Embed Size (px)
Citation preview

© 2005 International Monetary Fund November 2005
IMF Country Report No. 05/401
France, Germany, Italy, and Spain: Explaining Differences in External Sector Performance Among Large Euro Area Countries
This cross-country paper was prepared by a staff team of the International Monetary Fund as background documentation for the periodic consultations with the member countries. It is based on the information available at the time it was completed on October 12, 2005. The views expressed in this document are those of the staff team and do not necessarily reflect the views of the governments of the member countries or the Executive Board of the IMF. The policy of publication of staff reports and other documents by the IMF allows for the deletion of market-sensitive information. To assist the IMF in evaluating the publication policy, reader comments are invited and may be sent by e-mail to [email protected].
Copies of this report are available to the public from
International Monetary Fund ● Publication Services 700 19th Street, N.W. ● Washington, D.C. 20431
Telephone: (202) 623 7430 ● Telefax: (202) 623 7201 E-mail: [email protected] ● Internet: http://www.imf.org
Price: $15.00 a copy
International Monetary Fund
Washington, D.C.

INTERNATIONAL MONETARY FUND
FRANCE, GERMANY, ITALY, AND SPAIN
Explaining Differences in External Sector Performance
Among Large Euro Area Countries
Prepared by Céline Allard, Mario Catalan, Luc Everaert, and Silvia Sgherri (all EUR)
Approved by the European Department
October 12, 2005
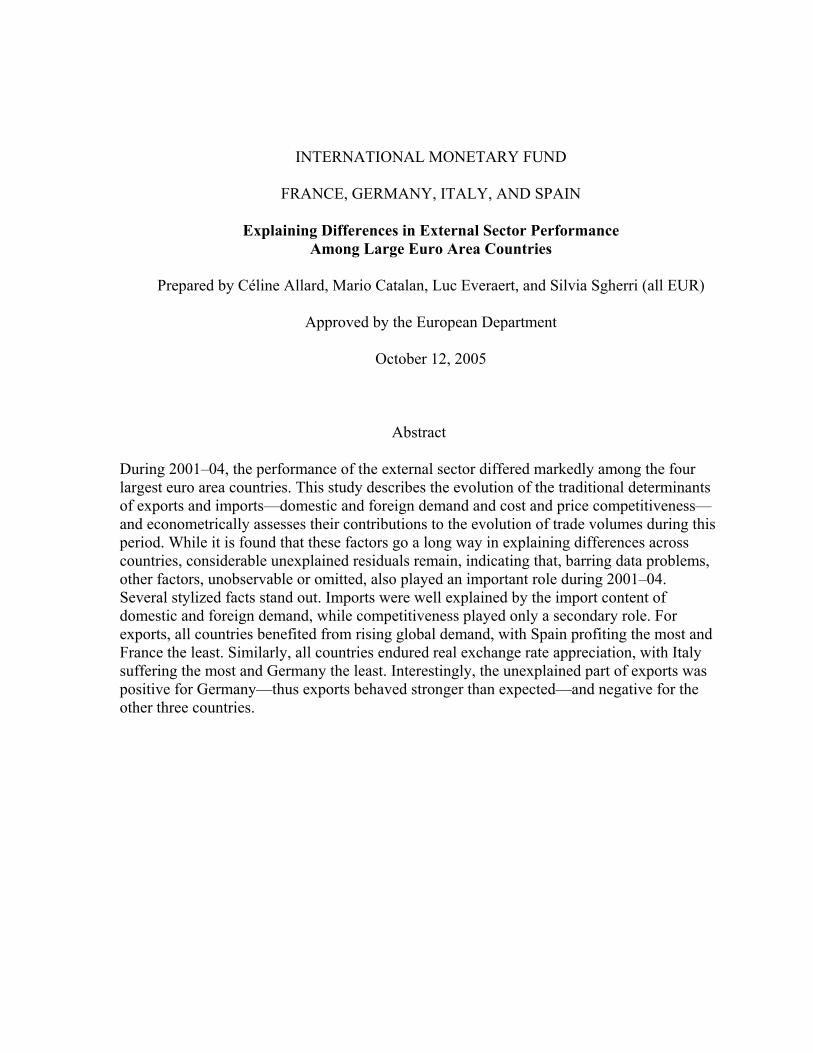
Abstract During 2001–04, the performance of the external sector differed markedly among the four largest euro area countries. This study describes the evolution of the traditional determinants of exports and imports—domestic and foreign demand and cost and price competitiveness—and econometrically assesses their contributions to the evolution of trade volumes during this period. While it is found that these factors go a long way in explaining differences across countries, considerable unexplained residuals remain, indicating that, barring data problems, other factors, unobservable or omitted, also played an important role during 2001–04. Several stylized facts stand out. Imports were well explained by the import content of domestic and foreign demand, while competitiveness played only a secondary role. For exports, all countries benefited from rising global demand, with Spain profiting the most and France the least. Similarly, all countries endured real exchange rate appreciation, with Italy suffering the most and Germany the least. Interestingly, the unexplained part of exports was positive for Germany—thus exports behaved stronger than expected—and negative for the other three countries.
- 2 -
Contents Page
I. Introduction ............................................................................................................................3
II. Developments in Key Determinants of Trade.......................................................................4
III. Econometric Analysis ..........................................................................................................8
IV. Concluding Remarks and Implications..............................................................................13
References................................................................................................................................25 Tables 1. Contributions of Net Exports to GDP Growth.......................................................................4 2. Balance on Non-oil Goods and Services ...............................................................................5 3. Geographic Orientation of Exports, 2004..............................................................................7 4. Cumulative Growth and Contribution of Trade Determinants, 2001–04 ............................12 Figures 1. Export Unit Values ................................................................................................................5 2. Real Effective Exchange Rates, Productivity, and Wages ....................................................6 3. Growth Rate of World Demand.............................................................................................7 4. Growth Rate of Domestic Demand........................................................................................8 5. Accounting for Country Differences in Trade Growth........................................................10 6. France: Dynamic Contributions to Exports and Imports, 1999–2004 .................................14 7. Germany: Dynamic Contributions to Exports and Imports, 1999–2004 .............................14 8. Italy: Dynamic Contributions to Exports and Imports, 1999–2004.....................................15 9. Spain: Dynamic Contributions to Exports and Imports, 1999–2004...................................15 Annexes 1. Data Sources ........................................................................................................................17 2. Error-Correction Model for Trade Equations and Cointegration Tests ...............................19 3. Principle of Dynamic Contributions ....................................................................................24
- 3 -
I. INTRODUCTION
1. Against overall sluggish activity in the euro area in recent years, the external sector has performed markedly differently among member countries. As background for the upcoming Article IV consultations with France, Germany, Italy, and Spain, this paper analyzes developments in the external sector during 2001–04 in these four countries on a comparable basis. It does not cover all possible factors underlying the differences in external sector performance and thus may need to be complemented with country-specific analysis as warranted.
2. Both cyclical and structural factors jointly determine developments in prices and volumes of trade. In economic and monetary union, without independent monetary policy, adjustment to different cyclical positions in demand (or output gaps) is expected to be associated with changes in relative competitiveness. Countries facing a comparatively weak cyclical position will experience relatively low price and wage inflation and enjoy an improvement in competitiveness, which will curb imports and boost exports. Among structural factors, different degrees of labor and product market flexibility will affect the responsiveness of individual economies to shocks, and different paces of structural reform will impart country-specific dynamics to their international competitiveness and trade. Pricing behavior also plays a role (Faruqee, 2004). Importers tend to fully pass through changes of exchange rates into their prices. Conversely, export margins move to a different extent across countries in response to developments in the exchange rate or productivity, with obvious implications for export volumes.
3. This paper describes the evolution of the traditional determinants of exports and imports and econometrically assesses their contributions to trade. Section II reviews developments in price and cost competitiveness, demand addressed to each individual country, the geographical orientation of exports, and domestic demand. Section III quantifies the dynamic contributions of the main determinants of trade to observed export and import volume behavior, using univariate error-correction models. This approach is statistical and has the drawback that the endogeneity of trade volumes and their determinants is not taken into account and that structural parameters are not identified. Nonetheless, it is often used in large-scale macroeconometric models where statistical properties—in this case cointegration and adequate short-term dynamics—are important to allow the models to track and forecast the data fairly well. The behavior of the residuals over the sample subperiod 2001–04 is analyzed to see how well the typical determinants explain trade and to shed some light on the influence of factors that are unobservable or omitted. Obviously, this requires caution as residuals also reflect statistical and data problems.1
1 Econometrically, the residuals were well behaved over the entire sample period, i.e., they have zero mean and no significant autocorrelation. However, in any given subperiod, as is the case during 2001–04, these properties may not be satisfied, suggesting that the model needs to be augmented with other, unobservable or omitted, explanatory factors.
- 4 -
4. Traditional determinants of imports and exports go a long way in accounting for differences in external sector performance, but a significant part remains unexplained, and developments in competitiveness are of concern for some countries (Section IV). For imports, the relative import content of domestic and foreign demand explains most of trade, while price and cost competitiveness play a secondary role. For exports, differences in foreign demand facing each of the countries and differences in cost competitiveness are key, while residuals are important as well.2 Germany’s relatively vibrant recent export performance is consistent with its comparative strength on price and cost competitiveness and global demand for its products, and helped by an econometrically-unexplained buoyancy of exports. France is only slightly weaker on cost competitiveness, but suffers from relatively lower global demand and some lack of export resilience, which cannot be attributed to the traditional determinants of trade. While a steady appreciation of Italy’s real effective exchange rate has contributed to the stagnation of its exports, despite the positive effect of global demand, factors not captured by the model have played an important role as well, warranting further analysis beyond the scope of this paper. Spain’s exports expanded at a good pace, though they were held back by the sharp appreciation of its real effective exchange rate and some unexplained negative factors.
II. DEVELOPMENTS IN KEY DETERMINANTS OF TRADE
5. The external sector’s contribution to growth differed markedly among the largest euro-area countries during 2001–04. For the euro area as a whole, the contribution of the external sector to output growth, which was positive in 2001–02, turned into a mild drag in 2003 and 2004, reflecting the appreciation of the euro and a modest rebound in domestic demand (Table 1). This average behavior nonetheless masks important differences across countries. In Germany, where domestic demand was very weak, the external sector contributed positively to growth throughout the period, even exceeding the cumulative increase in GDP during 2001–04. In contrast, in Spain, the country with the highest GDP and domestic demand growth rates, its contribution was continuously negative. France’s pattern followed the euro area average, with the external sector contribution switching from marginally positive in 2001–02 to appreciably negative in 2003–04. In Italy, the weakness of domestic demand, especially of investment, could not prevent the external sector from detracting from growth in every year since 2002.
2 The ECB also finds that price competitiveness and foreign demand can explain export developments to a considerable extent for the euro area , though not always for individual countries (ECB, 2005).
Memo item:Proj. Real GDP
2001-02 2003-04 2005 2001-05 2001-05
Euro area 1.5 -0.3 0.0 1.1 6.9France 0.1 -2.0 -0.9 -2.9 8.3Germany 3.7 0.3 1.2 5.3 3.9Italy -0.5 -0.7 -0.6 -1.9 3.4Spain -0.9 -3.0 -1.8 -6.1 16.4
Source: WEO.
Table 1. Contributions of Net Exports to GDP Growth (In cumulative percent)
- 5 -
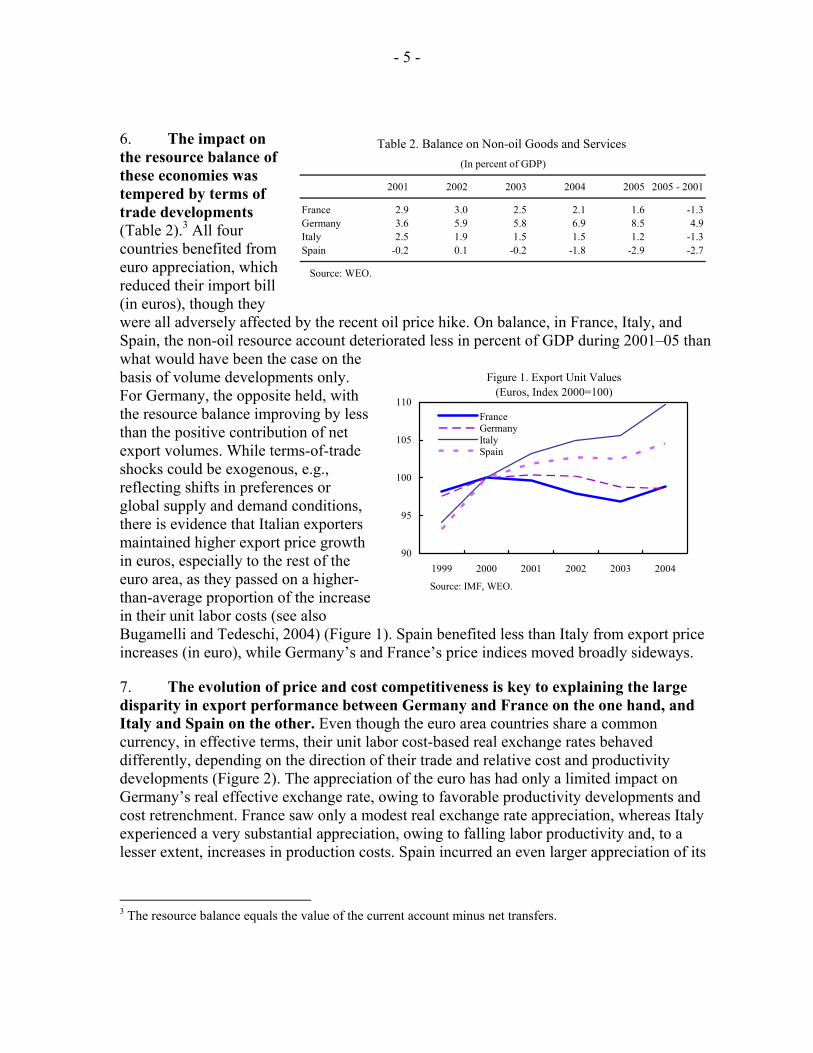
6. The impact on the resource balance of these economies was tempered by terms of trade developments (Table 2).3 All four countries benefited from euro appreciation, which reduced their import bill (in euros), though they were all adversely affected by the recent oil price hike. On balance, in France, Italy, and Spain, the non-oil resource account deteriorated less in percent of GDP during 2001–05 than what would have been the case on the basis of volume developments only. For Germany, the opposite held, with the resource balance improving by less than the positive contribution of net export volumes. While terms-of-trade shocks could be exogenous, e.g., reflecting shifts in preferences or global supply and demand conditions, there is evidence that Italian exporters maintained higher export price growth in euros, especially to the rest of the euro area, as they passed on a higher-than-average proportion of the increase in their unit labor costs (see also Bugamelli and Tedeschi, 2004) (Figure 1). Spain benefited less than Italy from export price increases (in euro), while Germany’s and France’s price indices moved broadly sideways.
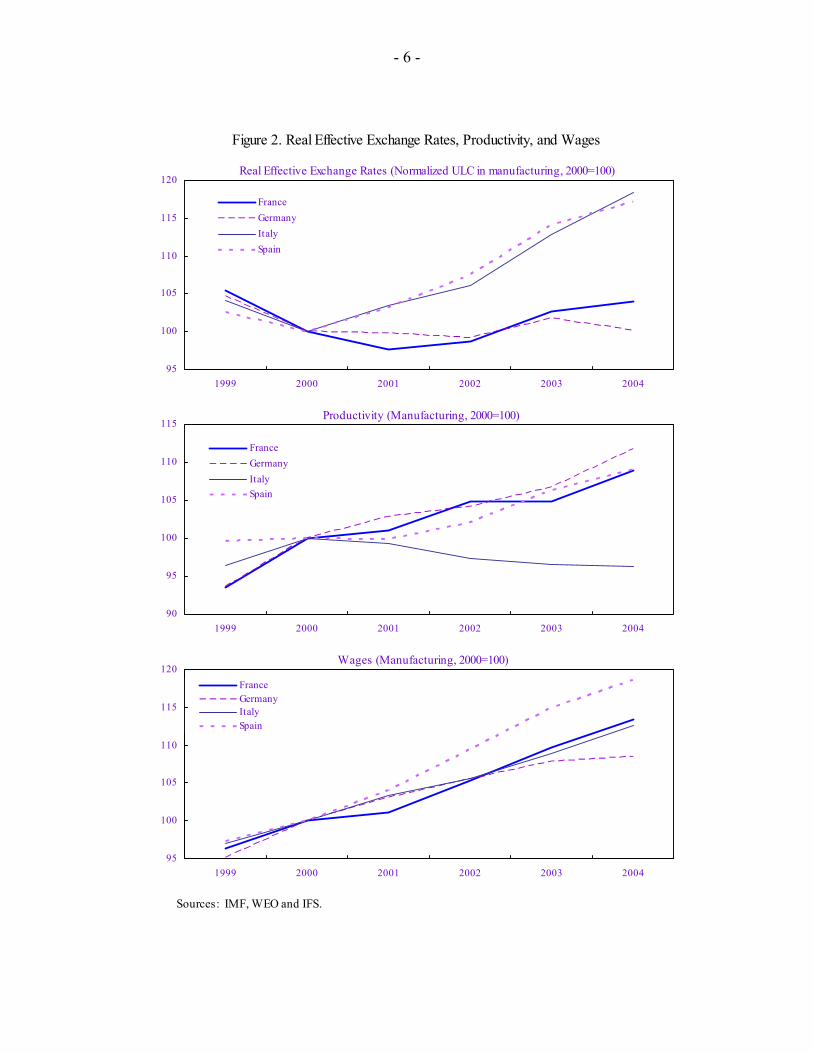
7. The evolution of price and cost competitiveness is key to explaining the large disparity in export performance between Germany and France on the one hand, and Italy and Spain on the other. Even though the euro area countries share a common currency, in effective terms, their unit labor cost-based real exchange rates behaved differently, depending on the direction of their trade and relative cost and productivity developments (Figure 2). The appreciation of the euro has had only a limited impact on Germany’s real effective exchange rate, owing to favorable productivity developments and cost retrenchment. France saw only a modest real exchange rate appreciation, whereas Italy experienced a very substantial appreciation, owing to falling labor productivity and, to a lesser extent, increases in production costs. Spain incurred an even larger appreciation of its
3 The resource balance equals the value of the current account minus net transfers.
2001 2002 2003 2004 2005 2005 - 2001
France 2.9 3.0 2.5 2.1 1.6 -1.3Germany 3.6 5.9 5.8 6.9 8.5 4.9Italy 2.5 1.9 1.5 1.5 1.2 -1.3Spain -0.2 0.1 -0.2 -1.8 -2.9 -2.7
Source: WEO.
Table 2. Balance on Non-oil Goods and Services (In percent of GDP)
Figure 1. Export Unit Values(Euros, Index 2000=100)
90
95
100
105
110
1999 2000 2001 2002 2003 2004
Source: IMF, WEO.
FranceGermanyItalySpain
- 6 -
Figure 2. Real Effective Exchange Rates, Productivity, and Wages
Sources: IMF, WEO and IFS.
Real Effective Exchange Rates (Normalized ULC in manufacturing, 2000=100)
95
100
105
110
115
120
1999 2000 2001 2002 2003 2004
FranceGermanyItalySpain
Productivity (Manufacturing, 2000=100)
90
95
100
105
110
115
1999 2000 2001 2002 2003 2004
FranceGermanyItalySpain
Wages (Manufacturing, 2000=100)
95
100
105
110
115
120
1999 2000 2001 2002 2003 2004
FranceGermanyItalySpain
- 7 -
real effective exchange, due to labor cost increases in excess of productivity gains. However, real effective exchange rate-based indicators do not capture all facets of competitiveness. Other factors, broadly grouped in “nonprice competitiveness,” such as brand and quality image and service after sale, could play a nontrivial role. Unfortunately, consistent time series of these indicators are not generally available.
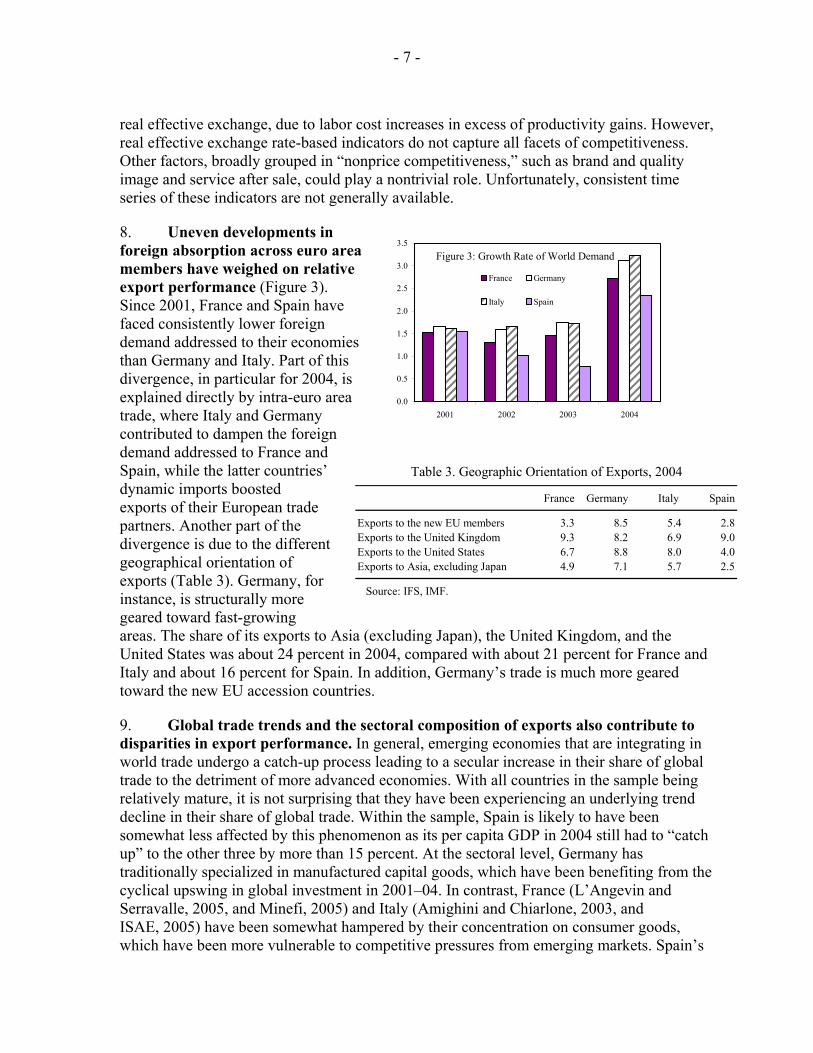
8. Uneven developments in foreign absorption across euro area members have weighed on relative export performance (Figure 3). Since 2001, France and Spain have faced consistently lower foreign demand addressed to their economies than Germany and Italy. Part of this divergence, in particular for 2004, is explained directly by intra-euro area trade, where Italy and Germany contributed to dampen the foreign demand addressed to France and Spain, while the latter countries’ dynamic imports boosted exports of their European trade partners. Another part of the divergence is due to the different geographical orientation of exports (Table 3). Germany, for instance, is structurally more geared toward fast-growing areas. The share of its exports to Asia (excluding Japan), the United Kingdom, and the United States was about 24 percent in 2004, compared with about 21 percent for France and Italy and about 16 percent for Spain. In addition, Germany’s trade is much more geared toward the new EU accession countries.
9. Global trade trends and the sectoral composition of exports also contribute to disparities in export performance. In general, emerging economies that are integrating in world trade undergo a catch-up process leading to a secular increase in their share of global trade to the detriment of more advanced economies. With all countries in the sample being relatively mature, it is not surprising that they have been experiencing an underlying trend decline in their share of global trade. Within the sample, Spain is likely to have been somewhat less affected by this phenomenon as its per capita GDP in 2004 still had to “catch up” to the other three by more than 15 percent. At the sectoral level, Germany has traditionally specialized in manufactured capital goods, which have been benefiting from the cyclical upswing in global investment in 2001–04. In contrast, France (L’Angevin and Serravalle, 2005, and Minefi, 2005) and Italy (Amighini and Chiarlone, 2003, and ISAE, 2005) have been somewhat hampered by their concentration on consumer goods, which have been more vulnerable to competitive pressures from emerging markets. Spain’s
Figure 3: Growth Rate of World Demand
0.0
0.5
1.0
1.5
2.0
2.5
3.0
3.5
2001 2002 2003 2004
France Germany
Italy Spain
France Germany Italy Spain
Exports to the new EU members 3.3 8.5 5.4 2.8Exports to the United Kingdom 9.3 8.2 6.9 9.0Exports to the United States 6.7 8.8 8.0 4.0Exports to Asia, excluding Japan 4.9 7.1 5.7 2.5
Source: IFS, IMF.
Table 3. Geographic Orientation of Exports, 2004
- 8 -
exports are heavily concentrated in manufactured goods, for which trade partner demand played the key role.
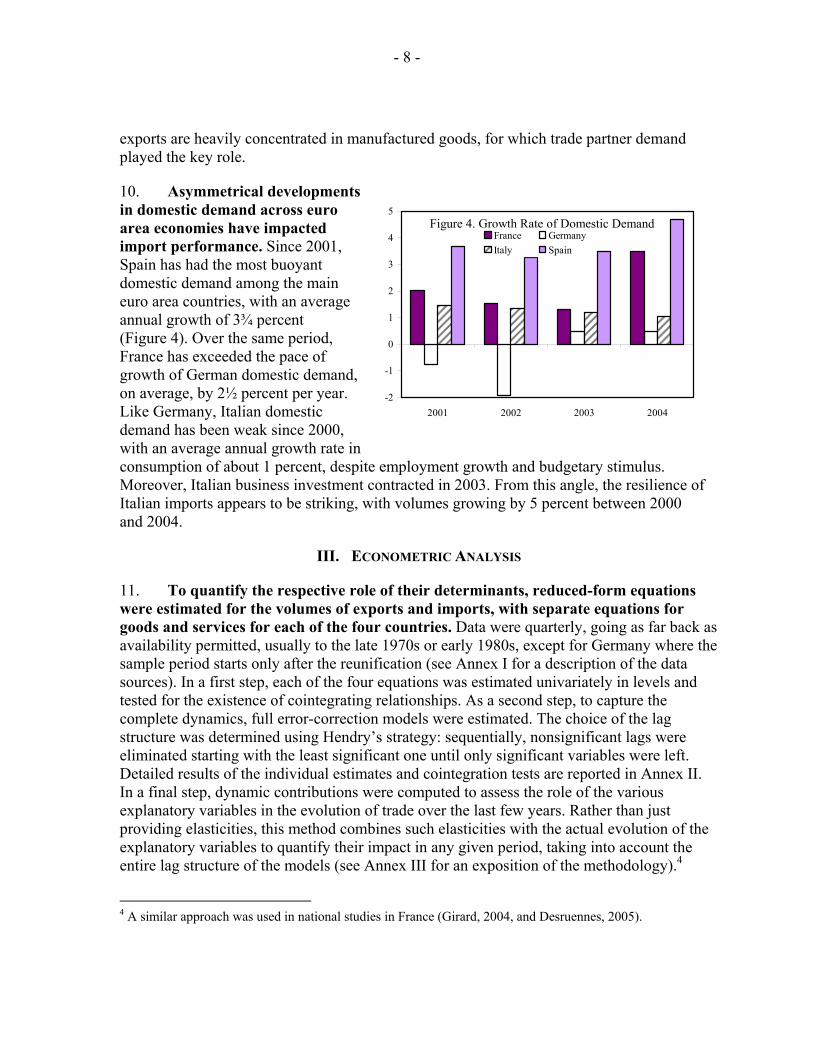
10. Asymmetrical developments in domestic demand across euro area economies have impacted import performance. Since 2001, Spain has had the most buoyant domestic demand among the main euro area countries, with an average annual growth of 3¾ percent (Figure 4). Over the same period, France has exceeded the pace of growth of German domestic demand, on average, by 2½ percent per year. Like Germany, Italian domestic demand has been weak since 2000, with an average annual growth rate in consumption of about 1 percent, despite employment growth and budgetary stimulus. Moreover, Italian business investment contracted in 2003. From this angle, the resilience of Italian imports appears to be striking, with volumes growing by 5 percent between 2000 and 2004.
III. ECONOMETRIC ANALYSIS
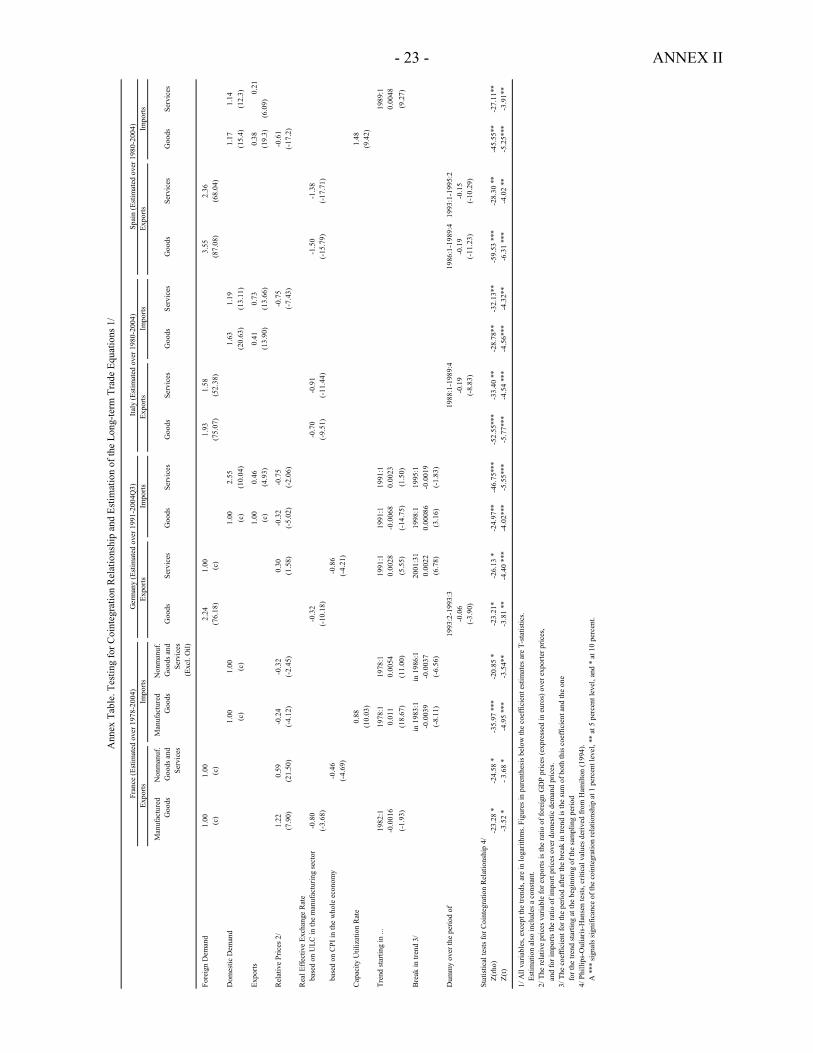
11. To quantify the respective role of their determinants, reduced-form equations were estimated for the volumes of exports and imports, with separate equations for goods and services for each of the four countries. Data were quarterly, going as far back as availability permitted, usually to the late 1970s or early 1980s, except for Germany where the sample period starts only after the reunification (see Annex I for a description of the data sources). In a first step, each of the four equations was estimated univariately in levels and tested for the existence of cointegrating relationships. As a second step, to capture the complete dynamics, full error-correction models were estimated. The choice of the lag structure was determined using Hendry’s strategy: sequentially, nonsignificant lags were eliminated starting with the least significant one until only significant variables were left. Detailed results of the individual estimates and cointegration tests are reported in Annex II. In a final step, dynamic contributions were computed to assess the role of the various explanatory variables in the evolution of trade over the last few years. Rather than just providing elasticities, this method combines such elasticities with the actual evolution of the explanatory variables to quantify their impact in any given period, taking into account the entire lag structure of the models (see Annex III for an exposition of the methodology).4
4 A similar approach was used in national studies in France (Girard, 2004, and Desruennes, 2005).
Figure 4. Growth Rate of Domestic Demand
-2
-1
0
1
2
3
4
5
2001 2002 2003 2004
France GermanyItaly Spain
- 9 -
12. Aside from the core variables of cost and price competitiveness and domestic and foreign demand, some plausible additional variables were needed in some equations to achieve a satisfactory fit. Cost competitiveness was represented by the unit labor cost-based real effective exchange rate. In addition, a relative price variable was included to capture the influence of factors other than labor costs, such as shifts in preferences and the margin behavior of market participants.5 Importers appear to consider each of the countries a “small” market and apply home currency pricing, but not exporters. Trade-weighted foreign demand and domestic demand represented the usual scale variables for exports and imports, respectively. In addition, in Germany, Italy, and Spain, the high import content of exports led to the incorporation of exports as an explanatory variable in the import equations in addition to domestic demand, but this variable was not significant in France. In France and Spain, capacity utilization helped explain imports, as bottlenecks in domestic production entailed larger recourse to imported goods. Trends were also retained where they were found to be significant.
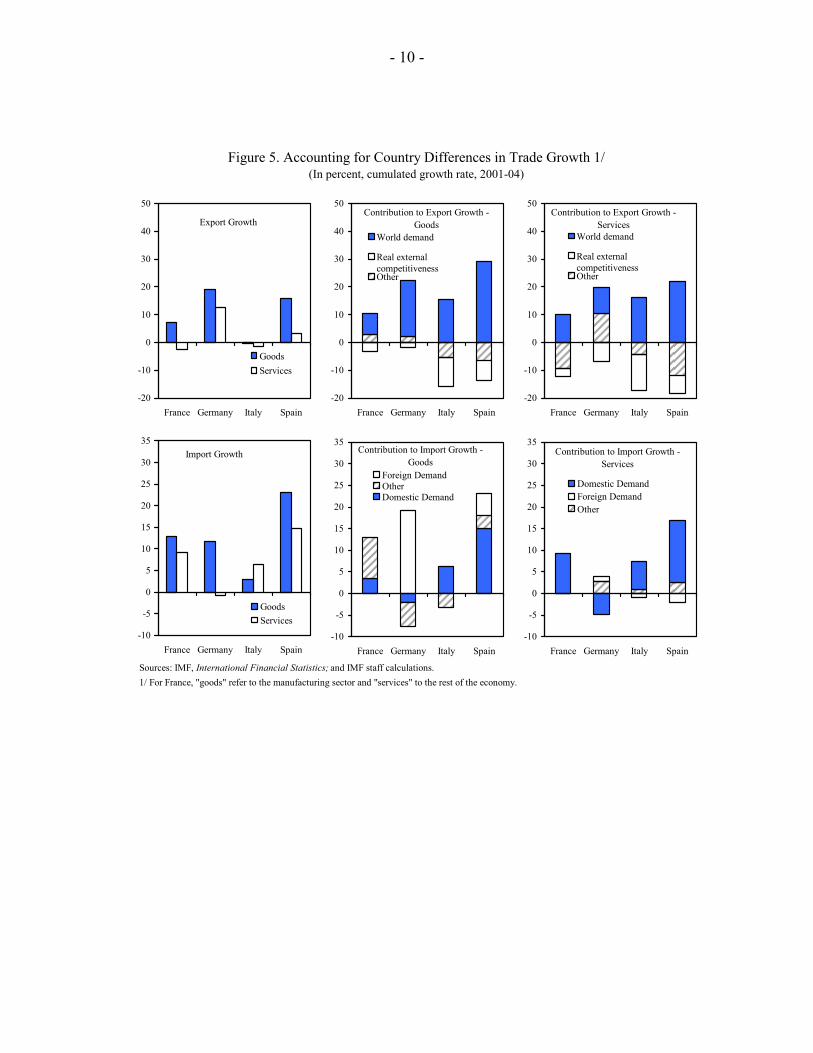
13. The behavior of the traditional determinants of trade explains a significant portion of the differences in external sector performance across large euro area countries during 2001–04 (Figure 5):
• The real effective exchange rate appreciation during 2001–04 had only a marginal impact on imports but adversely affected exports of goods and services in all countries, broadly in proportion with the degree of appreciation. However, there were some notable variations. Germany seems to have been relatively less affected by real effective exchange rate appreciation, especially for goods, while Italy has been comparatively more affected for both goods and services. This reflects lower estimated exchange rate elasticities for goods for Germany (0.3) than for Italy (0.7), compounded by the lesser degree of appreciation in Germany.
• Global demand contributed positively to exports in all cases, with the strongest impact in Spain and the weakest in France, and in the case of Germany, a larger impact on goods than on services, again reflecting different
5 For exports, the relative price variable is the trade-weighted GDP deflator of trading partners over the export price of the relevant country. For imports, it is the ratio of each countries’ import prices over its domestic demand price. This definition, particularly on the export side, is not entirely satisfactory due to data limitations. It would have been preferable to have a price index of tradable goods. By using the GDP deflator instead, the variable may be contaminated by Balassa-Samuelson effects. In this case, it would exhibit a declining trend, which could simply capture increasing trade openness of the trade partners of the four euro area countries.
- 10 -
Figure 5. Accounting for Country Differences in Trade Growth 1/
(In percent, cumulated growth rate, 2001-04)
Sources: IMF, International Financial Statistics; and IMF staff calculations.1/ For France, "goods" refer to the manufacturing sector and "services" to the rest of the economy.
Export Growth
-20
-10
0
10
20
30
40
50
France Germany Italy Spain
GoodsServices
Contribution to Export Growth - Goods
-20
-10
0
10
20
30
40
50
France Germany Italy Spain
World demand
Real externalcompetitivenessOther
Contribution to Export Growth - Services
-20
-10
0
10
20
30
40
50
France Germany Italy Spain
World demand
Real externalcompetitivenessOther
Import Growth
-10
-5
0
5
10
15
20
25
30
35
France Germany Italy Spain
GoodsServices
Contribution to Import Growth - Goods
-10
-5
0
5
10
15
20
25
30
35
France Germany Italy Spain
Foreign DemandOtherDomestic Demand
Contribution to Import Growth - Services
-10
-5
0
5
10
15
20
25
30
35
France Germany Italy Spain
Domestic DemandForeign DemandOther
- 11 -
estimated elasticities. For France, a unit elasticity with respect to global demand could not be rejected by the data, while Italy, Germany, and Spain posted much higher elasticities, for goods reaching 1.9, 2.2, and 3.6, respectively. In the case of Spain, the (perhaps surprisingly) high elasticity more than compensated for the relative sluggishness of global demand addressed to Spain.6
• Domestic demand played a key role on the import side, as anticipated, and comparatively more so in Spain, where it was much more energetic. In Germany and Spain, imports were also driven by foreign demand, reflecting the high import content of exports. This factor was also significant in the equations for Italy, but export growth was too weak to make it a driver of imports.
14. Other variables included in the regressions also contributed, though to a lesser extent, and their role is more difficult to interpret (Table 4):
• Price competitiveness (as defined by the relative price variable, see ¶12) contributed in an intuitive manner on the import side, though it was not of major importance except for Spanish goods imports. Global competition and euro appreciation over 2001–04 have likely allowed importers to reduce their prices in euros, thus helping to boost imports. On the export side, relative prices were insignificant, except for French goods, which is somewhat puzzling as it points to the ability of French exporters to move up the demand curve by lowering relative prices. The method used here does not allow to distinguish whether this is due to supply or demand factors.
• Lower capacity utilization owing to slack in the French and Spanish economies dampened imports, but this variable did not play in Germany and Italy.7
• Trends were significant only in some sectors in France and Germany. Notable were a strong positive contribution of trends to imports of goods in France, a sharp trend-driven increase in German services exports (though this covers only 15 percent of total trade), and a trend decline in German goods imports.
15. During 2001–04, the contribution of the residuals deserves a careful reading. While statistically these residuals average zero over the entire sample period, their behavior in any given subperiod may reflect, apart from data issues, the influence of factors that were not explicitly considered in the exercise, such as nonprice competitiveness or the sectoral orientation of trade. In this context, it is striking that for both exports and imports, the 6 The estimated elasticity for Spain is higher than suggested by other studies (Buisán and Gordo (1997) and Estrada and others (2004)). However, these studies use partners’ imports rather than partners’ GDP as a proxy for world demand. With imports growing at a much faster pace than GDP over the sample period, it is not surprising that our estimate is much higher. Nonetheless, recent research suggests that it has decreased since the end of the 1990s. 7 In both France and Spain, higher capacity utilization drives up imports (positive elasticities in the estimated equations in Annex II) but the rate of capacity utilization fell on average during the period considered.

- 12 -
France Manufactured Nonmanufactured Manufactured NonmanufacturedGoods Goods and Services Goods Goods and Services
(Exclud. Oil)
Cumulative Cumulative growth over 2001-04 7.1 -2.4 growth over 2001-04 12.9 9.1Contributions: Contributions:
Foreign demand 7.4 10.0 Domestic demand 5.0 9.1Relative prices 13.3 -0.4 Relative prices 1.1 0.8Reer -3.2 -2.9 Capacity utilization -1.4 ...Trend -2.5 ... Trend 11.9 2.7Unexplained -7.7 -9.1 Unexplained -3.8 -3.5
Germany Goods Services Goods Services
Cumulative Cumulative growth over 2001-04 18.9 12.5 growth over 2001-04 11.8 -0.9Contributions: Contributions:
Foreign demand 20.4 9.3 Domestic demand -2.0 -4.9Relative prices ... -1.2 Relative prices 2.6 2.3Reer -1.7 -6.7 Exports 19.3 1.1Trend ... 14.7 Trend -9.3 0.7Unexplained 2.1 -3.0 Unexplained 1.0 -0.1
Italy Goods Services Goods Services
Cumulative Cumulative growth over 2001-04 -0.3 -1.4 growth over 2001-04 3.0 6.4Contributions: Contributions:
Foreign demand 15.5 16.1 Domestic demand 6.3 6.5Relative prices ... ... Relative prices ... 7.1Reer -10.6 -13.0 Exports 0.0 -1.0Unexplained -5.2 -4.5 Unexplained -3.2 -6.3
Spain Goods Services Goods Services
Cumulative Cumulative growth over 2001-04 15.8 3.4 growth over 2001-04 23.1 14.8Contributions: Contributions:
Foreign demand 29.3 21.8 Domestic demand 17.4 14.3Relative prices ... ... Relative prices 10.9 ...Reer -7.0 -6.4 Exports 5.1 -2.0Trend ... -1.2 Capacity utilization -2.3 ...Unexplained -6.5 -10.9 Trend ... 7.7
Unexplained -8.0 -5.1
Source: IMF staff estimates.
Exports Imports
Exports Imports
Table 4. Cumulative Growth and Contribution of Trade Determinants, 2001-04
Exports Imports
Exports Imports
(In percentage points)
- 13 -
residuals contributed negatively during 2001–04 for France, Italy and Spain. On balance, France fared worse, losing almost 8 percentage points of goods exports for reasons not captured by the variables included in the equation, but only 4 percentage points of goods imports. Italy lost about 2 percentage points in the balance between exports and imports for both goods and services. In contrast, Germany’s exports gained more than imports, particularly in the important goods category, though by only 1 percentage point. In Spain, both exports and imports were weaker than predicted, but for goods, the residual was larger on the import side.
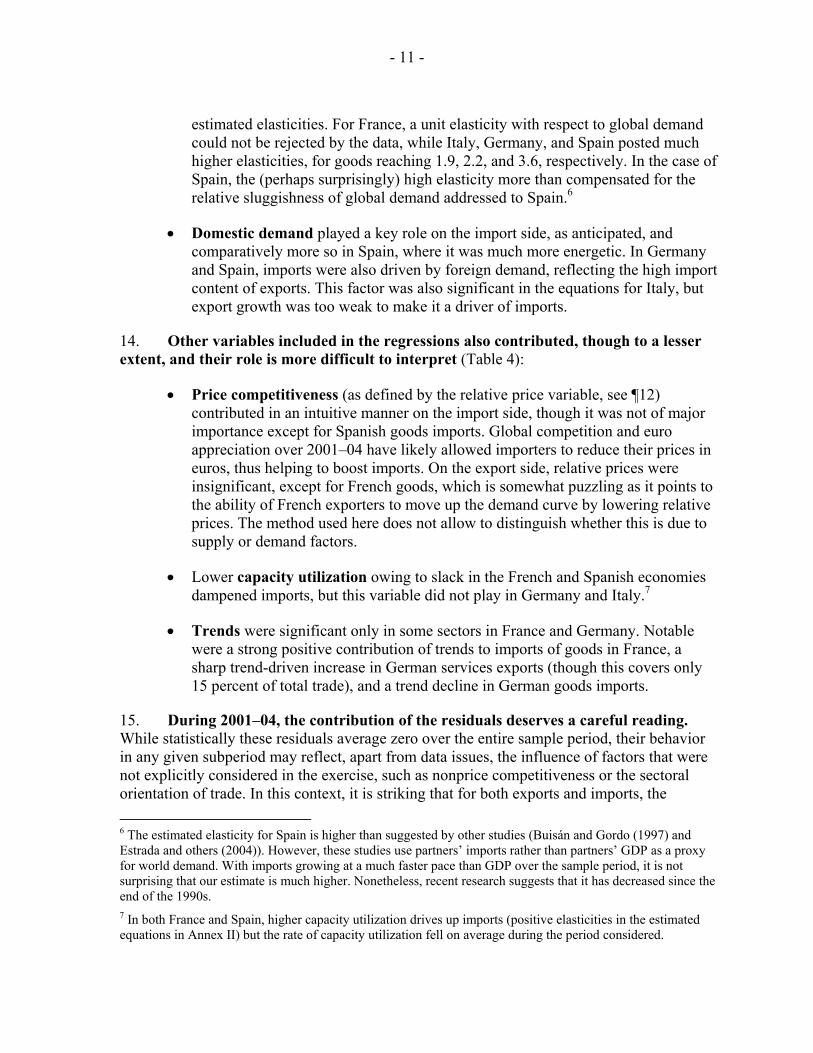
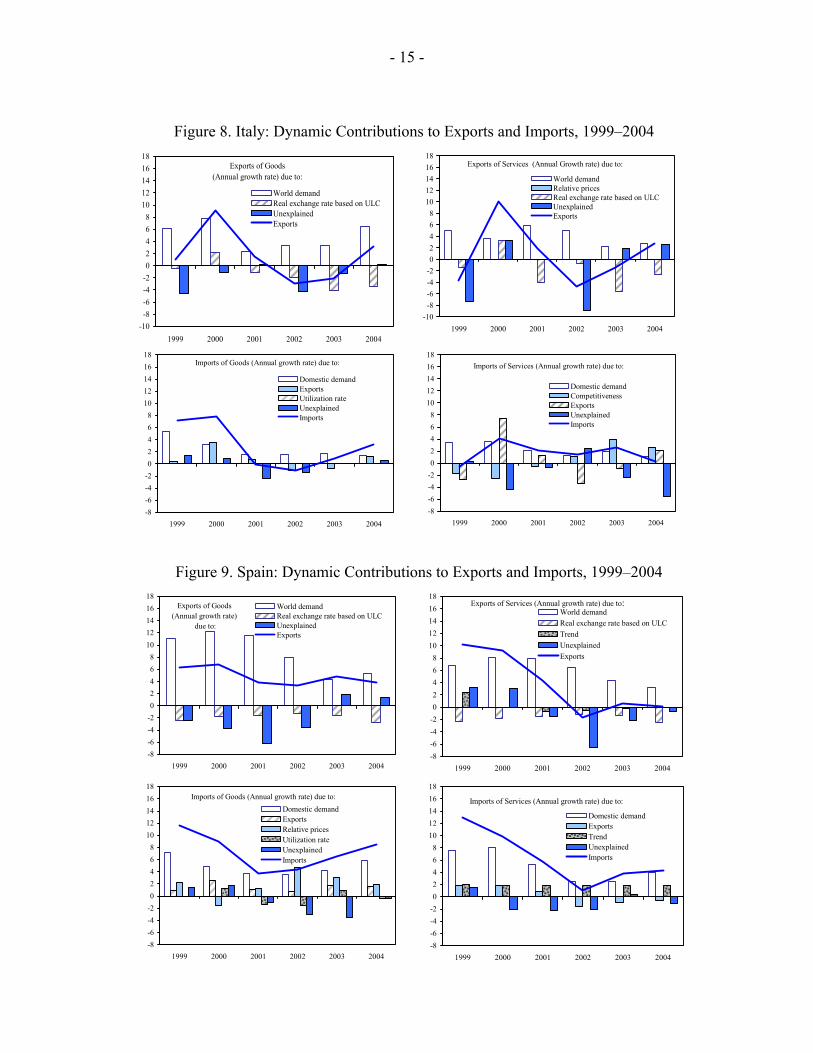
16. An analysis of the time series of dynamic contributions sheds some light on the timing of the impact and the nature of the various forces shaping trade developments (Figures 6–9). The movement of the euro is clearly discernible in the data. In France and Germany, its depreciated level initially contributed positively to export growth or was neutral. Its subsequent appreciation, at about the same time as global demand was slowing, added in all countries to the fall in export growth or the decline in the level of exports. However, for Italy, deteriorating competitiveness already exerted a drag on exports before the recent euro appreciation. In Spain, the continuous real appreciation of a similar magnitude as Italy was associated with a steady negative contribution to export growth throughout 2001–04. However, the impact was considerably less negative than for Italy, suggesting that part of the appreciation could constitute an equilibrium phenomenon due to convergence. For the countries with unexplained weakness in exports, residuals became smaller in 2003–04 and turned even positive in some cases in 2004. Imports closely followed the time profile of domestic demand and/or of exports, where the latter had high import content.
IV. CONCLUDING REMARKS AND IMPLICATIONS
17. Global demand lifted the external sector’s contribution to growth in all large euro area countries during 2001–04, though to different degrees, and it was in some cases overwhelmed by the evolution of domestic demand. Owing to a different geographic orientation and different demand elasticities, external demand contributed less in France than elsewhere and particularly strongly in the case of Spain. In both countries, buoyant domestic demand sharply boosted imports. Germany experienced weak domestic demand, but the increasing import content of its exports stimulated import growth.
18. Divergences in price and cost competitiveness are key to explaining the recent differences in the performance of the external sector in the larger euro area economies. Adjustment to cyclical differences in monetary union is consistent with the direction of developments observed in Germany and France and to a lesser extent in Spain, but at odds with Italy. In addition, the magnitude of changes in the real effective exchange rate points to the crucial importance of underlying structural factors. Thus, were domestic demand to settle at a pace that closes the output gap in all countries over a similar time horizon, there would only be a partial reversal of the recent worsening of the external accounts of France and Spain and the improvement in Germany. For Italy, however, the closure of the output gap would likely further deteriorate its external accounts.
- 14 -
Figure 6. France: Dynamic Contributions to Exports and Imports, 1999–2004
Exports of Manufactured Goods (Annual growth rate) due to:
-8-6-4-202468
1012141618
1999 2000 2001 2002 2003 2004
Quarterly World demandRelative pricesTrendReal exchange rate based on ULCUnexplained Exports
Exports of Non Manufactured Goods and Services(Annual growth rate ) due to:
-8-6-4-202468
1012141618
1999 2000 2001 2002 2003 2004
World demandRelative pricesReal exchange rate based on CPIUnexplained Exports
Imports of Manufactured Goods (Annual growth rate) due to:
-8-6-4-202468
1012141618
1999 2000 2001 2002 2003 2004
Domestic demandRelative pricesTrendUtilization rateUnexplainedImports
Imports of Non Manufactured Goods and Services(excluding energy, annual growth rate) due to:
-8-6-4-202468
1012141618
1999 2000 2001 2002 2003 2004
Domestic demandRelative pricesTrendUnexplainedImports
Figure 7. Germany: Dynamic Contributions to Exports and Imports, 1999–2004
Exports of Goods (Annual growth rate) due to:
-8-6-4-202468
1012141618
1999 2000 2001 2002 2003 2004 (up toQ3)
World demandReal exchange rate based on ULCUnexplained Exports
Exports of Services(Annual growth rate)
due to:
-8-6-4-202468
1012141618
1999 2000 2001 2002 2003 2004 (up toQ3)
World demandRelative pricesReal exchange rate based on CPITrendUnexplained Exports
Imports of Goods (Annual growth rate) due to:
-8-6-4-202468
1012141618
1999 2000 2001 2002 2003 2004 (up toQ3)
Domestic demandExportsRelative pricesTrendUnexplainedImports
Imports of Services (Annual growth rate) due to:
-8-6-4-202468
1012141618
1999 2000 2001 2002 2003 2004 (up toQ3)
Domestic demandExportsRelative pricesTrendUnexplainedImports
- 15 -
Figure 8. Italy: Dynamic Contributions to Exports and Imports, 1999–2004
Exports of Goods(Annual growth rate) due to:
-10-8-6-4-202468
1012141618
1999 2000 2001 2002 2003 2004
World demandReal exchange rate based on ULCUnexplained Exports
Exports of Services (Annual Growth rate) due to:
-10-8-6-4-202468
1012141618
1999 2000 2001 2002 2003 2004
World demandRelative pricesReal exchange rate based on ULCUnexplained Exports
Imports of Goods (Annual growth rate) due to:
-8-6-4-202468
1012141618
1999 2000 2001 2002 2003 2004
Domestic demandExportsUtilization rateUnexplainedImports
Imports of Services (Annual growth rate) due to:
-8-6-4-202468
1012141618
1999 2000 2001 2002 2003 2004
Domestic demandCompetitivenessExportsUnexplainedImports
Figure 9. Spain: Dynamic Contributions to Exports and Imports, 1999–2004
Exports of Goods(Annual growth rate)
due to:
-8-6-4-202468
1012141618
1999 2000 2001 2002 2003 2004
World demandReal exchange rate based on ULCUnexplained Exports
Exports of Services (Annual growth rate) due to:
-8-6-4-202468
1012141618
1999 2000 2001 2002 2003 2004
World demandReal exchange rate based on ULCTrendUnexplained Exports
Imports of Goods (Annual growth rate) due to:
-8-6-4-202468
1012141618
1999 2000 2001 2002 2003 2004
Domestic demandExportsRelative pricesUtilization rateUnexplainedImports
Imports of Services (Annual growth rate) due to:
-8-6-4-202468
1012141618
1999 2000 2001 2002 2003 2004
Domestic demandExportsTrendUnexplainedImports
- 16 -
19. Exporters’ margin behavior and the sectoral composition of exports appear at least partially responsible for Italy’s idiosyncratic behavior. Italy’s exporters seem to have responded to the appreciation of the euro by passing on to export prices a higher-than-average percentage of the increase in unit labor costs. Consequently, there may be scope for margin retrenchment to prevent further erosion of market shares in volume. Nonetheless, Italian exports appear to be concentrated in relatively slow-growing sectors of world demand and areas where competition from emerging markets is likely to continue to intensify. Resolving this “dynamic inefficiency” is likely to require structural reforms that facilitate industrial restructuring and technology adoption.
20. The fact that a significant part of trade behavior during 2001–04 cannot be attributed to the traditional explanatory variables considered in the econometric analysis calls for prudence. For Germany, this residual was positive, and estimated trends were also favorable, thus pointing to possible improvements in competitiveness not measured by standard price and cost indicators. For France, Italy and Spain, trade performed weaker than predicted, while estimated trends, where significant, tended to be negative for exports and positive for imports. These developments, if persistent, signal a need to improve underlying external performance in each of the three countries.
- 17 - ANNEX I
Data Sources
French data:
From INSEE quarterly data (in base 1995), for 1978 Q1–2004 Q4, all seasonally adjusted and corrected for working days:
• Exports and imports in volume for the manufacturing sector (TD_P6/P7_DIM1); • Exports in volume for the nonmanufacturing sector and services (TD_P6 for sectors
S1, EA1, EB1 and EG1); • Imports in volume for the nonmanufacturing sector and services excluding oil
(TD_P6 for sectors S1, EA1 and EB1); • Domestic demand in volume for the manufacturing sector: sum of consumption in
intermediary manufacturing goods, household consumption, government consumption, investment and change in inventories (sum of TD_P2_DIM1, TD_P3M_DIM1, TD_P3G_DIM1, TD_P51_DIM1, TD_P52_DIM1);
• Domestic demand in volume for the nonmanufacturing sector and services excluding oil: same components of demand as for domestic demand in the manufacturing sector, but for the sectors S1, EA1 and EB1; and
• Export, import, and domestic demand prices for the same breakdown.
German data:
From the German Institute for Economic Research (Deutsches Institut für Wirtschaftsforschung, DIW, http://www.diw.de/deutsch/) quarterly data (in base 1995), for 1991 Q1–2004 Q3:
• Exports and imports in volume for respectively goods and services, seasonally adjusted and corrected for working days (P61RFB, P62RFB, P71RFB and P72RFB);
• Total domestic demand in volume (for all goods, as no breakdown was available), seasonally adjusted (P3R+P5RB); and
• Export, import, and domestic demand prices for the same breakdown. Italian data:
From ISTAT (http://www.istat.it/comest/) quarterly data over 1980Q1–2004Q4: • Exports and imports in volume for goods and services, respectively, seasonally
adjusted and corrected for working days, and expressed in 1995 euros; • Total domestic demand in volume (for all goods, as no breakdown is available); and • Export, import, and domestic demand deflators for the same breakdown.
Spanish data:
From INE (http://www.ine.es) quarterly data over 1980Q1-2004Q4:
- 18 - ANNEX I
• Exports and imports in volume for goods and services, respectively, seasonally adjusted and corrected for working days, and expressed in 1995 euros;
• Total domestic demand in volume; and • Export, import and domestic demand deflators for the same breakdown.
External environment data:
From the WEO data base: • Foreign demand faced by France, Germany, Italy, and Spain: weighted GDP at
constant prices of trade partners, with, for each of the four countries, weights defined as the share of exports to the trade partners (for the trade partners whose share is greater than 1 percent of total exports). Detailed export data are derived from the IMF Direction of Trade Statistics. Foreign demand is available only on an annual basis, and for the sake of the econometric analysis, the quarterly series for foreign demand is derived by applying the quarterly pattern of G-7 GDP to distribute global demand on a quarterly basis. This simplifying assumption may affect the accuracy of the short-term dynamics;
• Foreign competitors’ prices (for all goods) for France, Germany, Italy, and Spain: weighted GDP deflators converted in euros, with weights similar to the ones used for foreign demand. As with foreign demand, the data are only available on an annual basis; and
• Export relative prices (for export equations) are defined as the ratio of foreign competitors prices, expressed in euros, over domestic exporters’ prices. Import relative prices (for import equations) are defined as the ratio of importers’ prices over overall domestic demand prices (as a proxy of the ratio of importers’ prices over the prices of domestic production sold nationally). Hence in both cases, an increase in the ratio signals an increase in price competitiveness.
Other data:
From the International Financial Statistics (IFS): • Real Effective Exchange Rate: For the equation on the manufacturing sector or the
goods sector, based on unit labor costs. In the case of France and Germany, for the rest of the economy, the indicator used is the Reer based on the CPI for the whole economy.
From the WEFA data base: • Capacity Utilization Rate in the manufacturing sector.
- 19 - ANNEX II
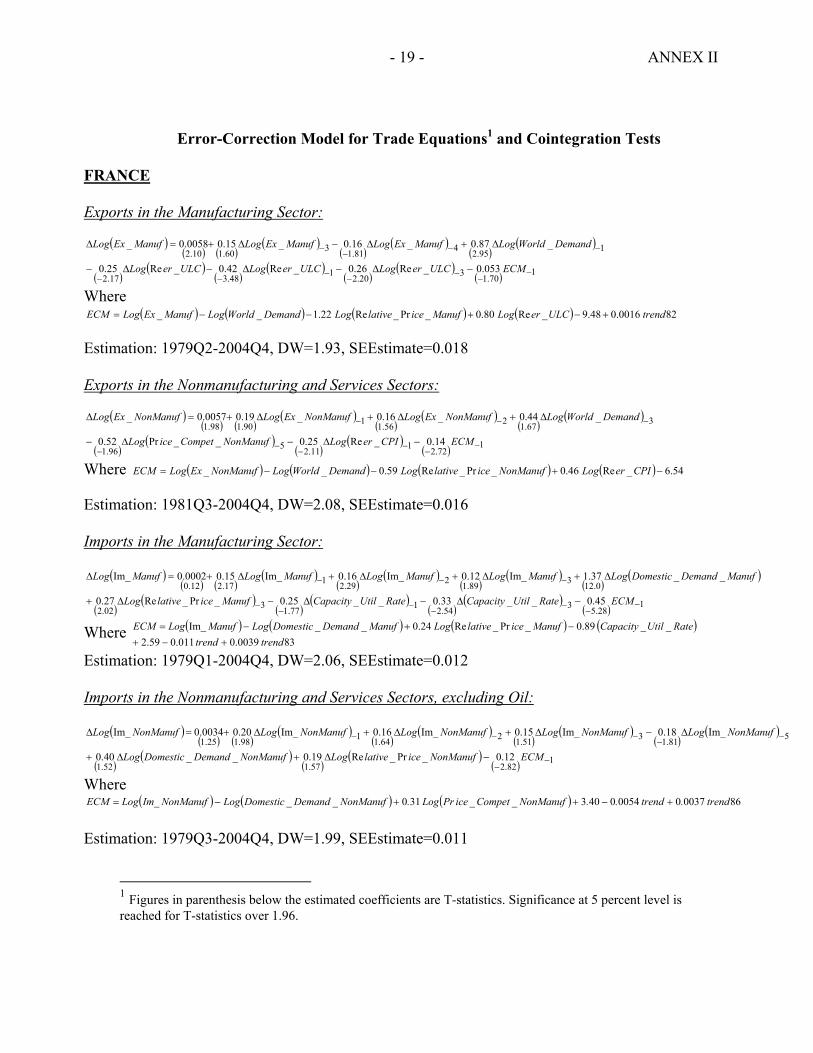
Error-Correction Model for Trade Equations1 and Cointegration Tests
FRANCE Exports in the Manufacturing Sector:
( )( ) ( )
( )( )
( )( )
( )
( )( )
( )( )
( )( )
( ) 170.1320.2148.317.2
195.2481.1360.110.2
053.0_Re26.0_Re42.0_Re25.0
_87.0_16.0_15.00058.0_
−−
−−
−−−
−−−
−
−∆−∆−∆−
∆+∆−∆+=∆
ECMULCerLogULCerLogULCerLog
DemandWorldLogManufExLogManufExLogManufExLog
Where ( ) ( ) ( ) ( ) 820016.048.9_Re80.0_Pr_Re22.1__ trendULCerLogManuficelativeLogDemandWorldLogManufExLogECM +−+−−=
Estimation: 1979Q2-2004Q4, DW=1.93, SEEstimate=0.018 Exports in the Nonmanufacturing and Services Sectors:
( )( ) ( )
( )( )
( )( )
( )
( )( )
( )( )
( ) 172.2111.2596.1
367.1256.1190.198.1
14.0_Re25.0__Pr52.0
_44.0_16.0_19.00057.0_
−−
−−
−−
−−−
−∆−∆−
∆+∆+∆+=∆
ECMCPIerLogNonManufCompeticeLog
DemandWorldLogNonManufExLogNonManufExLogNonManufExLog
Where ( ) ( ) ( ) ( ) 54.6_Re46.0_Pr_Re59.0__ −+−−= CPIerLogNonManuficelativeLogDemandWorldLogNonManufExLogECM Estimation: 1981Q3-2004Q4, DW=2.08, SEEstimate=0.016 Imports in the Manufacturing Sector:
( )( ) ( )
( )( )
( )( )
( )( )
( )
( )( )
( )( )
( )( )
( ) 128.5354.2177.1302.2
0.12389.1229.2117.212.0
45.0__33.0__25.0_Pr_Re27.0
__37.1Im_12.0Im_16.0Im_15.00002.0Im_
−−
−−
−−
−
−−−
−∆−∆−∆+
∆+∆+∆+∆+=∆
ECMRateUtilCapacityRateUtilCapacityManuficelativeLog
ManufDemandDomesticLogManufLogManufLogManufLogManufLog
Where ( ) ( ) ( ) ( )830039.0011.059.2
__89.0_Pr_Re24.0__Im_trendtrend
RateUtilCapacityManuficelativeLogManufDemandDomesticLogManufLogECM+−+
−+−=
Estimation: 1979Q1-2004Q4, DW=2.06, SEEstimate=0.012 Imports in the Nonmanufacturing and Services Sectors, excluding Oil:
( )( ) ( )
( )( )
( )( )
( )( )
( )
( )( )
( )( )
( ) 182.257.152.1
581.1351.1264.1198.125.1
12.0_Pr_Re19.0__40.0
Im_18.0Im_15.0Im_16.0Im_20.00034.0Im_
−−
−−
−−−
−∆+∆+
∆−∆+∆+∆+=∆
ECMNonManuficelativeLogNonManufDemandDomesticLog
NonManufLogNonManufLogNonManufLogNonManufLogNonManufLog
Where ( ) ( ) ( ) 860037000540403310 trend.trend..NonManuf_Compet_icePrLog.NonManuf_Demand_DomesticLogNonManufIm_LogECM +−++−=
Estimation: 1979Q3-2004Q4, DW=1.99, SEEstimate=0.011
1 Figures in parenthesis below the estimated coefficients are T-statistics. Significance at 5 percent level is reached for T-statistics over 1.96.
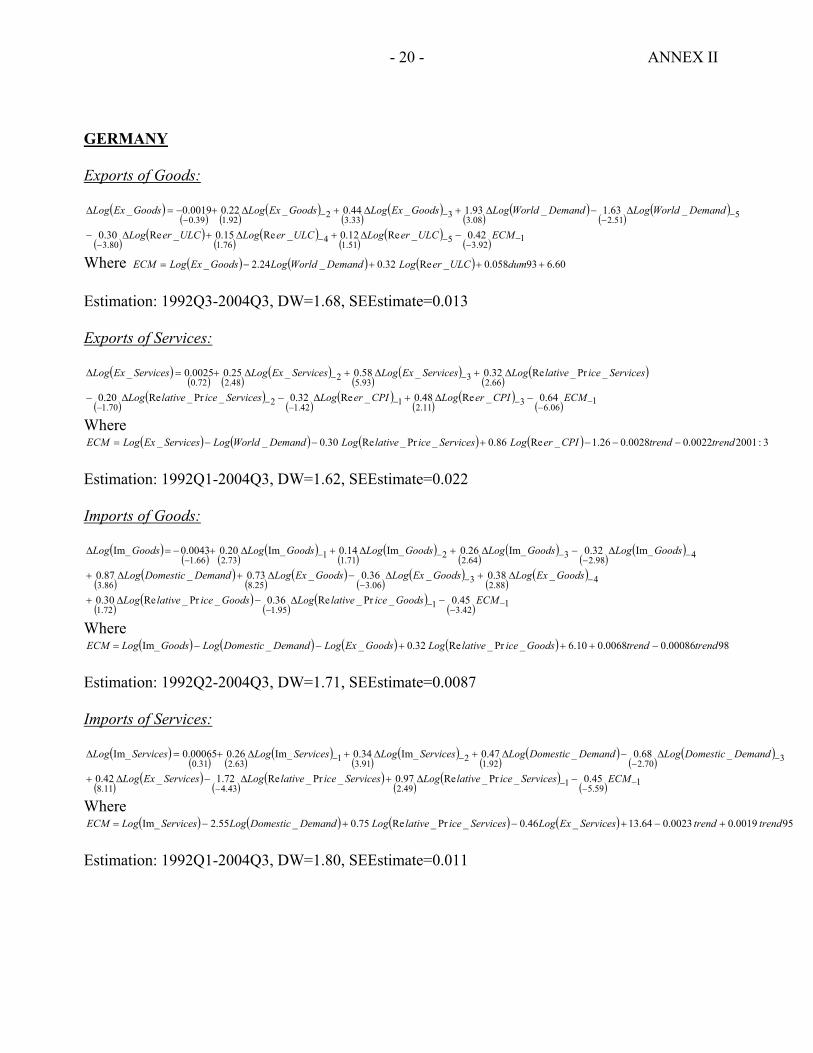
- 20 - ANNEX II
GERMANY Exports of Goods:
( )( ) ( )
( )( )
( )( )
( )( )
( )
( )( )
( )( )
( )( )
( ) 192.3551.1476.180.3
551.208.3333.3292.139.0
42.0_Re12.0_Re15.0_Re30.0
_63.1_93.1_44.0_22.00019.0_
−−
−−−
−−
−−−
−∆+∆+∆−
∆−∆+∆+∆+−=∆
ECMULCerLogULCerLogULCerLog
DemandWorldLogDemandWorldLogGoodsExLogGoodsExLogGoodsExLog
Where ( ) ( ) ( ) 60.693058.0_Re32.0_24.2_ +++−= dumULCerLogDemandWorldLogGoodsExLogECM Estimation: 1992Q3-2004Q3, DW=1.68, SEEstimate=0.013 Exports of Services:
( )( ) ( )
( )( )
( )( )
( )
( )( )
( )( )
( )( )
( ) 106.6311.2142.1270.1
66.2393.5248.272.0
64.0_Re48.0_Re32.0_Pr_Re20.0
_Pr_Re32.0_58.0_25.00025.0_
−−
−−−
−−
−−
−∆+∆−∆−
∆+∆+∆+=∆
ECMCPIerLogCPIerLogServicesicelativeLog
ServicesicelativeLogServicesExLogServicesExLogServicesExLog
Where ( ) ( ) ( ) ( ) 3:20010022.00028.026.1_Re86.0_Pr_Re30.0__ trendtrendCPIerLogServicesicelativeLogDemandWorldLogServicesExLogECM −−−+−−=
Estimation: 1992Q1-2004Q3, DW=1.62, SEEstimate=0.022 Imports of Goods:
( )( ) ( )
( )( )
( )( )
( )( )
( )
( )( )
( )( )
( )( )
( )( )
( )( )
( )( )
( ) 142.3195.172.1
488.2306.325.886.3
498.2364.2271.1173.266.1
45.0_Pr_Re36.0_Pr_Re30.0
_38.0_36.0_73.0_87.0
Im_32.0Im_26.0Im_14.0Im_20.00043.0Im_
−−
−−
−−−
−−
−−−−
−∆−∆+
∆+∆−∆+∆+
∆−∆+∆+∆+−=∆
ECMGoodsicelativeLogGoodsicelativeLog
GoodsExLogGoodsExLogGoodsExLogDemandDomesticLog
GoodsLogGoodsLogGoodsLogGoodsLogGoodsLog
Where ( ) ( ) ( ) ( ) 9800086.00068.010.6_Pr_Re32.0__Im_ trendtrendGoodsicelativeLogGoodsExLogDemandDomesticLogGoodsLogECM −+++−−=
Estimation: 1992Q2-2004Q3, DW=1.71, SEEstimate=0.0087 Imports of Services:
( )( ) ( )
( )( )
( )( )
( )( )
( )
( )( )
( )( )
( )( )
( ) 159.5149.243.411.8
370.292.1291.3163.231.0
45.0_Pr_Re97.0_Pr_Re72.1_42.0
_68.0_47.0Im_34.0Im_26.000065.0Im_
−−
−−
−−
−−
−∆+∆−∆+
∆−∆+∆+∆+=∆
ECMServicesicelativeLogServicesicelativeLogServicesExLog
DemandDomesticLogDemandDomesticLogServicesLogServicesLogServicesLog
Where ( ) ( ) ( ) ( ) 950019.00023.064.13_46.0_Pr_Re75.0_55.2Im_ trendtrendServicesExLogServicesicelativeLogDemandDomesticLogServicesLogECM +−+−+−=
Estimation: 1992Q1-2004Q3, DW=1.80, SEEstimate=0.011
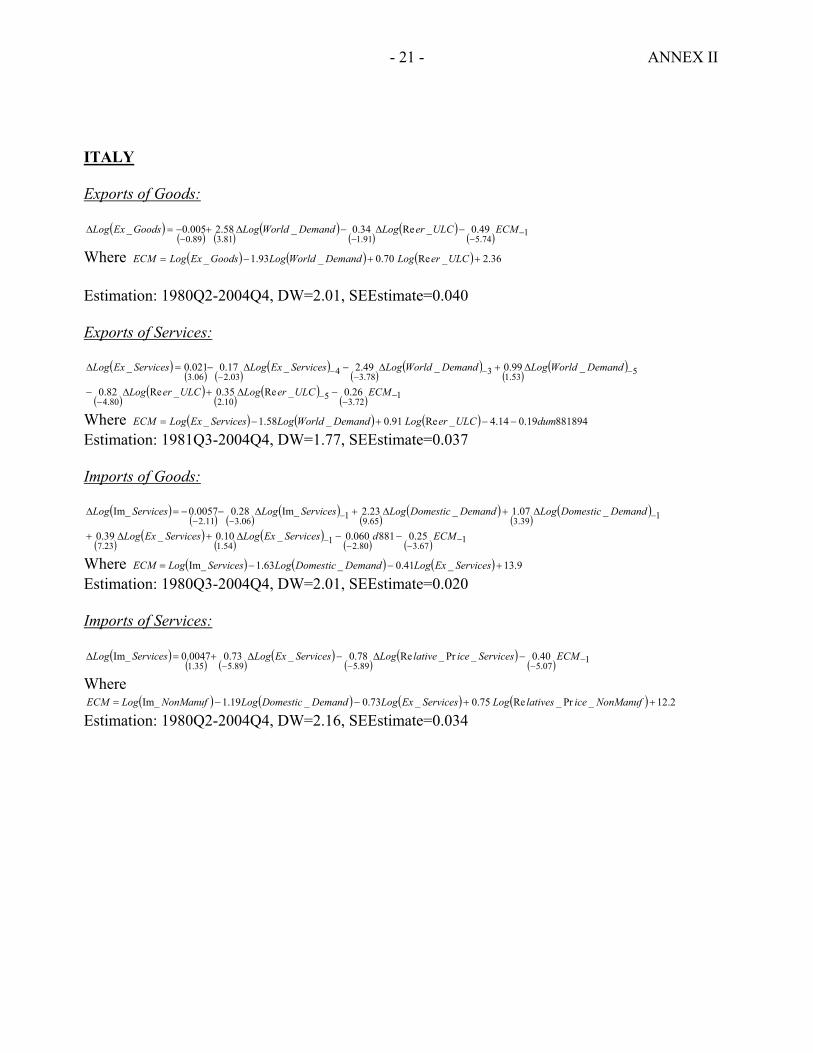
- 21 - ANNEX II
ITALY Exports of Goods:
( )( ) ( )
( )( )
( )( ) 1
74.591.181.389.049.0_Re34.0_58.2005.0_ −
−−−−∆−∆+−=∆ ECMULCerLogDemandWorldLogGoodsExLog
Where ( ) ( ) ( ) 36.2_Re70.0_93.1_ ++−= ULCerLogDemandWorldLogGoodsExLogECM Estimation: 1980Q2-2004Q4, DW=2.01, SEEstimate=0.040 Exports of Services:
( )( ) ( )
( )( )
( )( )
( )
( )( )
( )( )
( ) 172.3510.280.4
553.1378.3403.206.3
26.0_Re35.0_Re82.0
_99.0_49.2_17.0021.0_
−−
−−
−−−
−−
−∆+∆−
∆+∆−∆−=∆
ECMULCerLogULCerLog
DemandWorldLogDemandWorldLogServicesExLogServicesExLog
Where ( ) ( ) ( ) 88189419.014.4_Re91.0_58.1_ dumULCerLogDemandWorldLogServicesExLogECM −−+−= Estimation: 1981Q3-2004Q4, DW=1.77, SEEstimate=0.037 Imports of Goods:
( )( ) ( )
( )( )
( )( )
( )
( )( )
( )( )
( ) ( ) 167.380.2154.123.7
139.365.9106.311.2
25.0881060.0_10.0_39.0
_07.1_23.2Im_28.00057.0Im_
−−−
−
−−−−
−−∆+∆+
∆+∆+∆−−=∆
ECMdServicesExLogServicesExLog
DemandDomesticLogDemandDomesticLogServicesLogServicesLog
Where ( ) ( ) ( ) 9.13_41.0_63.1Im_ +−−= ServicesExLogDemandDomesticLogServicesLogECM Estimation: 1980Q3-2004Q4, DW=2.01, SEEstimate=0.020 Imports of Services:
( )( ) ( )
( )( )
( )( ) 1
07.589.589.535.140.0_Pr_Re78.0_73.00047.0Im_ −
−−−−∆−∆+=∆ ECMServicesicelativeLogServicesExLogServicesLog
Where( ) ( ) ( ) ( ) 2.12_Pr_Re75.0_73.0_19.1Im_ ++−−= NonManuficelativesLogServicesExLogDemandDomesticLogNonManufLogECM
Estimation: 1980Q2-2004Q4, DW=2.16, SEEstimate=0.034
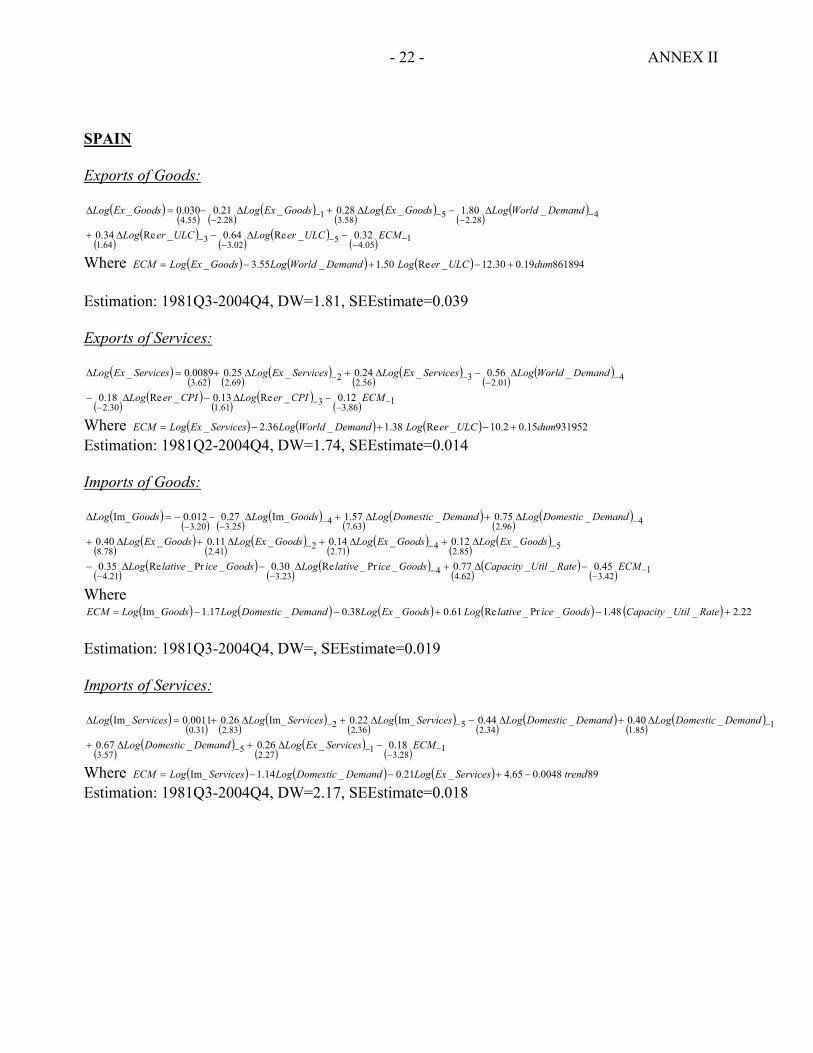
- 22 - ANNEX II
SPAIN Exports of Goods:
( )( ) ( )
( )( )
( )( )
( )
( )( )
( )( )
( ) 105.4502.3364.1
428.2558.3128.255.4
32.0_Re64.0_Re34.0
_80.1_28.0_21.0030.0_
−−
−−
−
−−
−−−
−∆−∆+
∆−∆+∆−=∆
ECMULCerLogULCerLog
DemandWorldLogGoodsExLogGoodsExLogGoodsExLog
Where ( ) ( ) ( ) 86189419.030.12_Re50.1_55.3_ dumULCerLogDemandWorldLogGoodsExLogECM +−+−= Estimation: 1981Q3-2004Q4, DW=1.81, SEEstimate=0.039 Exports of Services:
( )( ) ( )
( )( )
( )( )
( )
( )( )
( )( )
( ) 186.3361.130.2
401.2356.2269.262.3
12.0_Re13.0_Re18.0
_56.0_24.0_25.00089.0_
−−
−−
−−
−−
−∆−∆−
∆−∆+∆+=∆
ECMCPIerLogCPIerLog
DemandWorldLogServicesExLogServicesExLogServicesExLog
Where ( ) ( ) ( ) 93195215.02.10_Re38.1_36.2_ dumULCerLogDemandWorldLogServicesExLogECM +−+−= Estimation: 1981Q2-2004Q4, DW=1.74, SEEstimate=0.014 Imports of Goods:
( )( ) ( )
( )( )
( )( )
( )
( )( )
( )( )
( )( )
( )( )
( )( )
( )( )
( )( )
( ) 142.362.4423.321.4
585.2471.2241.278.8
496.263.7425.320.3
45.0__77.0_Pr_Re30.0_Pr_Re35.0
_12.0_14.0_11.0_40.0
_75.0_57.1Im_27.0012.0Im_
−−
−−−
−−−
−−−−
−∆+∆−∆−
∆+∆+∆+∆+
∆+∆+∆−−=∆
ECMRateUtilCapacityGoodsicelativeLogGoodsicelativeLog
GoodsExLogGoodsExLogGoodsExLogGoodsExLog
DemandDomesticLogDemandDomesticLogGoodsLogGoodsLog
Where ( ) ( ) ( ) ( ) ( ) 22.2__48.1_Pr_Re61.0_38.0_17.1Im_ +−+−−= RateUtilCapacityGoodsicelativeLogGoodsExLogDemandDomesticLogGoodsLogECM
Estimation: 1981Q3-2004Q4, DW=, SEEstimate=0.019 Imports of Services:
( )( ) ( )
( )( )
( )( )
( )( )
( )
( )( )
( )( )
( ) 128.3127.2557.3
185.134.2536.2283.231.0
18.0_26.0_67.0
_40.0_44.0Im_22.0Im_26.00011.0Im_
−−
−−
−−−
−∆+∆+
∆+∆−∆+∆+=∆
ECMServicesExLogDemandDomesticLog
DemandDomesticLogDemandDomesticLogServicesLogServicesLogServicesLog
Where ( ) ( ) ( ) 890048.065.4_21.0_14.1Im_ trendServicesExLogDemandDomesticLogServicesLogECM −+−−= Estimation: 1981Q3-2004Q4, DW=2.17, SEEstimate=0.018
- 23 - ANNEX II
Man
ufac
ture
dN
onm
anuf
.M
anuf
actu
red
Non
man
uf.
Goo
dsG
oods
and
Goo
dsG
oods
and
Goo
dsSe
rvic
esG
oods
Serv
ices
Goo
dsSe
rvic
esG
oods
Serv
ices
Goo
dsSe
rvic
esG
oods
Serv
ices
Serv
ices
Serv
ices
(Exc
l. O
il)
Fore
ign
Dem
and
1.00
1.00
2.24
1.00
1.93
1.58
3.55
2.36
(c)
(c)
(76.
18)
(c)
(75.
07)
(52.
38)
(87.
08)
(68.
04)
Dom
estic
Dem
and
1.00
1.00
1.00
2.55
1.63
1.19
1.17
1.14
(c)
(c)
(c)
(10.
04)
(20.
63)
(13.
11)
(15.
4)(1
2.3)
Expo
rts1.
000.
460.
410.
730.
380.
21(c
)(4
.93)
(13.
90)
(13.
66)
(19.
3)(6
.09)
Rel
ativ
e Pr
ices
2/
1.22
0.59
-0.2
4-0
.32
0.30
-0.3
2-0
.75
-0.7
5-0
.61
(7.9
0)(2
1.50
)(-
4.12
)(-
2.45
)(1
.58)
(-5.
02)
(-2.
06)
(-7.
43)
(-17
.2)
Rea
l Effe
ctiv
e Ex
chan
ge R
ate
base
d on
ULC
in th
e m
anuf
actu
ring
sect
or-0
.80
-0.3
2-0
.70
-0.9
1-1
.50
-1.3
8(-
3.68
)(-
10.1
8)(-
9.51
)(-
11.4
4)(-
15.7
9)(-
17.7
1)ba
sed
on C
PI in
the
who
le e
cono
my
-0.4
6-0
.86
(-4.
69)
(-4.
21)
Cap
acity
Util
izat
ion
Rat
e0.
881.
48(1
0.03
)(9
.42)
Tren
d st
artin
g in
...
1982
:119
78:1
1978
:119
91:1
1991
:119
91:1
1989
:1-0
.001
60.
011
0.00
540.
0028
-0.0
068
0.00
230.
0048
(-1.
93)
(18.
67)
(11.
00)
(5.5
5)(-
14.7
5)(1
.50)
(9.2
7)
Bre
ak in
tren
d 3/
in 1
983:
1in
198
6:1
2001
:31
1998
:119
95:1
-0.0
039
-0.0
037
0.00
220.
0008
6-0
.001
9(-
8.11
)(-
6.56
)(6
.78)
(3.1
6)(-
1.83
)
Dum
my
over
the
perio
d of
1993
:2-1
993:
319
88:1
-198
9:4
1986
:1-1
989:
419
93:1
-199
5:2
-0.0
6-0
.19
-0.1
9-0
.15
(-3.
90)
(-8.
83)
(-11
.23)
(-10
.29)
Stat
istic
al te
sts f
or C
oint
egra
tion
Rel
atio
nshi
p 4/
Z(rh
o)-2
3.28
*-2
4.58
*-3
5.97
***
-20.
85 *
-23.
21*
-26.
13 *
-24.
97**
-46.
75**
*-5
2.55
***
-33.
40 *
*-2
8.78
**-3
2.13
**-5
9.53
***
-28.
30 *
*-4
5.55
**-2
7.11
**Z(
t)-3
.52
*- 3
.68
*-4
.95
***
-3.5
4**
-3.8
1 **
-4.4
0 **
*-4
.02*
**-5
.55*
**-5
.77*
**-4
.54
***
-4.5
6***
-4.3
2**
-6.3
1 **
*-4
.02
**-5
.25*
**-3
.91*
*
1/ A
ll va
riabl
es, e
xcep
t the
tren
ds, a
re in
loga
rithm
s. Fi
gure
s in
pare
nthe
sis b
elow
the
coef
ficie
nt e
stim
ates
are
T-s
tatis
tics.
Estim
atio
n al
so in
clud
es a
con
stan
t.2/
The
rela
tive
pric
es v
aria
ble
for e
xpor
ts is
the
ratio
of f
orei
gn G
DP
pric
es (e
xpre
ssed
in e
uros
) ove
r exp
orte
r pric
es,
and
for i
mpo
rts th
e ra
tio o
f im
port
pric
es o
ver d
omes
tic d
eman
d pr
ices
.3/
The
coe
ffici
ent f
or th
e pe
riod
afte
r the
bre
ak in
tren
d is
the
sum
of b
oth
this
coe
ffici
ent a
nd th
e on
e fo
r the
tren
d st
artin
g at
the
begi
nnin
g of
the
sam
plin
g pe
riod
4/ P
hilli
ps-O
ulia
ris-H
anse
n te
sts,
criti
cal v
alue
s der
ived
from
Ham
ilton
(199
4).
A *
** si
gnal
s sig
nific
ance
of t
he c
oint
egra
tion
rela
tions
hip
at 1
per
cent
leve
l, **
at 5
per
cent
leve
l, an
d *
at 1
0 pe
rcen
t.
Spai
n (E
stim
ated
ove
r 198
0-20
04)
Expo
rtsIm
ports
Ann
ex T
able
. Tes
ting
for C
oint
egra
tion
Rel
atio
nshi
p an
d Es
timat
ion
of th
e Lo
ng-te
rm T
rade
Equ
atio
ns 1
/
Expo
rtsIm
ports
Ger
man
y (E
stim
ated
ove
r 199
1-20
04Q
3)Ita
ly (E
stim
ated
ove
r 198
0-20
04)
Expo
rtsIm
ports
Expo
rtsIm
ports
Fran
ce (E
stim
ated
ove
r 197
8-20
04)
- 24 - ANNEX III
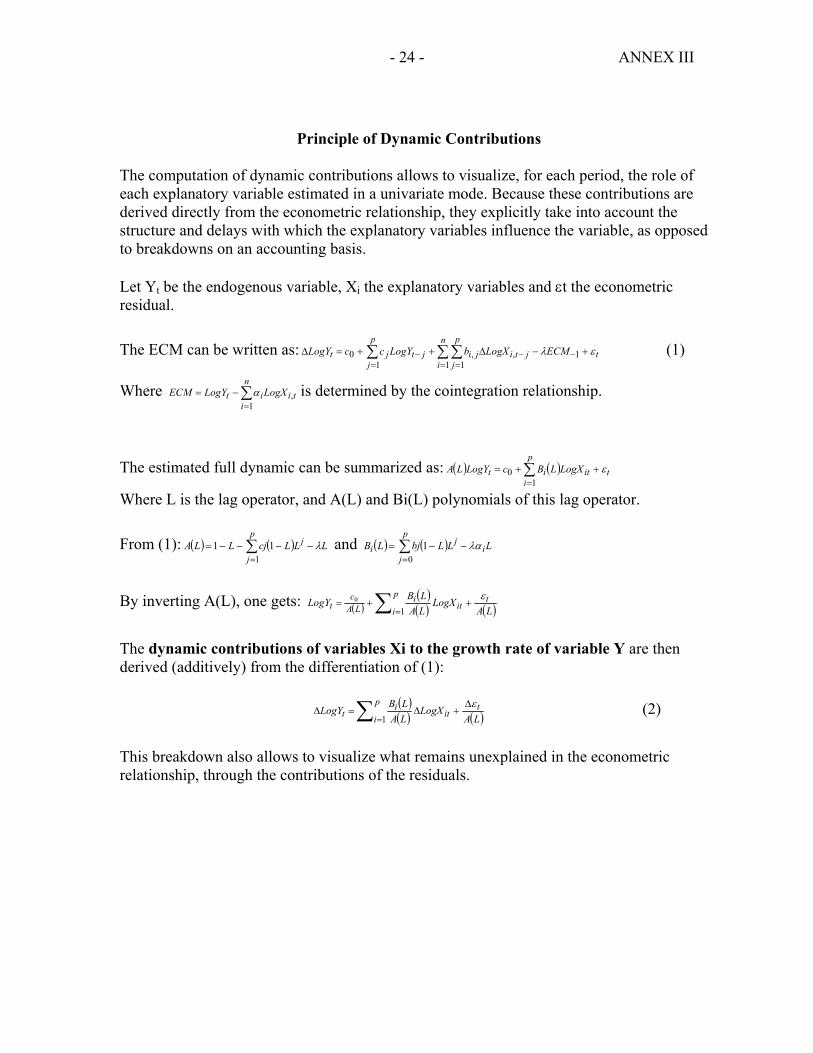
Principle of Dynamic Contributions The computation of dynamic contributions allows to visualize, for each period, the role of each explanatory variable estimated in a univariate mode. Because these contributions are derived directly from the econometric relationship, they explicitly take into account the structure and delays with which the explanatory variables influence the variable, as opposed to breakdowns on an accounting basis. Let Yt be the endogenous variable, Xi the explanatory variables and εt the econometric residual.
The ECM can be written as: ∑∑∑=
−=
−=
− +−∆++=∆n
it
p
jjtiji
p
jjtjt ECMLogXbLogYccLogY
11
1,,
10 ελ (1)
Where ∑=
−=n
itiit LogXLogYECM
1,α is determined by the cointegration relationship.
The estimated full dynamic can be summarized as: ( ) ( )∑=
++=p
ititit LogXLBcLogYLA
10 ε
Where L is the lag operator, and A(L) and Bi(L) polynomials of this lag operator.
From (1): ( ) ( ) LLLcjLLAp
j
j λ−−−−= ∑=1
11 and ( ) ( ) LLLbjLB ip
j
ji λα−−= ∑
=01
By inverting A(L), one gets: ( )
( )( ) ( )∑ =
++=p
it
iti
LAc
t LALogX
LALBLogY
10 ε
The dynamic contributions of variables Xi to the growth rate of variable Y are then derived (additively) from the differentiation of (1):
( )( ) ( )∑ =
∆+∆=∆
p
it
iti
t LALogX
LALBLogY
1
ε (2)
This breakdown also allows to visualize what remains unexplained in the econometric relationship, through the contributions of the residuals.

- 25 - ANNEX III
REFERENCES
Amighini, A., and S. Chiarlone, 2003, “Rischi e opportunità dell’integrazione commerciale cinese per la competitività internazionale dell'Italia,” CESPRI Working Papers 149, (Centre for Research on Innovation and Internationalisation, Universita' Bocconi: Milano, Italy).
Bugamelli, M., and R. Tedeschi, 2004, “Le Strategie di Prezzo delle Imprese Esportatrici
Italiane”, in Concorrenza ed Efficienza delle Imprese Italiane negli Anni Novanta, Mimeo, Bank of Italy.
Buisán A., and E. Gordo, 1997, “El sector exterior en España,” Estudios Económicos 60,
Banco de España. Desruennes, A., 2005, “Quelle lecture faire de l’évolution récente des exportations
françaises?” DPAE No 70, Ministry of Finance, April 2005. ECB - Task Force of the monetary Policy Committee of the European system of Central
Banks, 2005, “Competitiveness and the Export Performance of the Euro Area,” Occasional Paper No. 70, European Central Bank, June 2005.
Estrada A., J.L. Fernández, E. Moral and A.V. Regil, 2004, “A Quarterly Macroeconometric
Model of the Spanish Economy,” Working Paper No. 0413, Bank of Spain. Faruqee, H., 2004, “Exchange Rate Pass-Through in the Euro Area: The Role of Asymmetric
Pricing Behavior,” IMF Working Papers 04/14, (Washington: International Monetary Fund).
Girard, E., 2004, “Comment expliquer l’évolution récente du compte courant en France?” DPAE No. 56, French ministry of finance, December 2004.
Hamilton, J., 1994, “Time Series Analysis,” Princeton University Press.
ISAE, 2005, Rapporto ISAE—Previsioni per l’Economia Italiana, Istituto di Studi e Analisi Economica: Rome.
L’Angevin, C., and S. Serravalle, 2005, “Performances à l’exportation de la France et de l’Allemagne. Une analyse par secteur et destination géographique,” INSEE Working Paper 2005/5.
Minefi, 2005, “Peut-on mieux comprendre l’évolution récente de nos exportations? Une analyse économométrique.” DGTPE, Mimeo, French minstry of finance, June 2005.