Embed Size (px)
Citation preview
Fraser River Sockeye Return Forecasts: Methods, Indicators, and Uncertainty
Sue Grant & Bronwyn MacDonald PICES Oct 14, 2013
Fisheries and Oceans Pêches et Océans Canada Canada
1
2
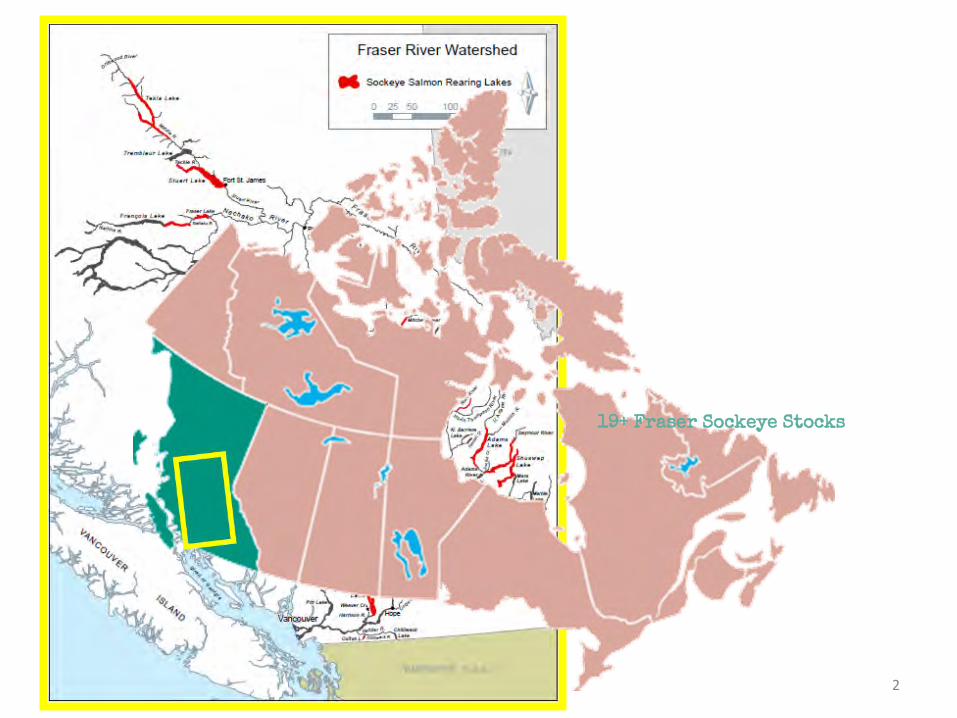
19+ Fraser Sockeye Stocks
3
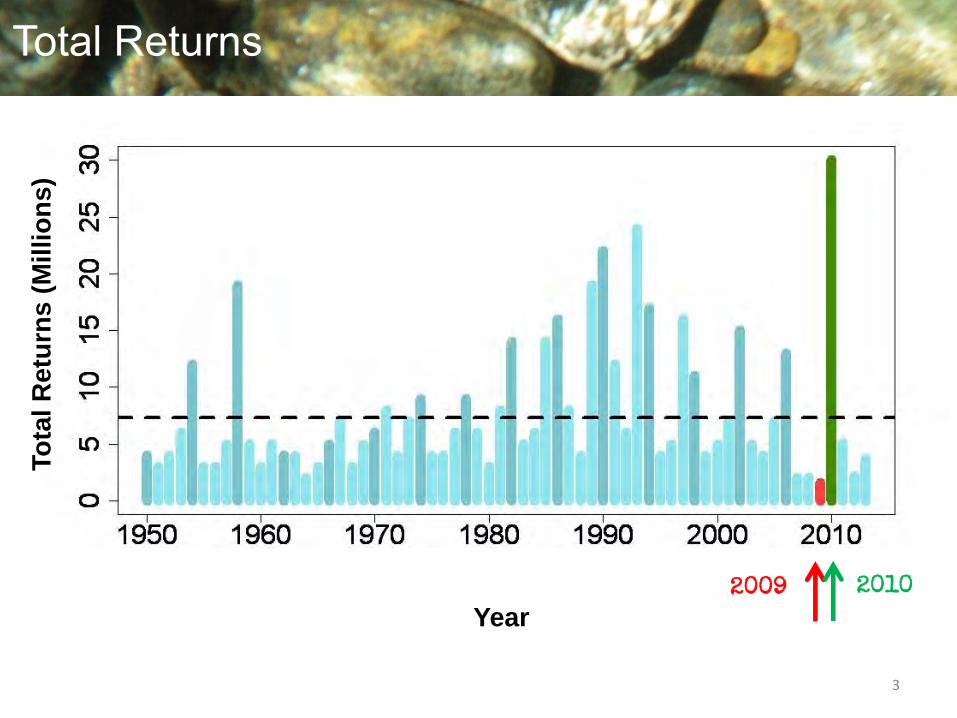
Total Returns To
tal R
etu
rns (
Millio
ns)
Year
2009 2010
4
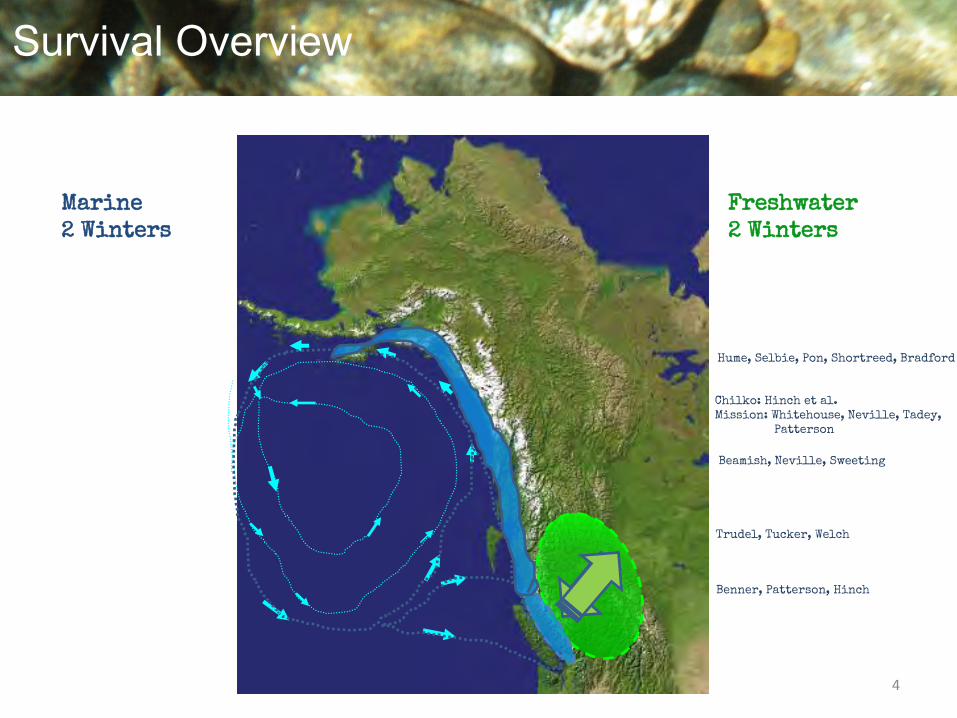
Marine 2 Winters
Freshwater 2 Winters
Beamish, Neville, Sweeting
Trudel, Tucker, Welch
Survival Overview
Chilko: Hinch et al. Mission: Whitehouse, Neville, Tadey, Patterson
Benner, Patterson, Hinch
Hume, Selbie, Pon, Shortreed, Bradford

Chilko Sockeye Fraser Sockeye Indicator Stock
5
6
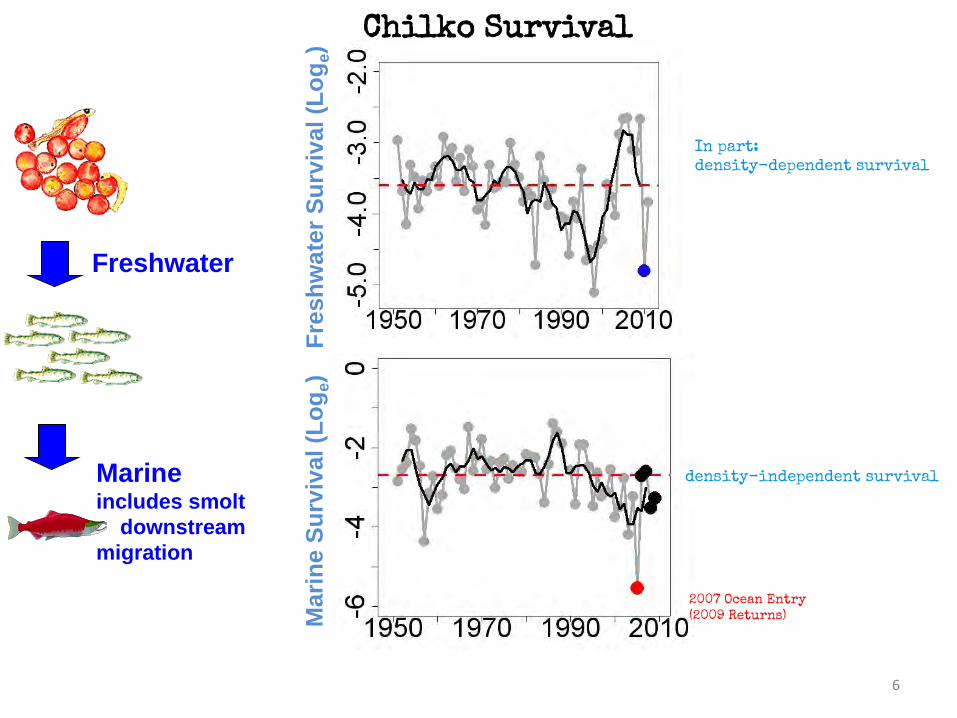
Freshwater
Marine includes smolt
downstream
migration
Year
Fre
sh
wate
r S
urv
ival (L
og
e)
Mari
ne S
urv
ival (L
og
e)
Chilko Survival
In part: density-dependent survival
2007 Ocean Entry (2009 Returns)
density-independent survival
Total Survival Freshwater & marine
7
8
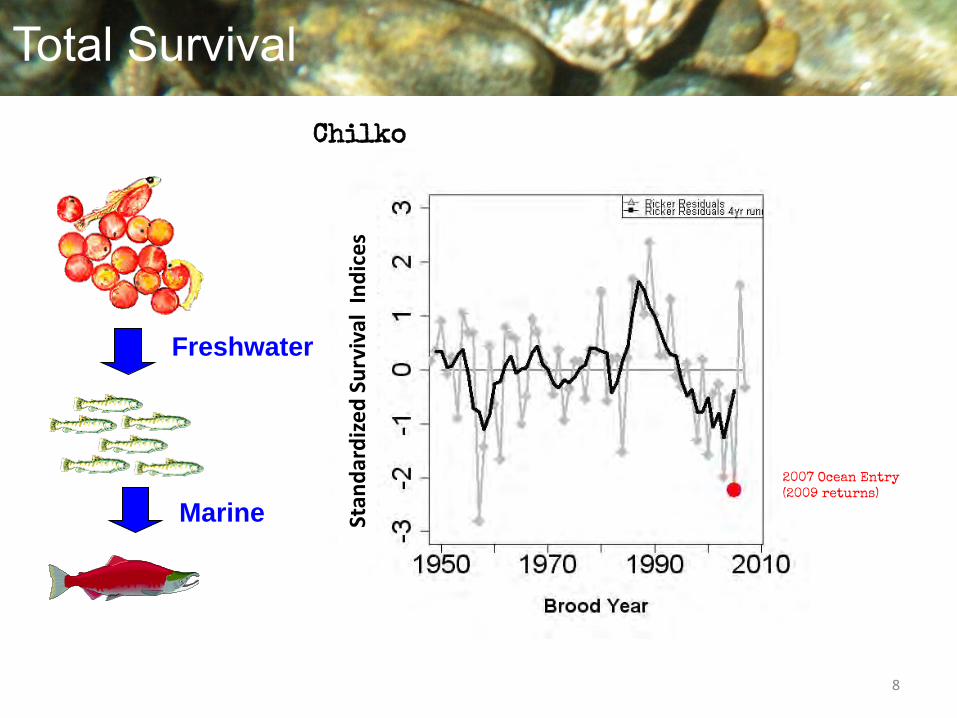
Freshwater
Marine
Chilko
Total Survival
2007 Ocean Entry (2009 returns)
Stan
dar
diz
ed S
urv
ival
In
dic
es
9
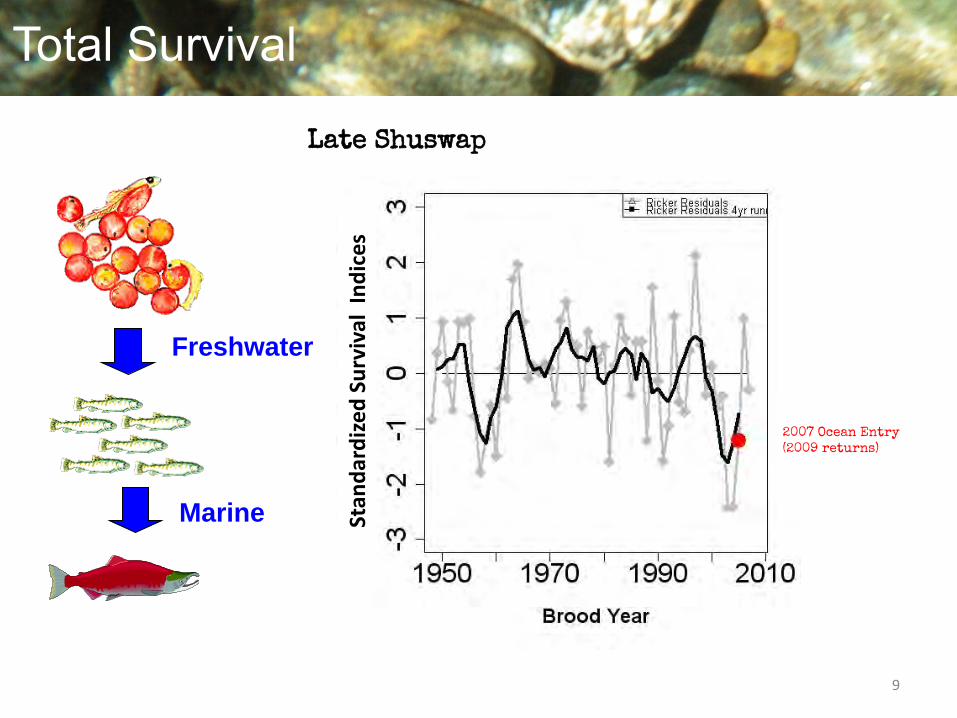
Freshwater
Marine
Late Shuswap
Total Survival Total Survival
2007 Ocean Entry (2009 returns)
Stan
dar
diz
ed S
urv
ival
In
dic
es
10
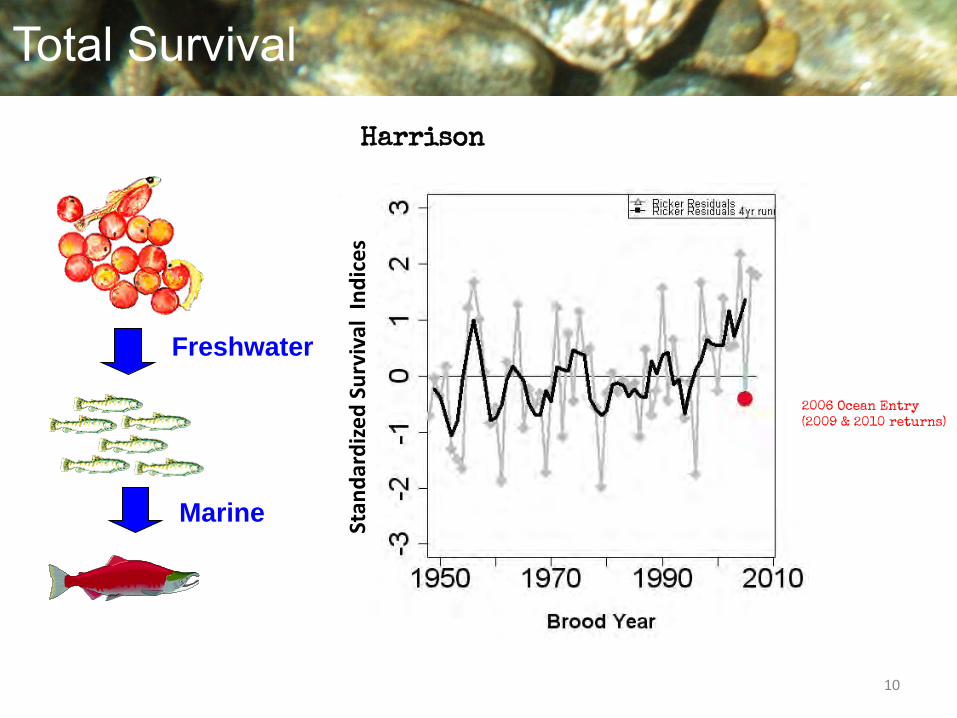
Freshwater
Marine
Harrison
Total Survival Total Survival
2006 Ocean Entry (2009 & 2010 returns)
Stan
dar
diz
ed S
urv
ival
In
dic
es
Stan
dar
diz
ed S
urv
ival
In
dic
es
11
FORCAST METHODS AND INDICATORS
12
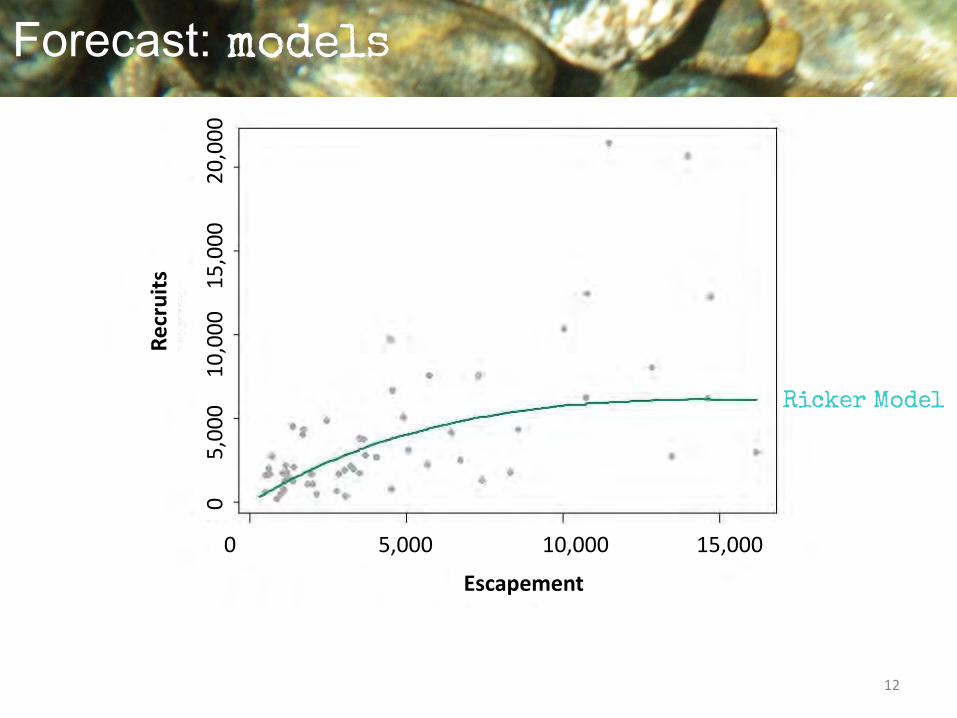
Forecast Models Forecast: models
Re
cru
its
Escapement
0 5,000 10,000 15,000
0
5
,00
0
10
,00
0
15
,00
0
2
0,0
00
Ricker Model
13
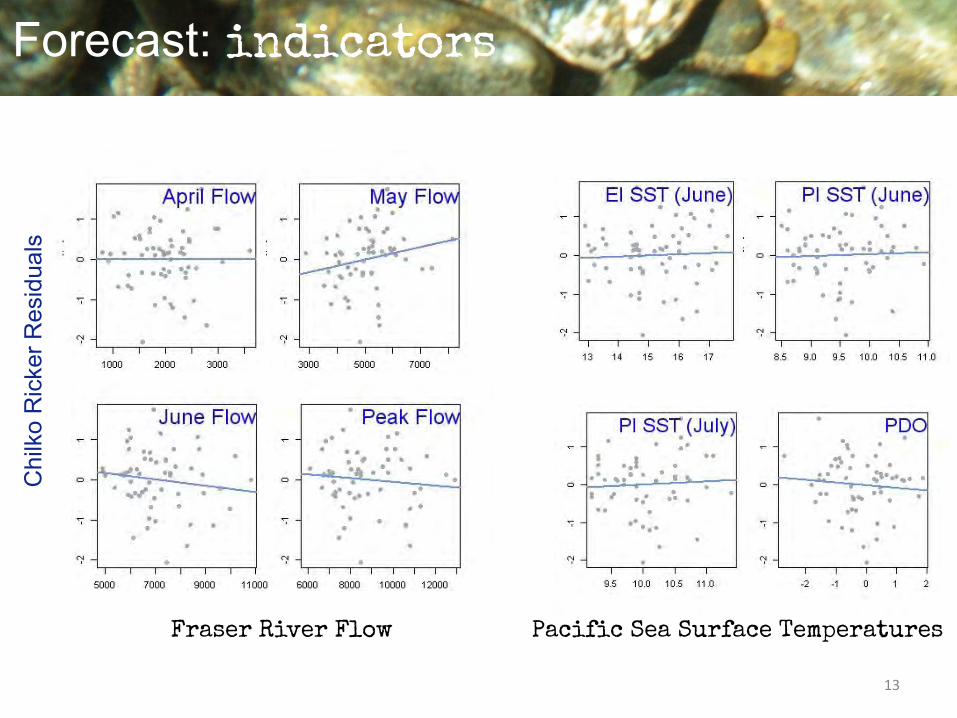
Ricker Model ln(Rt /St) = a – bSt + γXt+2 + εt Forecast: indicators
Chi
lko
Ric
ker R
esid
uals
Fraser River Flow Pacific Sea Surface Temperatures
14
Forecast Uncertainty
Chilko smolts
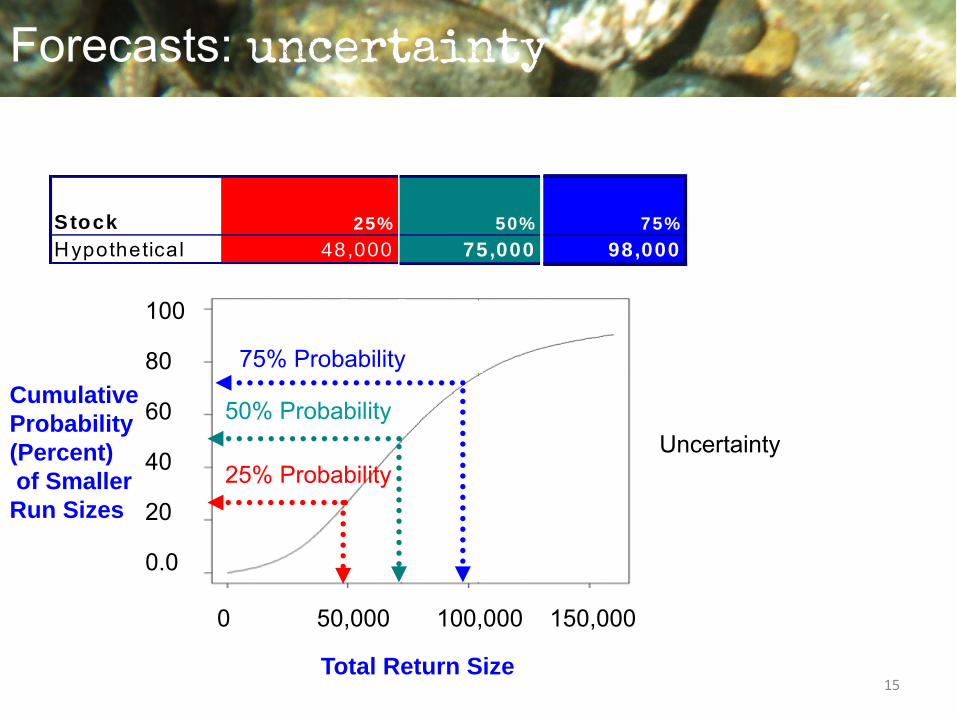
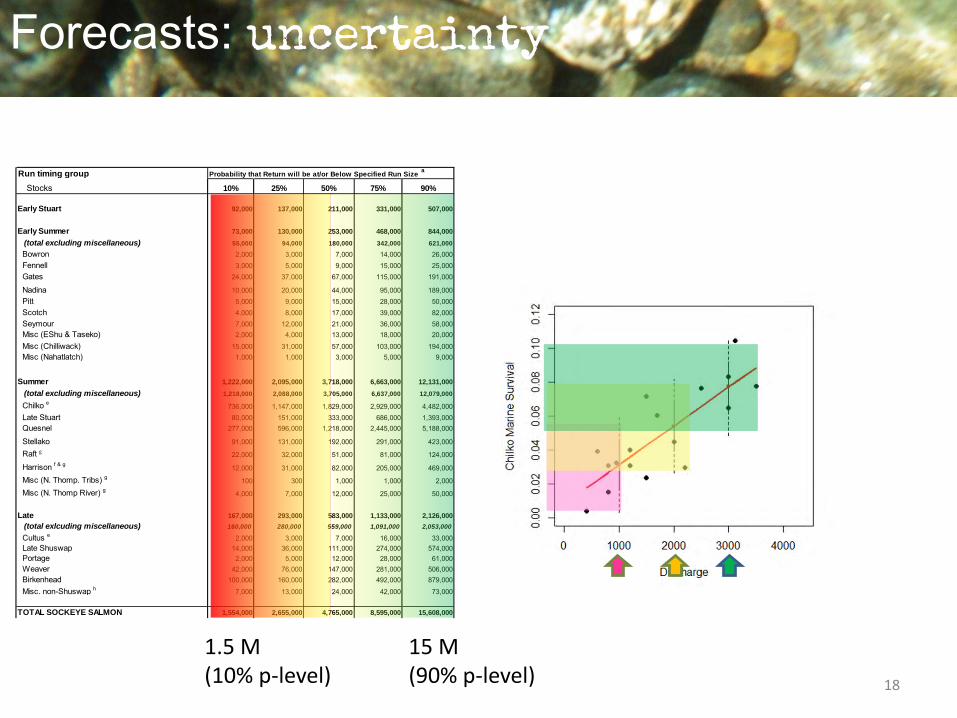
Forecasts: uncertainty
15
100
80
60
40
20
0.0
0 50,000 100,000 150,000
Total Return Size
Cumulative
Probability
(Percent)
of Smaller
Run Sizes
25% Probability
50% Probability
75% Probability
75,000
50%
Hypothetical 48,000
Stock 25%
98,000
75%
Uncertainty
16
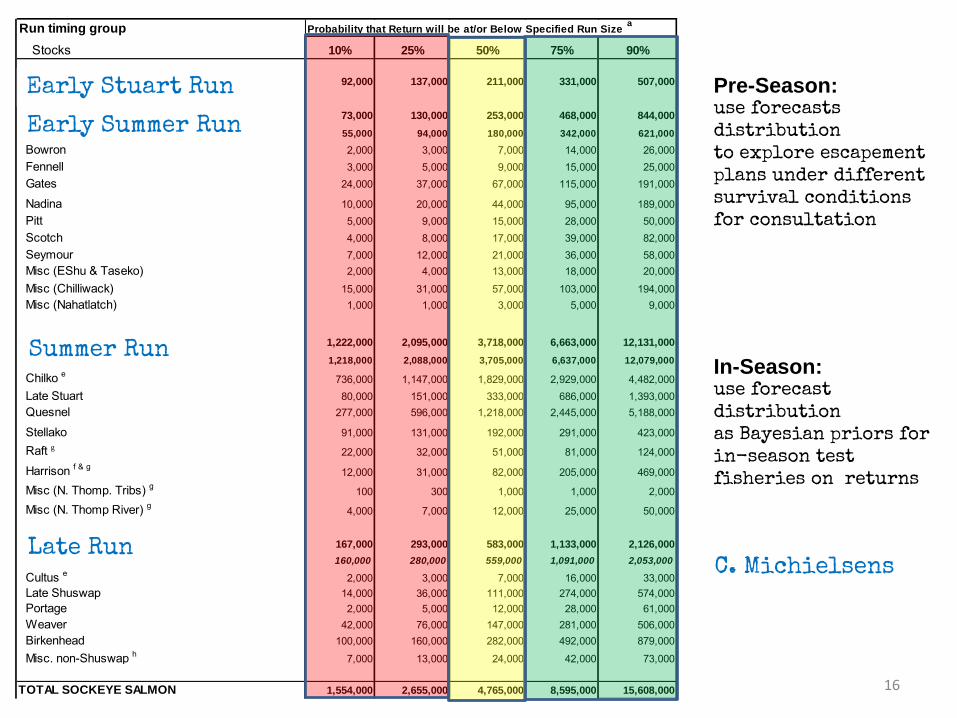
Run timing group StocksProbability that Return will be at/or Below Specified Run Size a
Stocks 10% 25% 50% 75% 90%
Early Stuart 92,000 137,000 211,000 331,000 507,000
Early Summer 73,000 130,000 253,000 468,000 844,000
(total excluding miscellaneous) 55,000 94,000 180,000 342,000 621,000
Bowron 2,000 3,000 7,000 14,000 26,000Fennell 3,000 5,000 9,000 15,000 25,000Gates 24,000 37,000 67,000 115,000 191,000
Nadina 10,000 20,000 44,000 95,000 189,000Pitt 5,000 9,000 15,000 28,000 50,000Scotch 4,000 8,000 17,000 39,000 82,000Seymour 7,000 12,000 21,000 36,000 58,000Misc (EShu & Taseko) 2,000 4,000 13,000 18,000 20,000
Misc (Chilliwack) 15,000 31,000 57,000 103,000 194,000Misc (Nahatlatch) 1,000 1,000 3,000 5,000 9,000
Summer 1,222,000 2,095,000 3,718,000 6,663,000 12,131,000
(total excluding miscellaneous) 1,218,000 2,088,000 3,705,000 6,637,000 12,079,000
Chilko e 736,000 1,147,000 1,829,000 2,929,000 4,482,000Late Stuart 80,000 151,000 333,000 686,000 1,393,000Quesnel 277,000 596,000 1,218,000 2,445,000 5,188,000
Stellako 91,000 131,000 192,000 291,000 423,000
Raft g 22,000 32,000 51,000 81,000 124,000
Harrison f & g 12,000 31,000 82,000 205,000 469,000
Misc (N. Thomp. Tribs) g 100 300 1,000 1,000 2,000
Misc (N. Thomp River) g 4,000 7,000 12,000 25,000 50,000
Late 167,000 293,000 583,000 1,133,000 2,126,000
(total exlcuding miscellaneous) 160,000 280,000 559,000 1,091,000 2,053,000
Cultus e 2,000 3,000 7,000 16,000 33,000Late Shuswap 14,000 36,000 111,000 274,000 574,000Portage 2,000 5,000 12,000 28,000 61,000Weaver 42,000 76,000 147,000 281,000 506,000Birkenhead 100,000 160,000 282,000 492,000 879,000
Misc. non-Shuswap h 7,000 13,000 24,000 42,000 73,000
TOTAL SOCKEYE SALMON 1,554,000 2,655,000 4,765,000 8,595,000 15,608,000
Pre-Season: use forecasts distribution to explore escapement plans under different survival conditions for consultation
In-Season: use forecast distribution as Bayesian priors for in-season test fisheries on returns
Early Stuart Run
Early Summer Run
Summer Run
Late Run C. Michielsens
17
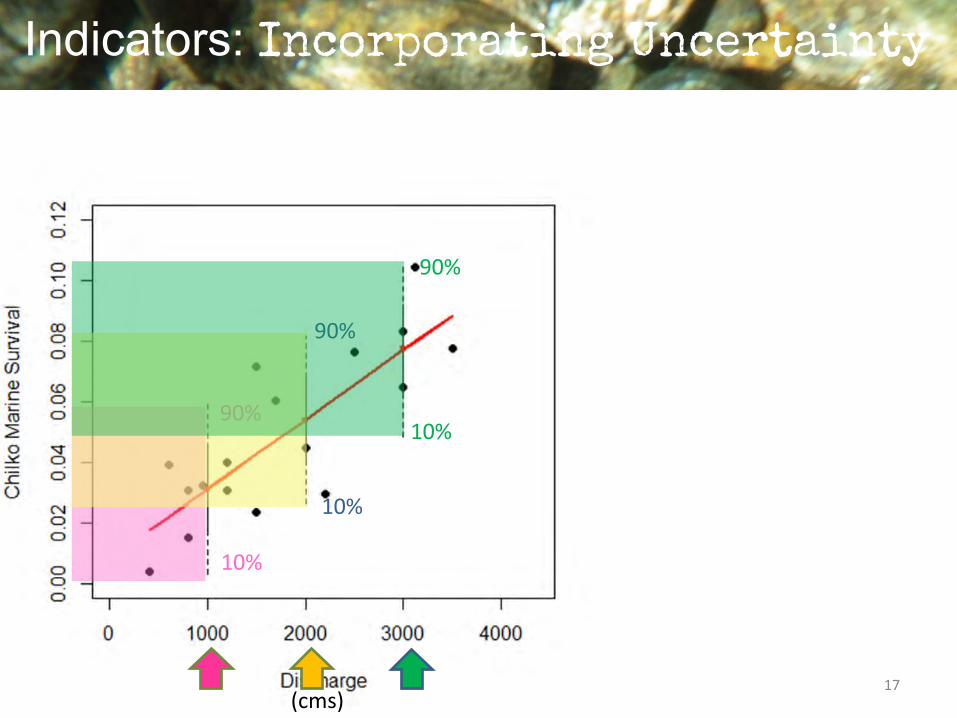
Indicators: Incorporating Uncertainty
90%
10%
90%
10%
10%
90%
(cms)
18
Run timing group StocksProbability that Return will be at/or Below Specified Run Size a
Stocks 10% 25% 50% 75% 90%
Early Stuart 92,000 137,000 211,000 331,000 507,000
Early Summer 73,000 130,000 253,000 468,000 844,000
(total excluding miscellaneous) 55,000 94,000 180,000 342,000 621,000
Bowron 2,000 3,000 7,000 14,000 26,000Fennell 3,000 5,000 9,000 15,000 25,000Gates 24,000 37,000 67,000 115,000 191,000
Nadina 10,000 20,000 44,000 95,000 189,000Pitt 5,000 9,000 15,000 28,000 50,000Scotch 4,000 8,000 17,000 39,000 82,000Seymour 7,000 12,000 21,000 36,000 58,000Misc (EShu & Taseko) 2,000 4,000 13,000 18,000 20,000
Misc (Chilliwack) 15,000 31,000 57,000 103,000 194,000Misc (Nahatlatch) 1,000 1,000 3,000 5,000 9,000
Summer 1,222,000 2,095,000 3,718,000 6,663,000 12,131,000
(total excluding miscellaneous) 1,218,000 2,088,000 3,705,000 6,637,000 12,079,000
Chilko e 736,000 1,147,000 1,829,000 2,929,000 4,482,000Late Stuart 80,000 151,000 333,000 686,000 1,393,000Quesnel 277,000 596,000 1,218,000 2,445,000 5,188,000
Stellako 91,000 131,000 192,000 291,000 423,000
Raft g 22,000 32,000 51,000 81,000 124,000
Harrison f & g 12,000 31,000 82,000 205,000 469,000
Misc (N. Thomp. Tribs) g 100 300 1,000 1,000 2,000
Misc (N. Thomp River) g 4,000 7,000 12,000 25,000 50,000
Late 167,000 293,000 583,000 1,133,000 2,126,000
(total exlcuding miscellaneous) 160,000 280,000 559,000 1,091,000 2,053,000
Cultus e 2,000 3,000 7,000 16,000 33,000Late Shuswap 14,000 36,000 111,000 274,000 574,000Portage 2,000 5,000 12,000 28,000 61,000Weaver 42,000 76,000 147,000 281,000 506,000Birkenhead 100,000 160,000 282,000 492,000 879,000
Misc. non-Shuswap h 7,000 13,000 24,000 42,000 73,000
TOTAL SOCKEYE SALMON 1,554,000 2,655,000 4,765,000 8,595,000 15,608,000
1.5 M (10% p-level)
15 M (90% p-level)
Forecasts: uncertainty
• For some stocks understanding what drives survival is complex; i.e. stocks with broad FW & marine distribution
• Indicator exploration should describe uncertainty in relationships (Bayesian approaches)
• differences in survival trends between stocks are useful to explore hypotheses (useful starting point for indicator exploration)
• Even indicators that frame out extremes (will survival be a well above average or well below average year) are helpful in traditional stock-recruit forecasts
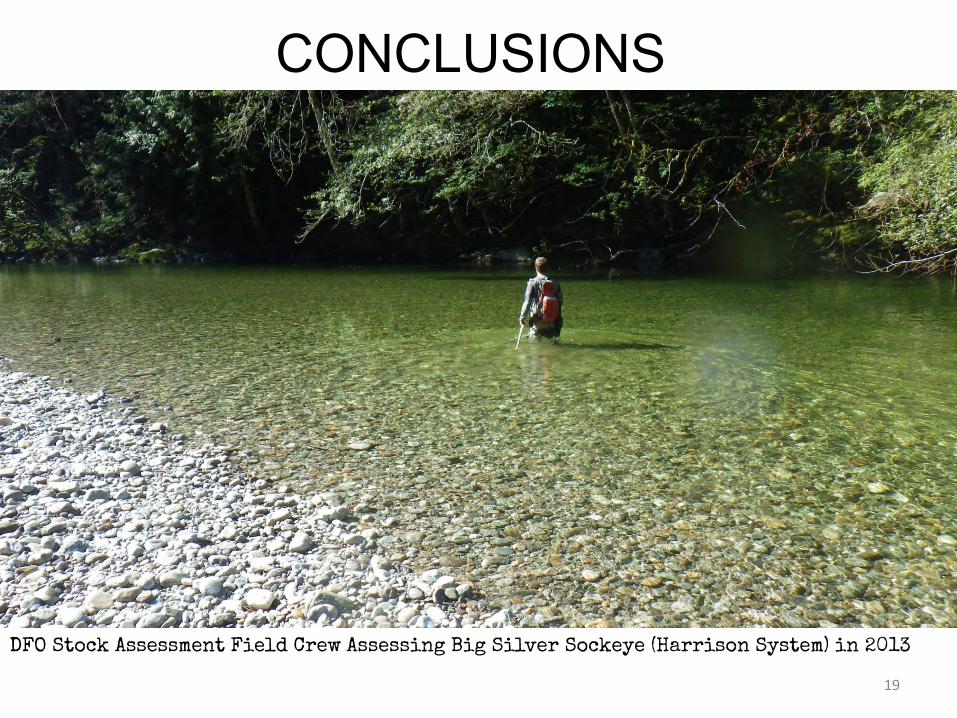
CONCLUSIONS
19
DFO Stock Assessment Field Crew Assessing Big Silver Sockeye (Harrison System) in 2013
20
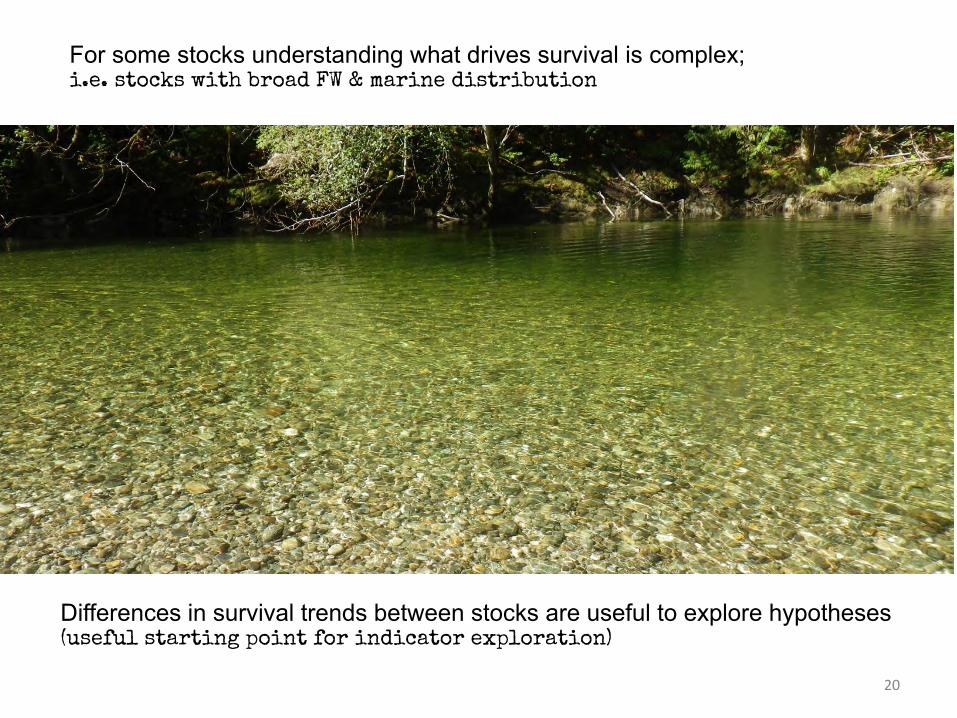
For some stocks understanding what drives survival is complex; i.e. stocks with broad FW & marine distribution
Differences in survival trends between stocks are useful to explore hypotheses (useful starting point for indicator exploration)
21
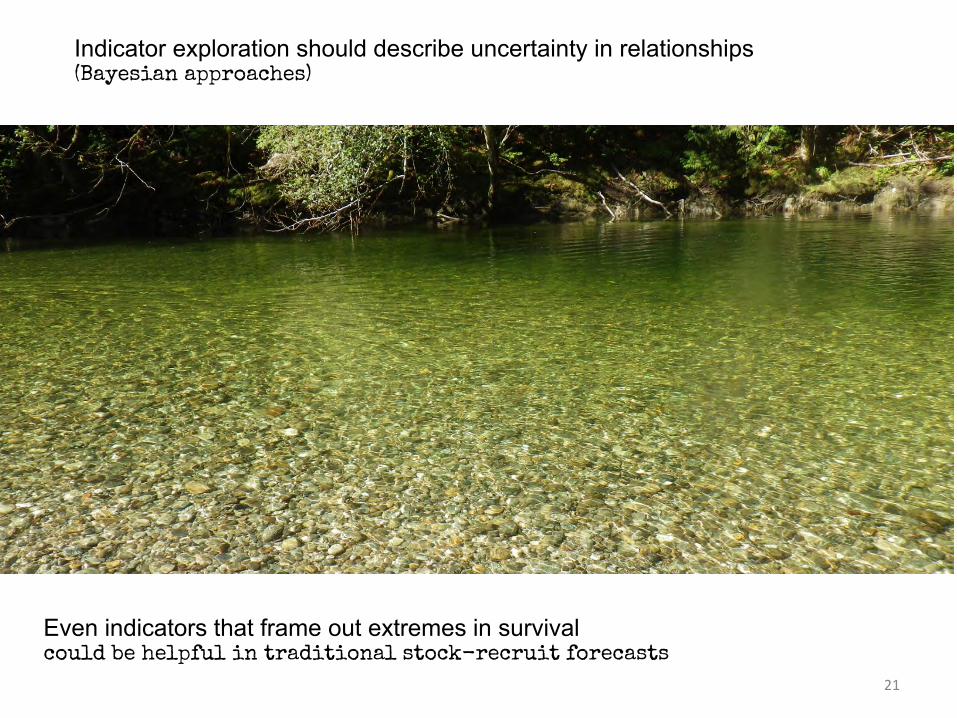
Indicator exploration should describe uncertainty in relationships (Bayesian approaches)
Even indicators that frame out extremes in survival could be helpful in traditional stock-recruit forecasts
22
End
DFO Stock assessment field crew assessing the large Adams River Sockeye Run in 2010 (setting the stage for 2014)