Embed Size (px)
Citation preview
FREE SPEED STUDY
Survey Report 2014
Research Department June 2015
2
FREE-SPEED SURVEY 2014
Free-speed Survey - Overview
Study Objectives: To determine the incidence of drivers of all vehicle types driving on Irish roads while speeding, and therefore presenting a road safety risk. Speed surveys are designed to monitor changes in the free speeds of vehicles in both urban and rural areas and to measure drivers’ choice of speed. Free speeds is defined as the speed at which drivers choose to travel when unconstrained by road geometry (e.g. sharp bends, intersections or hills), weather conditions (e.g. rain) or traffic conditions (e.g. congestion). Methodology: In November 2014, Nationwide Data Collection conducted an observational study of over 16,500 vehicles on behalf of the Road Safety Authority. The surveys took place at the roadside at 91 sites: 39 urban (60km/h or less speed limit) and 52 rural (80km/h or more speed limit) and cars (12,241), rigid goods vehicles (2,430), semi-articulated vehicles (1,327) and single decker buses (404) were observed. A further 216 vehicles were surveyed at a site with long term road works and a temporary speed limit. Surveys were carried out at the designated locations during working hours (8.30am to 5.30pm), Monday to Friday. Only speeds of vehicles that were unconstrained - speeds derived from vehicles with a headway / gap of at least 200 metres on roads where it was possible to exceed the speed limit - were recorded. The target sample size for surveys on urban national roads was: 140 cars, 90 rigid vehicles and 30 articulated vehicles; no quotas were allocated for buses surveyed. The target sample size for urban residential and urban arterial roads was 140 cars (no buses, rigid or articulated vehicles were surveyed for these roads).
Key Findings:
The percentage of car drivers breaking the speed limit on urban roads was 60%; when
residential roads are excluded, this rises to 73% for all other urban national roads
The percentage of car drivers breaking the speed limit on rural roads was 24%
Trucks and buses were more likely to exceed the speed limit on rural roads than cars
The percentage of cars speeding on motorways increased from 21% in 2013 to 28% in
2014
The percentage of cars speeding on dual carriageways increased from 28% in 2013 to
36% in 2014
The percentage of cars speeding on regional 80km/h roads increased from 36% in 2013
to 45% in 2014
There was a 15% reduction in the percentage of car drivers speeding on urban national
60km/h roads but a 2% increase on urban arterial 60km/h roads
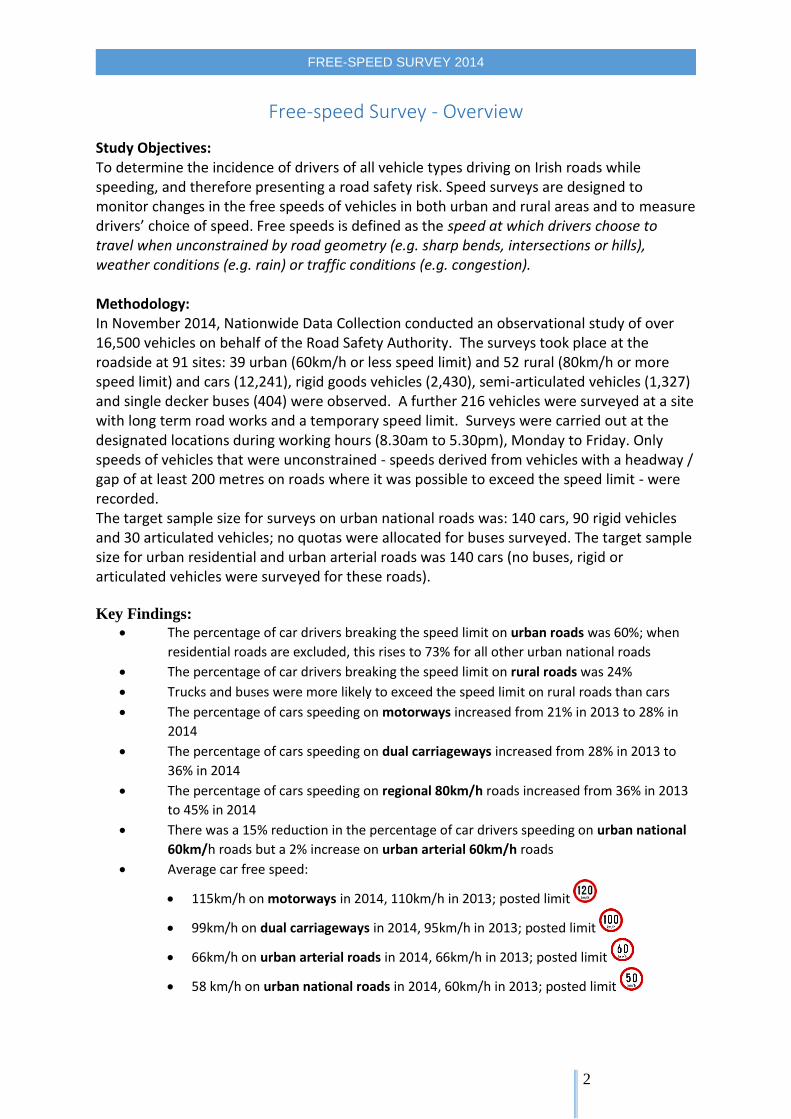
Average car free speed:
115km/h on motorways in 2014, 110km/h in 2013; posted limit
99km/h on dual carriageways in 2014, 95km/h in 2013; posted limit
66km/h on urban arterial roads in 2014, 66km/h in 2013; posted limit
58 km/h on urban national roads in 2014, 60km/h in 2013; posted limit
3
FREE-SPEED SURVEY 2014
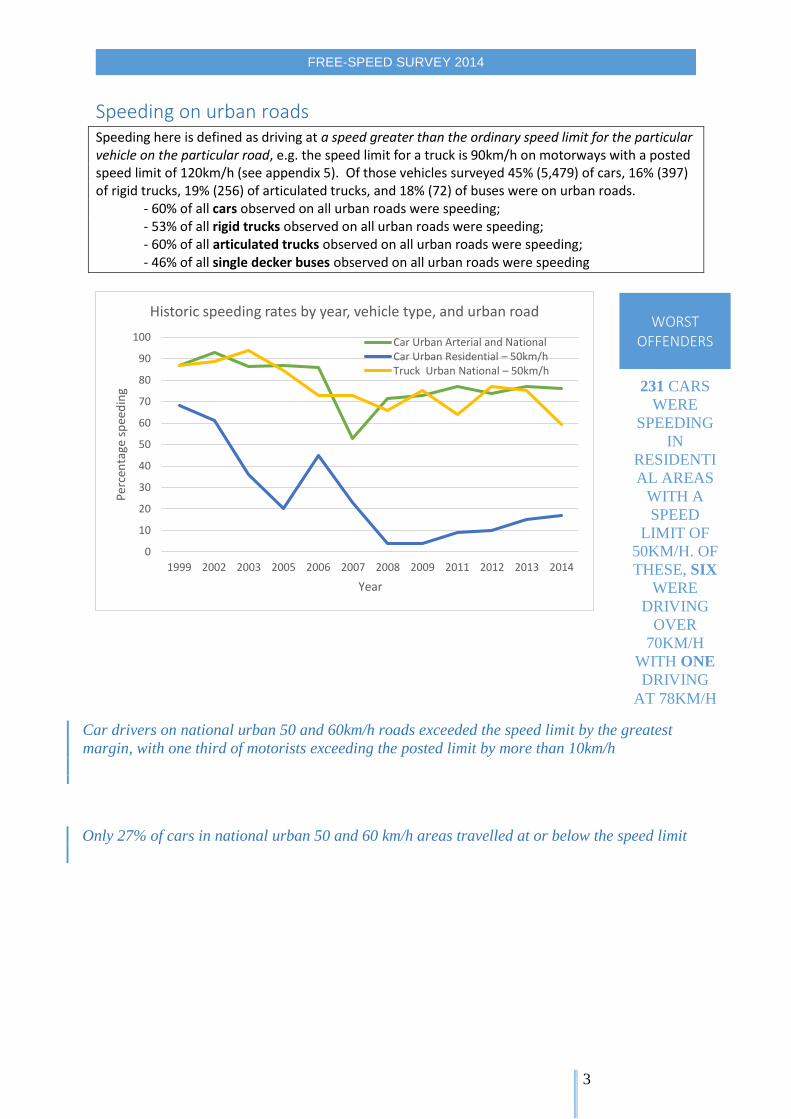
Speeding on urban roads Speeding here is defined as driving at a speed greater than the ordinary speed limit for the particular vehicle on the particular road, e.g. the speed limit for a truck is 90km/h on motorways with a posted speed limit of 120km/h (see appendix 5). Of those vehicles surveyed 45% (5,479) of cars, 16% (397) of rigid trucks, 19% (256) of articulated trucks, and 18% (72) of buses were on urban roads.
- 60% of all cars observed on all urban roads were speeding; - 53% of all rigid trucks observed on all urban roads were speeding; - 60% of all articulated trucks observed on all urban roads were speeding; - 46% of all single decker buses observed on all urban roads were speeding
0
10
20
30
40
50
60
70
80
90
100
1999 2002 2003 2005 2006 2007 2008 2009 2011 2012 2013 2014
Per
cen
tage
sp
eed
ing
Year
Historic speeding rates by year, vehicle type, and urban road
Car Urban Arterial and NationalCar Urban Residential – 50km/hTruck Urban National – 50km/h
WORST OFFENDERS
231 CARS
WERE
SPEEDING
IN
RESIDENTI
AL AREAS
WITH A
SPEED
LIMIT OF
50KM/H. OF
THESE, SIX
WERE
DRIVING
OVER
70KM/H
WITH ONE
DRIVING
AT 78KM/H
Only 27% of cars in national urban 50 and 60 km/h areas travelled at or below the speed limit
Only 27% of cars in national urban 50 and 60 km/h areas travelled at or below the speed limit
Car drivers on national urban 50 and 60km/h roads exceeded the speed limit by the greatest
margin, with one third of motorists exceeding the posted limit by more than 10km/h
4
FREE-SPEED SURVEY 2014
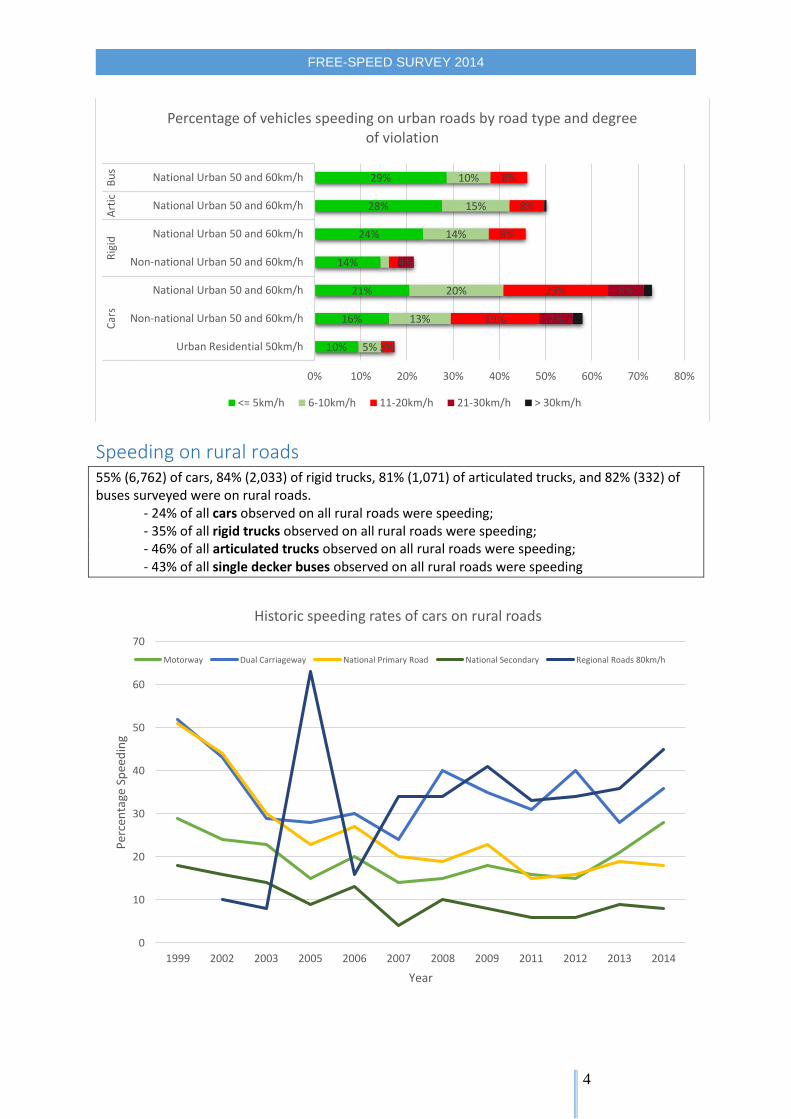
Speeding on rural roads 55% (6,762) of cars, 84% (2,033) of rigid trucks, 81% (1,071) of articulated trucks, and 82% (332) of buses surveyed were on rural roads.
- 24% of all cars observed on all rural roads were speeding; - 35% of all rigid trucks observed on all rural roads were speeding; - 46% of all articulated trucks observed on all rural roads were speeding; - 43% of all single decker buses observed on all rural roads were speeding
10%
16%
21%
14%
24%
28%
29%
5%
13%
20%
14%
15%
10%
3%
19%
23%
8%
8%
8%
7%
8%
4%
0% 10% 20% 30% 40% 50% 60% 70% 80%
Urban Residential 50km/h
Non-national Urban 50 and 60km/h
National Urban 50 and 60km/h
Non-national Urban 50 and 60km/h
National Urban 50 and 60km/h
National Urban 50 and 60km/h
National Urban 50 and 60km/h
Car
sR
igid
Art
icB
us
Percentage of vehicles speeding on urban roads by road type and degree of violation
<= 5km/h 6-10km/h 11-20km/h 21-30km/h > 30km/h
0
10
20
30
40
50
60
70
1999 2002 2003 2005 2006 2007 2008 2009 2011 2012 2013 2014
Per
cen
tage
Sp
eed
ing
Year
Historic speeding rates of cars on rural roads
Motorway Dual Carriageway National Primary Road National Secondary Regional Roads 80km/h
5
FREE-SPEED SURVEY 2014
13%
12%
8%
4%
13%
7%
10%
5%
2%
8%
5%
11%
4%
8%
2%
3%
3%
0% 5% 10% 15% 20% 25% 30% 35% 40%
Motorway
Dual Carriageway
National Primary100km/h
National Secondary 100km/h
Non-national Rural 80km/h
Car
s
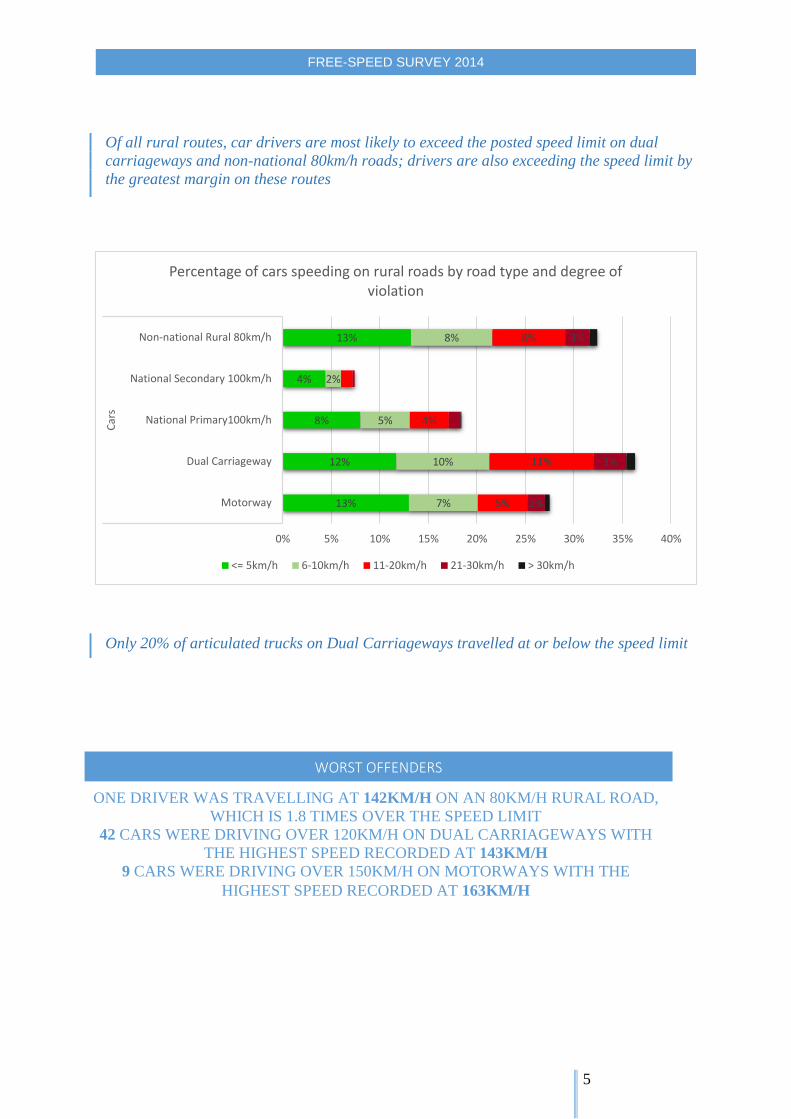
Percentage of cars speeding on rural roads by road type and degree of violation
<= 5km/h 6-10km/h 11-20km/h 21-30km/h > 30km/h
WORST OFFENDERS
ONE DRIVER WAS TRAVELLING AT 142KM/H ON AN 80KM/H RURAL ROAD,
WHICH IS 1.8 TIMES OVER THE SPEED LIMIT
42 CARS WERE DRIVING OVER 120KM/H ON DUAL CARRIAGEWAYS WITH
THE HIGHEST SPEED RECORDED AT 143KM/H
9 CARS WERE DRIVING OVER 150KM/H ON MOTORWAYS WITH THE
HIGHEST SPEED RECORDED AT 163KM/H
Only 20% of articulated trucks on Dual Carriageways travelled at or below the speed limit
Of all rural routes, car drivers are most likely to exceed the posted speed limit on dual
carriageways and non-national 80km/h roads; drivers are also exceeding the speed limit by
the greatest margin on these routes
6
FREE-SPEED SURVEY 2014
3%
31%
37%
27%
9%
8%
36%
38%
35%
17%
26%
23%
6%
37%
32%
9%
30%
8%
40%
0% 10% 20% 30% 40% 50% 60% 70% 80% 90% 100%
Motorway
Dual Carriageway
National Primary100km/h
National Secondary 100km/h
Non-national Rural 80km/h
Motorway
Dual Carriageway
National Primary100km/h
National Secondary 100km/h
Dual Carriageway
Rig
idA
rtic
Bu
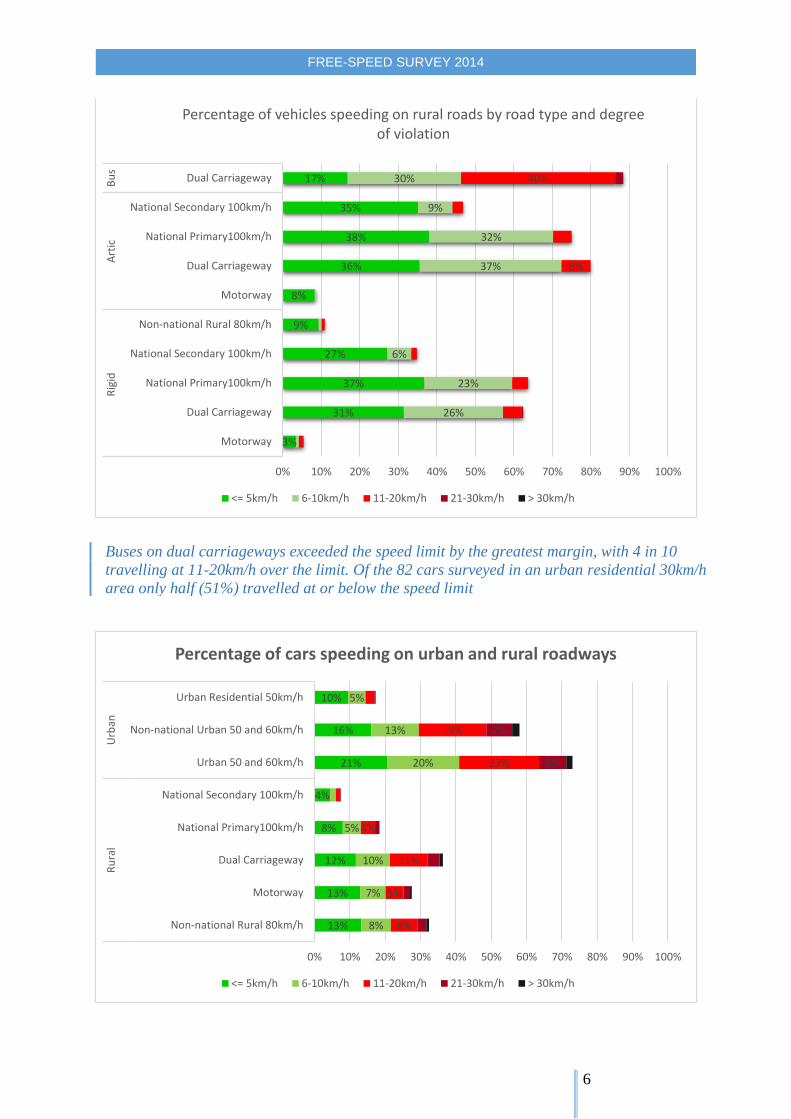
sPercentage of vehicles speeding on rural roads by road type and degree
of violation
<= 5km/h 6-10km/h 11-20km/h 21-30km/h > 30km/h
13%
13%
12%
8%
4%
21%
16%
10%
8%
7%
10%
5%
20%
13%
5%
8%
5%
11%
4%
23%
19%
8%
7%
0% 10% 20% 30% 40% 50% 60% 70% 80% 90% 100%
Non-national Rural 80km/h
Motorway
Dual Carriageway
National Primary100km/h
National Secondary 100km/h
Urban 50 and 60km/h
Non-national Urban 50 and 60km/h
Urban Residential 50km/h
Ru
ral
Urb
an
Percentage of cars speeding on urban and rural roadways
<= 5km/h 6-10km/h 11-20km/h 21-30km/h > 30km/h
Buses on dual carriageways exceeded the speed limit by the greatest margin, with 4 in 10
travelling at 11-20km/h over the limit. Of the 82 cars surveyed in an urban residential 30km/h
area only half (51%) travelled at or below the speed limit
7
FREE-SPEED SURVEY 2014
Who’s up and who’s down: Speeding by cars
Historic speeding rates for vehicles and road types can be found in the tables in appendix 2 and 3. In particular speeding by cars on urban roads has increased by 2% on each of urban arterial (50 and 60km/h) and urban residential (50 km/h) roads between 2013 and 2014. There was also a 7% increase on local 50km/h roads and an increase of 15% on local 60km/h roads. Over the same period speeding has decreased on national urban 50km/h roads by 6% and on national urban 60km/h roads by 15%, and regional 50 km/h roads by 7%. Rural motorway, dual carriageway, and regional 80km/h roads had an increase in speeding of 7%, 8%, and 9% respectively, between 2013 and 2014. There was a decrease in rural primary and secondary road speeding by cars of 1% on each road type.
ROADWORKS
ONE SITE SURVEYED WAS IN AN AREA WITH LONG TERM ROAD WORKS
AND A TEMPORARY SPEED LIMIT OF 60KM/H. OF THE 216 VEHICLES
SURVEYED PASSING THIS SITE, 98% WERE TRAVELLING ABOVE THE
TEMPORARY SPEED LIMIT. THIS SITE WAS NOT INCLUDED IN THE
OVERALL ANALYSIS.
8
FREE-SPEED SURVEY 2014
Summary & Recommendations The Government Road Safety Strategy 2013 – 2020 sets ambitious targets for speed compliance: ‘A target of 100% compliance has been set and whilst it is acknowledged it may be difficult to achieve, it is a necessary requirement to support the primary targets of fatality and serious injury reduction in this Strategy’. Based on the results from the 2014 Free-Speed survey, speeding is an issue on all road types, in all speed limit areas, and across all vehicle types. However, there are certain areas that are a particular cause for concern. That is
Car drivers in urban 50km/h and 60km/h areas and
Larger vehicles (trucks and buses) on rural 100km/h roads
In the event of a collision in these situations, it is other road users (pedestrians, cyclists, motorcyclists, and other drivers) who are at greatest risk of injury or death. There is a need for continued education of drivers and future drivers about the dangers of speeding
in general. While education is one aspect of the drive to reduce speeding to appropriate levels, enforcement continues to play a vital role through the use of the safety camera system.
Within the Road Safety Strategy 2013 – 2020 there are a number of actions that pertain to the improvement of speed compliance in Ireland, and work is underway in these areas: Actions 1&4: These relate to the implementation of public
education/awareness campaigns which target the main
causal factors for collisions, including speeding, and the
improvement of road users’ understanding of how and why
speed limits are set (RSA).
Action 90/ Action 16 of the Speed Limit Review Report: This
relates to researching Intelligent Speed Adaption systems,
based on trials and pilot studies (DTTAS/RSA)
Action 72: This relates to the continuation of the outsourcing
of the operation of safety cameras (An Garda Síochána)
Action 91: Relates to legislating for, subject to legal advice, and implement the use of average speed cameras at appropriate locations (DTTAS) Action 114: Relates to the conduct of annual surveys of drivers free speed (RSA)
In relation to Actions 1&4, communications campaign development should take into account the following:
Speeding in urban areas places vulnerable road users at greater risk of injury or death;
Speeding in rural areas puts everyone involved in the collision at greater risk of injury or
death because of the higher speeds experienced.
9
FREE-SPEED SURVEY 2014
The European Transport Safety Council (ETSC) has also made a number of recommendations to Member States about speed management, many of which are integrated into the current Road Safety Strategy. These include:
Enforcement: safety cameras should be introduced, and time-over-distance cameras should
be considered
Penalty points for speeding should be implemented, and there should be increases in points
in line with the degree of speed violation
Intelligent Speed Adaption: member states are encouraged to roll out ISA nationally, and
develop digital maps of speed limits
30km/h limits in residential areas should be introduced, also in areas with a high volume of
vulnerable road users
There should be a maximum 50km/h speed limit in urban areas
Note that the Department of Transport, Tourism and Sport, in conjunction with Local Authorities, are pursuing piloting 30km/h speed limits in certain residential areas for 2014/2015.
10
FREE-SPEED SURVEY 2014
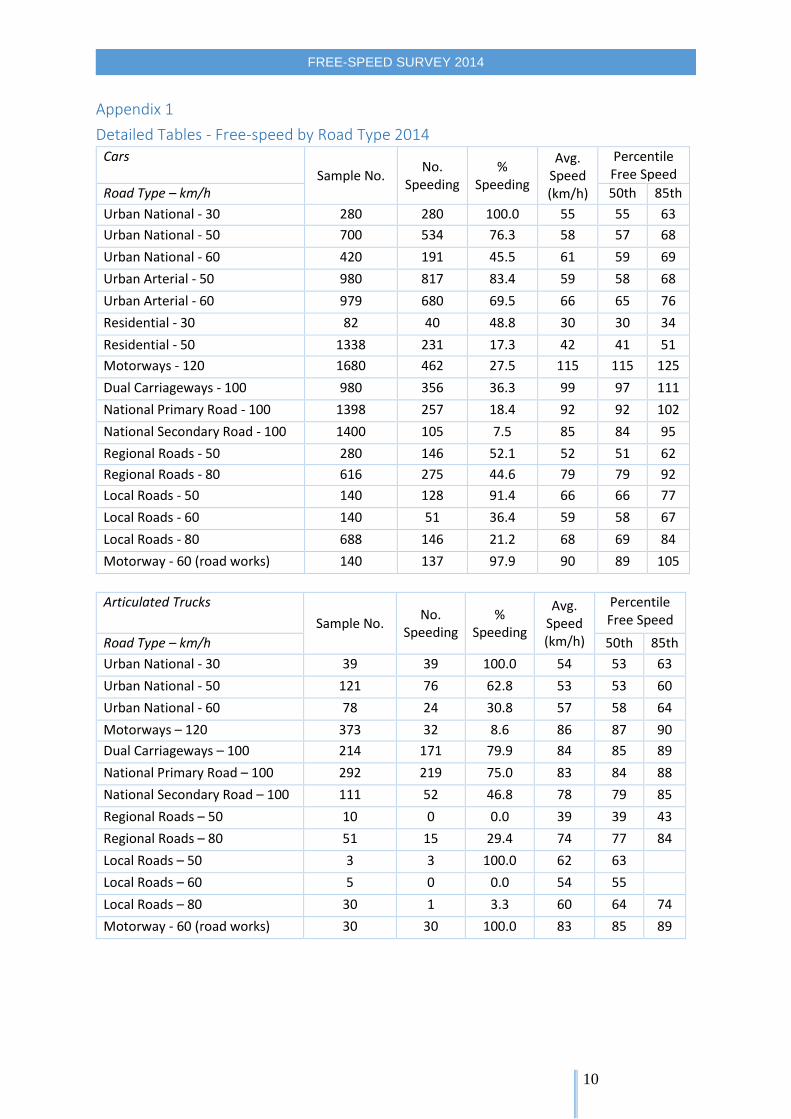
Appendix 1
Detailed Tables - Free-speed by Road Type 2014 Cars
Sample No. No.
Speeding %
Speeding
Avg. Speed (km/h)
Percentile Free Speed
Road Type – km/h 50th 85th
Urban National - 30 280 280 100.0 55 55 63
Urban National - 50 700 534 76.3 58 57 68
Urban National - 60 420 191 45.5 61 59 69
Urban Arterial - 50 980 817 83.4 59 58 68
Urban Arterial - 60 979 680 69.5 66 65 76
Residential - 30 82 40 48.8 30 30 34
Residential - 50 1338 231 17.3 42 41 51
Motorways - 120 1680 462 27.5 115 115 125
Dual Carriageways - 100 980 356 36.3 99 97 111
National Primary Road - 100 1398 257 18.4 92 92 102
National Secondary Road - 100 1400 105 7.5 85 84 95
Regional Roads - 50 280 146 52.1 52 51 62
Regional Roads - 80 616 275 44.6 79 79 92
Local Roads - 50 140 128 91.4 66 66 77
Local Roads - 60 140 51 36.4 59 58 67
Local Roads - 80 688 146 21.2 68 69 84
Motorway - 60 (road works) 140 137 97.9 90 89 105
Articulated Trucks
Sample No. No.
Speeding %
Speeding
Avg. Speed (km/h)
Percentile Free Speed
Road Type – km/h 50th 85th
Urban National - 30 39 39 100.0 54 53 63
Urban National - 50 121 76 62.8 53 53 60
Urban National - 60 78 24 30.8 57 58 64
Motorways – 120 373 32 8.6 86 87 90
Dual Carriageways – 100 214 171 79.9 84 85 89
National Primary Road – 100 292 219 75.0 83 84 88
National Secondary Road – 100 111 52 46.8 78 79 85
Regional Roads – 50 10 0 0.0 39 39 43
Regional Roads – 80 51 15 29.4 74 77 84
Local Roads – 50 3 3 100.0 62 63
Local Roads – 60 5 0 0.0 54 55
Local Roads – 80 30 1 3.3 60 64 74
Motorway - 60 (road works) 30 30 100.0 83 85 89
11
FREE-SPEED SURVEY 2014
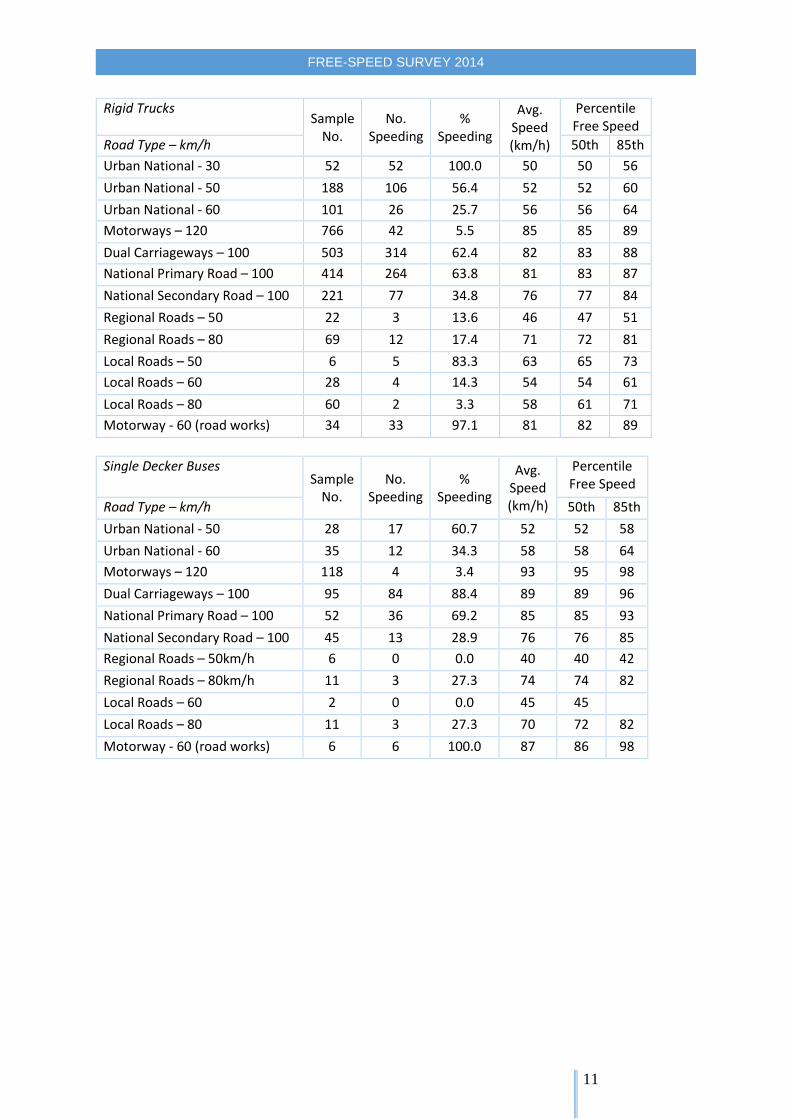
Rigid Trucks Sample
No. No.
Speeding %
Speeding
Avg. Speed (km/h)
Percentile Free Speed
Road Type – km/h 50th 85th
Urban National - 30 52 52 100.0 50 50 56
Urban National - 50 188 106 56.4 52 52 60
Urban National - 60 101 26 25.7 56 56 64
Motorways – 120 766 42 5.5 85 85 89
Dual Carriageways – 100 503 314 62.4 82 83 88
National Primary Road – 100 414 264 63.8 81 83 87
National Secondary Road – 100 221 77 34.8 76 77 84
Regional Roads – 50 22 3 13.6 46 47 51
Regional Roads – 80 69 12 17.4 71 72 81
Local Roads – 50 6 5 83.3 63 65 73
Local Roads – 60 28 4 14.3 54 54 61
Local Roads – 80 60 2 3.3 58 61 71
Motorway - 60 (road works) 34 33 97.1 81 82 89
Single Decker Buses Sample
No. No.
Speeding %
Speeding
Avg. Speed (km/h)
Percentile Free Speed
Road Type – km/h 50th 85th
Urban National - 50 28 17 60.7 52 52 58
Urban National - 60 35 12 34.3 58 58 64
Motorways – 120 118 4 3.4 93 95 98
Dual Carriageways – 100 95 84 88.4 89 89 96
National Primary Road – 100 52 36 69.2 85 85 93
National Secondary Road – 100 45 13 28.9 76 76 85
Regional Roads – 50km/h 6 0 0.0 40 40 42
Regional Roads – 80km/h 11 3 27.3 74 74 82
Local Roads – 60 2 0 0.0 45 45
Local Roads – 80 11 3 27.3 70 72 82
Motorway - 60 (road works) 6 6 100.0 87 86 98

12
FREE-SPEED SURVEY 2014
Appendix 2
Percentage speeding (Urban) 1999 to 2014 Vehicle Class
1999 2002 2003 2005 2006 2007 2008 2009 2011 2012 2013 2014
Urban Arterial – 50 km/h
Car 99 99 86 91 86 40 70 68 77 74 81 83
Articulated - - - - - - - - - - - -
Rigid - - - - - - - - - - - -
S.D. Buses - - - - - - - - - - - -
Motor Cycle
- - - - - - - - - - - -
Urban Arterial – 60 km/h
Vehicle Class
1999 2002 2003 2005 2006 2007 2008 2009 2011 2012 2013 2014
Car 67 82 75 80 89 32 67 67 72 62 68 70
Articulated - - - - - - - - - - - -
Rigid - - - - - - - - - - - -
S.D. Buses - - - - - - - - - - - -
Motor Cycle
- - - - - - - - - - - -
Urban National – 50 km/h
Vehicle Class
1999 2002 2003 2005 2006 2007 2008 2009 2011 2012 2013 2014
Car 94 97 98 89 82 86 78 83 82 85 82 76
Articulated 89 92 92 89 69 74 68 77 64 78 77 63
Rigid 85 85 96 80 77 72 64 73 64 76 73 56
S.D. Buses - - - 79 74 80 - - - 89 77 61*
Motor Cycle
- - - - 88 - - - - - 100 75*
Urban National – 60 km/h
Vehicle Class
1999 2002 2003 2005 2006 2007 2008 2009 2011 2012 2013 2014
Car - - - - - - - - - - 61 46
Articulated - - - - - - - - - - 29 31*
Rigid - - - - - - - - - - 32 26
S.D. Buses - - - - - - - - - - 22 34*
Motor Cycle
- - - - - - - - - - - -
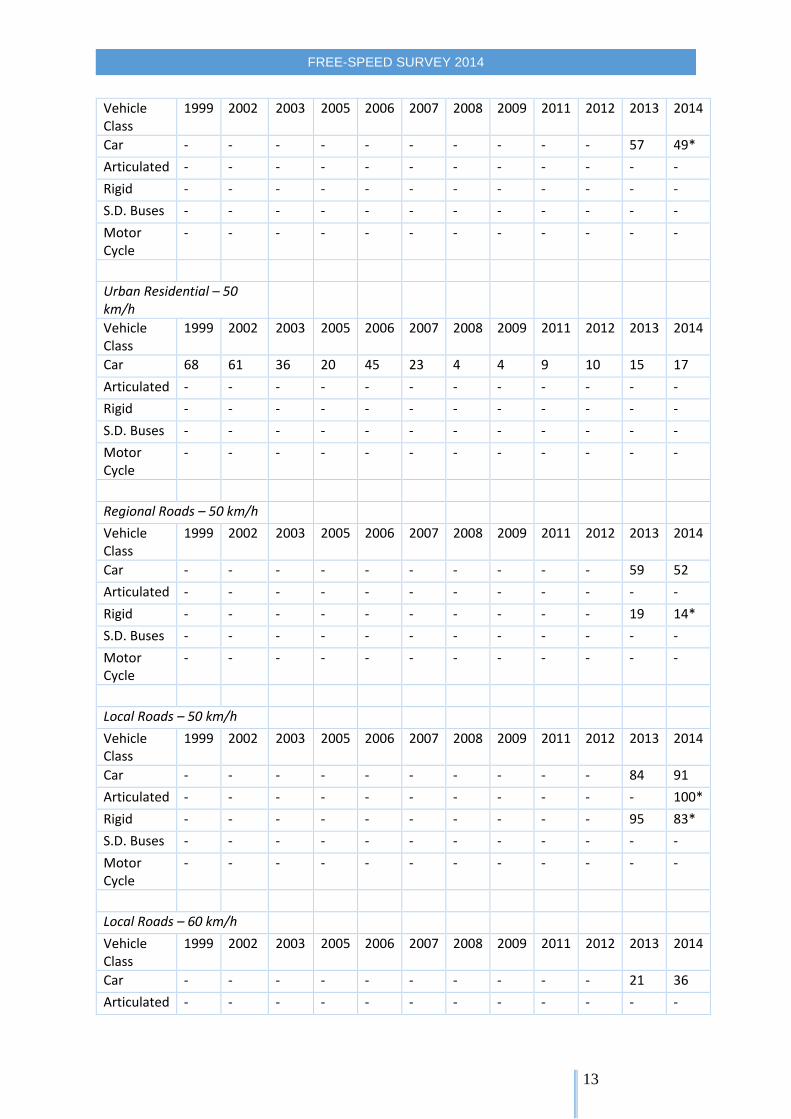
Urban Residential – 30 km/h
13
FREE-SPEED SURVEY 2014
Vehicle Class
1999 2002 2003 2005 2006 2007 2008 2009 2011 2012 2013 2014
Car - - - - - - - - - - 57 49*
Articulated - - - - - - - - - - - -
Rigid - - - - - - - - - - - -
S.D. Buses - - - - - - - - - - - -
Motor Cycle
- - - - - - - - - - - -
Urban Residential – 50 km/h
Vehicle Class
1999 2002 2003 2005 2006 2007 2008 2009 2011 2012 2013 2014
Car 68 61 36 20 45 23 4 4 9 10 15 17
Articulated - - - - - - - - - - - -
Rigid - - - - - - - - - - - -
S.D. Buses - - - - - - - - - - - -
Motor Cycle
- - - - - - - - - - - -
Regional Roads – 50 km/h
Vehicle Class
1999 2002 2003 2005 2006 2007 2008 2009 2011 2012 2013 2014
Car - - - - - - - - - - 59 52
Articulated - - - - - - - - - - - -
Rigid - - - - - - - - - - 19 14*
S.D. Buses - - - - - - - - - - - -
Motor Cycle
- - - - - - - - - - - -
Local Roads – 50 km/h
Vehicle Class
1999 2002 2003 2005 2006 2007 2008 2009 2011 2012 2013 2014
Car - - - - - - - - - - 84 91
Articulated - - - - - - - - - - - 100*
Rigid - - - - - - - - - - 95 83*
S.D. Buses - - - - - - - - - - - -
Motor Cycle
- - - - - - - - - - - -
Local Roads – 60 km/h
Vehicle Class
1999 2002 2003 2005 2006 2007 2008 2009 2011 2012 2013 2014
Car - - - - - - - - - - 21 36
Articulated - - - - - - - - - - - -

14
FREE-SPEED SURVEY 2014
Rigid - - - - - - - - - - 0 14*
S.D. Buses - - - - - - - - - - - -
Motor Cycle
- - - - - - - - - - - -
*Small sample size; S.D. Buses = Single Decker Buses
15
FREE-SPEED SURVEY 2014
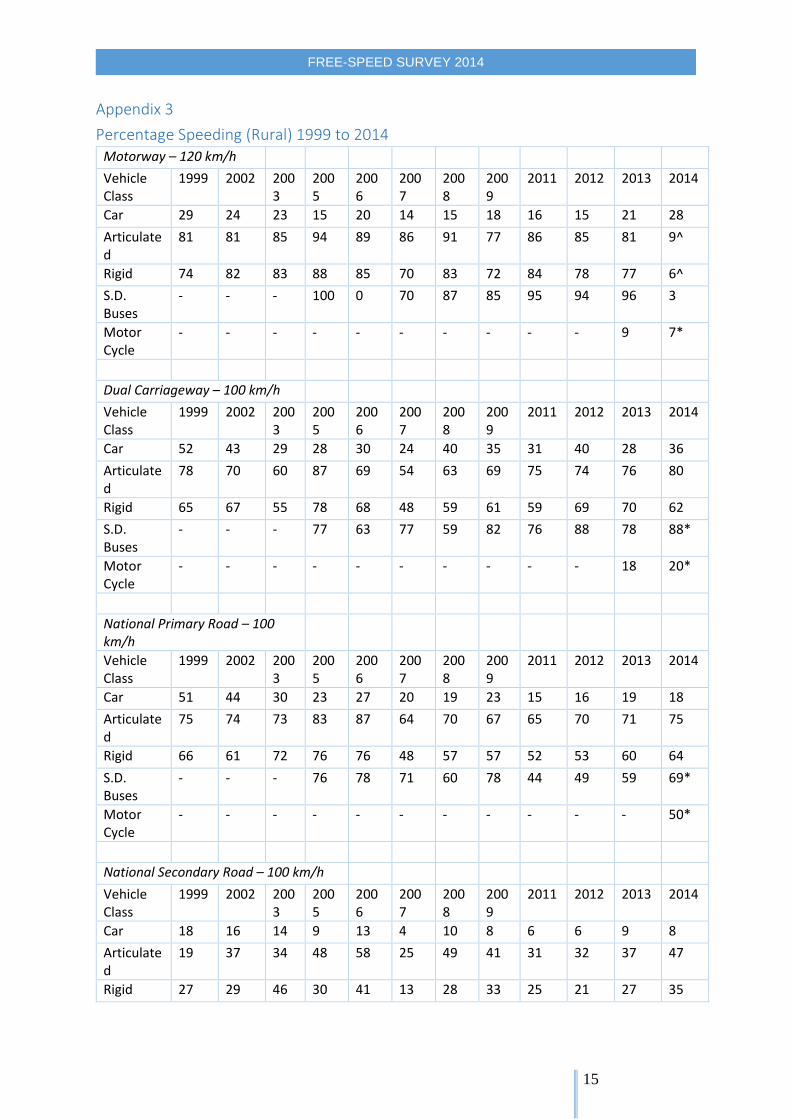
Appendix 3
Percentage Speeding (Rural) 1999 to 2014 Motorway – 120 km/h
Vehicle Class
1999 2002 2003
2005
2006
2007
2008
2009
2011 2012 2013 2014
Car 29 24 23 15 20 14 15 18 16 15 21 28
Articulated
81 81 85 94 89 86 91 77 86 85 81 9^
Rigid 74 82 83 88 85 70 83 72 84 78 77 6^
S.D. Buses
- - - 100 0 70 87 85 95 94 96 3
Motor Cycle
- - - - - - - - - - 9 7*
Dual Carriageway – 100 km/h
Vehicle Class
1999 2002 2003
2005
2006
2007
2008
2009
2011 2012 2013 2014
Car 52 43 29 28 30 24 40 35 31 40 28 36
Articulated
78 70 60 87 69 54 63 69 75 74 76 80
Rigid 65 67 55 78 68 48 59 61 59 69 70 62
S.D. Buses
- - - 77 63 77 59 82 76 88 78 88*
Motor Cycle
- - - - - - - - - - 18 20*
National Primary Road – 100 km/h
Vehicle Class
1999 2002 2003
2005
2006
2007
2008
2009
2011 2012 2013 2014
Car 51 44 30 23 27 20 19 23 15 16 19 18
Articulated
75 74 73 83 87 64 70 67 65 70 71 75
Rigid 66 61 72 76 76 48 57 57 52 53 60 64
S.D. Buses
- - - 76 78 71 60 78 44 49 59 69*
Motor Cycle
- - - - - - - - - - - 50*
National Secondary Road – 100 km/h
Vehicle Class
1999 2002 2003
2005
2006
2007
2008
2009
2011 2012 2013 2014
Car 18 16 14 9 13 4 10 8 6 6 9 8
Articulated
19 37 34 48 58 25 49 41 31 32 37 47
Rigid 27 29 46 30 41 13 28 33 25 21 27 35
16
FREE-SPEED SURVEY 2014
S.D. Buses
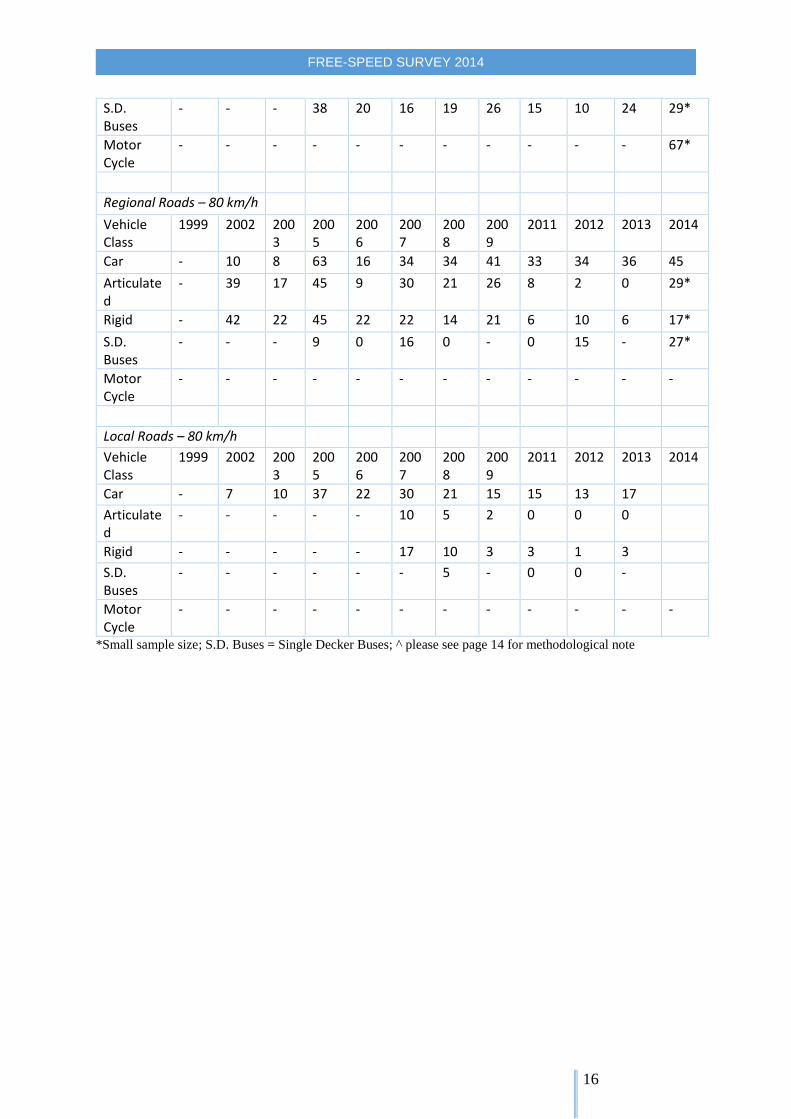
- - - 38 20 16 19 26 15 10 24 29*
Motor Cycle
- - - - - - - - - - - 67*
Regional Roads – 80 km/h
Vehicle Class
1999 2002 2003
2005
2006
2007
2008
2009
2011 2012 2013 2014
Car - 10 8 63 16 34 34 41 33 34 36 45
Articulated
- 39 17 45 9 30 21 26 8 2 0 29*
Rigid - 42 22 45 22 22 14 21 6 10 6 17*
S.D. Buses
- - - 9 0 16 0 - 0 15 - 27*
Motor Cycle
- - - - - - - - - - - -
Local Roads – 80 km/h
Vehicle Class
1999 2002 2003
2005
2006
2007
2008
2009
2011 2012 2013 2014
Car - 7 10 37 22 30 21 15 15 13 17
Articulated
- - - - - 10 5 2 0 0 0
Rigid - - - - - 17 10 3 3 1 3
S.D. Buses
- - - - - - 5 - 0 0 -
Motor Cycle
- - - - - - - - - - - -
*Small sample size; S.D. Buses = Single Decker Buses; ^ please see page 14 for methodological note
17
FREE-SPEED SURVEY 2014
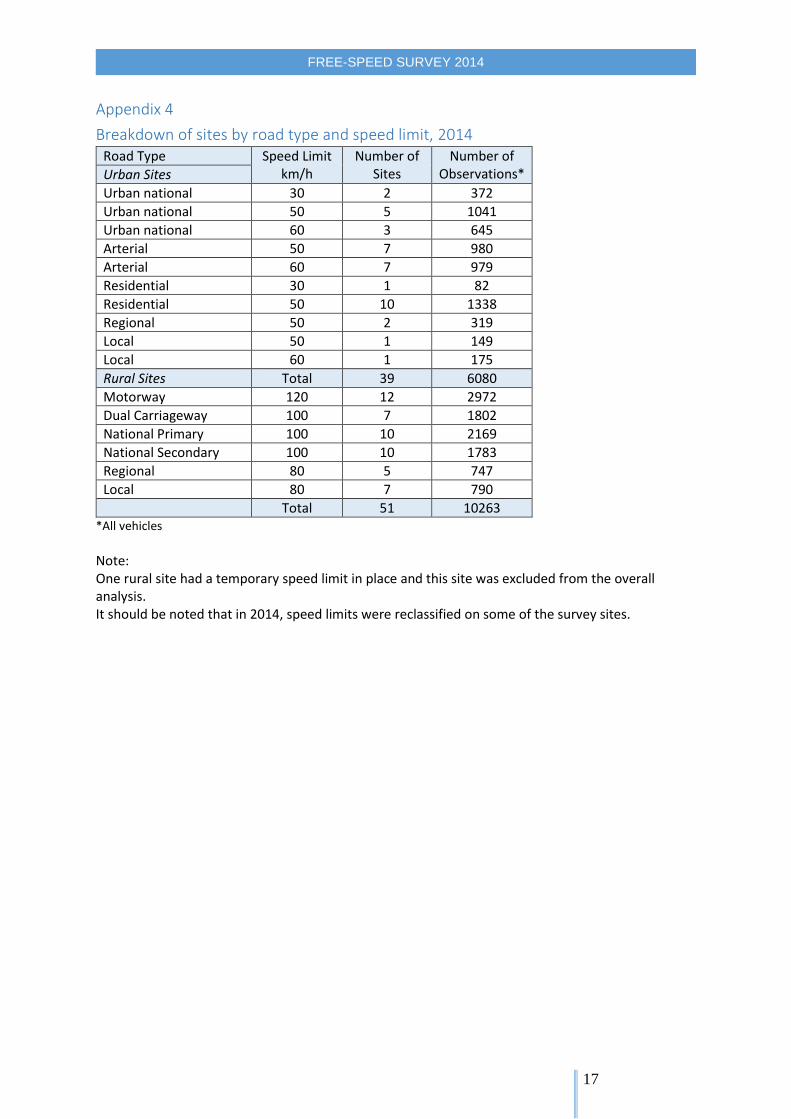
Appendix 4
Breakdown of sites by road type and speed limit, 2014 Road Type Speed Limit
km/h Number of
Sites Number of
Observations* Urban Sites
Urban national 30 2 372
Urban national 50 5 1041
Urban national 60 3 645
Arterial 50 7 980
Arterial 60 7 979
Residential 30 1 82
Residential 50 10 1338
Regional 50 2 319
Local 50 1 149
Local 60 1 175
Rural Sites Total 39 6080
Motorway 120 12 2972
Dual Carriageway 100 7 1802
National Primary 100 10 2169
National Secondary 100 10 1783
Regional 80 5 747
Local 80 7 790
Total 51 10263 *All vehicles
Note: One rural site had a temporary speed limit in place and this site was excluded from the overall analysis. It should be noted that in 2014, speed limits were reclassified on some of the survey sites.
18
FREE-SPEED SURVEY 2014
Appendix 5
Survey Details The same sites were chosen as in previous surveys, where the sites were chosen according to the following criteria: • Long, straight sections of roadway;
• Carriageway of at least seven metres (except for urban residential);
• Sites where speed is relatively unaffected by geometry, traffic, traffic lights, traffic calming
measures, junctions, road works or parking;
• Sites where it is feasible to drive faster than the speed limit.
Methodology Nationwide Data Collection (NDC) on behalf of the Road Safety Authority carried out national surveys in relation to traffic speeds in 2014. Survey results are used to monitor trends, determine the effectiveness of safety initiatives and to inform the on-going review of public policy in relation to road safety. The methodology developed for and used by the Road Safety Authority in all previous surveys is applied to this survey. Speed surveys are conducted annually at randomly selected sites on the Irish road network to provide an estimate of the speed at which drivers choose to travel. The target population is the entire Irish road network. There were 52 rural road sites and 39 urban road sites surveyed. On urban arterial roads, speeds were measured between 5.30am and 7.30am. However, in some locations in Dublin, few readings of vehicles were taken after 7.00am, as the traffic conditions could not be described as free-flowing. The speed measurements on residential roads were carried out in normal daylight hours (typically between 8.30am and 5.30pm). For national roads, the speeds of cars, rigid and articulated vehicles were recorded separately. All surveys were carried out in dry conditions. Speed was measured with calibrated radar meters. Surveyors were instructed to choose vehicles in a random manner to avoid bias. Where a cluster of vehicles arrived together, the speed of the first vehicle only was taken. Every effort was made for surveyors to be as inconspicuous as possible. Surveyors had set targets for vehicle classes. They were instructed to continue surveying until either
a. these targets were reached or
b. for a maximum of 2.5 hours, whichever occurred earlier
Due to low sample sizes, no figures are provided for double decker buses and caution should be taken in the interpretation of results provided for single decker buses, as they are based on very limited sample sizes.
19
FREE-SPEED SURVEY 2014
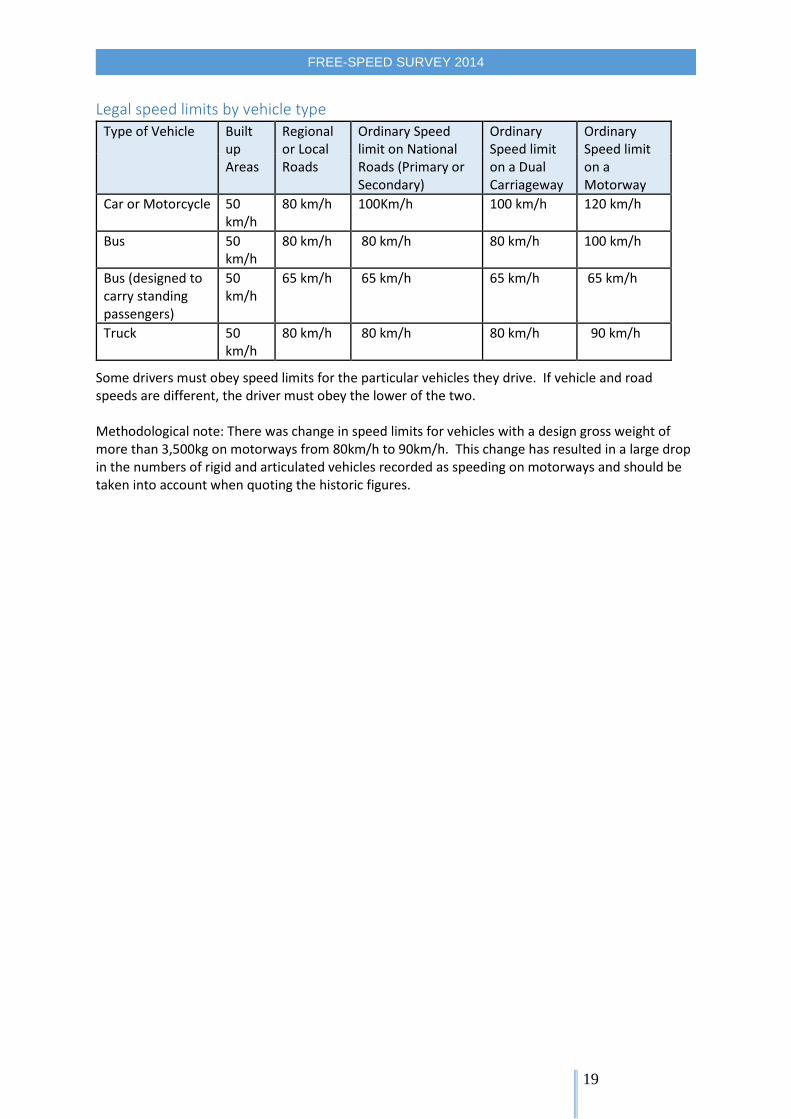
Legal speed limits by vehicle type
Some drivers must obey speed limits for the particular vehicles they drive. If vehicle and road speeds are different, the driver must obey the lower of the two. Methodological note: There was change in speed limits for vehicles with a design gross weight of more than 3,500kg on motorways from 80km/h to 90km/h. This change has resulted in a large drop in the numbers of rigid and articulated vehicles recorded as speeding on motorways and should be taken into account when quoting the historic figures.
Type of Vehicle Built up Areas
Regional or Local Roads
Ordinary Speed limit on National Roads (Primary or Secondary)
Ordinary Speed limit on a Dual Carriageway
Ordinary Speed limit on a Motorway
Car or Motorcycle 50 km/h
80 km/h 100Km/h 100 km/h 120 km/h
Bus 50 km/h
80 km/h 80 km/h 80 km/h 100 km/h
Bus (designed to carry standing passengers)
50 km/h
65 km/h 65 km/h 65 km/h 65 km/h
Truck 50 km/h
80 km/h 80 km/h 80 km/h 90 km/h