Embed Size (px)
Citation preview

Fresno County Employees’ Retirement Association
Global Government Bond Mandate
Scott Thiel, Deputy Chief Investment Officer of Fundamental Fixed Income
Jeremy Watt, Institutional Client Business
For use with institutional and professional investors only - proprietary and confidential

1. Introduction to BlackRock
2. BlackRock Fundamental Global Bond Strategy – Style/Process
3. BlackRock Fundamental Global Bond Strategy – Investment Team
4. Track Record and Positioning
Appendices
A. Sources of Alpha and Portfolio Guidelines
B. Sample Macro and Credit Research
C. Sample Risk Management Output
D. Market Outlook
E. Biographies of Team
F. Disclosures
Table of contents
2

1. Introduction to BlackRock
1970s • Pioneered index and quantitative investing
1980s• Created the First Term Trust (closed-end fund)
• Initiated fixed income and international indexing
1990s
• Created the industry’s first target date fund
• Introduced exchange-traded funds under World Equity Benchmark Shares (WEBS) brand (now iShares® ETFs)
2000s
• Launched BlackRock Solutions® for risk management and advisory services
• Enhanced capabilities by strengthening equities, and adding alternatives, real estate, passive, and scientific investments
• Launched Financial Markets Advisory business
2010s
• Engaged by US and European governments for critical risk assessments and banking sector stabilization strategies
• Launched BlackRock Investment Institute
• Introduced Global Capital Markets desk
• Launched first target maturity fixed income ETF
• Created an index to track sovereign credit risk (BlackRockSovereign Risk Index)
Firm culture and structure reinforce our client-centric approach
Independent asset manager focused only on clients
� Established in 1988 and public since 1999 (NYSE: BLK)
� Independent Board of Directors
� No proprietary trading
� Group dedicated to corporate governance
Deep understanding of regulatory requirements
� Manage portfolios for clients subject to varied and complex regulatory regimes
� Operate on behalf of investors under 50 regulatory authorities worldwide
� Significant experience managing portfolios for official institutions and governments
BlackRock Solutions® foundation for managing risk
� Deliberate, diversified and scaled risk enables us to invest with conviction in pursuit of alpha
� Internally developed risk tools and analysis offered directly to clients as a service
� Reinforces transparency and our responsibility to clients
Timeline includes history from predecessor entities
History of innovation and evolution to better serve investors
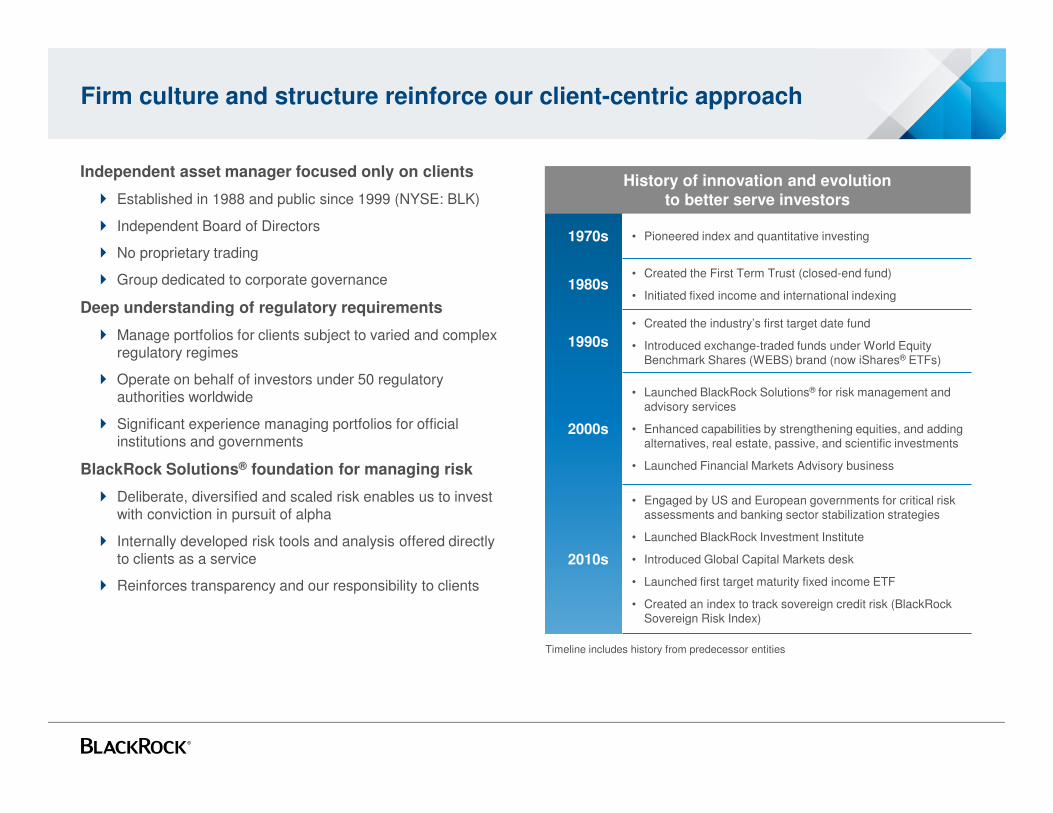
Depth of investment resources maximizes performance potential
Organization drives idea and analysis sharing
� 124 investment teams located in 17 countries connect through a common culture and operating platform*
� The BlackRock Investment Institute (BII), our internal investor forum, facilitates sharing and debates insights
� Daily global meeting for BlackRock’s 1,900+ investment professionals to discuss markets, portfolio positioning and ongoing trends
� Chief Investment Officers ensure rigorous, deliberate and repeatable investment processes
Investors potential benefit from scale of infrastructure
� Global trading function seeks to enable increased access to liquidity and produces trading efficiencies, improving execution
� Capital Markets Group leverages scale and breadth of platform to help maximize allocations and to seek alpha opportunities in primary markets
� Dedicated Risk & Quantitative Analysis (RQA) professionals partner with portfolio teams to monitor and analyze risk
� Proprietary Aladdin® platform integrates portfolio management, risk analytics, trading and operations
Built to generate alpha
Collective expertise
Global infrastructure
Trading Dedicated Capital Markets
Aladdin®
Risk & Quantitative
Analysis
Investment Research
DailyGlobal Meeting
BlackRock Investment
Institute
Chief Investment Officers
*Data as of 31 March 2014
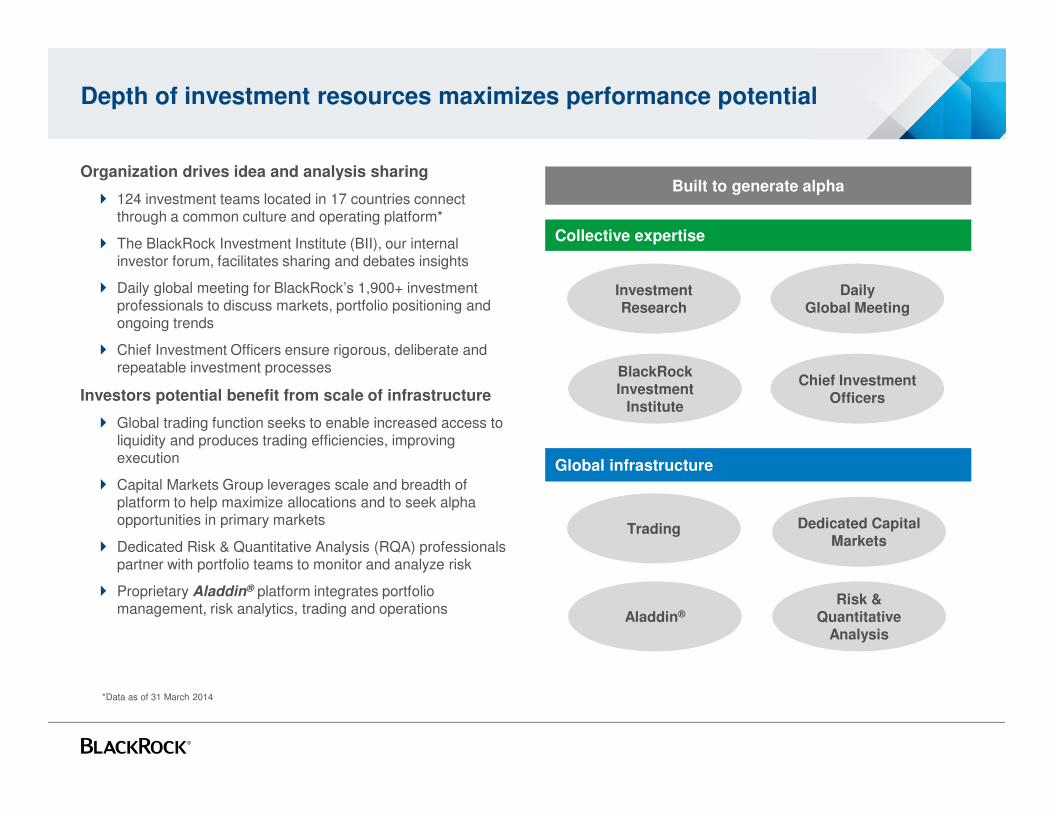
Positioned to address client needs
Breadth of capabilities enables outcome-based solutions tailored to individual client objectives
• Capabilities across investment styles: index, active fundamental, scientific and absolute return
• Global, regional and sector-specific investing
• Specialized capabilities across real estate, private equity, direct hedge funds, fund of hedge funds, infrastructure and renewable power
• Solutions-oriented approach extends to alternatives portfolio construction
• Manage strategies across benchmark types and styles: index, fundamental, model-based and absolute return
• Specialized experts covering all market sectors
• Recognized as ‘go to’ leader in credit and liquidity
• Flexible product range across multiple currencies
• Outcome focused: target-date, balanced risk factor, and liability-driven investing
• Asset-class agnostic perspective facilitates unbiased market views, advice, and portfolio solutions
$4.59 trillion in assets under management Scalable services and infrastructure
• Centralized platform analyzes risk across asset classes
• Leverage for risk management, investment decision support and performance analytics
• Partner with clients to help save costs and reduce risks when changing investment exposures
• Executed over 3,000 individual transitions with assets totaling $2.3 trillion over the past five years
• Advise public and private financial institutions on complex capital markets and balance sheet exposures
• Managed or advised on over $8 trillion in asset and derivative portfolios
• More than 50,000 trades per day across equity, fixed income, cash, currency and futures
• 24-hour global coverage across seven trading desks
• Focus on research, technology and coordination with portfolio management functions that seek to deliver above market returns
• Covers securities in over 30 markets globally
Equity
$2.5 trillion
Fixed Income
$1.3 trillion
Alternatives
$117 billion
Multi-asset
$374 billion
Cash
$268 billion
Risk Management
Advisory
Transition Management
Securities Lending
Trading
AUM As of 30 June 2014

2. BlackRock Fundamental Global Bond Strategy
Style / Process
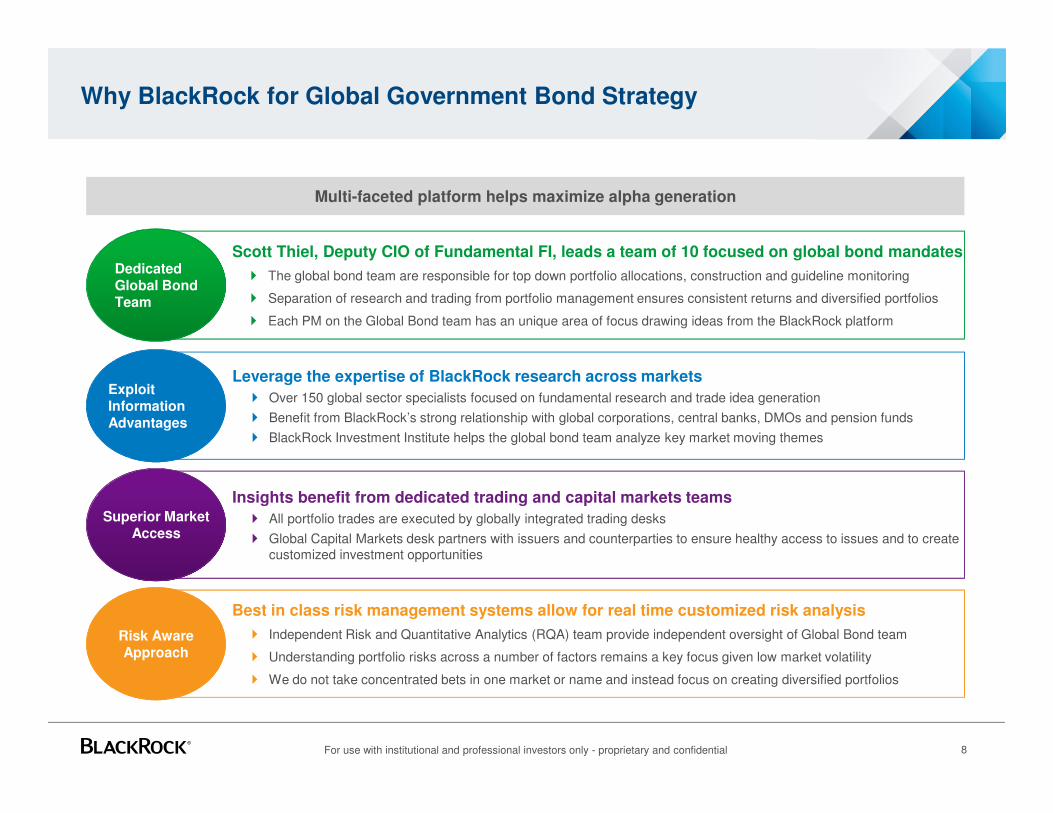
Why BlackRock for Global Government Bond Strategy
Scott Thiel, Deputy CIO of Fundamental FI, leads a team of 10 focused on global bond mandates
� The global bond team are responsible for top down portfolio allocations, construction and guideline monitoring
� Separation of research and trading from portfolio management ensures consistent returns and diversified portfolios
� Each PM on the Global Bond team has an unique area of focus drawing ideas from the BlackRock platform
Dedicated Global Bond Team
Insights benefit from dedicated trading and capital markets teams
� All portfolio trades are executed by globally integrated trading desks
� Global Capital Markets desk partners with issuers and counterparties to ensure healthy access to issues and to create customized investment opportunities
Multi-faceted platform helps maximize alpha generation
Best in class risk management systems allow for real time customized risk analysis
� Independent Risk and Quantitative Analytics (RQA) team provide independent oversight of Global Bond team
� Understanding portfolio risks across a number of factors remains a key focus given low market volatility
� We do not take concentrated bets in one market or name and instead focus on creating diversified portfolios
Risk Aware Approach
Leverage the expertise of BlackRock research across markets
� Over 150 global sector specialists focused on fundamental research and trade idea generation
� Benefit from BlackRock’s strong relationship with global corporations, central banks, DMOs and pension funds
� BlackRock Investment Institute helps the global bond team analyze key market moving themes
Exploit Information Advantages
Superior Market Access
8For use with institutional and professional investors only - proprietary and confidential
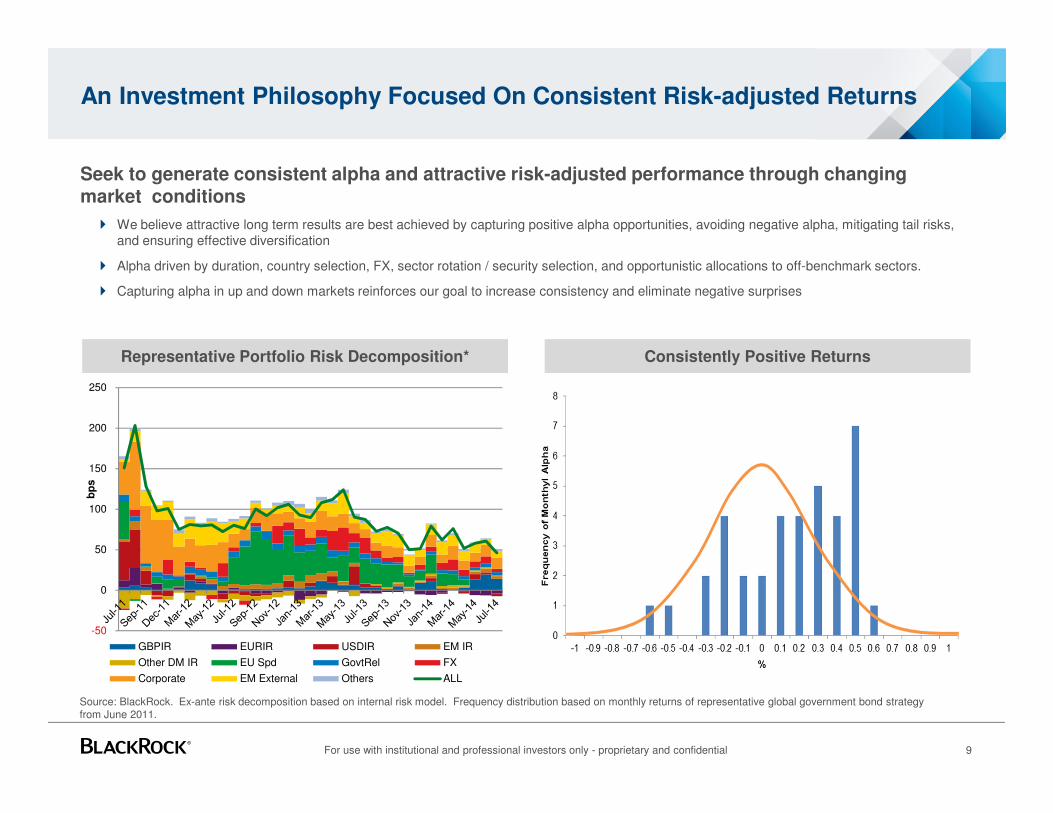
An Investment Philosophy Focused On Consistent Risk-adjusted Returns
Seek to generate consistent alpha and attractive risk-adjusted performance through changing market conditions
� We believe attractive long term results are best achieved by capturing positive alpha opportunities, avoiding negative alpha, mitigating tail risks, and ensuring effective diversification
� Alpha driven by duration, country selection, FX, sector rotation / security selection, and opportunistic allocations to off-benchmark sectors.
� Capturing alpha in up and down markets reinforces our goal to increase consistency and eliminate negative surprises
9
Representative Portfolio Risk Decomposition*
Source: BlackRock. Ex-ante risk decomposition based on internal risk model. Frequency distribution based on monthly returns of representative global government bond strategy from June 2011.
Consistently Positive Returns
For use with institutional and professional investors only - proprietary and confidential
-50
0
50
100
150
200
250
bp
s
GBPIR EURIR USDIR EM IR
Other DM IR EU Spd GovtRel FX
Corporate EM External Others ALL
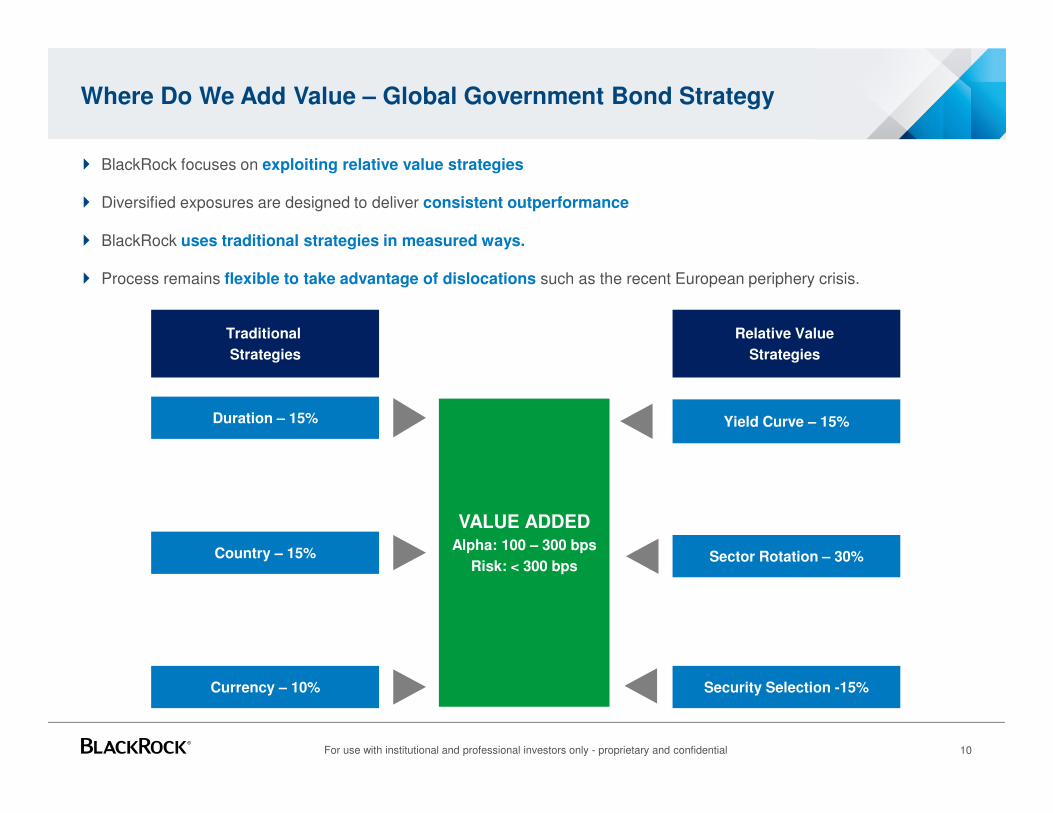
Where Do We Add Value – Global Government Bond Strategy
� BlackRock focuses on exploiting relative value strategies
� Diversified exposures are designed to deliver consistent outperformance
� BlackRock uses traditional strategies in measured ways.
� Process remains flexible to take advantage of dislocations such as the recent European periphery crisis.
VALUE ADDEDAlpha: 100 – 300 bps
Risk: < 300 bps
Yield Curve – 15%
Relative Value
Strategies
Traditional
Strategies
Country – 15%
Currency – 10%
Sector Rotation – 30%
Duration – 15%
Security Selection -15%
10For use with institutional and professional investors only - proprietary and confidential
11For use with institutional and professional investors only — proprietary and confidential
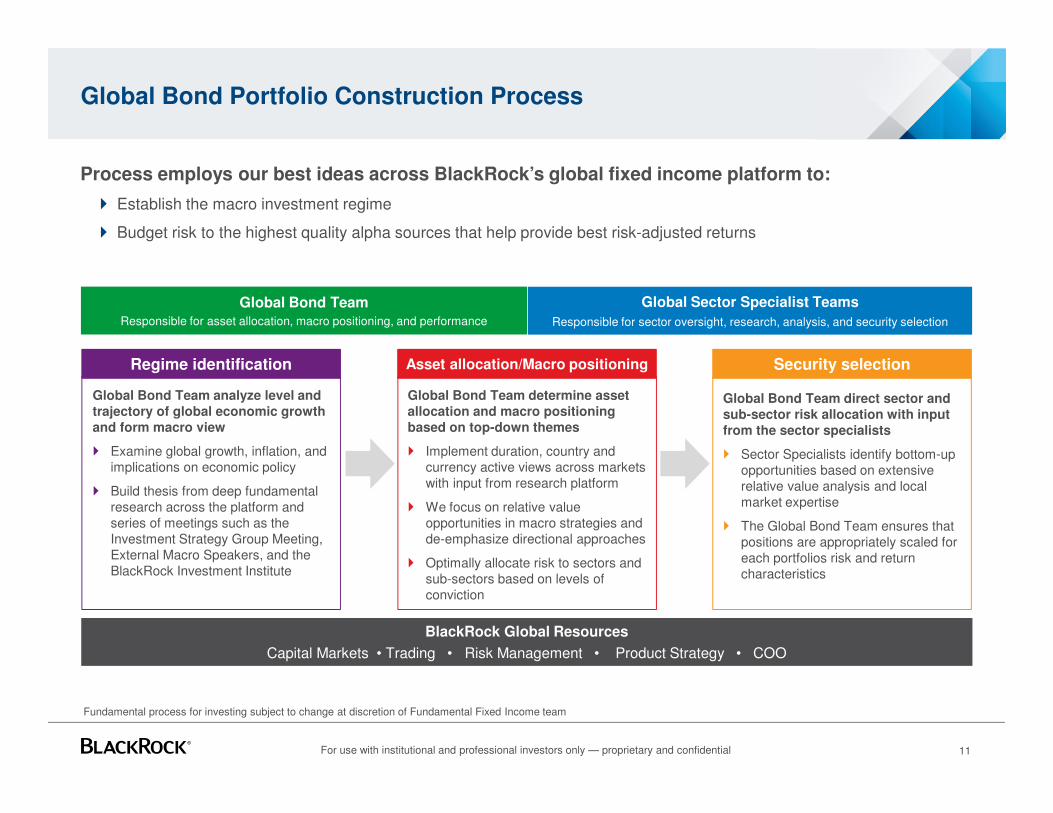
Global Bond Portfolio Construction Process
Process employs our best ideas across BlackRock’s global fixed income platform to:
� Establish the macro investment regime
� Budget risk to the highest quality alpha sources that help provide best risk-adjusted returns
Global Bond Team analyze level and trajectory of global economic growth and form macro view
� Examine global growth, inflation, and implications on economic policy
� Build thesis from deep fundamental research across the platform and series of meetings such as the Investment Strategy Group Meeting, External Macro Speakers, and the BlackRock Investment Institute
Regime identification Security selection
Global Bond Team direct sector and sub-sector risk allocation with input from the sector specialists
� Sector Specialists identify bottom-up opportunities based on extensive relative value analysis and local market expertise
� The Global Bond Team ensures that positions are appropriately scaled for each portfolios risk and return characteristics
Asset allocation/Macro positioning
Global Bond Team determine asset allocation and macro positioning based on top-down themes
� Implement duration, country and currency active views across markets with input from research platform
� We focus on relative value opportunities in macro strategies and de-emphasize directional approaches
� Optimally allocate risk to sectors and sub-sectors based on levels of conviction
Global Bond TeamResponsible for asset allocation, macro positioning, and performance
Global Sector Specialist Teams
Responsible for sector oversight, research, analysis, and security selection
BlackRock Global Resources
Capital Markets • Trading • Risk Management • Product Strategy • COO
Fundamental process for investing subject to change at discretion of Fundamental Fixed Income team
12For use with institutional and professional investors only — proprietary and confidential
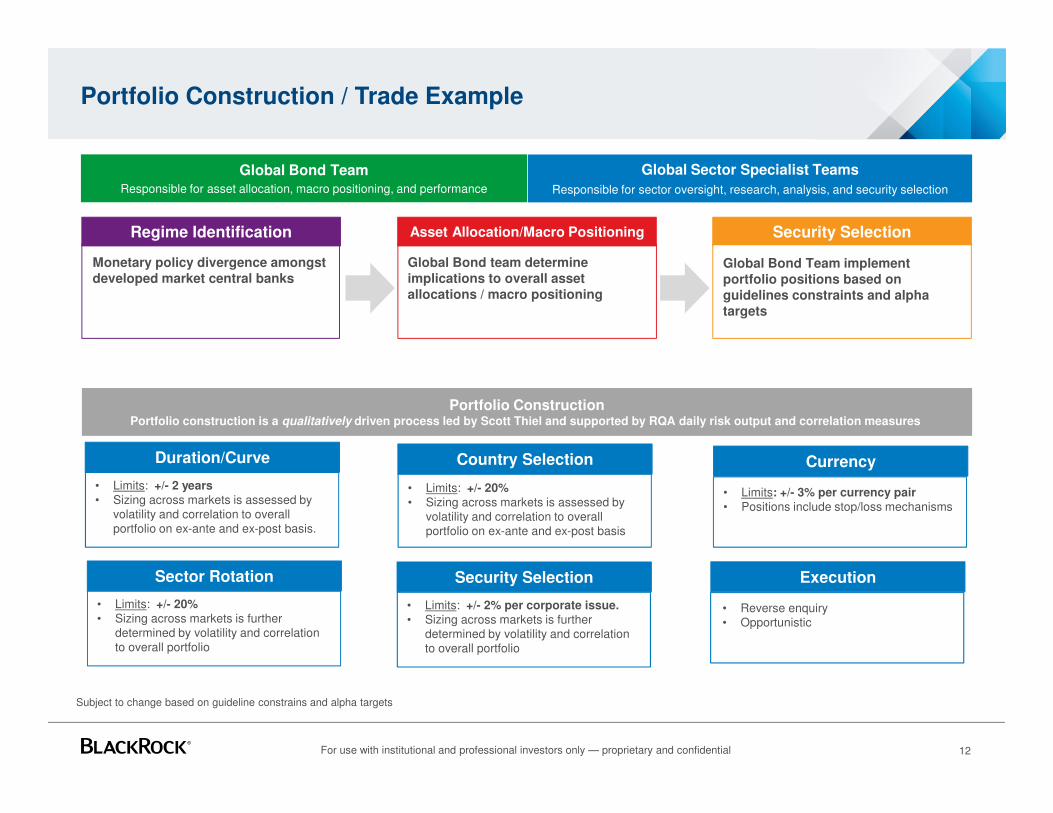
Portfolio Construction / Trade Example
Monetary policy divergence amongst developed market central banks
Regime Identification Security Selection
Global Bond Team implement portfolio positions based on guidelines constraints and alpha targets
Asset Allocation/Macro Positioning
Global Bond team determine implications to overall asset allocations / macro positioning
Global Bond TeamResponsible for asset allocation, macro positioning, and performance
Global Sector Specialist Teams
Responsible for sector oversight, research, analysis, and security selection
Duration/Curve
Portfolio ConstructionPortfolio construction is a qualitatively driven process led by Scott Thiel and supported by RQA daily risk output and correlation measures
• Limits: +/- 2 years• Sizing across markets is assessed by
volatility and correlation to overall portfolio on ex-ante and ex-post basis.
Country Selection
• Limits: +/- 20%• Sizing across markets is assessed by
volatility and correlation to overall portfolio on ex-ante and ex-post basis
Currency
• Limits: +/- 3% per currency pair• Positions include stop/loss mechanisms
Sector Rotation
• Limits: +/- 20%• Sizing across markets is further
determined by volatility and correlation to overall portfolio
Security Selection
• Limits: +/- 2% per corporate issue. • Sizing across markets is further
determined by volatility and correlation to overall portfolio
Execution
• Reverse enquiry• Opportunistic
Subject to change based on guideline constrains and alpha targets
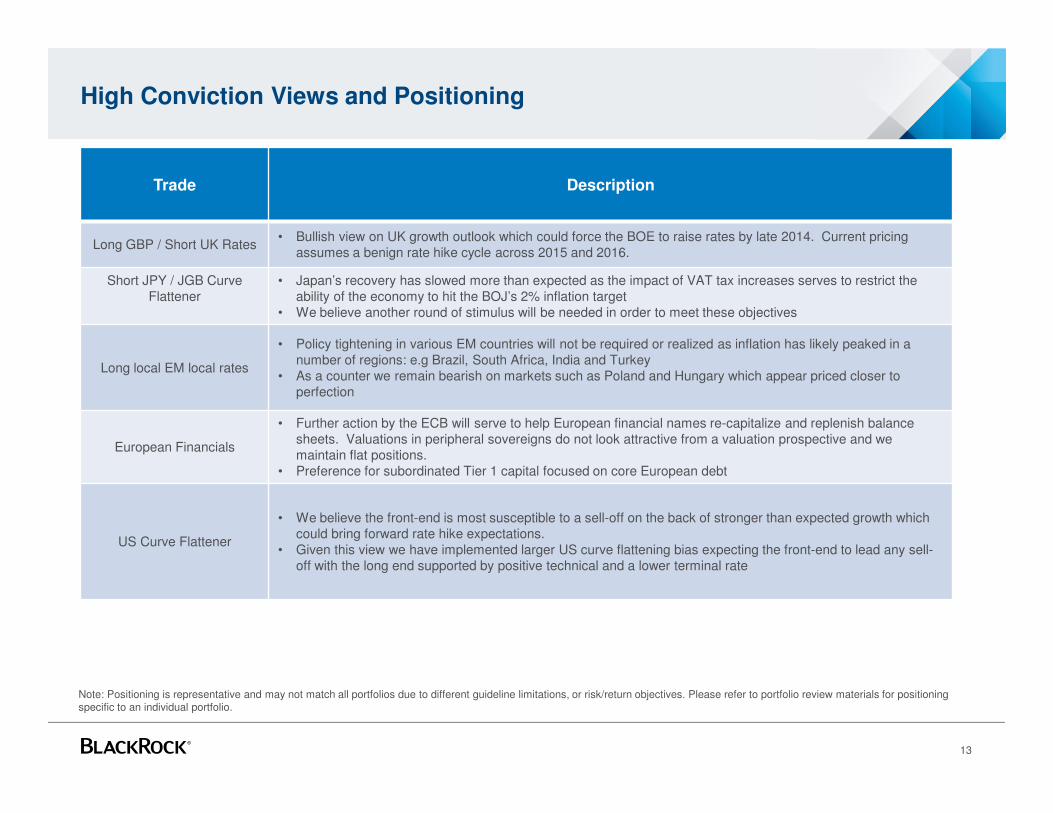
High Conviction Views and Positioning
13
Trade Description
Long GBP / Short UK Rates• Bullish view on UK growth outlook which could force the BOE to raise rates by late 2014. Current pricing
assumes a benign rate hike cycle across 2015 and 2016.
Short JPY / JGB Curve Flattener
• Japan’s recovery has slowed more than expected as the impact of VAT tax increases serves to restrict the ability of the economy to hit the BOJ’s 2% inflation target
• We believe another round of stimulus will be needed in order to meet these objectives
Long local EM local rates
• Policy tightening in various EM countries will not be required or realized as inflation has likely peaked in a number of regions: e.g Brazil, South Africa, India and Turkey
• As a counter we remain bearish on markets such as Poland and Hungary which appear priced closer to perfection
European Financials
• Further action by the ECB will serve to help European financial names re-capitalize and replenish balance sheets. Valuations in peripheral sovereigns do not look attractive from a valuation prospective and we maintain flat positions.
• Preference for subordinated Tier 1 capital focused on core European debt
US Curve Flattener
• We believe the front-end is most susceptible to a sell-off on the back of stronger than expected growth which could bring forward rate hike expectations.
• Given this view we have implemented larger US curve flattening bias expecting the front-end to lead any sell-off with the long end supported by positive technical and a lower terminal rate
Note: Positioning is representative and may not match all portfolios due to different guideline limitations, or risk/return objectives. Please refer to portfolio review materials for positioning specific to an individual portfolio.
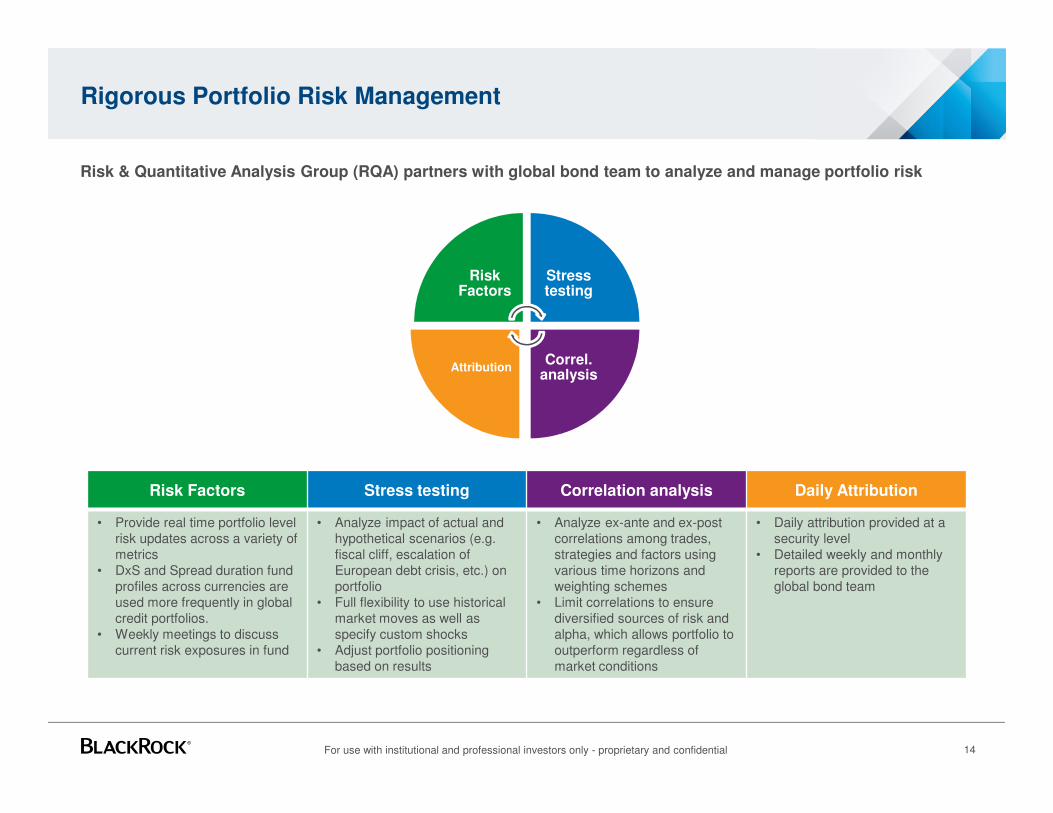
Rigorous Portfolio Risk Management
Risk & Quantitative Analysis Group (RQA) partners with global bond team to analyze and manage portfolio risk
Risk Factors
Stress testing
Correl.analysis
Attribution
Risk Factors Stress testing Correlation analysis Daily Attribution
• Provide real time portfolio level risk updates across a variety of metrics
• DxS and Spread duration fund profiles across currencies are used more frequently in global credit portfolios.
• Weekly meetings to discuss current risk exposures in fund
• Analyze impact of actual and hypothetical scenarios (e.g. fiscal cliff, escalation of European debt crisis, etc.) on portfolio
• Full flexibility to use historical market moves as well as specify custom shocks
• Adjust portfolio positioning based on results
• Analyze ex-ante and ex-post correlations among trades,strategies and factors using various time horizons and weighting schemes
• Limit correlations to ensure diversified sources of risk and alpha, which allows portfolio to outperform regardless of market conditions
• Daily attribution provided at a security level
• Detailed weekly and monthly reports are provided to the global bond team
14For use with institutional and professional investors only - proprietary and confidential
3. BlackRock Fundamental Global Bond Strategy
Investment Team
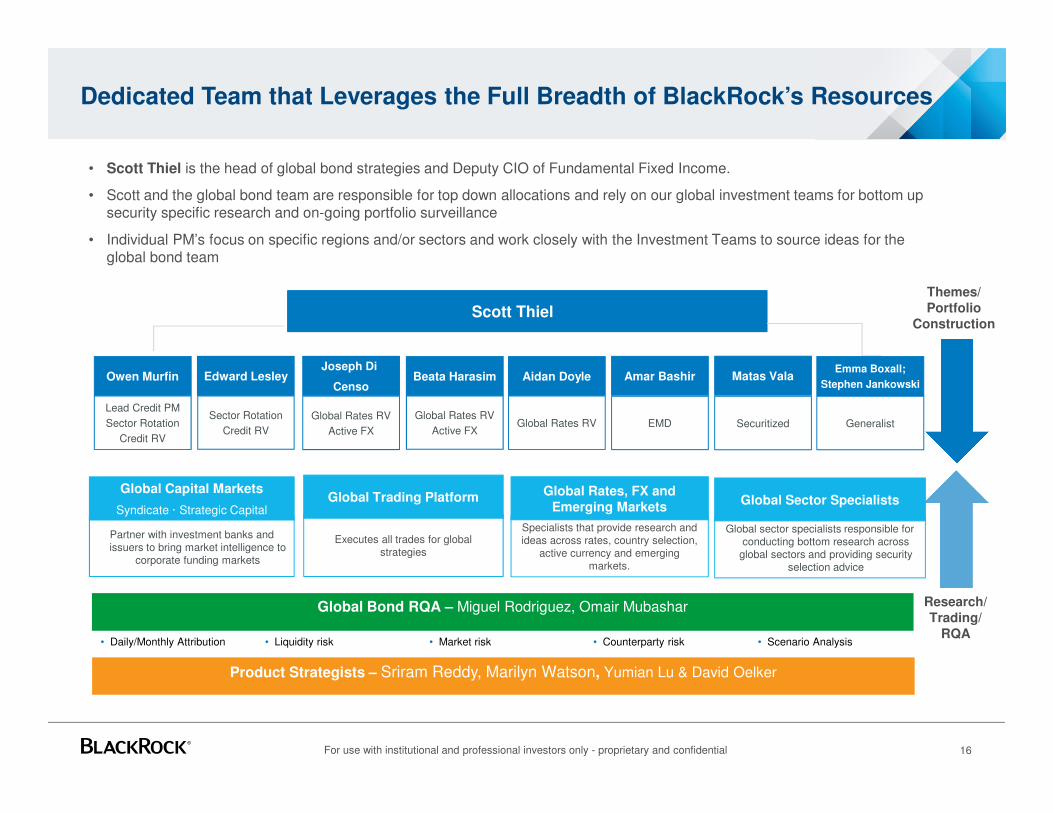
Dedicated Team that Leverages the Full Breadth of BlackRock’s Resources
16
Scott Thiel
Global Bond RQA – Miguel Rodriguez, Omair Mubashar
• Daily/Monthly Attribution • Liquidity risk • Market risk • Counterparty risk • Scenario Analysis
Product Strategists – Sriram Reddy, Marilyn Watson, Yumian Lu & David Oelker
Partner with investment banks and issuers to bring market intelligence to
corporate funding markets
Specialists that provide research and ideas across rates, country selection,
active currency and emerging markets.
Global Capital Markets
Syndicate · Strategic Capital
Global Rates, FX and Emerging Markets
Lead Credit PM
Sector Rotation
Credit RV
Owen Murfin Edward Lesley
Global Rates RV
Joseph Di
CensoBeata Harasim
Global Rates RV
Active FX
Aidan Doyle
EMD
Amar Bashir Matas Vala
Themes/Portfolio
Construction
Research/Trading/
RQA
Sector Rotation
Credit RV
Global Rates RV
Active FXGeneralist
Emma Boxall;
Stephen Jankowski
• Scott Thiel is the head of global bond strategies and Deputy CIO of Fundamental Fixed Income.
• Scott and the global bond team are responsible for top down allocations and rely on our global investment teams for bottom upsecurity specific research and on-going portfolio surveillance
• Individual PM’s focus on specific regions and/or sectors and work closely with the Investment Teams to source ideas for the global bond team
Securitized
Executes all trades for global strategies
Global Trading Platform
Global sector specialists responsible for conducting bottom research across
global sectors and providing security selection advice
Global Sector Specialists
For use with institutional and professional investors only - proprietary and confidential
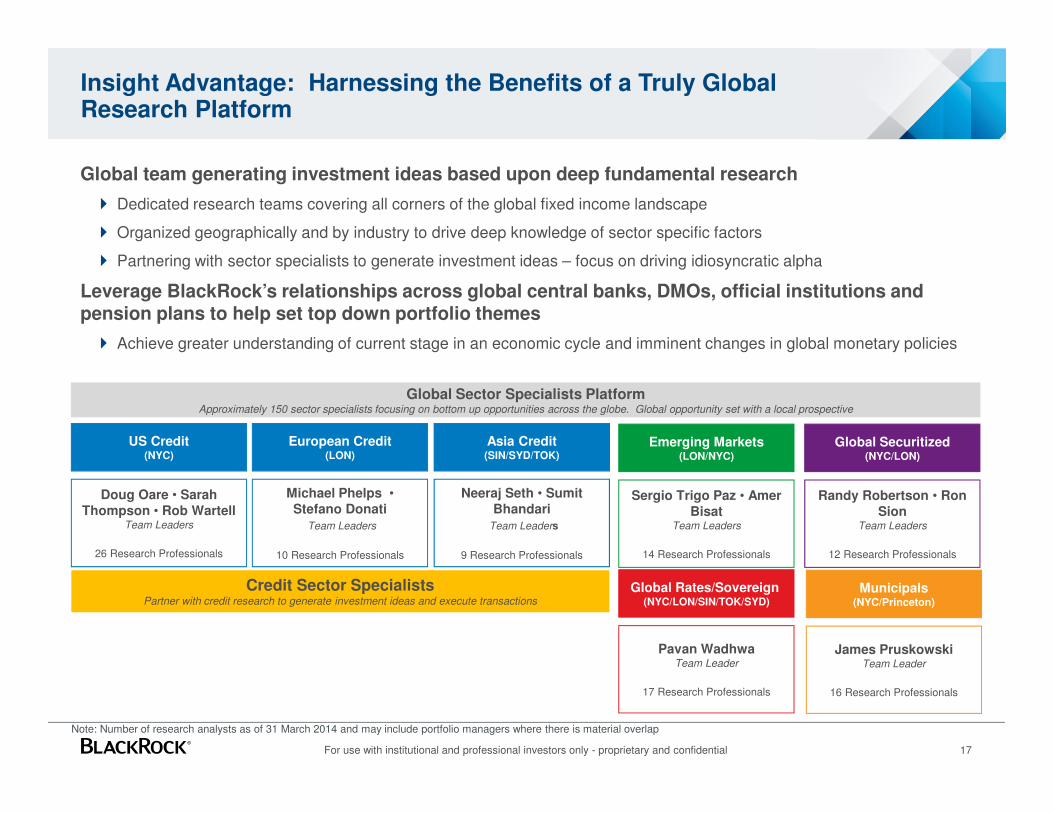
Insight Advantage: Harnessing the Benefits of a Truly Global Research Platform
Global team generating investment ideas based upon deep fundamental research
� Dedicated research teams covering all corners of the global fixed income landscape
� Organized geographically and by industry to drive deep knowledge of sector specific factors
� Partnering with sector specialists to generate investment ideas – focus on driving idiosyncratic alpha
Leverage BlackRock’s relationships across global central banks, DMOs, official institutions and pension plans to help set top down portfolio themes
� Achieve greater understanding of current stage in an economic cycle and imminent changes in global monetary policies
17
Note: Number of research analysts as of 31 March 2014 and may include portfolio managers where there is material overlap
Global Sector Specialists PlatformApproximately 150 sector specialists focusing on bottom up opportunities across the globe. Global opportunity set with a local prospective
US Credit(NYC)
European Credit (LON)
Asia Credit(SIN/SYD/TOK)
Doug Oare • Sarah Thompson • Rob Wartell
Team Leaders
26 Research Professionals
Michael Phelps • Stefano Donati
Team Leaders
10 Research Professionals
Neeraj Seth • SumitBhandari
Team Leaders
9 Research Professionals
Credit Sector SpecialistsPartner with credit research to generate investment ideas and execute transactions
Emerging Markets(LON/NYC)
Sergio Trigo Paz • Amer Bisat
Team Leaders
14 Research Professionals
Global Securitized(NYC/LON)
Randy Robertson • Ron Sion
Team Leaders
12 Research Professionals
Global Rates/Sovereign (NYC/LON/SIN/TOK/SYD)
Pavan WadhwaTeam Leader
17 Research Professionals
Municipals(NYC/Princeton)
James PruskowskiTeam Leader
16 Research Professionals
For use with institutional and professional investors only - proprietary and confidential
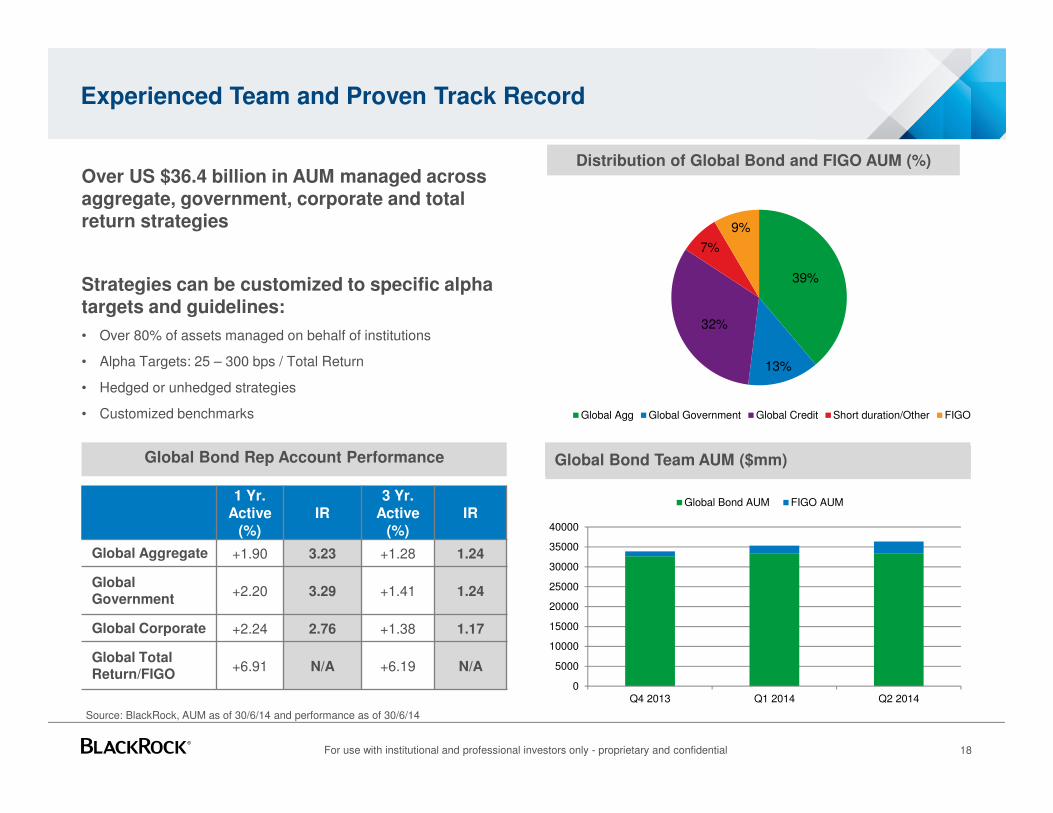
Experienced Team and Proven Track Record
18
Source: BlackRock, AUM as of 30/6/14 and performance as of 30/6/14
Over US $36.4 billion in AUM managed across aggregate, government, corporate and total return strategies
Strategies can be customized to specific alpha targets and guidelines:
• Over 80% of assets managed on behalf of institutions
• Alpha Targets: 25 – 300 bps / Total Return
• Hedged or unhedged strategies
• Customized benchmarks
Global Bond AUM ($mm)Global Bond Rep Account Performance Global Bond Team AUM ($mm)
Distribution of Global Bond and FIGO AUM (%)
39%
13%
32%
7%
9%
Global Agg Global Government Global Credit Short duration/Other FIGO
1 Yr. Active
(%)IR
3 Yr. Active
(%)IR
Global Aggregate +1.90 3.23 +1.28 1.24
Global Government
+2.20 3.29 +1.41 1.24
Global Corporate +2.24 2.76 +1.38 1.17
Global Total Return/FIGO
+6.91 N/A +6.19 N/A
0
5000
10000
15000
20000
25000
30000
35000
40000
Q4 2013 Q1 2014 Q2 2014
Global Bond AUM FIGO AUM
For use with institutional and professional investors only - proprietary and confidential

4. Track Record and Positioning
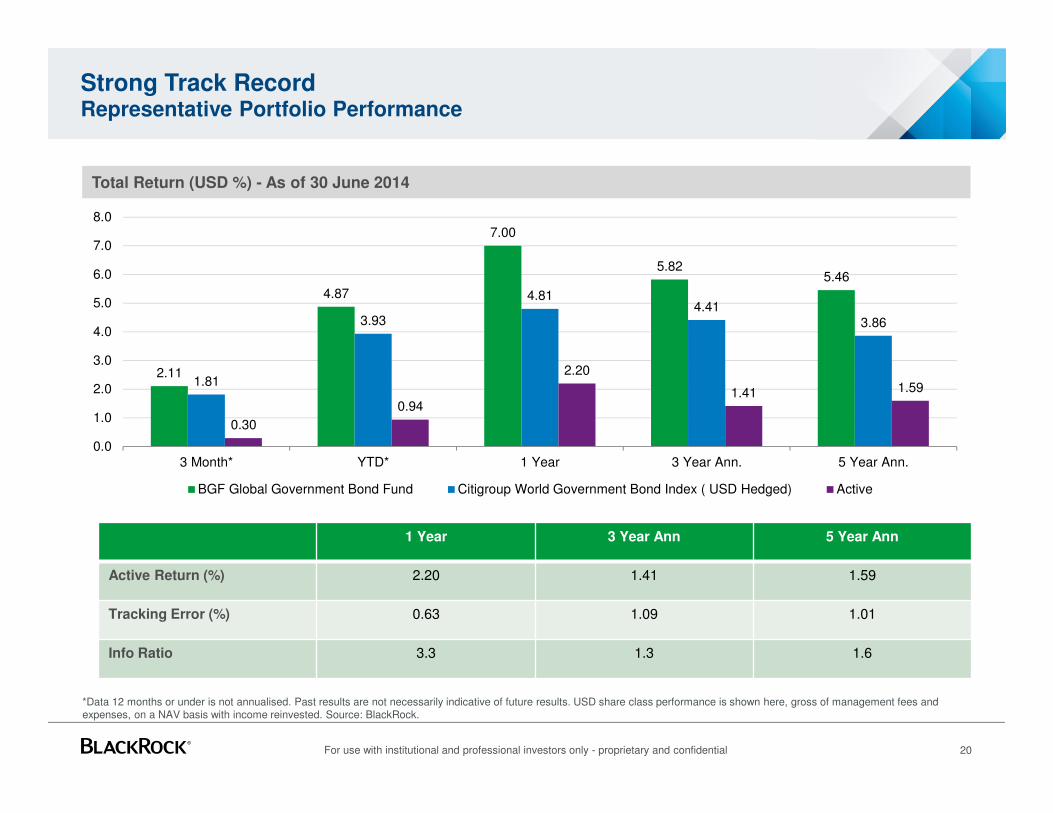
*Data 12 months or under is not annualised. Past results are not necessarily indicative of future results. USD share class performance is shown here, gross of management fees and expenses, on a NAV basis with income reinvested. Source: BlackRock.
Total Return (USD %) - As of 30 June 2014
Strong Track RecordRepresentative Portfolio Performance
2.11
4.87
7.00
5.825.46
1.81
3.93
4.814.41
3.86
0.30
0.94
2.20
1.41 1.59
0.0
1.0
2.0
3.0
4.0
5.0
6.0
7.0
8.0
3 Month* YTD* 1 Year 3 Year Ann. 5 Year Ann.
BGF Global Government Bond Fund Citigroup World Government Bond Index ( USD Hedged) Active
1 Year 3 Year Ann 5 Year Ann
Active Return (%) 2.20 1.41 1.59
Tracking Error (%) 0.63 1.09 1.01
Info Ratio 3.3 1.3 1.6
20For use with institutional and professional investors only - proprietary and confidential
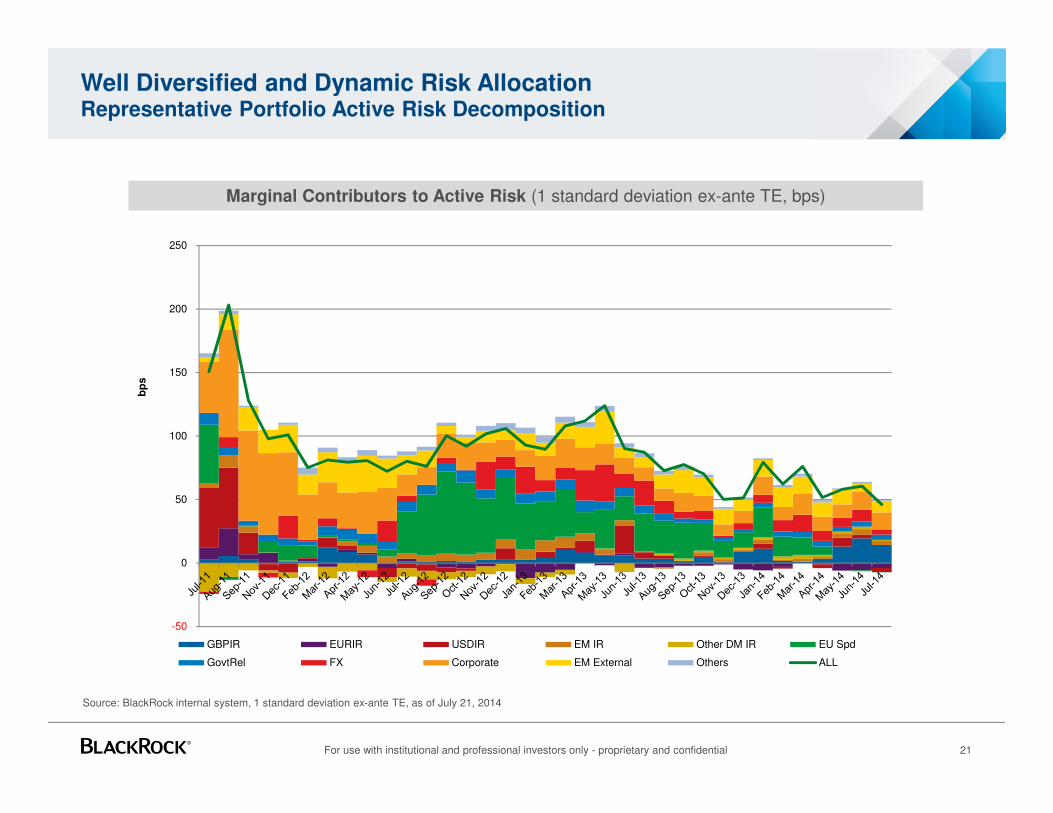
Well Diversified and Dynamic Risk AllocationRepresentative Portfolio Active Risk Decomposition
21
Source: BlackRock internal system, 1 standard deviation ex-ante TE, as of July 21, 2014
Marginal Contributors to Active Risk (1 standard deviation ex-ante TE, bps)
For use with institutional and professional investors only - proprietary and confidential
-50
0
50
100
150
200
250
bp
s
GBPIR EURIR USDIR EM IR Other DM IR EU Spd
GovtRel FX Corporate EM External Others ALL
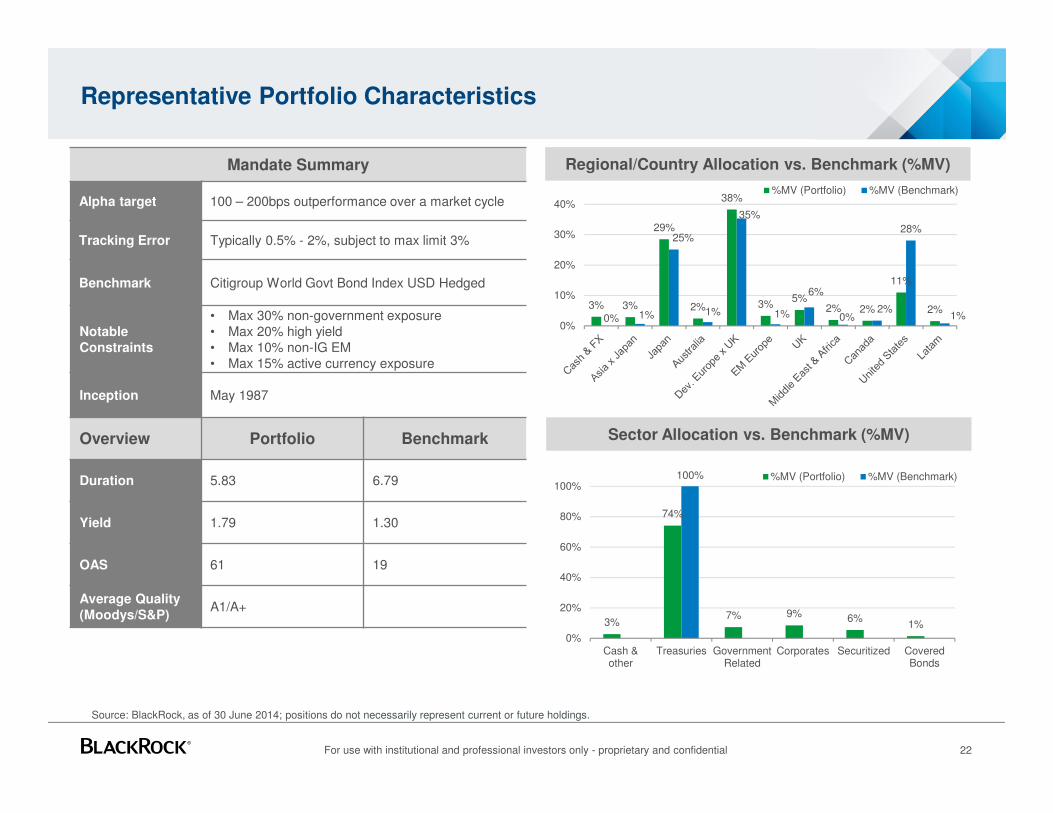
Representative Portfolio Characteristics
Source: BlackRock, as of 30 June 2014; positions do not necessarily represent current or future holdings.
Regional/Country Allocation vs. Benchmark (%MV)
Sector Allocation vs. Benchmark (%MV)
Mandate Summary
Alpha target 100 – 200bps outperformance over a market cycle
Tracking Error Typically 0.5% - 2%, subject to max limit 3%
Benchmark Citigroup World Govt Bond Index USD Hedged
Notable Constraints
• Max 30% non-government exposure• Max 20% high yield • Max 10% non-IG EM • Max 15% active currency exposure
Inception May 1987
Overview Portfolio Benchmark
Duration 5.83 6.79
Yield 1.79 1.30
OAS 61 19
Average Quality (Moodys/S&P)
A1/A+
3% 3%
29%
2%
38%
3%5%
2% 2%
11%
2%0% 1%
25%
1%
35%
1%
6%
0%2%
28%
1%0%
10%
20%
30%
40%
%MV (Portfolio) %MV (Benchmark)
3%
74%
7% 9% 6%1%
100%
0%
20%
40%
60%
80%
100%
Cash &other
Treasuries GovernmentRelated
Corporates Securitized CoveredBonds
%MV (Portfolio) %MV (Benchmark)
22For use with institutional and professional investors only - proprietary and confidential
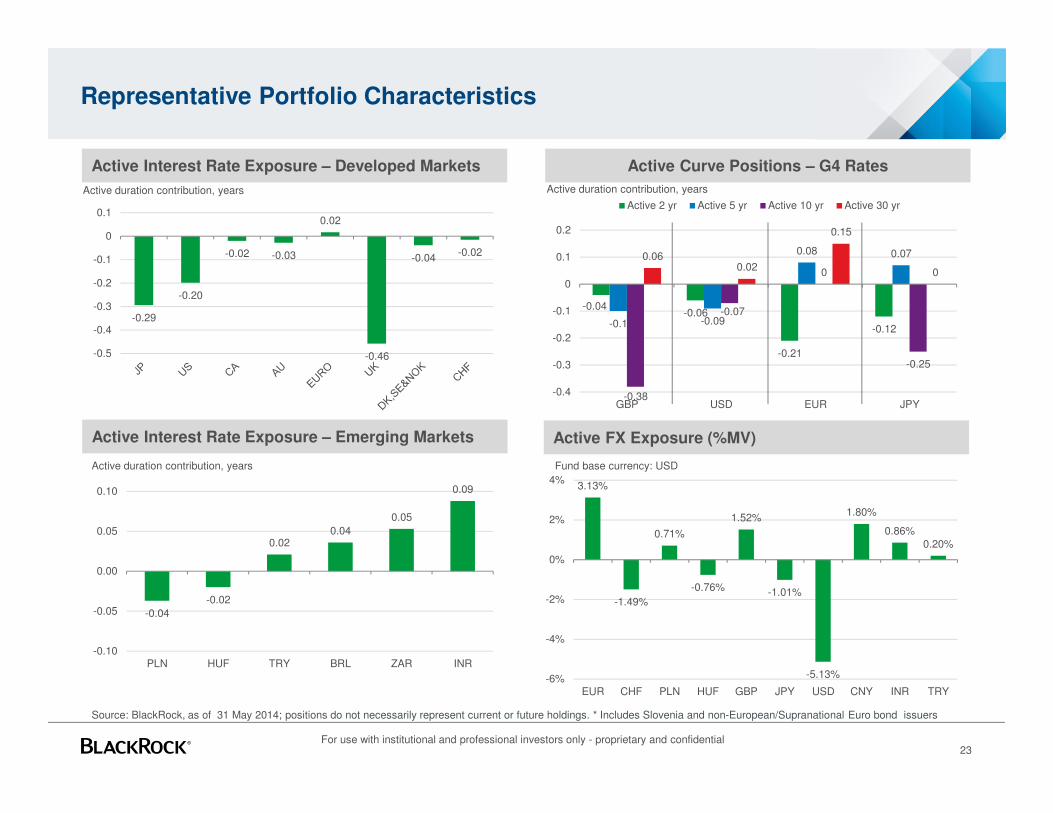
Active Interest Rate Exposure – Developed Markets Active Curve Positions – G4 Rates
Active FX Exposure (%MV)
Representative Portfolio Characteristics
Source: BlackRock, as of 31 May 2014; positions do not necessarily represent current or future holdings. * Includes Slovenia and non-European/Supranational Euro bond issuers
Active duration contribution, years Active duration contribution, years
Fund base currency: USD
Active Interest Rate Exposure – Emerging Markets
-0.29
-0.20
-0.02 -0.03
0.02
-0.46
-0.04-0.02
-0.5
-0.4
-0.3
-0.2
-0.1
0
0.1
3.13%
-1.49%
0.71%
-0.76%
1.52%
-1.01%
-5.13%
1.80%
0.86%0.20%
-6%
-4%
-2%
0%
2%
4%
EUR CHF PLN HUF GBP JPY USD CNY INR TRY
-0.04-0.06
-0.21
-0.12-0.1 -0.09
0.08 0.07
-0.38
-0.07
0
-0.25
0.060.02
0.15
0
-0.4
-0.3
-0.2
-0.1
0
0.1
0.2
GBP USD EUR JPY
Active 2 yr Active 5 yr Active 10 yr Active 30 yr
-0.04
-0.02
0.020.04
0.05
0.09
-0.10
-0.05
0.00
0.05
0.10
PLN HUF TRY BRL ZAR INR
Active duration contribution, years
23For use with institutional and professional investors only - proprietary and confidential
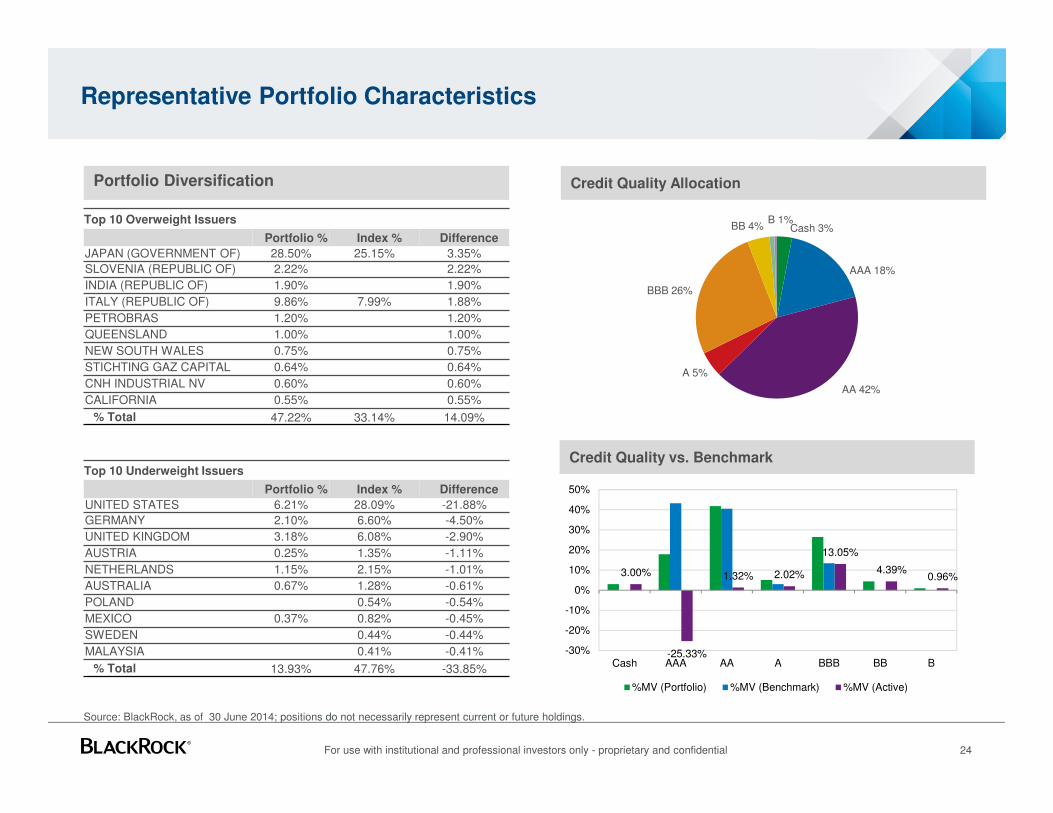
Representative Portfolio Characteristics
24
Portfolio Diversification
Source: BlackRock, as of 30 June 2014; positions do not necessarily represent current or future holdings.
Top 10 Overweight Issuers
Portfolio % Index % Difference
JAPAN (GOVERNMENT OF) 28.50% 25.15% 3.35%
SLOVENIA (REPUBLIC OF) 2.22% 2.22%
INDIA (REPUBLIC OF) 1.90% 1.90%
ITALY (REPUBLIC OF) 9.86% 7.99% 1.88%
PETROBRAS 1.20% 1.20%
QUEENSLAND 1.00% 1.00%
NEW SOUTH WALES 0.75% 0.75%
STICHTING GAZ CAPITAL 0.64% 0.64%
CNH INDUSTRIAL NV 0.60% 0.60%
CALIFORNIA 0.55% 0.55%
% Total 47.22% 33.14% 14.09%
Top 10 Underweight Issuers
Portfolio % Index % Difference
UNITED STATES 6.21% 28.09% -21.88%
GERMANY 2.10% 6.60% -4.50%
UNITED KINGDOM 3.18% 6.08% -2.90%
AUSTRIA 0.25% 1.35% -1.11%
NETHERLANDS 1.15% 2.15% -1.01%
AUSTRALIA 0.67% 1.28% -0.61%
POLAND 0.54% -0.54%
MEXICO 0.37% 0.82% -0.45%
SWEDEN 0.44% -0.44%
MALAYSIA 0.41% -0.41%
% Total 13.93% 47.76% -33.85%
Credit Quality Allocation
Credit Quality vs. Benchmark
Cash 3%
AAA 18%
AA 42%
A 5%
BBB 26%
BB 4%B 1%
3.00%
-25.33%
1.32% 2.02%
13.05%
4.39%0.96%
-30%
-20%
-10%
0%
10%
20%
30%
40%
50%
Cash AAA AA A BBB BB B
%MV (Portfolio) %MV (Benchmark) %MV (Active)
For use with institutional and professional investors only - proprietary and confidential
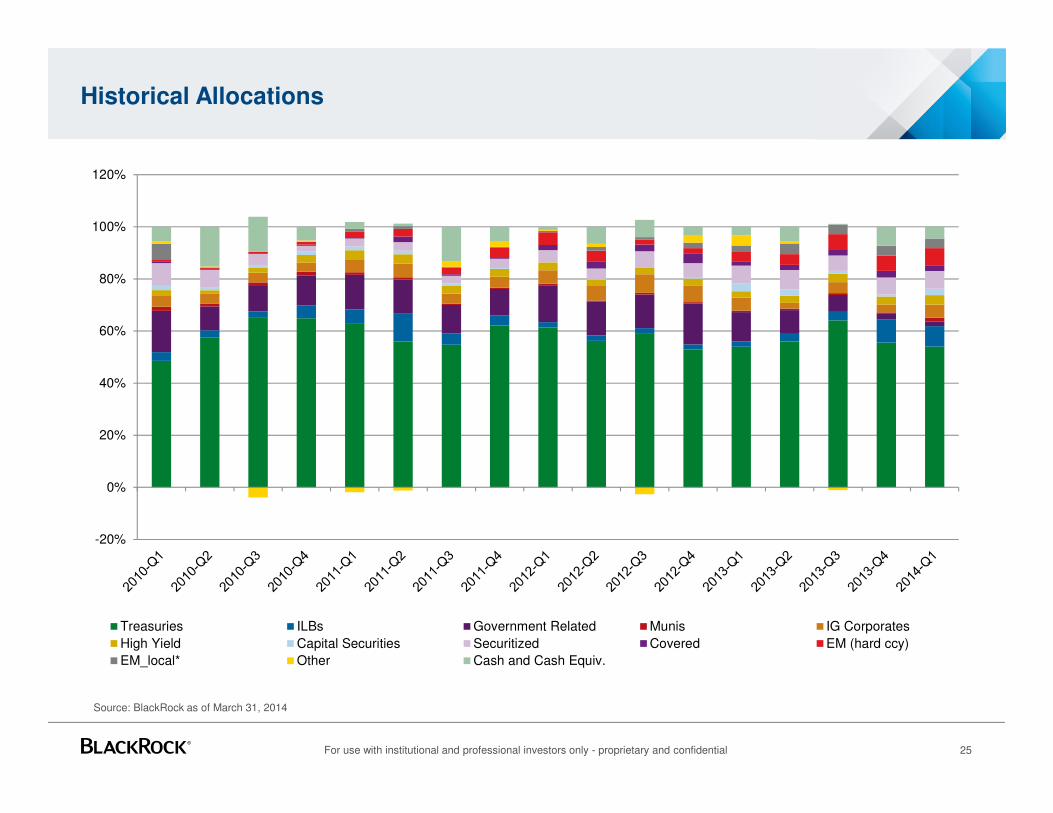
Historical Allocations
For use with institutional and professional investors only - proprietary and confidential 25
-20%
0%
20%
40%
60%
80%
100%
120%
Treasuries ILBs Government Related Munis IG Corporates
High Yield Capital Securities Securitized Covered EM (hard ccy)
EM_local* Other Cash and Cash Equiv.
Source: BlackRock as of March 31, 2014
Appendix
A. Sources of Alpha and Guidelines
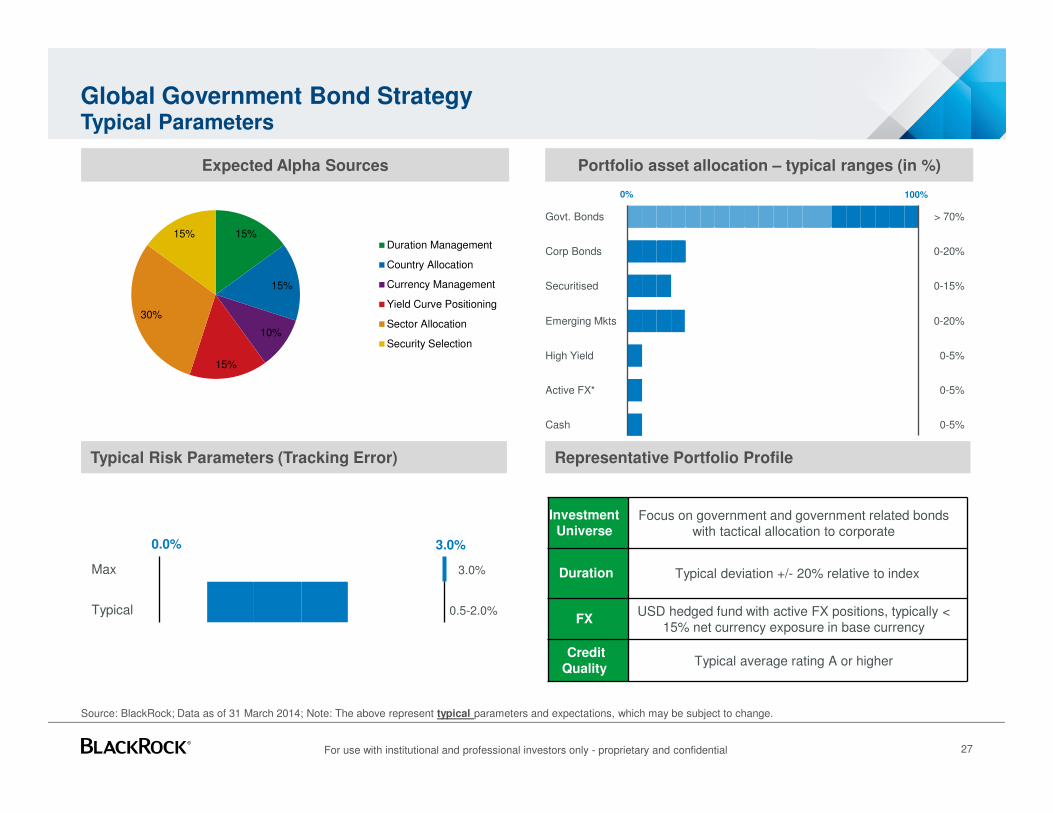
Global Government Bond Strategy Typical Parameters
Portfolio asset allocation – typical ranges (in %)
Source: BlackRock; Data as of 31 March 2014; Note: The above represent typical parameters and expectations, which may be subject to change.
Expected Alpha Sources
0% 100%
Govt. Bonds > 70%
Corp Bonds 0-20%
Securitised 0-15%
Emerging Mkts 0-20%
High Yield 0-5%
Active FX* 0-5%
Cash 0-5%
15%
15%
10%
15%
30%
15%Duration Management
Country Allocation
Currency Management
Yield Curve Positioning
Sector Allocation
Security Selection
Typical Risk Parameters (Tracking Error)
Max 3.0%
Typical 0.5-2.0%
0.0% 3.0%
Representative Portfolio Profile
Investment Universe
Focus on government and government related bonds with tactical allocation to corporate
Duration Typical deviation +/- 20% relative to index
FXUSD hedged fund with active FX positions, typically <
15% net currency exposure in base currency
Credit Quality
Typical average rating A or higher
For use with institutional and professional investors only - proprietary and confidential 27
Appendix
B. Sample Macro and Credit Research
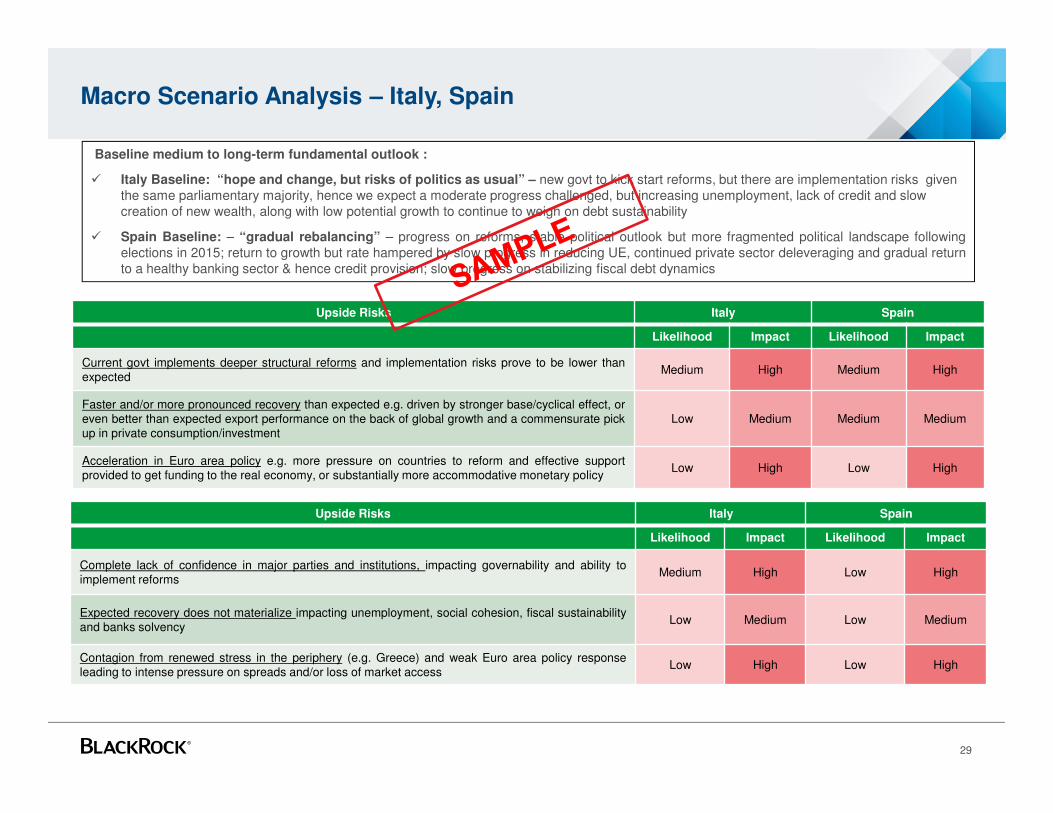
Macro Scenario Analysis – Italy, Spain
Upside Risks Italy Spain
Likelihood Impact Likelihood Impact
Current govt implements deeper structural reforms and implementation risks prove to be lower thanexpected
Medium High Medium High
Faster and/or more pronounced recovery than expected e.g. driven by stronger base/cyclical effect, oreven better than expected export performance on the back of global growth and a commensurate pickup in private consumption/investment
Low Medium Medium Medium
Acceleration in Euro area policy e.g. more pressure on countries to reform and effective supportprovided to get funding to the real economy, or substantially more accommodative monetary policy
Low High Low High
Upside Risks Italy Spain
Likelihood Impact Likelihood Impact
Complete lack of confidence in major parties and institutions, impacting governability and ability toimplement reforms
Medium High Low High
Expected recovery does not materialize impacting unemployment, social cohesion, fiscal sustainabilityand banks solvency
Low Medium Low Medium
Contagion from renewed stress in the periphery (e.g. Greece) and weak Euro area policy responseleading to intense pressure on spreads and/or loss of market access
Low High Low High
29
Baseline medium to long-term fundamental outlook :
� Italy Baseline: “hope and change, but risks of politics as usual” – new govt to kick start reforms, but there are implementation risks given the same parliamentary majority, hence we expect a moderate progress challenged, but increasing unemployment, lack of credit and slow creation of new wealth, along with low potential growth to continue to weigh on debt sustainability
� Spain Baseline: – “gradual rebalancing” – progress on reforms, stable political outlook but more fragmented political landscape followingelections in 2015; return to growth but rate hampered by slow progress in reducing UE, continued private sector deleveraging and gradual returnto a healthy banking sector & hence credit provision; slow progress on stabilizing fiscal debt dynamics
For use with institutional and professional investors only — proprietary and confidential
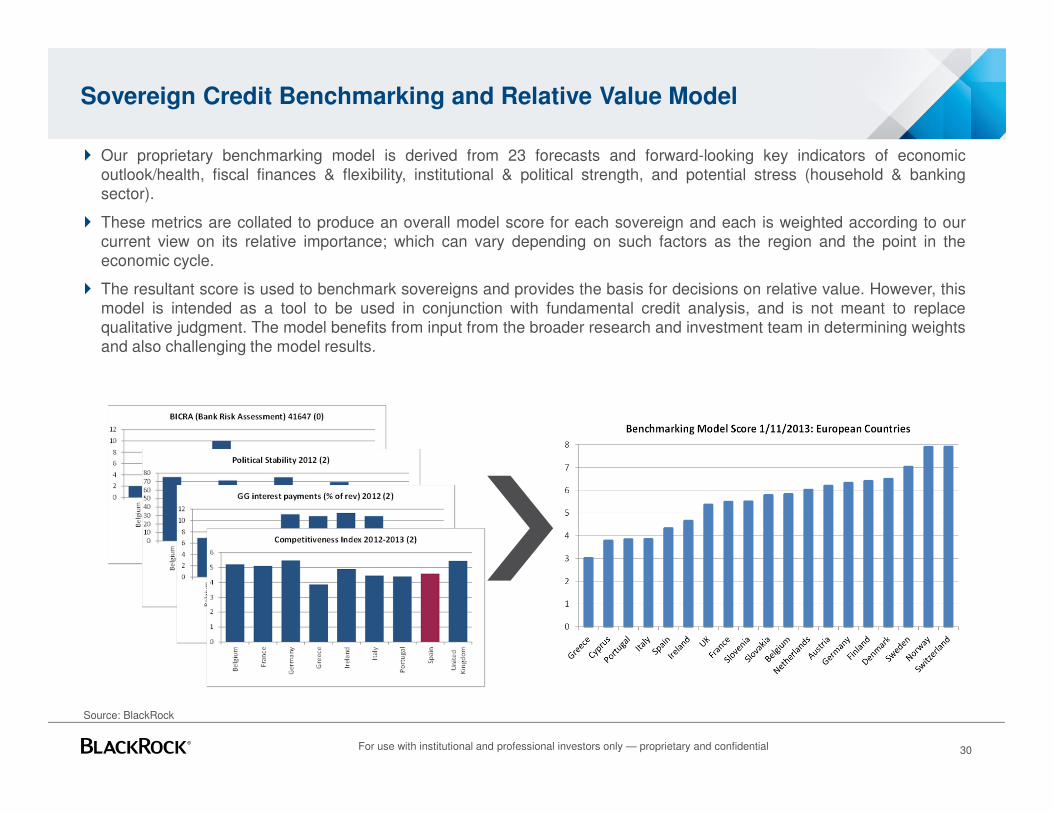
Sovereign Credit Benchmarking and Relative Value Model
� Our proprietary benchmarking model is derived from 23 forecasts and forward-looking key indicators of economicoutlook/health, fiscal finances & flexibility, institutional & political strength, and potential stress (household & bankingsector).
� These metrics are collated to produce an overall model score for each sovereign and each is weighted according to ourcurrent view on its relative importance; which can vary depending on such factors as the region and the point in theeconomic cycle.
� The resultant score is used to benchmark sovereigns and provides the basis for decisions on relative value. However, thismodel is intended as a tool to be used in conjunction with fundamental credit analysis, and is not meant to replacequalitative judgment. The model benefits from input from the broader research and investment team in determining weightsand also challenging the model results.
Source: BlackRock
30
For use with institutional and professional investors only — proprietary and confidential
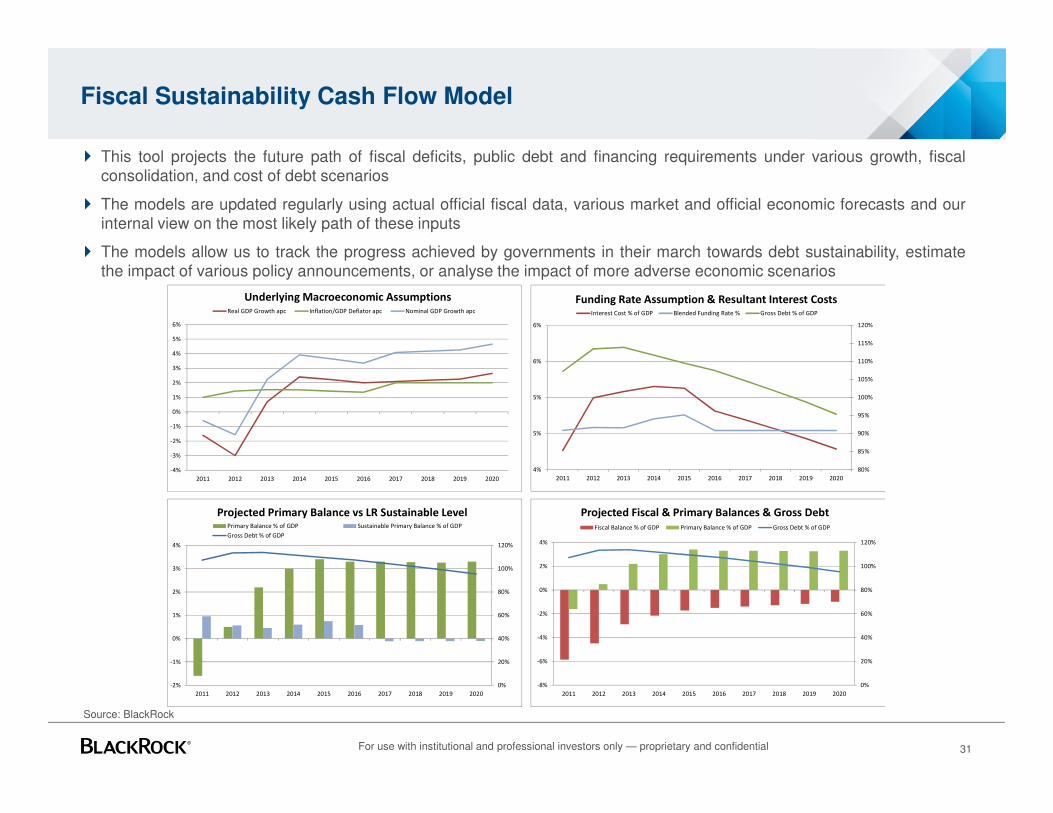
Fiscal Sustainability Cash Flow Model
� This tool projects the future path of fiscal deficits, public debt and financing requirements under various growth, fiscalconsolidation, and cost of debt scenarios
� The models are updated regularly using actual official fiscal data, various market and official economic forecasts and ourinternal view on the most likely path of these inputs
� The models allow us to track the progress achieved by governments in their march towards debt sustainability, estimatethe impact of various policy announcements, or analyse the impact of more adverse economic scenarios
-4%
-3%
-2%
-1%
0%
1%
2%
3%
4%
5%
6%
2011 2012 2013 2014 2015 2016 2017 2018 2019 2020
Underlying Macroeconomic AssumptionsReal GDP Growth apc Inflation/GDP Deflator apc Nominal GDP Growth apc
0%
20%
40%
60%
80%
100%
120%
-2%
-1%
0%
1%
2%
3%
4%
2011 2012 2013 2014 2015 2016 2017 2018 2019 2020
Projected Primary Balance vs LR Sustainable LevelPrimary Balance % of GDP Sustainable Primary Balance % of GDP
Gross Debt % of GDP
80%
85%
90%
95%
100%
105%
110%
115%
120%
4%
5%
5%
6%
6%
2011 2012 2013 2014 2015 2016 2017 2018 2019 2020
Funding Rate Assumption & Resultant Interest CostsInterest Cost % of GDP Blended Funding Rate % Gross Debt % of GDP
0%
20%
40%
60%
80%
100%
120%
-8%
-6%
-4%
-2%
0%
2%
4%
2011 2012 2013 2014 2015 2016 2017 2018 2019 2020
Projected Fiscal & Primary Balances & Gross Debt
Fiscal Balance % of GDP Primary Balance % of GDP Gross Debt % of GDP
31
Source: BlackRock
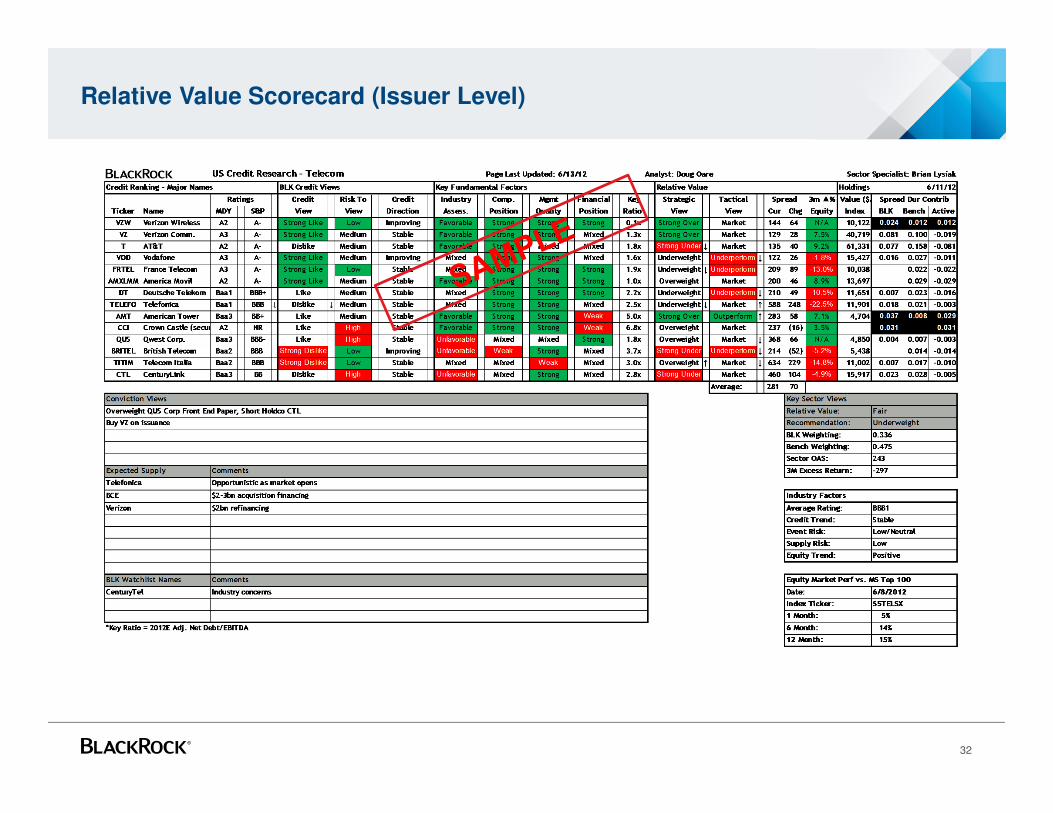
Relative Value Scorecard (Issuer Level)
32
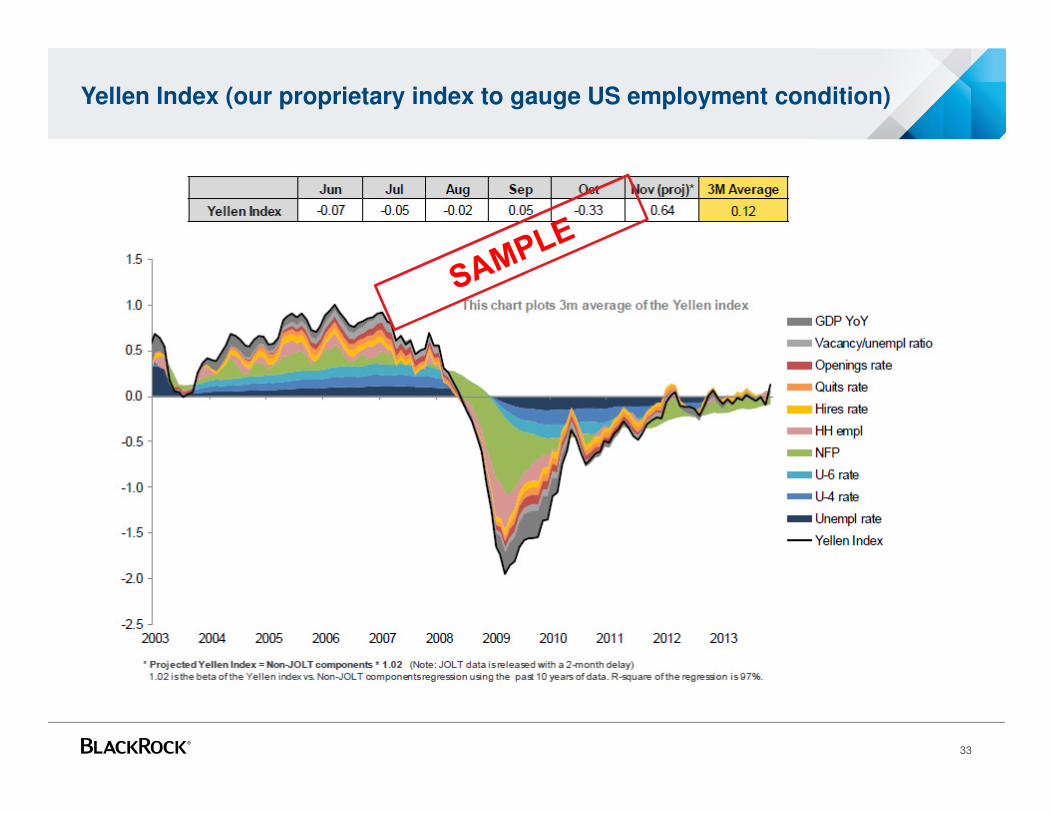
Yellen Index (our proprietary index to gauge US employment condition)
33
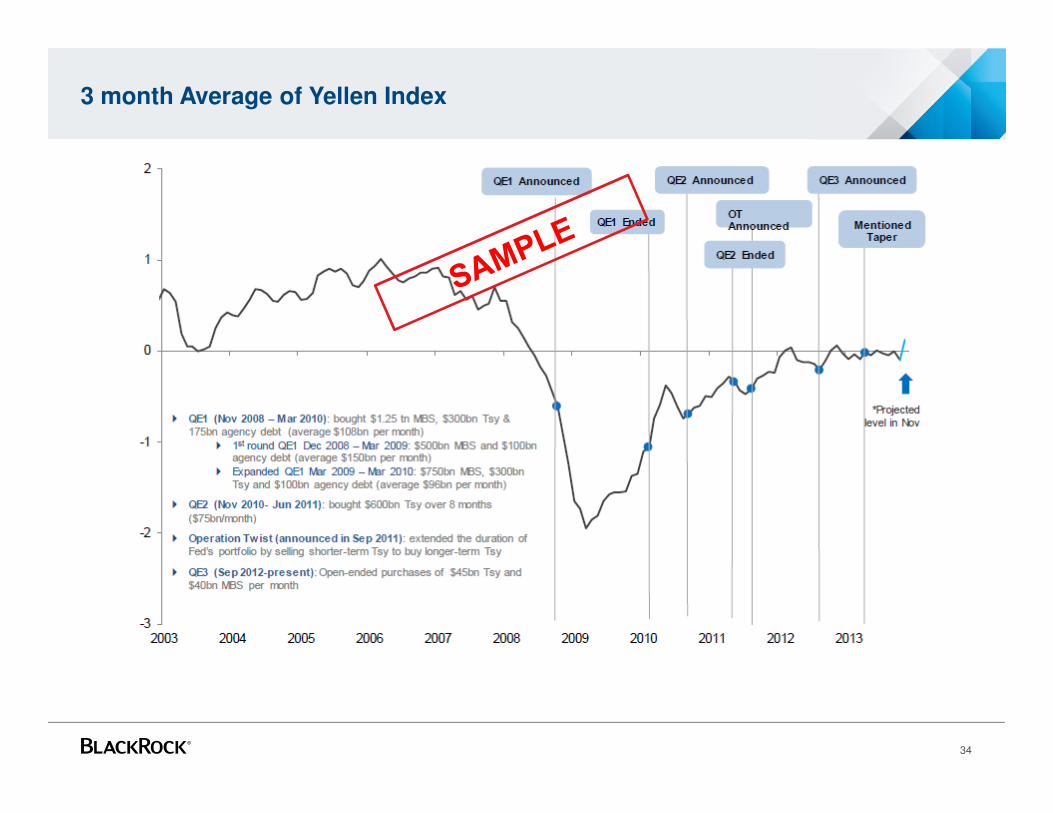
3 month Average of Yellen Index
34
Appendix
C. Sample Risk Management Output
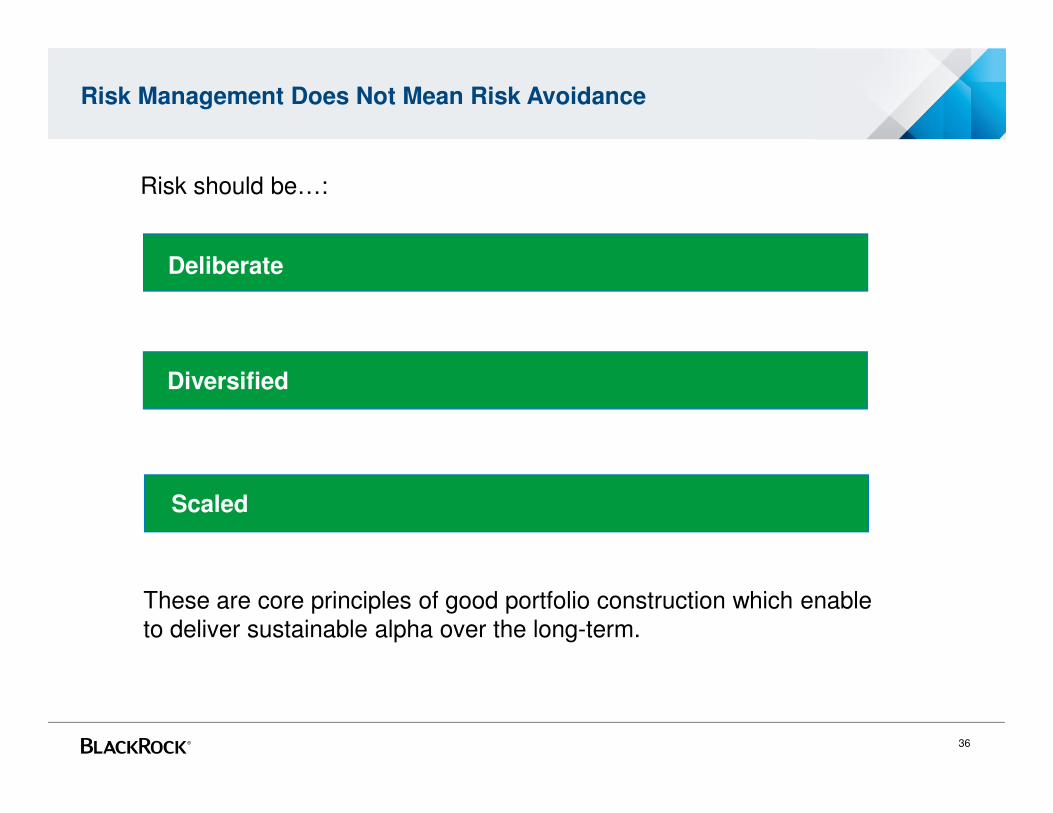
Risk Management Does Not Mean Risk Avoidance
Deliberate
Diversified
Scaled
Risk should be…:
These are core principles of good portfolio construction which enable to deliver sustainable alpha over the long-term.
36
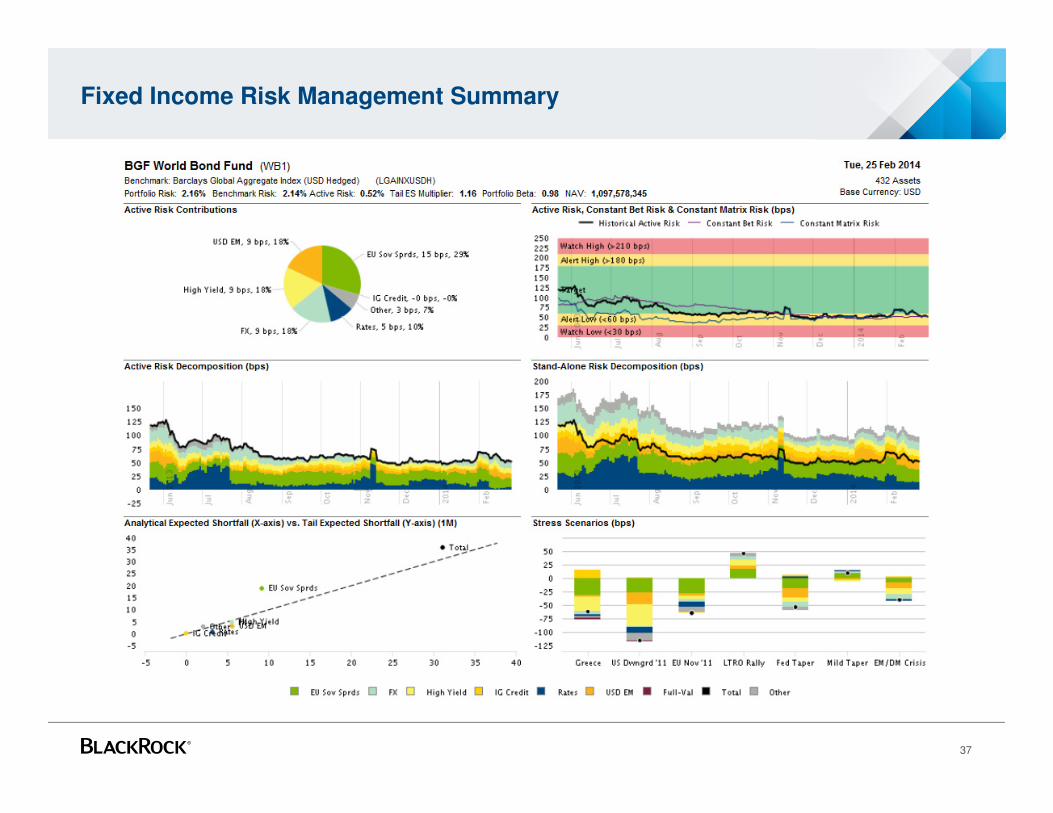
Fixed Income Risk Management Summary
37
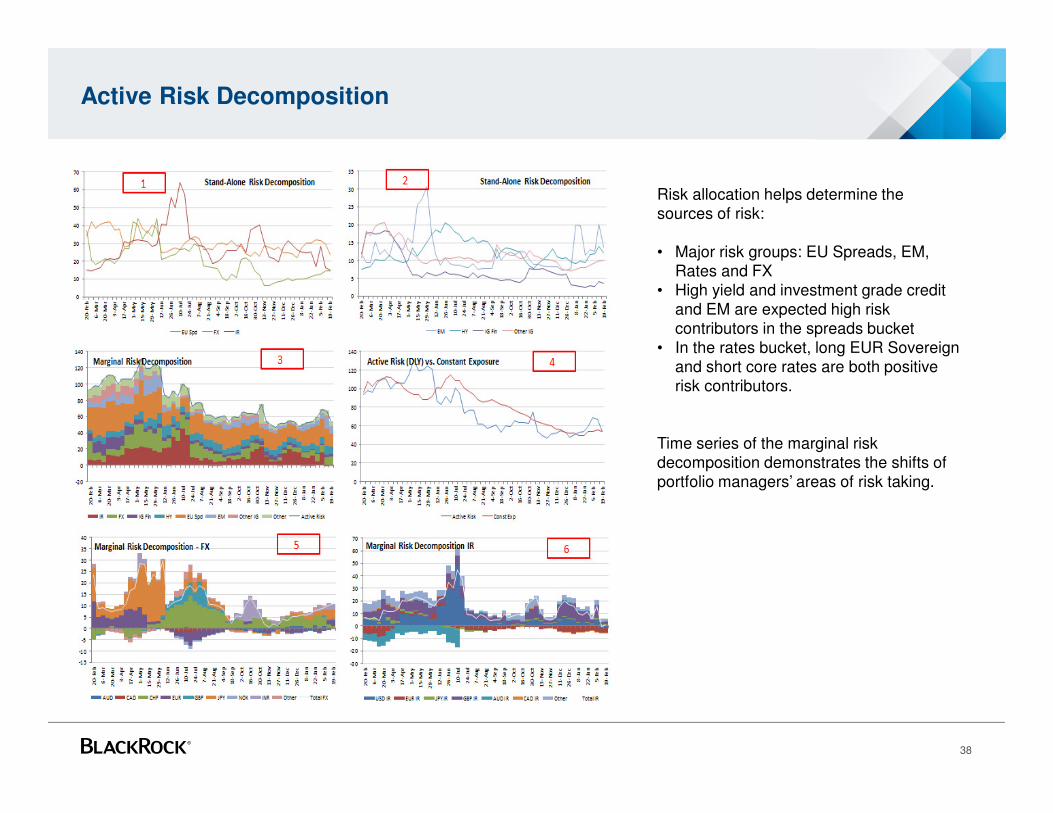
Active Risk Decomposition
Risk allocation helps determine the sources of risk:
• Major risk groups: EU Spreads, EM, Rates and FX
• High yield and investment grade credit and EM are expected high risk contributors in the spreads bucket
• In the rates bucket, long EUR Sovereign and short core rates are both positive risk contributors.
Time series of the marginal risk decomposition demonstrates the shifts of portfolio managers’ areas of risk taking.
38
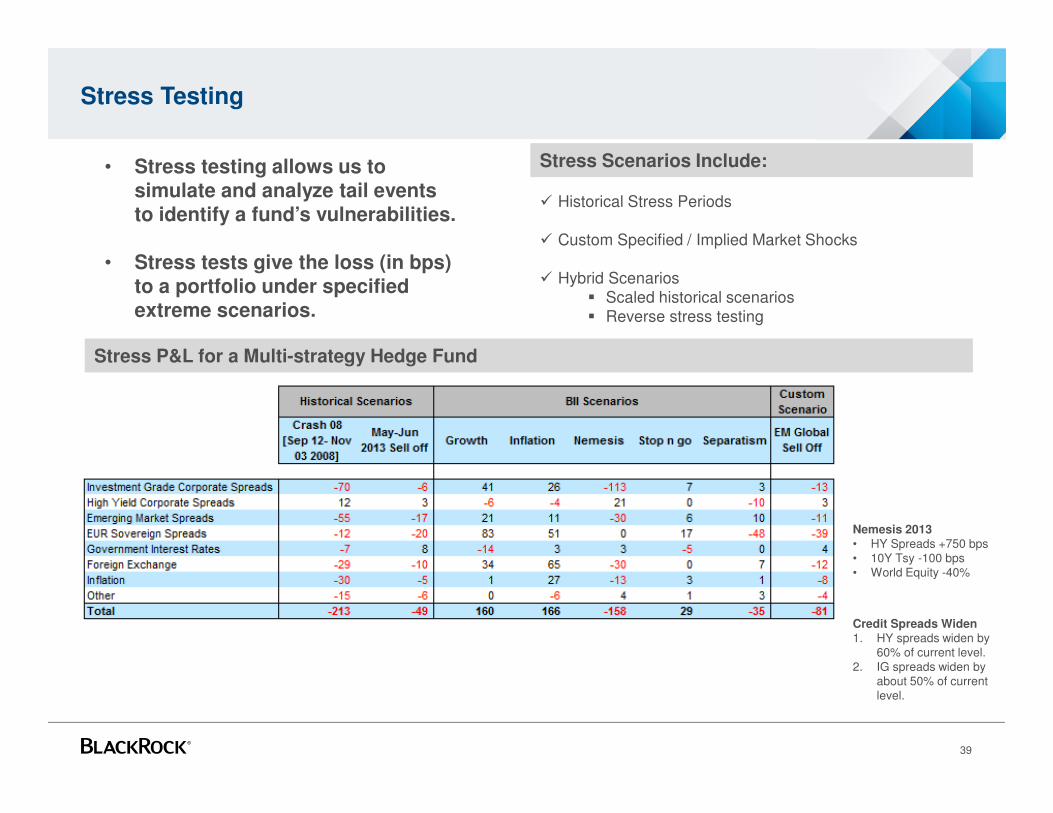
Stress Testing
Stress P&L for a Multi-strategy Hedge Fund
Stress Scenarios Include:
� Historical Stress Periods
� Custom Specified / Implied Market Shocks
� Hybrid Scenarios� Scaled historical scenarios� Reverse stress testing
• Stress testing allows us to simulate and analyze tail events to identify a fund’s vulnerabilities.
• Stress tests give the loss (in bps) to a portfolio under specified extreme scenarios.
39
Nemesis 2013• HY Spreads +750 bps• 10Y Tsy -100 bps• World Equity -40%
Credit Spreads Widen1. HY spreads widen by
60% of current level.2. IG spreads widen by
about 50% of current level.
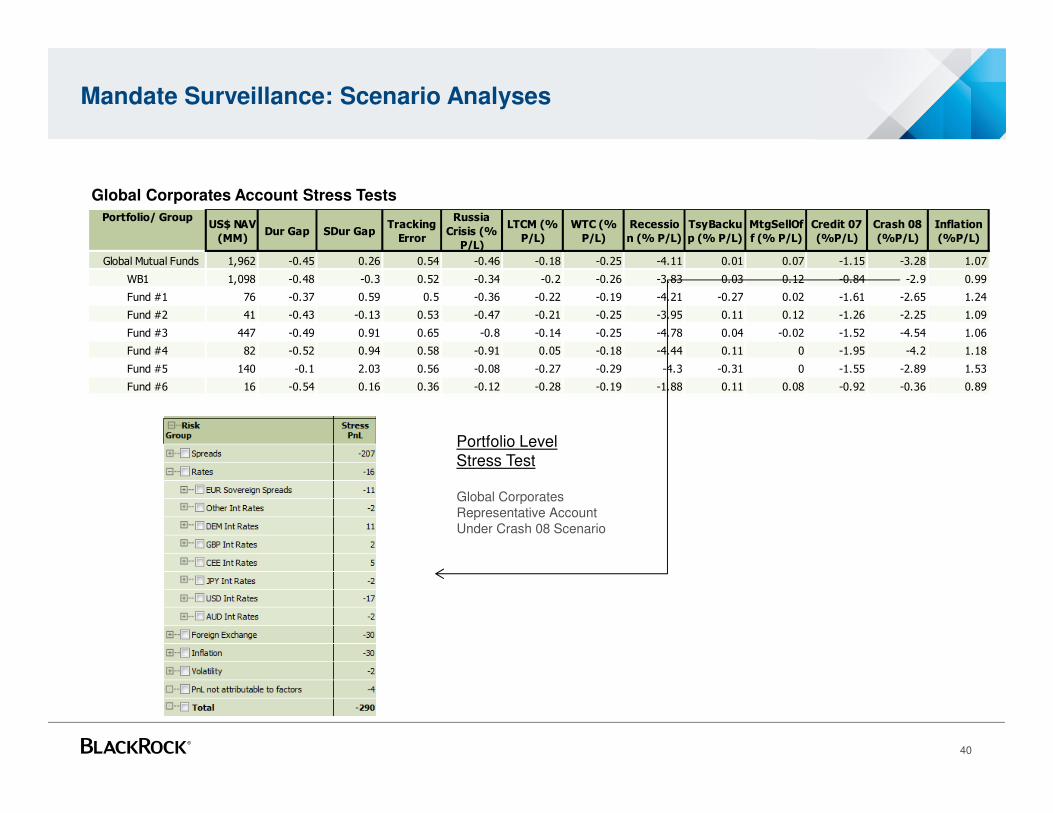
Portfolio/ GroupUS$ NAV
(MM)Dur Gap SDur Gap
Tracking
Error
Russia
Crisis (%
P/L)
LTCM (%
P/L)
WTC (%
P/L)
Recessio
n (% P/L)
TsyBacku
p (% P/L)
MtgSellOf
f (% P/L)
Credit 07
(%P/L)
Crash 08
(%P/L)
Inflation
(%P/L)
Global Mutual Funds 1,962 -0.45 0.26 0.54 -0.46 -0.18 -0.25 -4.11 0.01 0.07 -1.15 -3.28 1.07
WB1 1,098 -0.48 -0.3 0.52 -0.34 -0.2 -0.26 -3.83 0.03 0.12 -0.84 -2.9 0.99
Fund #1 76 -0.37 0.59 0.5 -0.36 -0.22 -0.19 -4.21 -0.27 0.02 -1.61 -2.65 1.24
Fund #2 41 -0.43 -0.13 0.53 -0.47 -0.21 -0.25 -3.95 0.11 0.12 -1.26 -2.25 1.09
Fund #3 447 -0.49 0.91 0.65 -0.8 -0.14 -0.25 -4.78 0.04 -0.02 -1.52 -4.54 1.06
Fund #4 82 -0.52 0.94 0.58 -0.91 0.05 -0.18 -4.44 0.11 0 -1.95 -4.2 1.18
Fund #5 140 -0.1 2.03 0.56 -0.08 -0.27 -0.29 -4.3 -0.31 0 -1.55 -2.89 1.53
Fund #6 16 -0.54 0.16 0.36 -0.12 -0.28 -0.19 -1.88 0.11 0.08 -0.92 -0.36 0.89
Mandate Surveillance: Scenario Analyses
Global Corporates Account Stress Tests
Portfolio Level Stress Test
Global Corporates Representative AccountUnder Crash 08 Scenario
40

Portfolio/ GroupUS$ NAV
(MM)Dur Gap SDur Gap
Tracking
Error
Russia
Crisis (%
P/L)
LTCM (%
P/L)
WTC (%
P/L)
Recessio
n (% P/L)
TsyBacku
p (% P/L)
MtgSellOf
f (% P/L)
Credit 07
(%P/L)
Crash 08
(%P/L)
Inflation
(%P/L)
Global Mutual Funds 1,962 -0.45 0.26 0.54 -0.46 -0.18 -0.25 -4.11 0.01 0.07 -1.15 -3.28 1.07
WB1 1,098 -0.48 -0.3 0.52 -0.34 -0.2 -0.26 -3.83 0.03 0.12 -0.84 -2.9 0.99
Fund #1 76 -0.37 0.59 0.5 -0.36 -0.22 -0.19 -4.21 -0.27 0.02 -1.61 -2.65 1.24
Fund #2 41 -0.43 -0.13 0.53 -0.47 -0.21 -0.25 -3.95 0.11 0.12 -1.26 -2.25 1.09
Fund #3 447 -0.49 0.91 0.65 -0.8 -0.14 -0.25 -4.78 0.04 -0.02 -1.52 -4.54 1.06
Fund #4 82 -0.52 0.94 0.58 -0.91 0.05 -0.18 -4.44 0.11 0 -1.95 -4.2 1.18
Fund #5 140 -0.1 2.03 0.56 -0.08 -0.27 -0.29 -4.3 -0.31 0 -1.55 -2.89 1.53
Fund #6 16 -0.54 0.16 0.36 -0.12 -0.28 -0.19 -1.88 0.11 0.08 -0.92 -0.36 0.89
Mandate Surveillance: Scenario Analyses
Global Corporates Account Stress Tests
Portfolio Level Stress Test
Global Corporates Representative AccountUnder Crash 08 Scenario
41

Appendix
D. Market Outlook
Four Themes for ’14 – Summary
43
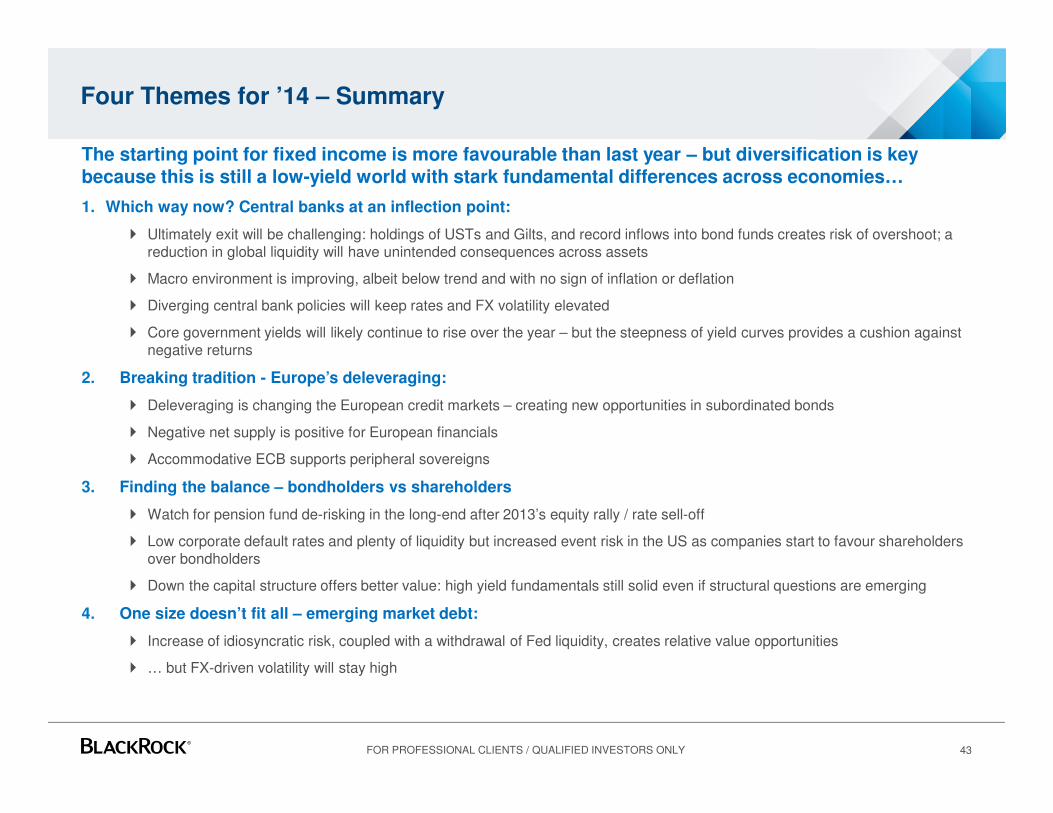
The starting point for fixed income is more favourable than last year – but diversification is key because this is still a low-yield world with stark fundamental differences across economies…
1. Which way now? Central banks at an inflection point:
� Ultimately exit will be challenging: holdings of USTs and Gilts, and record inflows into bond funds creates risk of overshoot; a reduction in global liquidity will have unintended consequences across assets
� Macro environment is improving, albeit below trend and with no sign of inflation or deflation
� Diverging central bank policies will keep rates and FX volatility elevated
� Core government yields will likely continue to rise over the year – but the steepness of yield curves provides a cushion against negative returns
2. Breaking tradition - Europe’s deleveraging:
� Deleveraging is changing the European credit markets – creating new opportunities in subordinated bonds
� Negative net supply is positive for European financials
� Accommodative ECB supports peripheral sovereigns
3. Finding the balance – bondholders vs shareholders
� Watch for pension fund de-risking in the long-end after 2013’s equity rally / rate sell-off
� Low corporate default rates and plenty of liquidity but increased event risk in the US as companies start to favour shareholdersover bondholders
� Down the capital structure offers better value: high yield fundamentals still solid even if structural questions are emerging
4. One size doesn’t fit all – emerging market debt:
� Increase of idiosyncratic risk, coupled with a withdrawal of Fed liquidity, creates relative value opportunities
� … but FX-driven volatility will stay high
FOR PROFESSIONAL CLIENTS / QUALIFIED INVESTORS ONLY
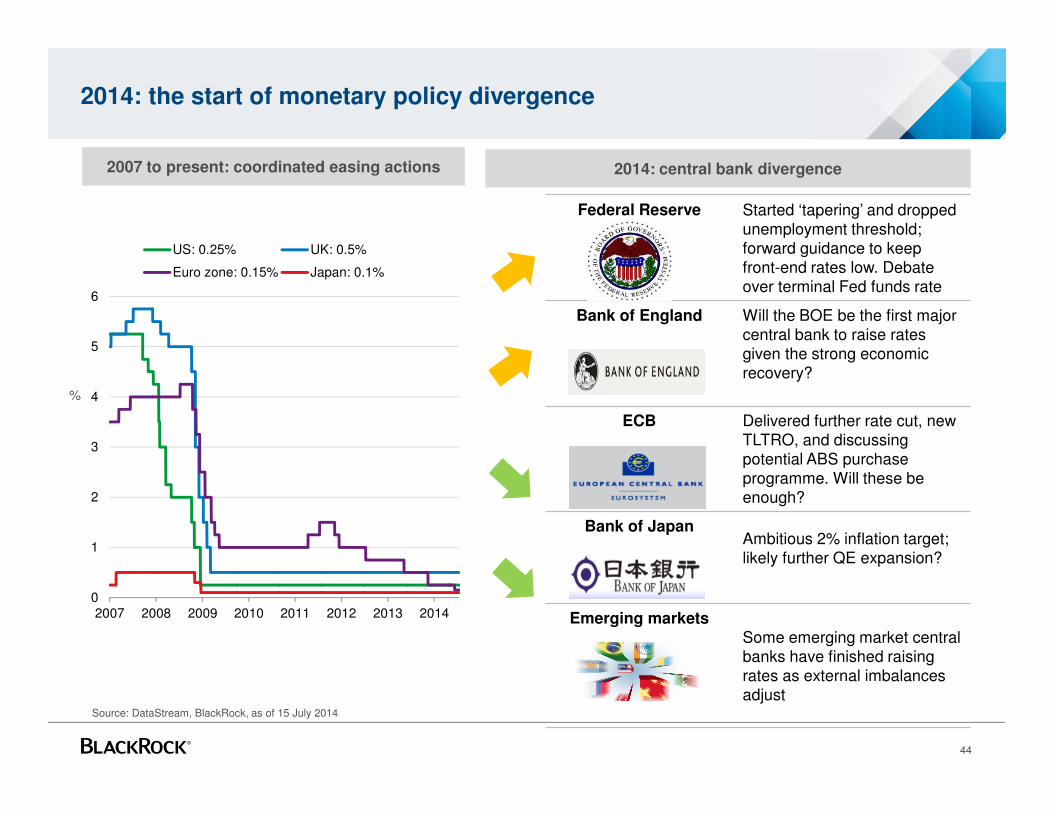
Federal Reserve Started ‘tapering’ and dropped unemployment threshold; forward guidance to keep front-end rates low. Debate over terminal Fed funds rate
Bank of England Will the BOE be the first majorcentral bank to raise rates given the strong economic recovery?
ECB Delivered further rate cut, new TLTRO, and discussing potential ABS purchase programme. Will these be enough?
Bank of JapanAmbitious 2% inflation target; likely further QE expansion?
Emerging marketsSome emerging market central banks have finished raising rates as external imbalances adjust
2014: the start of monetary policy divergence
44
Source: DataStream, BlackRock, as of 15 July 2014
2014: central bank divergence2007 to present: coordinated easing actions
%
0
1
2
3
4
5
6
2007 2008 2009 2010 2011 2012 2013 2014
US: 0.25% UK: 0.5%
Euro zone: 0.15% Japan: 0.1%

United States
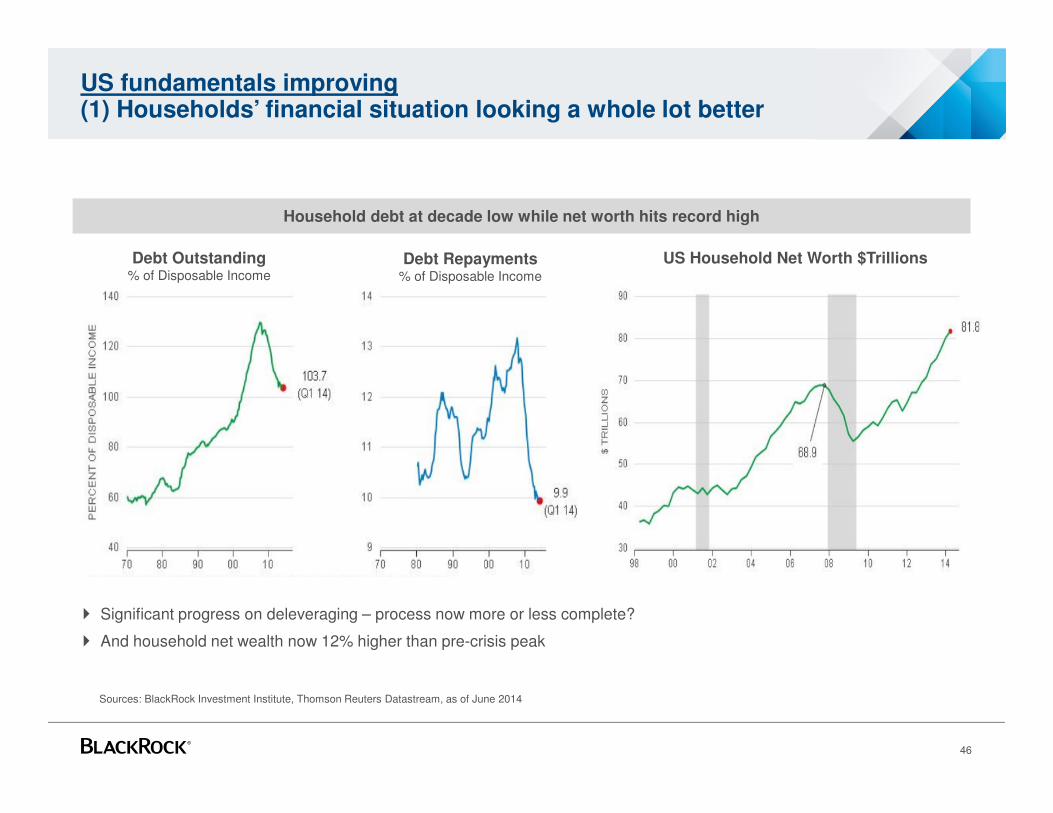
US fundamentals improving(1) Households’ financial situation looking a whole lot better
46
� Significant progress on deleveraging – process now more or less complete?
� And household net wealth now 12% higher than pre-crisis peak
Sources: BlackRock Investment Institute, Thomson Reuters Datastream, as of June 2014
Household debt at decade low while net worth hits record high
US Household Net Worth $TrillionsDebt Outstanding% of Disposable Income
Debt Repayments % of Disposable Income
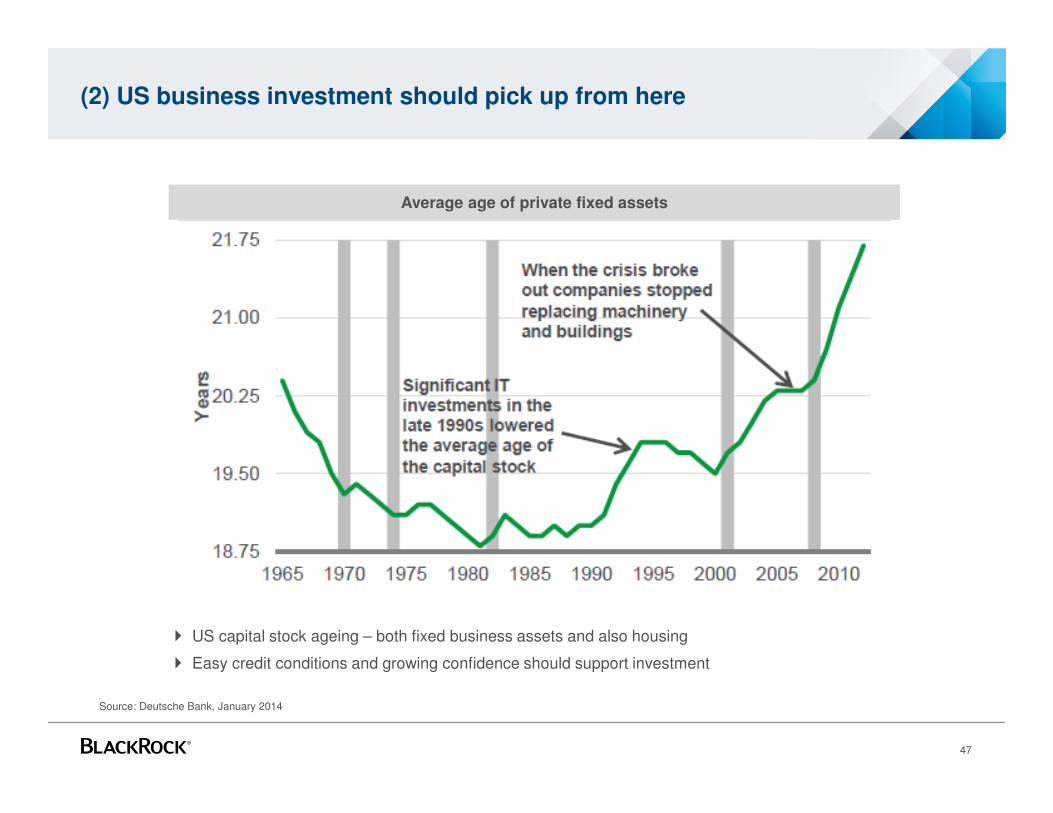
(2) US business investment should pick up from here
47
� US capital stock ageing – both fixed business assets and also housing
� Easy credit conditions and growing confidence should support investment
Source: Deutsche Bank, January 2014
Average age of private fixed assets
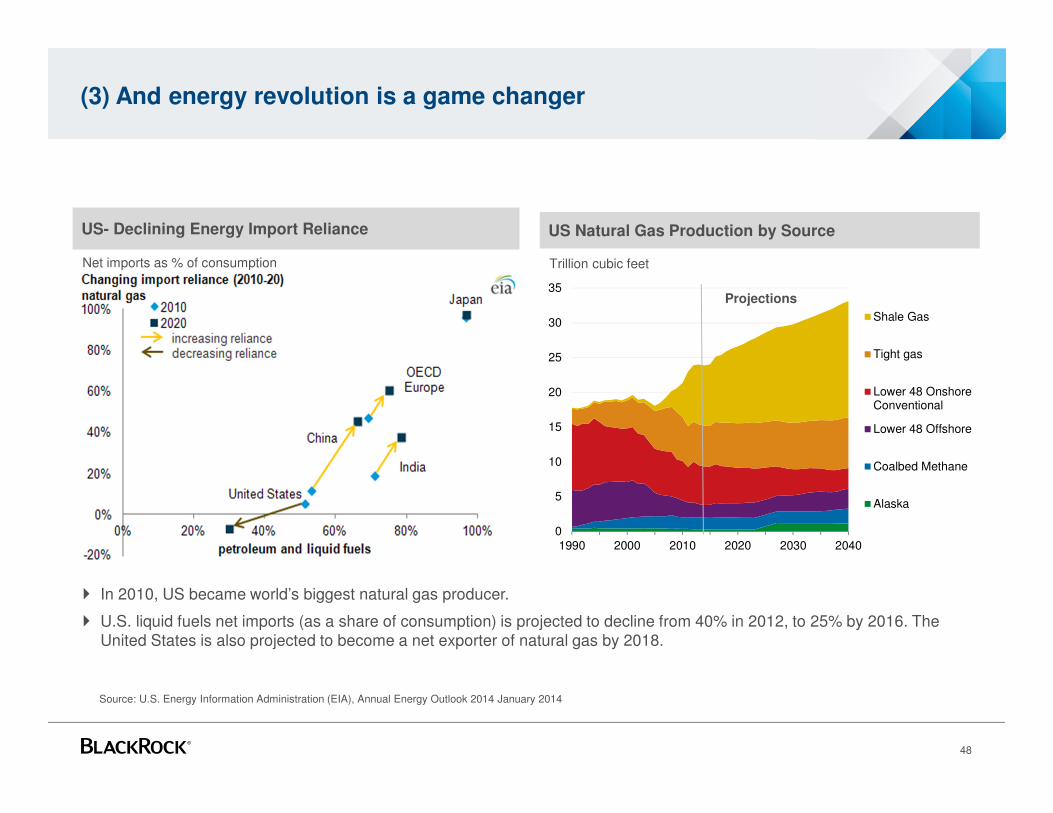
(3) And energy revolution is a game changer
48
� In 2010, US became world’s biggest natural gas producer.
� U.S. liquid fuels net imports (as a share of consumption) is projected to decline from 40% in 2012, to 25% by 2016. The United States is also projected to become a net exporter of natural gas by 2018.
Source: U.S. Energy Information Administration (EIA), Annual Energy Outlook 2014 January 2014
US- Declining Energy Import Reliance US Natural Gas Production by Source
Net imports as % of consumption
0
5
10
15
20
25
30
35
1990 2000 2010 2020 2030 2040
Shale Gas
Tight gas
Lower 48 OnshoreConventional
Lower 48 Offshore
Coalbed Methane
Alaska
Projections
Trillion cubic feet
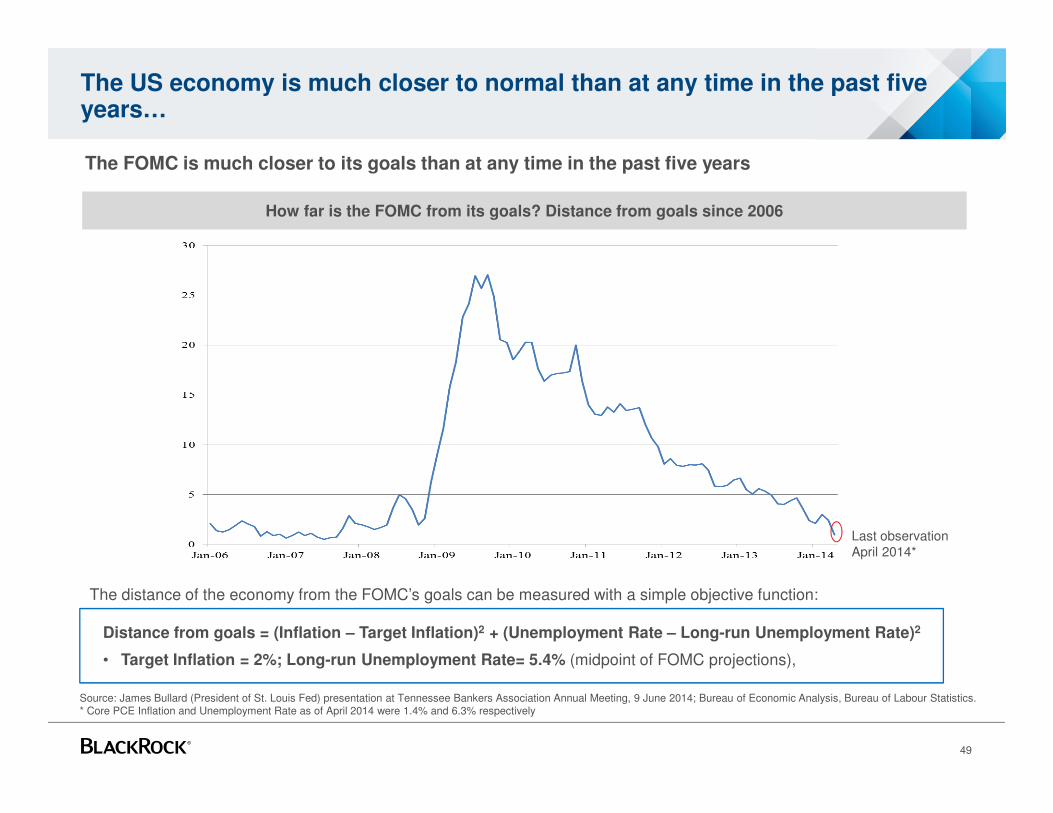
The US economy is much closer to normal than at any time in the past five years…
49
Source: James Bullard (President of St. Louis Fed) presentation at Tennessee Bankers Association Annual Meeting, 9 June 2014; Bureau of Economic Analysis, Bureau of Labour Statistics.* Core PCE Inflation and Unemployment Rate as of April 2014 were 1.4% and 6.3% respectively
The FOMC is much closer to its goals than at any time in the past five years
Distance from goals = (Inflation – Target Inflation)2 + (Unemployment Rate – Long-run Unemployment Rate)2
• Target Inflation = 2%; Long-run Unemployment Rate= 5.4% (midpoint of FOMC projections),
How far is the FOMC from its goals? Distance from goals since 2006
Last observation April 2014*
The distance of the economy from the FOMC’s goals can be measured with a simple objective function:
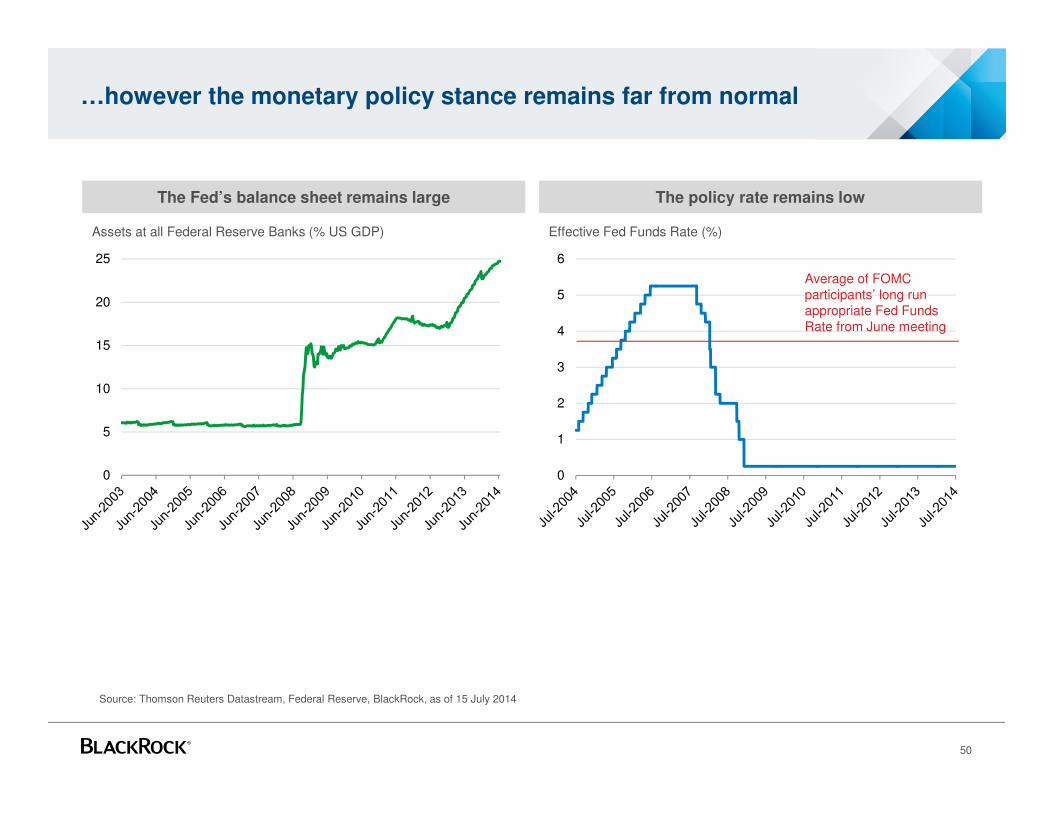
…however the monetary policy stance remains far from normal
50
The Fed’s balance sheet remains large The policy rate remains low
0
5
10
15
20
25
Assets at all Federal Reserve Banks (% US GDP) Effective Fed Funds Rate (%)
0
1
2
3
4
5
6
Average of FOMC participants’ long run appropriate Fed Funds Rate from June meeting
Source: Thomson Reuters Datastream, Federal Reserve, BlackRock, as of 15 July 2014
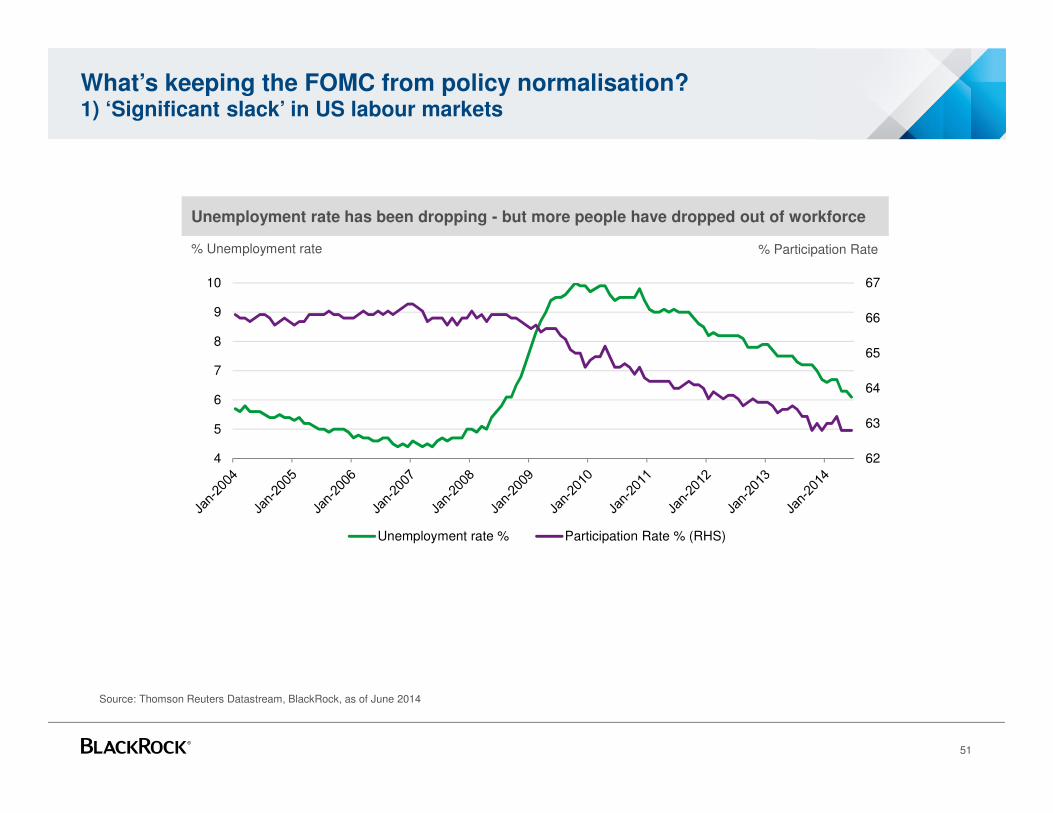
What’s keeping the FOMC from policy normalisation?1) ‘Significant slack’ in US labour markets
51
Unemployment rate has been dropping - but more people have dropped out of workforce
62
63
64
65
66
67
4
5
6
7
8
9
10
Unemployment rate % Participation Rate % (RHS)
% Participation Rate% Unemployment rate
Source: Thomson Reuters Datastream, BlackRock, as of June 2014
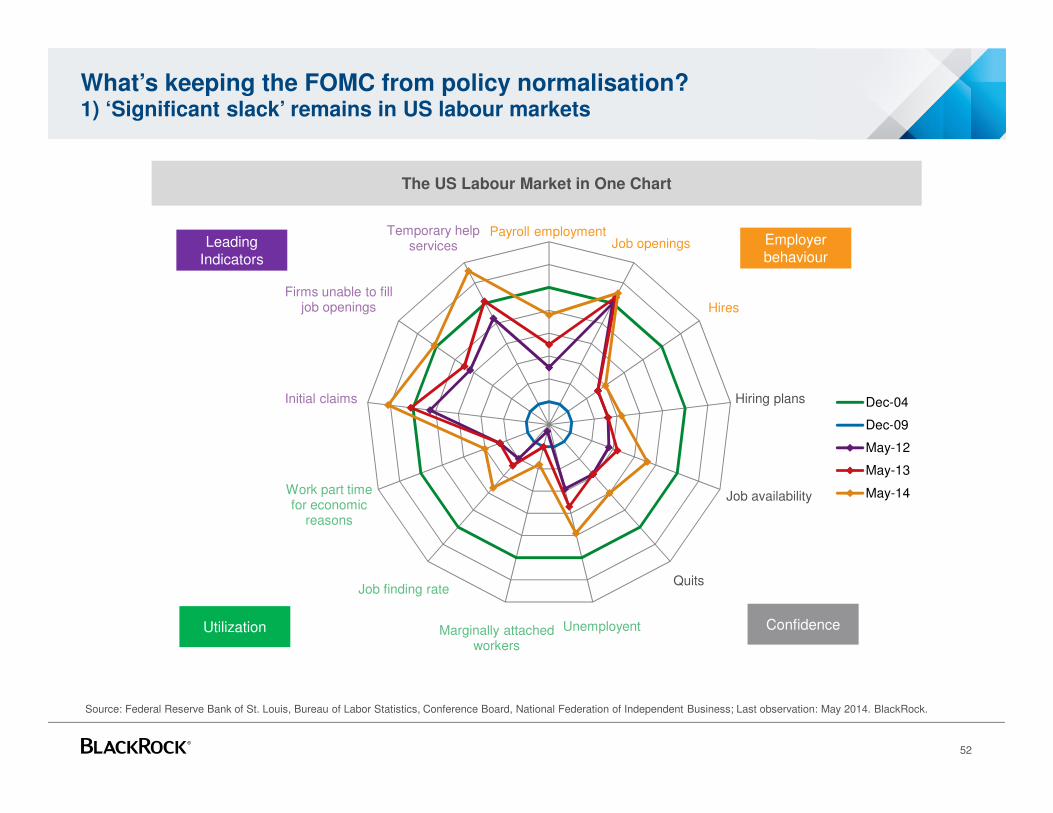
What’s keeping the FOMC from policy normalisation?1) ‘Significant slack’ remains in US labour markets
52
The US Labour Market in One Chart
Payroll employmentJob openings
Hires
Hiring plans
Job availability
Quits
UnemployentMarginally attachedworkers
Job finding rate
Work part timefor economic
reasons
Initial claims
Firms unable to filljob openings
Temporary helpservices
Dec-04
Dec-09
May-12
May-13
May-14
Leading Indicators
Employer behaviour
Utilization Confidence
Source: Federal Reserve Bank of St. Louis, Bureau of Labor Statistics, Conference Board, National Federation of Independent Business; Last observation: May 2014. BlackRock.
0.00
0.50
1.00
1.50
2.00
2.50
Mar-12 Jun-12 Sep-12 Dec-12 Mar-13 Jun-13 Sep-13 Dec-13 Mar-14
% c
hg
Headline PCE Core PCE
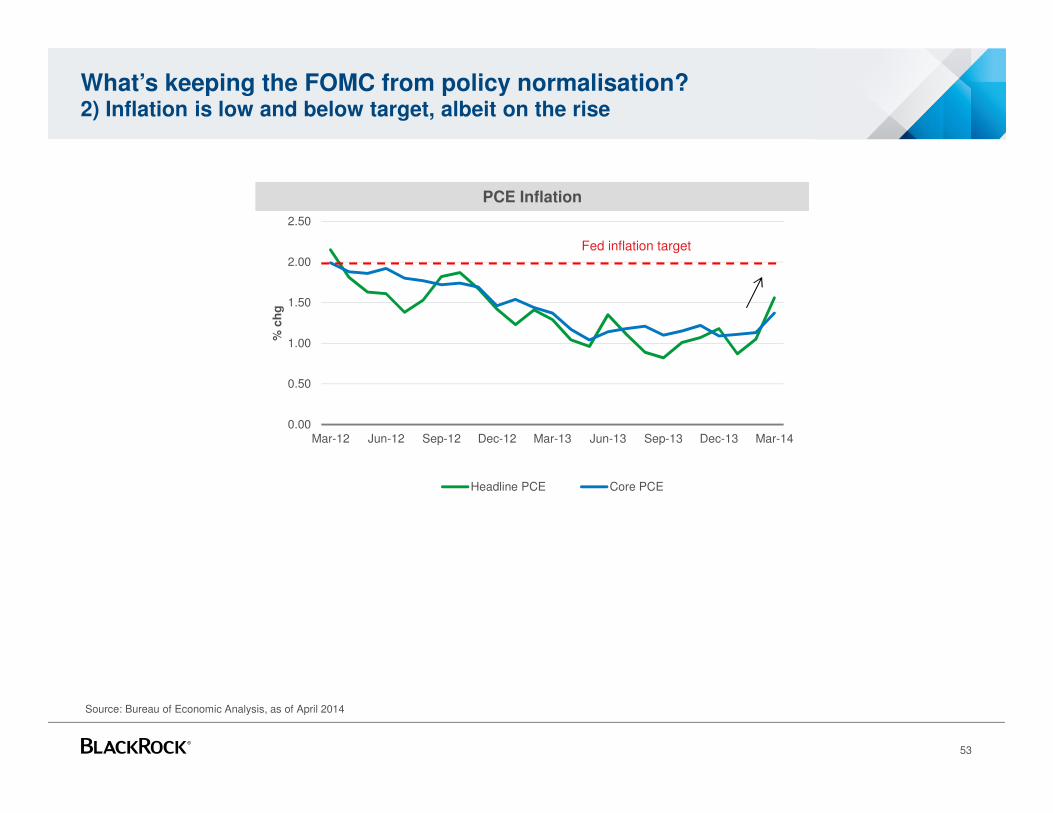
What’s keeping the FOMC from policy normalisation?2) Inflation is low and below target, albeit on the rise
53
PCE Inflation
Source: Bureau of Economic Analysis, as of April 2014
Fed inflation target
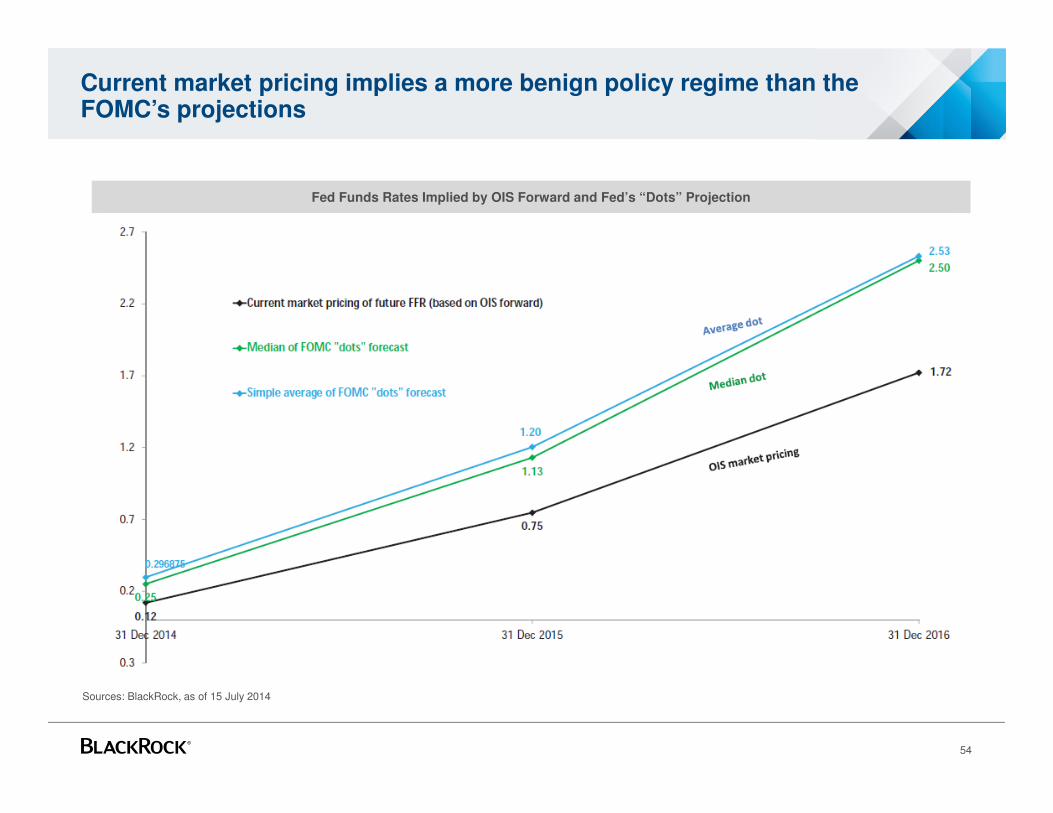
Current market pricing implies a more benign policy regime than the FOMC’s projections
54
Sources: BlackRock, as of 15 July 2014
Fed Funds Rates Implied by OIS Forward and Fed’s “Dots” Projection
0%
10%
20%
30%
40%
50%
60%
70%
80%
20
15-0
8-1
520
16-0
1-3
120
16-0
4-3
020
16-0
7-3
120
16-1
1-1
520
17-0
2-2
820
17-0
6-3
020
17-0
9-3
020
18-0
1-3
120
18-0
5-1
520
18-0
9-3
020
19-0
1-3
120
19-0
4-3
020
19-0
9-3
020
20-0
3-3
120
20-0
8-3
120
21-0
2-2
820
21-1
1-1
520
23-0
2-1
520
25-0
8-1
520
29-0
2-1
520
39-0
2-1
520
41-0
5-1
520
43-0
8-1
5
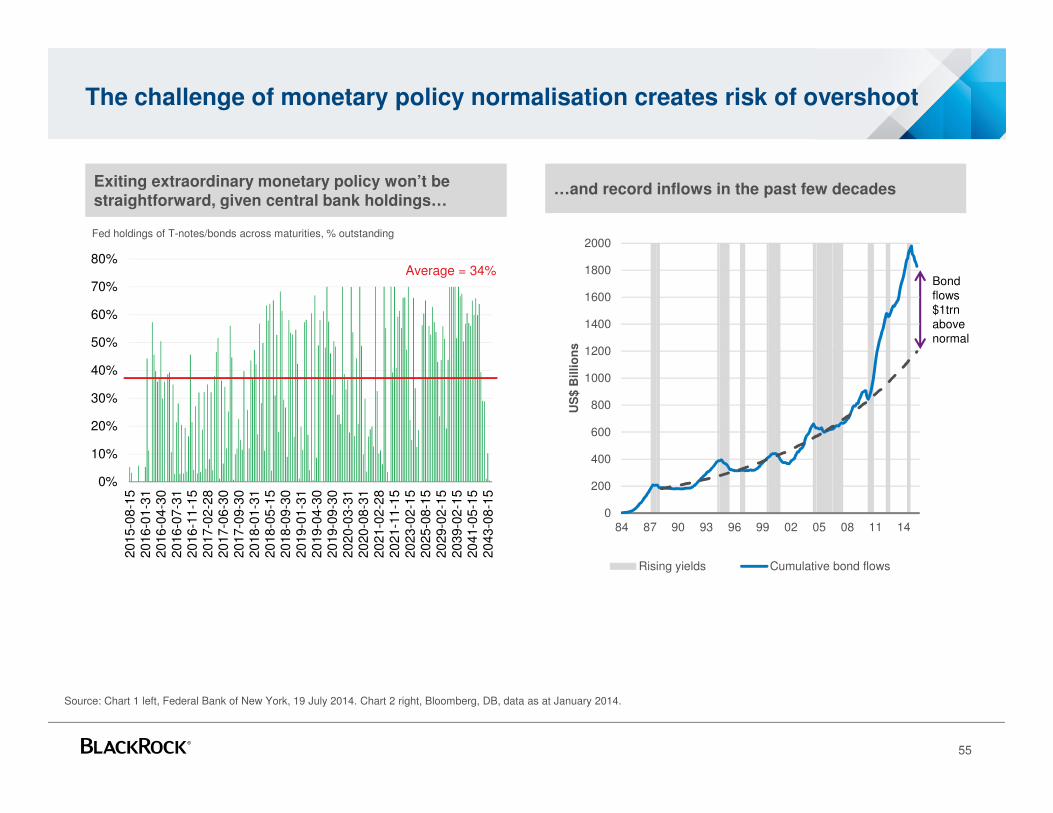
Source: Chart 1 left, Federal Bank of New York, 19 July 2014. Chart 2 right, Bloomberg, DB, data as at January 2014.
The challenge of monetary policy normalisation creates risk of overshoot
55
Exiting extraordinary monetary policy won’t be straightforward, given central bank holdings…
…and record inflows in the past few decades
0
200
400
600
800
1000
1200
1400
1600
1800
2000
84 87 90 93 96 99 02 05 08 11 14
US
$ B
illi
on
sRising yields Cumulative bond flows
Bond flows $1trn above normal
Fed holdings of T-notes/bonds across maturities, % outstanding
Average = 34%

Europe
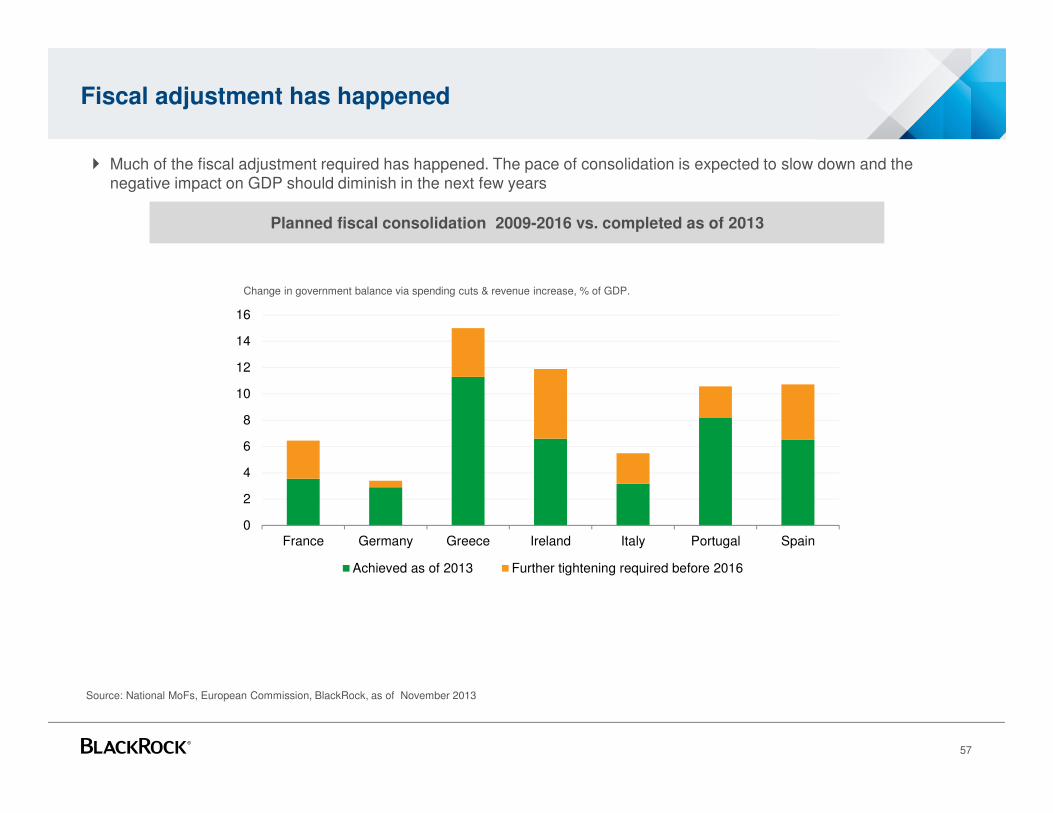
Fiscal adjustment has happened
57
Source: National MoFs, European Commission, BlackRock, as of November 2013
Planned fiscal consolidation 2009-2016 vs. completed as of 2013
0
2
4
6
8
10
12
14
16
France Germany Greece Ireland Italy Portugal Spain
Achieved as of 2013 Further tightening required before 2016
Change in government balance via spending cuts & revenue increase, % of GDP.
� Much of the fiscal adjustment required has happened. The pace of consolidation is expected to slow down and the negative impact on GDP should diminish in the next few years
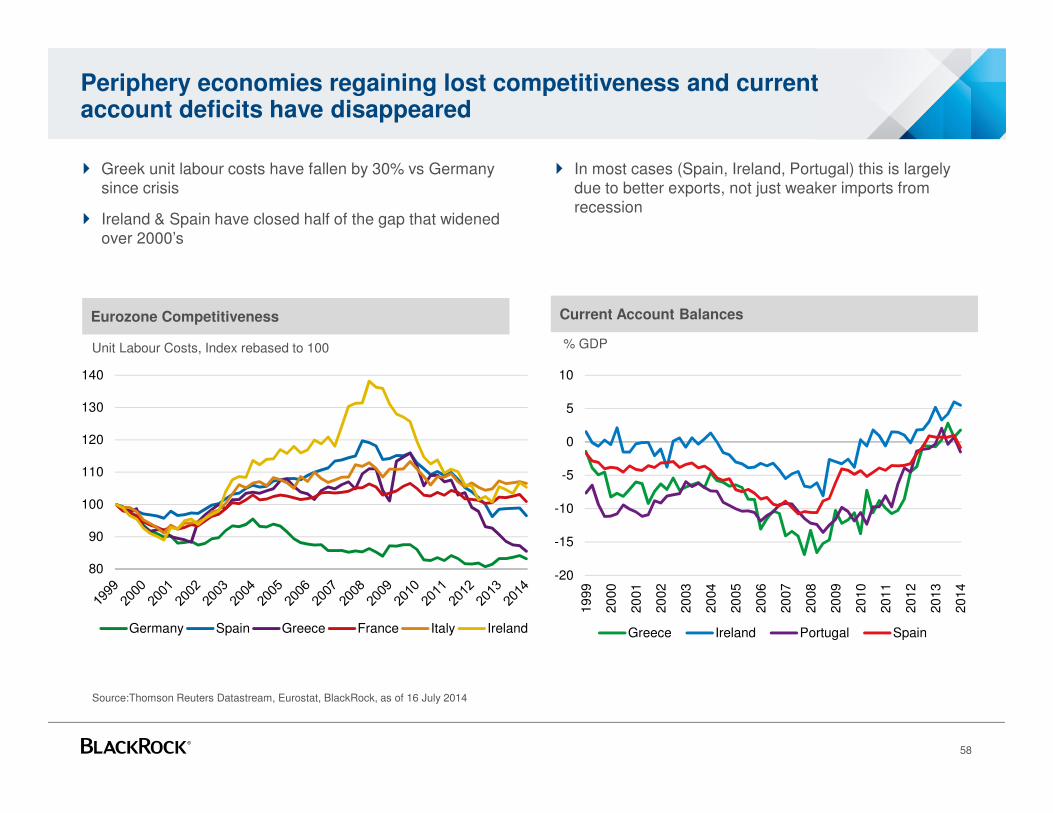
Periphery economies regaining lost competitiveness and current account deficits have disappeared
58
� Greek unit labour costs have fallen by 30% vs Germany since crisis
� Ireland & Spain have closed half of the gap that widened over 2000’s
� In most cases (Spain, Ireland, Portugal) this is largely due to better exports, not just weaker imports from recession
Eurozone Competitiveness Current Account Balances
Unit Labour Costs, Index rebased to 100
Source:Thomson Reuters Datastream, Eurostat, BlackRock, as of 16 July 2014
80
90
100
110
120
130
140
Germany Spain Greece France Italy Ireland
-20
-15
-10
-5
0
5
10
19
99
20
00
20
01
20
02
20
03
20
04
20
05
20
06
20
07
20
08
20
09
20
10
20
11
20
12
20
13
20
14
Greece Ireland Portugal Spain
% GDP
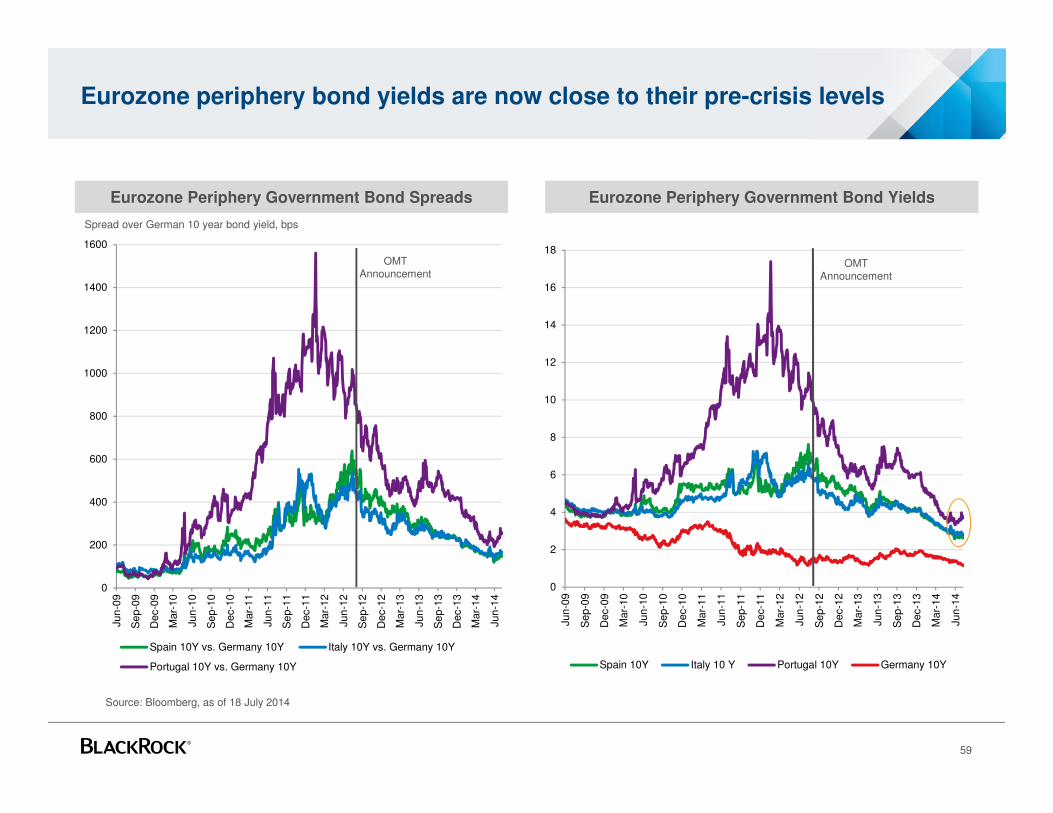
Eurozone periphery bond yields are now close to their pre-crisis levels
59
Eurozone Periphery Government Bond Spreads
Spread over German 10 year bond yield, bps
Source: Bloomberg, as of 18 July 2014
Eurozone Periphery Government Bond Yields
0
200
400
600
800
1000
1200
1400
1600
Jun
-09
Se
p-0
9
Dec-0
9
Mar-
10
Jun
-10
Se
p-1
0
Dec-1
0
Mar-
11
Jun
-11
Se
p-1
1
Dec-1
1
Mar-
12
Jun
-12
Se
p-1
2
Dec-1
2
Mar-
13
Jun
-13
Se
p-1
3
Dec-1
3
Mar-
14
Jun
-14
Spain 10Y vs. Germany 10Y Italy 10Y vs. Germany 10Y
Portugal 10Y vs. Germany 10Y
0
2
4
6
8
10
12
14
16
18
Jun
-09
Se
p-0
9
Dec-0
9
Mar-
10
Jun
-10
Se
p-1
0
Dec-1
0
Mar-
11
Jun
-11
Se
p-1
1
Dec-1
1
Mar-
12
Jun
-12
Se
p-1
2
Dec-1
2
Mar-
13
Jun
-13
Se
p-1
3
Dec-1
3
Mar-
14
Jun
-14
Spain 10Y Italy 10 Y Portugal 10Y Germany 10Y
OMT Announcement
OMT Announcement
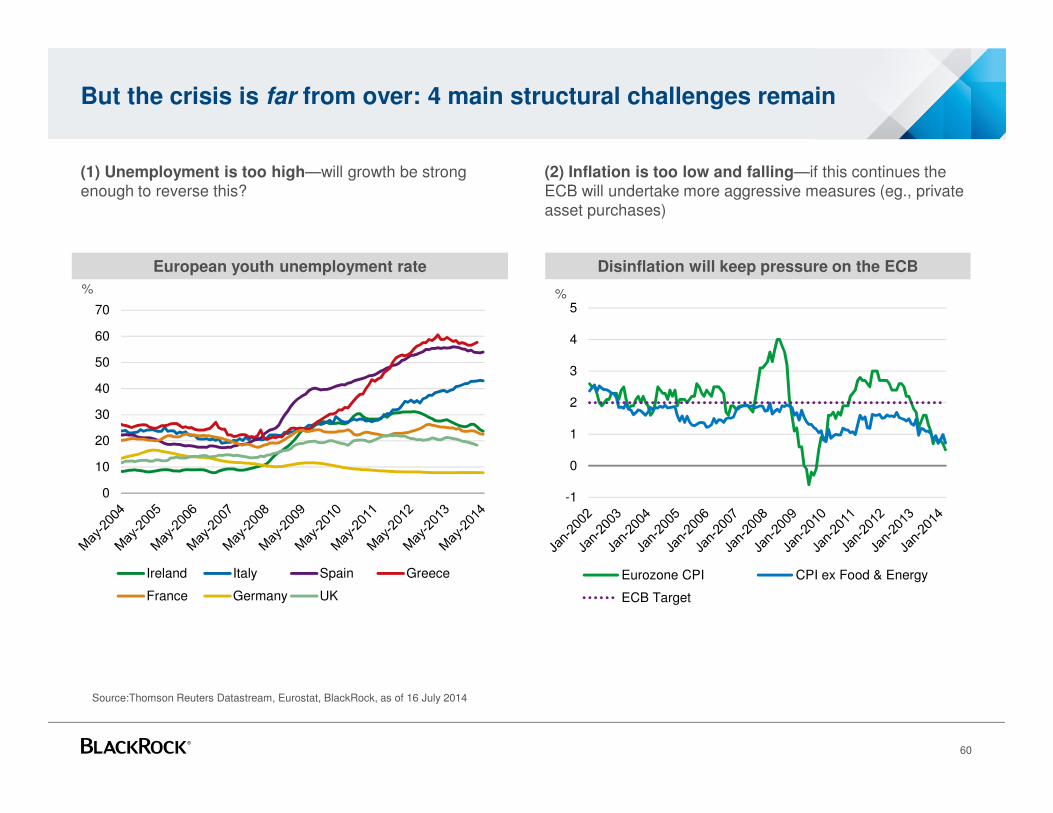
(1) Unemployment is too high—will growth be strong enough to reverse this?
(2) Inflation is too low and falling—if this continues the ECB will undertake more aggressive measures (eg., private asset purchases)
But the crisis is far from over: 4 main structural challenges remain
60
European youth unemployment rate Disinflation will keep pressure on the ECB
-1
0
1
2
3
4
5
Eurozone CPI CPI ex Food & Energy
ECB Target
Source:Thomson Reuters Datastream, Eurostat, BlackRock, as of 16 July 2014
0
10
20
30
40
50
60
70
Ireland Italy Spain Greece
France Germany UK
% %
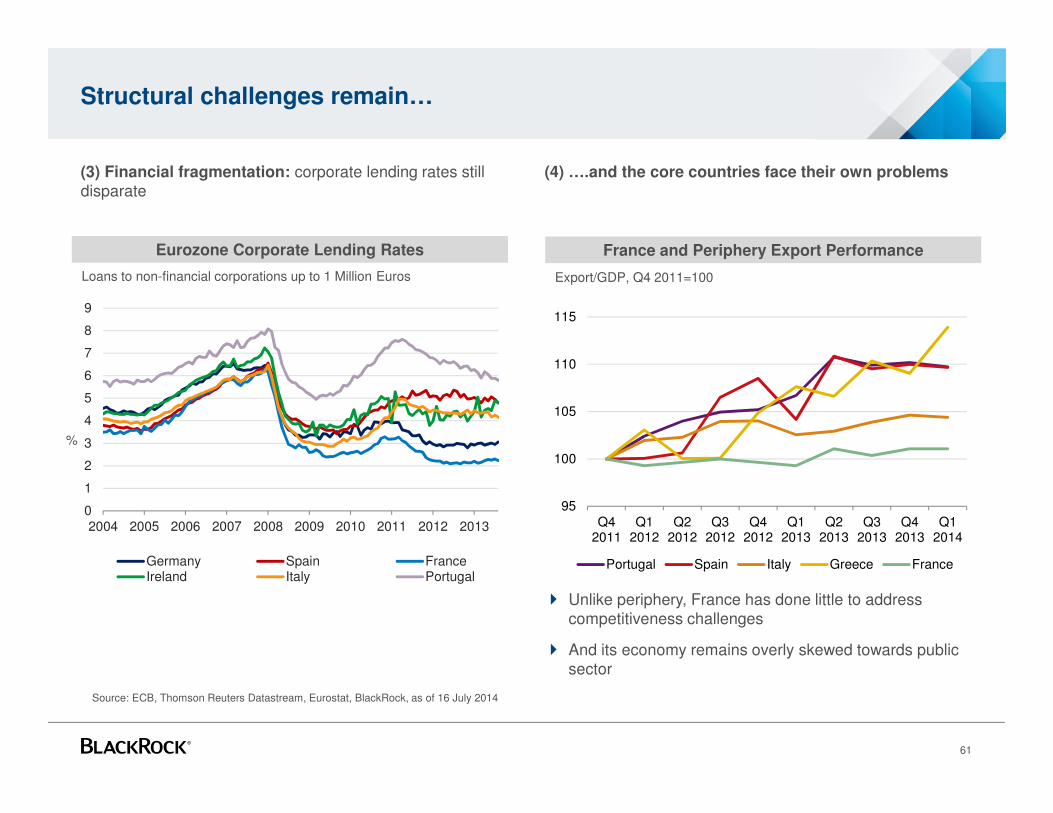
(3) Financial fragmentation: corporate lending rates still disparate
(4) ….and the core countries face their own problems
Structural challenges remain…
61
� Unlike periphery, France has done little to address competitiveness challenges
� And its economy remains overly skewed towards public sector
Eurozone Corporate Lending Rates France and Periphery Export Performance
Source: ECB, Thomson Reuters Datastream, Eurostat, BlackRock, as of 16 July 2014
0
1
2
3
4
5
6
7
8
9
2004 2005 2006 2007 2008 2009 2010 2011 2012 2013
Germany Spain FranceIreland Italy Portugal
Loans to non-financial corporations up to 1 Million Euros
%
95
100
105
110
115
Q42011
Q12012
Q22012
Q32012
Q42012
Q12013
Q22013
Q32013
Q42013
Q12014
Portugal Spain Italy Greece France
Export/GDP, Q4 2011=100
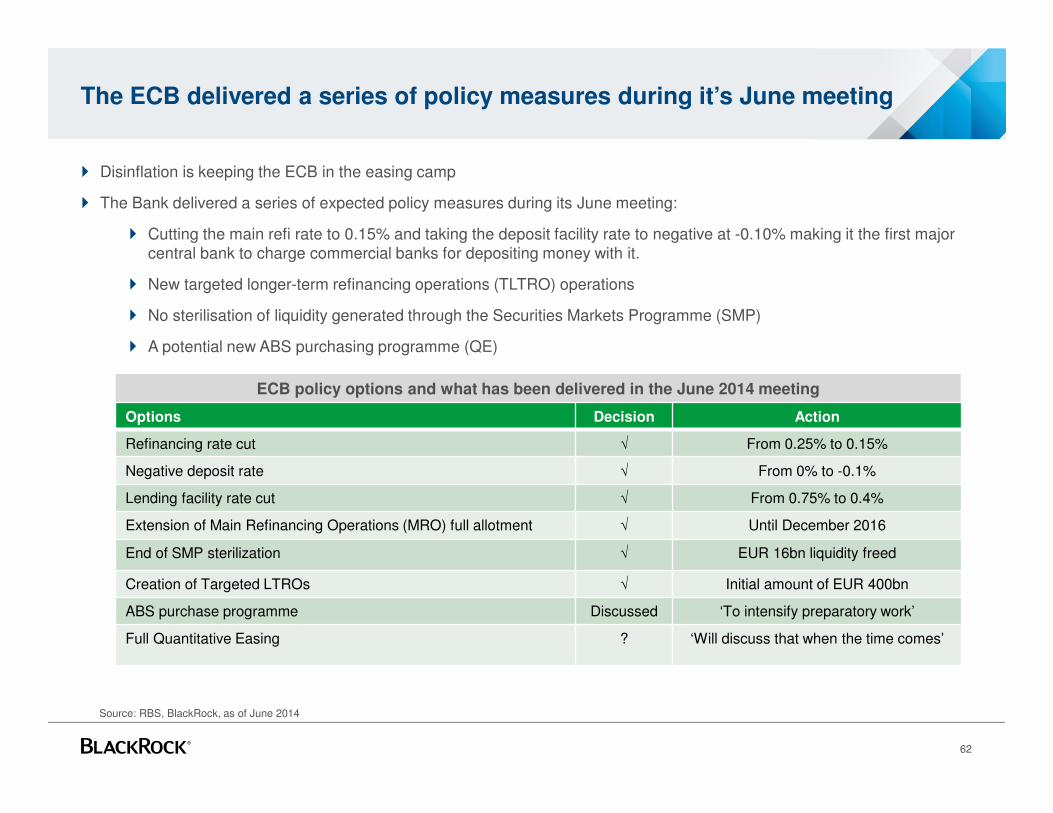
The ECB delivered a series of policy measures during it’s June meeting
� Disinflation is keeping the ECB in the easing camp
� The Bank delivered a series of expected policy measures during its June meeting:
� Cutting the main refi rate to 0.15% and taking the deposit facility rate to negative at -0.10% making it the first major central bank to charge commercial banks for depositing money with it.
� New targeted longer-term refinancing operations (TLTRO) operations
� No sterilisation of liquidity generated through the Securities Markets Programme (SMP)
� A potential new ABS purchasing programme (QE)
62
ECB policy options and what has been delivered in the June 2014 meeting
Source: RBS, BlackRock, as of June 2014
Options Decision Action
Refinancing rate cut √ From 0.25% to 0.15%
Negative deposit rate √ From 0% to -0.1%
Lending facility rate cut √ From 0.75% to 0.4%
Extension of Main Refinancing Operations (MRO) full allotment √ Until December 2016
End of SMP sterilization √ EUR 16bn liquidity freed
Creation of Targeted LTROs √ Initial amount of EUR 400bn
ABS purchase programme Discussed ‘To intensify preparatory work’
Full Quantitative Easing ? ‘Will discuss that when the time comes’
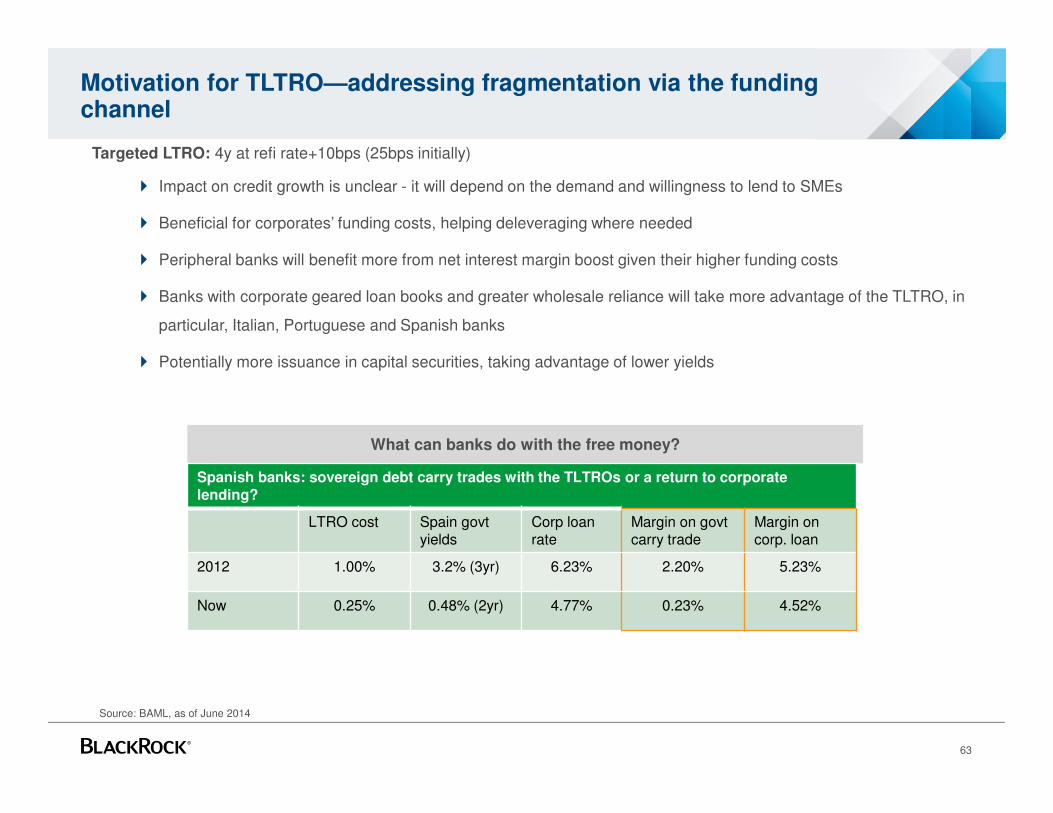
Targeted LTRO: 4y at refi rate+10bps (25bps initially)
� Impact on credit growth is unclear - it will depend on the demand and willingness to lend to SMEs
� Beneficial for corporates’ funding costs, helping deleveraging where needed
� Peripheral banks will benefit more from net interest margin boost given their higher funding costs
� Banks with corporate geared loan books and greater wholesale reliance will take more advantage of the TLTRO, in
particular, Italian, Portuguese and Spanish banks
� Potentially more issuance in capital securities, taking advantage of lower yields
Motivation for TLTRO—addressing fragmentation via the funding channel
63
What can banks do with the free money?
Spanish banks: sovereign debt carry trades with the TLTROs or a return to corporate lending?
LTRO cost Spain govtyields
Corp loanrate
Margin on govtcarry trade
Margin on corp. loan
2012 1.00% 3.2% (3yr) 6.23% 2.20% 5.23%
Now 0.25% 0.48% (2yr) 4.77% 0.23% 4.52%
Source: BAML, as of June 2014
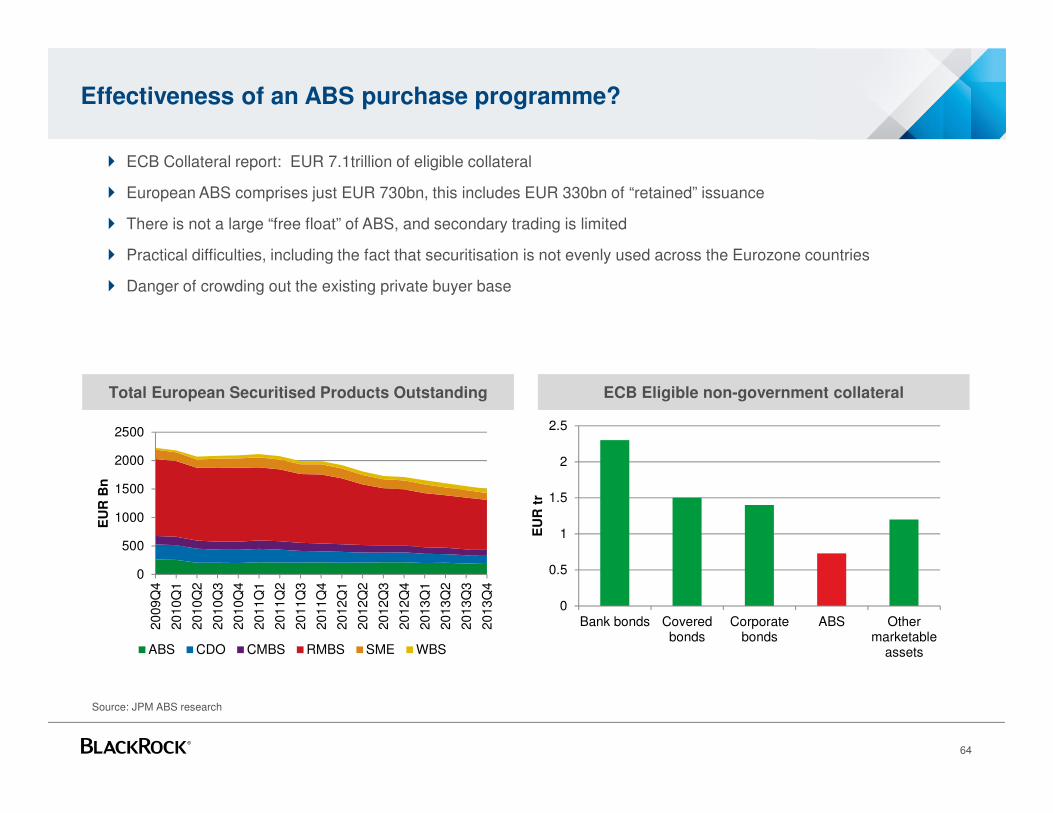
Effectiveness of an ABS purchase programme?
� ECB Collateral report: EUR 7.1trillion of eligible collateral
� European ABS comprises just EUR 730bn, this includes EUR 330bn of “retained” issuance
� There is not a large “free float” of ABS, and secondary trading is limited
� Practical difficulties, including the fact that securitisation is not evenly used across the Eurozone countries
� Danger of crowding out the existing private buyer base
64
Source: JPM ABS research
0
0.5
1
1.5
2
2.5
Bank bonds Coveredbonds
Corporatebonds
ABS Othermarketable
assets
EU
R t
r
ECB-eligible non govt collateral
0
500
1000
1500
2000
2500
20
09Q
4
20
10Q
1
20
10Q
2
20
10Q
3
20
10Q
4
20
11Q
1
20
11Q
2
20
11Q
3
20
11Q
4
20
12Q
1
20
12Q
2
20
12Q
3
20
12Q
4
20
13Q
1
20
13Q
2
20
13Q
3
20
13Q
4
EU
R B
n
ABS CDO CMBS RMBS SME WBS
ECB Eligible non-government collateralTotal European Securitised Products Outstanding
Impact of the ECB’s Asset Quality Review on European Banks
Asset Quality Review
� Assessment of collateral valuations and coverage levels
� Conducted by the ECB and national regulators, covering Eurozone banks representing 85% of Eurozone assets
� €3.72trillion of assets were selected, equivalent to 58% of total Risk-Weighted-Assets across the banks.
� Pass-mark: 8% Common Equity Tier 1 ratio
The ECB’s balance sheet assessment is generally credit positive for the European banking sector as it will enhance transparency, comparability and eventually strengthen banks’ solvency levels (ex-ante impact)
The exercise has already resulted in precautionary measures by some banks which have raised capital and improved their provision coverage.
65
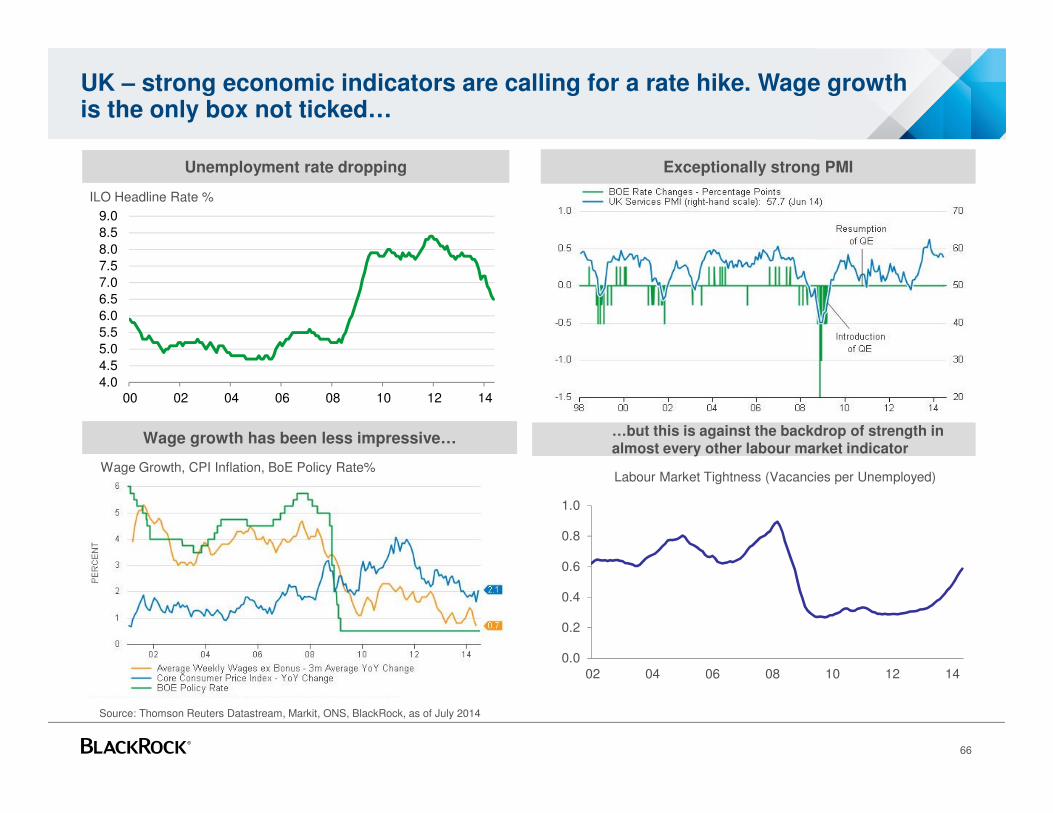
UK – strong economic indicators are calling for a rate hike. Wage growth is the only box not ticked…
66
…but this is against the backdrop of strength in almost every other labour market indicator
Unemployment rate dropping Exceptionally strong PMI
Wage growth has been less impressive…
Source: Thomson Reuters Datastream, Markit, ONS, BlackRock, as of July 2014
0.0
0.2
0.4
0.6
0.8
1.0
02 04 06 08 10 12 14
Labour Market Tightness (Vacancies per Unemployed)Wage Growth, CPI Inflation, BoE Policy Rate%
4.0
4.5
5.0
5.5
6.0
6.5
7.0
7.5
8.0
8.5
9.0
00 02 04 06 08 10 12 14
ILO Headline Rate %

Japan
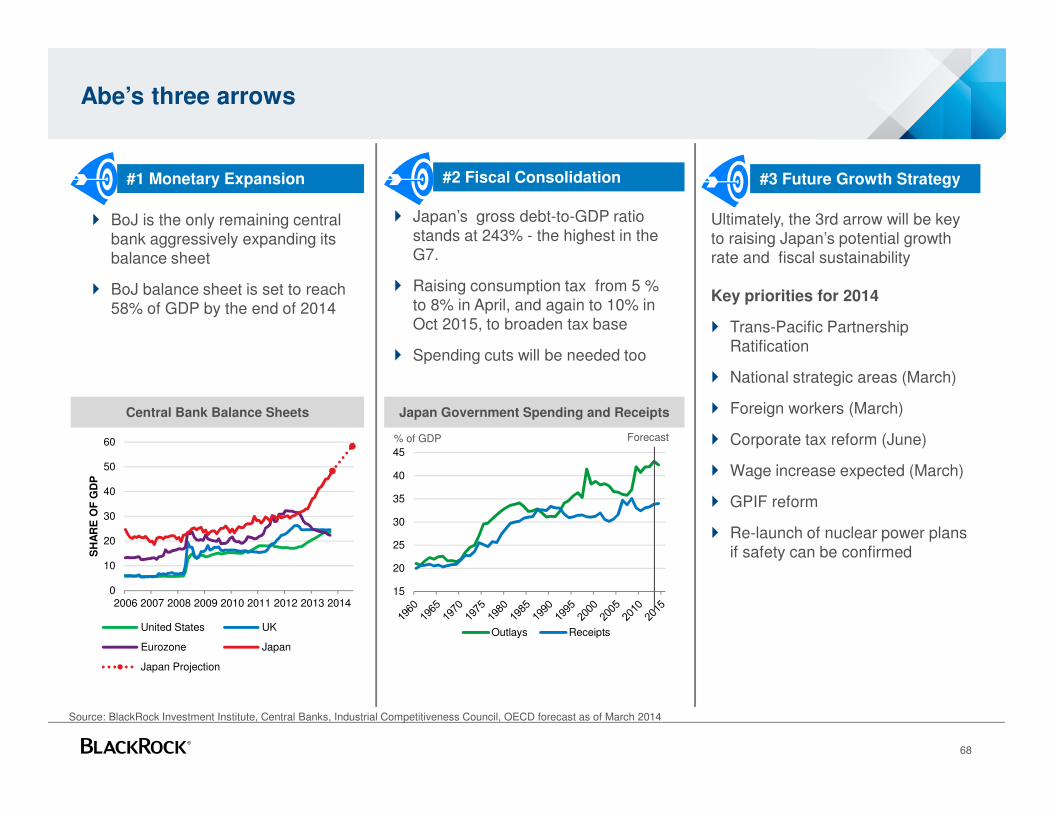
Abe’s three arrows
68
#1 Monetary Expansion #2 Fiscal Consolidation #3 Future Growth Strategy
� BoJ is the only remaining central bank aggressively expanding its balance sheet
� BoJ balance sheet is set to reach 58% of GDP by the end of 2014
� Japan’s gross debt-to-GDP ratio stands at 243% - the highest in the G7.
� Raising consumption tax from 5 % to 8% in April, and again to 10% in Oct 2015, to broaden tax base
� Spending cuts will be needed too
Source: BlackRock Investment Institute, Central Banks, Industrial Competitiveness Council, OECD forecast as of March 2014
Ultimately, the 3rd arrow will be key to raising Japan’s potential growth rate and fiscal sustainability
Key priorities for 2014
� Trans-Pacific Partnership Ratification
� National strategic areas (March)
� Foreign workers (March)
� Corporate tax reform (June)
� Wage increase expected (March)
� GPIF reform
� Re-launch of nuclear power plans if safety can be confirmed
0
10
20
30
40
50
60
2006 2007 2008 2009 2010 2011 2012 2013 2014
SH
AR
E O
F G
DP
United States UK
Eurozone Japan
Japan Projection
Central Bank Balance Sheets Japan Government Spending and Receipts
15
20
25
30
35
40
45
Outlays Receipts
% of GDP Forecast
70
80
90
100
110
-1.0
-0.5
0.0
0.5
1.0
1.5
2.0
2.5
Core CPI YoY% Yen per $
-5.0
-4.0
-3.0
-2.0
-1.0
0.0
1.0
2.0
Jan
-11
Mar-
11
May-
11
Jul-1
1
Se
p-1
1
Nov-1
1
Jan
-12
Mar-
12
May-
12
Jul-1
2
Se
p-1
2
Nov-1
2
Jan
-13
Mar-
13
May-
13
Jul-1
3
Se
p-1
3
Nov-1
3
Jan
-14
Mar-
14
May-
14
Cash Earnings Growth (YoY%) Real Wage Growth (YoY%)
BoJ forecasts:**
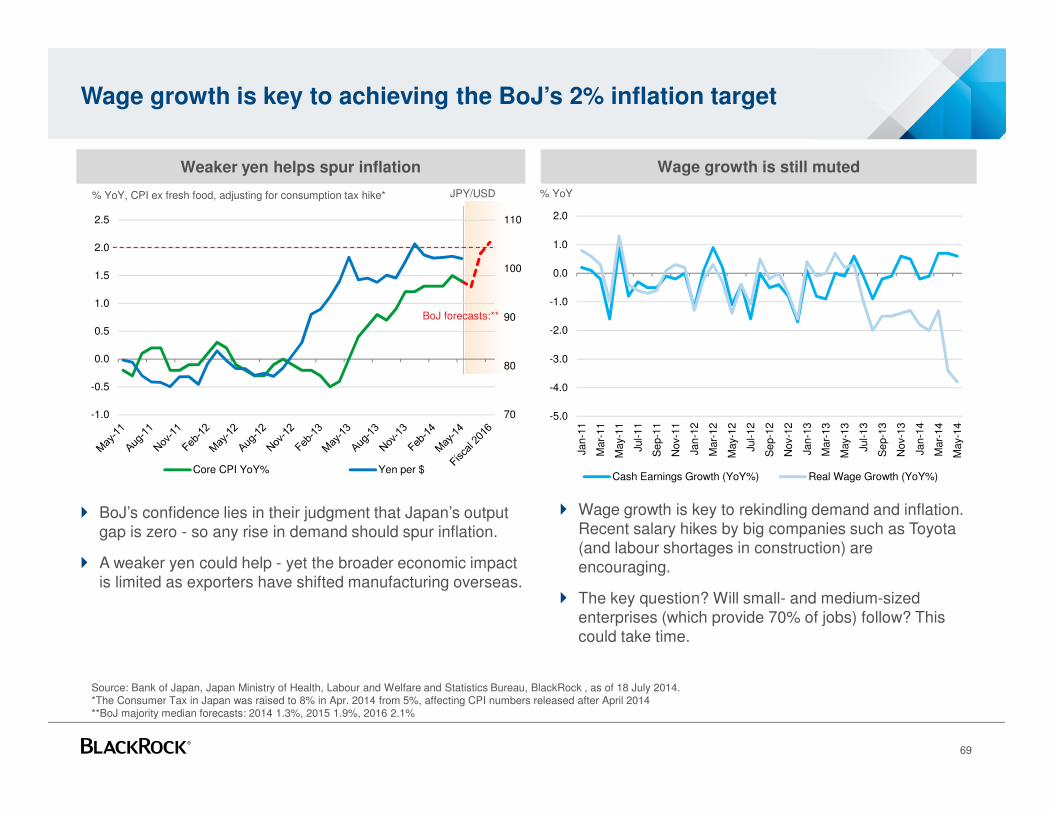
Wage growth is key to achieving the BoJ’s 2% inflation target
69
� Wage growth is key to rekindling demand and inflation. Recent salary hikes by big companies such as Toyota (and labour shortages in construction) are encouraging.
� The key question? Will small- and medium-sized enterprises (which provide 70% of jobs) follow? This could take time.
Source: Bank of Japan, Japan Ministry of Health, Labour and Welfare and Statistics Bureau, BlackRock , as of 18 July 2014.*The Consumer Tax in Japan was raised to 8% in Apr. 2014 from 5%, affecting CPI numbers released after April 2014 **BoJ majority median forecasts: 2014 1.3%, 2015 1.9%, 2016 2.1%
Wage growth is still mutedWeaker yen helps spur inflation
% YoY, CPI ex fresh food, adjusting for consumption tax hike*
� BoJ’s confidence lies in their judgment that Japan’s output gap is zero - so any rise in demand should spur inflation.
� A weaker yen could help - yet the broader economic impact is limited as exporters have shifted manufacturing overseas.
% YoYJPY/USD
0
50
100
150
200
250
1980 1985 1990 1995 2000 2005 2010 2015
Gross Net
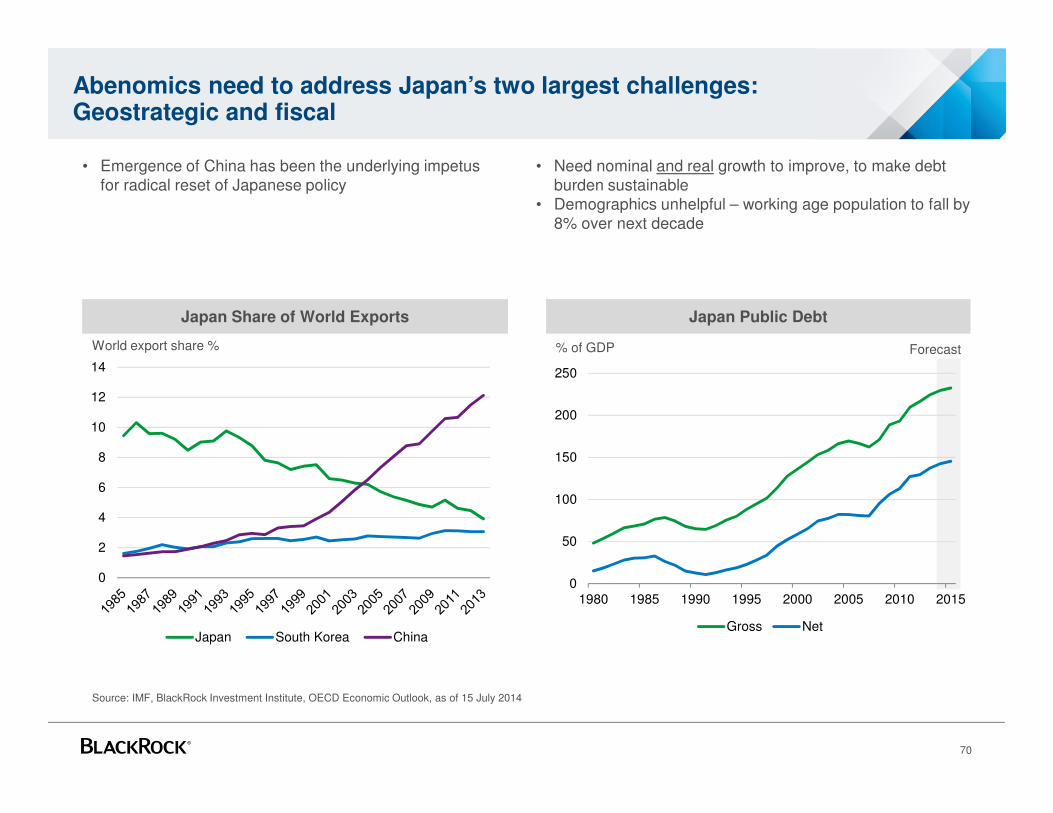
Abenomics need to address Japan’s two largest challenges: Geostrategic and fiscal
70
• Emergence of China has been the underlying impetus for radical reset of Japanese policy
• Need nominal and real growth to improve, to make debt burden sustainable
• Demographics unhelpful – working age population to fall by 8% over next decade
Source: IMF, BlackRock Investment Institute, OECD Economic Outlook, as of 15 July 2014
Japan Share of World Exports Japan Public Debt
% of GDP Forecast
0
2
4
6
8
10
12
14
Japan South Korea China
World export share %

Emerging markets
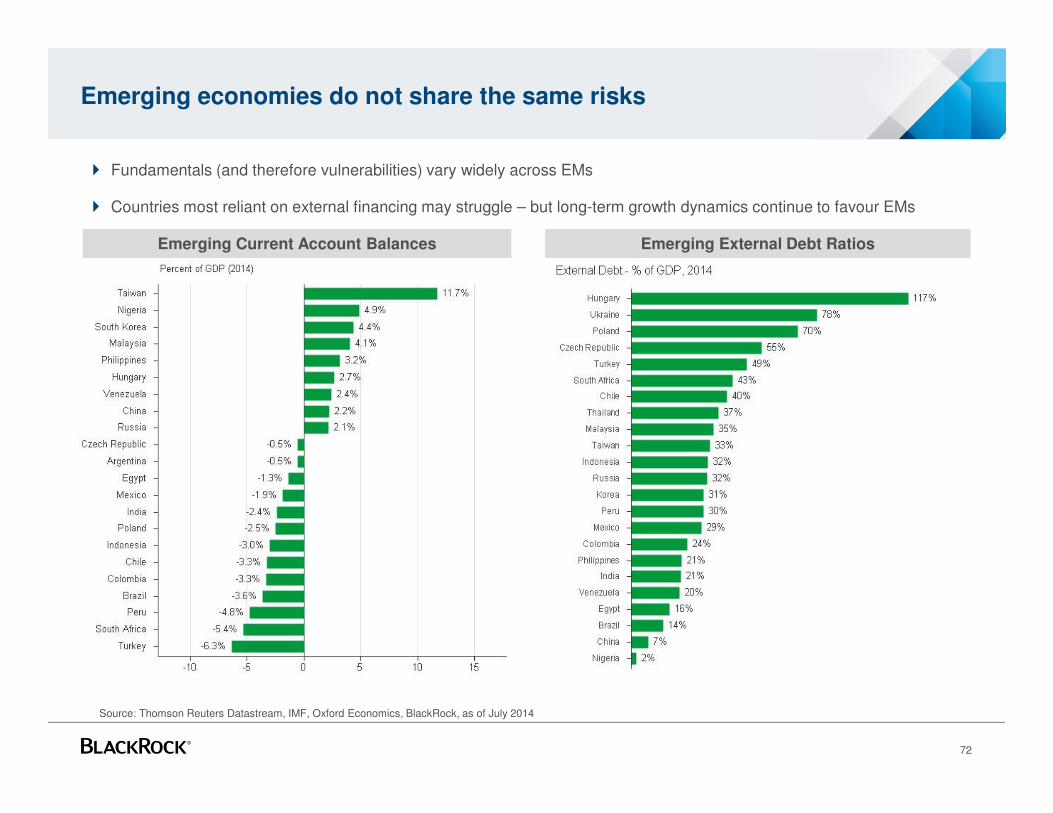
Emerging economies do not share the same risks
72
� Fundamentals (and therefore vulnerabilities) vary widely across EMs
� Countries most reliant on external financing may struggle – but long-term growth dynamics continue to favour EMs
Emerging Current Account Balances Emerging External Debt Ratios
Source: Thomson Reuters Datastream, IMF, Oxford Economics, BlackRock, as of July 2014
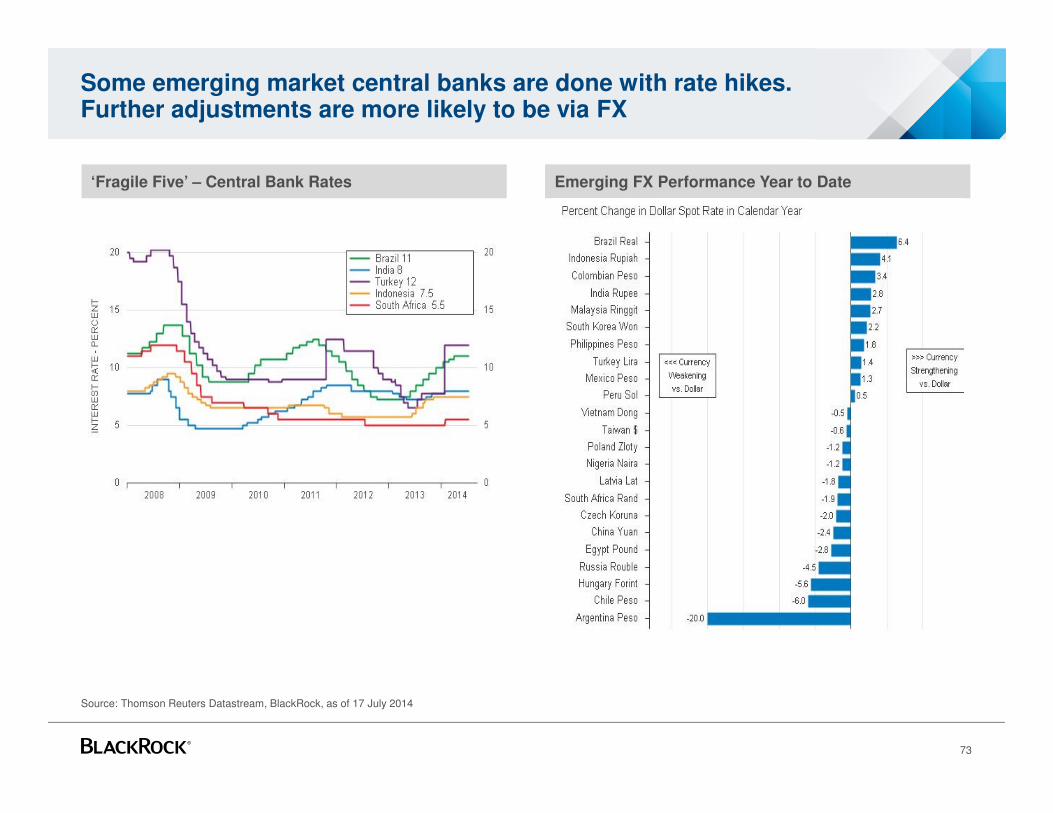
Some emerging market central banks are done with rate hikes. Further adjustments are more likely to be via FX
73
‘Fragile Five’ – Central Bank Rates Emerging FX Performance Year to Date
Source: Thomson Reuters Datastream, BlackRock, as of 17 July 2014
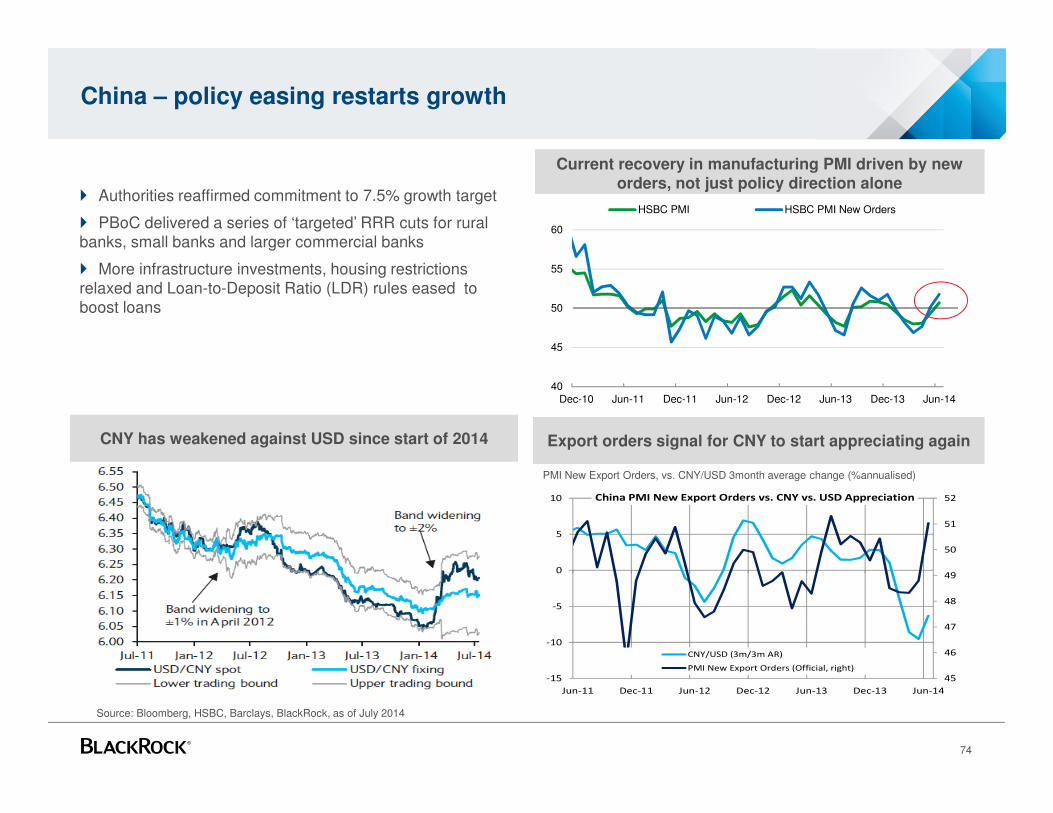
China – policy easing restarts growth
74
Current recovery in manufacturing PMI driven by new orders, not just policy direction alone
Export orders signal for CNY to start appreciating again
45
46
47
48
49
50
51
52
-15
-10
-5
0
5
10
Jun-11 Dec-11 Jun-12 Dec-12 Jun-13 Dec-13 Jun-14
China PMI New Export Orders vs. CNY vs. USD Appreciation
CNY/USD (3m/3m AR)
PMI New Export Orders (Official, right)
Source: Bloomberg, HSBC, Barclays, BlackRock, as of July 2014
PMI New Export Orders, vs. CNY/USD 3month average change (%annualised)
40
45
50
55
60
Dec-10 Jun-11 Dec-11 Jun-12 Dec-12 Jun-13 Dec-13 Jun-14
HSBC PMI HSBC PMI New Orders
CNY has weakened against USD since start of 2014
� Authorities reaffirmed commitment to 7.5% growth target
� PBoC delivered a series of ‘targeted’ RRR cuts for rural banks, small banks and larger commercial banks
� More infrastructure investments, housing restrictions relaxed and Loan-to-Deposit Ratio (LDR) rules eased to boost loans

Conclusion
In conclusion…
• Flexibility is the key to coping with a low-yield environment
• Monetary policy divergence means very different opportunities across bond markets
• Major ingredients for global recovery now in place:
• Cyclical recovery in developed economies finally taking hold
• Necessary reform process and rebalancing of demand underway in the US, Europe, Japan and China
• Emerging markets are not one bloc and there is value in bottom-up country differentiation
• But still major questions for investors:
• Can these reform and adjustment processes be sustained?
• Will there be enough demand - especially if deficit countries adjust more rapidly than surplus countries?
• And crucially - how much of this recovery is already priced in by markets?
76

Appendix
E. Biographies
78
GA_4
BlackRock Global Bond Portfolio Team
Scott ThielDeputy CIO of Fundamental Fixed Income and Head of Global Bond Strategies
Scott Thiel, Managing Director, is BlackRock's Deputy Chief Investment Officer of Fixed Income, Fundamental Portfolios, and Head of European and & Global Bonds. He is a member of the Fixed Income Executive Committee and the EMEA Executive Committee. Mr. Thiel is a member of BlackRock's Leadership Committee.
Prior to joining BlackRock in 2002, Mr. Thiel was a Vice President at Goldman Sachs & Co. During his thirteen years there, he was responsible for developing strategies in both US and international interest rate and derivative markets for institutional money managers.
Mr. Thiel earned a BA degree in American history from Princeton University in 1987.
Owen Murfin, CFAPortfolio Manager – Head of Global Credit Strategies
Owen Murfin, CFA, Managing Director, is a member of the Fundamental Fixed Income platform within the International Fixed Income group. He is a senior portfolio manager on the Global Bond Portfolio Team and is responsible for overseeing global credit strategies across global bond portfolios as well as serving as the lead portfolio manager for dedicated global corporate bond portfolios.
Mr. Murfin's service with the firm dates back to 2002, including his years with Merrill Lynch Investment Managers (MLIM), which merged with BlackRock in 2006. At MLIM, Mr. Murfin was a fixed income portfolio manager responsible for non-government securities within global aggregate and global corporate portfolios. Prior to joining MLIM, Mr. Murfin worked at Goldman Sachs Asset Management, managing global credit portfolios.
Mr. Murfin earned a BSc degree in chemistry from University College London in 1997.
Joseph Di Censo, CFA, CAIAPortfolio Manager – Economist, Global Rates, FX
Joe Di Censo, CFA, CAIA, Managing Director, is a member of the Fundamental Fixed Income platform within the International Fixed Income group. He is a senior portfolio manager on the Global Bond Portfolio Team and is responsible for helping develop to down themes within the portfolio as well as active positioning across country selection, global rates and FX.
Prior to joining BlackRock in 2011, Mr. Di Censo was a member of the Monetary and Capital Markets Division of the International Monetary Fund (IMF) in Washington D.C. He served as a financial sector expert to IMF teams working on the European sovereign debt crisis, and advised policymakers in India, Indonesia, Japan, and Korea. In addition, Mr. Di Censo was a lead author of the Global Financial Stability Report. Prior to his work at the IMF, Mr. Di Censo was a Senior Vice President at Lehman Brothers, where he spent nine years as a member of the global asset allocation research team. In that role, he contributed to fundamental and quantitative investment strategies across US, European, and Asia fixed income markets as well as the broader research platform. He was also an author of Lehman's flagship fixed income research publication, Daily and Weekly Global Relative Value.
Mr. Di Censo has an MA degree in economics from the University of Pennsylvania and received a BS degree, magna cum laude, from Georgetown University's School of Foreign Service in 1998.
79
GA_4
BlackRock Global Bond Portfolio Team
Amar Bashir, CFAPortfolio Manager
Amar Bashir, CFA, Director, is a member of the Fundamental Fixed Income platform within the International Fixed Income group. He is a senior portfolio manager on the Global Bond Portfolio Team and is responsible for overseeing the emerging market investment strategies across the global bond portfolios as well as serving as the lead portfolio manager for the team's dedicated Canadian Fixed Income and High Alpha/Performance institutional separate mandates.
Mr. Bashir's service with the firm dates back to 2002, as an analyst in the Portfolio Compliance Group. He joined the Portfolio Management Group in 2006. Mr. Bashir earned a BSc degree in economics, with a concentration in finance and electronic commerce, from the University of Pennsylvania in 2002.
Beata Harasim, CFA, CAIAPortfolio Manager
Beata Harasim, CFA, CAIA, Vice President, is a member of the Fundamental Fixed Income platform within the International Fixed Income group. She is a portfolio manager on the Global Bond Portfolio Team and is focused on active FX idea generation and implementation across global bond portfolios.
Ms Harasim began her career at BlackRock as a member of the graduate program in 2008. Ms Harasim has earned a MA in finance and banking from the Warsaw School of Economics in 2008.
Aidan DoylePortfolio Manager
Aidan Doyle, Associate, is a member of the Fundamental Fixed Income platform within the International Fixed Income group. He is a portfolio manager on the Global Bond Portfolio Team and is focused on global rates relative value idea generation and portfolio implementation.
Mr. Doyle began his career at BlackRock in 2010. Mr. Doyle earned a BA degree in Economics, with honors, from Trinity College Dublin in 2009 and an MSc degree in Finance from the Imperial College London in 2010..
Edward LesleyPortfolio Manager
Edward Lesley, Associate, is a member of the Fundamental Fixed Income platform within the International Fixed Income group. He is a portfolio manager on the Global Bond Portfolio Team and is focused on implementation of bottom up credit ideas generated by Global Sector Specialists.. .
Mr. Lesley began his career at BlackRock in 2010 and was previously a Banks Analyst within Fundamental Fixed Income. Mr. Lesley earned a BA degree in Philosophy, Politics and Economics, with honours, from the University of Warwick in 2010..

80
GA_4
BlackRock Global Bond Product Strategy Team
Sriram ReddyProduct Strategist – Global Bond Strategies
Sriram Reddy, Director, is a member of the Product Strategy Team within BlackRock's Fixed Income Portfolio Management Group. He is a product strategist focusing on global bond strategies.
Prior to moving to his current role in 2010, Mr. Reddy was a member of the Global Client Group in Singapore, responsible for developing and maintaining institutional relationships with the firm's clients throughout the South East Asia region. Mr. Reddy's service with the firm dates back to 2005, including his years with Barclays Global Investors (BGI), which merged with BlackRock in 2009. At BGI, he worked within the Transition Management Group most recently as a transition strategist for the Asia Pacific region. Prior to BGI Mr. Reddy worked for RTL Capital conducting research on long only investment strategies.
Mr. Reddy earned a BA degree in economics from Johns Hopkins University in 2004.
Marilyn WatsonProduct Strategist – Global Bond Strategies
Marilyn Watson, Director, is a member of the Product Strategy Team within BlackRock's Fixed Income Portfolio Management Group. She is a product strategist focusing on global bond strategies.
Ms. Watson joined BlackRock in January 2011 from the Bank of England, where she worked as an economist and deputy agent in the Monetary Policy Division. Prior to joining the Bank of England in 2009, she spent two years as a global investment strategist and six years selling FX derivatives at JPMorgan Asset Management and JPMorgan Investment Bank respectively.
Ms. Watson earned an MA degree in economics from Cambridge University in 1999.
Yumian LuProduct Strategist – Global Bond Strategist
Yumian Lu, Associate, is a member of the Product Strategy Team within BlackRock's Fundamental Fixed Income Portfolio Management Group. She is a product strategist focusing on global bond strategies.
Ms. Lu's service with the firm dates back to 2011. Prior to moving to her current role in 2012, Miss Lu was a member of the Financial Institutions Group, responsible for managing relationships with the firm's insurance clients. Prior to joining BlackRock, Miss Lu was an institutional salesperson at Deutsche Bank's Sales & Trading division in Hong Kong from 2008 to 2010, covering Greater China clients.
Ms. Lu earned a Msc degree in risk and finance from the London School of Economics in 2011, and a BA degree in economics from the University of Cambridge in 2008.

81
Jeremy WattRelationship Manager – Institutional Client Business
Jeremy Watt, Director, is a member of the US and Canada Institutional team within BlackRock's Institutional Client Business. He is responsible for developing and maintaining relationships with institutional investors, including public and private pension plans, foundations and endowments.
Mr. Watt's service with the firm dates back to 1996, including his years with Barclays Global Investors (BGI), which merged with BlackRock in 2009. At BGI, he was a senior client relationship officer for the US Institutional Client Service Group. Mr. Watt began his career at BGI as a senior data analyst before serving as a project manager for BGI's Global Market Data Group. Prior to joining BGI, Mr. Watt was a fund accountant and a securities operations analyst at Invesco.
Mr. Watt earned a BA degree in business studies from Charles Sturt University.
Fresno County Employees’ Retirement AssociationBlackRock Relationship Manager

Appendix
F. Disclosures
In the US this material is for institutional investors only. In the EU issued by BlackRock Investment Management (UK) Limited (authorised and regulated by the Financial Conduct Authority). Registered office: 12 Throgmorton Avenue, London, EC2N 2DL. Registered in England No. 2020394. Tel: 020 7743 3000. For your protection, telephone calls are usually recorded. BlackRock is a trading name of BlackRock Investment Management (UK) Limited. In Hong Kong, the information provided is issued by BlackRock (Hong Kong) Limited and is only for distribution to "professional investors" (as defined in the Securities and Futures Ordinances (Cap. 571 of the laws of Hong Kong)) and should not be relied upon by any other persons. In Singapore, this is issued by BlackRock (Singapore) Limited (company registration number: 200010143N) for institutional investors only.
For distribution in EMEA and Korea for Professional Investors only (or “professional clients”, as such term may apply in relevant jurisdictions). For distribution in Taiwan for Professional Investors only. Independently operated by BlackRock Investment Management (Taiwan) Limited. Address: 28/F, No. 95, Tun Hwa South Road, Section 2, Taipei 106, Taiwan. Tel: (02)23261624. In Japan, not for use with individual investors. In Canada, this material is intended for permitted clients only. This material is being distributed/issued in Australia and New Zealand by BlackRock Financial Management, Inc. ("BFM"), which is a United States domiciled entity and is exempted under ASIC CO 03/1100 from the requirement to hold an Australian Financial Services License and is regulated by the Securities and Exchange Commission under US laws which differ from Australian laws. In Australia this document is only distributed to "wholesale" and "professional" investors within the meaning of the Corporations Act 2001. In New Zealand, this document is not to be distributed to retail clients. BFM believes that the information in this document is correct at the time of compilation, but no warranty of accuracy or reliability is given and no responsibility arising in any other way for errors and omissions (including responsibility to any person by reason of negligence) is accepted by BFM, its officers, employees or agents.
In Latin America, for Institutional and Professional Investors only. This material is solely for educational purposes and does not constitute investment advice, or an offer or a solicitation to sell or a solicitation of an offer to buy any shares of any funds (nor shall any such shares be offered or sold to any person) in any jurisdiction within Latin America in which such an offer, solicitation, purchase or sale would be unlawful under the securities laws of that jurisdiction. If any funds are mentioned or inferred to in this material, it is possible that some or all of the funds have not been registered with the securities regulator of Brazil, Chile, Colombia, Mexico, Peru or any other securities regulator in any Latin American country, and thus, might not be publicly offered within any such country. The securities regulators of such countries have not confirmed the accuracy of any information contained herein. No information discussed herein can be provided to the general public in Latin America.
This document contains general information only and is not intended to be relied upon as a forecast, research, investment advice, or a recommendation, offer or solicitation to buy or sell any securities or to adopt any investment strategy. The information does not take into account your financial circumstances. An assessment should be made as to whether the information is appropriate for you having regard to your objectives, financial situation and needs.
The opinions expressed are as of August 6, 2014 and may change as subsequent conditions vary. The information and opinions contained in this material are derived from proprietary and non-proprietary sources deemed by BlackRock, Inc. and/or its subsidiaries (together, “BlackRock”) to be reliable, are not necessarily all inclusive and are not guaranteed as to accuracy. There is no guarantee that any forecasts made will come to pass. Any investments named within this material may not necessarily be held in any accounts managed by BlackRock. Reliance upon information in this material is at the sole discretion of the reader. Past performance is no guarantee of future results.
BlackRock® is a registered trademark of BlackRock, Inc. All other trademarks are the property of their respective owners.
© 2014 BlackRock, Inc. All rights reserved. BLACKROCK, BLACKROCK SOLUTIONS, and iSHARES are registered trademarks of BlackRock, Inc. or its subsidiaries. All other trademarks are the property of their respective owners.
BLK-0843-0613
Important notes