Embed Size (px)
Citation preview
MICROSTRUCTURAL STUDY AND NUMERICAL SIMULATION OF INERTIA
FRICTION WELDING OF ASTROLOY
Michelle SoucailI)*, Alain Moa12), Lok NazCl), Elizabeth Massoniz)? Christophe Levaillant2) and Yves Bienvenul)
Ecole des Mines de Paris, 1) Centre des Materiaux P.M. Four-t, BP 87,91003 Evry Cedex, France.
2) Cemef, Sophia Antipolis, 06565 Valbonne, France.
Abstract
Inertia friction welding involves the interaction of thermal, mechanical and metallurgical phenomena. The study of this process was performed on Astroloy. The evolution of the microstructure of the superalloy was determined and modeled in relation to the heating rate, temperature and strain rate. The deformation microstructures were examined by transmission electron microscopy on high temperature torsion test samples and qualitatively related to the temperature and the strain rate of the experiment. A numerical simulation of a friction welding experiment is described. The predictions of the model are compared to experimental measurements and observations on welds.
* now at ONERA, BP 72,92322 Chatillon Cedex, France.
Superalloys 1992 Edited by S.D. Antolovich, R.W. Stusrud, R.A. MacKay,
D.L. Anton, T. Khan, R.D. Kissinger, D.L. Klarstrom The Minerals, Metals & Materials Society, 1992
847
Introduction
Friction welding is an attractive process since it is claimed not to involve melting and to produce a joint exhibiting the parent metal strength. That is the reason why it is presently considered by the S.N.E.C.M.A. for joining nickel base superalloy components [l]. The complexity of the process lies in the fact that it lasts less than 10 seconds and takes the center of the joint to some 1300°C with deformation rates roughly estimated in excess of lo2 s-l. Industrial development of this process requires a numerical simulation and the scope of this paper is to present the various steps leading to the model. Its physical basis such as the analysis of the phase transformations and the determination of the constitutive laws are described before the finite element numerical analysis is introduced.
Exnerimental nrocedure
In order to study the effects of rapid heating and deformation, thermal cycles and hot torsion tests were performed. Thermal cycles were performed on 3 mm diameter Astroloy rods with a SMITWELD simulator employing Joule heating and allowing a maximum heating rate of 3OOK/s. The resulting microstructures were studied by scanning electron microscopy. Hot torsion tests, chosen to investigate the rheology of the material, were conducted to rupture (ar, deformation at rupture, ranges between 0.5 and 15). Deformation rates were varied between 0.1 and 30 s-l and temperature between 750 and 1200°C. Friction welding tests were performed on tubular samples by the SNECMA. The deformation microstructures of the torsion and friction welding samples were examined by transmission electron microscopy using a Philips 430 operating at 300 kV.
Phase transformations
The material of the study is Astroloy, a well established powder metallurgy nickel base superalloy. Argon atomised powders were hot extruded, forged and heat treated to produce a 5pm grain size. The y’ phase (45% volume fraction) is distributed between large primary intergranular precipitates (2pm), secondary intragranular precipitates (0.1 ym) and ultrafine (10nm) precipitates. Borides are also an important feature of the microstructure in spite of their lower volume fraction. The equilibrium temperatures of dissolution of the secondary y, primary y and borides determined by differential thermal analysis are respectively: 1090, 1140 and 1220°C. The solidus is at 1250°C and the liquidus at 1345°C. Phase transformations under rapid heating were studied by rapid thermal cycling (figure 1). The hold time at maximum temperature was 0.5s and the cooling rate SO”C/s. The most prominent feature concerns the large delay in the dissolution of the primary y phase. This delay is less for secondary precipitates and the effect of the heating rate is almost negligible on the dissolution of the borides which corresponds to the incipient melting of the alloy [2]. A model is proposed to describe the dissolution of the y phase during rapid thermal cycling. The first step of this model is to determine a time-temperature equivalence (by equaling integral diffusion length with that of the hold time te at peak temperature Te). The model of Ashby and Easterling [3] for the dissolution of carbides in steel welds was then adapted for the case of y’ precipitates. These precipitates, unlike carbides in steel, cannot be considered as points because of their large volume fraction and size, The matrix volume fraction f affected by dissolution is expressed as:
f= (d%e+W3 ($j& + R)3 + 13 for m “-R ;
fJme+W3 13
for nk < 1-R
848
where R is the precipitate radius, De the diffusion coefficient of aluminium in nickel at the peak temperature, and 1 the radius of the equivalent matrix sphere associated with a precipitate.
This relationship gives that f is equal to (T )3 when I/& is small and that f is equal to 1 when
it is large.The thermodynamic equilibrium between matrix and precipitates with the atomic fraction of aluminium is expressed as :
In XAl,y = A -+
The temperature T, at which the y dissolve completely in a time t less than that required to reach equilibrium is given by :
In%?@ = A- em?!- f Ts
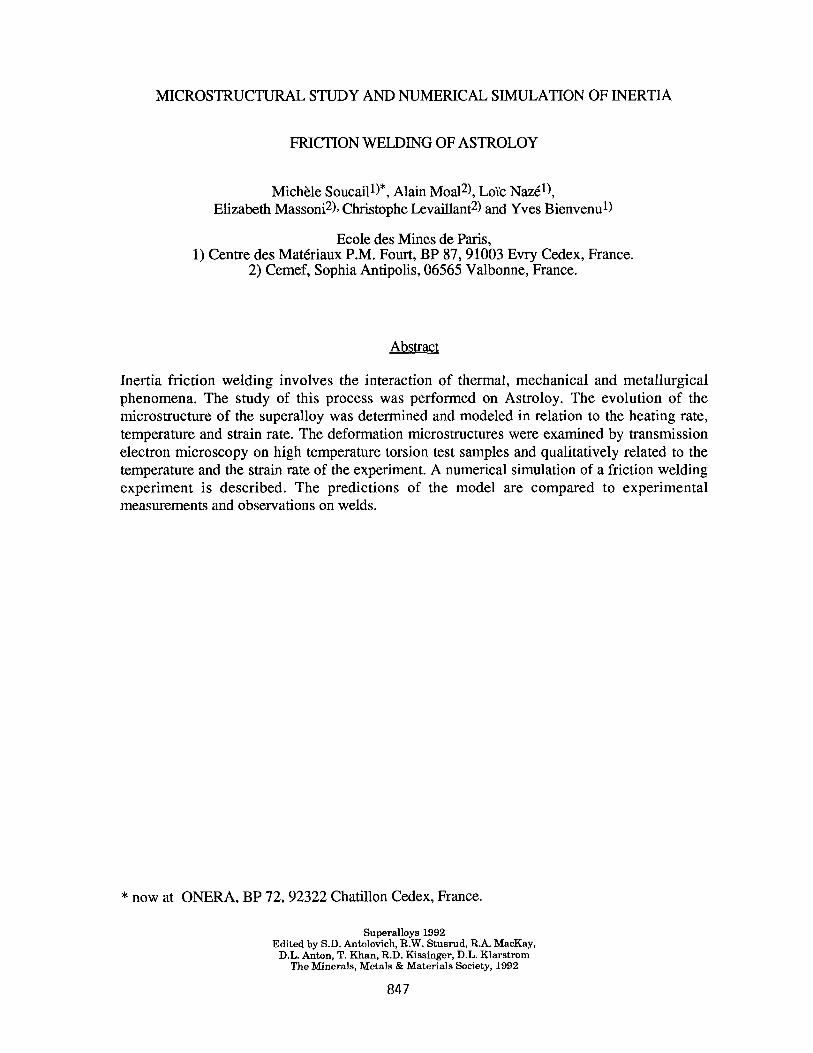
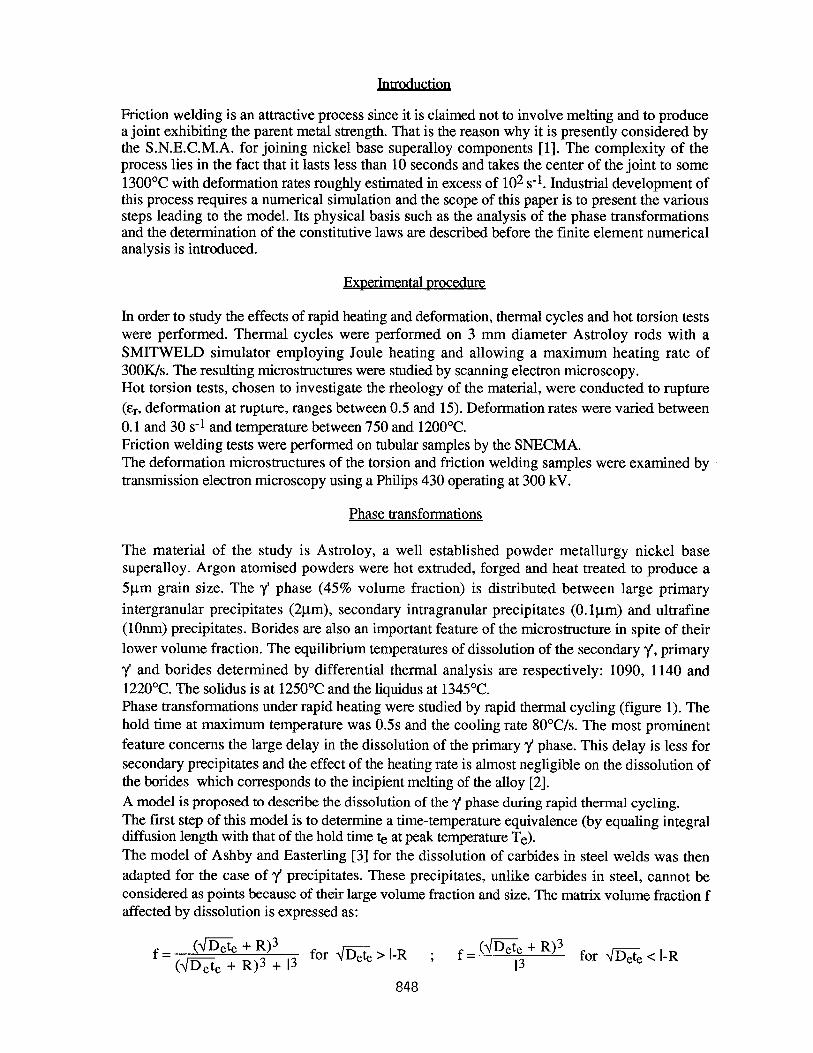
where X0,4 is the nominal atomic fraction. As shown in figure 1, a good agreement is obtained between the experimental and calculated temperatures for complete dissolution. These results were used to determine a profile of the maximum temperature across a friction welded joint. The increases of temperature were measured during the welding process : an optical pyrometer was used for the interface zone and thermocouples along the static part of the sample. At the original interface it appears that a temperature threshold of 1280°C is reached in less than 1 second. Along the sample heating rates are of the order of 200 to 300 K/s and the cooling rate of 80 to 100 K/s. These measurements together with an analysis of the y’ and borides microstructure allow us to determine the profile of the maximum temperature reached along the AFF8/4 weld (figure 2). The temperatures on which this profile is based, correspond to total dissolution of primary y, borides and secondary y and at the onset of y’ dissolution.
1400[
1300r-,-1.1
1000 I 41 91 1 10 100 1000
Heating rate (“C/s)
Figure l- Effect of heating rate on the temperatures of complete dissolution of y precipitates and borides. The cooling rate is 8OK/s and the hold time is 0.5s. Continuous line is the result of simulation (see text).
849
9003 w 0,2 0,4 0,6 0,s 1,0 1,2
Distance to center of welding (mm)
Figure 2 -Temperature profile of AFF8/4 welded sample determined from microstructure.
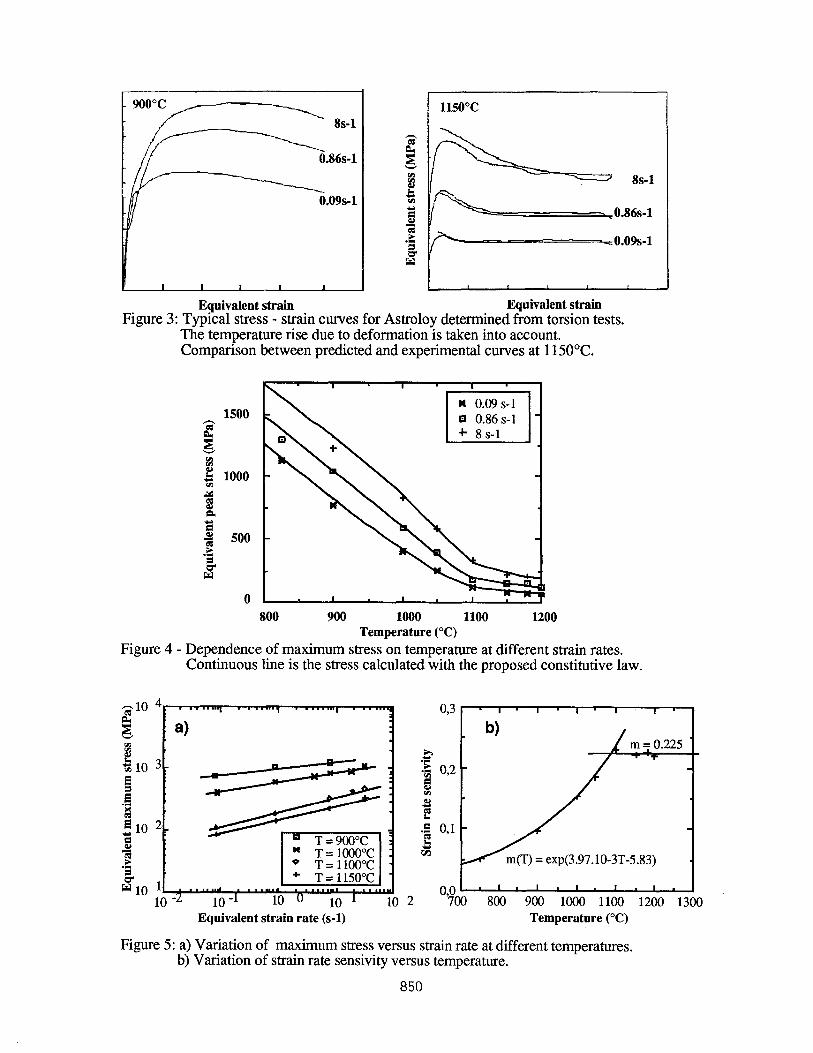
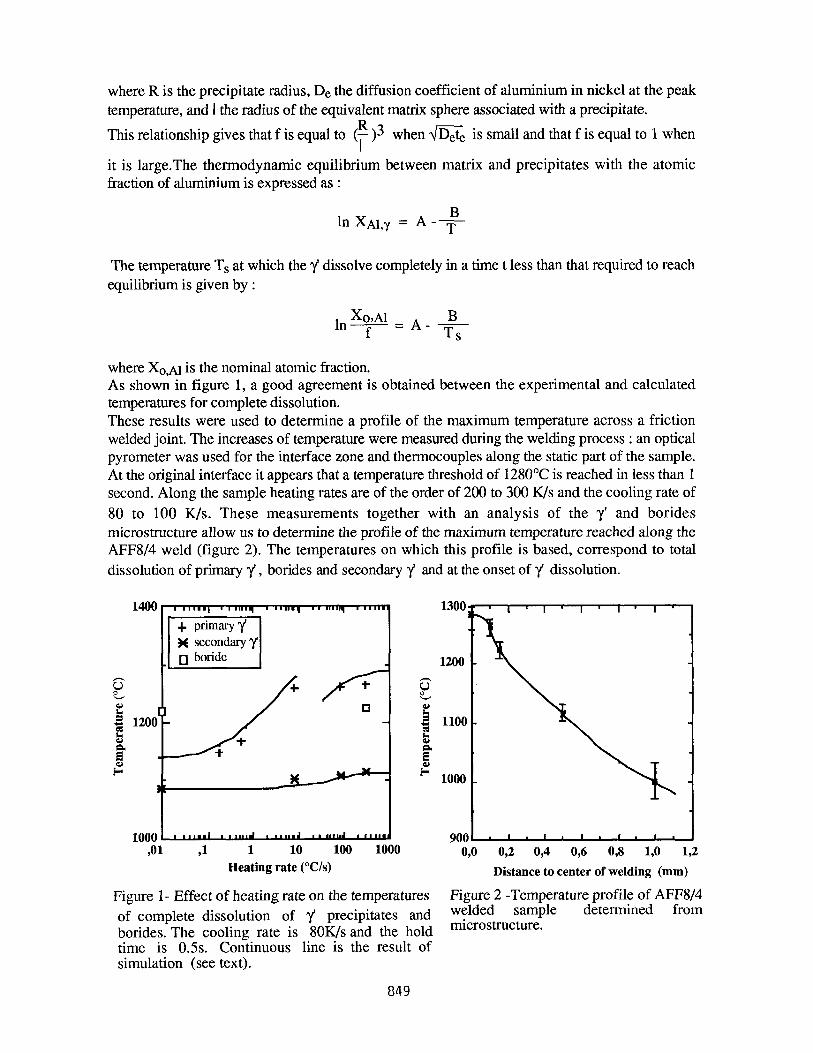
Equivalent strain Equivalent strain Figure 3: Typical stress - strain curves for Astroloy determined from torsion tests.
The temperature rise due to deformation is taken into account. Comparison between predicted and experimental curves at 115OOC.
1500
E
: g 1000
Ii a 2 s 500 F .” & w
0 800 900 1000 1100 1200
Temperature (“C) Figure 4 - Dependence of maximum stress on temperature at different strain rates.
Continuous line is the stress calculated with the proposed constitntive law.
-1 h o’3 3
2
1 L 10 -
:E 03 % % f
-1
.a 0,l s VJ
Equivalent strain rate (s-l) Temperature (“C)
Figure 5: a) Variation of maximum stress versus strain rate at different temperatures. b) Variation of strain rate sensivity versus temperature.
850
Rheoloeical Behavior
Exuerimental results
The experimental torque, r, is recorded in relation with N, the number of revolutions. The equivalent strain rate, and the equivalent strain calculated at the periphery of the test sample are:
where R and L are the radius and length. The Von Mises equivalent stress is given by [4]:
o= l-fi z (3+ii+iil)
where 5 and t% are the sensitivity exponent of the torque to the strain and to the strain rate. Actually the torque has to be corrected to take the heat generated by plastic deformation into account. The thermal equilibrium of the test sample is:
mCndAT =?J I2ndN+&S CT (T4-To4) dt
where C, is the specific heat, q the viscous efficiency, E the emissivity, CT the Stephan’s constant, S the area and AT = T - To measures the heating over the ambient temperature. Two types of rheological behaviours are identified according to temperature (figure 3): -from 800 to 1090°C, the stress after a short period of work hardening, is constant and the ductility is low. -from 1090°C to 1200°C, the curves show a maximum (the peak stress on) followed by a softening and ultimately by a steady state stress 0,. The peak stress corresponds to a strain of 0.1 to 0.2, and is almost independent of the thermomechanical conditions of the torsion tests. The strain at the onset of steady state flow increases with strain rate and decreases with temperature. The ductility is high. In both domain, the maximum flow stress increases with strain rate and decreases with temperature (figure 4).The strain rate sensitivity coefficient increases with temperature in the first domain (figure 5) and remains constant in the second. Thus 1090°C appears to be an important temperature for the rheology of the alloy. In metallurgical terms this value corresponds to the total dissolution of secondary y precipitates and hence this led us to investigate the microstructural aspects of hot deformation in both temperature domains.
Deformation mechanisms
From 1090 to 1200°C : In this temperature range, secondary y are dissolved and primary v are only found in tests performed below 114OOC. After torsion, grains are equiaxial even for the highest strains (a>lO). The microstructure of torsion samples, observed in the T.E.M., is heterogeneous (figure 6) and typical of dynamic recrystallization. Evidence of slip and climb of dislocations has been identified. Tangles of dislocations are often found while some grains are dislocation free. It is likely that a metadynamic recrystallization (which would occur after the end of torsion, during the few seconds before quenching) may accentuate the heterogeneity of the microstructure. For lower strain rates, dislocations form subgrain boundaries but the dislocation density is much lower than precedently.
851
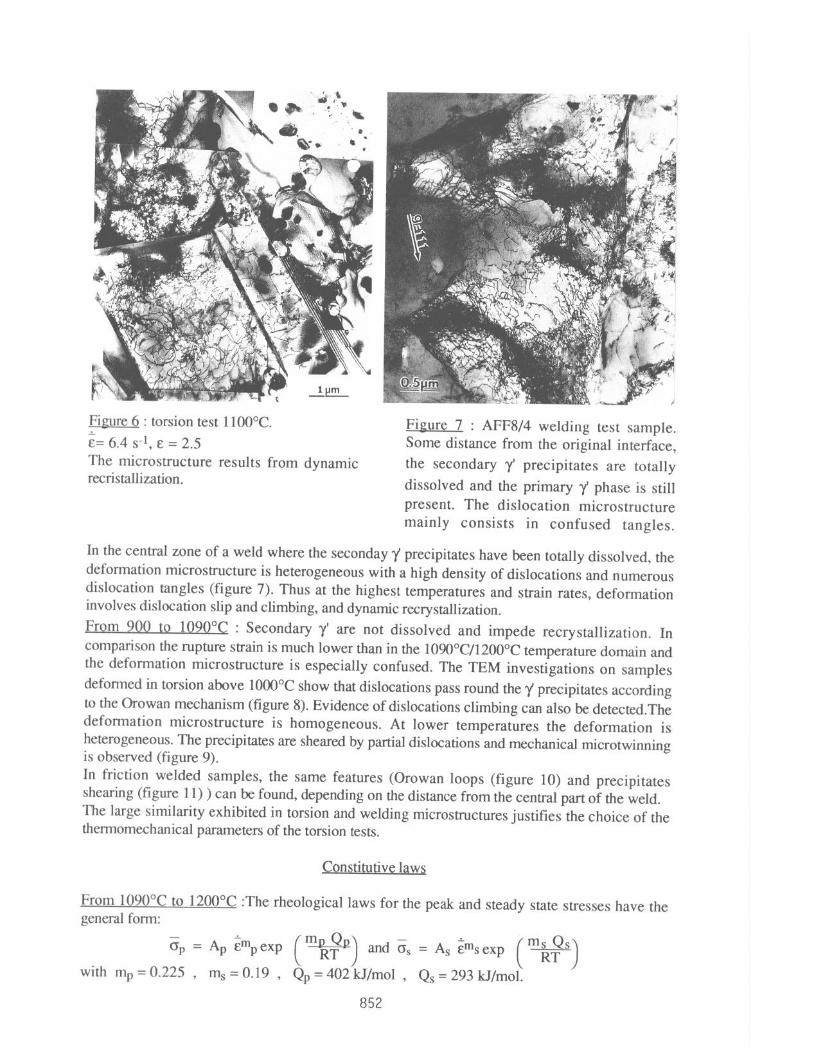
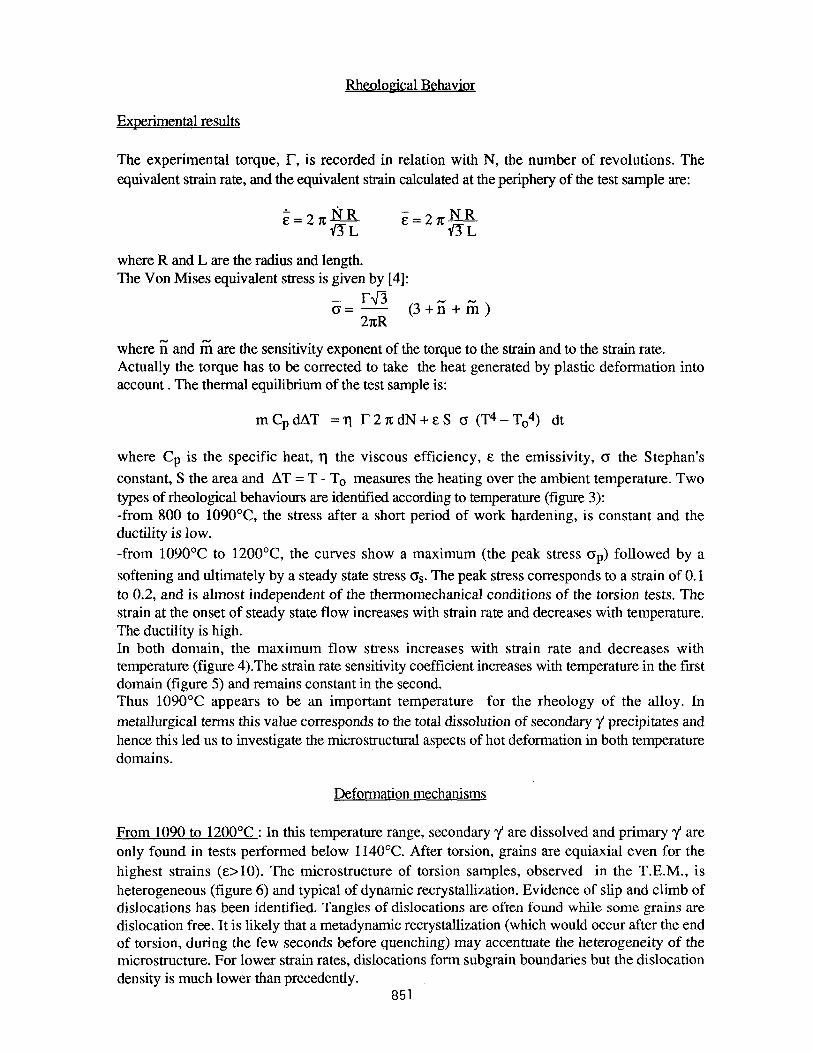
Figure 6 : torsion test 1100°C. ;= 6.4 s-l, E = 2.5 The microstructure results from dynamic recristallization.
Figure 7 : AFF814 welding test sample. Some distance from the original interface, the secondary y’ precipitates are totally dissolved and the primary y phase is still present. The dislocation microstructure mainly consists in confused tangles.
In the central zone of a weld where the seconday y precipitates have been totally dissolved, the deformation microstructure is heterogeneous with a high density of dislocations and numerous dislocation tangles (figure 7). Thus at the highest temperatures and strain rates, deformation involves dislocation slip and climbing, and dynamic recrystallization. From 900 to 1090°C : Secondary y’ are not dissolved and impede recrystallization. In comparison the rupture strain is much lower than in the 1090°C/12000C temperature domain and the deformation microstructure is especially confused. The TEM investigations on samples deformed in torsion above 1000°C show that dislocations pass round the y precipitates according to the Qrowan mechanism (figure 8). Evidence of dislocations climbing can also be detected.The deformation microstructure is homogeneous. At lower temperatures the deformation is heterogeneous. The precipitates are sheared by partial dislocations and mechanical microtwinning is observed (figure 9). In friction welded samples, the same features (Orowan loops (figure 10) and precipitates shearing (figure 11) ) can be found, depending on the distance from the central part of the weld. The large similarity exhibited in torsion and welding microstructures justifies the choice of the thermomechanical parameters of the torsion tests.
Constitutive laws
From 1090°C to 1200°C :The rheological laws for the peak and steady state stresses have the general form:
op = A, imp exp and & = As zrn, exp
with mp = 0.225 , m, = 0.19 , Qp = 402 kJ/mol , Qs = 293 kJ/mol.
852
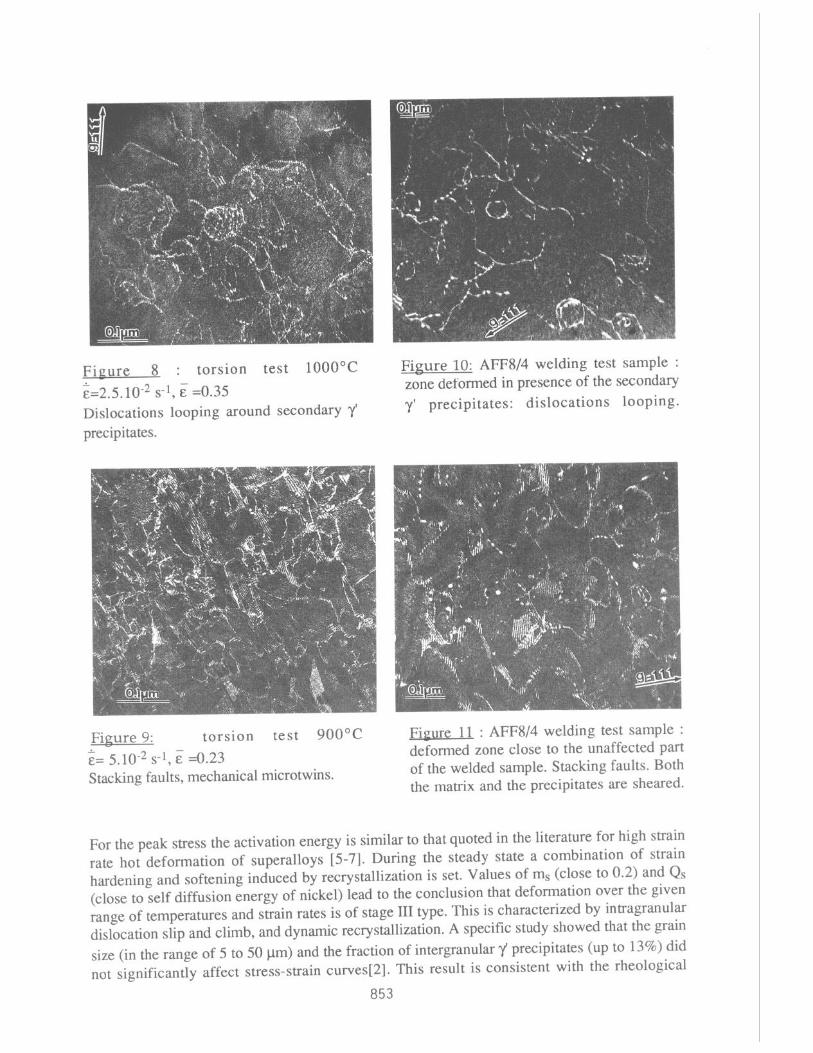
Figure 8 : torsion test 1000°C ;=2 5 10-2 s-t, E =0.35 . . Dislocations looping around secondary y’ precipitates.
Figure 10: AFF8/4 welding test sample : zone deformed in presence of the secondary y’ precipitates: dislocations looping.
Figure 9: torsion test 900°C %= 5.10-2 s-1, E =0.23 Stacking faults, mechanical microtwins.
Fivure 11 : AFF8/4 welding test sample : deformed zone close to the unaffected part of the welded sample. Stacking faults. Both the matrix and the precipitates are sheared.
For the peak stress the activation energy is similar to that quoted in the literature for high strain rate hot deformation of superalloys [5-71. During the steady state a combination of strain hardening and softening induced by recrystallization is set. Values of ms (close to 0.2) and Qs (close to self diffusion energy of nickel) lead to the conclusion that deformation over the given range of temperatures and strain rates is of stage III type. This is characterized by intragranular dislocation slip and climb, and dynamic recrystallization. A specific study showed that the grain size (in the range of 5 to 50 pm) and the fraction of intergranular y precipitates (up to 13%) did not significantly affect stress-strain curves[2]. This result is consistent with the rheological
853
parameters.It allows us to use the above constitutive laws for welding simulation despite the delay in the dissolution of the primary 7 phase and the changes in grain size it produces. Between the peak and the steady-state, stress can be described by an iso-strain rate model :
0 = (1-a) 6 + aos
in which a represents the “recrystallized“ fraction and is determined by an Avrami type equation [2,8,9].The comparison between computed and experimental curves is quite satisfactory (see figure 3). From 800 to 1090°C : After strain hardening the stress can be taken as a constant and a Norton- Hoff constitutive law gives :
where m(T) is shown figure 5. Up to now the constitutive laws we consider are independent of the initial microstructure though it has been shown that the initial secondary y size is an important parameter. Indeed, in friction welding, the flash produced is devoid of secondary r’. It can be noted that the dissolution of these precipitates controls the quantity of material expulsed during welding. The constitutive laws proposed above were modified to incorporate the significant microstructural parameters (volume fraction and size of secondary y) [2].
The Finite Element Model
Considering inertia terms and external forces, the dynamical equilibrium equation may be written as the Virtual Power Principle :
vv*uY* , I ( CT : i*- pyv* da - n ) \
T.v*dS - aQT 1
z.v*dS = 0 anf
ii2 is the domain &2f is a part of Q on which friction occurs (interface of the two pieces), afiT is a part of fi on which external forces per unit surface area T are applied,
P is the volumic mass, y the acceleration vector and z the friction shear stress.
The material is assumed to obey a Norton-Hoff constitutive law and to be incompressible. At the beginning of the welding, when temperature is still low, the friction shear stress is assumed to depend on the prescribed pressure P :
z = - a P bv$Pf’Avs
Avs is the slipping velocity between the pieces and pf the slipping velocity sensitivity. Then, when temperature is higher, the friction behaviour is the same as the rheological behaviour of a thin Norton-Hoff layer submitted to a shear stress :
z = - a K IAv$Pt’Av,
where K is the consistency of the layer.
854
The incompressibility condition is included in the equilibrium equation by the use of a penalty method. A semi-implicit integration scheme allows the computation of the acceleration. The mesh and various parameters are updated after each time step (updated lagrangian formulation) with an explicit scheme. The mechanical problem is solved with the aid of the Finite Element Method. In order to simulate the torsional effects [lo] and the decrease of the rotating velocity, the three components of the velocity vector are taken into account in an axisymmetric approximation [ 111. We obtain the set of n non-linear equations (n is the number of degrees of freedom) from the discretized form of the Virtual Power Principle. The domain is meshed with quadratic elements (6 nodes triangles with 7 integration and 2 reduced integration points). The non-linear system is solved with a Newton-Raphson procedure using a sub-incrementation technique.
The temperature field is computed separately on each time step. The mechanical and thermal resolutions are linked through the dissipated plastic deformation power, the heat flux generated on the contact surfaces by friction and the temperature-dependence of the constitutive parameters.
pC#$ = div (k Grad(T)) + Q in L!
pC, is the heat capacity and k the thermal conductivity,
0 denotes the rate of internal heat generation during the plastic deformation.
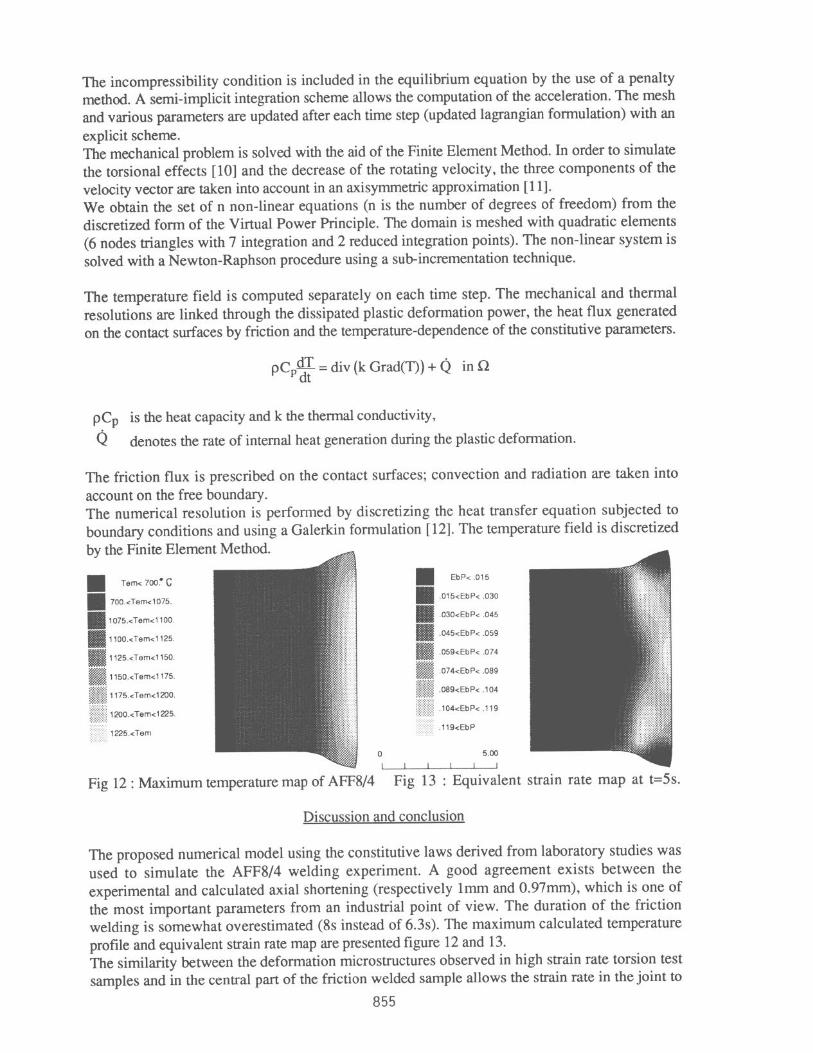
The friction flux is prescribed on the contact surfaces; convection and radiation are taken into account on the free boundary. The numerical resolution is performed by discretizing the heat transfer equation subjected to boundary conditions and using a Galerkin formulation [ 121. The temperature field is discretized by the Finite Element Method.
Tem<7W?C EbP<.OlB
70O.<Tem<1075. .OlS<EbP<.030
1075.<Tem<llOO OJO<EbP< 045
llOO.<Tem<1125 .045<EbP< 059
l125.-zTem<1150 .OBS<EbPc 074
<si,,ics 115O.<Tem<1175 f:+"j .074<EbP< 089 ., ,.. . . . . .: $ < l175.<Tem<1200. > .089<EbP<.104 : ::
: ,12OO.<Tem<l225 . . .104<EbP<.119
1225.sTem .llS<EbP
0 5.00
I I I I I 1
Fig 12 : Maximum temperature map of AFF8/4 Fig 13 : Equivalent strain rate map at t=%.
Discussion and conclusion
The proposed numerical model using the constitutive laws derived from laboratory studies was used to simulate the AFF8/4 welding experiment. A good agreement exists between the experimental and calculated axial shortening (respectively lmm and 0.97mm), which is one of the most important parameters from an industrial point of view. The duration of the friction welding is somewhat overestimated (8s instead of 6.3s). The maximum calculated temperature profile and equivalent strain rate map are presented figure 12 and 13. The similarity between the deformation microstructures observed in high strain rate torsion test samples and in the central part of the friction welded sample allows the strain rate in the joint to
855
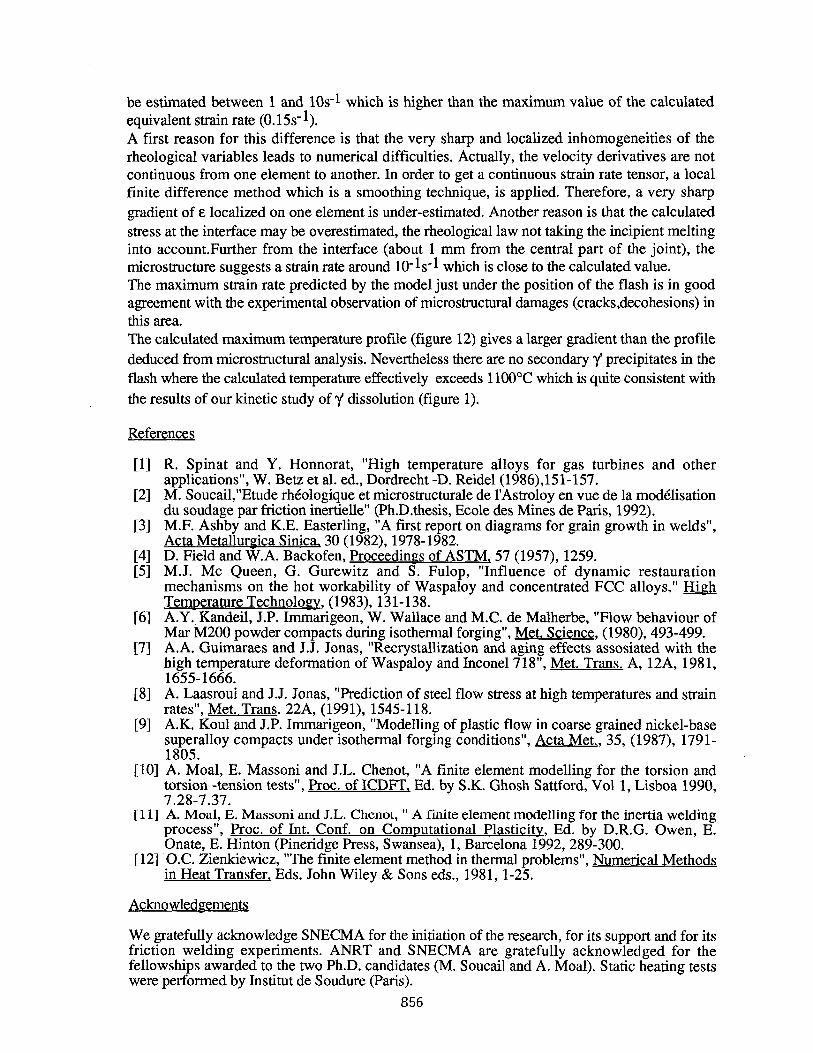
be estimated between 1 and 10s1 which is higher than the maximum value of the calculated equivalent strain rate (0.15sl). A fist reason for this difference is that the very sharp and localized inhomogeneities of the rheological variables leads to numerical difficulties. Actually, the velocity derivatives are not continuous from one element to another. In order to get a continuous strain rate tensor, a local finite difference method which is a smoothing technique, is applied. Therefore, a very sharp gradient of E localized on one element is under-estimated. Another reason is that the calculated stress at the interface may be overestimated, the rheological law not taking the incipient melting into account.Further from the interface (about 1 mm from the central part of the joint), the microstructure suggests a strain rate around 10-1~1 which is close to the calculated value. The maximum strain rate predicted by the model just under the position of the flash is in good agreement with the experimental observation of microstructural damages (cracks,decohesions) in this area. The calculated maximum temperature profile (figure 12) gives a larger gradient than the profile deduced from microstructural analysis. Nevertheless there are no secondary 7 precipitates in the flash where the calculated temperature effectively exceeds 1100°C which is quite consistent with the results of our kinetic study of y dissolution (figure 1).
References
ill PI
[31
r41 II51
[61
[71
PI
/91
WI
I1 11
WI
R. Spinat and Y. Honnorat, “High temperature alloys for gas turbines and other applications”, W. Betz et al. ed., Dordrecht -D. Reidel(1986),151-157. M. Soucail,“Etude rheologique et microstructurale de 1’Astroloy en vue de la modelisation du soudage par friction inertielle” (Ph.D.thesis, Ecole des Mines de Paris, 1992). M.F. Ashby and K.E. Easterling, “A first report on diagrams for grain growth in welds”, Acta Metallurgica Sinica, 30 (1982), 1978-1982. D. Field and W.A. Backofen, Proceedings of ASTM, 57 (1957), 1259. M.J. MC Queen, G. Gurewitz and S. Fulop, “Influence of dynamic restauration mechanisms on the hot workability of Waspaloy and concentrated FCC alloys,” H&h Temperature Technology, (1983), 131-138. A.Y. Kandeil, J.P. Immarigeon, W. Wallace and M.C. de Malherbe, “Flow behaviour of Mar M200 powder compacts during isothermal forging“, Met. Science, (1980), 493-499. A.A. Guimaraes and J.J. Jonas, “Recrystallization and aging effects assosiated with the high temperature deformation of Waspaloy and Inconel7 18”, Met. Trans. A, 12A, 1981, 1655-1666. A. Laasroui and J.J. Jonas, “Prediction of steel flow stress at high temperatures and strain rates”, Met. Trans. 22A, (1991), 1545-118. A.K. Koul and J.P. Immarigeon, “Modelling of plastic flow in coarse grained nickel-base superalloy compacts under isothermal forging conditions”, Acta Met., 35, (1987), 1791- 1805. A. Moal, E. Massoni and J.L. Chenot, “A finite element modelling for the torsion and torsion -tension tests”, Proc. of ICDFT, Ed. by S.K. Ghosh Sattford, Vol 1, Lisboa 1990, 7.28-7.37. A. Moal, E. Massoni and J.L. Chenot, ” A finite element modelling for the inertia welding process”, Proc. of Int. Conf. on Computational Plasticity, Ed. by D.R.G. Owen, E. Onate, E. Hinton (Pineridge Press, Swansea), 1, Barcelona 1992,289-300. O.C. Zienkiewicz, “The finite element method in thermal problems”, Numerical Methods in Heat Transfer, Eds. John Wiley & Sons eds., 1981, l-25.
Acknowledgements
We gratefully acknowledge SNECMA for the initiation of the research, for its support and for its friction welding experiments. ANRT and SNECMA are gratefully acknowledged for the fellowships awarded to the two Ph.D. candidates (M. Soucail and A. Moal). Static heating tests were performed by Institut de Soudure (Paris).
856