Embed Size (px)
Citation preview
From Temporary Competitive Advantage to Sustainable Competitive
Advantage
Huang, K-F., Dyerson, R., Wu, L-Y. & Harindranath, G.
Forthcoming in British Journal of Management; Accepted January 2015
ABSTRACT
Both the industrial organization theory (IO) and the resource-based view of the firm (RBV)
have advanced our understanding of the antecedents of competitive advantage but few have
attempted to verify the outcome variables of competitive advantage and the persistence of
such outcome variables. Here by integrating both IO and RBV perspectives in the analysis of
competitive advantage at the firm level, our study clarifies a conceptual distinction between
two types of competitive advantage: temporary competitive advantage and sustainable
competitive advantage, and explores how firms transform temporary competitive advantage
into sustainable competitive advantage. Testing of the developed hypotheses, based on a
survey of 165 firms from Taiwan’s information and communication technology industry,
suggests that firms with a stronger market position can only attain a better outcome of
temporary competitive advantage whereas firms possessing a superior position in
technological resources or capabilities can attain a better outcome of sustainable competitive
advantage. More importantly, firms can leverage a temporary competitive advantage as an
outcome of market position, to improving their technological resource and capability position,
which in turn can enhance their sustainable competitive advantage.
Key Words: sustainable competitive advantage, resource-based view of the firm, industrial
organization economics, technological capability, market power
1
INTRODUCTION
The concept of competitive advantage has been widely discussed by prior researchers.
Most of the prior studies have mainly investigated the factors facilitating a firm’s sustainable
competitive advantage, such as intellectual capital (Hsu and Wang, 2012), innovation (Barrett
and Sexton, 2006), or dynamic capabilities (Bowman and Ambrosini, 2003; Easterby‐Smith
and Prieto, 2008; Macher and Mowery, 2009; Pandza and Thorpe, 2009). However, these
studies rarely attempt to look into the different natures of temporary and sustainable
competitive advantage, with few exceptions. For instance, Bowman and Ambrosini (2000)
differentiate value creation from value capture from the perspective of the difference between
temporary competitive advantage (TCA) and sustainable competitive advantage (SCA) while
Ambrosini and Bowman (2010) investigate how causal ambiguity affects the sustainability of
competitive advantage and rent appropriation. No matter what arguments the prior studies
propose, the concept of competitive advantage is particularly discussed by industrial
organization (IO) economists as well as proponents of the resource-based view of the firm
(RBV). Although one can acknowledge the differing starting point and assumptions of the
essentially inward looking RBV and the externally focused gaze of the IO approach, both at
heart are concerned with competitive success. The IO proponents assert that competitive
2
advantage (or superior profit) is attained if the firm has a stronger market position in an
industry compared to competitors, created for example through economies of scale (Caves
and Porter, 1977; Porter, 1980; Rumelt, 1991). Alternatively, RBV researchers suggest that
sustained competitive advantage arises from the firm’s possession of resources and
capabilities with particular characteristics (Barney, 1991). These competitive advantage
studies either focus on how independent variables affects firm performance from the RBV
perspective or on the sustainability of superior performance for a long period of time from the
IO perspective. However, such studies rarely investigate how a firm moves from TCA to SCA
based on an integrated view of both the RBV and IO perspectives (with an exception by
Nickerson, Hamilton, and Wada’s (2001) study). In this paper, we integrate the RBV and IO
perspectives into one framework to explain how a firm can attain a TCA and then move to a
SCA.
Depending upon the underlying theory, a firm’s competitive advantage is determined by
two major forces, an endogenous force from resources and capabilities and an exogenous
force from market position in an industry (the ‘industry effect’). A common link among these
two streams of studies is the focus on firm performance as the dependent variable although it
is considered an imprecise proxy (Crook, Ketchen, Combs, and Todd, 2008). There have been
considerable studies devoted to testing how various variables affect firm performance but
little attention has been paid to the detailed mapping of performance itself (Wiggins and
3
Ruefli, 2002). No specific definition distinguishes TCA from SCA in prior studies, except
Barney’s (1991) and Wiggins and Ruefli’s (2005) studies. Barney (1991) suggests that firms
can achieve SCA if they possess resources with valuable, rare, inimitable, and
non-substitutable (VRIN) attributes and just a TCA if firms possess resources displaying only
valuable and rare (VR) attributes. Sustained competitive advantage may be made up of a
series of temporary advantages over time (Wiggins and Ruefli, 2005; D’Avenni et al; 2010).
Less clear though is how firms move from TCA into SCA.
The competitive advantage attained from the environmental structure may vanish if
environmental factors change. For instance, markets may be punctuated by processes of
creative destruction manifested through shocks and technological discontinuities (Schumpeter,
1934), or hyper-competition (D’Aveni, 1994), which may erode the original competitive
advantage derived from the original market structure. Therefore, firms need to appropriate
value from their TCA and then transform it into resources or capabilities with valuable, rare,
inimitable, and non-substitutable attributes to attain SCA. A recent research stream, the
dynamic capability perspective, has extended the research focus to how firms can sustain
competitive advantage for a period of time when facing dynamic and fast-changing
environments (Teece, Pisano, and Shuen, 1997). However, prior research rarely empirically
investigates the relationships among market position, resource and capability position, TCA,
and SCA. Our research proposes a framework wherein firms will attain a better outcome of
4
TCA via a stronger market position (IO perspective), transform the appropriated value from
TCA into resources and capabilities (RBV perspective), and then utilize these resources and
capabilities to achieve a better outcome of SCA.
In order to meet the research objectives, a questionnaire survey of 165 Taiwan’s
information and communication technology (ICT) firms was conducted and structural
equation methods were employed to examine our developed hypotheses. After the
introduction, we discuss related literature and develop the research hypotheses in section two.
Section three describes the research method and section four provides the empirical results.
Section five discusses the findings while the last section concludes the paper.
THEORETICAL BACKGROUND AND HYPOTHESIS DEVELOPMENT
Competitive advantage and firm performance
As Powell (2001) notes, prior theories suggest that superior performance arises from
different SCAs. Whatever the underlying theory, a firm’s competitive advantage is determined
by two major forces, an endogenous force from resources and capabilities (the RBV
perspective), and an exogenous force from market position (the IO perspective). From the IO
perspective, superior performance derives from monopoly rents sustained by protected market
positions (Caves and Porter, 1977; Porter, 1980). From the RBV perspective, Ricardian rents
take place due to idiosyncratic firm specific resources (Lippman and Rumelt, 1982;
Wernerfelt, 1984), or Schumpeterian rents emerge due to the dynamic capability to renew
5
advantages over time (Teece et al., 1997). Thus, a firm achieves a superior performance either
from a stronger market position (Porter, 1980) or from possessing valuable, rare, inimitable,
and non-substitutable resources (Barney, 1991). In other words, a firm’s competitive
advantage consists of two components, sources of competitive advantage (i.e., market
position or resources) and the outcome of competitive advantage (i.e., performance such as
profitability).
A common connection in these two streams is the focus on how firm can attain superior
firm performance or economic rents. There have been a considerable number of studies
regarding how various independent variables affects superior firm performance for a
persistent period of time (Powell, 2001). For instance, Mueller’s (1986) time series regression
of 600 large industrial firms in the US over the period between 1950 and 1972 finds that profit
levels (ROA) converge toward the mean of ROA, but the highest-performing firms converge
most slowly, and even some high-performing firms increase profitability over time.
Alternatively, by using ROI as the measure for firm performance, Jacobsen (1988) finds that
profit levels converge over the period between 1970 and 1983 but do not persist. Using a
different methodology, Wiggins and Ruefli (2002) also find that only a rare minority of firms
exhibit superior economic performance and that the duration of sustainability declines
(measured by ROA and Tobin’s q) over the period between 1974 and 1997. However, these
studies (Wiggins and Ruefli 2002 study excepted) regarding the persistence of superior
6
economic performance focus on whether firms can sustain their superior profits over a period
of time by comparing the variation from the mean profit of the sample industry, but pay less
attention on differentiating a firm’s TCA and SCA and on which antecedents determine TCA
or SCA.
Partly readdressing the balance, D’Aveni, Dagnino, and Smith (2010) called a special
issue to remind strategic management researchers of the distinction between TCA and SCA.
The major concern in that issue was: what if sustainable advantages did not exist? (D’Aveni
et al., 2010) In answering their own question, D’Aveni et al. suggests that ensuring a string of
temporary advantages might then become the focus of strategy. Further research suggests that
the temporary component of competitive advantage is rising compared to the long run
component of SCA (Thomas and D’Aveni, 2009). However, the focus on TCA and SCA
should not be constrained by their substitution for each other. In fact, there ought to be a
causal relationship between these two competitive advantages. As noted by Wiggins and
Ruefli (2005), firms with SCA are likely to be companies which achieved a series of TCAs
over a period of time. Our study concurs with their proposition and attempts to provoke an
integrative view of TCA and SCA.
An integrative view of temporary and sustainable competitive advantage
Before beginning the theoretical induction, there are two assumptions in our framework:
(1) destruction assumption and (2) mobility assumption.
7
Destruction assumption
Destruction assumption refers to the unpredictability of sustaining a competitive
advantage by a firm. Inherently, our view of the environmental context is that it is uncertain
because of increasingly frequent and rapid changes in technology and market demand. The
incumbent firm’s competitive advantage generated by the environmental structure may vanish
if creative destruction processes take place in the market in which markets are punctuated by
shocks and technological discontinuities (Schumpeter, 1934). Such violent and
hypercompetitive environments may destroy the equilibrium among players in the industry,
which in turn erode the advantageous firm’s superior performance (Wiggins and Ruefli,
2005).
Both Porter’s five forces model and the resource-based view are rooted in a conception
of the world that is essentially stable (D’Aveni et al., 2010). However, an increasing number
of studies suggest that formerly stable environments are becoming uncertain as a result of
accelerating technological change, globalization, industry convergence, aggressive
competitive behaviour, deregulation, and so on. Thus, any status quo generated by
competitive advantage would be subject to disruption. For instance, Nokia and Motorola had
been two of the largest handset makers in the world up until early 2000. However, Motorola’s
leadership in terms of market shares was weakened as the market migrated from
analogue-based mobile phones (1G) to digital-based mobile phones (2G) (He, Lim, and Wong,
8
2006). Nokia similarly lost leadership and market share to Apple and Samsung as the system
transformed from 2G to 3G in the second half of the new millennium’s first decade. The
strong market position (larger market share) of the incumbents in the mobile phone industry
was eroded as the technology base in the handsets shifted. This suggests that the superior firm
performance generated by a strong market position (market share) may only be temporarily
and not sustainable once a destructive environment ensues. This prompts us to argue that the
competitive advantage derived from industry structure or market position as suggested by the
IO school may be temporary instead of sustainable depending on the frequency and level of
destructive events.
Mobility assumption
From the RBV perspective, valuable, rare, inimitable resources or capabilities are the
foundation of superior performance or SCA (Barney, 1991; Barney and Clarke, 2007).
Nevertheless, there are two important assumptions for the above statement: (1) firms are
heterogeneous and (2) factors are imperfectly mobile among firms (Barney, 1991; Barney and
Clarke, 2007). Foss and Knudsen (2003) also reflect on Barney’s classification of VRIN
conditions, and propose two necessary conditions for achieving SCA: uncertainty and
immobility. In an era of globalization, the first assumption remains valid but the second
assumption of immobility becomes increasingly void. Major advances in cross-border
communications and transportation has both enabled and spurred rapid internationalization
9
(Beechler and Javidan, 2007; Bloodgood and Sapienza, 1996), making factors, such as capital
(Stulz, 1999) and highly skilled labour (Parey and Waldinger, 2011), mobile across countries
at lower costs. For instance, a number of semiconductor engineers were first lured away from
the US Silicon Valley to Taiwan in the l990s (Hobday, 1995), and now from Taiwan to China
(Klaus, 2003). Moreover, inter-organizational cooperation or alliances also serve as a means
for mobilizing resources that have been considered immobile by conventional RBV theorists.
When resources cannot be mobilised, inter-organizational cooperation or alliances enable the
transfer of benefits associated with such resources and, thus, weaken the imperfect mobility
condition (Lavie, 2006). For instance, an advanced technology or knowledge, which has been
considered a competitive advantage, can be mobilised from one firm to another via licensing,
technology alliances, or even via open innovation (Chesbrough, 2003). Android, a mobile
device’s operating system, developed by Google, has been overwhelmingly adopted since
Google opened its standard to hardware and software companies via the Open Handset
Alliance. This implies that a privileged resource mobilised among firms may create more
value than when it is possessed by a single firm. The above example suggests that the
assumption of imperfect mobile factors is increasingly challenged and weakened even though
some location-bounded resources or assets, such as land, remain immobile. Therefore, a firm
possessing resources or capabilities with the attributes suggested by the RBV may no longer
attain a sustainable superior performance. Of course superior rents are less likely to derive
10
from valuable, rare, and inimitable resources or capabilities, but rather from the dynamic
capability of reconfiguration and rebuilding resources over time (Teece et al., 1997; Fiol,
2001).
Taking our assumptions of destruction and mobility into account, neither the IO nor
RBV perspectives individually can fully explain SCA on their own. Although both IO and
RBV scholars agree that the fundamental objective of the firm is profit maximization or
earning above-normal returns (Conner 1991), they disagree on the antecedents of competitive
advantage. Ideally, a view on SCA should take both the IO and RBV perspectives into
consideration. The antecedents of competitive advantage raised by both IO and RBV should
complement each other to explain the difference between TCA and SCA.
Some scholars argue that hypercompetition is so pervasive that ‘all competitive
advantage is temporary’ (Fine, 1998: 30; D’Aveni, 1994). Brown and Eisenhardt (1998) assert
that a firm’s success can only be achieved from a continuous stream of temporary advantages
when the environment is ‘relentlessly shifting’. Wiggins and Ruefli (2005) also suggest that a
firm’s SCA is likely to be achieved via a series of TCAs over a period of time. From the RBV
perspective, slack resources are needed to alter current capabilities or to create new ones in
response to environmental threats or opportunities (Sirmon, Hitt, and Ireland, 2007). Thus, the
accumulation of TCAs can also be regarded as the growth of slack resources which facilitate
firms to build new capabilities and then sustain competitive advantage. Nevertheless,
11
exploring whether SCA exists or not, though a valuable question, is not the focus of this paper;
rather this paper examines the causality between TCA and SCA based on the existence of
SCA, which is increasingly accepted by theorists. Our research, therefore, attempts to provide
an integrative view of IO and RBV to shed light on the competitive advantage over a period
of time as well as to explain how a firm accumulates its TCA to achieve SCA.
From temporary competitive advantage to sustainable competitive advantage
Attaining a better outcome of TCA via stronger market position (IO perspective)
The term of “competitive advantage” has been widely studied in economics as well as
strategic management; albeit that the term itself continues to be ill-defined and subject to
debate (Leiblein, 2011). Most economic perspectives mainly explore superior economic
performance at an equilibrium point, which is compatible with the concept of TCA in the
short run. Such superior performance is attained either with the imposition of entry barriers as
the mechanism for protecting abnormal profits or from the concentrated nature of the industry
structure such as in the cases of monopoly and oligopoly (Schmalensee, 1985). Porter (1980,
1985) goes further in arguing that market structure shapes entry barriers in an industry and
further influences a firm’s long-term profitability. By analyzing five significant structural
forces (threats from potential entrants, supplier power, buyer power, substitute products, and
internal rivalry), Porter (1980) argues that a firm can exploit its competitive advantage by
positioning itself in its optimal market and then sustain its competitive advantage by erecting
12
entry barriers for competitors. Entry barriers are key industry structural factors that impact on
market shares (Mason, 1939; Porter, 1980; Dess et al., 1990) as well as economic returns
(Hofer and Schendel, 1978; Porter, 1980; McDougall et al., 1992; Robinson and McDougall,
2001). Firms could establish entry barriers through economies of scale, making large capital
investments, or producing differentiated products (Bain, 1956, 1959; Hofer and Schendel,
1978; Porter, 1980; Hay and Morris, 1991; Siegfried and Evans, 1994) in order to deter
competitors from entering the market.
However, in a fast-changing hypercompetitive environment, imitation by competitors,
new entry, or the introduction of substitutes will all erode original competitive advantages
(D’Aveni, 1994), which prevents initially superior economic performance from sustaining
into the future. Moreover, the competitive advantage resulting from the environmental
structure may disappear if these markets are punctuated by shocks and technological
discontinuities (Schumpeter, 1934). Carr (1993) finds that firms using a market-power-based
strategy significantly underperformed their competitors who adopt a resource-based strategy
over a longer period of time. This suggests that firms in possession of market positions may
gain only a temporary advantage over their rivals. Accordingly, firms with stronger market
positions are expected to attain a superior outcome of competitive advantage that is at least
temporary in dynamic and hypercompetitive environments. Hypothesis 1 summarizes our
argumentation:
13
Hypothesis 1: A firm’s stronger level of market position in an industry is expected
to increase a firm’s outcome of TCA.
Using the better outcome of TCA to accumulate technological resource/capability position
RBV theorists (Penrose, 1959; Wernerfelt, 1984; Barney, 1991; Rumelt, 1984, 1991)
argue that a firm’s SCA emerges from a firm’s command over specific resources and superior
capabilities. In their empirical study, Hansen and Wernerfelt (1989) find that organizational
factors explained about twice as much of the variance in firm profit rates as industry factors.
Rumelt (1991) also asserts that the most important determinant of the long-term rate of
business returns is not associated with industries but with the unique endowments, positions,
and strategies of individual businesses.
However, the potential to attain a competitive advantage is not inherent in all resources
(Wernerfelt, 1989). Firms can use such “barriers to imitation” to prevent duplication by other
firms in order to sustain a competitive advantage acquired through a valuable and rare
resource position (Lippman and Rumelt, 1982; Rumelt, 1984; Wernerfelt, 1989; Rumelt, 1991;
Peteraf, 1993). Several such barriers are identified in the literature, including unique historical
conditions (Dierickx and Cool, 1989; Reed and DeFillippi, 1990; Barney, 1991; Mata et al.,
1995), causal ambiguity (Teece, 1987; Reed and DeFillippi, 1990; Barney, 1991) or uncertain
imitability (Lippman and Rumelt, 1982), and social complexity (Barney, 1986, 1991, 1994;
Teece, 1987; Reed and DeFillippi, 1990).
14
From the RBV perspective, TCA stems from resources that are valuable and rare, but
that are easily imitated by rivals or cheap to reproduce. When resources are valuable, they
generate at least a TCA by reducing the organization’s costs or raising prices (Crook et al.,
2008). However, if these valuable and rare resources serve as a source of competitive
advantage and the cost to the organization of imposing inimitability is greater than the benefit
derived from such actions, other firms will soon imitate them resulting in competitive parity.
Firms with inimitable resources may also struggle to sustain competitive advantage when they
face a disruptive environment (D’Aveni et al., 2010). Under such conditions, firms may
become locked into an ongoing continuous transformation and innovation processes implied
for acquiring and developing valuable and rare resources (Audia, Locke, and Smith, 2000)
and may exhaust available financial capital for supporting the expensive consumption in
innovation or responding to intense competition. Therefore, having access to continuous and
sufficient cash inflows to secure attaining valuable and rare resources, such as continuous
product innovation (Verona and Ravasi, 2003) for a high-technology firm, becomes important,
and a firm’s better outcome of temporary competitive will provide the foundation of such cash
inflows. For instance, HTC, a Taiwanese smart phone maker, with strong innovation
capabilities in mobile technologies, has struggled to establish a SCA in the mobile industry.
HTC’s global market share in terms of sales had grown to 2.4% by 2011 (Gartner, 2012) but
has rapidly dropped since 2012. Thus, the profit and cash inflows might be quickly consumed
15
if it continually competes with rivals, Apple and Samsung, in innovation and markets without
increasing or at least sustaining its market position.
The HTC case implies that without sufficient capital generated by a better outcome of
TCA derived from a strong market position, even a firm possessing value and rare resources
or capabilities (innovative mobile technologies in the HTC’s case) may not sustain its
competitive advantage or its superior economic rents. Thus, it is important to recognize the
role played by market position in securing a TCA when a firm seeks a SCA. Prior studies also
conclude that firms with SCA are likely to have achieved a series of temporary advantages
over time (Wiggins and Ruefli, 2005), particularly in the disruption of the status quo (D’Aveni,
1994).
In short, we argue that the better outcome of TCA, a static outcome of market position,
can provide sufficient pockets of capital for supporting continuous innovation and
competition to acquire value and rare resources or capabilities, particularly technological
resources or capabilities for high-technology firms, for the sustainability of competitive
advantage (or persistent superior economic returns). Thus, a firm’s better outcome of TCA
derived from a strong market position can help it to continuously create and rebuild resources
and capabilities, which leads to a higher position of technological resources and capabilities
for high-technology firms. Hence, we derive the following hypothesis:
Hypothesis 2: A firm’s better outcome of TCA is expected to improve a firm’s
16
technological resource and capability position.
Retaining a better outcome of SCA by utilizing technological resource/capability position
(RBV perspective)
As noted earlier, from the RBV perspective, TCA stems from resources that are value
and rare while SCA arises from resources that are inimitable and non-substitutable (Barney,
1991). In a fast-changing environment, the resources that support a competitive advantage in
one or several time periods may become liabilities in a present time period (Leonard-Barton,
1992). Arend (2004) argues that strategic assets, following RBV attributes (e.g., valuable, rare,
etc.), are capabilities that are costly appropriated by the firm since they are not equally
distributed among firms and cannot be converted to a munificent state with any benefit to the
firm because of the high costs involved to do so. However, Sirmon, Hitt, and Arregle (2010)
suggest that these core rigidities or strategic liabilities do not have to be absolutely costly, but
only less valuable than competitors, as well as possessing the potential to be converted from
weakness to strength over time with a net benefit to the firm. Firms may need to give up on
seeking the once-coveted SCA but use one temporary position of strength to “hopscotch” into
another (Useem, 2000). This implies that a high-technology firm with a superior temporary
position of technological resources or capabilities (including dynamic capabilities) is more
likely to reconfigure and rebuild its resources in responding to a fast-changing environment,
and therefore achieve a better outcome SCA or superior economic rents for a longer period of
17
time. Thus, we can derive our Hypothesis 3 as following:
Hypothesis 3: A firm’s higher technological resource and capability position is
expected to increase a firm’s outcome of SCA.
————————————
Insert Figure 1 about here
————————————
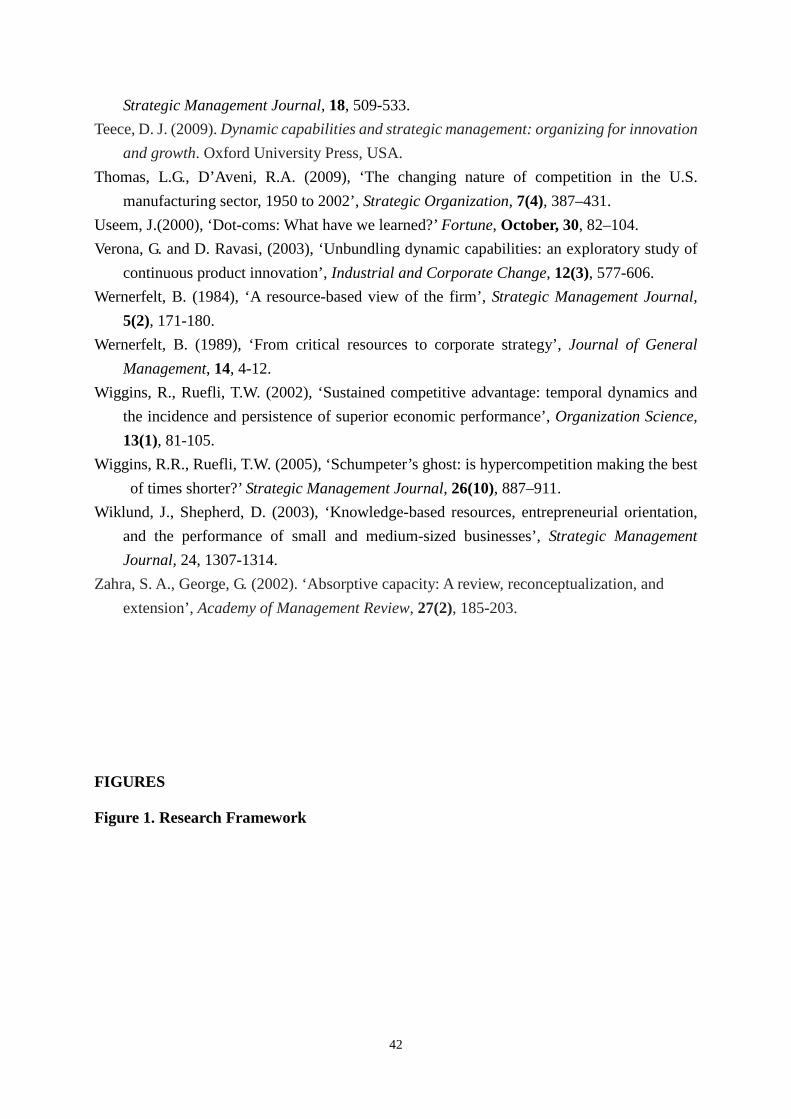
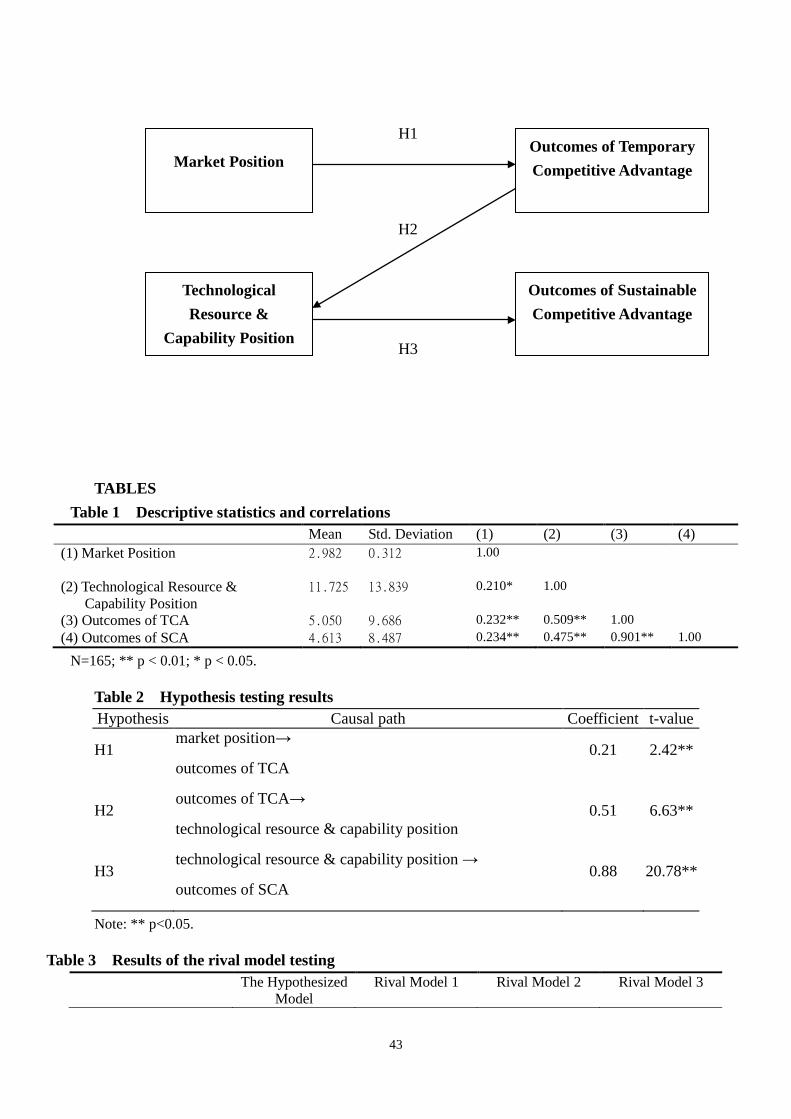
Figure 1 provides a research framework summarizing our three developed hypotheses.
RESEARCH METHOD
Theoretically, the RBV focuses on exploring competitiveness at the firm level whereas
the IO concentrates on analyzing competitiveness at the industry level. However, in order to
integrate these two different perspectives, we used the firm level as the analysis unit in our
study, which allowed us to investigate both market position and resource and capability
position in the same level. A questionnaire survey of 165 Taiwan’s high-technology firms in
the information and communication technology (ICT) was conducted and the structural
equation method (SEM) was employed to examine our developed hypotheses after data
collection.
Sample selection and data collection
The sample firms of this research were Taiwanese manufacturing firms in the ICT
industry. Due to dissimilarities between manufacturing and trade-only firms, the trade-only
firms were excluded from our samples. Moreover, only firms with seven-or-more-year
18
financial history were included in the sample for this study. Based on the above selection
criteria, 415 publicly-listed firms were selected and accounted for approximately 80% of the
production value of the entire Taiwan’s ICT industry in 2002, suggesting our sample selection
was highly representative. The firms were selected on the basis of the stock code compiled by
the Taiwan Stock Exchange Corporation (TSEC) and the Over-The-Counter (OTC), starting
with 23, 24, and 30, in the TSEC and 53, 54, 61, and 80 in the OTC.
The CEOs or senior managers of the sample firms were targeted. Two mail surveys were
conducted together with follow-up telephone and face-to-face interviews. As a result, 169 of
415 CEOs or senior managers returned their replies (40.7% response rate). After excluding
four invalid respondents, 165 firms were finally valid. An independent sample T-test tested
the two sub-samples (81 firms from the first mail survey and the rest of firms) in terms of firm
size. The result showed that the two sub-samples had no significant difference (F =2.564, p >
0.1). This suggests that non-response bias might not be a problem.
Quantitative data in this research was gathered from varied sources, including Taiwan’s
official government publications and corporate financial statements. For instance, return on
asset (ROA) was derived from the database of the Securities & Futures Institute (SFI).
Research approach and statistical techniques
Following Huber and Power (1985) and Miller et al. (1997), we used a retrospective
report method to evaluate the independent variables in this research. Respondents were asked
19
to evaluate the items in the questionnaire in 2002. This allowed us to measure market position,
which is rarely used in traditional IO studies.
To establish the groundwork for our research and to develop the measures for our
constructs, a total of 26 items for a firm’s market position were designed in our multi-purpose
questionnaire. All items were standardized as five-point Likert scale questions ascending from
1 (strongly disagree) to 5 (strongly agree) in the type of agreement questions. The validity of
construct measurement in the questionnaire was checked by Cronbach’s alpha. The overall
value of Cronbach’s alpha in our study is 0.7, which is theoretically acceptable (Henson,
2001).
After data collection, we used path analysis via a structural equation procedure to test
our developed hypotheses. The path analysis procedure is becoming common in management
studies when a small sample size restricts the use of full structural equation models (Li and
Calantone, 1998; Chaudhuri and Holbrook, 2001), allowing us to examine the relationship
between multiple independent variables and multiple dependent variables.
Dependent variables
There are two dependent variables in this research: outcomes of TCA and SCA.
Outcomes of TCA
Indictors such as return on assets (ROA), return on equity (ROE), or return on sales
(ROS) are normally adopted to measure a firm’s profitability or the outcome of competitive
20
advantage in various economic and management studies. Since ROA, in particular, is widely
accepted by business practitioners and academic researchers (Scherer and Ross, 1990; Corbett
and Claridge, 2002; Eriksena and Knudsen, 2003), ROA was employed as our indicator for
measuring the outcome of a firm’s competitive advantage. Taking into account the short
industry life cycle for the ICT industry (Moore’s Law suggested that the capacity of
semiconductor chips doubles every 18-24 months), a firm’s outcome of TCA was measured
by a three-year averaged ROA between 2003 and 2005.
Outcomes of SCA
Time spans for sustainable profitability measures vary among different studies. For
industrial organization economics studies, the time span for measuring the sustainability of
profitability can be more than twenty years (Mueller, 1986; Wiggins and Ruefli, 2002).
Alternatively, for general management research, a shorter time span is used, such as the
five-year averaged ROA in Eriksena and Knudsen’s (2003) study or a six-year averaged ROA
in Said et al. (2003) study. Moreover, the time span for sustainable profitability also varies
among different industries due to the nature of the product life cycle. A short product life
cycle increases the possibility of competition among firms. It shortens the time span of a new
product in the market and imposes on firms the need to continually innovate. To some extent,
this implies that the leading firm can only possess its technology advantage over a short time
period and often loses the advantage of lower unit costs generated from long-term production
21
(Dedrick and Kraemer, 1998). Thus, the sustainability of competitive advantage varies among
different industries due the nature of the product life cycle. In our research, considering the
short life cycle of Taiwan’s ICT industry, a firm’s outcome of SCA in our research was
measured by a six-year averaged ROA between 2003 and 2008.
Independent variables
We used the questionnaire survey to assess market position and incorporated secondary
data to assess the resource and capability position.
Market position
Traditionally, conventional industrial organization economists use the concentration
ratio as a measure for market position, such as the four-firm concentration, the Herfindahl
index1, and the Lerner index2 (Lerner, 1934; Scherer, 1965; Ornstein et al., 1973; Feinberg,
1980; Lippman and Rumelt, 1982; Carlton and Perloff, 1994; Barla, 2000). Nonetheless, the
above measures for market power have some limitations. Lippman and Rumelt (1982)
commented that both the concentration ratio and the Herfindahl index might not be able to
predict the relationship between market position and profitability. Moreover, the conventional
instruments are normally employed for analysing market position at the industry level, which
may not be appropriate for our analysis at the firm level. Thus, we used the questionnaire to
1 The Herfindahl index refers to the sum of the squared market shares of all firms in an industry (Lippman and Rumelt, 1982; Barla, 2000). 2 The Lerner index refers to (P-MC)/P while P represents price and MC represents marginal cost. It proposes an index of divergence from optimal resource allocation and is frequently applied as a measure for the effects of concentration, firm size, or entry barriers (Feinberg, 1980).
22
assess a firm’s market position based on Porter’s (1980) five-force framework, which
included threats from new entrants, bargaining power of suppliers, bargaining power of
buyers, pressure from substitute products, and the extent of internal rivalry from competitors.
In addition to Porter’s (1980) five forces, we have also included the institutional context such
as industrial policies, which are suggested associated with a firm’s market position (Porter,
1998). We designed a five-point Likert scale questionnaire with 26 items to measure these six
important factors determining a firm’s market position (please see Appendix 1 for the detailed
questions). Market position was calculated by the mean of these 26 items.
Technological resource or capability position
In this study, we measured a firm’s resource and capability position with its
technological resources and capabilities since they are critical factors to a high-technology
firm’s performance (Miyazaki, 1995), which was the context for our sample firms (ICT firms).
Prior studies have shown that a firm’s technological innovative capabilities are significant
sources of competitive advantage (Porter, 1985; Barney, 1991; Kogut and Zander, 1992).
Moreover, a firm’s position in technological resources and capabilities is an outcome of the
combination of different resources and capabilities such as organizational learning,
organizational structure, employee knowledge, top management strategy, culture, or networks
with external resources. Thus, focusing on a firm’s position in technological resources and
capabilities enables us to narrow the scope of this research without neglecting the
23
interrelationship with other resources or capabilities for the high-technology firm.
Prior studies use a Likert-scale questionnaire to measure a firm’s resource depth
(Laamanen, 2005), capability position (Jaffe 1986; Huang, 2011), or knowledge position
(Gupta and Govindarajan, 2000; Wiklund and Shepherd, 2003). However, since a firm’s
specific assets facilitate a firm’s strategic posture of competitive advantage, we used
technological assets to interpret the position of a firm’s technological resources and
capabilities. Patent data has been increasingly used as an indicator of corporate technological
capabilities or assets in management research (Jaffe 1986, Patel and Pavitt 1994, Mowery et
al. 1996; Silverman, 1999; Almeida and Phene, 2004; Huang, 2011). Particularly for
high-technology firms, patent data offer richer information on technological strengths
possessed by a firm (Silverman, 1999). However, patent data have some limitations. For
instance, much of a firm’s technical knowledge may remain unpatented (Silverman, 1999).
While patents may not directly measure a firm’s noncodifiable knowledge or resources, they
should function as a partial and noisy indicator of its unpatented technological resources
(Robins and Wiersema, 1995; Silverman, 1999). Thus, our study used patent stock as an
indicator of a firm’s technological resource and capability position since it can represent the
entire patented and unpatented resources and capabilities of a technological firm.
Consequently, to measure a firm’s technological resource and capability position, our study
used the total number of applied patents for each firm, suggested by Almeida and Phene
24
(2004), between 2003 and 2005.
RESULTS
Descriptive statistics and correlations
Table 1 summarized the descriptive statistics for the 165 firms of this study. The mean
of outcomes of TCA (3-year ROA) was 5.05%, while the mean of outcomes of SCA (6-year
ROA) was 4.61%. Moreover, the mean of technological resource and capability position was
11.73 while the mean of market position was 2.98 in this research. Table 1 also presented the
correlation matrix among the variables. The results showed that problems of multicollinearity
should not significantly influence the stability of the parameter estimates since the VIF value
of all independent variables were less than 10.
————————————
Insert Table 1 about here
————————————
Hypothesis testing
The structural relationship was tested using path analysis via a structural equation
procedure. Calantone, Schmidt and Song (1996), Cavusgil and Zou (1994), and Price,
Arnould, and Tierney (1995) proposed using a summary of item scores to test relations among
constructs because this method yields an acceptable variable-to-sample size ratio and
simplifies the model. Path analysis in LISREL was performed for hypotheses testing.
25
The model fit indexes indicated that the model was acceptable (χ2(3)= 3.61, RMSEA=
0.040, GFI= 0.986, CFI= 0.998, NNFI= 0.995). All of the three hypotheses are supported (see
Table 2), including H1 (the outcome of TCA increases with market position)(β= 0.21,
t-value= 2.42), H2 (technological resource & capability position increases with the outcome
of TCA)(β= 0.51, t-value= 6.63), and H3 (the outcome of SCA increases with technological
resource & capability position)(β=0.88, t-value= 20.78).
————————————
Insert Table 2 about here
————————————
A rival model testing
In our hypothesized model, the focal or central variable is the technological resource and
capability position because it performs as a mediator between the antecedents and the
consequence constructs. In other words, the hypothesized model does not have direct paths
from the antecedents (market position and outcomes of TCA) to the consequence constructs
(outcomes of SCA). Based on the strategy management literature on market position and
outcomes of TCA, a potential alternative model would be that these two constructs may have
a direct impact on outcomes of SCA. In the rival models, three conditions are allowed to test
the relationship between original antecedent variables (i.e., market position and outcomes of
TCA) and outcomes of SCA. Thus, in the rival models, technological resource and capability
position does not completely mediate.
26
Following Bollen and Long (1992), this study compared the hypothesized model with
three rival models: Model 1: adding “market position to outcomes of SCA” path; Model 2:
adding “outcomes of TCA to outcomes of SCA” path; and Model 3: adding both of them
(shown in Table 3). This helps us test the nomological status of the focal variable (e.g.,
Morgan and Hunt 1994; Ramani & Kumar, 2008). Because all the models use the exact same
covariance structure as the input, and thus are nested, this study compared the models using
the following criteria: (1) the chi-square difference test, (2) overall fit of the model, as
measured by the RMSEA, CFI, and NNFI, and (3) percentage of the model’s significant
structural paths.
————————————
Insert Table 3 about here
————————————
As shown in the results on Table 3, the rival model was less parsimonious than the
hypothesized model (comparison in number of distinct parameters to be estimated). The test
results indicated that all of the rival models did not explain the covariance structure any better
than the hypothesized model. Moving to comparing the criteria index, these results also
indicated a preference for the hypothesized model over other rival models, so favoring the
original model. Finally, the percentage of estimated paths supported in the hypothesized
model (3/3 = 100%) was greater than the percentage of estimated paths supported in all rival
models (3/4 = 0.75% for Models 1 and 2; 3/5 = 60% for Model 3). Our study therefore prefers
27
the more parsimonious hypothesized model to the rival models. This result also implies that
the technological resource and capability position holds a central nomological status and
therefore is a key construct in explaining a firm’s outcome of SCA.
Since the cross-sectional nature between outcomes of TCA and the technological
resource/capability position may cause a concern for reverse-causality and endogeneity issues
in this study, we have provided the remedies by testing reverse-causality models and using the
two-stage Heckman procedure (Heckman, 1978, 1979) respectively. The results show that
both reverse-causality and endogeneity issues are not serious concerns in our research (Please
see Appendix 2).
DISCUSSION
Market position and outcomes of temporary competitive advantage
As shown in Table 2, Hypothesis 1 was supported, suggesting that a firm’s market
position in an industry was positively associated with a firm’s outcome of TCA. As suggested
by the IO economists, firms with a stronger market position may create an entry barrier
constraining the entry of potential competitors and therefore achieve a better competitive
advantage. Our results supported the IO theorists’ proposition that a firm’s TCA can be gained
via strengthening its market position in an industry. Going further Rival Model 1 and Rival
Model 3 suggested that a firm’s market position in an industry was observed as having no
influence on a firm’s outcome of SCA. These results support our argument that the
28
competitive advantage resulting from entry barriers or market concentration is temporary.
Such competitive advantage helps firms to reach an outcome performance in the static
equilibrium at a specific spot of time (i.e. TCA), but it will not be sustained if the
environment changes dramatically, such as through creative destruction in technology
development (Schumpeter, 1934) or hyper-competition (D’Aveni, 1994). More importantly,
this implies that the TCA attained at the specific spot of time via a strong market position will
struggle to be sustainable if firms only focus on exogenous factors influencing market
position.
Transforming temporary competitive advantage to technological resource/capability
position
As shown in Table 2, Hypothesis 2 was also supported, suggesting that a firm’s
short-term superior economic performance contributes to its accumulation of technological
resources and capabilities, particularly in the ICT industry. This is very important for helping
us to understand how a better outcome of TCA can be transformed into a SCA. While our
Hypothesis 1 suggests that a stronger market position helps a firm to generate a superior
economic performance for the short term, Hypothesis 2 suggests that the generated superior
economic performance can be utilized into the accumulation of the firm’s technological
resource and capability position. This implies a potential causal relationship between the
market position and the technological resource/capability position via the mediation of
29
short-term superior economic performance (or outcomes of TCA), which has not been fully
investigated in prior research.
. As shown in our Rival Models 2 and 3, outcomes of TCA (or short-term profits) did
not directly contribute to outcomes of SCA. Firms need to have sufficient financial support,
generated via a strong market position in the short term, to continuously build, redeploy, and
reconfigure their resources and capabilities and then to achieve a better position of
technological resources and capabilities for sustaining superior economic rents for a longer
period of time.
Technological resources and capability position enhances a better outcome of sustainable
competitive advantage
Table 2 indicates support for Hypothesis 3, suggesting that a firm’s technological
resource and capability position is positively associated with a firm’s outcome of SCA. Our
results were consistent with the prior RBV proposition that a firm’s SCA emerges from a
firm’s specific resources and superior capabilities (Penrose, 1959; Wernerfelt, 1984; Barney,
1991). The observed positive association implies that a firm with a strong technological
resource and capability position can sustain its superior economic performance for a period of
time and therefore the high-technology firm should accumulate and nurture its technological
resources and capability in order to attain dynamic equilibrium and SCA.
Transformation from temporary competitive advantage to sustainable competitive
30
advantage
Our findings partially support Wiggins and Ruefli’s (2005) study and provide a more
insightful explanation as to how a firm’s SCA could be achieved via a series of TCAs.
Incorporating market position, resource and capability position, and competitive advantage
from an integrated view of the IO and RBV perspectives, our study found that a
high-technology firm’s TCA can be attained via a stronger market position whereas a SCA
can only be secured through strong positions in technological resources and capabilities which
are accumulated via a series of TCAs. From our findings, a superior market position is a
sufficient condition for TCA while a superior resource and capability position is a sufficient
condition for SCA. Most importantly, a TCA is the foundation of improving a firm’s resource
and capability position, which in turn enhances SCA. Although we do not explore in this
paper the exact mechanisms through which a temporary market advantage may be utilized to
move the organization into a stronger resource and capability position, which
knowledge-based organizational processes have been explored by other scholars (Grant, 1996;
Zahra and George, 2002; Teece, 2009), our results help to clarify the theoretical logic for how
a firm can move from TCA to SCA.
CONCLUSION
Our study suggests that high-technology firms with a stronger market position can help
in attaining a better outcome of TCA whereas the firms possessing a superior position in
31
technological resources or capabilities accumulated via a better outcome of TCA can attain a
better outcome of SCA. By recognizing the existence of the destruction and mobility
assumptions, our research provides an empirical attempt to integrate both IO and RBV
perspectives to investigate a firm’s competitive advantage at the firm level. Another
contribution of our study is that we distinguish between the sources of two different
competitive advantages by integrating both IO and RBV perspectives: market position as a
source of TCA and resource/capability position as a source of SCA. Our empirical results not
only support the Wiggins and Ruefli’s (2005) proposition that SCA is likely to be achieved via
a series of TCAs, but go further in providing a relatively clear set of causal relationships
among market position, resource/capability position, and competitive advantage (both
temporary and sustainable), which has not been fully empirically investigated in prior studies.
In arguing the important role of resources and capabilities for SCA, our study shows that
market position is an antecedent only for TCA but nonetheless, the temporary superior
economic returns derived from strong market positions can provide capital for accumulating
resources and capabilities. Business practitioners can learn lessons from our research by
understanding that firms should establish a stronger market position in an industry to
maximize outcomes of TCA but also focus on accumulating or nurturing a superior position in
resources and capabilities for better outcomes of SCA. Particularly in the Taiwan’s ICT
industry, a high-technology firm should use its strong market position to generate short-term
32
superior economic rents, and then use the generated capital to accumulate its position on
technological resources or capabilities (patents in this research), to sustain its superior
economic rents for a longer period of time.
By understanding that a firm’s SCA is attained via its resource and capability position
whereas a firm’s TCA is attained via its market position, policy makers can also learn from
this study by refining policies for enhancing firm performance. Policy makers could
re-examine policies designed to facilitate a supportive environment for firms to develop their
resources or capability, which in turn attain SCA. In the meantime, since a weak market
position will affect a firm’s outcome of TCA, making it vulnerable to insufficient capital to
accumulate resources or capabilities, policy makers may facilitate an equal-chance
competition environment for firms in an industry.
One of major limitations is that a part of cross sectional data has been inevitably used in
this research. Being aware of the drawback of cross sectional data on the causality research,
we have deliberately created the time lag between independent variables and dependent
variables. However, since we need to examine the effects of market position on both
outcomes of TCA and SCA simultaneously as well as the sequential effects from market
position, outcomes of TCA, technological resource & capability position, to outcomes of SCA,
the use of cross sectional data for outcomes of TCA and the technological resource &
33
capability position (both from 2003 to 2005) is inevitable3. Having said that, future studies
may improve on our research design. Another research limitation is the possible effect of
interruption of a series of temporary competitive advantages on sustainable competitive
advantage. If a series of temporary competitive advantages are interrupted, sustainable
competitive advantage might be nullified. However, if the series of temporary competitive
advantages are ‘briefly’ interrupted but remain to be accumulated after the interruption, then
sustainable competitive advantage should not be completely nullified. Assuming that the
interruption has not lasted for a lengthy period of time or permanently, a short-period
interruption should not immediately and completely nullify sustainable competitive advantage
due to path dependency and organizational inertia on competitive advantage. However, due to
the restriction of the research framework and construct measurement, our study was unable to
examine whether the interruption of temporary competitive advantage accumulation has an
impact on sustainable competitive advantage. Future studies are highly encouraged to
investigate this line of the research. Furthermore, this research did not examine the mediation
effect of technological competencies on the relationship between outcomes of temporary
3 As shown in Appendix 3, we attempt to argue that market position only helps firms to attain a better outcome of TCA (H1) instead of a better outcome of SCA (P1). Thus, while market position was measured in 2002, TCA was measured between 2003 and 2005 (a 3-year span) and SCA was measured between 2003 and 2008 (a 6-year span), which exhibited a reasonable time lag between the independent (market position) and dependent variables (outcomes of TCA and SCA). However, in this study, we also test whether a firm will transform its outcome of TCA into an outcome of SCA via its technological resource and capability position (H2 & H3) instead of directly from a TCA to a SCA (P2). If we create a time lag between an outcome of TCA (i.e., 2003-2005) and a technological resource & capability position (i.e., 2004-2006), the 2004-2006’s technological resource & capability position cannot then predict the 2003-2008’s SCA (H3). If we push the time span for outcomes of SCA further away, for example 2005-2010, then our first research purpose may be problematic since there is a three-year gap between market position 2002) and SCA (2005-2010), which may not allow us to compare H1 and P1. Thus, we have to keep the cross sectional data for the two variables, outcomes of TCA and technological resource & capability position, in order to meet our research purpose in the framework.
34
competitive advantage and technological resource and capability position due to the limitation
of our data structure (i.e., we did not measure a firm’s competencies between 2003 and 2005).
Future studies are encouraged to further investigate this effect. Moreover, patent applications
may only partially but not fully explain SCA. Instead of measuring other types of resources or
capabilities by asking firms to evaluate the resources or capabilities themselves, we used the
accumulated patent number as a proxy to reflect a firm’s position or repertoires of
technological resources and capabilities for the following reasons. First, patents are an
appropriate proxy since it reflects the outcome of a firm’s efforts, including technological
resources and capabilities, on its business operation. Better combination and reconfiguration
of resources and capabilities can help firms to develop new technologies or new products,
which are patented to protect their potential of value appropriation. Thus, patents reflect a
repertoire of summed technological resources and capabilities which have been invested in.
Second, particularly in the high-technology industry, patents are the most important indicator
for a firm to demonstrate its ability and potential to appropriate future value creation.
Therefore, compared to other resources, such as brands, patents can better capture the sources
of SCA for the high-technology-oriented firms, which were our sample population. However,
we also recognized the limitation of research design in this research prohibits us from
employing different measures for the resource and capability position, and encourage future
studies to use different measures.
35
REFERENCES Almeida, P., Phene, A. (2004), ‘Subsidiaries and knowledge creation: the influence of the
MNC and host country on innovation’, Strategic Management Journal, 25, 847–64. Ambrosini V., Bowman C. (2010). ‘The Impact of Causal Ambiguity on Competitive
Advantage and Rent Appropriation’, British Journal of Management, 21, 939–953. Arend, R.J. (2004), ‘The definition of strategic liabilities, and their impact on firm
performance’, Journal of Management Studies, 41(6), 1003–1027. Audia, P., Locke, E.A., Smith, K.G. (2000), ‘The paradox of success: an archival and
laboratory study of strategic persistence following a radical environmental change’, Academy of Management Journal, 43(5), 837–854.
Bain, J. (1956), Barriers to New Competition. Harvard University Press: Cambridge. Bain, J. (1959), Industrial Organization. Wiley: New York. Barla, P. (2000), ‘Firm size inequality and market power’, International Journal of Industrial
Organization, 18, 693-722. Barney, J. (1986), ‘Organizational culture: Can it be a source of competitive advantage’,
Academy of Management Review, 11(3), 656-665. Barney, J. (1991), ‘Firm resources and sustained competitive advantage‘, Journal of
Management, 17(1), 99-120. Barney, J. (1994), Competitive Advantage from Organizational Analysis. Texas A&M
University Working Paper: Texas. Barney, J. B., Clark, D. N. (2007). Resource-Based Theory: Creating and Sustaining
Competitive Advantage. Oxford University Press: Oxford. Barrett, P. Sexton, M. (2006). ‘Innovation in small, project-based construction firms’, British
Journal of Management, 17, 331-346. Beechler, S., Javidan, M. (2007). ‘Leading with a global mindset’, Advances in International
Management, 19, 131–169. Bloodgood, J.M., Sapienza, H.J. (1996), ‘The Internationalization of New High-Potential U.S.
Ventures: Antecedents and Outcomes’, Entrepreneurship: Theory & Practice. 20, 61–76. Bollen, K.A., Long, S.J., (1992), ‘Test for structural equation models: introduction’,
36
Sociological Methods and Research, 21(2), 123-131. Bowman, C., Ambrosini, V. (2000). ‘Value Creation Versus Value Capture: Towards a
Coherent Definition of Value in Strategy’, British Journal of Management, 11, 1-15. Bowman, C., Ambrosini, V. (2003). ‘How the resource-based and the dynamic capability
views of the firm inform competitive and corporate level strategy’, British Journal of Management, 14, 289–303.
Brown, S.L., Eisenhardt, K.M. (1997), ‘The art of continuous change: linking complexity theory and time-paced evolution in relentlessly shifting organizations’, Administrative Science Quarterly, 42(1), 1–34.
Calantone, R.J., Schmidt, J.S., Song, X.M. (1996), ‘Controllable factors of new product success: a cross-national comparison’, Marketing Science, 15, 341-358.
Carlton, D.W., Perloff, J.M. (1994), Modern Industrial Organization, 2nd ed. HarperCollins: New York.
Carr, C. (1993), ‘Global, national and resource-based strategies: An examination of strategic choice and performance in the vehicle components industry’, Strategic Management Journal, 14(7), 551-568.
Caves, R., Porter, M. (1977), ‘From entry barriers to mobility barriers: conjectural decisions and contrived deterrence to new competition’, Quarterly Journal of Economics, 91, 241–262.
Cavusgil, S.T., Zou, S. (1994), ‘Marketing strategy-performance relationship: an investigation’, Journal of Marketing, 58, 1-21.
Chaudhuri, A., Holbrook, M.B. (2001), ’The chain of effects from brand trust and brand affect to brand performance: the role of brand loyalty’, Journal of Marketing, 65, 83-93.
Chesbrough, H. (2003), Open Innovation: The New Imperative for Creating and Profiting from Technology. Harvard Business School Publishing: Boston, MA.
Conner, K.R. (1991), ‘A historical comparison of resource-based theory and five schools of thought within industrial organization economics: Do we have a new theory of the firm’, Journal of Management, 17(1), 121-154.
Corbett, L.M., Claridge, G.S. (2002), ‘Key manufacturing capability elements and business performance’, International Journal of Production Research, 40(1), 109-131.
Crook, T.R., Ketchen, D.J., Combs, J.G., Todd, S.Y. (2008), ‘Strategic resources and performance: a meta‐analysis’, Strategic Management Journal, 29, 1141-1154.
D’Aveni, R.A. (1994), Hypercompetition: Managing the Dynamics of Strategic Maneuvering. The Free Press: New York.
D’Aveni, R.A., Dagnino, G.B., and Smith, K. (2010), ‘The age of temporary competitive advantage’, Strategic Management Journal, 31, 1371-1385.
Dedrick J., Kraemer K.L. (1998). Asia’s Computer Challenge. Oxford University Press: New York.
Dess, G.G., Ireland, R.D., Hitt, M.A. (1990), ‘Industry effects and strategic management
37
research’, Journal of Management, 16(1), 7-27. Diamantopoulos, A., Siguaw, J. A. (2006). ‘Formative Versus Reflective Indicators in
Organizational Measure Development: A Comparison and Empirical Illustration’, British Journal of Management, 17, 263-282.
Dierickx, L, Cool, K. (1989), ‘Asset stock accumulation and the sustainability of competitive advantage’, Management Science, 35(12), 1504-1511.
Easterby-Smith, M., Prieto, I. (2008). ‘Dynamic capabilities and knowledge management: an integrative role for learning?’ British Journal of Management, 19 (3), 235-249.
Eriksena, B., Knudsen, T. (2003), ‘Industry and firm level interaction Implications for profitability’, Journal of Business Research, 56, 191-199.
Feinberg, R.M. (1980), ‘The Lerner Index, concentration, and the measurement of market power’, Southern Economic Journal, 46(4), 1180-1186.
Fine, C.H. (1998), Clockspeed: Winning Industry Control in the Age of Temporary Advantage. Perseus: Reading, MA.
Fiol, C.M. (2001), ‘Revisiting an identity-based view of sustainable competitive advantage’, Journal of Management, 27, 691-699.
Foss, N. J., Knudsen, T. (2003). ‘A Resource-Based Tangle: Towards a Sustainable Explanation of Competitive Advantage’, Managerial and Decision Economics, 24(4), 291-307.
Grant, R. M. (1996). Prospering in dynamically-competitive environments: Organizational capability as knowledge integration. Organization science, 7(4), 375-387.
Gupta, A., Govindarajan, V. (2000), ‘Knowledge flows within multinational corporations’, Strategic Management Journal, 21(4), 473-496.
Hansen, G., Wernerfelt, B. (1989), ‘Determinants of firm performance: the relative importance of economic and organizational factors’, Strategic Management Journal, 10(5), 399-411.
Hay, D.A., Morris, D.K. (1991), Industrial Economics and Organization: Theory and Evidence, Oxford University Press: New York.
He, Z., Lim, K., Wong, P. (2006), ‘Entry and competitive dynamics in the mobile telecommunications market’, Research Policy, 35(8), 1147-1165.
Henson, R.K. (2001), ‘Understanding internal consistency reliability estimates: a conceptual primer on coefficient alpha’, Measurement and Evaluation in Counselling and Development, 34, 177-189.
Hobday, M. (1995). Innovation in East Asia: The challenge to Japan. Aldershot; Edward Elgar.
Hofer, C.W., Schendel, D. (1978), Strategy Formulation: Analytical Concepts. West: St. Paul. Hsu, L. C., Wang, C. H. (2012). ‘Clarifying the effect of intellectual capital on performance:
The mediating role of dynamic capability’, British Journal of Management, 23, 179-205. Huang, K.F. (2011), ‘Technology competencies in competitive environment’, Journal of
Business Research, 64(2), 172-179.
38
Huang, K.F., Wu, L.Y., Dyerson, R., Chen, C.F. (2012), ‘How does a technological firm develop its competitive advantage? A dynamic capability perspective’, IEEE Transactions on Engineering Management, 59(4), 644-653.
Huber, G.P., Power, D.J. (1985), ‘Retrospective reports of strategic-level managers: guidelines for increasing their accuracy’, Strategic Management Journal, 6, 171-180.
Jacobsen, R. (1988), ‘The persistence of abnormal returns’, Strategic Management Journal, 9, 415–430.
Jaffe, A.B. (1986), ‘Technological opportunity and spillovers of R&D: Evidence from firms’ patents, profits, and market value’, American Economic Review, 76(3), 984–1001.
Klaus, M. (2003). ‘Red chips: Implications of the semiconductor’s industry’s relocation to China’, Asian Affairs: An American Review, 29, 237–253.
Kogut, B, Zander, U. (1992), ‘Knowledge of the firm, combinative capabilities, and the replication of technology’, Organization Science, 3(3), 383-397.
Laamanen, T. (2005), ‘Dependency, resource depth, and supplier performance during industry downturn’, Research Policy, 34, 125-140.
Lavie, D. (2006), ‘The competitive advantage of interconnected firms: an extension of the resource-based view’. Academy of Management Review, 31, 638-658.
Leiblein, M. J. (2011), ‘ What do resource-and capability-based theories propose?’, Journal of Management, 37(4), 909-932.
Leiblein, M., Reuer, J. J., Dalsace, F. (2002). ‘Do make or buy decisions matter? The influence of organizational governance on technological performance’, Strategic Management Journal, 23(9), 817-833.
Leonard-Barton, D. (1992), ‘Core capabilities and core rigidities: A paradox in managing new product development’, Strategic Management Journal, 13(8), 111–125.
Lerner, A.P. (1934), ‘The concept of monopoly and the measurement of monopoly power’, Review of Economic Studies, 157-175.
Li, T., Calantone, R.J. (1998), ‘The impact of market knowledge competence on new product advantage: conceptualization and empirical examination’, Journal of Marketing, 62, 13-29.
Lippman, S.A., Rumelt, R. (1982), ‘Uncertain irritability: An analysis of interfirm differences in efficiency under competition’, Bell Journal of Economics, 13(2), 418-438.
Macher, J.T., Mowery, D.C. (2009). ‘Measuring dynamic capabilities: practices and performance in semiconductor manufacturing’, British Journal of Management, 20, S41-S62.
Mason, E.S. (1939), ‘Price and production policies of large scale enterprises’, American Economic Review, 29(1), 61-74.
McDougall, P.P., Robinson, R.B., DeNisi, A.S. (1992), ‘Modeling new venture performance: An analysis of new venture strategy, industry structure, and venture origin’, Journal of Business Venturing, 7(4), 267-289.
39
Miller, C.C., Cardinal, L.B., Glick, W.H. (1997), ‘Retrospective reports in organizational research: a reexamnation of recent evidence’, Academy of Management Journal, 40, 189-204.
Miyazaki, K. (1995), Building Competences in the Firm. Macmillan Press Ltd.: London. Morgan, R.M., Hunt, S.D., (1994), ‘The commitment-trust theory of relationship marketing’,
Journal of Marketing, 58(3), 20-38. Mowery, D.C., Oxley, J.E., Silverman, B.S. (1996), ‘Strategic alliances and interfirm
knowledge transfer’, Strategic Management Journal, 17, 77–92. Mueller, D.C. (1986), Profits in the Long Run. Cambridge University Press: Cambridge, U.K. Nickerson, J.A., Hamilton, B.H., Wada, T. (2001), ‘Market position, resource profile, and
governance: linking Porter and Williamson in the context of international courier and small package services in Japan’, Strategic Management Journal, 22(3), 251-273.
Ornstein, S.I., Weston, J.F., Intriligator, M.D., Shrieves, R.E. (1973), ‘Determinants of market structure’, Southern Economic Journal, 39(4), 612-625.
Pandza, K., Thorpe, R. (2009). ‘Creative search and strategic sense-making: Missing dimensions in the concept of dynamic capabilities’, British Journal of Management, 20, S118-S131.
Parey, M., Waldinger, F. (2011). ‘Studying Abroad and the Effect on International Labour Market Mobility: Evidence from the Introduction of ERASMUS’, The Economic Journal, 121(March), 194-222.
Patel, P., Pavitt, K. (1994), ‘Technological competencies in the world’slargest firms: Characteristics, constraints and scope for managerial choice’, Unpublished manuscript, Science Policy Research Unit, University of Sussex, Brighton, U.K.
Penrose, E. (1959), The Theory of the Growth of the Firm. Oxford University Press: New York.
Peteraf, M. (1993), ‘The cornerstones of competitive advantage: A resource-based view’, Strategic Management Journal, 14(3), 179-192.
Porter, M.E. (1980), Competitive Strategy. Free Press: New York. Porter, M.E. (1985), Competitive Advantage. First Press: New York. Porter, M.E. (1998), On Competition. Boston, MA: Harvard University Press. Powell, T.C. (2001), ‘Competitive advantage: Logical and philosophical considerations’,
Strategic Management Journal, 22, 875-888. Price, L.L., Arnould, E.J., Tierney, P. (1995), ‘Going to extremes: managing service
encounters and assessing provider performance’, Journal Marketing, 59, 83-97. Ramani, G. Kumar, V. (2008), ‘Interaction orientation and firm performance’, Journal of
Marketing, 72(1), 27-45. Reed, R, DeFillippi, R.J. (1990), ‘Casual ambiguity, barriers to imitation and sustainable
competitive advantage’, Academy of Management Review, 15(1), 88-102. Robins, J.A., Wiersema, M.F. (1995), ‘A resource-based approach to the multibusiness firm:
40
empirical analysis of portfolio interrelationships and corporate financial performance’, Strategic Management Journal, 16(4), 277-299.
Robinson, K.C, McDougall, P.P. (2001), ‘Entry barriers and new venture performance: A comparison of universal and contingency approaches’, Strategic Management Journal, 22, 659-686.
Rumelt, R. (1984), ‘Toward a strategic theory of the firm’, in Lamb R (ed.), Competitive Strategic Management, 556-570, Prentice-Hall: Englewood Cliffs.
Rumelt, R. (1991), ‘How much does industry matter’, Strategic Management Journal, 12(3), 167-185.
Said, A.A., HassabElnaby, H.R., Wier, B. (2003), ‘An empirical investigation of the performance consequences of nonfinancial measures’, Journal of Management Accounting Research, 15, 193-223.
Scherer, F.M., Ross, D. (1990), Industrial Market Structure and Economic Performance, Third edition. Houghton Mifflin: Boston.
Scherer, F.M. (1965), lFirm size, market structure, opportunity, and the output of patented inventions’, American Economic Review, 319-340.
Schmalensee, R. (1985), ‘Do markets differ much?’ American Economics Review, 75, 341–351.
Schumpeter, J.A. (1934), The Theory of Economic Development. Harvard University Press: Cambridge, Mass.
Shaver, J. M. (1998). ‘Accounting for endogeneity when assessing strategy performance: does entry mode choice affect FDI survival?’ Management Science, 44(4), 571-585.
Siegfried, J.J., Evans, L.B. (1994), ‘Empirical studies of entry and exit: A survey of the evidence’, Review of Industrial Organization, 2, 121-155.
Silverman, B.S. (1999), ‘Technological resources and the direction f corporate diversification: Toward an integration of the resource-based view and transaction cost economics’, Management Science, 45(8), 1109-1124.
Sirmon, D.G., Hitt, M.A., Ireland, R.D. (2007). ‘Managing firm resources in dynamic environments to create value: Looking inside the black box’, Academy of Management Review, 32(1), 273–292.
Sirmon, D.G., Hitt, M.A., Arregle, J. (2010), ‘The dynamic interplay of capability strengths and weaknesses: investigating the bases of temporary competitive advantage’, Strategic Management Journal, 31, 1386-1409.
Stulz, R.M. (1999), ‘Globalization, corporate finance, and the cost of capital’. Journal of Applied Corporate Finance, 12, 8-25.
Teece, D.J. (1987), ‘Profiting from technological innovation: Implications for integration, collaboration, licensing, and public policy’, In Teece D. (ed.), The Competitive Challenge, 185-220, Cambridge, Ballinger.
Teece, D.J., Pisano, G., Shuen, A. (1997), ‘Dynamic capabilities and strategic management’,
41
Strategic Management Journal, 18, 509-533. Teece, D. J. (2009). Dynamic capabilities and strategic management: organizing for innovation
and growth. Oxford University Press, USA. Thomas, L.G., D’Aveni, R.A. (2009), ‘The changing nature of competition in the U.S.
manufacturing sector, 1950 to 2002’, Strategic Organization, 7(4), 387–431. Useem, J.(2000), ‘Dot-coms: What have we learned?’ Fortune, October, 30, 82–104. Verona, G. and D. Ravasi, (2003), ‘Unbundling dynamic capabilities: an exploratory study of
continuous product innovation’, Industrial and Corporate Change, 12(3), 577-606. Wernerfelt, B. (1984), ‘A resource-based view of the firm’, Strategic Management Journal,
5(2), 171-180. Wernerfelt, B. (1989), ‘From critical resources to corporate strategy’, Journal of General
Management, 14, 4-12. Wiggins, R., Ruefli, T.W. (2002), ‘Sustained competitive advantage: temporal dynamics and
the incidence and persistence of superior economic performance’, Organization Science, 13(1), 81-105.
Wiggins, R.R., Ruefli, T.W. (2005), ‘Schumpeter’s ghost: is hypercompetition making the best of times shorter?’ Strategic Management Journal, 26(10), 887–911.
Wiklund, J., Shepherd, D. (2003), ‘Knowledge-based resources, entrepreneurial orientation, and the performance of small and medium-sized businesses’, Strategic Management Journal, 24, 1307-1314.
Zahra, S. A., George, G. (2002). ‘Absorptive capacity: A review, reconceptualization, and extension’, Academy of Management Review, 27(2), 185-203.
FIGURES
Figure 1. Research Framework
42
TABLES
Table 1 Descriptive statistics and correlations Mean Std. Deviation (1) (2) (3) (4) (1) Market Position
2.982 0.312 1.00
(2) Technological Resource & Capability Position
11.725 13.839 0.210* 1.00
(3) Outcomes of TCA 5.050 9.686 0.232** 0.509** 1.00 (4) Outcomes of SCA 4.613 8.487 0.234** 0.475** 0.901** 1.00
N=165; ** p < 0.01; * p < 0.05.
Table 2 Hypothesis testing results Hypothesis Causal path Coefficient t-value
H1 market position→
outcomes of TCA 0.21 2.42**
H2 outcomes of TCA→
technological resource & capability position 0.51 6.63**
H3 technological resource & capability position →
outcomes of SCA 0.88 20.78**
Note: ** p<0.05.
Table 3 Results of the rival model testing The Hypothesized
Model Rival Model 1
Rival Model 2
Rival Model 3
Technological Resource &
Capability Position
Market Position
Outcomes of Temporary Competitive Advantage
Outcomes of Sustainable Competitive Advantage
H1
H2
H3
43
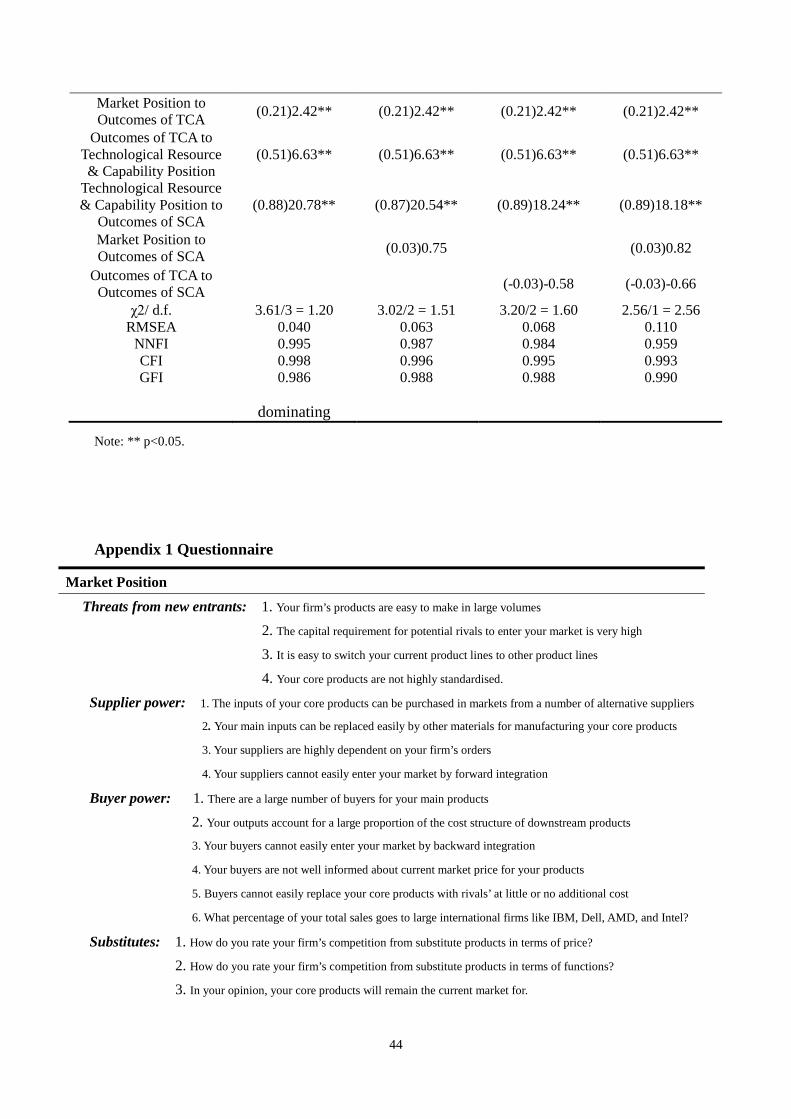
Market Position to Outcomes of TCA (0.21)2.42** (0.21)2.42** (0.21)2.42** (0.21)2.42**
Outcomes of TCA to Technological Resource & Capability Position
(0.51)6.63** (0.51)6.63** (0.51)6.63** (0.51)6.63**
Technological Resource & Capability Position to
Outcomes of SCA (0.88)20.78** (0.87)20.54** (0.89)18.24** (0.89)18.18**
Market Position to Outcomes of SCA (0.03)0.75 (0.03)0.82
Outcomes of TCA to Outcomes of SCA (-0.03)-0.58 (-0.03)-0.66
χ2/ d.f. 3.61/3 = 1.20 3.02/2 = 1.51 3.20/2 = 1.60 2.56/1 = 2.56 RMSEA 0.040 0.063 0.068 0.110
NNFI 0.995 0.987 0.984 0.959 CFI 0.998 0.996 0.995 0.993 GFI 0.986 0.988 0.988 0.990
dominating
Note: ** p<0.05.
Appendix 1 Questionnaire
Market Position Threats from new entrants: 1. Your firm’s products are easy to make in large volumes
2. The capital requirement for potential rivals to enter your market is very high 3. It is easy to switch your current product lines to other product lines 4. Your core products are not highly standardised.
Supplier power: 1. The inputs of your core products can be purchased in markets from a number of alternative suppliers
2. Your main inputs can be replaced easily by other materials for manufacturing your core products
3. Your suppliers are highly dependent on your firm’s orders
4. Your suppliers cannot easily enter your market by forward integration
Buyer power: 1. There are a large number of buyers for your main products
2. Your outputs account for a large proportion of the cost structure of downstream products
3. Your buyers cannot easily enter your market by backward integration
4. Your buyers are not well informed about current market price for your products
5. Buyers cannot easily replace your core products with rivals’ at little or no additional cost
6. What percentage of your total sales goes to large international firms like IBM, Dell, AMD, and Intel?
Substitutes: 1. How do you rate your firm’s competition from substitute products in terms of price? 2. How do you rate your firm’s competition from substitute products in terms of functions? 3. In your opinion, your core products will remain the current market for.
44
Internal Rivalry: 1. Most firms in your industry concentrate on more than one or two products as their core business 2. What number of competitors do you face for your core products? 3. How do you rate capacity in your industry?
Policy: 1. Your firm benefited from “Five-year Tax Free Statute for High-technology Industry” prior to 2002 2. Your firm benefited from “Measures for Encouraging Private Enterprise to Develop New Industrial Product” 3. You are highly satisfied with basic infrastructure like electricity & water for the IC industry in Taiwan 4. You are highly satisfied with the performance of the Taiwanese government’s R&D policy making 5. You are highly satisfied with the performance of the Taiwanese government’s R&D policy implementation 6. You are highly satisfied with the intellectual property protection framework within the IT industry in Taiwan
Appendix 2 Reverse Causality Test and Endogeneity Test
Reverse causality test This study compared the hypothesized model with three reverse-causality models: RC
Model 1: adding “outcomes of SCA to technological resource & capability position” path; RC Model 2: adding “outcomes of SCA to outcomes of TCA” path; and RC Model 3: adding “technological resource & capability position to outcomes of TCA” path. The overall disposition of the RC Model 1 fit indices, including χ2(2)=3.239, p=0.198, χ2/df=1.62, RMSEA=0.068, NNFI=0.978, CFI=0.993, GFI=0.988, demonstrating acceptable model fit. The relationship from outcomes of SCA to technological resource & capability position was insignificant (γ=0.185, t-value=0.672). The overall disposition of the RC Model 2 fit indices, including χ2(2)=0.838, p=0.658, χ2/df=0.419, RMSEA=0.000, NNFI=0.995, CFI=1.000, GFI=0.997, demonstrating acceptable model fit. The relationship from outcomes of SCA to outcomes of TCA was insignificant (γ=-4.527, t-value=-1.001). The overall disposition of the RC Model 3 fit indices, including χ2(2)=0.998, p=0.607, χ2/df=0.499, RMSEA=0.000, NNFI=1.018, CFI=1.000, GFI=0.996, demonstrating acceptable model fit. The relationship from outcomes of TCA to technological resource & capability position was insignificant (γ=-1.807, t-value=-0.824).
This study compared the hypothesized models with three reverse-causality models, and the hypothesized model is superior to RC Models 1, 2, and 3. Since the values of △χ2(1)= 0.340, △χ2(1)= 2.741, and △χ2(1)= 2.581 were smaller than 3.84, this indicated that the hypothesized models were superior to RC Models 1, 2, and 3. The reverse-causality models were less parsimonious than the hypothesized models (comparison in number of distinct parameters to be estimated). The test results indicated that all of the reverse-causality models did not explain the covariance structure any better than the hypothesized models. Furthermore, the percentage of estimated paths supported in the hypothesized models (3/3 = 100%) was greater than the percentage of estimated paths supported in all reverse-causality models (3/4 = 0.75% for models 1 and 2; 2/4 = 50% for models 3). Our study therefore preferred the more
45
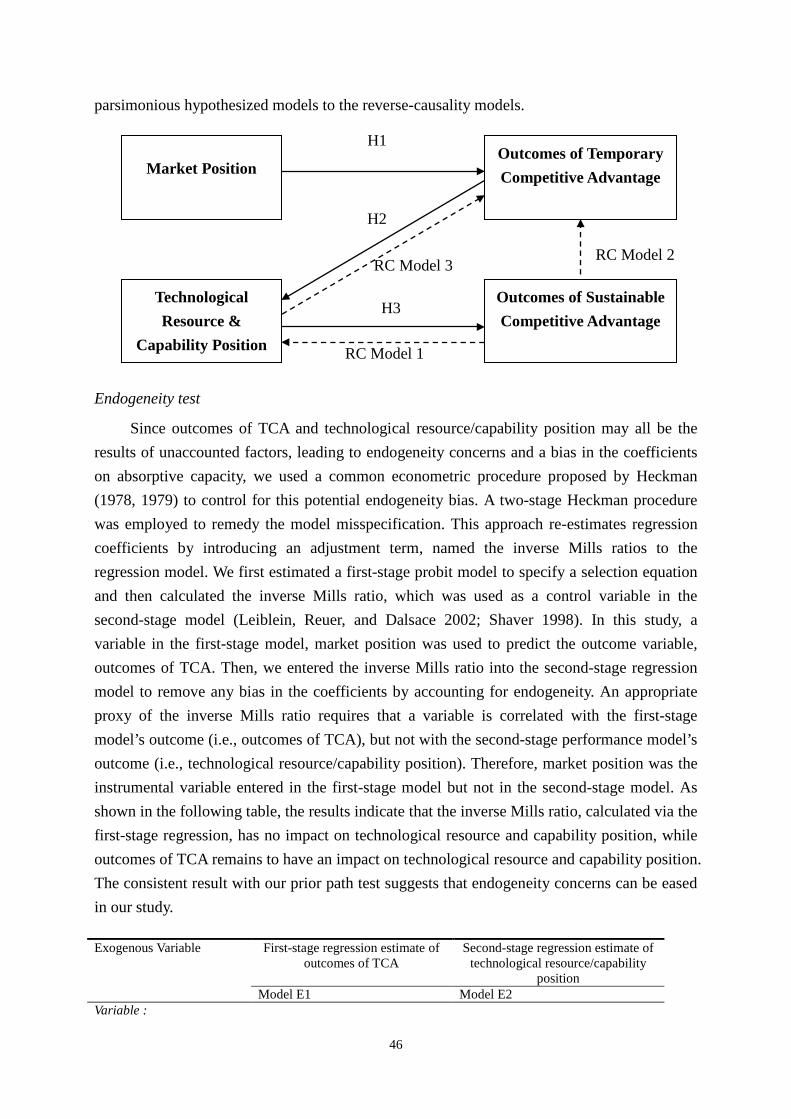
parsimonious hypothesized models to the reverse-causality models.
Endogeneity test
Since outcomes of TCA and technological resource/capability position may all be the results of unaccounted factors, leading to endogeneity concerns and a bias in the coefficients on absorptive capacity, we used a common econometric procedure proposed by Heckman (1978, 1979) to control for this potential endogeneity bias. A two-stage Heckman procedure was employed to remedy the model misspecification. This approach re-estimates regression coefficients by introducing an adjustment term, named the inverse Mills ratios to the regression model. We first estimated a first-stage probit model to specify a selection equation and then calculated the inverse Mills ratio, which was used as a control variable in the second-stage model (Leiblein, Reuer, and Dalsace 2002; Shaver 1998). In this study, a variable in the first-stage model, market position was used to predict the outcome variable, outcomes of TCA. Then, we entered the inverse Mills ratio into the second-stage regression model to remove any bias in the coefficients by accounting for endogeneity. An appropriate proxy of the inverse Mills ratio requires that a variable is correlated with the first-stage model’s outcome (i.e., outcomes of TCA), but not with the second-stage performance model’s outcome (i.e., technological resource/capability position). Therefore, market position was the instrumental variable entered in the first-stage model but not in the second-stage model. As shown in the following table, the results indicate that the inverse Mills ratio, calculated via the first-stage regression, has no impact on technological resource and capability position, while outcomes of TCA remains to have an impact on technological resource and capability position. The consistent result with our prior path test suggests that endogeneity concerns can be eased in our study.
Exogenous Variable First-stage regression estimate of outcomes of TCA
Second-stage regression estimate of technological resource/capability
position Model E1 Model E2
Variable :
Technological Resource &
Capability Position
Market Position
Outcomes of Temporary Competitive Advantage
Outcomes of Sustainable Competitive Advantage
H1
H2
H3
RC Model 1
RC Model 2 RC Model 3
46
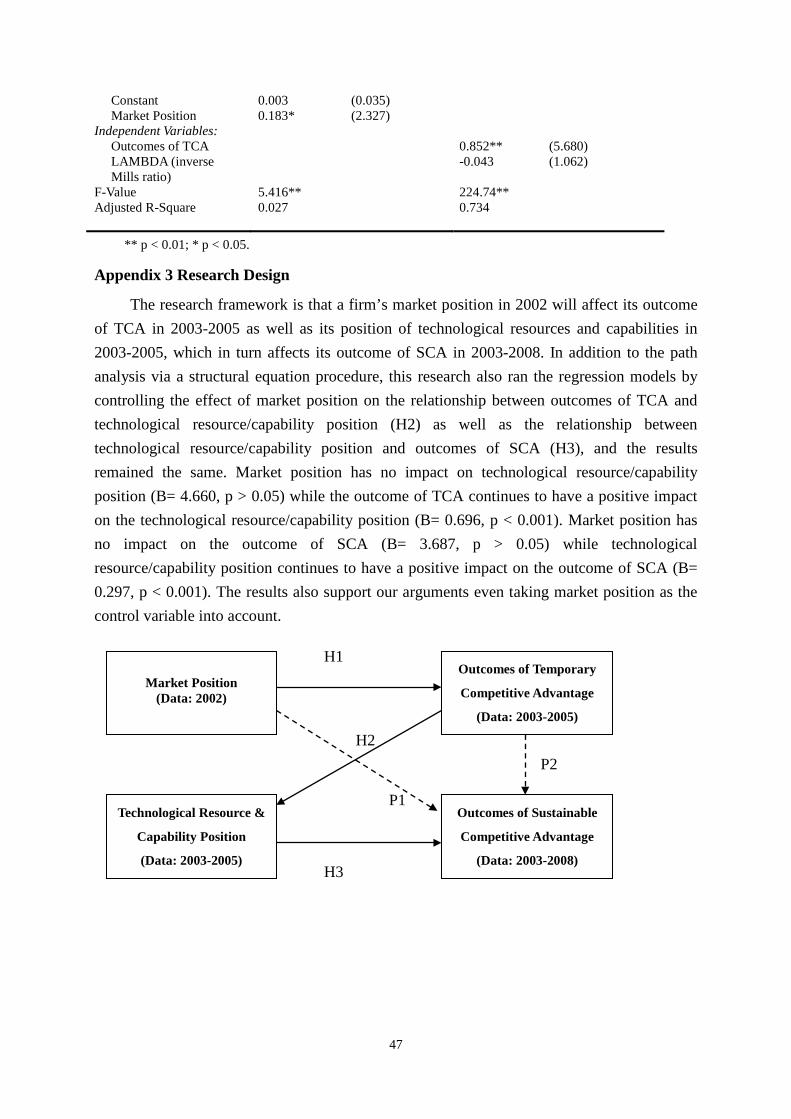
** p < 0.01; * p < 0.05.
Appendix 3 Research Design
The research framework is that a firm’s market position in 2002 will affect its outcome of TCA in 2003-2005 as well as its position of technological resources and capabilities in 2003-2005, which in turn affects its outcome of SCA in 2003-2008. In addition to the path analysis via a structural equation procedure, this research also ran the regression models by controlling the effect of market position on the relationship between outcomes of TCA and technological resource/capability position (H2) as well as the relationship between technological resource/capability position and outcomes of SCA (H3), and the results remained the same. Market position has no impact on technological resource/capability position (B= 4.660, p > 0.05) while the outcome of TCA continues to have a positive impact on the technological resource/capability position (B= 0.696, p < 0.001). Market position has no impact on the outcome of SCA (B= 3.687, p > 0.05) while technological resource/capability position continues to have a positive impact on the outcome of SCA (B= 0.297, p < 0.001). The results also support our arguments even taking market position as the control variable into account.
Constant 0.003 (0.035) Market Position 0.183* (2.327)
Independent Variables: Outcomes of TCA 0.852** (5.680) LAMBDA (inverse Mills ratio)
-0.043 (1.062)
F-Value 5.416** 224.74** Adjusted R-Square 0.027 0.734
Technological Resource &
Capability Position
(Data: 2003-2005)
Market Position
(Data: 2002)
Outcomes of Temporary
Competitive Advantage
(Data: 2003-2005)
Outcomes of Sustainable
Competitive Advantage
(Data: 2003-2008)
H1
H2
H3
P1
P2
47