Embed Size (px)
Citation preview
FROM UPPER MIDDLE INCOME TO BUILDING A MORE SECURE MIDDLE CLASS:
CRITICAL STEPS
WORLD BANK GROUP
Systematic Country Diagnostics
AEF June 15, 2017
• Setting the stage and identifying challenges..
..to growth, jobs, and building a more secure middle class
• Getting back on course – 4 interconnected and interdependent paths:
Economic management for diversification
Private sector development
Integration and connectivity
Competitive and adaptive human capital
• Concluding thoughts: looking forward
OUTLINE
SETTING THE STAGE: GROWTH, JOBS,
AND BUILDING A SECURE MIDDLE CLASS
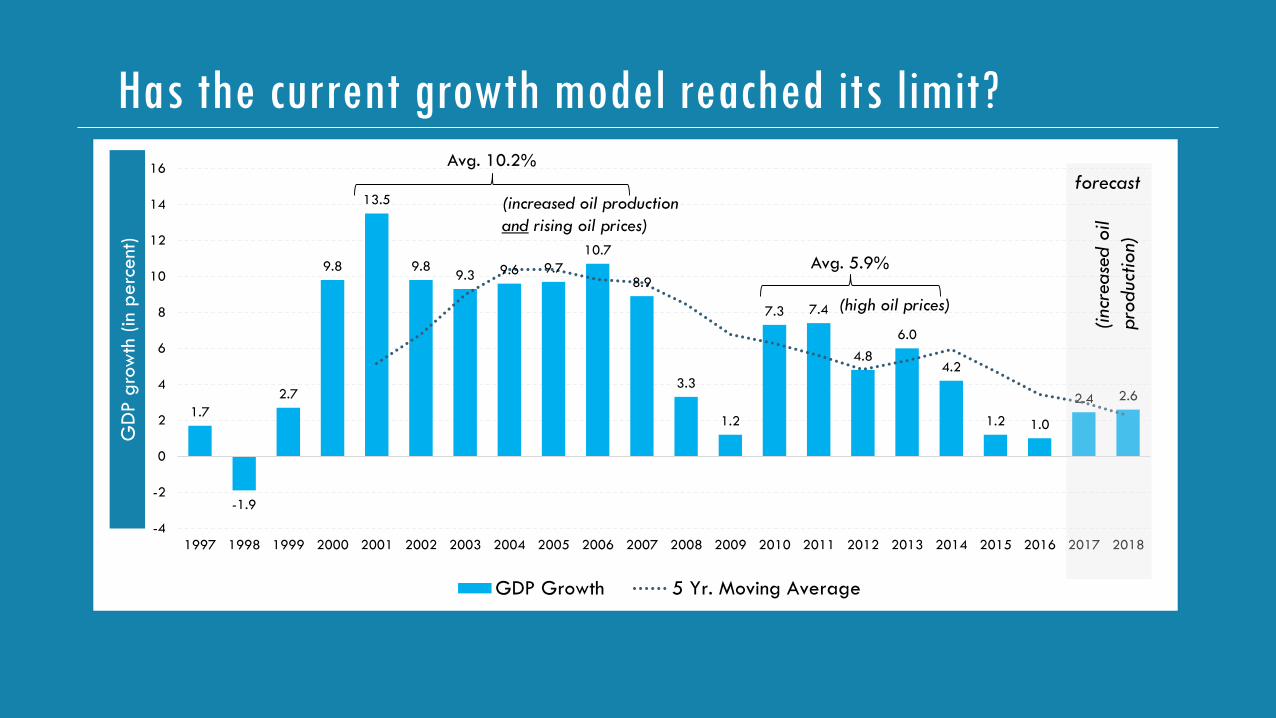
Has the current growth model reached its limit?
1.7
-1.9
2.7
9.8
13.5
9.8 9.3 9.6 9.7
10.7
8.9
3.3
1.2
7.3 7.4
4.8
6.0
4.2
1.2 1.0
2.4 2.6
-4
-2
0
2
4
6
8
10
12
14
16
1997 1998 1999 2000 2001 2002 2003 2004 2005 2006 2007 2008 2009 2010 2011 2012 2013 2014 2015 2016 2017 2018
GDP Growth 5 Yr. Moving Average
Avg. 10.2%
Avg. 5.9%
(high oil prices)
(increased oil production
and rising oil prices)
forecast
GD
P g
row
th (
in p
erc
ent
)
(inc
rease
d o
il
pro
duc
tion)
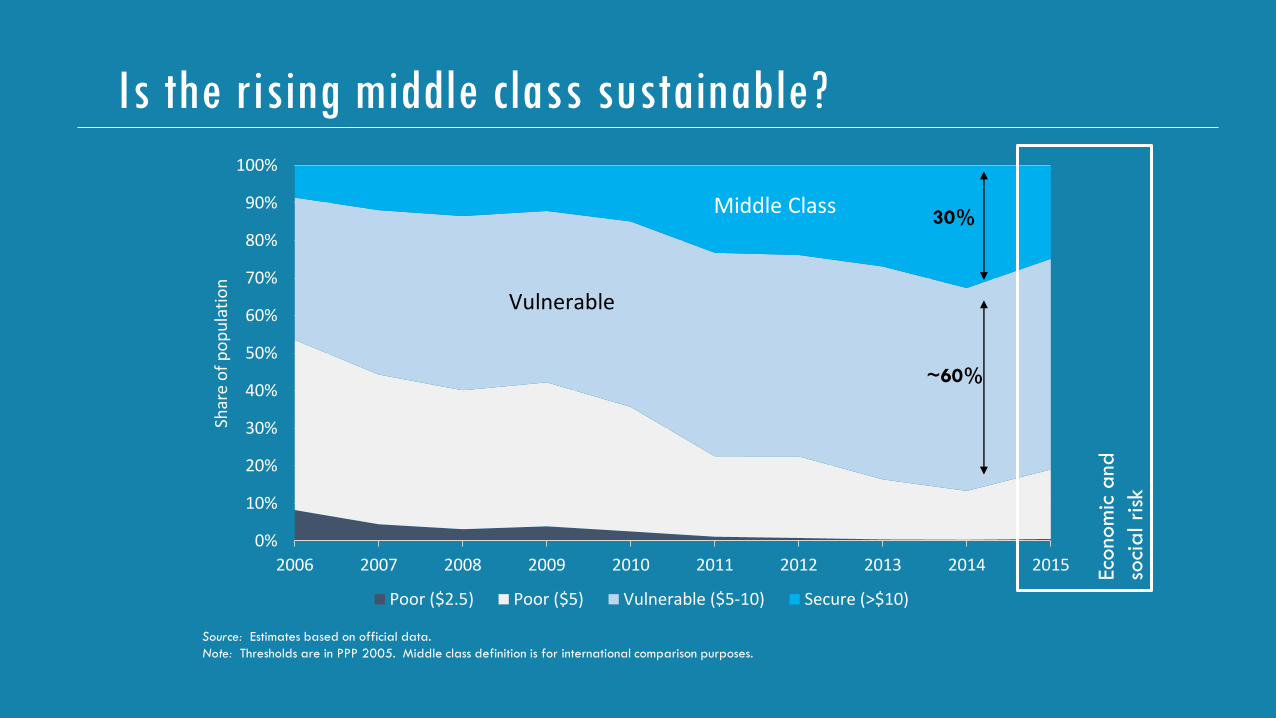
Is the rising middle class sustainable?
0%
10%
20%
30%
40%
50%
60%
70%
80%
90%
100%
2006 2007 2008 2009 2010 2011 2012 2013 2014 2015
Shar
e o
f p
op
ula
tio
n
Poor ($2.5) Poor ($5) Vulnerable ($5-10) Secure (>$10)
Vulnerable
Middle Class30%
~60%
Source: Estimates based on official data.
Note: Thresholds are in PPP 2005. Middle class definition is for international comparison purposes.
Econo
mic
and
soci
al ri
sk
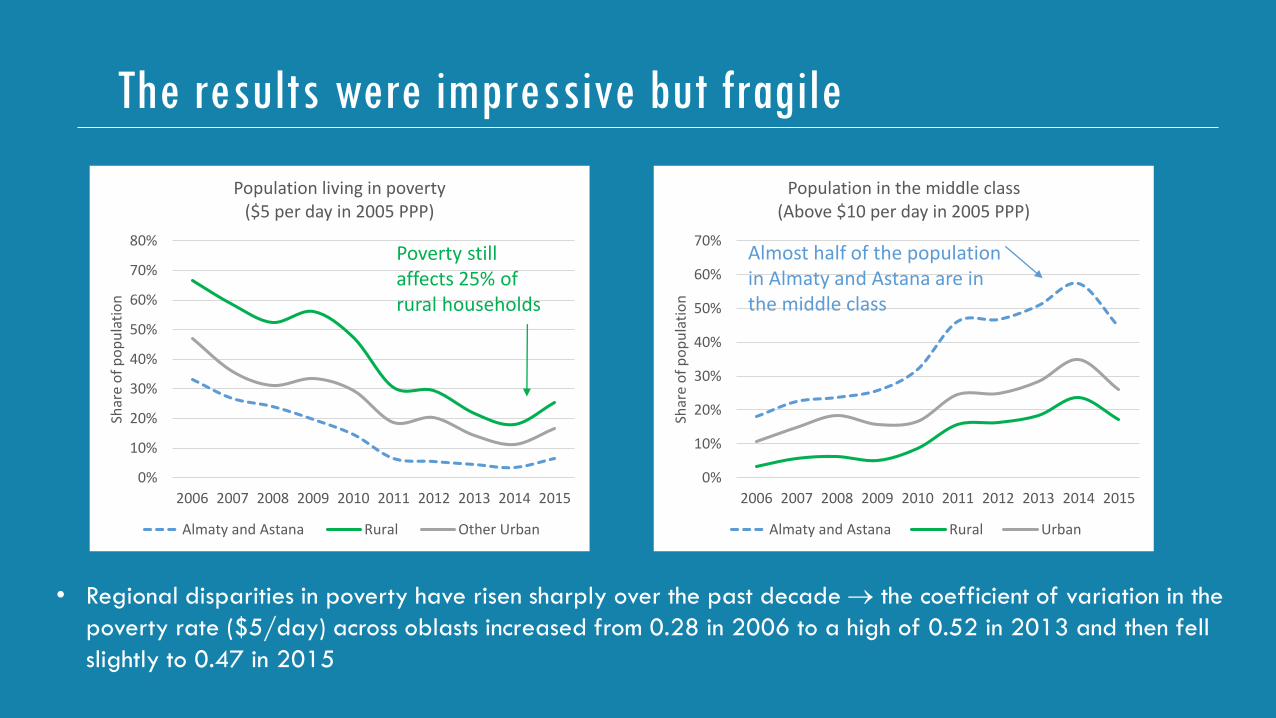
The results were impressive but fragile
0%
10%
20%
30%
40%
50%
60%
70%
80%
2006 2007 2008 2009 2010 2011 2012 2013 2014 2015
Shar
e o
f p
op
ula
tio
n
Population living in poverty($5 per day in 2005 PPP)
Almaty and Astana Rural Other Urban
0%
10%
20%
30%
40%
50%
60%
70%
2006 2007 2008 2009 2010 2011 2012 2013 2014 2015
Shar
e o
f p
op
ula
tio
n
Population in the middle class(Above $10 per day in 2005 PPP)
Almaty and Astana Rural Urban
• Regional disparities in poverty have risen sharply over the past decade the coefficient of variation in the
poverty rate ($5/day) across oblasts increased from 0.28 in 2006 to a high of 0.52 in 2013 and then fell
slightly to 0.47 in 2015
Poverty still affects 25% of rural households
Almost half of the population in Almaty and Astana are in the middle class
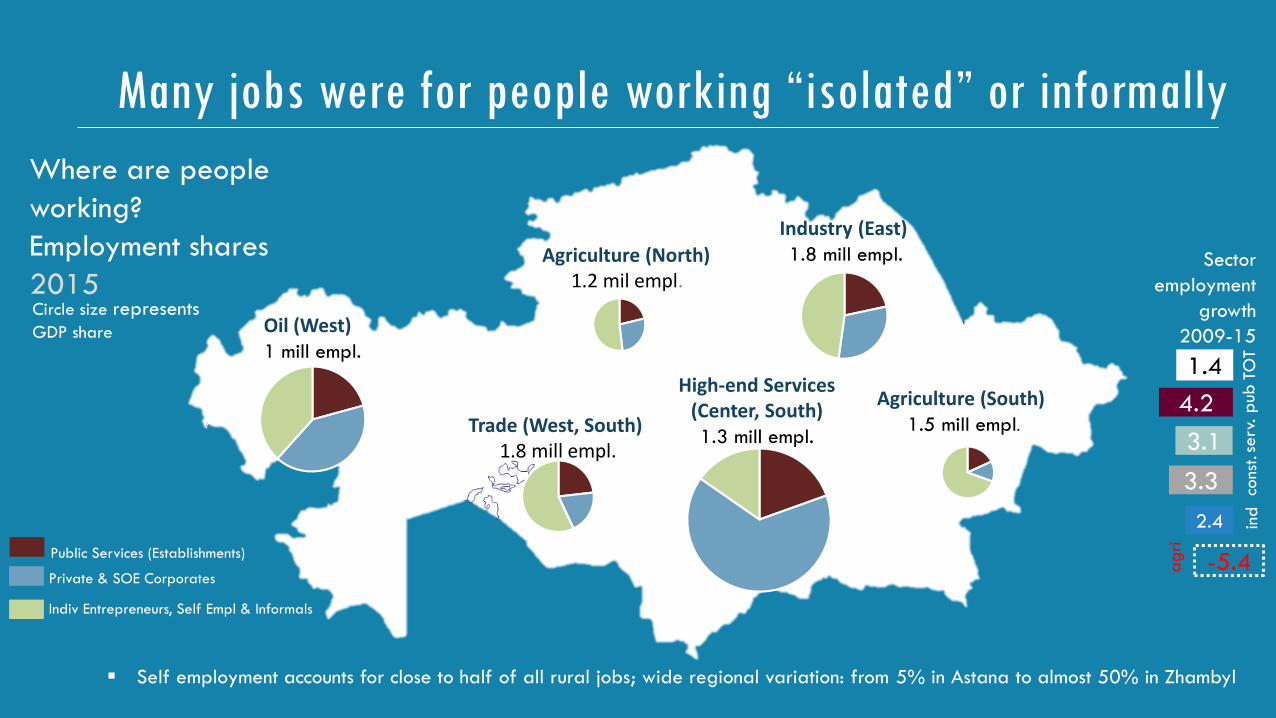
Many jobs were for people working “isolated” or informally
Where are people
working?
Employment shares
2015Circle size representsGDP share
Public Services (Establishments)
Private & SOE Corporates
Indiv Entrepreneurs, Self Empl & Informals
3.1
2.4
1.4
-5.4
3.3
Sector
employment
growth
2009-15
ag
ri
ind
pub
serv
.co
nst.
TOT
4.2
Self employment accounts for close to half of all rural jobs; wide regional variation: from 5% in Astana to almost 50% in Zhambyl
Oil (West)1 mill empl.
Agriculture (North)1.2 mil empl.
Agriculture (South) 1.5 mill empl.Trade (West, South)
1.8 mill empl.
Industry (East) 1.8 mill empl.
High-end Services (Center, South) 1.3 mill empl.
PUBLIC
SECTOR
NON-
TRADABLES
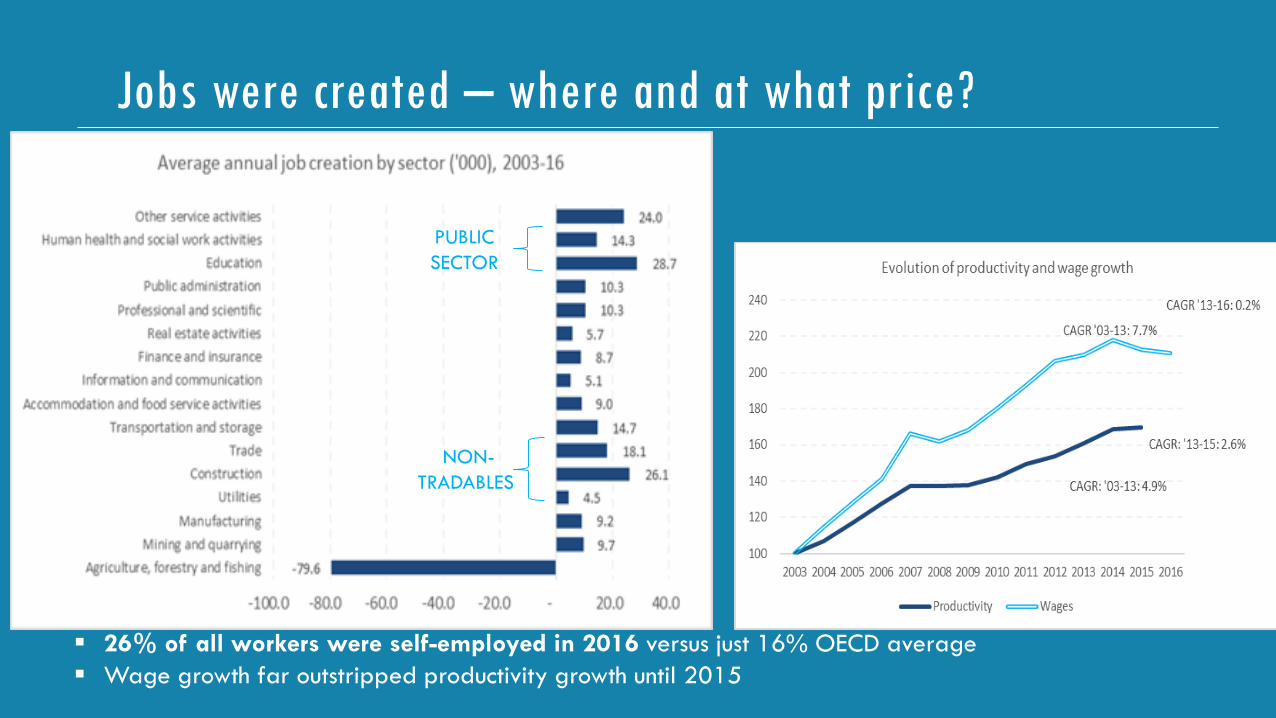
Jobs were created – where and at what price?
26% of all workers were self-employed in 2016 versus just 16% OECD average
Wage growth far outstripped productivity growth until 2015
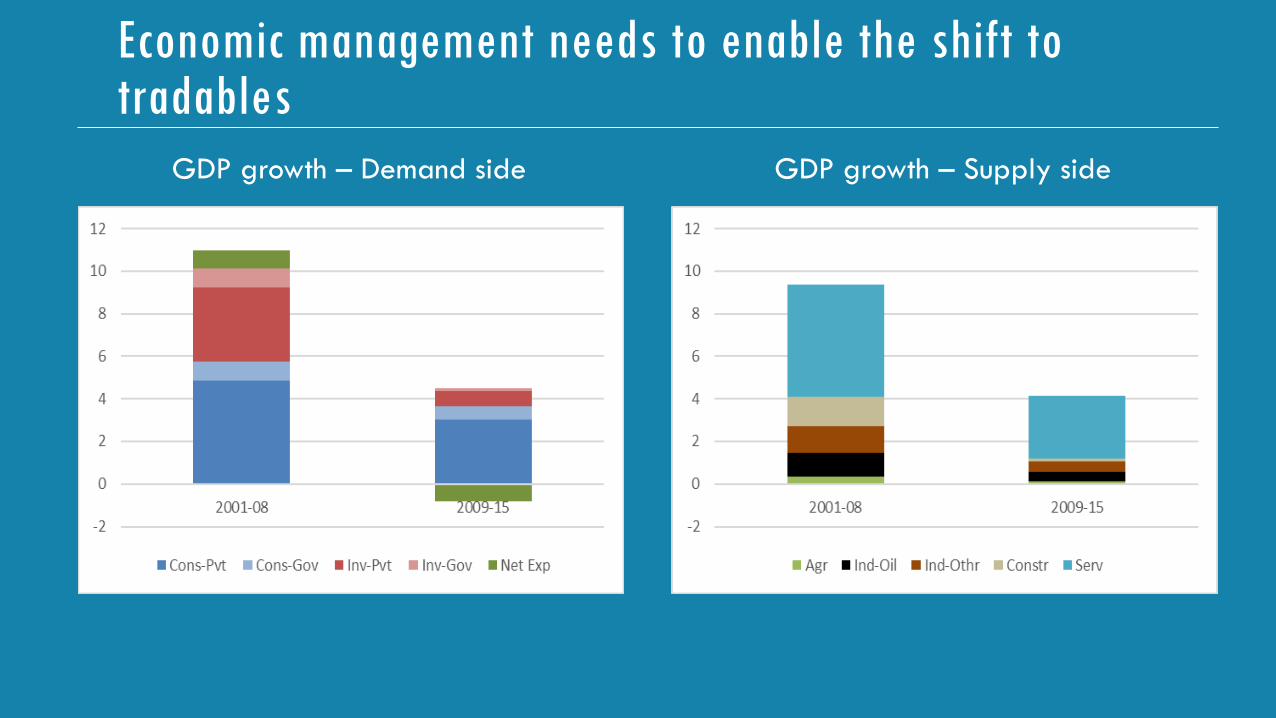
Economic management needs to enable the shift to tradables
GDP growth – Supply sideGDP growth – Demand side
PATHWAY #1
ECONOMIC MANAGEMENT
FOR DIVERSIFICATION
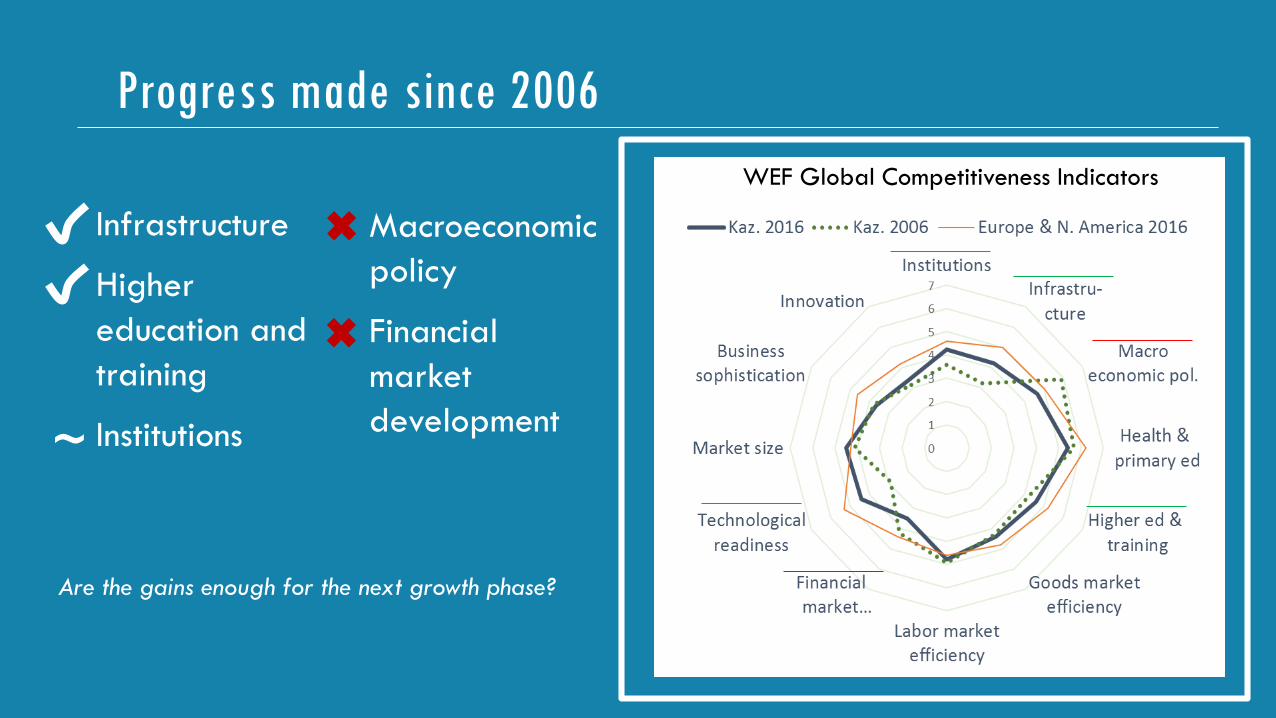
Progress made since 2006
Infrastructure
Higher
education and
training
Institutions
Macroeconomic
policy
Financial
market
development
Are the gains enough for the next growth phase?
WEF Global Competitiveness Indicators
~
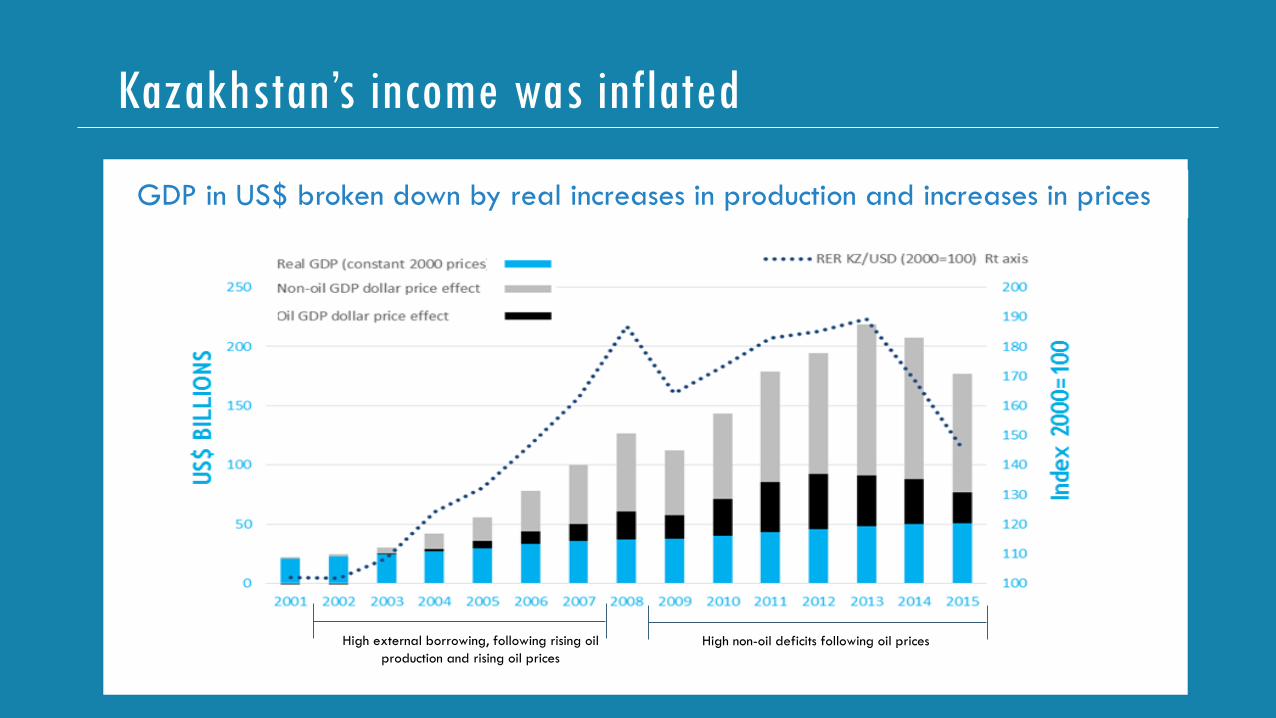
Kazakhstan’s income was inflated
High non-oil deficits following oil pricesHigh external borrowing, following rising oil
production and rising oil prices
GDP in US$ broken down by real increases in production and increases in prices
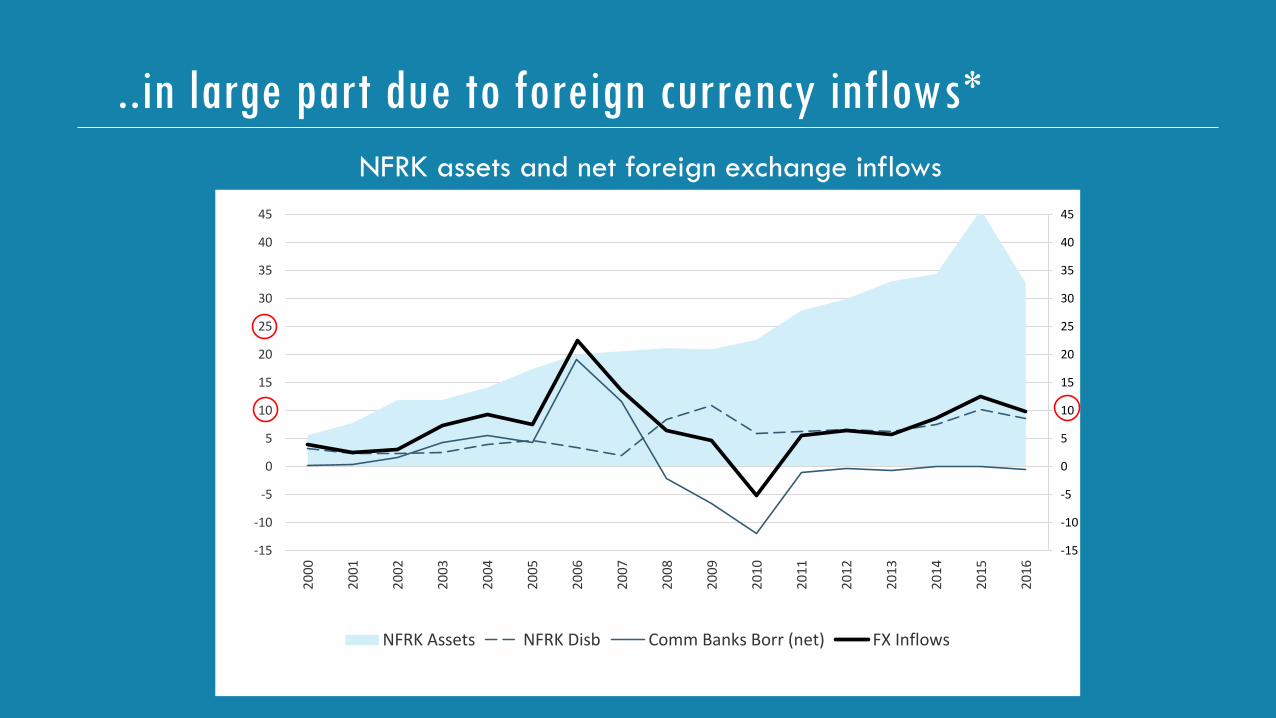
..in large part due to foreign currency inflows*
NFRK assets and net foreign exchange inflows
-15
-10
-5
0
5
10
15
20
25
30
35
40
45
-15
-10
-5
0
5
10
15
20
25
30
35
40
45
200
0
200
1
200
2
200
3
200
4
200
5
200
6
200
7
200
8
200
9
201
0
201
1
201
2
201
3
201
4
201
5
201
6
NFRK Assets NFRK Disb Comm Banks Borr (net) FX Inflows

The non-oil deficit after 2008 was too large*
-5
0
5
10
15
20
2001 2002 2003 2004 2005 2006 2007 2008 2009 2010 2011 2012 2013 2014 2015 2016
Perc
ent
of
no
n-o
il G
DP
OF guaranteed transfer OF TT+Cust. Duty
OF direct lending to SOEs Net borrowing
50
75
100
125
150
175
200
Jan
Au
g
Mar
Oct
May
De
c
Jul
Feb
Sep
Ap
r
No
v
Jun
Jan
Au
g
Mar
Oct
May
De
c
Jul
Feb
Sep
Ap
r
No
v
Jun
Jan
Au
g
Mar
Oct
May
De
c
2000 2001 2002 2003 2004 2005 2006 2007 2008 2009 2010 2011 2012 2013 2014 2015 2016
RER KZT/Ruble RER KZT/USD RER KZT/CNY
~8-10%
What's the
implementation plan?
Non-oil deficit financing 2001-2016Real exchange rates 2001-2016
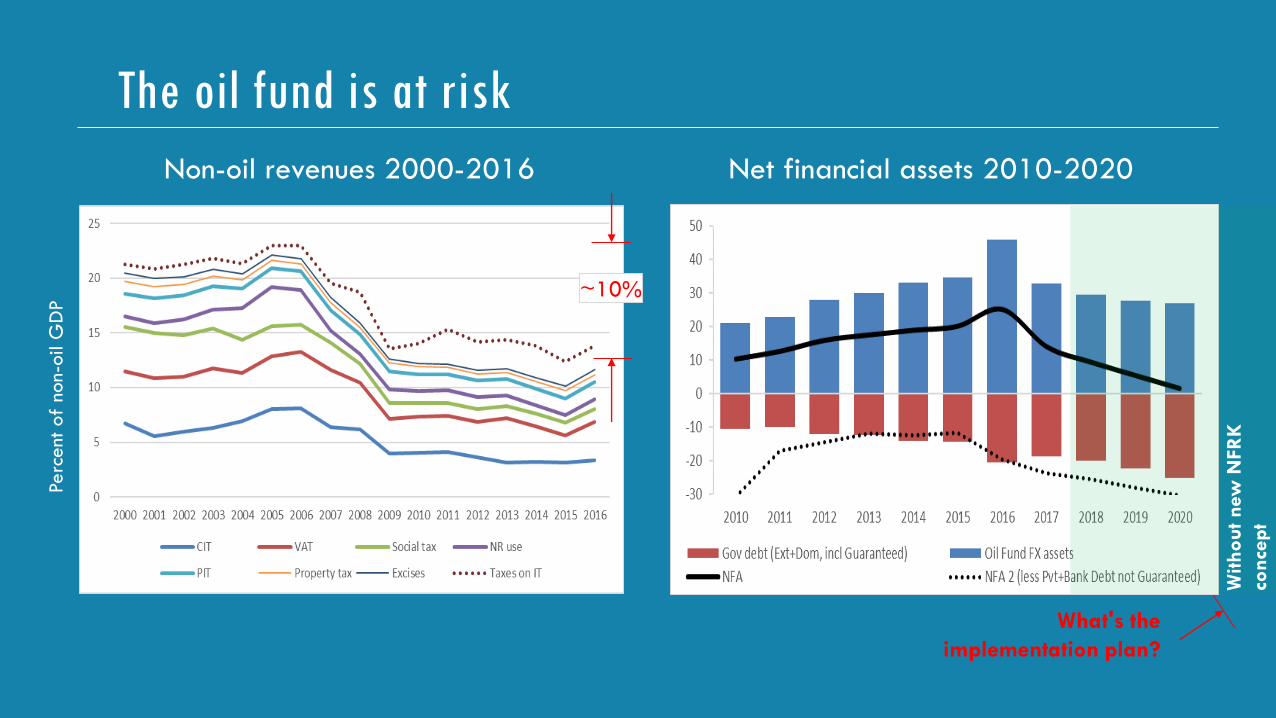
The oil fund is at risk
Net financial assets 2010-2020Non-oil revenues 2000-2016
~10%
Witho
ut new
NFR
K
conce
pt
What's the
implementation plan?
Perc
ent
of
non-o
il G
DP

Problems with corruption persist
Corruption experience in transition economies
Households
• Education quality
• Health access
• Health quality
• Utilities access
Businesses
• SOE procurement
• GOK procurement
• Licenses
• Inspections
Things to look at
Source: Life In Transition Survey III (2016)
PATHWAY #2
PRIVATE SECTOR
DEVELOPMENT
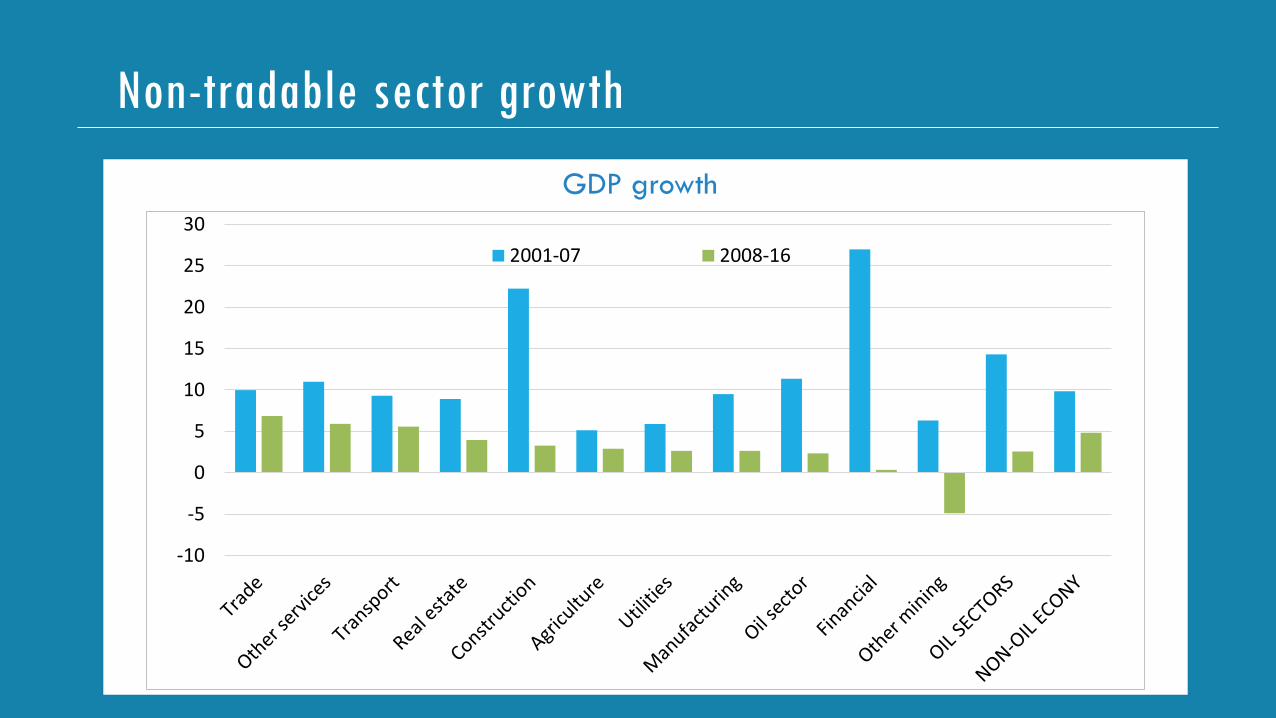
Non-tradable sector growth
-10
-5
0
5
10
15
20
25
30
2001-07 2008-16
GDP growth
-20.0
-10.0
0.0
10.0
20.0
30.0
40.0
50.0
60.0
70.0
2000 2001 2002 2003 2004 2005 2006 2007 2008 2009 2010 2011 2012 2013 2014 2015 2016
Credit to the economy (percent of GDP)
Real growth of credit to rest of economy (percent change)
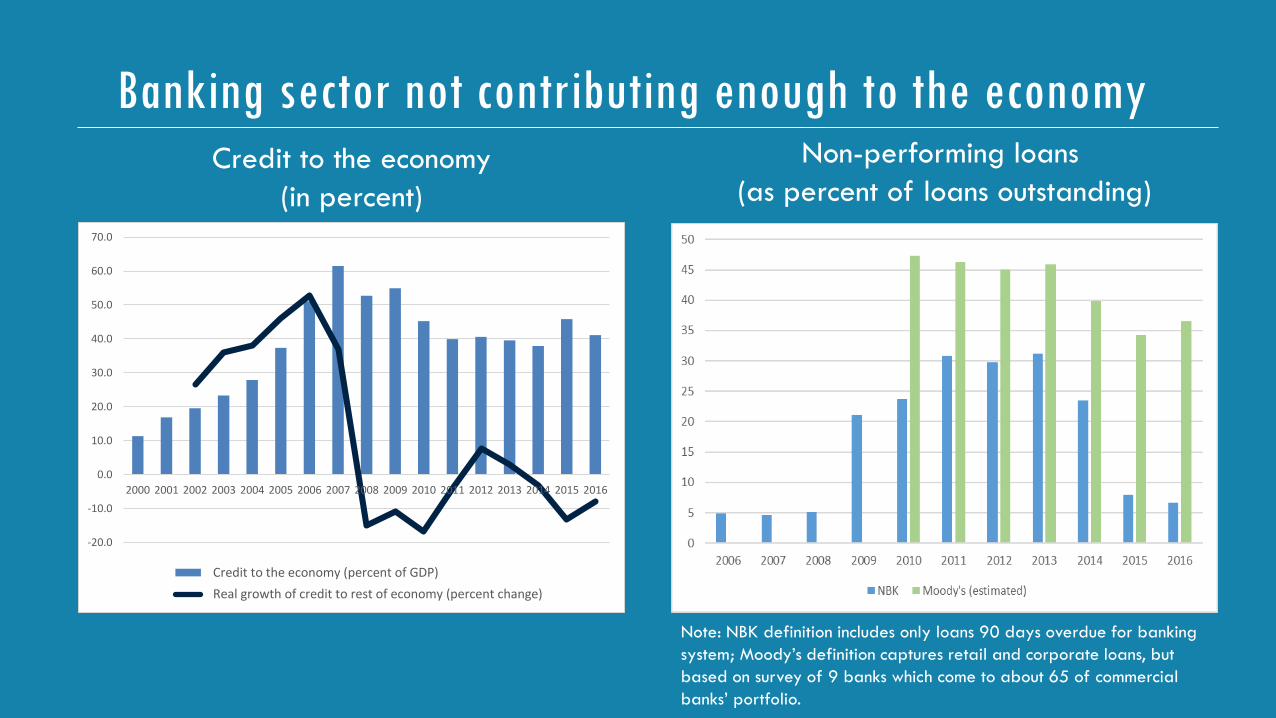
Banking sector not contributing enough to the economyNon-performing loans
(as percent of loans outstanding)Credit to the economy
(in percent)
Note: NBK definition includes only loans 90 days overdue for banking
system; Moody’s definition captures retail and corporate loans, but
based on survey of 9 banks which come to about 65 of commercial
banks’ portfolio.
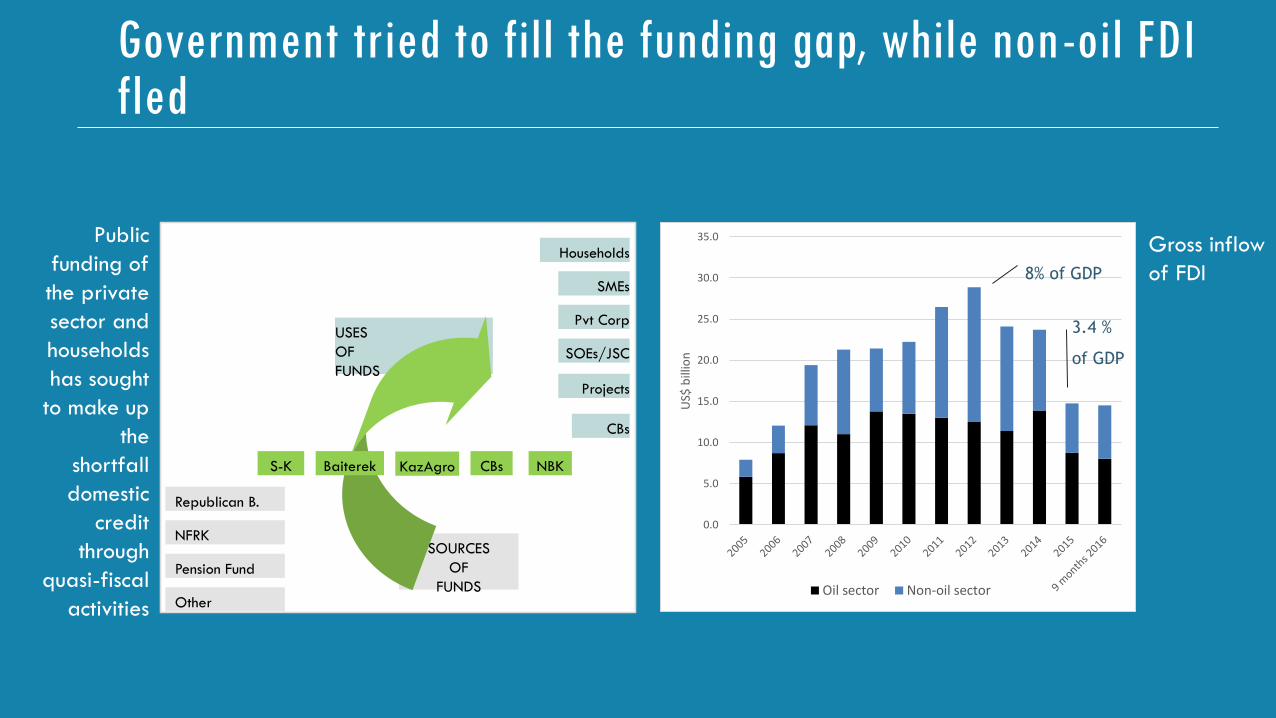
USES
OF
FUNDS
SOURCES
OF
FUNDS
Republican B.
NFRK
Pension Fund
Other
S-K KazAgro CBs NBK
Households
SMEs
Pvt Corp
SOEs/JSC
Projects
CBs
Baiterek
Public
funding of
the private
sector and
households
has sought
to make up
the
shortfall
domestic
credit
through
quasi-fiscal
activities
0.0
5.0
10.0
15.0
20.0
25.0
30.0
35.0
US$
bill
ion
Oil sector Non-oil sector
8% of GDP
3.4 %
of GDP
Gross inflow
of FDI
Government tried to fill the funding gap, while non-oil FDI fled
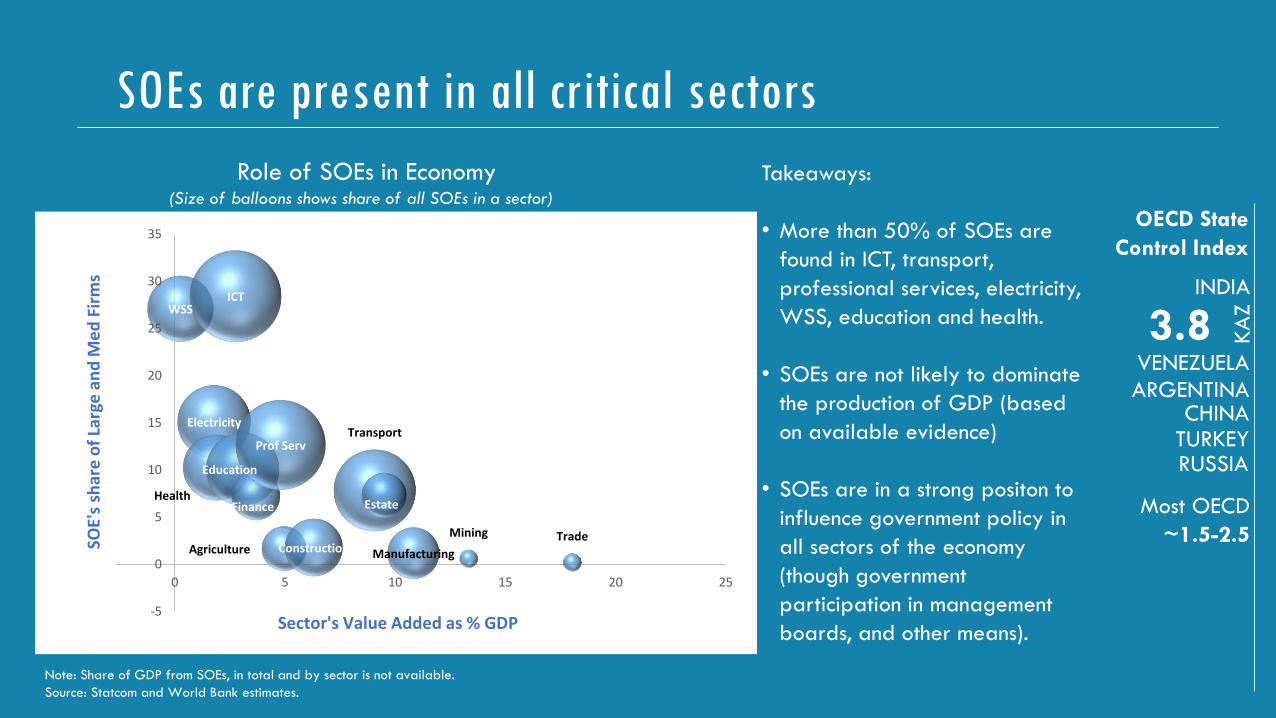
SOEs are present in all critical sectors
WSS
Electricity
Health
ICT
Education
Finance
Prof Serv
Agriculture Construction
Transport
Estate
Manufacturing
Mining Trade
-5
0
5
10
15
20
25
30
35
-5 0 5 10 15 20 25
Series1Sector's Value Added as % GDP
SOE'
s sh
are
of
Larg
e a
nd
Me
dFi
rms
Role of SOEs in Economy(Size of balloons shows share of all SOEs in a sector)
Takeaways:
• More than 50% of SOEs are
found in ICT, transport,
professional services, electricity,
WSS, education and health.
• SOEs are not likely to dominate
the production of GDP (based
on available evidence)
• SOEs are in a strong positon to
influence government policy in
all sectors of the economy
(though government
participation in management
boards, and other means).
3.8
OECD State
Control Index
KA
Z
INDIA
VENEZUELA
ARGENTINACHINA
TURKEYRUSSIA
Most OECD
~1.5-2.5
Note: Share of GDP from SOEs, in total and by sector is not available.
Source: Statcom and World Bank estimates.
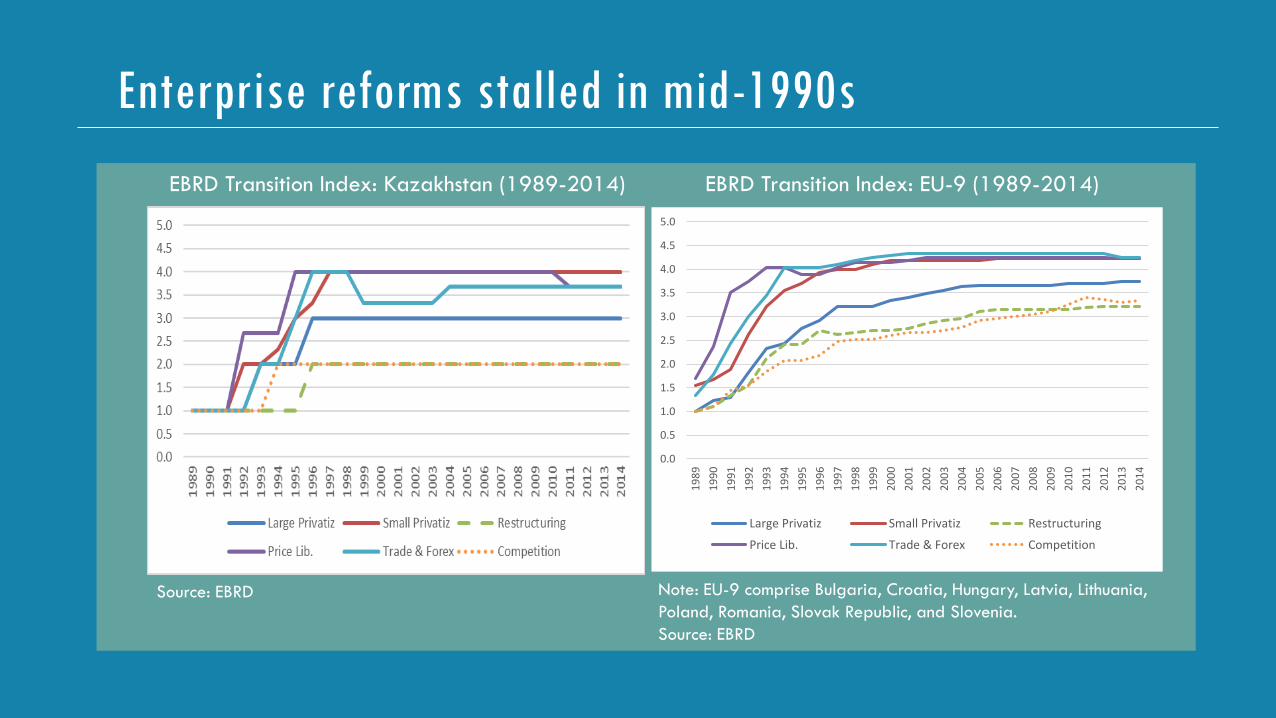
Enterprise reforms stalled in mid-1990s
EBRD Transition Index: Kazakhstan (1989-2014) EBRD Transition Index: EU-9 (1989-2014)
Source: EBRD Note: EU-9 comprise Bulgaria, Croatia, Hungary, Latvia, Lithuania,
Poland, Romania, Slovak Republic, and Slovenia.
Source: EBRD
0.0
0.5
1.0
1.5
2.0
2.5
3.0
3.5
4.0
4.5
5.0
19
89
19
90
19
91
19
92
19
93
19
94
19
95
19
96
19
97
19
98
19
99
20
00
20
01
20
02
20
03
20
04
20
05
20
06
20
07
20
08
20
09
20
10
20
11
20
12
20
13
20
14
Large Privatiz Small Privatiz Restructuring
Price Lib. Trade & Forex Competition
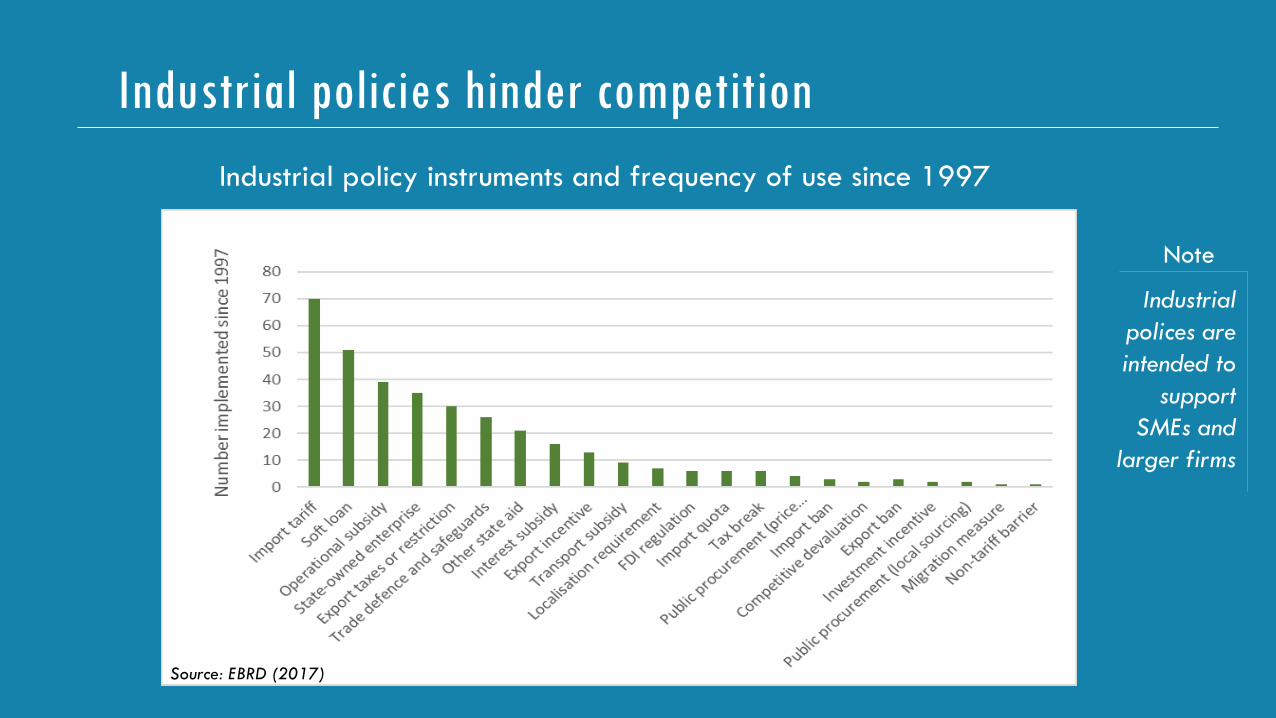
Industrial policies hinder competition
Industrial policy instruments and frequency of use since 1997
Source: EBRD (2017)
Industrial
polices are
intended to
support
SMEs and
larger firms
Note
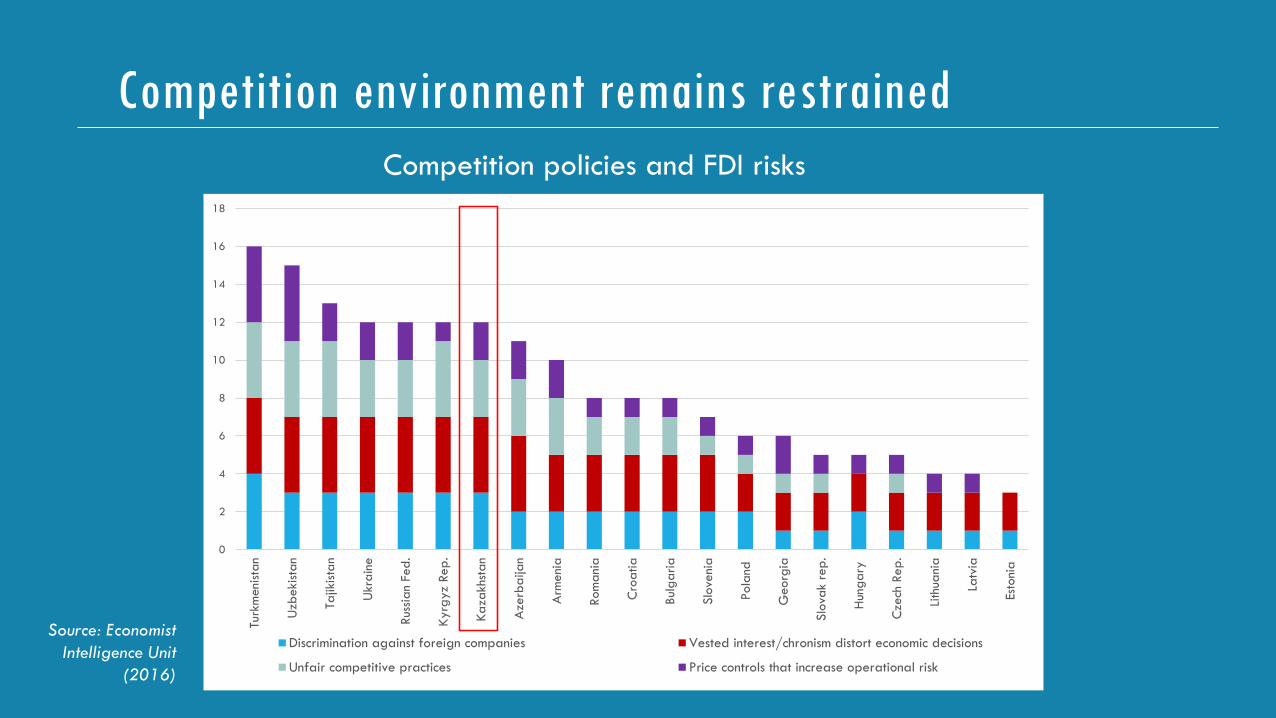
Competition environment remains restrained
0
2
4
6
8
10
12
14
16
18
Turk
menista
n
Uzb
ekista
n
Tajik
ista
n
Ukr
ain
e
Rus
sian
Fed
.
Kyrg
yz R
ep
.
Ka
zakhs
tan
Aze
rba
ijan
Arm
eni
a
Rom
ania
Cro
atia
Bul
garia
Slo
veni
a
Pola
nd
Georg
ia
Slo
vak r
ep.
Hun
gary
Cze
ch R
ep.
Lith
uani
a
Latv
ia
Esto
nia
Discrimination against foreign companies Vested interest/chronism distort economic decisions
Unfair competitive practices Price controls that increase operational risk
Competition policies and FDI risks
Source: Economist
Intelligence Unit
(2016)
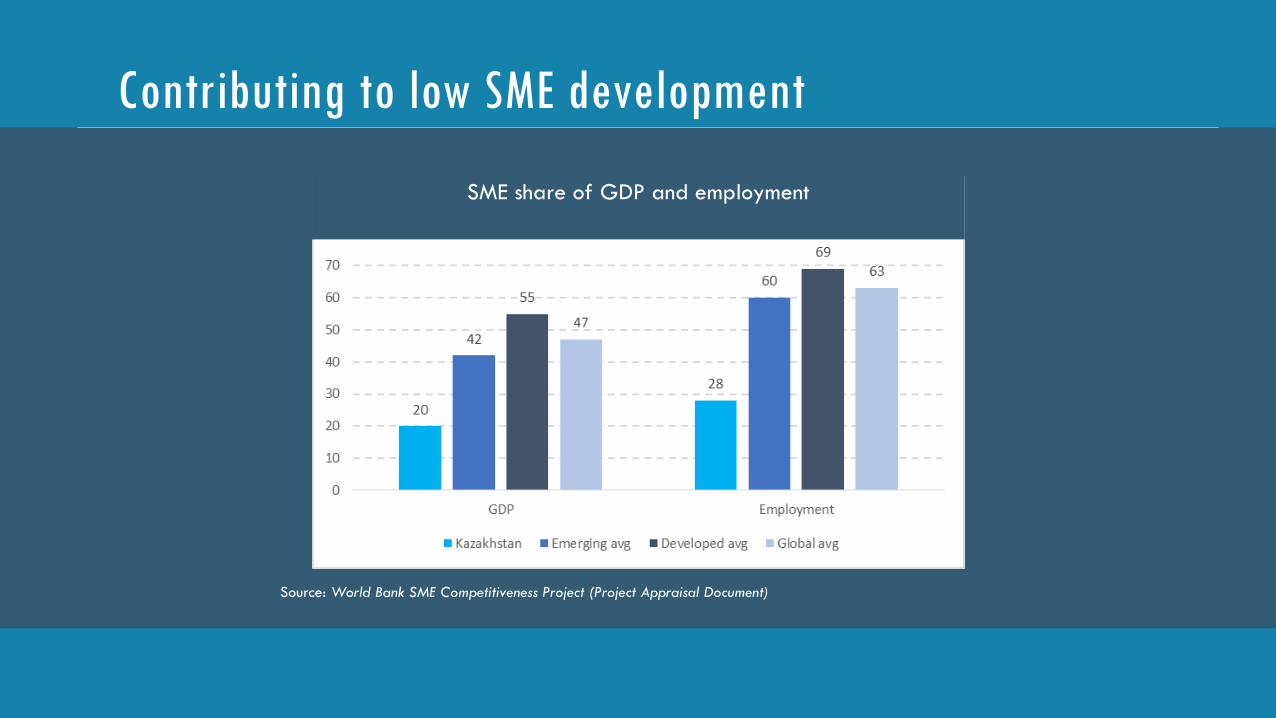
Contributing to low SME development
Source: World Bank SME Competitiveness Project (Project Appraisal Document)
SME share of GDP and employment
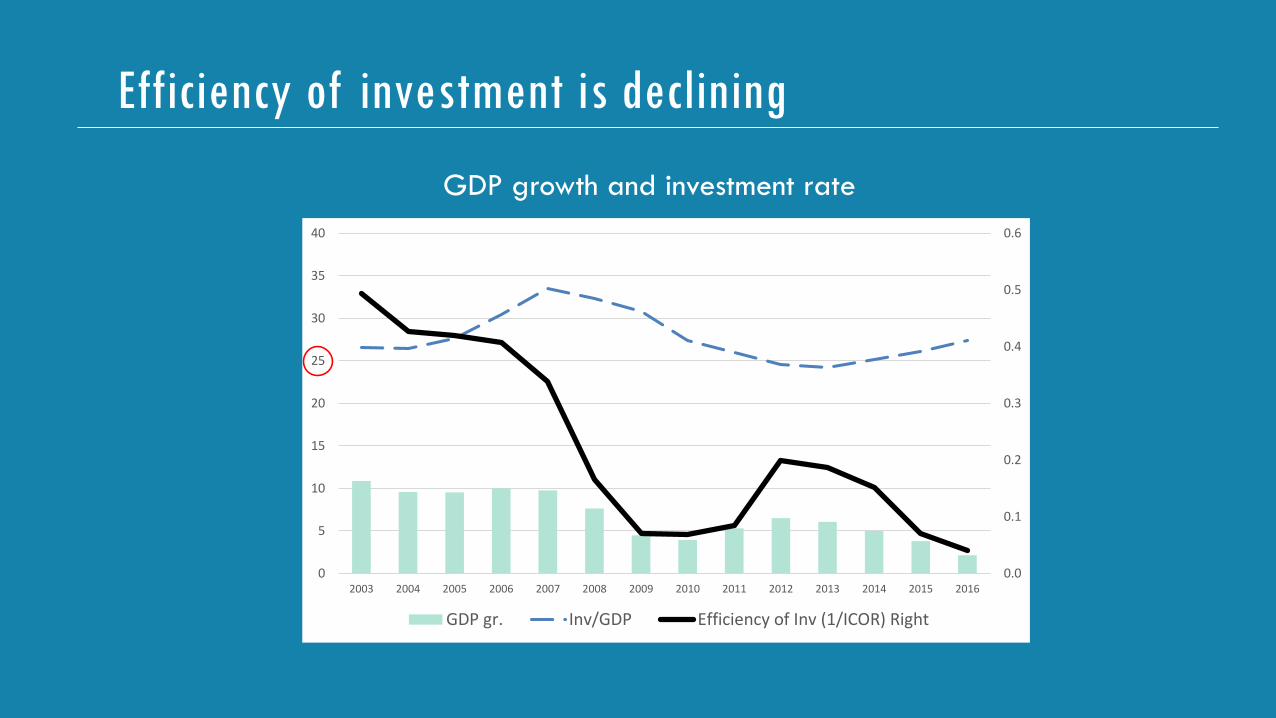
Efficiency of investment is declining
GDP growth and investment rate
0.0
0.1
0.2
0.3
0.4
0.5
0.6
0
5
10
15
20
25
30
35
40
2003 2004 2005 2006 2007 2008 2009 2010 2011 2012 2013 2014 2015 2016
GDP gr. Inv/GDP Efficiency of Inv (1/ICOR) Right
PATHWAY #3
TRADE, CONNECTIVITY
AND INTEGRATION
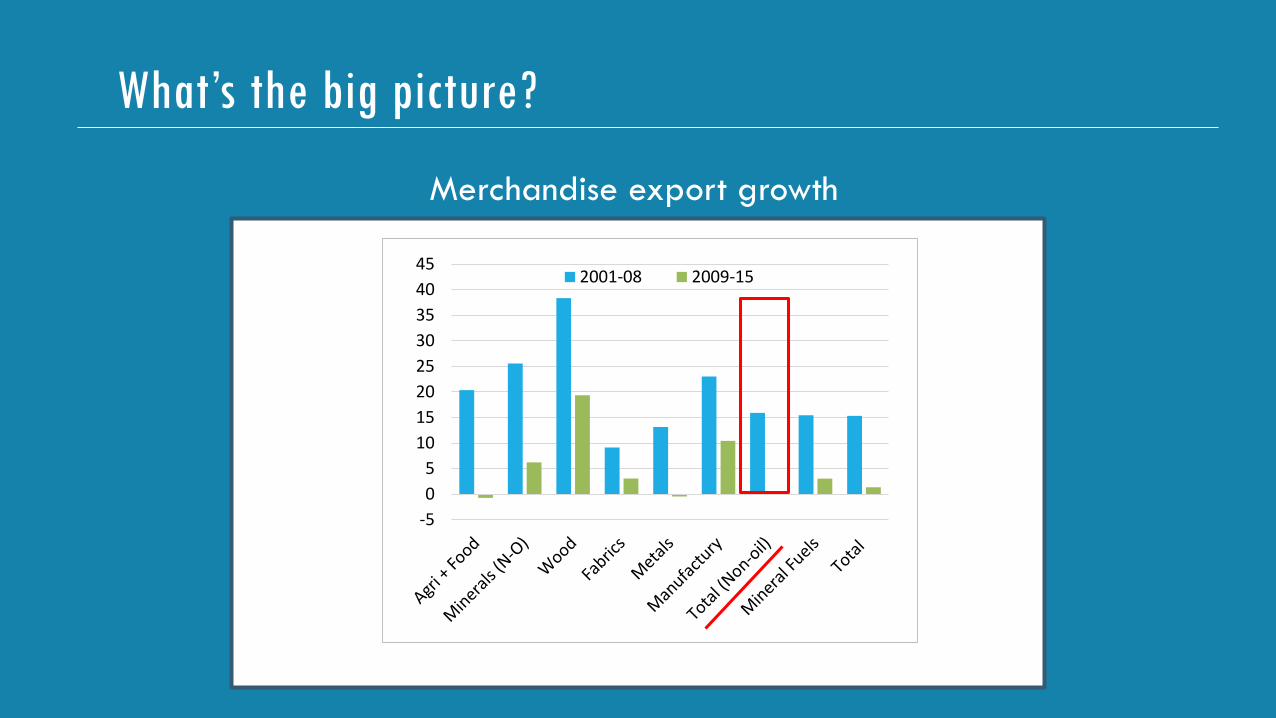
What’s the big picture?
-5
0
5
10
15
20
25
30
35
40
452001-08 2009-15
Merchandise export growth
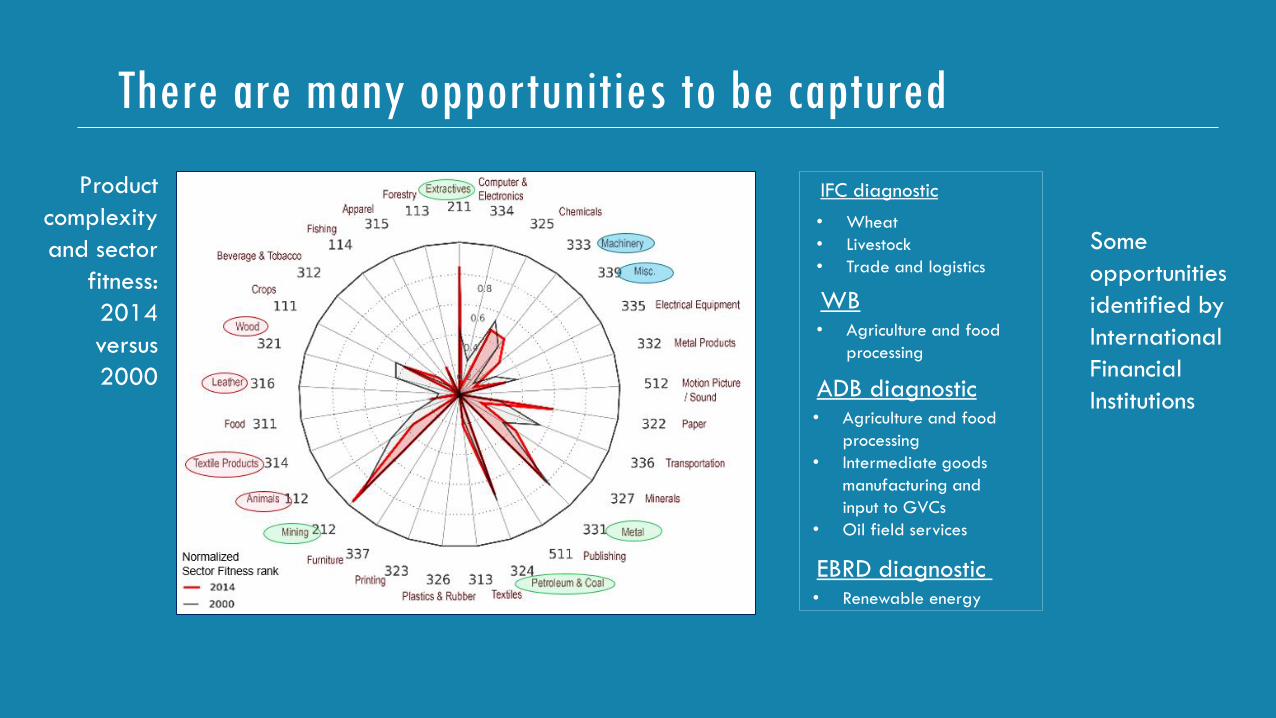
There are many opportunities to be captured
• Wheat
• Livestock
• Trade and logistics
IFC diagnostic
• Agriculture and food
processing
WB
• Agriculture and food
processing
• Intermediate goods
manufacturing and
input to GVCs
• Oil field services
ADB diagnostic
• Renewable energy
EBRD diagnostic
Some
opportunities
identified by
International
Financial
Institutions
Product
complexity
and sector
fitness:
2014
versus
2000
West
Kazakhstan
AktobeAtyrau
Mangystau Kyzylorda
South
Kazakhstan
Jambyl
Almaty
Province
Almaty
Karagandy
East Kazakhstan
Pavlodar
North
Kazakhstan
Kostanay
AstanaAkmola
Tier 1 - RCI 100-58
Tier 2 – RCI 45-52
Tier 3 – RCI 13-40
Tier 4 – RCI 1-10
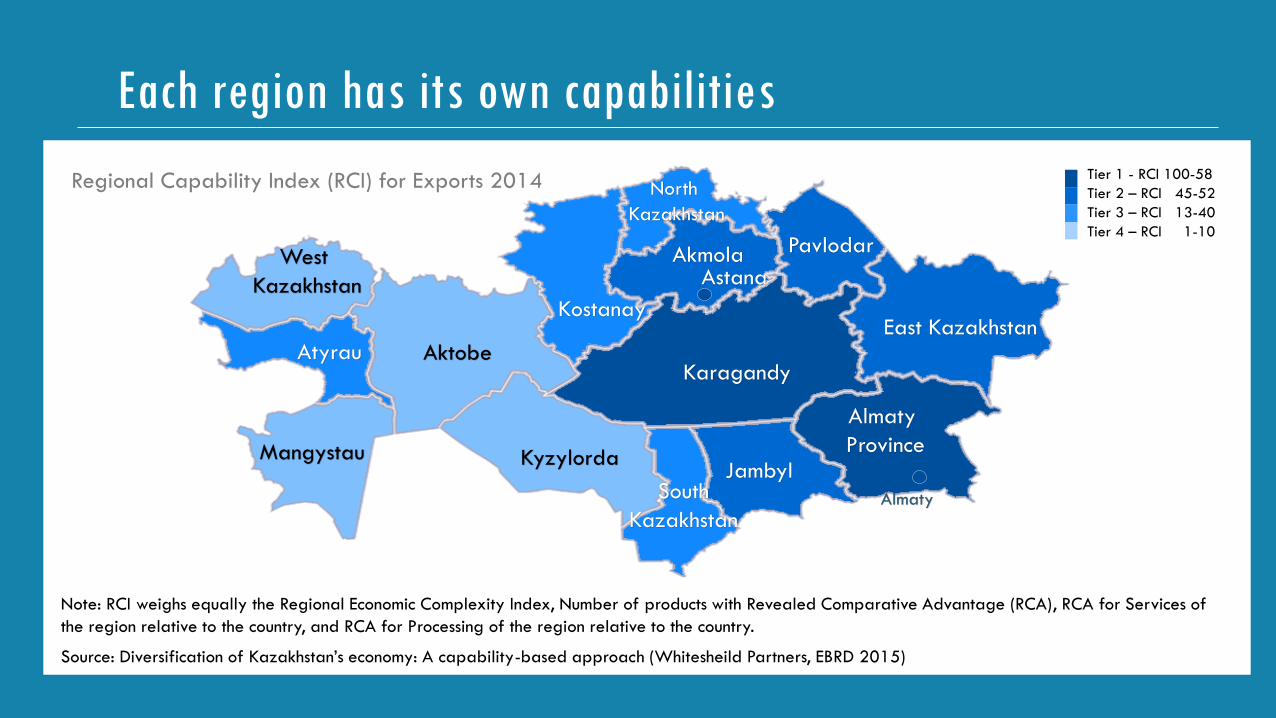
Note: RCI weighs equally the Regional Economic Complexity Index, Number of products with Revealed Comparative Advantage (RCA), RCA for Services of
the region relative to the country, and RCA for Processing of the region relative to the country.
Source: Diversification of Kazakhstan’s economy: A capability-based approach (Whitesheild Partners, EBRD 2015)
Regional Capability Index (RCI) for Exports 2014
Each region has its own capabilities
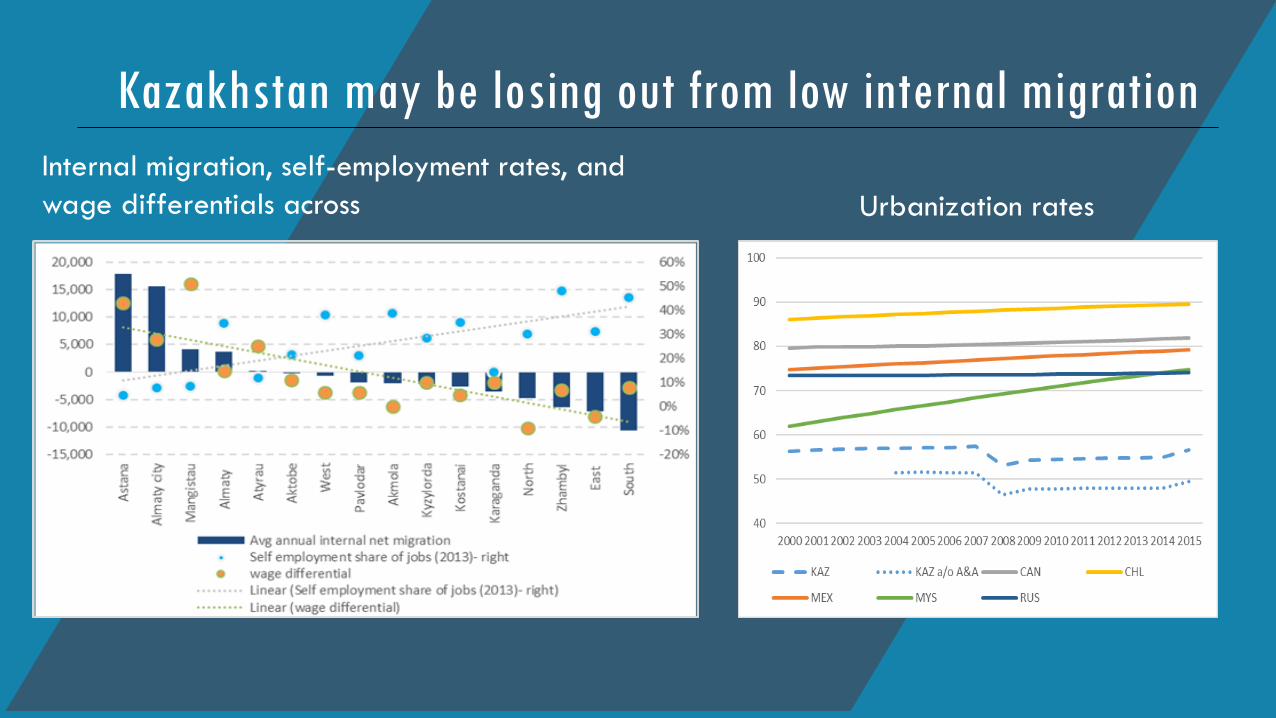
Kazakhstan may be losing out from low internal migration
Urbanization rates
Internal migration, self-employment rates, and
wage differentials across
FUTURE
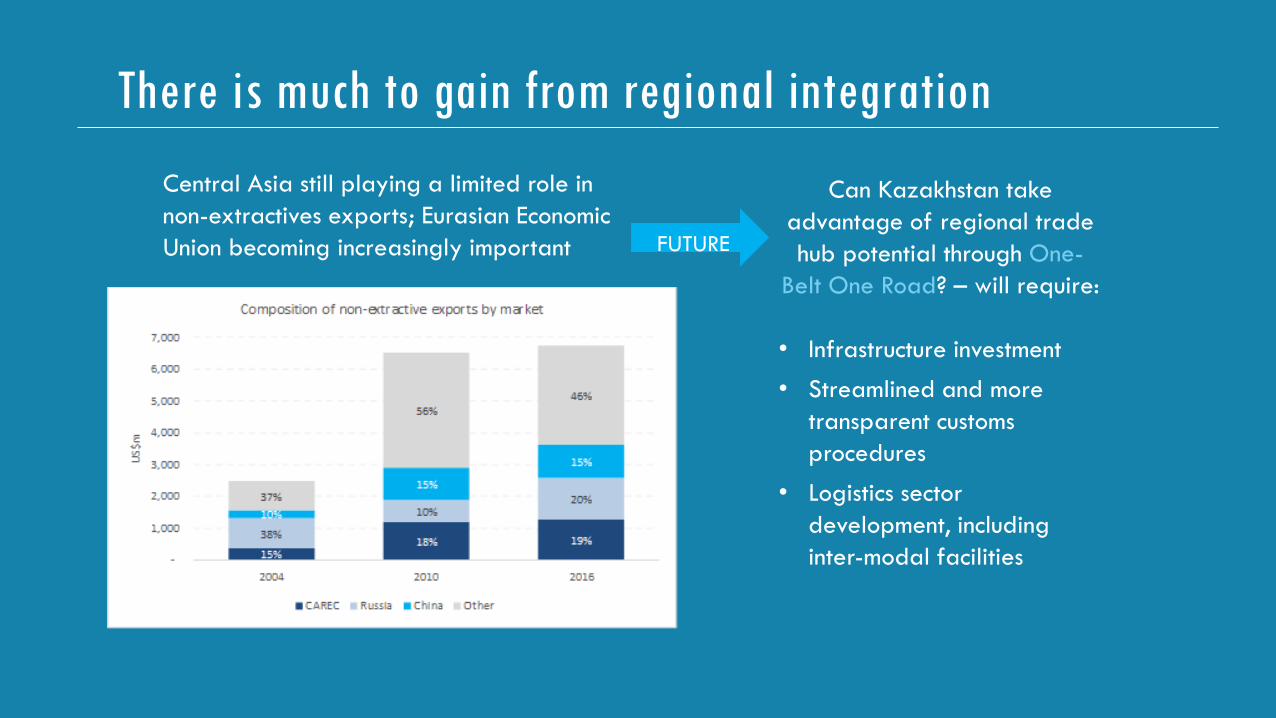
Central Asia still playing a limited role in
non-extractives exports; Eurasian Economic
Union becoming increasingly important
Can Kazakhstan take
advantage of regional trade
hub potential through One-
Belt One Road? – will require:
• Infrastructure investment
• Streamlined and more
transparent customs
procedures
• Logistics sector
development, including
inter-modal facilities
There is much to gain from regional integration
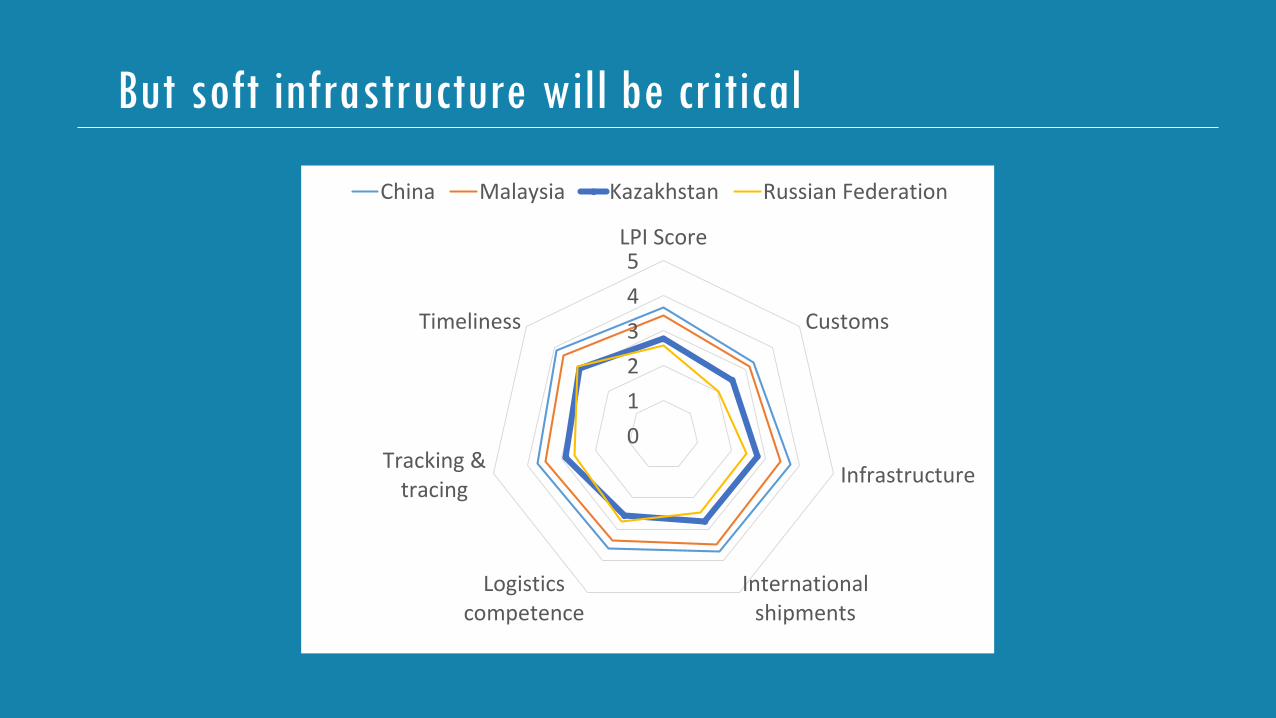
But soft infrastructure will be critical
0
1
2
3
4
5LPI Score
Customs
Infrastructure
Internationalshipments
Logisticscompetence
Tracking &tracing
Timeliness
China Malaysia Kazakhstan Russian Federation
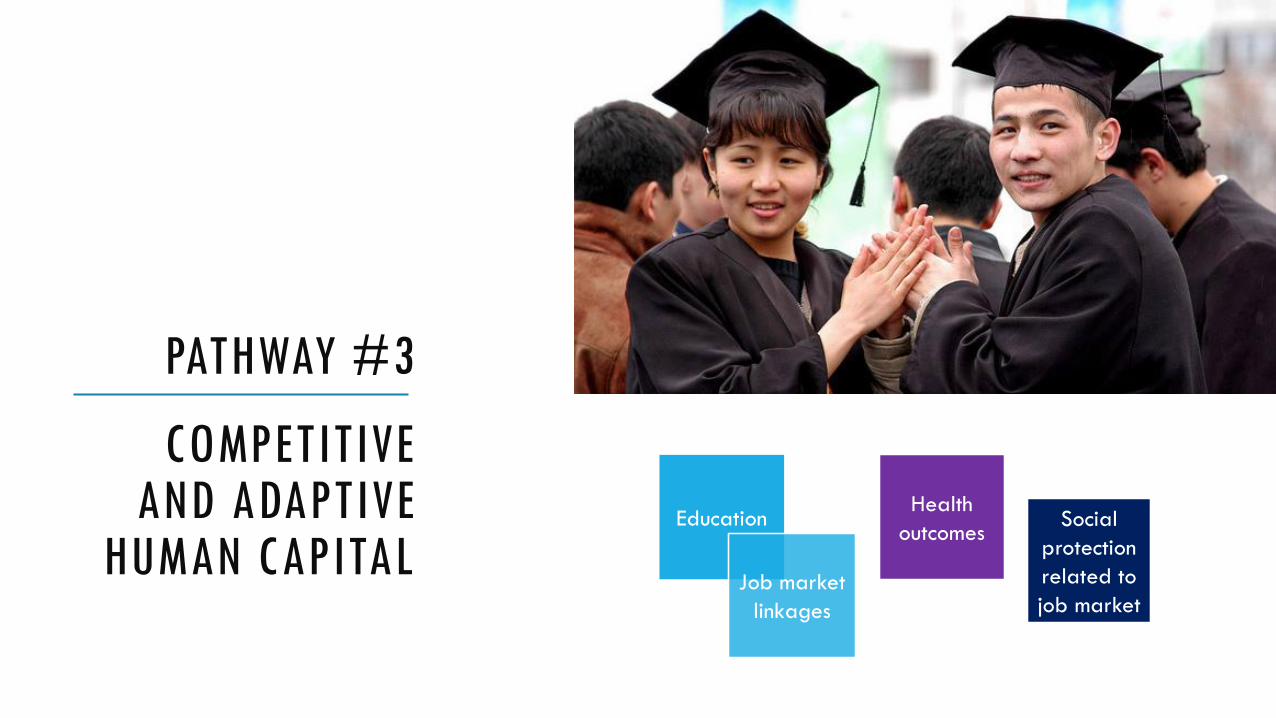
PATHWAY #3
COMPETITIVE AND ADAPTIVE
HUMAN CAPITALEducation
Job market
linkages
Health
outcomesSocial
protection
related to
job market
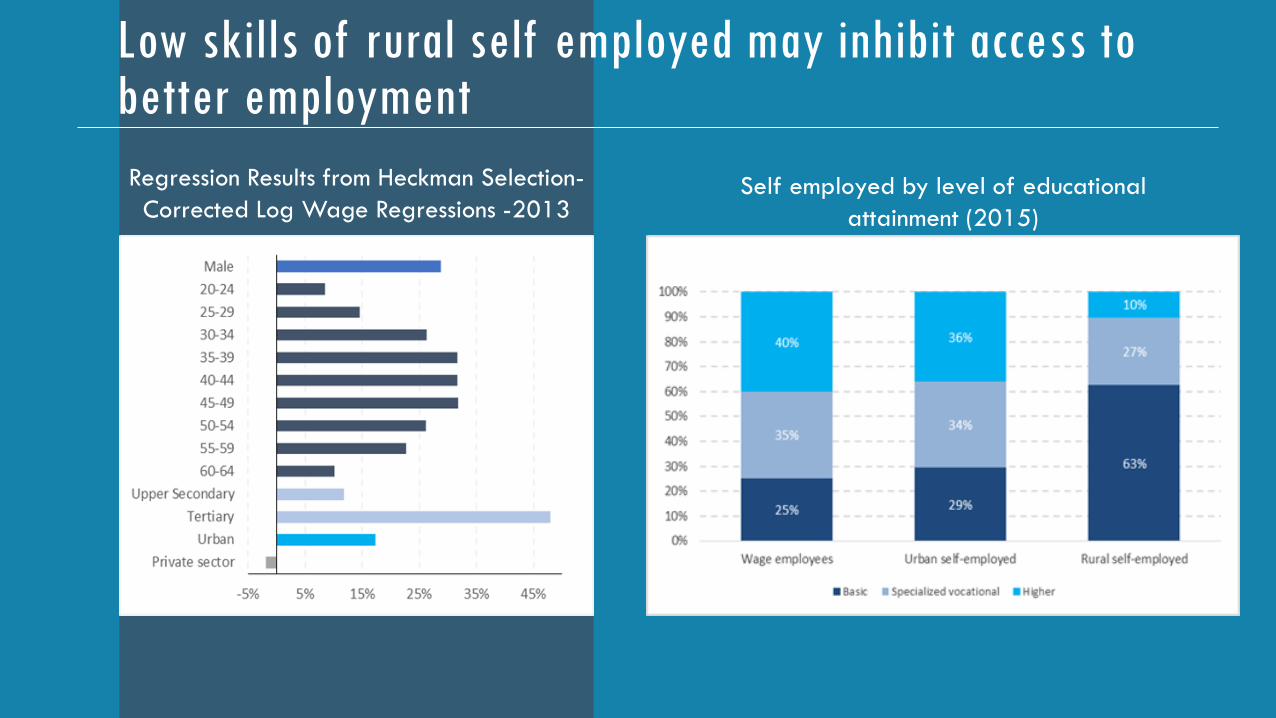
Low skills of rural self employed may inhibit access to better employment
Regression Results from Heckman Selection-
Corrected Log Wage Regressions -2013Self employed by level of educational
attainment (2015)

Distribution of educational attainment of youth population
(15-28)
Evolution of Kazakhstan’s PISA
performance
Despite overall progress made on education
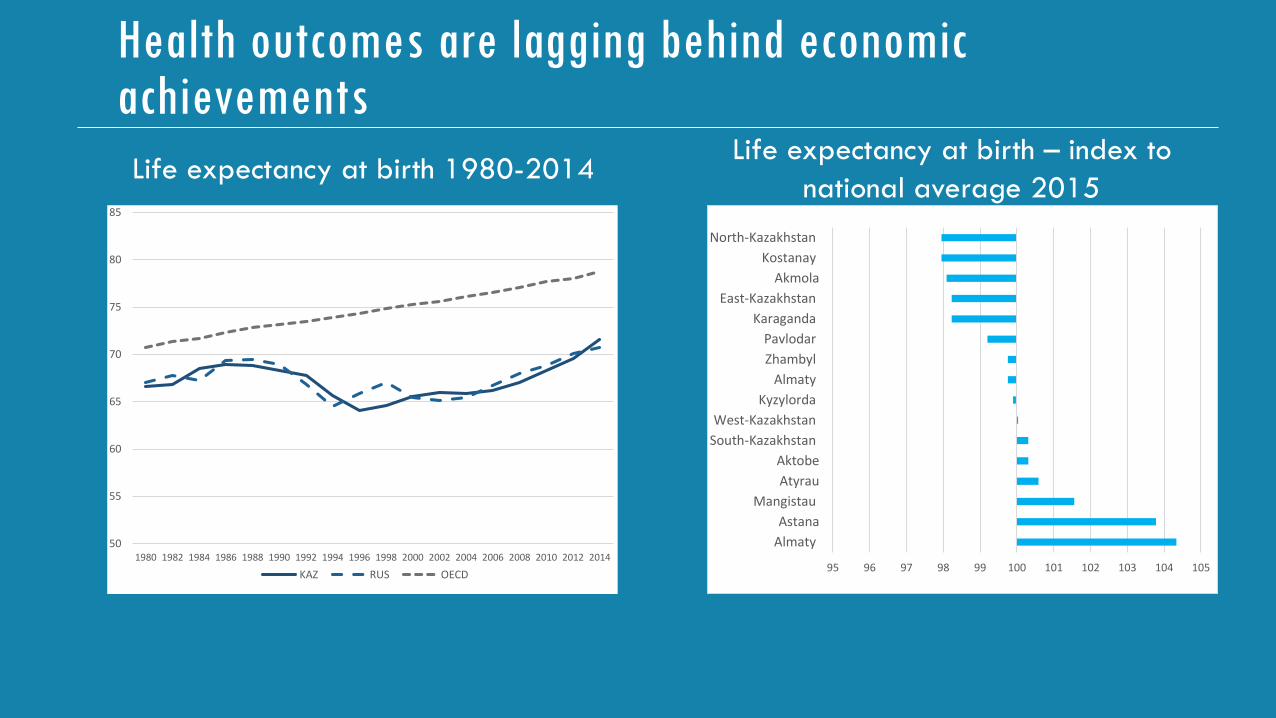
Health outcomes are lagging behind economic achievements
95 96 97 98 99 100 101 102 103 104 105
Almaty
Astana
Mangistau
Atyrau
Aktobe
South-Kazakhstan
West-Kazakhstan
Kyzylorda
Almaty
Zhambyl
Pavlodar
Karaganda
East-Kazakhstan
Akmola
Kostanay
North-Kazakhstan
50
55
60
65
70
75
80
85
1980 1982 1984 1986 1988 1990 1992 1994 1996 1998 2000 2002 2004 2006 2008 2010 2012 2014
KAZ RUS OECD
Life expectancy at birth – index to
national average 2015Life expectancy at birth 1980-2014
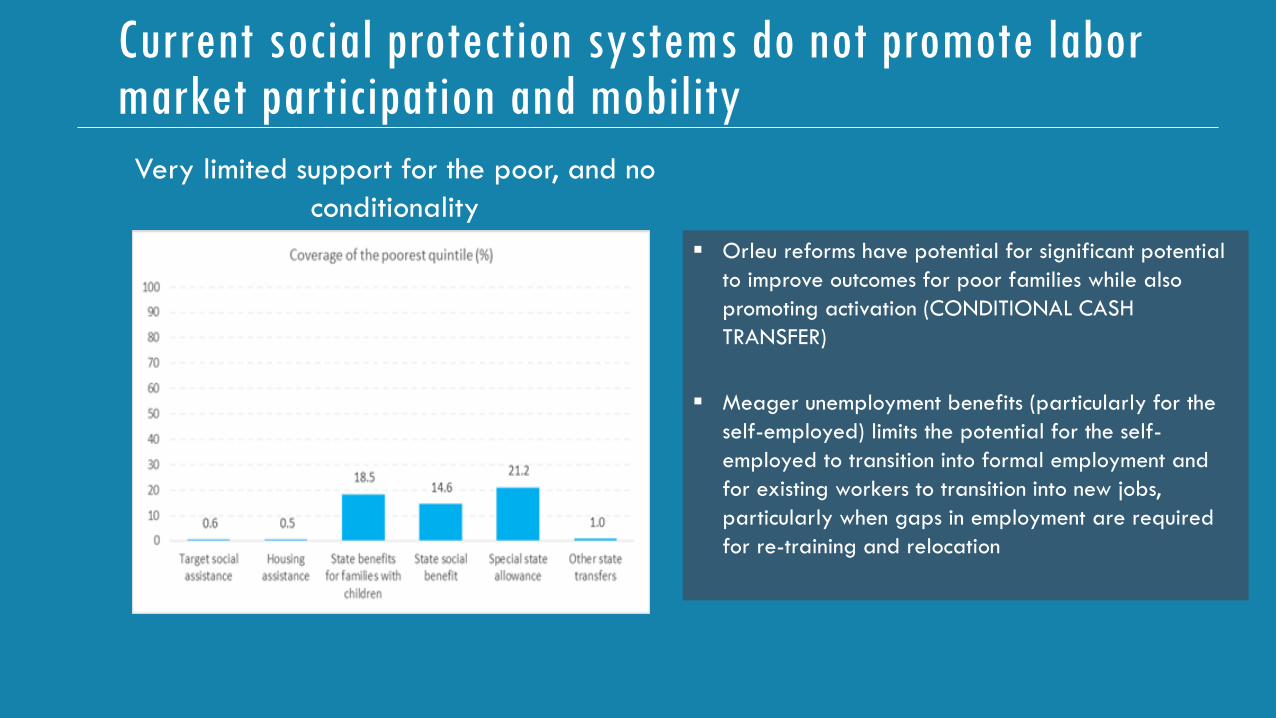
Current social protection systems do not promote labor market participation and mobility
Very limited support for the poor, and no
conditionality
Orleu reforms have potential for significant potential
to improve outcomes for poor families while also
promoting activation (CONDITIONAL CASH
TRANSFER)
Meager unemployment benefits (particularly for the
self-employed) limits the potential for the self-
employed to transition into formal employment and
for existing workers to transition into new jobs,
particularly when gaps in employment are required
for re-training and relocation
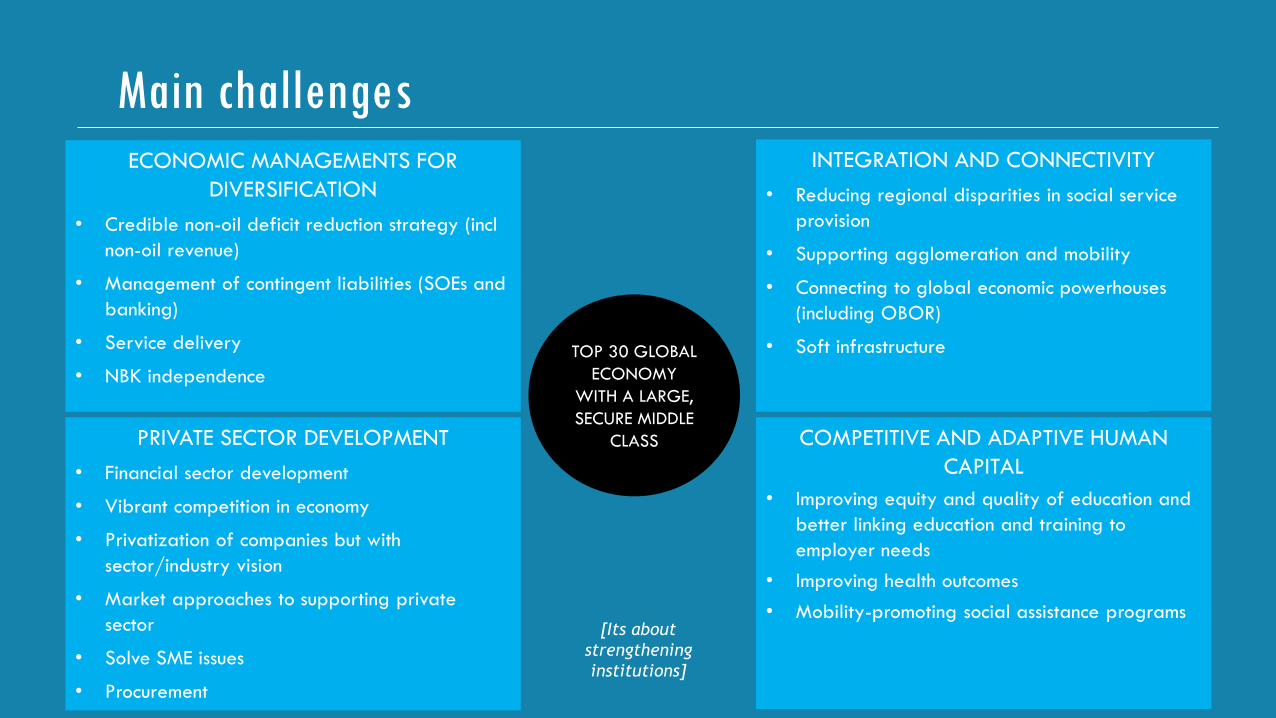
ECONOMIC MANAGEMENTS FOR
DIVERSIFICATION
• Credible non-oil deficit reduction strategy (incl
non-oil revenue)
• Management of contingent liabilities (SOEs and
banking)
• Service delivery
• NBK independence
PRIVATE SECTOR DEVELOPMENT
• Financial sector development
• Vibrant competition in economy
• Privatization of companies but with
sector/industry vision
• Market approaches to supporting private
sector
• Solve SME issues
• Procurement
COMPETITIVE AND ADAPTIVE HUMAN
CAPITAL
• Improving equity and of education
and better linking education and
training to employer needs
• Improving health outcomes
• Mobility-promoting social assistance
programs
COMPETITIVE AND ADAPTIVE HUMAN
CAPITAL
• Improving equity and quality of education and
better linking education and training to
employer needs
• Improving health outcomes
• Mobility-promoting social assistance programs
TOP 30 GLOBAL
ECONOMY
WITH A LARGE,
SECURE MIDDLE
CLASS
[Its about
strengthening
institutions]
Main challengesINTEGRATION AND CONNECTIVITY
• Reducing regional disparities in social service
provision
• Supporting agglomeration and mobility
• Connecting to global economic powerhouses
(including OBOR)
• Soft infrastructure

THANK YOU FOR YOUR ATTENTION