Embed Size (px)
Citation preview
FTSE ALL-SHARE DIRECTORS’ PAY GUIDE
2018/2019

32
Introduction Welcome to the 2018/19 Korn Ferry FTSE All-Share Directors’ Pay Guide, the second edition of this document.
This Guide is structured as follows:
� Part 1 – General Commentary: In this main body of our Guide, we summarise pay trends and practice amongst FTSE All-Share companies i.e. encompassing the FTSE 100, 250 and SmallCap. We provide:
- Our thoughts on how executive pay continues to evolve, particularly in the context of a changing regulatory and governance landscape in the UK.
- A summary of trends in each of the main elements of executive director pay (i.e. salary, pension, annual bonus and long-term incentives), while also considering Chairman/NED pay.
- An overview of the issues at the top of the agendas of shareholders and the main proxy voting agencies, as well as a summary of recent voting trends.
� Part 2 – Data Analysis: In this Part we provide information on actual pay levels and structure in each of the FTSE 100, 250 and SmallCap.
Our approach to sourcing data and attributing values to each element of pay (together with an explanation of the terminology used) can be found in the Appendix. However, in summary:
� Data source – all data is sourced from Report and Accounts published by FTSE All-Share companies up to July 2018, therefore covering the main body of the 2018 AGM season (i.e. including all 31st March 2018 year ends).
� Valuation methodology – we have analysed each element of remuneration using an “on-target” value basis, looking at each element in isolation and on a “total remuneration” basis.
We hope you find this Guide helpful.

54
Executive remuneration has also been caught in the cross-fire. Shareholders, regulators and governments are alive to what could be argued as being a paradigm shift in popular sentiment and, as a result, have felt compelled to act:
� Investors - The 2018 AGM season saw almost unprecedented levels of shareholder activism, with a significant number of pay-related resolutions attracting at least 20% votes against which is enough to place a company on the Investment Association’s new public register.
� Regulators – A new UK Corporate Governance Code will apply from 2019 which contains a raft of additional requirements and guidance on executive pay and employee/stakeholder engagement more generally.
� Governments – what would perhaps be considered inconceivable only a few years ago, we have seen a Conservative government - traditionally the natural home of business friendly free marketeers - passing legislation that (amongst other things) requires companies to disclose CEO vs all-employee pay ratios. That said, perhaps companies should be thankful for small mercies as the legislation didn’t go as far as had been threatened (e.g. no annual binding vote on pay or a ban on LTIPs was forthcoming).
Companies must, therefore, accept that a new order is being established and that some of the traditional rules of engagement have been swept away. For example, the Persimmon case showed that Remuneration Committees can no longer rely upon the defence that shareholders voted
a plan through if eventual outturns are seen to be disproportionate. Instead, Remuneration Committees will now be expected to step in and modify bonus payouts and/or LTIP vestings (or, as the new Corporate Governance Code would have it, “override formulaic outcomes”) if they do not reflect underlying performance and the broader context.
Similarly, going forward only a very brave company will not wish to be seen as addressing a material concern raised by shareholders at a previous AGM, as to not do so may characterise you as a “repeat offender” within the investor community and result in an even higher negative vote the following year. And negative votes are no longer cast solely in relation to the actual remuneration-related resolutions – a very notable trend during the 2018 AGM season was the frequent instances of substantial (i.e. 20% plus) votes against the re-election of directors – a doubling of occurrences compared to 2017 according to the Investment Association.
However, with change comes opportunity, which leads on to perhaps the most hotly debated executive pay-related issue of the current time – restricted shares. Interestingly, the amount of discussion that has played out in Remuneration Committee meetings on this topic is probably inversely proportional to the number of companies that have successfully replaced their traditional LTIP with restricted shares. While the attractions of restricted shares are clear to many – two being perceived simplicity and reduced overall quantum being two – for various reasons we have seen only a very small number of companies
Part 1
An Overview We live in interesting times. A surge of popularism and anti-establishment sentiment has emerged globally which has many manifestations – the Brexit vote, the election of Donald Trump, right-wing anti-immigration governments coming to power in Europe to name but a few.

76
the Remuneration Committee is required to undertake i.e. the new requirement is no more than further encouragement to ensure that Remuneration Committees make decisions on executive pay in a broader context.
However, some commentators are suggesting that this extended Remuneration Committee oversight will require far more proactive input into not only workforce pay, but also general conditions such as training, flexitime, promotion opportunities etc. Is this really what an individual signs up to when they agree to be a non-executive director and member/chair of the Remuneration Committee, and is this level of granular involvement in quasi-executive responsibilities really what shareholders would want NEDs to be involved in?
In the end, we are likely to see a Remuneration Committee’s “to do” list continuing to lengthen. They are facing a broader remit, regulatory/legislative changes, increasingly activist shareholders and management teams who – with a degree of justification perhaps – are becoming ever more frustrated by the additional compliance-driven complexity of their pay (e.g. post vesting holding periods in LTIPs). All this, together with investors’ newfound appetite to vote against the re-election of non-executives, hardly makes the role of Remuneration Committee chair more attractive.
Indeed, it is likely that we will continue to live in “interesting times” from an executive remuneration perspective for a fair while longer.
obtaining shareholder approval for the operation of restricted shares for main Board directors (although they are more common below Board).
There are many reasons for this:
� Although most shareholders strive for greater simplicity in executive pay, for many replacing LTIPs with non-performance linked restricted shares is just a step too far. The Investment Association’s public register (or “naughty step” as it has been dubbed by some), does not necessarily encourage innovation.
� As a result, companies must provide a very compelling case for introducing restricted shares which is specific to their particular circumstances (e.g. an inability to set long-term targets due to macro-economic/cyclical factors).
� In addition to a strong strategic rationale, other sine qua nons of restricted shares include (i) at least a 2:1 “exchange rate” between LTIPs and restricted shares (ii) a long-tail vesting profile (i.e. at least five years) and (iii) the application of some form of underpins that, if not met, can reduce vesting. While (as noted above) there are very limited instances of restricted shares being introduced, it is interesting to note that, of those that have been established, most will require a degree of judgement by the Remuneration Committee, either: - as the underpins themselves are not binary in nature (e.g. “business performance has to be robust and sustainable for awards to vest”), and/or - the extent to which the award should be reduced if the underpins are not met.
Some Remuneration Committees will embrace the ability to exercise judgement at the relevant time. Others may take the view that this could lead them to be in a very unenviable and uncomfortable position.
Stepping back though, while restricted shares may be absolutely the right tool to align management and shareholder interests for some companies, there are arguably broader issues at play here. The whole concept of linking executive pay to performance and the use of shares stems from the “principal/agency theory” - executives are the agents of the owners of the business and so the best way to align the interests of the two is via performance-related pay and share awards. However, more recent thinking suggests that agents may be inherently (and overly) risk averse – if a CEO is accountable for a company’s performance but believes that there are a myriad of factors that are out of his/her control that influence corporate performance, the CEO is more likely to pursue low risk (and, potentially low return) strategies. Therefore, the argument goes that by operating a non-performance linked restricted shares policy, a company is making it even more likely that the management team will be too risk averse as they will have no direct incentive to achieve long-term goals.
Of course, restricted shares is only one of the growing list of issues with which Remuneration Committees are having to wrestle. The new Corporate Governance Code now requires Remuneration Committees to set the pay of all members of “senior management”, not just the executive directors. In practice, this may not increase a Remuneration Committee’s burden unduly as it would more often than not already be taking an active role in “ExCo” pay. However, perhaps of greater impact will be the new Code requirement for Remuneration Committees to “review workforce remuneration and related policies…..taking these into account when setting the policy for director remuneration”. The jury is currently out as to what this actually means for Remuneration Committees. Most will probably hope that the second limb of the requirement - to take general workforce pay into account when setting executive pay - will not increase the amount of actual oversight of general workforce pay that

98
Review of the yearThe following is a summary of the main trends we witnessed in the 2018 AGM season. Full details of actual pay quantum and structure based on company size can be found in Part 2 of this Guide.
Base salary
Where provided, salary increases generally tracked wider employee increases at around 2% - 3%. That said, we saw a continuation of the trend of a significant minority of directors (around 30%) not receiving a salary increase for 2018.
Shareholders remain very wary of above-inflationary salary increases which require robust justification over and above “the need to move a salary up to the median level”. The one exception to this rule relates to new joiners, where greater flexibility can be afforded to move an executive’s salary up to a more market-reflective level where it is initially set at a significant discount to the market rate and/or that of the previous incumbent. This should however be signposted on recruitment.
Pension
The new UK Corporate Governance Code (effective from 2019) includes a provision stating that companies should align the directors’ pension policy with the wider workforce. This is in line with recent trends where new appointees are often receiving lower levels of pension contributions than previous incumbents.
Annual bonus
2018 saw little change in bonus structure or quantum:
� Bonus opportunity generally remained unchanged. In the minority of companies where it was increased a strong rationale was needed.
� A blend of financial and non-financial measures tend to be used, albeit with the majority on financial.
� Standard practice for 25% - 50% of the bonus earned to be deferred into shares for two/three years.
� Malus and clawback provisions are now common practice.
Overall, actual payouts were marginally up compared to the prior year and there is continuing criticism from shareholders over the lack of variability in bonus payouts. There is strong focus placed on the stretch of bonus targets and their disclosure to allow scrutiny of the payouts. Most companies retrospectively disclose (i) the precise financial targets used in the prior year and (ii) a good level of detail of the non-financial targets and performance against them.
Remuneration Committees are expected to be able to apply discretion to bonus payouts, and use it where appropriate to strengthen the link between pay and performance. There is evidence of Committees using this discretion at the largest companies, and we expect this practice to become more common in smaller companies as shareholder pressure increases.

1110
Long-term incentives
As with annual bonuses, generally speaking there were few changes in approach:
� The vast majority of companies continued to operate a Performance Share Plan as their sole long-term incentive. Whilst there were significant discussions on the topic, only a very small number of companies (including Weir Group and Card Factory) successfully introduced Restricted Share Plans.
� Award levels typically remained the same as the prior year.
� With regard to performance conditions: - The performance period remains three years in virtually all cases - A blend of two or three measures tend to be used - TSR and financial metrics remain the most common, with EPS and return metrics (e.g. ROCE) the most commonly used financial metrics
� Malus and clawback provisions are now common practice.
Whilst TSR and Group financial metrics remain the most common, in an attempt to strengthen the link between reward and performance some companies are including other KPIs and/or strategic goals. These may include strategic/operational/non-financial metrics which were
traditionally used only in annual bonuses e.g. customer service, Net Promoter Score, employee engagement, market share etc.
Post vesting holding periods, requiring shares delivered under LTIPs not to be sold for a further two years, are now standard market practice. Indeed, the new Corporate Governance Code has introduced a provision stating that LTIPs should have a total time horizon (vesting plus holding period) of five years and as such we expect the majority of those who do not already include such a feature to do so when next reviewing their policy (if not before).
Share ownership guidelines are now at least 200% of salary for all directors at the majority of companies, as companies have increased levels to meet shareholder/ISS expectations. In addition, the new Corporate Governance Code states that Remuneration Committees should develop a formal policy for post-employment shareholding which should include both unvested and vested shares. That said, thus far few companies have extended their shareholding requirements beyond cessation.
Chairman/NED fees
Whilst traditionally companies would only review NED fees every few years, it is now increasingly common for companies to review, although not necessarily increase, fees on an annual basis.
1312
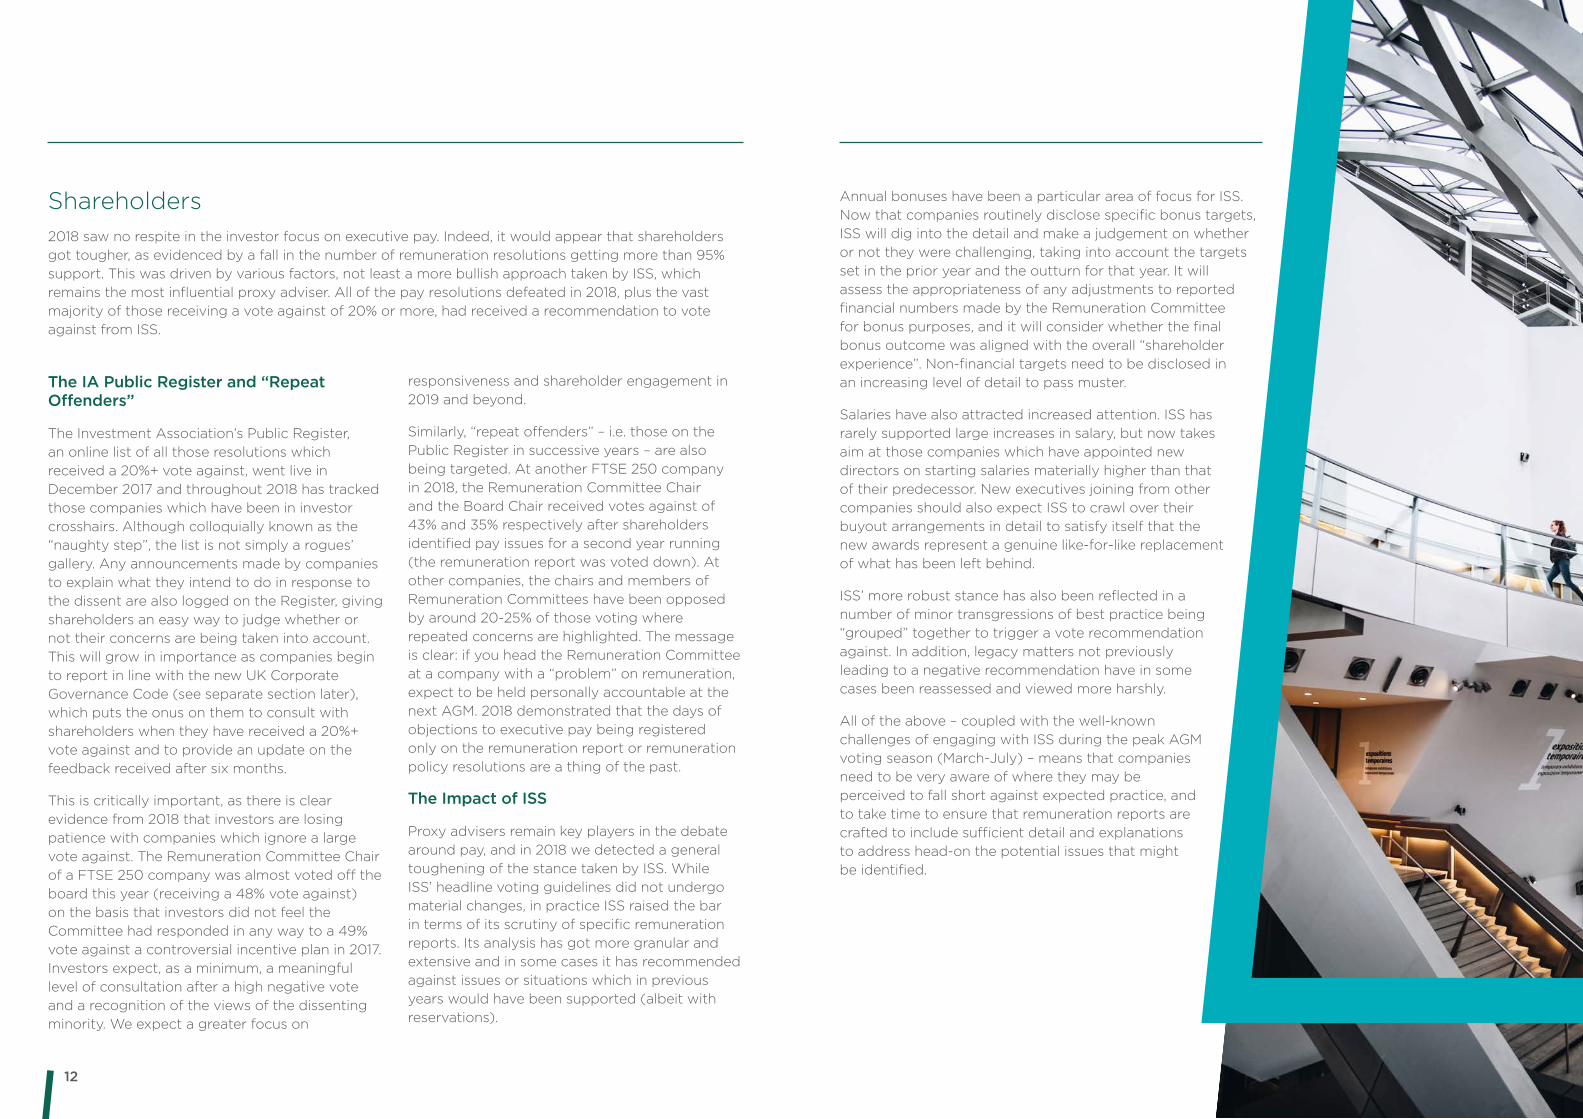
The IA Public Register and “Repeat Offenders”
The Investment Association’s Public Register, an online list of all those resolutions which received a 20%+ vote against, went live in December 2017 and throughout 2018 has tracked those companies which have been in investor crosshairs. Although colloquially known as the “naughty step”, the list is not simply a rogues’ gallery. Any announcements made by companies to explain what they intend to do in response to the dissent are also logged on the Register, giving shareholders an easy way to judge whether or not their concerns are being taken into account. This will grow in importance as companies begin to report in line with the new UK Corporate Governance Code (see separate section later), which puts the onus on them to consult with shareholders when they have received a 20%+ vote against and to provide an update on the feedback received after six months.
This is critically important, as there is clear evidence from 2018 that investors are losing patience with companies which ignore a large vote against. The Remuneration Committee Chair of a FTSE 250 company was almost voted off the board this year (receiving a 48% vote against) on the basis that investors did not feel the Committee had responded in any way to a 49% vote against a controversial incentive plan in 2017. Investors expect, as a minimum, a meaningful level of consultation after a high negative vote and a recognition of the views of the dissenting minority. We expect a greater focus on
responsiveness and shareholder engagement in 2019 and beyond.
Similarly, “repeat offenders” – i.e. those on the Public Register in successive years – are also being targeted. At another FTSE 250 company in 2018, the Remuneration Committee Chair and the Board Chair received votes against of 43% and 35% respectively after shareholders identified pay issues for a second year running (the remuneration report was voted down). At other companies, the chairs and members of Remuneration Committees have been opposed by around 20-25% of those voting where repeated concerns are highlighted. The message is clear: if you head the Remuneration Committee at a company with a “problem” on remuneration, expect to be held personally accountable at the next AGM. 2018 demonstrated that the days of objections to executive pay being registered only on the remuneration report or remuneration policy resolutions are a thing of the past.
The Impact of ISS
Proxy advisers remain key players in the debate around pay, and in 2018 we detected a general toughening of the stance taken by ISS. While ISS’ headline voting guidelines did not undergo material changes, in practice ISS raised the bar in terms of its scrutiny of specific remuneration reports. Its analysis has got more granular and extensive and in some cases it has recommended against issues or situations which in previous years would have been supported (albeit with reservations).
Annual bonuses have been a particular area of focus for ISS. Now that companies routinely disclose specific bonus targets, ISS will dig into the detail and make a judgement on whether or not they were challenging, taking into account the targets set in the prior year and the outturn for that year. It will assess the appropriateness of any adjustments to reported financial numbers made by the Remuneration Committee for bonus purposes, and it will consider whether the final bonus outcome was aligned with the overall “shareholder experience”. Non-financial targets need to be disclosed in an increasing level of detail to pass muster.
Salaries have also attracted increased attention. ISS has rarely supported large increases in salary, but now takes aim at those companies which have appointed new directors on starting salaries materially higher than that of their predecessor. New executives joining from other companies should also expect ISS to crawl over their buyout arrangements in detail to satisfy itself that the new awards represent a genuine like-for-like replacement of what has been left behind.
ISS’ more robust stance has also been reflected in a number of minor transgressions of best practice being “grouped” together to trigger a vote recommendation against. In addition, legacy matters not previously leading to a negative recommendation have in some cases been reassessed and viewed more harshly.
All of the above – coupled with the well-known challenges of engaging with ISS during the peak AGM voting season (March-July) – means that companies need to be very aware of where they may be perceived to fall short against expected practice, and to take time to ensure that remuneration reports are crafted to include sufficient detail and explanations to address head-on the potential issues that might be identified.
Shareholders 2018 saw no respite in the investor focus on executive pay. Indeed, it would appear that shareholders got tougher, as evidenced by a fall in the number of remuneration resolutions getting more than 95% support. This was driven by various factors, not least a more bullish approach taken by ISS, which remains the most influential proxy adviser. All of the pay resolutions defeated in 2018, plus the vast majority of those receiving a vote against of 20% or more, had received a recommendation to vote against from ISS.
1514
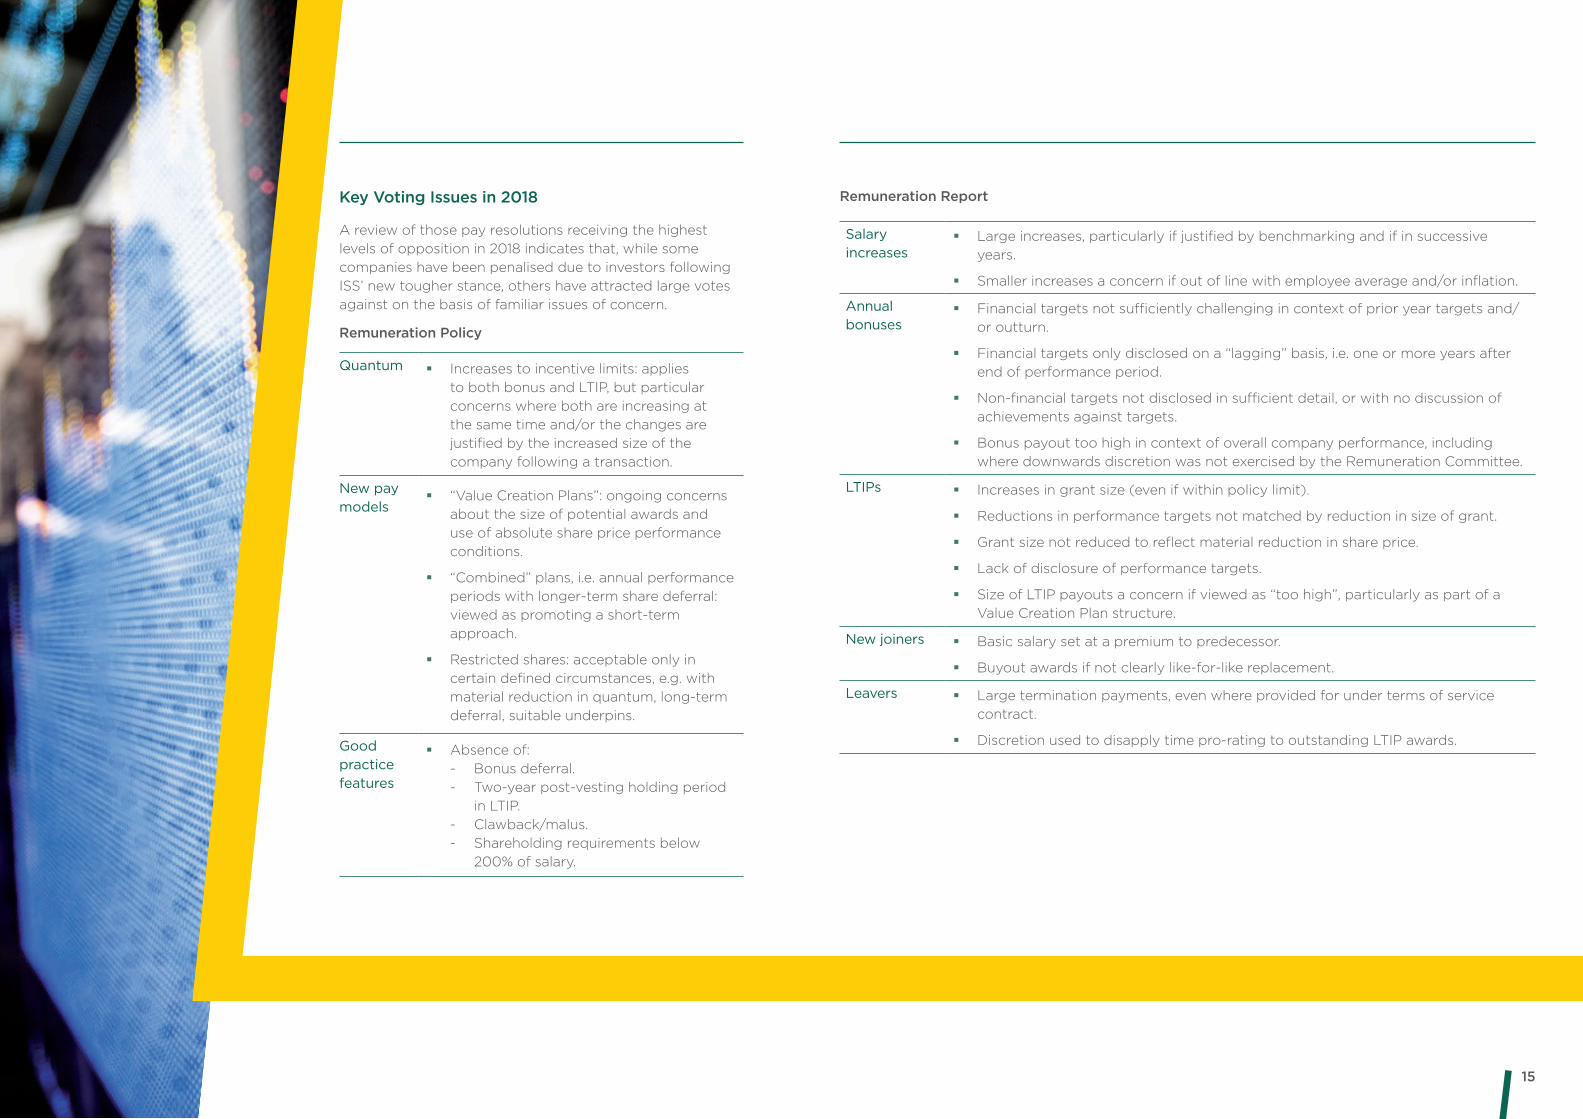
Remuneration Policy
Remuneration Report
Remuneration Report
Salary increases
� Large increases, particularly if justified by benchmarking and if in successive years.
� Smaller increases a concern if out of line with employee average and/or inflation.
Annual bonuses
� Financial targets not sufficiently challenging in context of prior year targets and/or outturn.
� Financial targets only disclosed on a “lagging” basis, i.e. one or more years after end of performance period.
� Non-financial targets not disclosed in sufficient detail, or with no discussion of achievements against targets.
� Bonus payout too high in context of overall company performance, including where downwards discretion was not exercised by the Remuneration Committee.
LTIPs � Increases in grant size (even if within policy limit).
� Reductions in performance targets not matched by reduction in size of grant.
� Grant size not reduced to reflect material reduction in share price.
� Lack of disclosure of performance targets.
� Size of LTIP payouts a concern if viewed as “too high”, particularly as part of a Value Creation Plan structure.
New joiners � Basic salary set at a premium to predecessor.
� Buyout awards if not clearly like-for-like replacement.
Leavers � Large termination payments, even where provided for under terms of service contract.
� Discretion used to disapply time pro-rating to outstanding LTIP awards.
Key Voting Issues in 2018
A review of those pay resolutions receiving the highest levels of opposition in 2018 indicates that, while some companies have been penalised due to investors following ISS’ new tougher stance, others have attracted large votes against on the basis of familiar issues of concern.
Remuneration Policy
Quantum � Increases to incentive limits: applies to both bonus and LTIP, but particular concerns where both are increasing at the same time and/or the changes are justified by the increased size of the company following a transaction.
New pay models
� “Value Creation Plans”: ongoing concerns about the size of potential awards and use of absolute share price performance conditions.
� “Combined” plans, i.e. annual performance periods with longer-term share deferral: viewed as promoting a short-term approach.
� Restricted shares: acceptable only in certain defined circumstances, e.g. with material reduction in quantum, long-term deferral, suitable underpins.
Good practice features
� Absence of: - Bonus deferral. - Two-year post-vesting holding period in LTIP. - Clawback/malus. - Shareholding requirements below 200% of salary.
1716
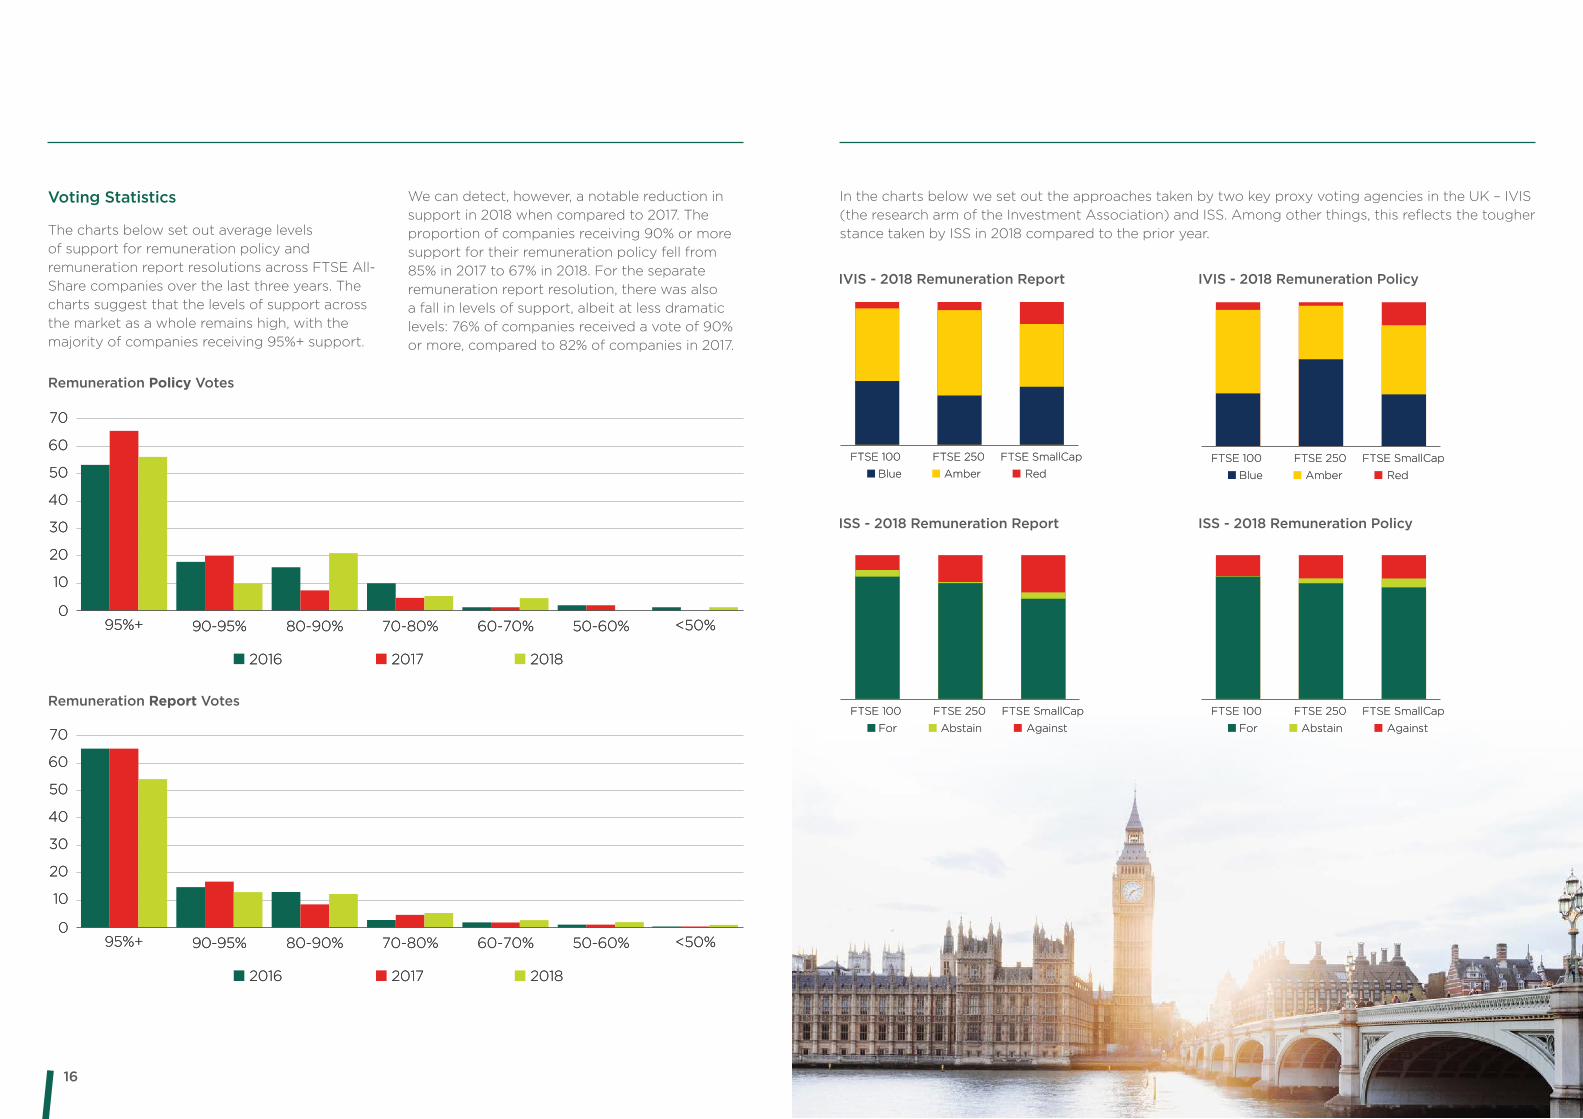
Voting Statistics
The charts below set out average levels of support for remuneration policy and remuneration report resolutions across FTSE All-Share companies over the last three years. The charts suggest that the levels of support across the market as a whole remains high, with the majority of companies receiving 95%+ support.
We can detect, however, a notable reduction in support in 2018 when compared to 2017. The proportion of companies receiving 90% or more support for their remuneration policy fell from 85% in 2017 to 67% in 2018. For the separate remuneration report resolution, there was also a fall in levels of support, albeit at less dramatic levels: 76% of companies received a vote of 90% or more, compared to 82% of companies in 2017.
Remuneration Report Votes
In the charts below we set out the approaches taken by two key proxy voting agencies in the UK – IVIS (the research arm of the Investment Association) and ISS. Among other things, this reflects the tougher stance taken by ISS in 2018 compared to the prior year.
00
1010
2020
3030
5050
4040
6060
7070
20162016 20172017 20182018
Remuneration Policy Votes
95%+95%+ 90-95%90-95% 80-90%80-90% 70-80%70-80% 60-70%60-70% 50-60%50-60% <50%<50%
00
1010
2020
3030
5050
4040
6060
7070
20162016 20172017 20182018
Remuneration Report Votes
95%+95%+ 90-95%90-95% 80-90%80-90% 70-80%70-80% 60-70%60-70% 50-60%50-60% <50%<50%
IVIS - 2018 Remuneration Report
ISS - 2018 Remuneration Report
IVIS - 2018 Remuneration Policy
ISS - 2018 Remuneration Policy
FTSE 100FTSE 100 FTSE 250FTSE 250 FTSE SmallCapFTSE SmallCap
BlueBlue Amber Amber RedRed
IVIS - 2018 Remuneration Report
FTSE 100FTSE 100 FTSE 250FTSE 250 FTSE SmallCapFTSE SmallCap
ForFor Abstain Abstain AgainstAgainst
ISS - 2018 Remuneration Report
FTSE 100FTSE 100 FTSE 250FTSE 250 FTSE SmallCapFTSE SmallCap
BlueBlue Amber Amber RedRed
IVIS - 2018 Remuneration Policy
FTSE 100FTSE 100 FTSE 250FTSE 250 FTSE SmallCapFTSE SmallCap
ISS - 2018 Remuneration Policy
ForFor Abstain Abstain AgainstAgainst
Remuneration Policy Votes
1918
Regulatory developmentsDuring 2018 there were two key developments in the legislative and regulatory environment around executive pay, representing the culmination of a period of consultation and debate started by the UK Government in its 2016 green paper on governance reform.
First, the Government finalised new secondary legislation – The Companies (Miscellaneous Reporting) Regulations 2018 – to introduce a raft of new reporting rules on directors’ remuneration, including a requirement for companies to disclose the ratio of CEO pay to the pay of the UK employee base. Second, the Financial Reporting Council (FRC) published a new version of the UK Corporate Governance Code, which has important implications for boards and Remuneration Committees.
Both the new legislation and the new Code are effective from 1 January 2019 and apply to reporting years beginning on or after that date. In practice, this means that companies will be required to formally report against the new rules in the annual report published in 2020.
The Companies (Miscellaneous Reporting) Regulations 2018
The regulations principally cover remuneration matters but also include provisions relating to directors’ duties and corporate governance reporting requirements for private companies. The remuneration elements apply to UK-incorporated quoted companies listed on the Main Market of the London Stock Exchange (not AIM). The key requirements are set out below.
CEO pay ratios
� A quoted company with more than 250 UK employees will be required to publish the ratio of CEO pay to the pay of the UK employee base.
� The pay ratio must be published on a quartile basis, illustrating the ratio relative to employees at the lower quartile, median and upper quartile.
� CEO pay is defined as total CEO remuneration as disclosed in the single figure table. The pay of the employees at each quartile is based on their full-time equivalent pay and benefits, intended to include everything that is also captured for the CEO (i.e. salary, benefits, pension and short and long-term incentive payments). The figures for each quartile (not just the ratio) must be disclosed, in terms of total remuneration and also for salary alone.
� The regulations include three options for determining the quartile numbers for the employee base, and the company must explain the rationale for its choice.
� The company must calculate and publish the pay ratio information each year, until a full 10-year history of ratios is disclosed, thereafter to be maintained on a rolling basis.
� In addition to the ratio, a narrative must also be provided explaining the change in ratio from the previous year’s figure, and whether the change was due to movements in the pay of the CEO or UK employees or due to a change in the company’s employment model. The company will also be required to explain any trend in the median pay ratio over the period covered by the pay ratio table (i.e. eventually covering 10 years of data) and also explain whether (and, if so, why) the median ratio is consistent with the pay, reward and progression policies for the company’s UK employees taken as a whole.
The impact of share price appreciation on remuneration
� The directors’ remuneration report requirements have been extended so that for incentive awards disclosed in the single figure table, it must be stated what amount was attributable to share price appreciation. Where discretion was exercised in respect of any award, the company must also explain whether this was as a result of share price appreciation or depreciation.
� The “scenario charts” which must be provided (at least in a policy review year) are being expanded so that, for long term incentive schemes, an indication is included of the maximum remuneration receivable assuming share price appreciation of 50% during the performance period.
The exercise of discretion
� The statement from the chair of the Remuneration Committee must include a summary of any discretion which has been exercised in the award of directors’ remuneration.
Directors’ duties
The changes in this area apply to all large companies, including private companies:
� Section 172 of the Companies Act 2006 includes a requirement for directors to promote the success of the company for the benefit of shareholders, while having regard to employee and other interests. The new regulations will require the strategic report to describe how the directors have had regard to such matters.
� A company with more than 250 UK employees across the group as a whole must also include in the directors’ report a statement summarising how the directors have engaged with employees, and how the directors have had regards to employees’ interests in respect of the principal decisions taken by the company during the year.
� The directors’ report must also contain a statement summarising how the directors have had regard to the need to foster the company’s business relationships with suppliers, customers and others, and the effect of that regard on the key decisions taken during the year.
2120
New UK Corporate Governance Code
The revised Code is shorter than the previous (2016) version, and is focused on a number of high-level Principles, together with more detailed Provisions. The Principles are structured around the following sections:
1. Board leadership and company purpose
2. Division of responsibilities
3. Composition, succession and evaluation
4. Audit, risk and internal control
5. Remuneration
Companies must apply the Principles, but the Provisions continue to operate on the basis of “comply or explain.” The Code applies to all companies with a premium listing on the Main Market in London, regardless of country of incorporation.
The FRC has also published an updated version of its Guidance on Board Effectiveness, which is intended to provide good practice guidance on applying the new Code.
The key features of the new Code are summarised below.
Culture
� The new Code takes forward the FRC’s previous work on the importance of company culture in delivering long-term sustainable performance. Principle B includes the statement that “the board should establish the company’s purpose, values and strategy, and satisfy itself that these and its culture are aligned.” Directors are required to “promote the desired culture.”
Board engagement with the workforce
� The new Code emphasises that companies have responsibilities to a wide range of stakeholders. Significant focus is placed on engagement with the wider workforce. The UK Government had suggested in 2017 that the revised Code include three options for companies to engage with employees: (1) a designated NED, (2) a formal employee advisory panel, or (3) a director appointed from the workforce. The FRC has included all three options in the new Code, although recognises that different approaches could be adopted.
� If the board has not chosen one or more of the three stated options, “it should explain what alternative arrangements are in place and why it considers that they are effective.”
Engagement with shareholders
� Previous Code guidelines on how companies should respond to a significant proportion of votes against a resolution have been extended. “Significant” is now defined as a 20% vote against. In addition to setting out what actions the company intends to take in consulting with shareholders in such circumstances, the new Code also recommends that an update on the views received and actions taken should be provided no later than six months after the meeting, with a final summary included in the following year’s annual report or AGM documents.
� The FRC has advised that it expects companies to start reporting in this area in 2019.
Board and committee composition
� The Code continues to recognise the special role of the board chair, and that he/she should be “independent on appointment,” taking into account the usual tests of independence.
However, a separate Provision has been added (Provision 19) stating that “the chair should not remain in post beyond nine years from the date of their first appointment to the board. To facilitate effective succession planning and the development of a diverse board, this period can be extended for a limited time, particularly in those cases where the chair was an existing non-executive director on appointment. A clear explanation should be provided.”
� On a related point, the criteria for judging a director’s independence based on tenure has been amended to reference “nine years from the date of their first appointment” instead of “first election”.
� The exemption for smaller companies (i.e. those outside the FTSE 350) permitting them to have only two independent non-executives has been removed. All companies are now subject to the provision that “at least half the board, excluding the chair, should be non-executive directors whom the board considers to be independent.” However, the Code permits the Audit and Remuneration Committees of smaller companies to be comprised of two independent directors only, thus maintaining the status quo. One caveat is that the board chair cannot be a member of the Audit Committee, a change from current practice.
Overboarding
� No explicit rules have been added to the Code regarding the maximum number of directorships that an individual should hold. However, wording has been included to the effect that significant commitments should be disclosed with an indication of the time involved. Further, the reasons for permitting any significant appointments should be explained in the annual report.
2322
Diversity
� Principle J of the new Code states that board appointments and succession plans should “promote diversity of gender, social and ethnic backgrounds, cognitive and personal strengths.” The Nomination Committee will also need to oversee the development of a diverse pipeline for succession.
� The Nomination Committee report has been expanded and will need to include, among other things, the approach to succession planning, the policy on diversity and inclusion (and its objectives and linkage to company strategy), and also set out the gender balance of those in senior management (i.e. the executive committee or the first layer of management below the board, including the company secretary) and their direct reports.
Remuneration
� Schedule A of the 2016 Code has been replaced with a revised section covering executive pay.
� The FRC had suggested expanding the remit of the Remuneration Committee to include the oversight of “remuneration and workforce policies and practices”. This was modified in the final version of the new Code, such that the board – rather than the Remuneration Committee – is responsible for workforce policies and practices. Furthermore, it is now the board that has reporting responsibility for explaining the company’s approach to investing in and rewarding its workforce.
� For its part, the Remuneration Committee should review “workforce remuneration and related policies and the alignment of incentives and rewards with culture.” These should be taken into account when setting the remuneration policy for executive directors. The Committee is also responsible for setting (not just recommending and monitoring) the pay for senior management.
� The new Code states that, before being appointed as chair of the Remuneration Committee, the appointee should have served on a Remuneration Committee for at least 12 months. This relates to prior experience on any Remuneration Committee, not just the committee in question.
� The new Code includes a statement that shares granted for the purpose of aligning executive directors with long-term shareholder interests “should be released for sale on a phased basis and be subject to a total vesting and holding period of five years or more.” This does not cover deferred bonuses.
� The Code also states: “The Remuneration Committee should develop a formal policy for post-employment shareholding requirements encompassing both unvested and vested shares.” The Guidance on Board Effectiveness implies that these requirements should apply for a period of two to three years after an executive leaves the company.
� The importance of discretion is emphasised, with the new Code stating that remuneration schemes and policies should enable the use of discretion to override formulaic outcomes.
� The FRC has toughened its stance on pensions, with the new Code noting explicitly that “the pension contribution rates for executive directors, or payments in lieu, should be aligned with those available to the workforce.”
� Provision 40 includes a list of factors which should be addressed by the Remuneration Committee when determining executive pay. These are (a) clarity, (b) simplicity, (c) risk, (d) predictability, (e) proportionality and (f) alignment to culture. On risk, the Code states that “remuneration arrangements should ensure reputational and other risks from excessive rewards, and behavioural risks that
can arise from target-based incentive plans, are identified and mitigated.”
� Provision 41 sets out information that should be included in the annual report on the work of the Remuneration Committee. This includes “reasons why the remuneration is appropriate using internal and external measures, including pay ratios and pay gaps,” “whether the remuneration policy operated as intended in terms of company performance and quantum, and, if not, what changes are necessary” and “what engagement with the workforce has taken place to explain how executive remuneration aligns with wider company pay policy.”

2524
Appendix – Methodology/TerminologySurvey methodology
Pay data was collected from companies’ report and accounts with financial year ends up to 31 March 2018, thereby capturing the main body of the 2018 AGM season.
Pay data disclosed in currencies other than GBP have been converted using a yearly average exchange rate.
Where the incumbent has not been in the disclosed executive role for the full year (e.g. part-year leavers or joiners), the pay data was annualised to reflect full-year equivalent pay.
When valuing each element of the package, we have adopted the following approach:
� Base salary is defined as the annualised cash salary payment plus all contractually agreed payments (but excluding payments in lieu of benefits, e.g. car or pension allowances).
� Target bonus (as a % of base salary) - the percentage payable for on-target or ‘on-budget’ performance.
� Maximum bonus (as a % of base salary) – the percentage payable for maximum
performance/the maximum which the company will pay for performance above expectations.
� Expected value of long-term incentives (as a % of base salary) - Long-Term Incentive (LTI) levels are reported as an ‘Expected Value’ (EV) percentage of base salary to allow for consistent comparison across companies and plan types. EV represents a best estimate of the value that executives may receive annually at the time of grant.
� Face value of long-term incentives (as a % of base salary) – Long-term Incentive levels are reported as ‘Face Value’ (FV) percentage of base salary, the full value of the award at the date of grant.
Terminology
Directors:
� CEO – Chief Executive Officer/Highest Paid Director
� CFO – Chief Financial Officer/Finance Director

2726
2018 Directors’ Remuneration Survey
Page
FTSE 100 28
FTSE 250 34
FTSE SMALLCAP 40
Part 2
2928
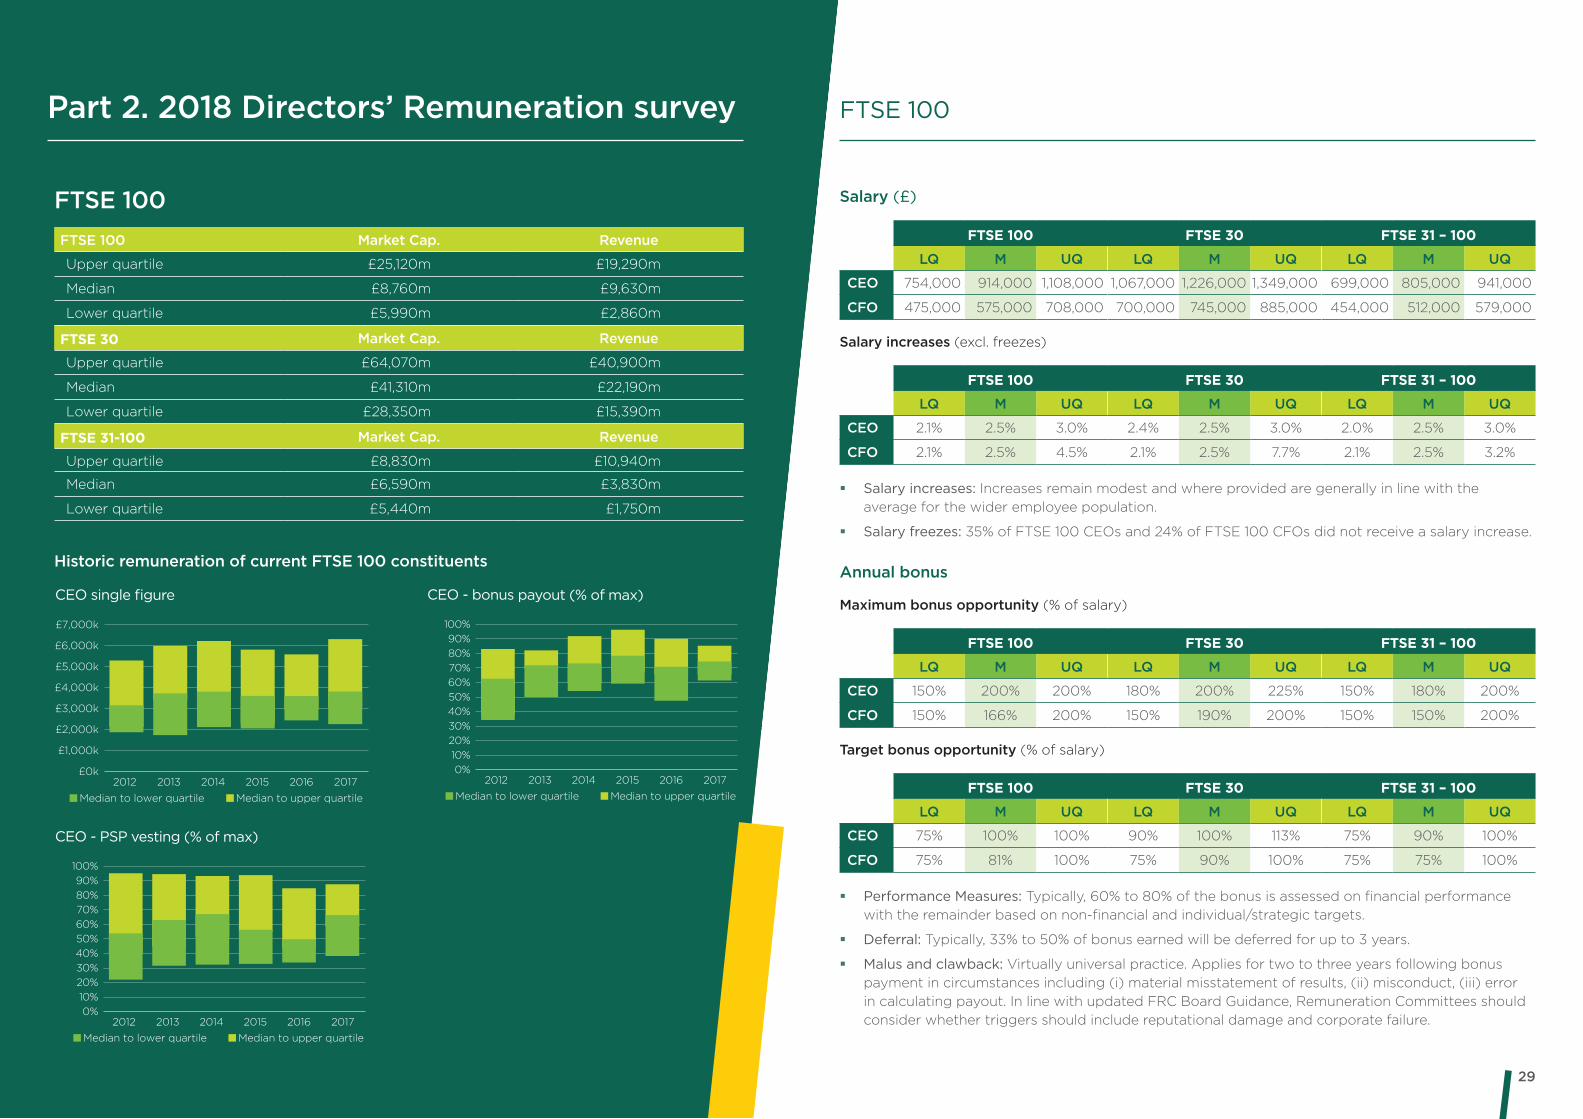
FTSE 100FTSE 100 Market Cap. Revenue
Upper quartile £25,120m £19,290m
Median £8,760m £9,630m
Lower quartile £5,990m £2,860m
FTSE 30 Market Cap. Revenue
Upper quartile £64,070m £40,900m
Median £41,310m £22,190m
Lower quartile £28,350m £15,390m
FTSE 31-100 Market Cap. Revenue
Upper quartile £8,830m £10,940m
Median £6,590m £3,830m
Lower quartile £5,440m £1,750m
Historic remuneration of current FTSE 100 constituents
Salary (£)
FTSE 100 FTSE 30 FTSE 31 – 100
LQ M UQ LQ M UQ LQ M UQ
CEO 754,000 914,000 1,108,000 1,067,000 1,226,000 1,349,000 699,000 805,000 941,000
CFO 475,000 575,000 708,000 700,000 745,000 885,000 454,000 512,000 579,000
Salary increases (excl. freezes)
FTSE 100 FTSE 30 FTSE 31 – 100
LQ M UQ LQ M UQ LQ M UQ
CEO 2.1% 2.5% 3.0% 2.4% 2.5% 3.0% 2.0% 2.5% 3.0%
CFO 2.1% 2.5% 4.5% 2.1% 2.5% 7.7% 2.1% 2.5% 3.2%
� Salary increases: Increases remain modest and where provided are generally in line with the average for the wider employee population.
� Salary freezes: 35% of FTSE 100 CEOs and 24% of FTSE 100 CFOs did not receive a salary increase.
Annual bonus
Maximum bonus opportunity (% of salary)
FTSE 100 FTSE 30 FTSE 31 – 100
LQ M UQ LQ M UQ LQ M UQ
CEO 150% 200% 200% 180% 200% 225% 150% 180% 200%
CFO 150% 166% 200% 150% 190% 200% 150% 150% 200%
Target bonus opportunity (% of salary)
FTSE 100 FTSE 30 FTSE 31 – 100
LQ M UQ LQ M UQ LQ M UQ
CEO 75% 100% 100% 90% 100% 113% 75% 90% 100%
CFO 75% 81% 100% 75% 90% 100% 75% 75% 100%
� Performance Measures: Typically, 60% to 80% of the bonus is assessed on financial performance with the remainder based on non-financial and individual/strategic targets.
� Deferral: Typically, 33% to 50% of bonus earned will be deferred for up to 3 years.
� Malus and clawback: Virtually universal practice. Applies for two to three years following bonus payment in circumstances including (i) material misstatement of results, (ii) misconduct, (iii) error in calculating payout. In line with updated FRC Board Guidance, Remuneration Committees should consider whether triggers should include reputational damage and corporate failure.
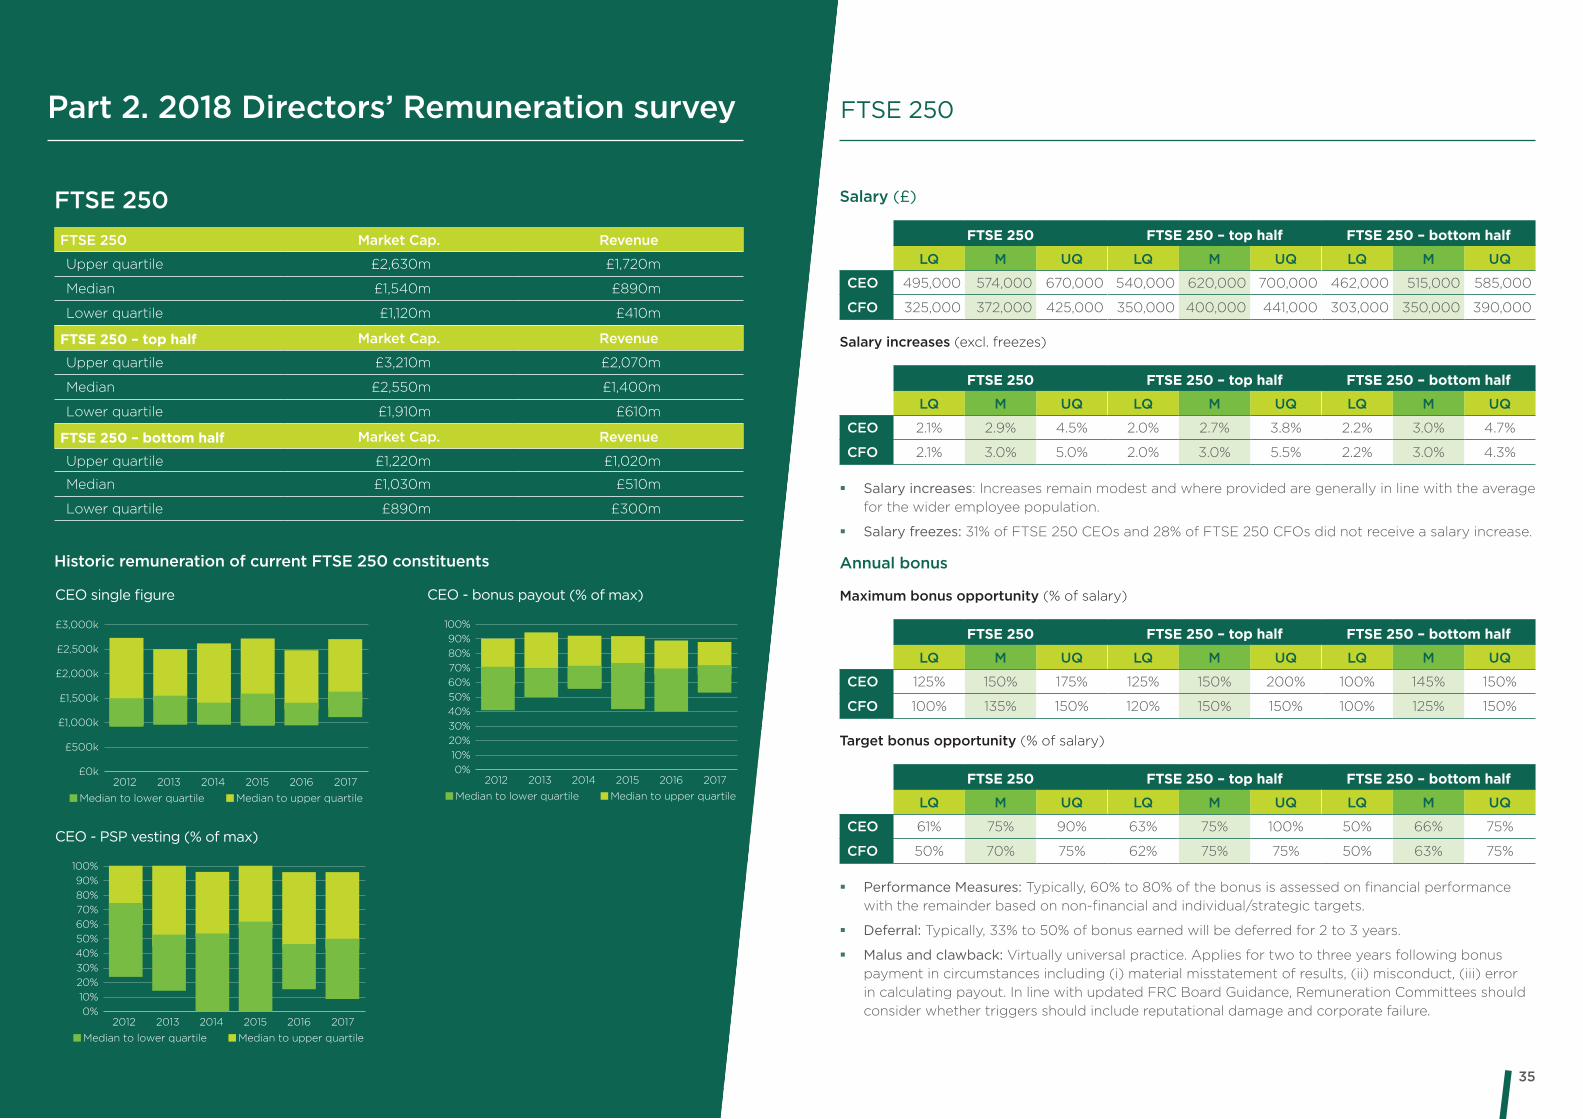
Part 2. 2018 Directors’ Remuneration survey
CEO single figure
Median to lower quartile Median to upper quartile
£7,000k
£6,000k
£5,000k
£4,000k
£3,000k
£2,000k
£1,000k
£0k2012 2013 2014 2015 2016 2017
CEO - bonus payout (% of max)
Median to lower quartile Median to upper quartile
100%
80%
60%
90%
70%
50%
40%
30%
20%
10%
0%2012 2013 2014 2015 2016 2017
CEO - PSP vesting (% of max)
Median to lower quartile Median to upper quartile
100%
80%
60%
90%
70%
50%
40%
30%
20%
10%
0%2012 2013 2014 2015 2016 2017
FTSE 100

3130
2017/18 bonus payout (% of maximum)
FTSE 100 FTSE 30 FTSE 31 – 100
LQ M UQ LQ M UQ LQ M UQ
CEO 61% 74% 85% 70% 77% 85% 60% 73% 85%
� Discretion: 2018 UK Corporate Governance Code states that companies should be able to use discretion to override formulaic outcomes.
Performance Share Plan
2018 PSP Award (% of salary)
FTSE 100 FTSE 30 FTSE 31 – 100
LQ M UQ LQ M UQ LQ M UQ
CEO 200% 250% 354% 315% 400% 500% 200% 228% 268%
CFO 185% 225% 300% 250% 335% 376% 175% 200% 249%
� Structure: Performance Share Plans remain the typical long-term incentive structure used by over 90% of companies.
� Performance Measures: TSR remains the most common measure and is used in over half of PSPs operated. EPS and Return measures are the most common financial measures. Alternative measures (including strategic measures) may be used where demonstrably in line with business strategy.
� Holding periods: c. 80% of plans include a post-vesting holding period. 2018 UK Corporate Governance Code states that shares should be subject to a total vesting and holding period of five years or more.
� Malus and clawback: As for the annual bonus, virtually universal practice. They apply for two to three years following vesting in circumstances including (i) material misstatement of results, (ii) misconduct, (iii) error in calculating payout. In line with updated FRC Board guidance, Remuneration Committees should consider whether triggers should include reputational damage and corporate failure.
2017/18 PSP payout (% of maximum)
FTSE 100 FTSE 30 FTSE 31 – 100
LQ M UQ LQ M UQ LQ M UQ
CEO 38% 67% 88% 50% 70% 82% 30% 62% 90%
� Methodology: PSP awards with final year performance period in 2017/18 financial year (i.e. where there was a 3 year performance period, the awards were made in 2015/16 financial year).
� Discretion: 2018 UK Corporate Governance Code states that companies should be able to use discretion to override formulaic outcomes.
Pension contribution (% of salary)
FTSE 100 FTSE 30 FTSE 31 – 100
LQ M UQ LQ M UQ LQ M UQ
CEO 19% 25% 30% 23% 30% 31% 17% 25% 25%
CFO 15% 25% 27% 24% 25% 30% 15% 21% 25%
� Structure: Around 90% of Directors receive a defined contribution pension arrangement, or salary supplement in lieu thereof. The remainder are either on legacy defined benefit plans or do not receive any amount in respect of pension.
� Policy: Shareholders are applying pressure for pension policy for new hires to be in line with the wider employee population. 2018 UK Corporate Governance Code states that these should be aligned.
Total target remuneration (£)
FTSE 100 FTSE 30 FTSE 31 – 100
LQ M UQ LQ M UQ LQ M UQ
CEO 2,649,000 3,182,000 5,192,000 4,437,000 5,784,000 6,885,000 2,311,000 2,854,000 3,342,000
CFO 1,450,000 1,869,000 2,845,000 2,629,000 3,201,000 3,963,000 1,331,000 1,625,000 1,966,000
� Methodology: Salary + benefits + pension + Target bonus opportunity + Expected Value of LTIs.
Single figure (£)
FTSE 100 FTSE 30 FTSE 31 – 100
LQ M UQ LQ M UQ LQ M UQ
CEO 2,244,000 3,846,000 6,330,000 3,873,000 6,422,000 8,808,000 2,069,000 3,399,000 4,461,000
� Methodology: Remuneration received in respect of the year, including 2017/18 bonus and PSPs with performance periods ending in the year.
Shareholding guidelines (% of salary)
FTSE 100 FTSE 30 FTSE 31 – 100
LQ M UQ LQ M UQ LQ M UQ
CEO 200% 300% 400% 300% 400% 500% 200% 250% 300%
CFO 200% 200% 300% 200% 300% 300% 200% 200% 200%
� Structure: 2018 UK Corporate Governance Code states that Remuneration Committees should develop a policy for post-employment shareholding requirements encompassing both unvested and vested shares.
FTSE 100 FTSE 100
3332 33
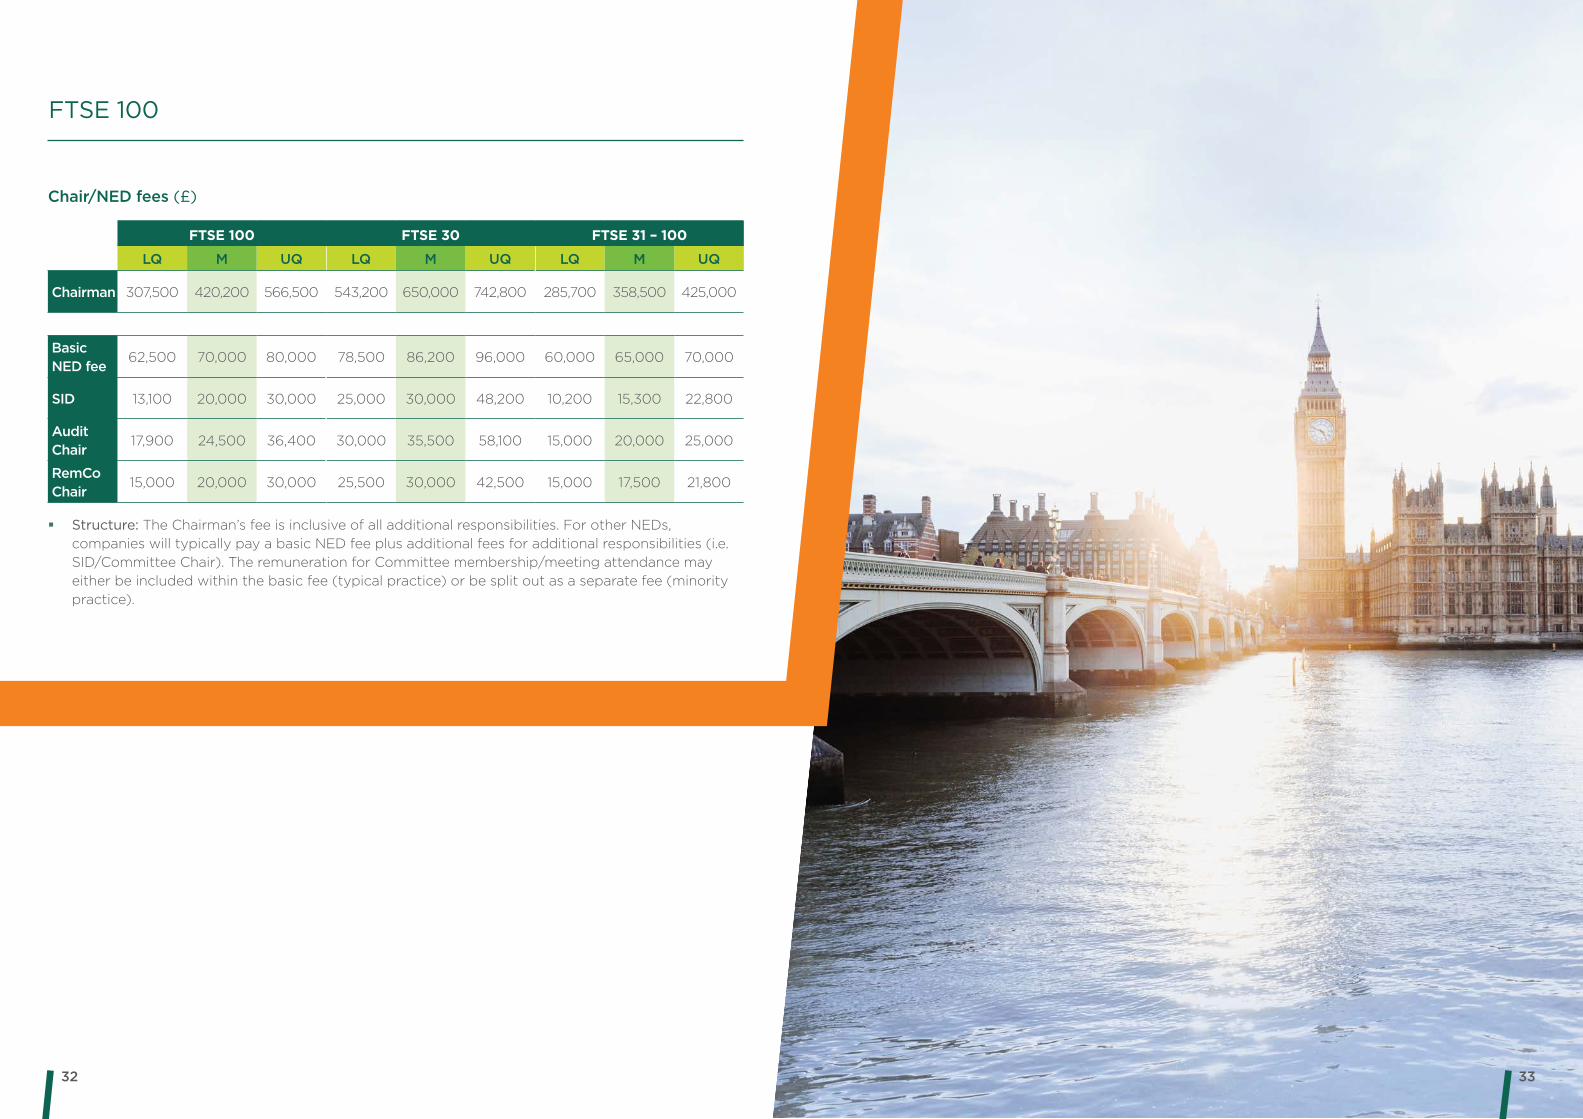
Chair/NED fees (£)
FTSE 100 FTSE 30 FTSE 31 – 100
LQ M UQ LQ M UQ LQ M UQ
Chairman 307,500 420,200 566,500 543,200 650,000 742,800 285,700 358,500 425,000
Basic NED fee
62,500 70,000 80,000 78,500 86,200 96,000 60,000 65,000 70,000
SID 13,100 20,000 30,000 25,000 30,000 48,200 10,200 15,300 22,800
Audit Chair
17,900 24,500 36,400 30,000 35,500 58,100 15,000 20,000 25,000
RemCo Chair
15,000 20,000 30,000 25,500 30,000 42,500 15,000 17,500 21,800
� Structure: The Chairman’s fee is inclusive of all additional responsibilities. For other NEDs, companies will typically pay a basic NED fee plus additional fees for additional responsibilities (i.e. SID/Committee Chair). The remuneration for Committee membership/meeting attendance may either be included within the basic fee (typical practice) or be split out as a separate fee (minority practice).
FTSE 100
3534
FTSE 250FTSE 250 Market Cap. Revenue
Upper quartile £2,630m £1,720m
Median £1,540m £890m
Lower quartile £1,120m £410m
FTSE 250 – top half Market Cap. Revenue
Upper quartile £3,210m £2,070m
Median £2,550m £1,400m
Lower quartile £1,910m £610m
FTSE 250 – bottom half Market Cap. Revenue
Upper quartile £1,220m £1,020m
Median £1,030m £510m
Lower quartile £890m £300m
Historic remuneration of current FTSE 250 constituents
Part 2. 2018 Directors’ Remuneration survey FTSE 250
CEO single figure
Median to lower quartile Median to upper quartile
£3,000k
£2,500k
£2,000k
£1,500k
£1,000k
£500k
£0k2012 2013 2014 2015 2016 2017
CEO - bonus payout (% of max)
Median to lower quartile Median to upper quartile
100%
80%
60%
90%
70%
50%
40%
30%
20%
10%
0%2012 2013 2014 2015 2016 2017
CEO - PSP vesting (% of max)
Median to lower quartile Median to upper quartile
100%
80%
60%
90%
70%
50%
40%
30%
20%
10%
0%2012 2013 2014 2015 2016 2017
Salary (£)
FTSE 250 FTSE 250 – top half FTSE 250 – bottom half
LQ M UQ LQ M UQ LQ M UQ
CEO 495,000 574,000 670,000 540,000 620,000 700,000 462,000 515,000 585,000
CFO 325,000 372,000 425,000 350,000 400,000 441,000 303,000 350,000 390,000
Salary increases (excl. freezes)
FTSE 250 FTSE 250 – top half FTSE 250 – bottom half
LQ M UQ LQ M UQ LQ M UQ
CEO 2.1% 2.9% 4.5% 2.0% 2.7% 3.8% 2.2% 3.0% 4.7%
CFO 2.1% 3.0% 5.0% 2.0% 3.0% 5.5% 2.2% 3.0% 4.3%
� Salary increases: Increases remain modest and where provided are generally in line with the average for the wider employee population.
� Salary freezes: 31% of FTSE 250 CEOs and 28% of FTSE 250 CFOs did not receive a salary increase.
Annual bonus
Maximum bonus opportunity (% of salary)
FTSE 250 FTSE 250 – top half FTSE 250 – bottom half
LQ M UQ LQ M UQ LQ M UQ
CEO 125% 150% 175% 125% 150% 200% 100% 145% 150%
CFO 100% 135% 150% 120% 150% 150% 100% 125% 150%
Target bonus opportunity (% of salary)
FTSE 250 FTSE 250 – top half FTSE 250 – bottom half
LQ M UQ LQ M UQ LQ M UQ
CEO 61% 75% 90% 63% 75% 100% 50% 66% 75%
CFO 50% 70% 75% 62% 75% 75% 50% 63% 75%
� Performance Measures: Typically, 60% to 80% of the bonus is assessed on financial performance with the remainder based on non-financial and individual/strategic targets.
� Deferral: Typically, 33% to 50% of bonus earned will be deferred for 2 to 3 years.
� Malus and clawback: Virtually universal practice. Applies for two to three years following bonus payment in circumstances including (i) material misstatement of results, (ii) misconduct, (iii) error in calculating payout. In line with updated FRC Board Guidance, Remuneration Committees should consider whether triggers should include reputational damage and corporate failure.
3736
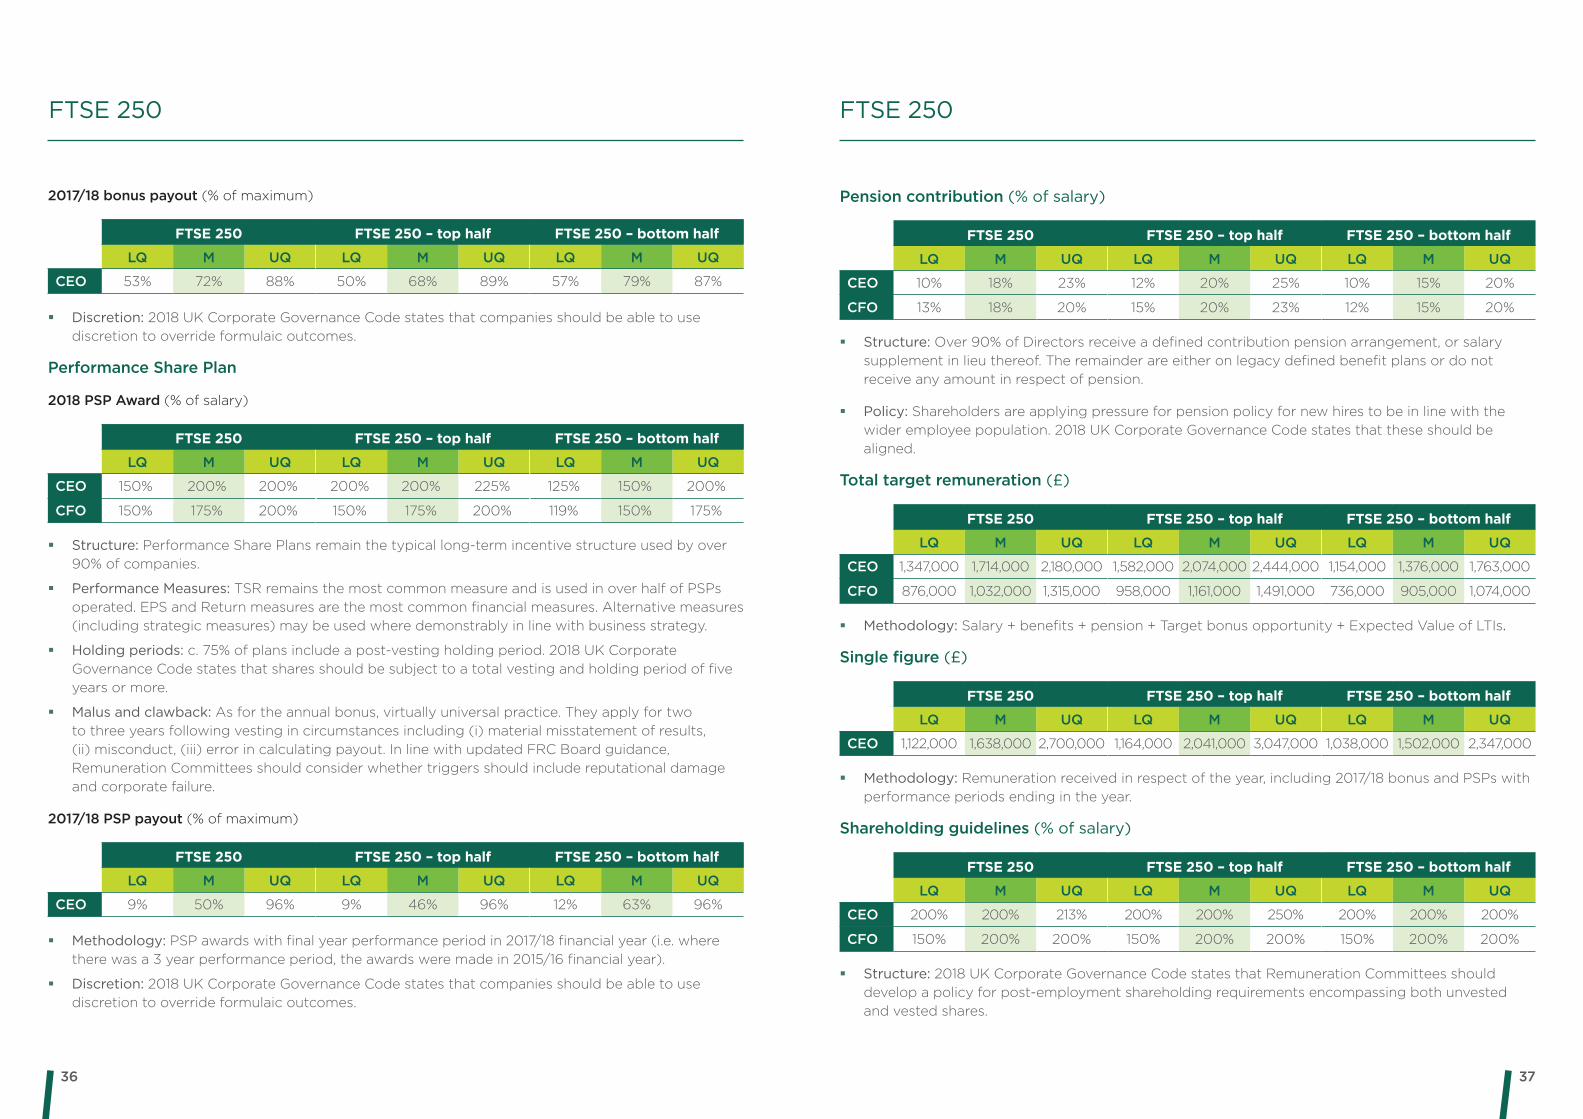
2017/18 bonus payout (% of maximum)
FTSE 250 FTSE 250 – top half FTSE 250 – bottom half
LQ M UQ LQ M UQ LQ M UQ
CEO 53% 72% 88% 50% 68% 89% 57% 79% 87%
� Discretion: 2018 UK Corporate Governance Code states that companies should be able to use discretion to override formulaic outcomes.
Performance Share Plan
2018 PSP Award (% of salary)
FTSE 250 FTSE 250 – top half FTSE 250 – bottom half
LQ M UQ LQ M UQ LQ M UQ
CEO 150% 200% 200% 200% 200% 225% 125% 150% 200%
CFO 150% 175% 200% 150% 175% 200% 119% 150% 175%
� Structure: Performance Share Plans remain the typical long-term incentive structure used by over 90% of companies.
� Performance Measures: TSR remains the most common measure and is used in over half of PSPs operated. EPS and Return measures are the most common financial measures. Alternative measures (including strategic measures) may be used where demonstrably in line with business strategy.
� Holding periods: c. 75% of plans include a post-vesting holding period. 2018 UK Corporate Governance Code states that shares should be subject to a total vesting and holding period of five years or more.
� Malus and clawback: As for the annual bonus, virtually universal practice. They apply for two to three years following vesting in circumstances including (i) material misstatement of results, (ii) misconduct, (iii) error in calculating payout. In line with updated FRC Board guidance, Remuneration Committees should consider whether triggers should include reputational damage and corporate failure.
2017/18 PSP payout (% of maximum)
FTSE 250 FTSE 250 – top half FTSE 250 – bottom half
LQ M UQ LQ M UQ LQ M UQ
CEO 9% 50% 96% 9% 46% 96% 12% 63% 96%
� Methodology: PSP awards with final year performance period in 2017/18 financial year (i.e. where there was a 3 year performance period, the awards were made in 2015/16 financial year).
� Discretion: 2018 UK Corporate Governance Code states that companies should be able to use discretion to override formulaic outcomes.
Pension contribution (% of salary)
FTSE 250 FTSE 250 – top half FTSE 250 – bottom half
LQ M UQ LQ M UQ LQ M UQ
CEO 10% 18% 23% 12% 20% 25% 10% 15% 20%
CFO 13% 18% 20% 15% 20% 23% 12% 15% 20%
� Structure: Over 90% of Directors receive a defined contribution pension arrangement, or salary supplement in lieu thereof. The remainder are either on legacy defined benefit plans or do not receive any amount in respect of pension.
� Policy: Shareholders are applying pressure for pension policy for new hires to be in line with the wider employee population. 2018 UK Corporate Governance Code states that these should be aligned.
Total target remuneration (£)
FTSE 250 FTSE 250 – top half FTSE 250 – bottom half
LQ M UQ LQ M UQ LQ M UQ
CEO 1,347,000 1,714,000 2,180,000 1,582,000 2,074,000 2,444,000 1,154,000 1,376,000 1,763,000
CFO 876,000 1,032,000 1,315,000 958,000 1,161,000 1,491,000 736,000 905,000 1,074,000
� Methodology: Salary + benefits + pension + Target bonus opportunity + Expected Value of LTIs.
Single figure (£)
FTSE 250 FTSE 250 – top half FTSE 250 – bottom half
LQ M UQ LQ M UQ LQ M UQ
CEO 1,122,000 1,638,000 2,700,000 1,164,000 2,041,000 3,047,000 1,038,000 1,502,000 2,347,000
� Methodology: Remuneration received in respect of the year, including 2017/18 bonus and PSPs with performance periods ending in the year.
Shareholding guidelines (% of salary)
FTSE 250 FTSE 250 – top half FTSE 250 – bottom half
LQ M UQ LQ M UQ LQ M UQ
CEO 200% 200% 213% 200% 200% 250% 200% 200% 200%
CFO 150% 200% 200% 150% 200% 200% 150% 200% 200%
� Structure: 2018 UK Corporate Governance Code states that Remuneration Committees should develop a policy for post-employment shareholding requirements encompassing both unvested and vested shares.
FTSE 250 FTSE 250
3938
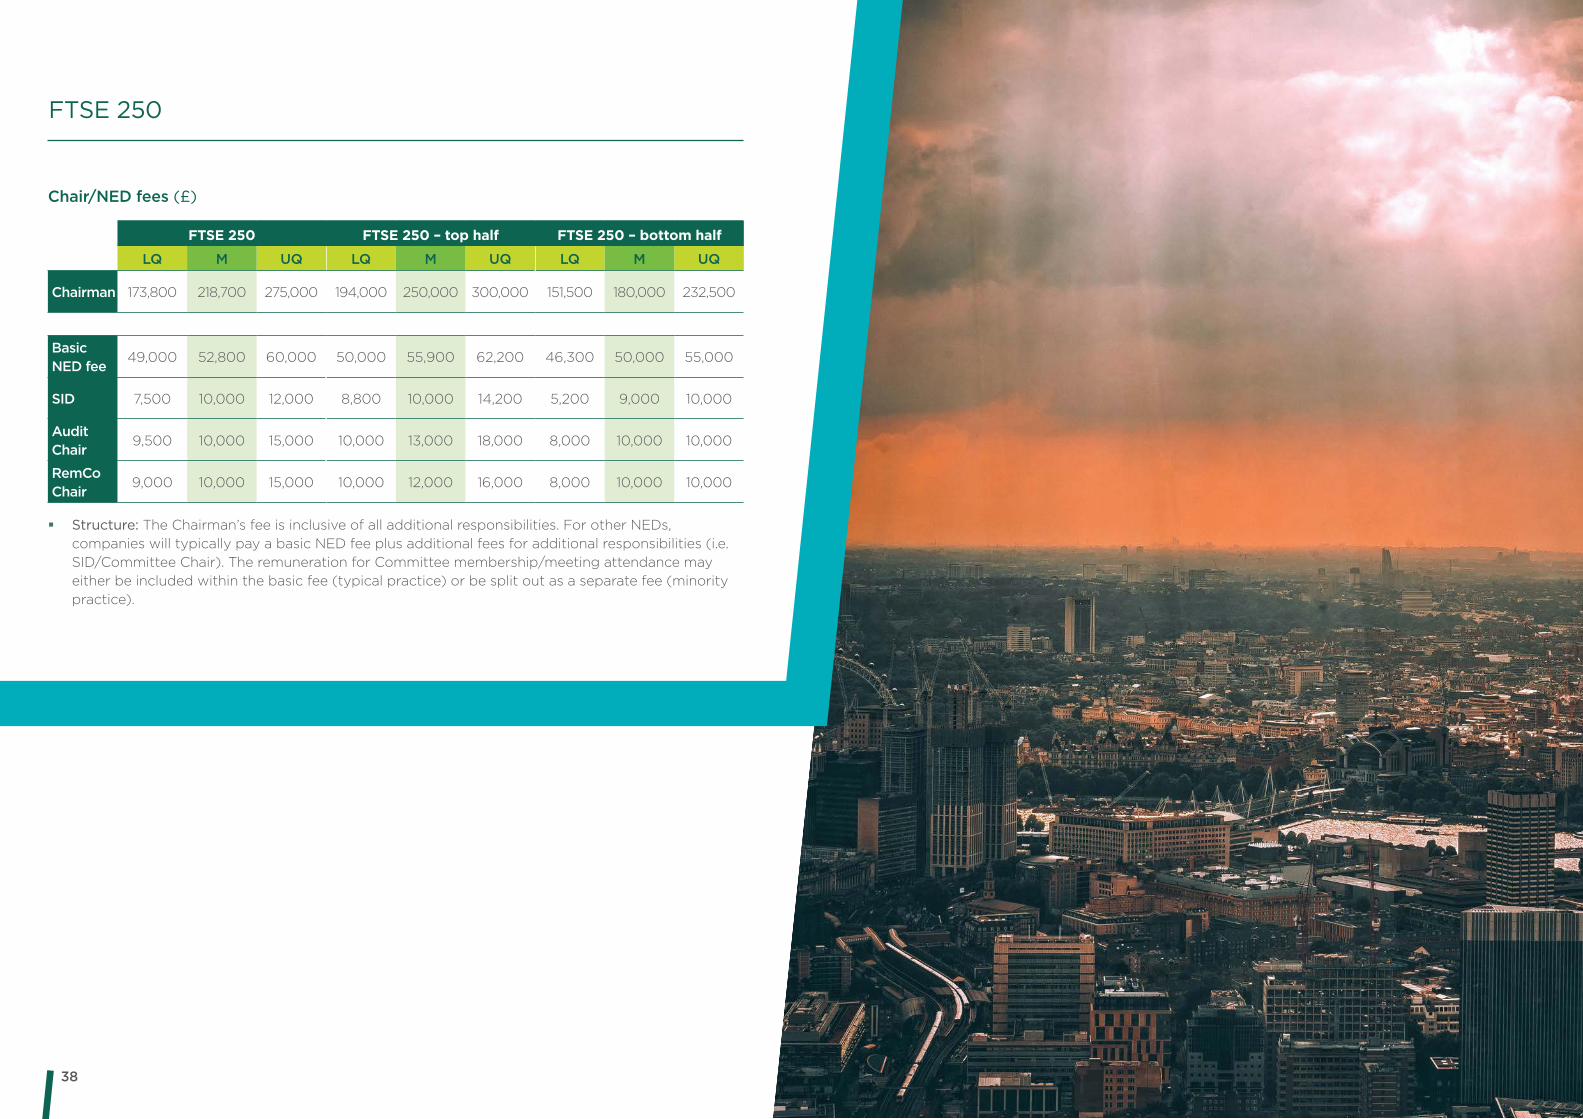
Chair/NED fees (£)
FTSE 250 FTSE 250 – top half FTSE 250 – bottom half
LQ M UQ LQ M UQ LQ M UQ
Chairman 173,800 218,700 275,000 194,000 250,000 300,000 151,500 180,000 232,500
Basic NED fee
49,000 52,800 60,000 50,000 55,900 62,200 46,300 50,000 55,000
SID 7,500 10,000 12,000 8,800 10,000 14,200 5,200 9,000 10,000
Audit Chair
9,500 10,000 15,000 10,000 13,000 18,000 8,000 10,000 10,000
RemCo Chair
9,000 10,000 15,000 10,000 12,000 16,000 8,000 10,000 10,000
� Structure: The Chairman’s fee is inclusive of all additional responsibilities. For other NEDs, companies will typically pay a basic NED fee plus additional fees for additional responsibilities (i.e. SID/Committee Chair). The remuneration for Committee membership/meeting attendance may either be included within the basic fee (typical practice) or be split out as a separate fee (minority practice).
FTSE 250
4140
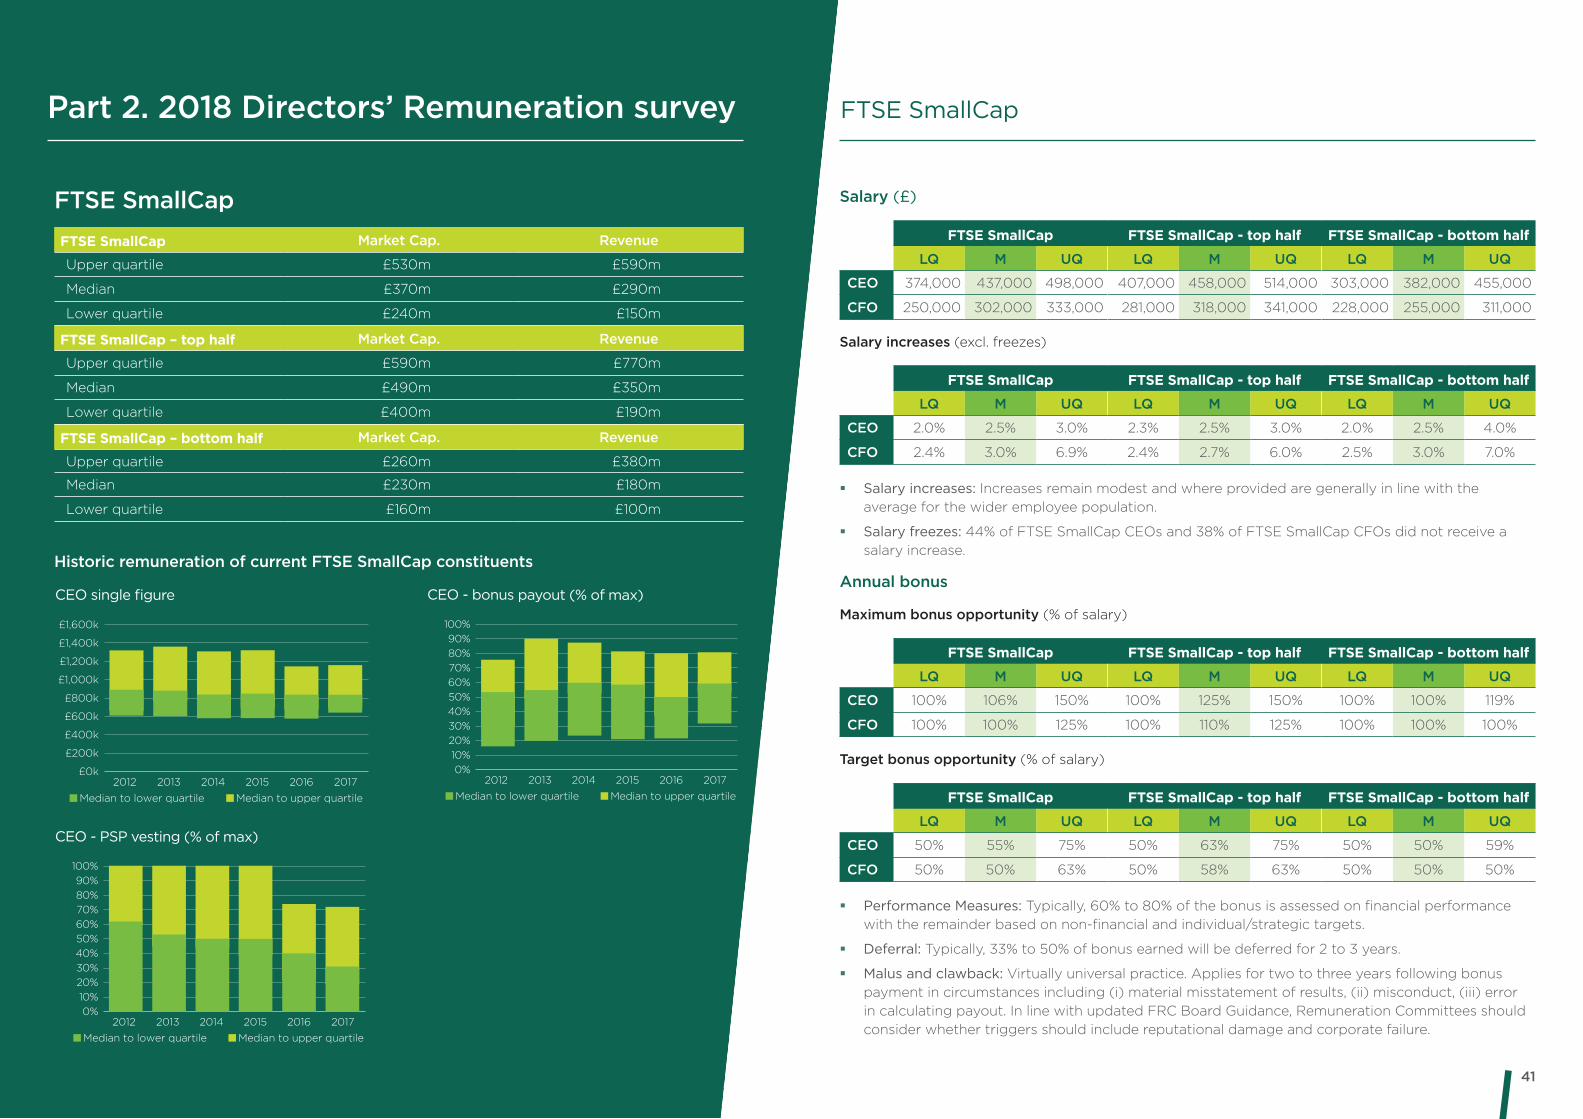
FTSE SmallCapFTSE SmallCap Market Cap. Revenue
Upper quartile £530m £590m
Median £370m £290m
Lower quartile £240m £150m
FTSE SmallCap – top half Market Cap. Revenue
Upper quartile £590m £770m
Median £490m £350m
Lower quartile £400m £190m
FTSE SmallCap – bottom half Market Cap. Revenue
Upper quartile £260m £380m
Median £230m £180m
Lower quartile £160m £100m
Historic remuneration of current FTSE SmallCap constituents
Part 2. 2018 Directors’ Remuneration survey
CEO single figure
Median to lower quartile Median to upper quartile
£1,600k
£1,200k
£1,400k
£1,000k
£800k
£600k
£400k
£200k
£0k2012 2013 2014 2015 2016 2017
CEO - bonus payout (% of max)
Median to lower quartile Median to upper quartile
100%
80%
60%
90%
70%
50%
40%
30%
20%
10%
0%2012 2013 2014 2015 2016 2017
CEO - PSP vesting (% of max)
Median to lower quartile Median to upper quartile
100%
80%
60%
90%
70%
50%
40%
30%
20%
10%
0%2012 2013 2014 2015 2016 2017
FTSE SmallCap
Salary (£)
FTSE SmallCap FTSE SmallCap - top half FTSE SmallCap - bottom half
LQ M UQ LQ M UQ LQ M UQ
CEO 374,000 437,000 498,000 407,000 458,000 514,000 303,000 382,000 455,000
CFO 250,000 302,000 333,000 281,000 318,000 341,000 228,000 255,000 311,000
Salary increases (excl. freezes)
FTSE SmallCap FTSE SmallCap - top half FTSE SmallCap - bottom half
LQ M UQ LQ M UQ LQ M UQ
CEO 2.0% 2.5% 3.0% 2.3% 2.5% 3.0% 2.0% 2.5% 4.0%
CFO 2.4% 3.0% 6.9% 2.4% 2.7% 6.0% 2.5% 3.0% 7.0%
� Salary increases: Increases remain modest and where provided are generally in line with the average for the wider employee population.
� Salary freezes: 44% of FTSE SmallCap CEOs and 38% of FTSE SmallCap CFOs did not receive a salary increase.
Annual bonus
Maximum bonus opportunity (% of salary)
FTSE SmallCap FTSE SmallCap - top half FTSE SmallCap - bottom half
LQ M UQ LQ M UQ LQ M UQ
CEO 100% 106% 150% 100% 125% 150% 100% 100% 119%
CFO 100% 100% 125% 100% 110% 125% 100% 100% 100%
Target bonus opportunity (% of salary)
FTSE SmallCap FTSE SmallCap - top half FTSE SmallCap - bottom half
LQ M UQ LQ M UQ LQ M UQ
CEO 50% 55% 75% 50% 63% 75% 50% 50% 59%
CFO 50% 50% 63% 50% 58% 63% 50% 50% 50%
� Performance Measures: Typically, 60% to 80% of the bonus is assessed on financial performance with the remainder based on non-financial and individual/strategic targets.
� Deferral: Typically, 33% to 50% of bonus earned will be deferred for 2 to 3 years.
� Malus and clawback: Virtually universal practice. Applies for two to three years following bonus payment in circumstances including (i) material misstatement of results, (ii) misconduct, (iii) error in calculating payout. In line with updated FRC Board Guidance, Remuneration Committees should consider whether triggers should include reputational damage and corporate failure.
4342
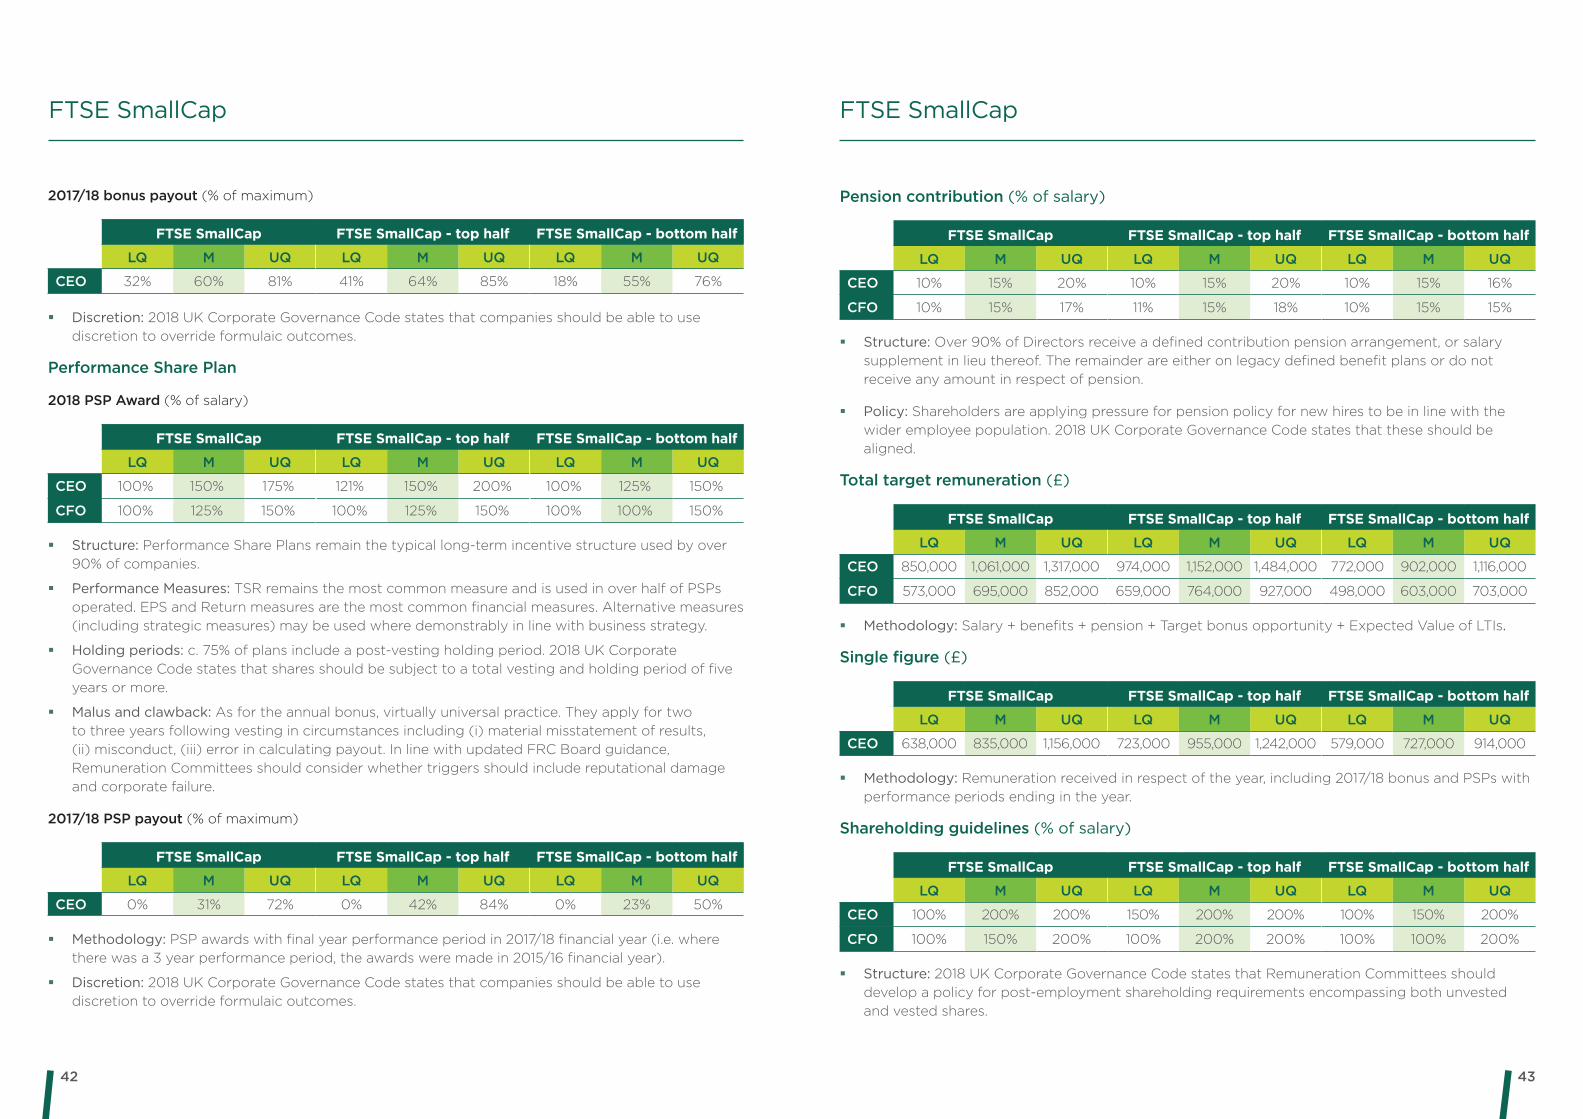
2017/18 bonus payout (% of maximum)
FTSE SmallCap FTSE SmallCap - top half FTSE SmallCap - bottom half
LQ M UQ LQ M UQ LQ M UQ
CEO 32% 60% 81% 41% 64% 85% 18% 55% 76%
� Discretion: 2018 UK Corporate Governance Code states that companies should be able to use discretion to override formulaic outcomes.
Performance Share Plan
2018 PSP Award (% of salary)
FTSE SmallCap FTSE SmallCap - top half FTSE SmallCap - bottom half
LQ M UQ LQ M UQ LQ M UQ
CEO 100% 150% 175% 121% 150% 200% 100% 125% 150%
CFO 100% 125% 150% 100% 125% 150% 100% 100% 150%
� Structure: Performance Share Plans remain the typical long-term incentive structure used by over 90% of companies.
� Performance Measures: TSR remains the most common measure and is used in over half of PSPs operated. EPS and Return measures are the most common financial measures. Alternative measures (including strategic measures) may be used where demonstrably in line with business strategy.
� Holding periods: c. 75% of plans include a post-vesting holding period. 2018 UK Corporate Governance Code states that shares should be subject to a total vesting and holding period of five years or more.
� Malus and clawback: As for the annual bonus, virtually universal practice. They apply for two to three years following vesting in circumstances including (i) material misstatement of results, (ii) misconduct, (iii) error in calculating payout. In line with updated FRC Board guidance, Remuneration Committees should consider whether triggers should include reputational damage and corporate failure.
2017/18 PSP payout (% of maximum)
FTSE SmallCap FTSE SmallCap - top half FTSE SmallCap - bottom half
LQ M UQ LQ M UQ LQ M UQ
CEO 0% 31% 72% 0% 42% 84% 0% 23% 50%
� Methodology: PSP awards with final year performance period in 2017/18 financial year (i.e. where there was a 3 year performance period, the awards were made in 2015/16 financial year).
� Discretion: 2018 UK Corporate Governance Code states that companies should be able to use discretion to override formulaic outcomes.
FTSE SmallCap
Pension contribution (% of salary)
FTSE SmallCap FTSE SmallCap - top half FTSE SmallCap - bottom half
LQ M UQ LQ M UQ LQ M UQ
CEO 10% 15% 20% 10% 15% 20% 10% 15% 16%
CFO 10% 15% 17% 11% 15% 18% 10% 15% 15%
� Structure: Over 90% of Directors receive a defined contribution pension arrangement, or salary supplement in lieu thereof. The remainder are either on legacy defined benefit plans or do not receive any amount in respect of pension.
� Policy: Shareholders are applying pressure for pension policy for new hires to be in line with the wider employee population. 2018 UK Corporate Governance Code states that these should be aligned.
Total target remuneration (£)
FTSE SmallCap FTSE SmallCap - top half FTSE SmallCap - bottom half
LQ M UQ LQ M UQ LQ M UQ
CEO 850,000 1,061,000 1,317,000 974,000 1,152,000 1,484,000 772,000 902,000 1,116,000
CFO 573,000 695,000 852,000 659,000 764,000 927,000 498,000 603,000 703,000
� Methodology: Salary + benefits + pension + Target bonus opportunity + Expected Value of LTIs.
Single figure (£)
FTSE SmallCap FTSE SmallCap - top half FTSE SmallCap - bottom half
LQ M UQ LQ M UQ LQ M UQ
CEO 638,000 835,000 1,156,000 723,000 955,000 1,242,000 579,000 727,000 914,000
� Methodology: Remuneration received in respect of the year, including 2017/18 bonus and PSPs with performance periods ending in the year.
Shareholding guidelines (% of salary)
FTSE SmallCap FTSE SmallCap - top half FTSE SmallCap - bottom half
LQ M UQ LQ M UQ LQ M UQ
CEO 100% 200% 200% 150% 200% 200% 100% 150% 200%
CFO 100% 150% 200% 100% 200% 200% 100% 100% 200%
� Structure: 2018 UK Corporate Governance Code states that Remuneration Committees should develop a policy for post-employment shareholding requirements encompassing both unvested and vested shares.
FTSE SmallCap
4544
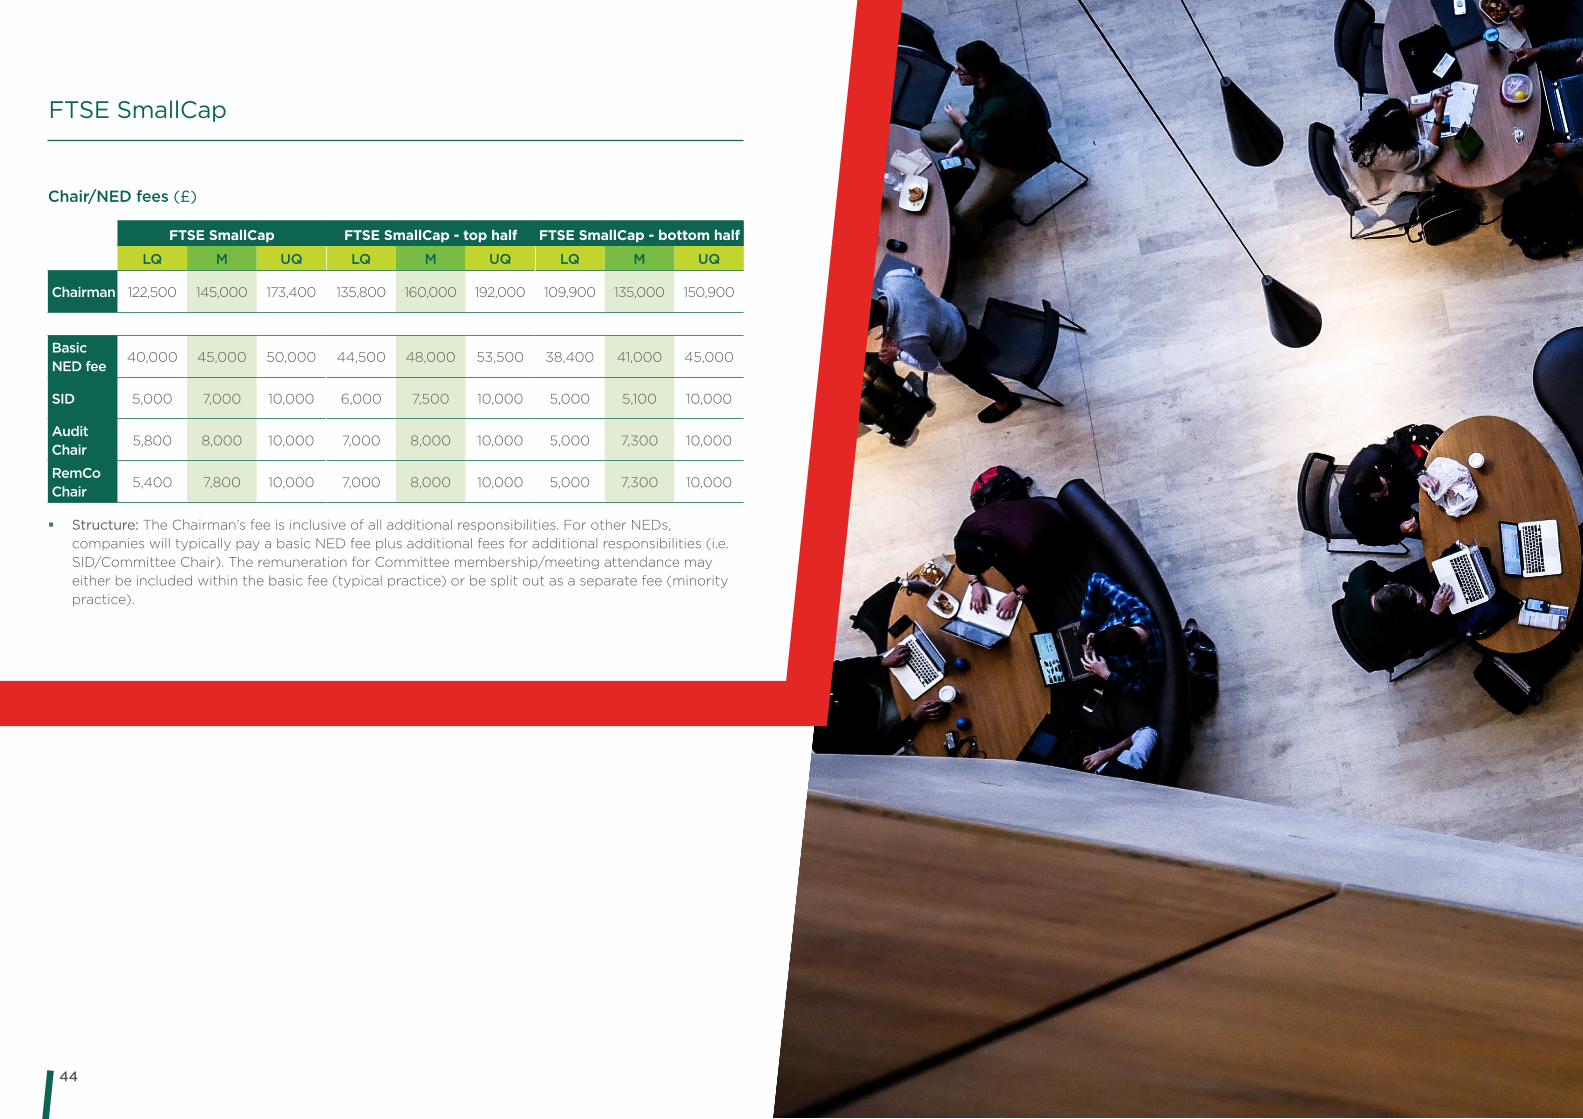
Chair/NED fees (£)
FTSE SmallCap FTSE SmallCap - top half FTSE SmallCap - bottom half
LQ M UQ LQ M UQ LQ M UQ
Chairman 122,500 145,000 173,400 135,800 160,000 192,000 109,900 135,000 150,900
Basic NED fee
40,000 45,000 50,000 44,500 48,000 53,500 38,400 41,000 45,000
SID 5,000 7,000 10,000 6,000 7,500 10,000 5,000 5,100 10,000
Audit Chair
5,800 8,000 10,000 7,000 8,000 10,000 5,000 7,300 10,000
RemCo Chair
5,400 7,800 10,000 7,000 8,000 10,000 5,000 7,300 10,000
� Structure: The Chairman’s fee is inclusive of all additional responsibilities. For other NEDs, companies will typically pay a basic NED fee plus additional fees for additional responsibilities (i.e. SID/Committee Chair). The remuneration for Committee membership/meeting attendance may either be included within the basic fee (typical practice) or be split out as a separate fee (minority practice).
FTSE SmallCap

4746
� Relationships are Partner-led: Partners actively lead our relationship with clients and are accessible. We have lower leverage than other firms because our clients tell us that they want to speak to our partners without delay.
� Because there is no substitute for experience: We have a team of senior partners who have a deep expertise in working with complex, innovative and challenging situations.
� We fit reward to your strategic context: We don’t believe in a one-size-fits-all approach to executive pay. Our recommendations take account of the entire business environment, as well as market comparisons. We look for innovative solutions. We can take a fresh perspective.
� We balance the needs of executives and stakeholders: As experts in executive behaviour, we understand how to create clear pay policies that attract and motivate executives.
� Our knowledge of investors is second to none: Experienced partners and consultants who have worked with the leading voting agencies have an inside track on what is acceptable and how best to work with investors when advising on PLC pay.
� We understand the importance of communication: Poor communication, rather than the substance of a proposal, has often led to a lack of shareholder support. We have experienced consultants who help ensure that an informed shareholder consultation process takes place with effective communication to all interested parties.
� We have a hard technical edge: our advice is based on a very firm understanding of the legal and regulatory environment.
� We have world-renowned methodologies and data: Our reward data is world renowned and our unique approach, proven methodologies and common-sense analytics have been developed over more than 70 years.
Please feel free to contact us at [email protected]
About the Executive Pay & Governance Practice at Korn Ferry
With the spotlight continuing to shine brightly on UK Directors’ pay, companies need expert advice more than ever. When making decisions on setting executive pay, organisations need access to experienced advisors who can provide the information, analysis and, above all, the right judgement. Choosing the Executive Pay & Governance Practice at Korn Ferry to support you has many advantages:

© 2018 Korn Ferry. All Rights Reserved.
About Korn FerryKorn Ferry is a global organisational consulting firm. We help companies design their organisation – the structure, the roles and responsibilities, as well as how they compensate, develop and motivate their people. As importantly, we help organisations select and hire the talent they need to execute their strategy. Our approximately 7,000 colleagues serve clients in more than 50 countries.