Embed Size (px)
Citation preview
Fubon Financial 2015 Q1 Interim Results
and
2015.05.13
and
2014 Embedded Value of Fubon Life
Disclaimer
This meeting may contain forward-looking statements with respect to the financial
condition, results of operations and business of the company. These forward-looking
statements represent the company’s expectations or beliefs concerning future events
and involve known and unknown risks and uncertainty that could cause actual
results, performance or events to differ materially from those expressed. Certain
statements, such as those that include the words “potential”, “estimated”, and similar
2
expressions or variations on such expressions may be considered “forward-looking
statements”. Financial numbers in this report may include preliminary unaudited
numbers or management accounts.
� Performance review by subsidiary
• Fubon Life
� Performance highlights of Fubon Financial Holdings
Agenda
• Taipei Fubon Bank
3
• Fubon Life
• Fubon Securities
• Fubon Insurance
•Fubon Bank (China)
� 2014 Embedded Value of Fubon Life
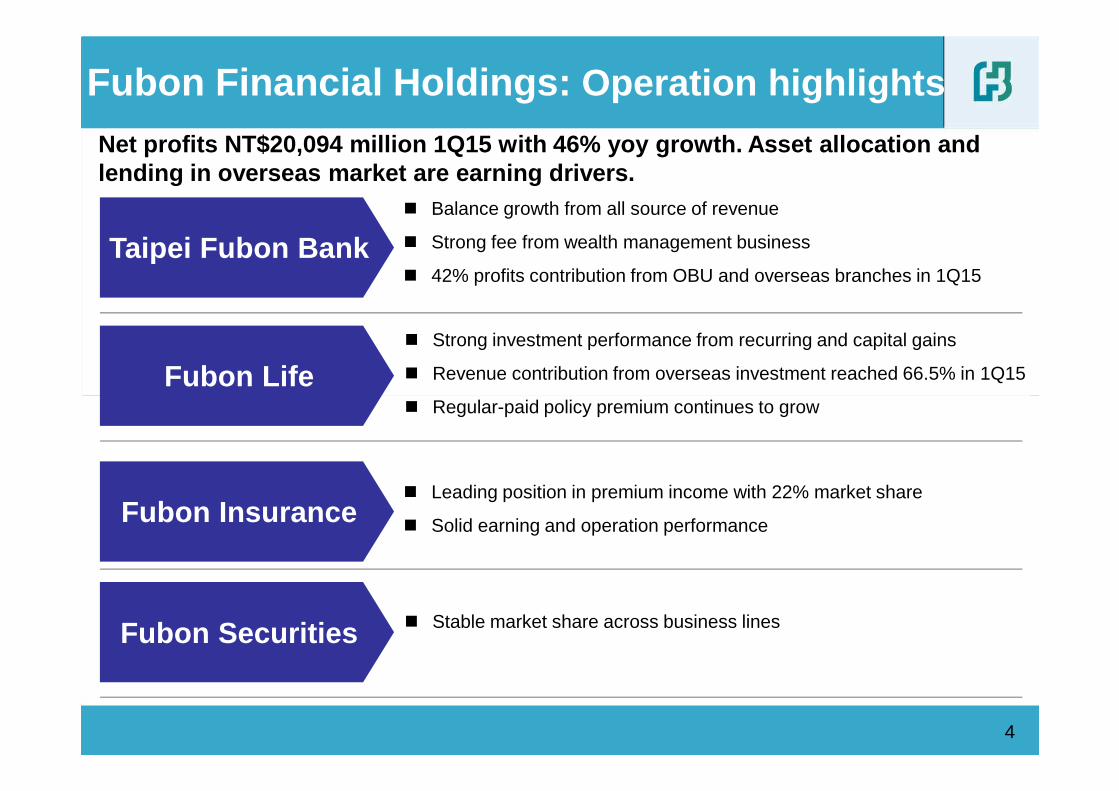
Fubon Financial Holdings: Operation highlights
Taipei Fubon Bank
Fubon Life
Net profits NT$20,094 million 1Q15 with 46% yoy gro wth. Asset allocation and lending in overseas market are earning drivers.
� Strong investment performance from recurring and capital gains
� Revenue contribution from overseas investment reached 66.5% in 1Q15
� Balance growth from all source of revenue
� Strong fee from wealth management business
� 42% profits contribution from OBU and overseas branches in 1Q15
4
� Stable market share across business lines
Fubon Insurance
Fubon Securities
� Regular-paid policy premium continues to grow
� Leading position in premium income with 22% market share
� Solid earning and operation performance
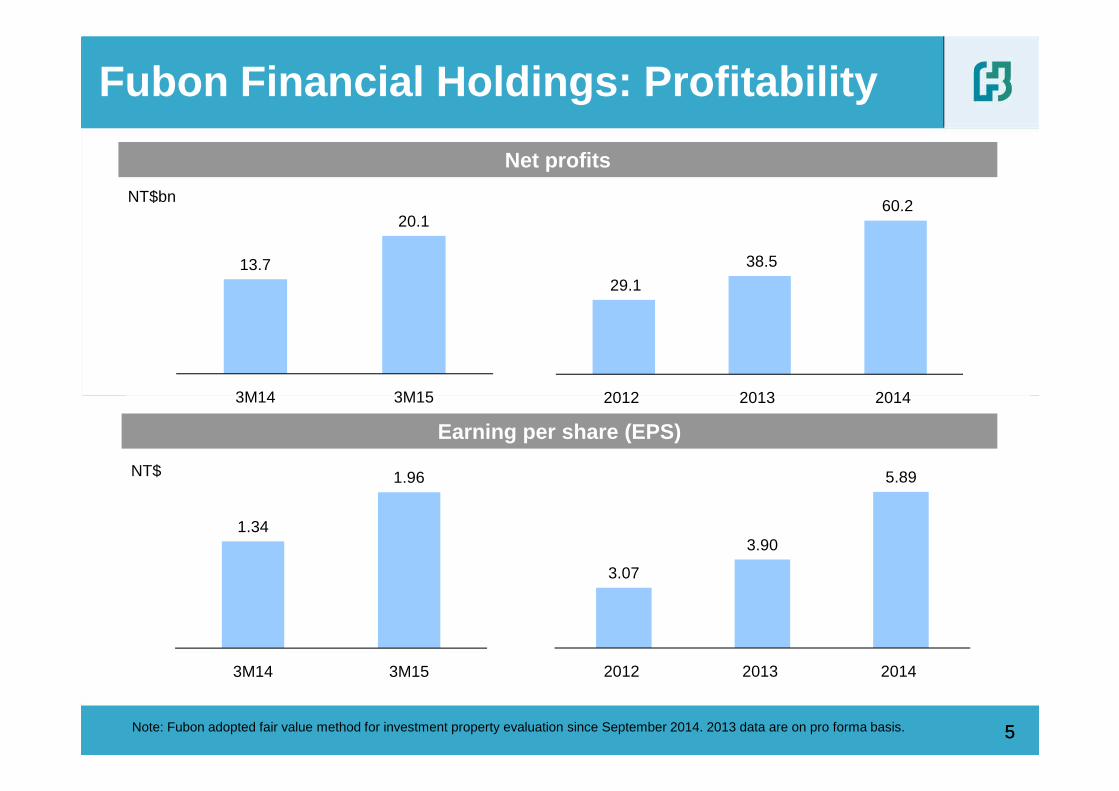
13.7
20.1
3M14 3M15
Net profits
NT$bn
29.1
38.5
60.2
2012 2013 2014
Fubon Financial Holdings: Profitability
3M14 3M15
3.07
3.90
5.89
2012 2013 2014
1.34
1.96
3M14 3M15
5
Earning per share (EPS)
NT$
Note: Fubon adopted fair value method for investment property evaluation since September 2014. 2013 data are on pro forma basis. 5
2012 2013 2014
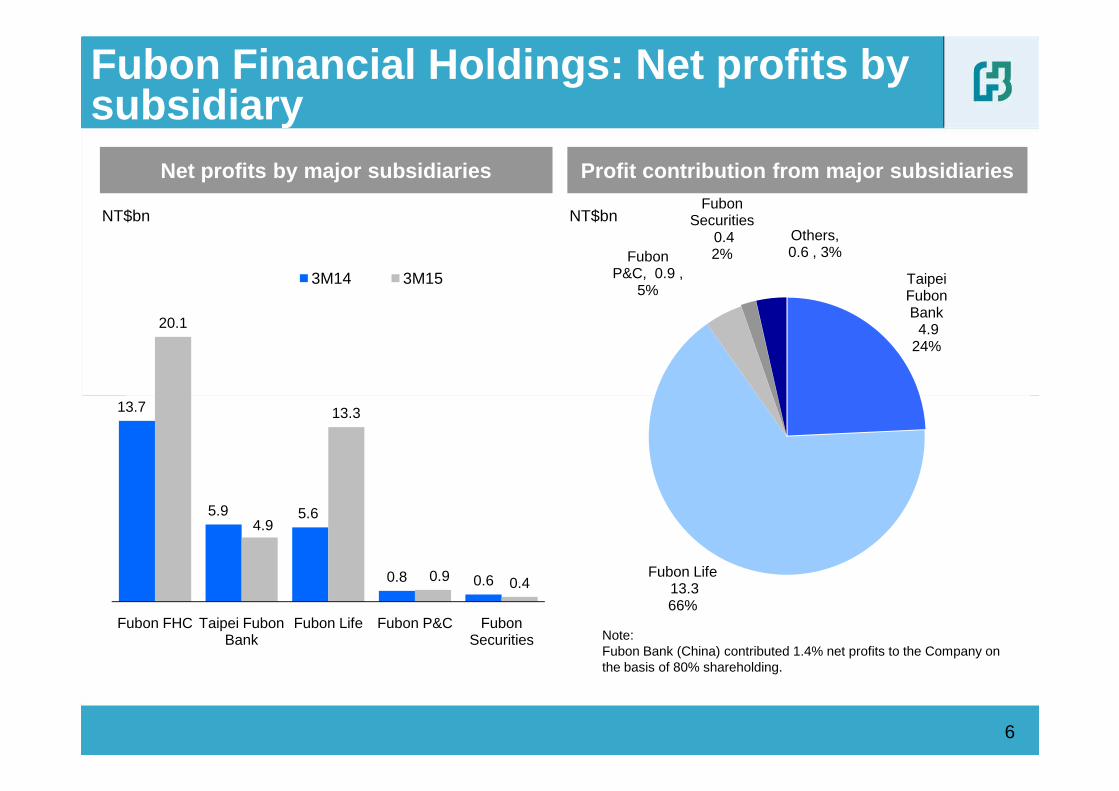
Fubon Financial Holdings: Net profits by subsidiary
Net profits by major subsidiaries Profit contribution from major subsidiaries
NT$bn NT$bn
20.1
3M14 3M15 Taipei Fubon Bank
4.9 24%
Fubon P&C, 0.9 ,
5%
Fubon Securities
0.4 2%
Others, 0.6 , 3%
6
Note: Fubon Bank (China) contributed 1.4% net profits to the Company on the basis of 80% shareholding.
13.7
5.9 5.6
0.8 0.6
4.9
13.3
0.9 0.4
Fubon FHC Taipei Fubon Bank
Fubon Life Fubon P&C Fubon Securities
Fubon Life13.3 66%
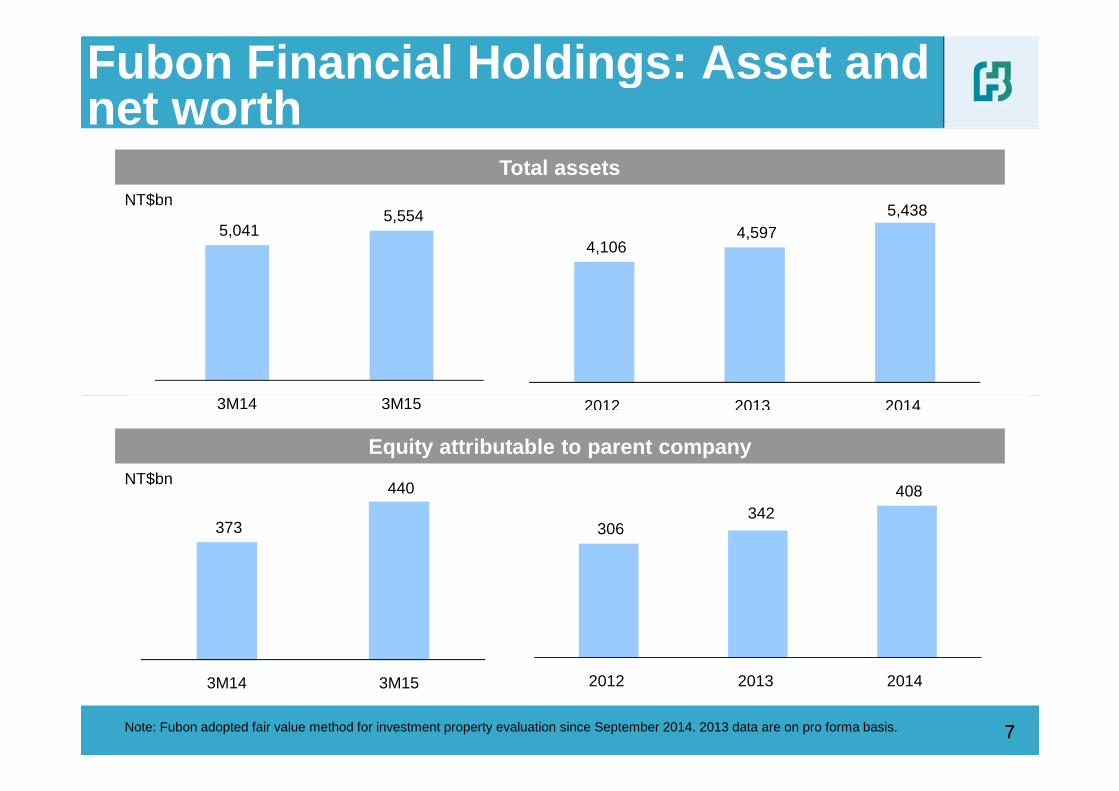
Total assetsNT$bn
4,106 4,597
5,438 5,041
5,554
3M14 3M15
Fubon Financial Holdings: Asset and net worth
77
Equity attributable to parent companyNT$bn
2012 2013 2014
306 342
408
2012 2013 2014
3M14 3M15
373
440
3M14 3M15
Note: Fubon adopted fair value method for investment property evaluation since September 2014. 2013 data are on pro forma basis.
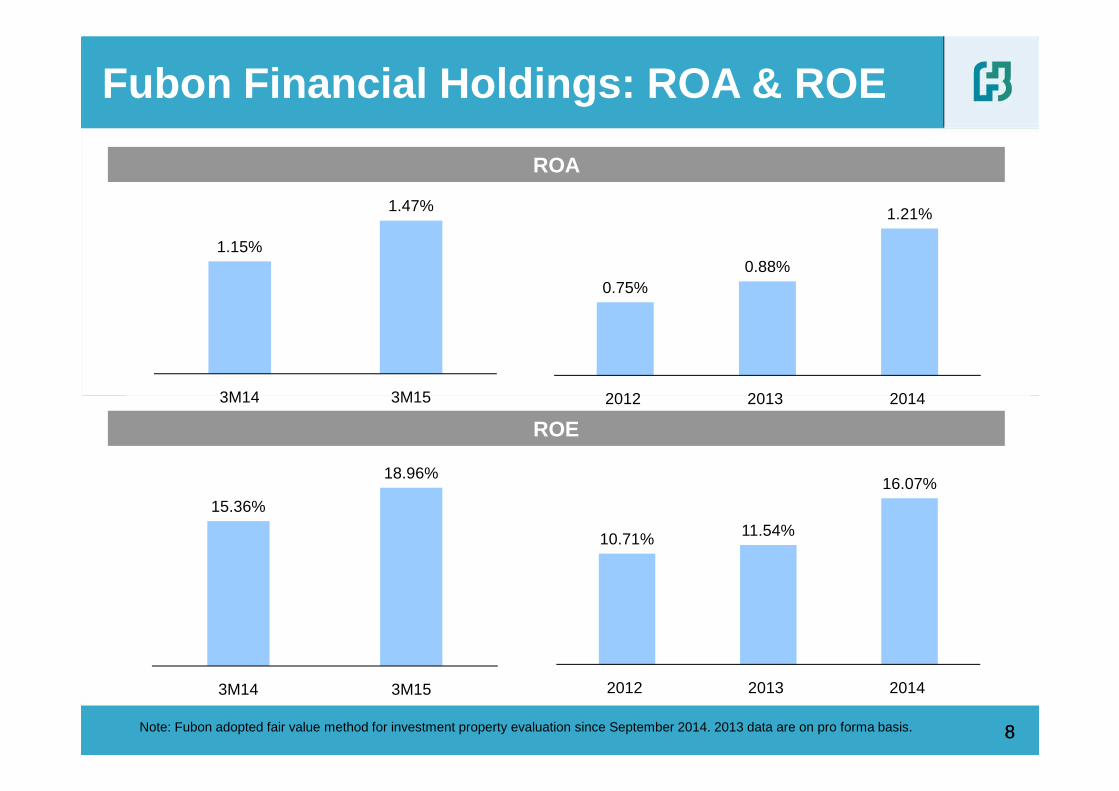
ROA
Fubon Financial Holdings: ROA & ROE
0.75%0.88%
1.21%
2012 2013 2014
1.15%
1.47%
3M14 3M15
88
ROE
2012 2013 2014
10.71% 11.54%
16.07%
2012 2013 2014
3M14 3M15
15.36%
18.96%
3M14 3M15
Note: Fubon adopted fair value method for investment property evaluation since September 2014. 2013 data are on pro forma basis.
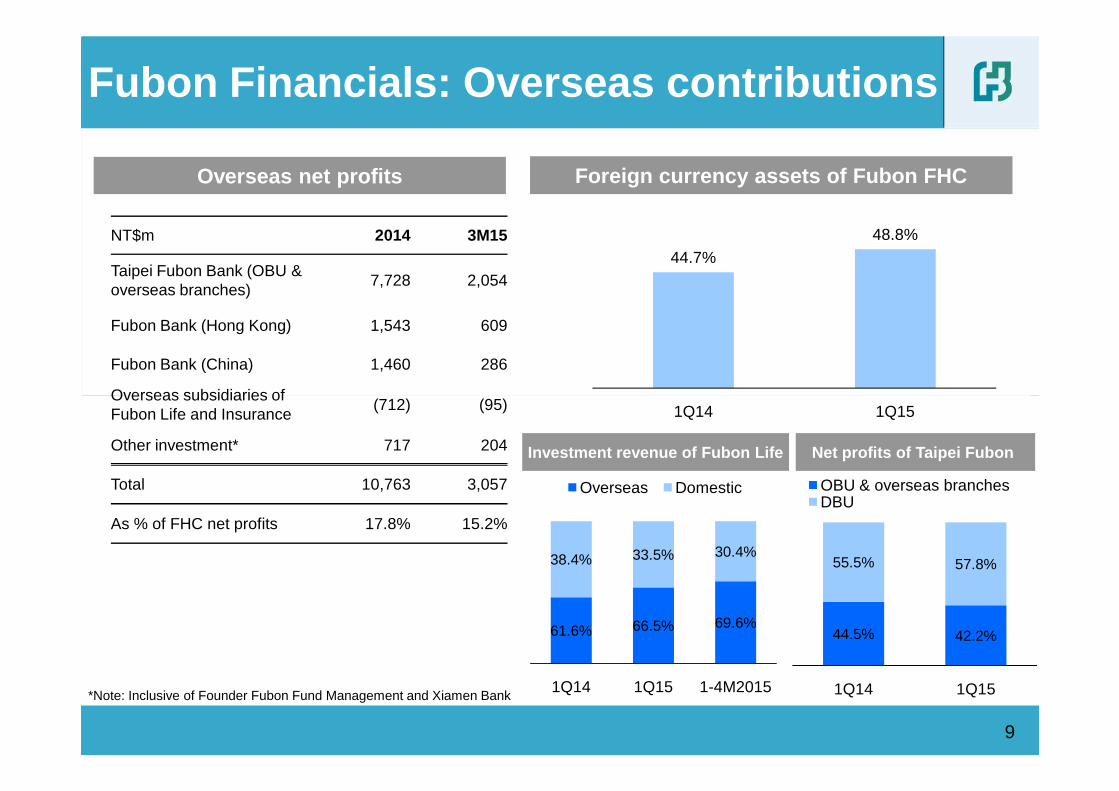
Fubon Financials: Overseas contributions
Foreign currency assets of Fubon FHC
44.7%48.8%
Overseas net profits
NT$m 2014 3M15
Taipei Fubon Bank (OBU & overseas branches)
7,728 2,054
Fubon Bank (Hong Kong) 1,543 609
Fubon Bank (China) 1,460 286
Overseas subsidiaries of
9
Investment revenue of Fubon Life
1Q14 1Q15
*Note: Inclusive of Founder Fubon Fund Management and Xiamen Bank
Overseas subsidiaries of Fubon Life and Insurance
(712) (95)
Other investment* 717 204
Total 10,763 3,057
As % of FHC net profits 17.8% 15.2%
Net profits of Taipei Fubon
61.6% 66.5% 69.6%
38.4% 33.5% 30.4%
1Q14 1Q15 1-4M2015
Overseas Domestic
44.5% 42.2%
55.5% 57.8%
1Q14 1Q15
OBU & overseas branchesDBU
� Performance review by subsidiary
• Fubon Life
� Performance highlights of Fubon Financial Holdings
Agenda
• Taipei Fubon Bank
10
• Fubon Life
• Fubon Securities
• Fubon Insurance
• Fubon Bank (China)
� 2014 Embedded Value of Fubon Life
Fubon Bank (China)
Treasury & others
Net fee income
Net interest income
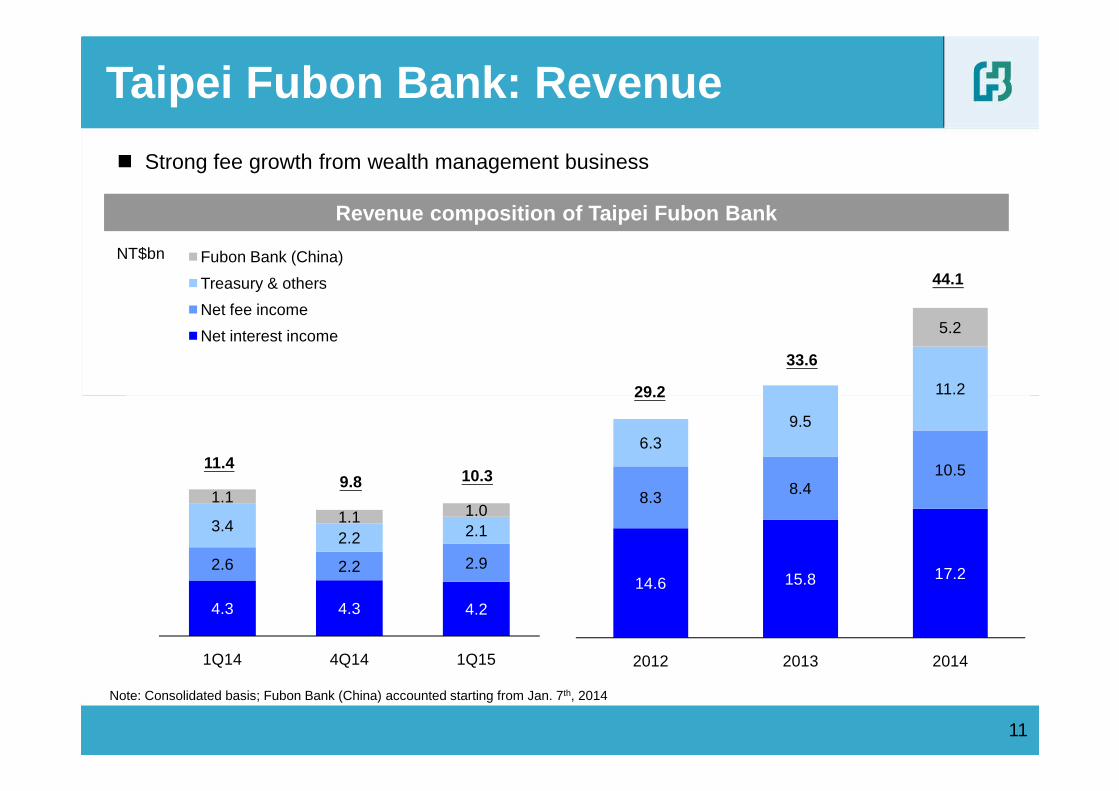
Taipei Fubon Bank: Revenue
Revenue composition of Taipei Fubon Bank
NT$bn
� Strong fee growth from wealth management business
29.2
33.6
44.1
11.2
5.2
4.3 4.3 4.2
2.6 2.2 2.9
3.42.2 2.1
1.11.1 1.0
1Q14 4Q14 1Q15
11
29.2
Note: Consolidated basis; Fubon Bank (China) accounted starting from Jan. 7th, 2014
10.311.4
9.8
14.6 15.8 17.2
8.3 8.410.5
6.39.5
11.2
2012 2013 2014
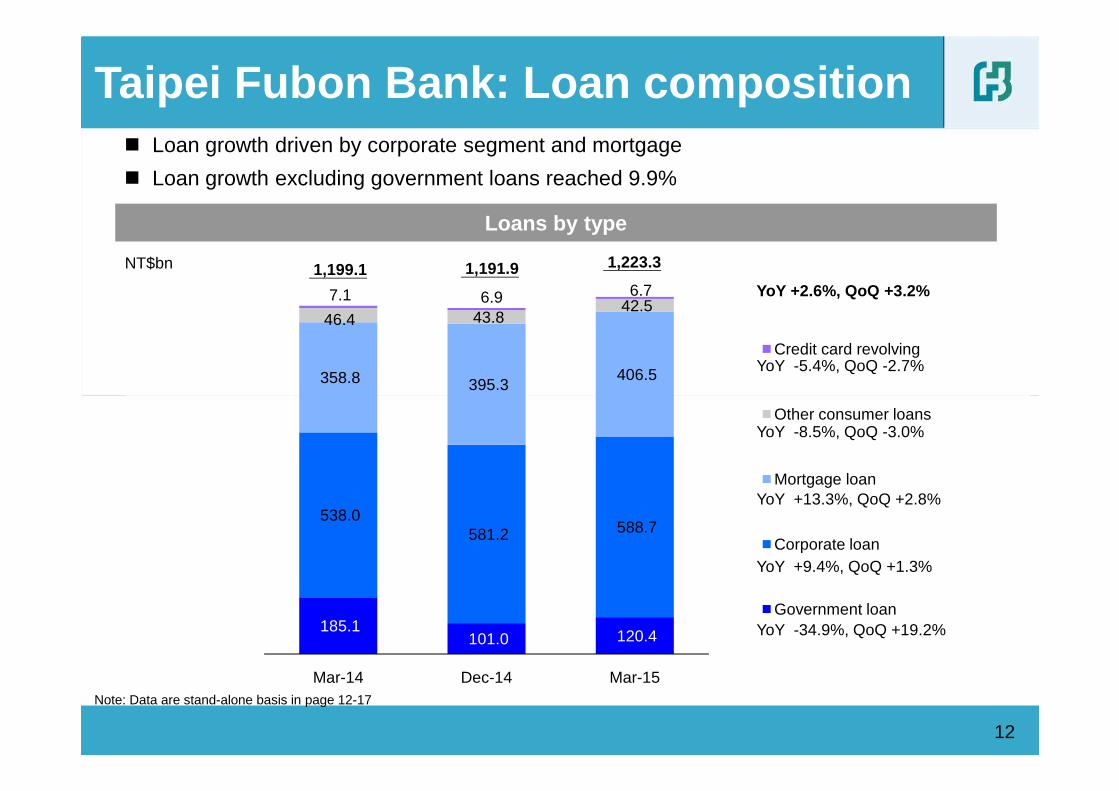
358.8 395.3 406.5
46.4 43.8 42.5
7.1 6.9 6.7
Credit card revolving
Taipei Fubon Bank: Loan composition
Loans by type
NT$bn 1,199.1 1,223.3
YoY +2.6%, QoQ +3.2%
YoY -5.4%, QoQ -2.7%
� Loan growth driven by corporate segment and mortgage
� Loan growth excluding government loans reached 9.9%
1,191.9
185.1 101.0 120.4
538.0 581.2 588.7
Mar-14 Dec-14 Mar-15
Other consumer loans
Mortgage loan
Corporate loan
Government loan
12
YoY -8.5%, QoQ -3.0%
YoY +13.3%, QoQ +2.8%
YoY +9.4%, QoQ +1.3%
YoY -34.9%, QoQ +19.2%
Note: Data are stand-alone basis in page 12-17
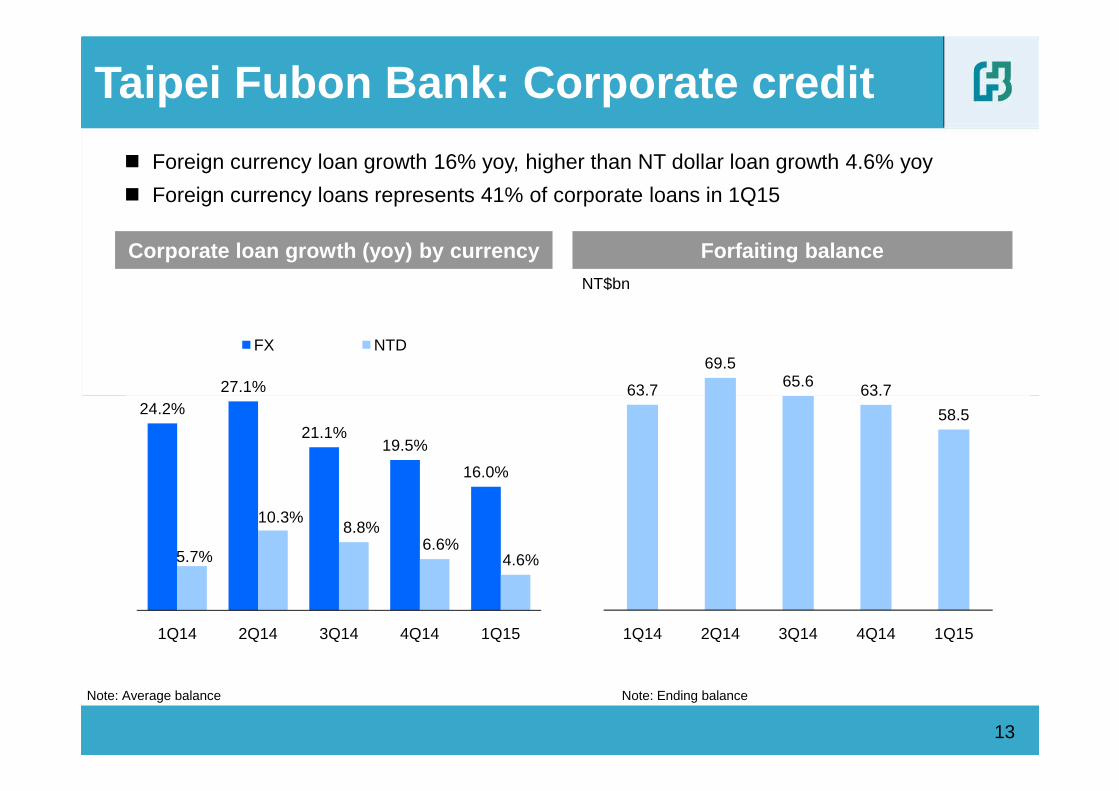
Taipei Fubon Bank: Corporate credit
Corporate loan growth (yoy) by currency Forfaiting balance
27.1%
FX NTD
63.7
69.5 65.6 63.7
NT$bn
� Foreign currency loan growth 16% yoy, higher than NT dollar loan growth 4.6% yoy
� Foreign currency loans represents 41% of corporate loans in 1Q15
13
Note: Average balance
24.2%
21.1%19.5%
16.0%
5.7%
10.3%8.8%
6.6%4.6%
1Q14 2Q14 3Q14 4Q14 1Q15
63.7 63.7
58.5
1Q14 2Q14 3Q14 4Q14 1Q15
Note: Ending balance
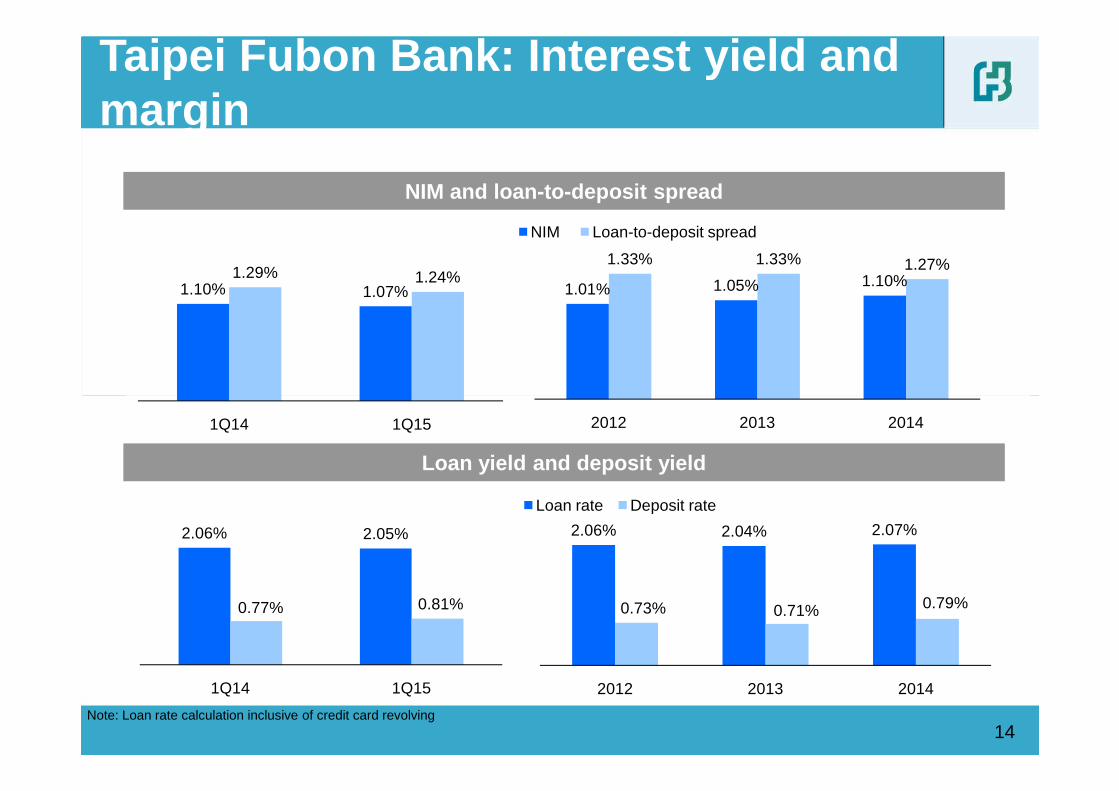
Taipei Fubon Bank: Interest yield and margin
NIM and loan-to-deposit spread
1.01% 1.05% 1.10%1.33% 1.33% 1.27%
NIM Loan-to-deposit spread
1.10% 1.07%1.29% 1.24%
14
Loan yield and deposit yield
Note: Loan rate calculation inclusive of credit card revolving
2012 2013 2014
2.06% 2.04% 2.07%
0.73% 0.71% 0.79%
2012 2013 2014
Loan rate Deposit rate
1Q14 1Q15
2.06% 2.05%
0.77% 0.81%
1Q14 1Q15
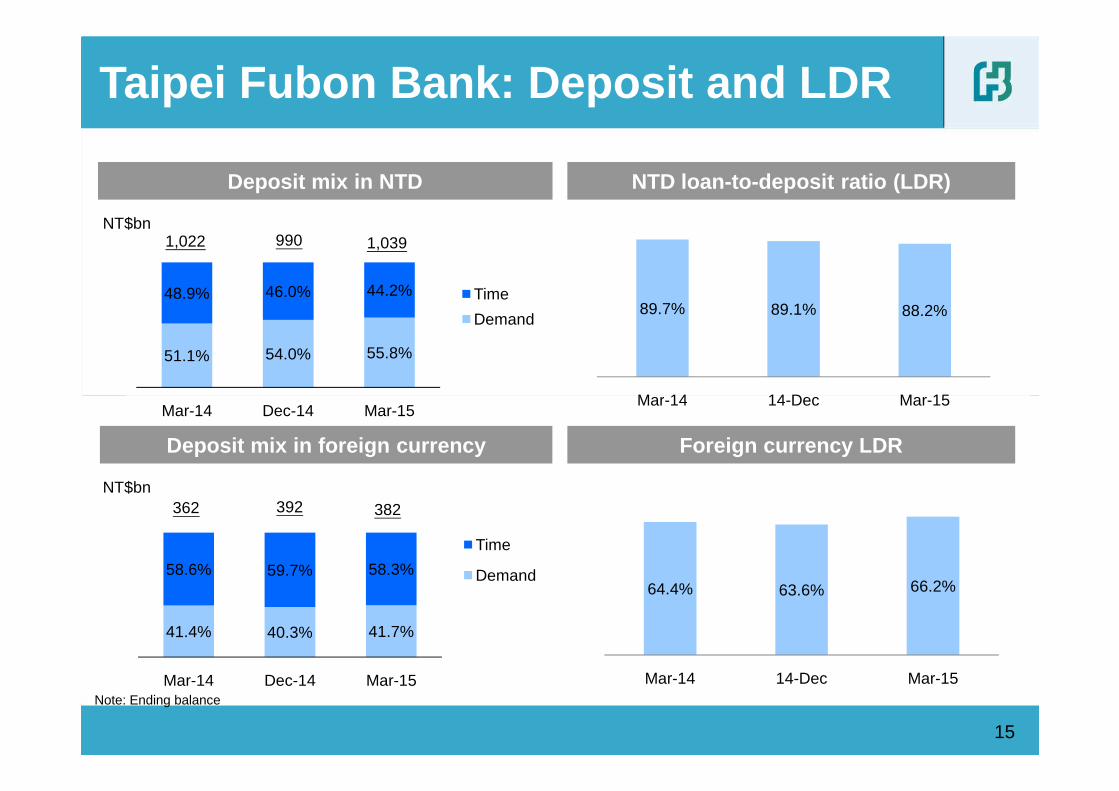
89.7% 89.1% 88.2%
Mar-14 14-Dec Mar-15
51.1% 54.0% 55.8%
48.9% 46.0% 44.2% Time
Demand
Taipei Fubon Bank: Deposit and LDR
NTD loan-to-deposit ratio (LDR)Deposit mix in NTD
NT$bn1,022 990 1,039
64.4% 63.6% 66.2%
Mar-14 14-Dec Mar-15
Mar-14 14-Dec Mar-15
41.4% 40.3% 41.7%
58.6% 59.7% 58.3%
Mar-14 Dec-14 Mar-15
Time
Demand
Mar-14 Dec-14 Mar-15
15
Deposit mix in foreign currency
NT$bn
Note: Ending balance
Foreign currency LDR
362 392 382
379
DCI,SI,SN and others
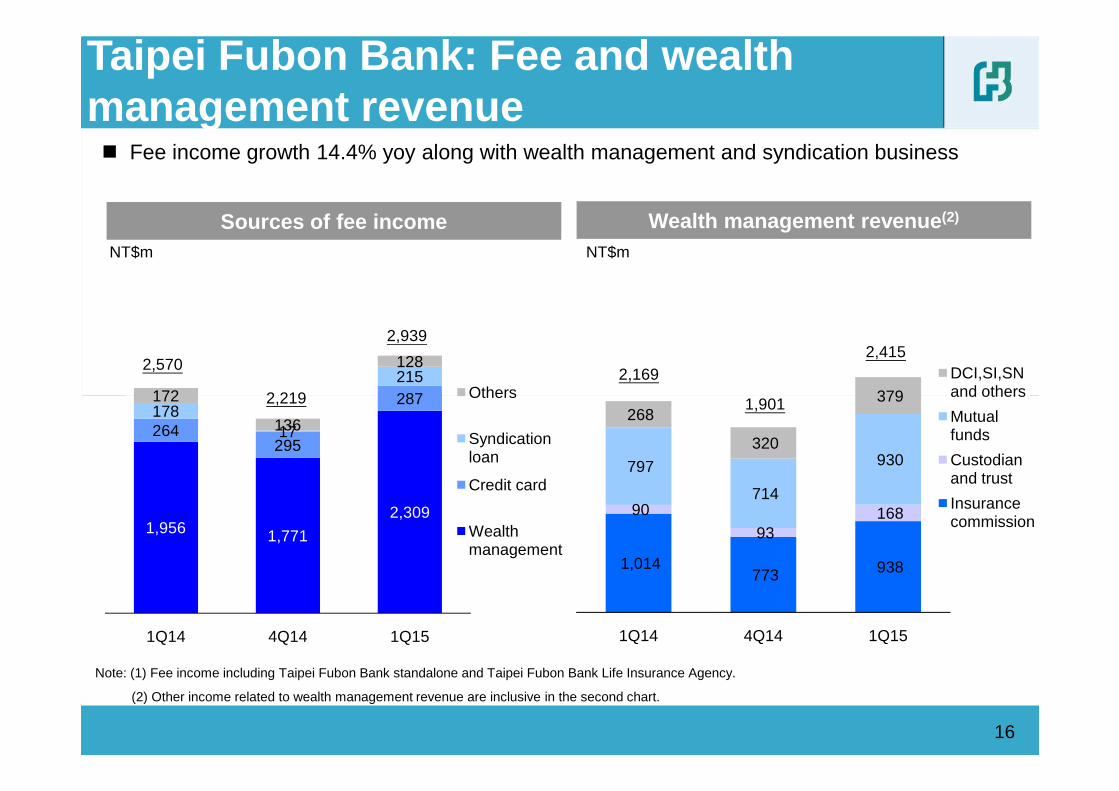
Taipei Fubon Bank: Fee and wealth management revenue
Sources of fee income Wealth management revenue (2)
NT$m NT$m
� Fee income growth 14.4% yoy along with wealth management and syndication business
2,570
2,939
2,1692,415
2,219 1,901287 215
172
128
Others
1,014 773 938
90
93 168
797
714
930
268
320
379
1Q14 4Q14 1Q15
and others
Mutual funds
Custodian and trust
Insurance commission
16
Note: (1) Fee income including Taipei Fubon Bank standalone and Taipei Fubon Bank Life Insurance Agency.
(2) Other income related to wealth management revenue are inclusive in the second chart.
2,219 1,901
1,956 1,771
2,309
264 295
287 178
17
172
136
1Q14 4Q14 1Q15
Others
Syndication loan
Credit card
Wealth management
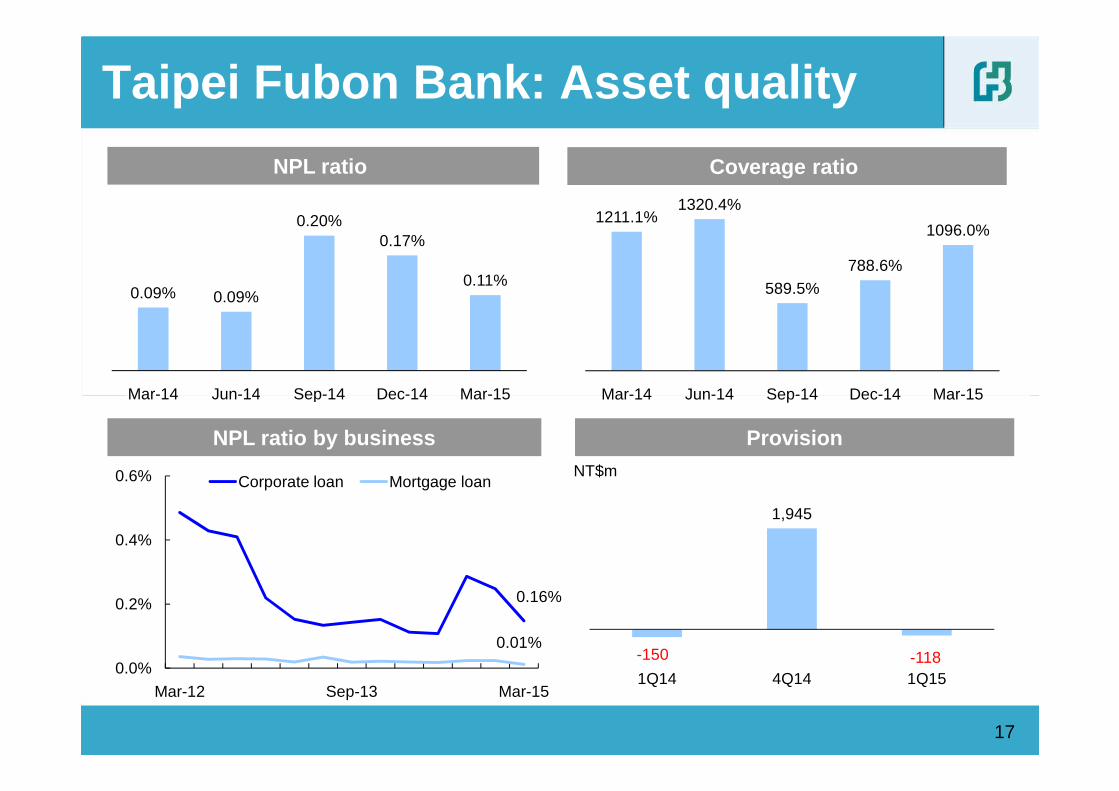
Taipei Fubon Bank: Asset quality
NPL ratio Coverage ratio
1211.1%1320.4%
589.5%788.6%
1096.0%
Mar-14 Jun-14 Sep-14 Dec-14 Mar-15
0.09% 0.09%
0.20%0.17%
0.11%
Mar-14 Jun-14 Sep-14 Dec-14 Mar-15
0.0%
0.2%
0.4%
0.6%
Mar-12 Sep-13 Mar-15
Corporate loan Mortgage loan
17
NPL ratio by business Provision
0.16%
0.01%
NT$m
Mar-14 Jun-14 Sep-14 Dec-14 Mar-15Mar-14 Jun-14 Sep-14 Dec-14 Mar-15
-150
1,945
-1181Q14 4Q14 1Q15
� Performance review by subsidiary
• Fubon Life
� Performance highlights of Fubon Financial Holdings
Agenda
• Taipei Fubon Bank
18
• Fubon Life
• Fubon Securities
• Fubon Insurance
• Fubon Bank (China)
� 2014 Embedded Value of Fubon Life
171.0 207.2 234.0
420.7
NT$bn
420.1 425.0
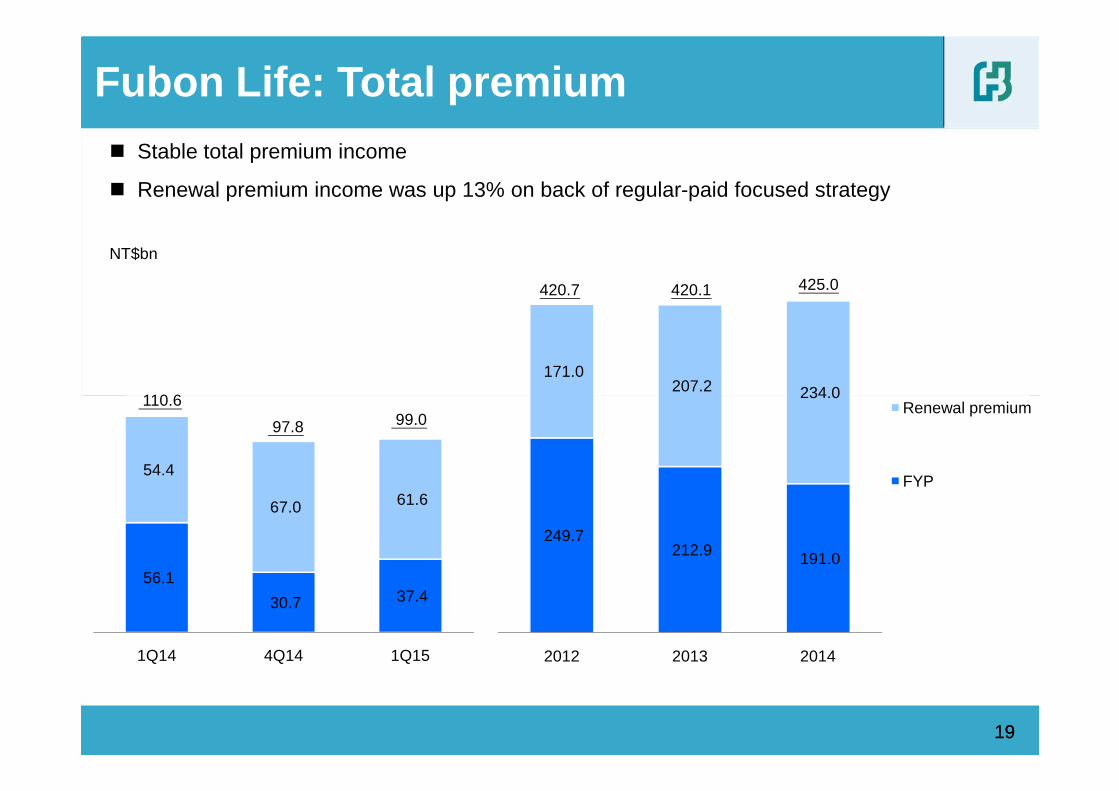
� Stable total premium income
� Renewal premium income was up 13% on back of regular-paid focused strategy
Fubon Life: Total premium
110.6
56.1
30.7 37.4
54.4
67.0 61.6
1Q14 4Q14 1Q15
249.7 212.9 191.0
234.0
2012 2013 2014
Renewal premium
FYP
1919
110.6 99.0 97.8
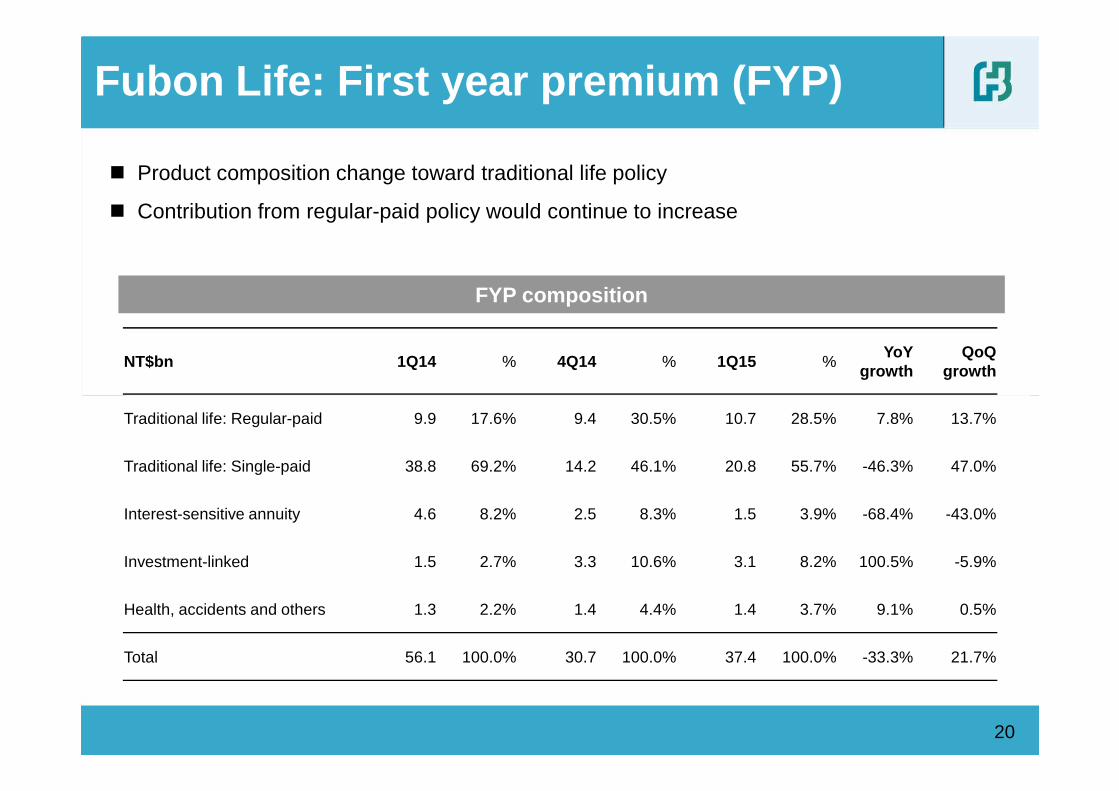
FYP composition
Fubon Life: First year premium (FYP)
� Product composition change toward traditional life policy
� Contribution from regular-paid policy would continue to increase
NT$bn 1Q14 % 4Q14 % 1Q15 %YoY
growthQoQ
growth
20
Traditional life: Regular-paid 9.9 17.6% 9.4 30.5% 10.7 28.5% 7.8% 13.7%
Traditional life: Single-paid 38.8 69.2% 14.2 46.1% 20.8 55.7% -46.3% 47.0%
Interest-sensitive annuity 4.6 8.2% 2.5 8.3% 1.5 3.9% -68.4% -43.0%
Investment-linked 1.5 2.7% 3.3 10.6% 3.1 8.2% 100.5% -5.9%
Health, accidents and others 1.3 2.2% 1.4 4.4% 1.4 3.7% 9.1% 0.5%
Total 56.1 100.0% 30.7 100.0% 37.4 100.0% -33.3% 21.7%
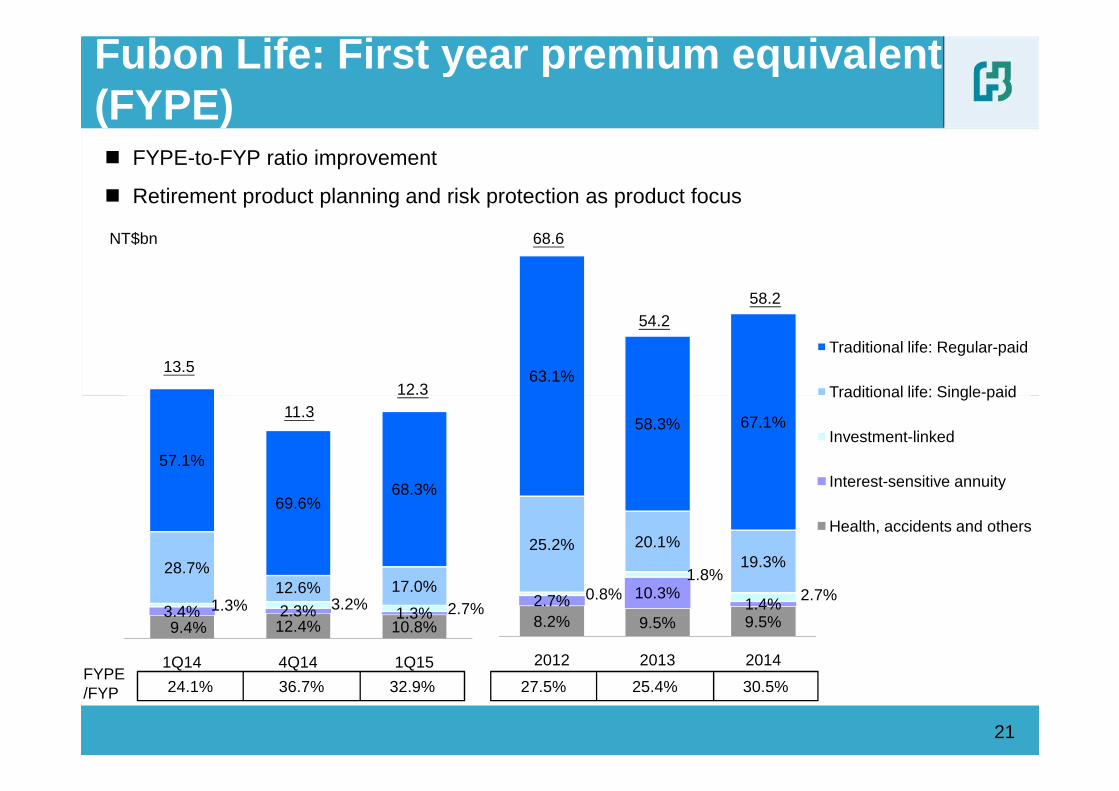
� FYPE-to-FYP ratio improvement
� Retirement product planning and risk protection as product focus
63.1%
Traditional life: Regular-paid
Traditional life: Single-paid
54.2
68.6NT$bn
Fubon Life: First year premium equivalent (FYPE)
58.2
12.313.5
9.4% 12.4% 10.8%3.4% 2.3% 1.3% 1.3% 3.2% 2.7%
28.7%12.6% 17.0%
57.1%
69.6%68.3%
1Q14 4Q14 1Q15
8.2% 9.5% 9.5%2.7% 10.3%
1.4% 0.8%
1.8%2.7%
25.2% 20.1%19.3%
58.3% 67.1%
2012 2013 2014
Traditional life: Single-paid
Investment-linked
Interest-sensitive annuity
Health, accidents and others
21
12.311.3
24.1% 36.7% 32.9%FYPE/FYP 27.5% 25.4% 30.5%
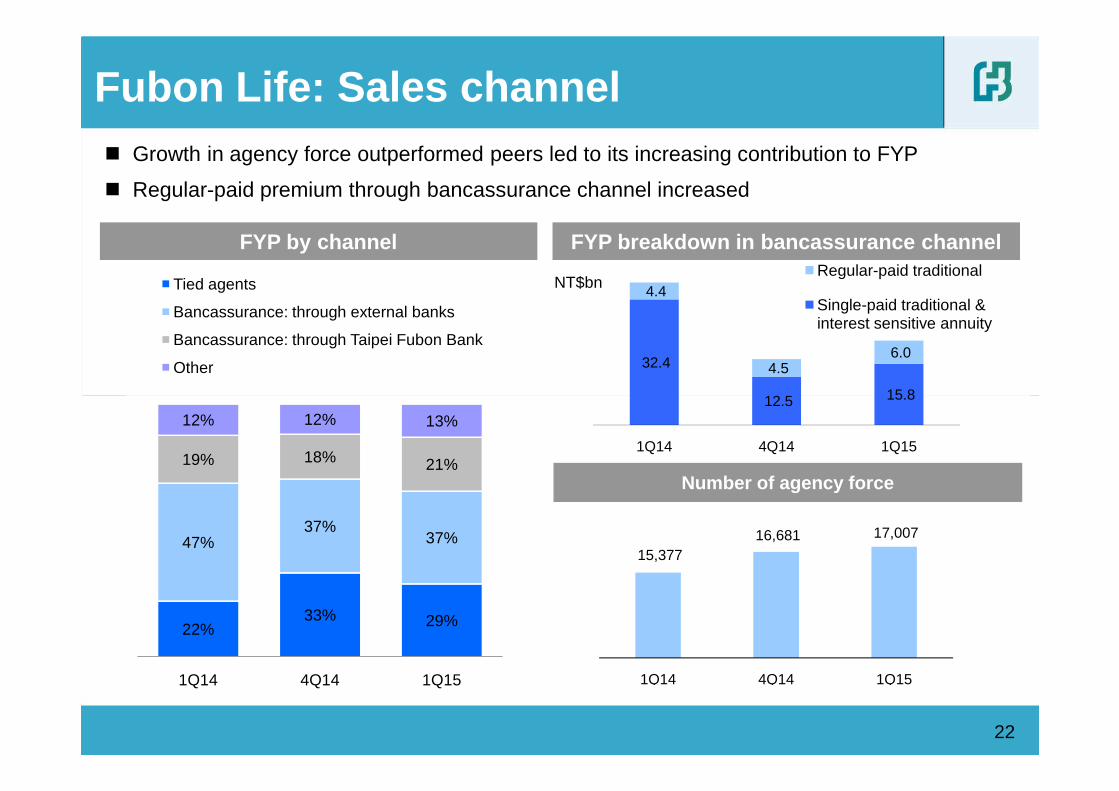
Tied agents
Bancassurance: through external banks
Bancassurance: through Taipei Fubon Bank
Other
FYP by channel
Fubon Life: Sales channel� Growth in agency force outperformed peers led to its increasing contribution to FYP
� Regular-paid premium through bancassurance channel increased
FYP breakdown in bancassurance channel
NT$bn
32.4
12.5 15.8
4.4
4.5 6.0
Regular-paid traditional
Single-paid traditional & interest sensitive annuity
22%33% 29%
47%37%
37%
19% 18% 21%
12% 12% 13%
1Q14 4Q14 1Q15
22
Number of agency force
15,377 16,681 17,007
1Q14 4Q14 1Q15
12.5 15.8
1Q14 4Q14 1Q15
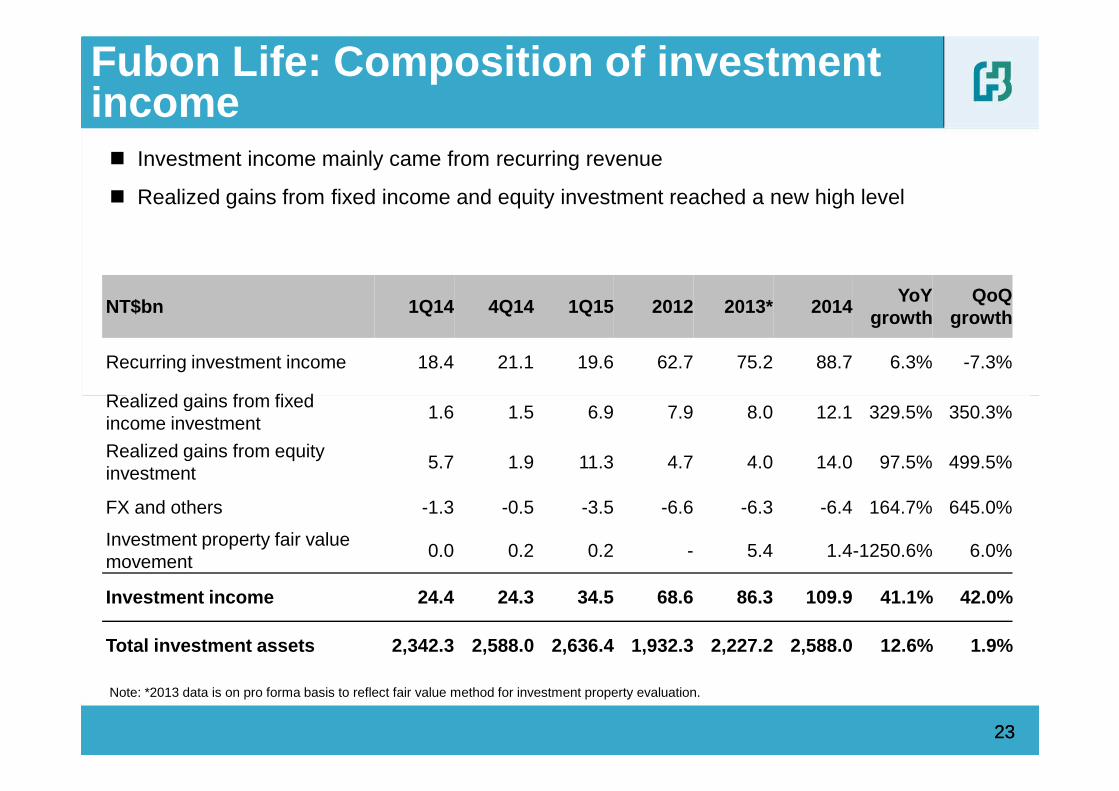
� Investment income mainly came from recurring revenue
� Realized gains from fixed income and equity investment reached a new high level
Fubon Life: Composition of investment income
NT$bn 1Q14 4Q14 1Q15 2012 2013* 2014YoY
growthQoQ
growth
Recurring investment income 18.4 21.1 19.6 62.7 75.2 88.7 6.3% -7.3%
Realized gains from fixed
2323
Note: *2013 data is on pro forma basis to reflect fair value method for investment property evaluation.
Realized gains from fixed income investment
1.6 1.5 6.9 7.9 8.0 12.1 329.5% 350.3%
Realized gains from equity investment
5.7 1.9 11.3 4.7 4.0 14.0 97.5% 499.5%
FX and others -1.3 -0.5 -3.5 -6.6 -6.3 -6.4 164.7% 645.0%
Investment property fair value movement
0.0 0.2 0.2 - 5.4 1.4-1250.6% 6.0%
Investment income 24.4 24.3 34.5 68.6 86.3 109.9 41.1% 42.0 %
Total investment assets 2,342.3 2,588.0 2,636.4 1,932.3 2,227.2 2,588.0 12.6% 1.9%
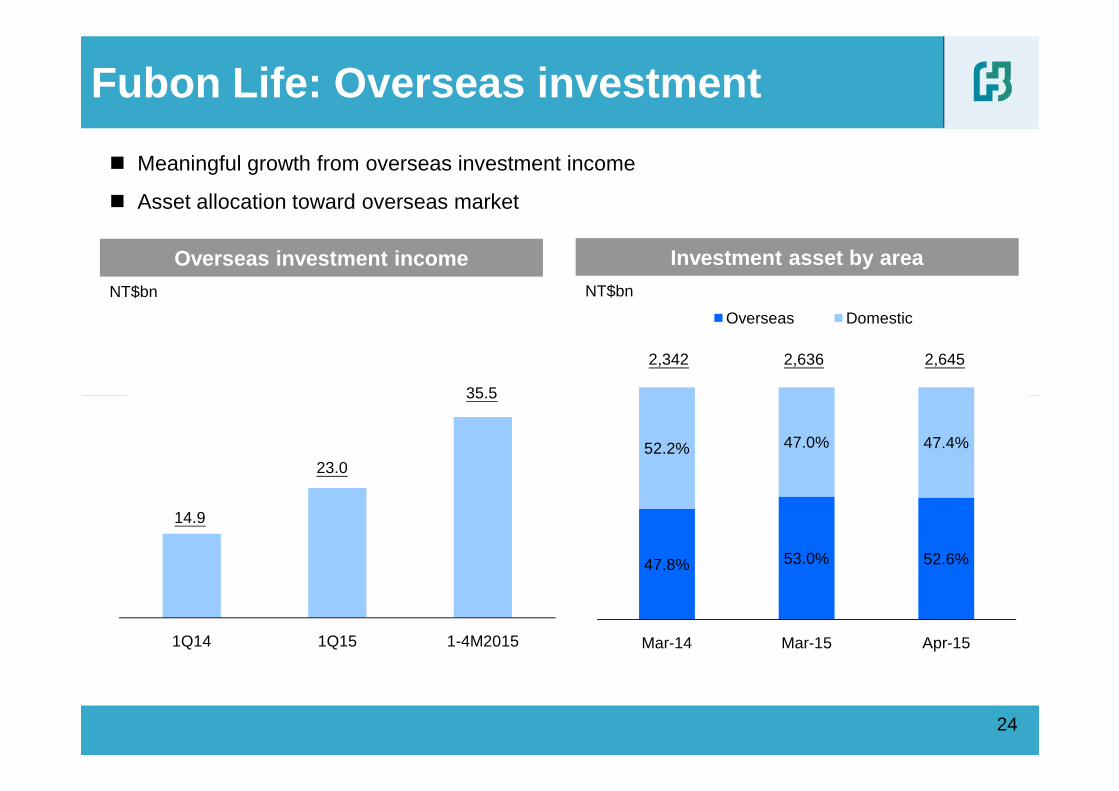
Overseas Domestic
Overseas investment income
Fubon Life: Overseas investment
Investment asset by area
NT$bn NT$bn
35.5
2,342 2,636 2,645
� Meaningful growth from overseas investment income
� Asset allocation toward overseas market
47.8% 53.0% 52.6%
52.2% 47.0% 47.4%
Mar-14 Mar-15 Apr-151Q14 1Q15 1-4M2015
24
14.9
23.0
35.5
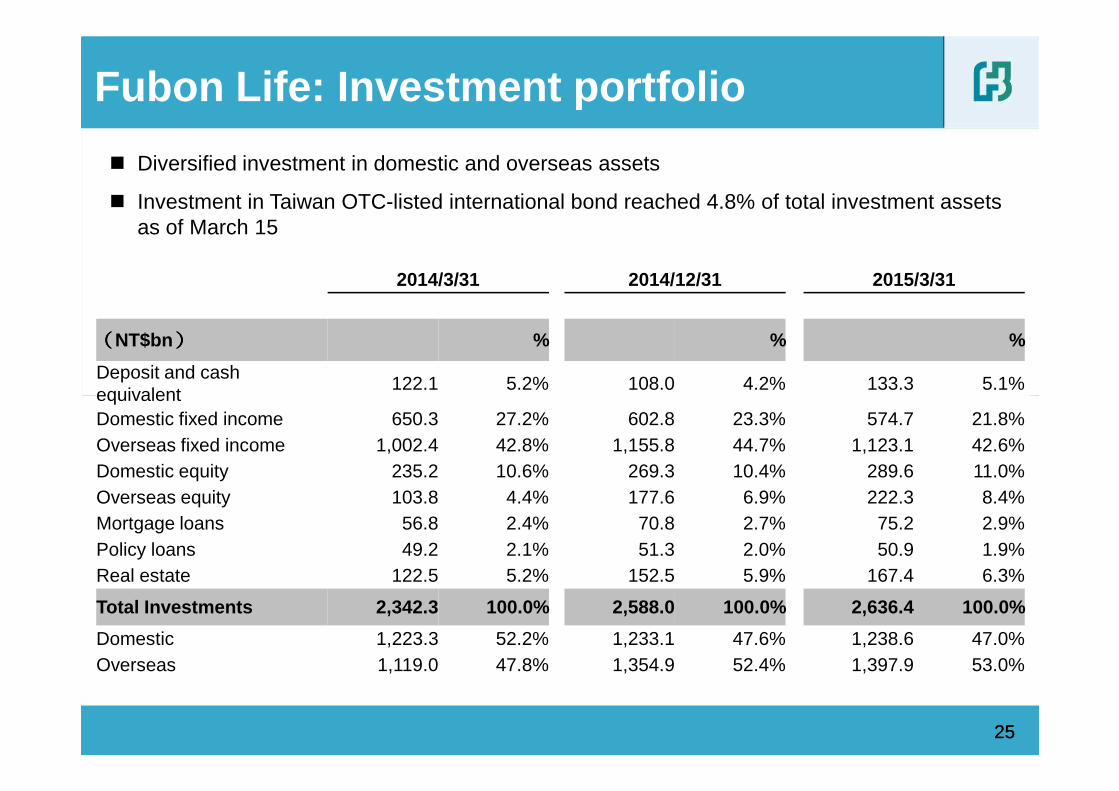
� Diversified investment in domestic and overseas assets
� Investment in Taiwan OTC-listed international bond reached 4.8% of total investment assets as of March 15
Fubon Life: Investment portfolio
2014/3/31 2014/12/31 2015/3/31
((((NT$bn)))) % % %
Deposit and cash equivalent
122.1 5.2% 108.0 4.2% 133.3 5.1%
2525
equivalentDomestic fixed income 650.3 27.2% 602.8 23.3% 574.7 21.8%Overseas fixed income 1,002.4 42.8% 1,155.8 44.7% 1,123.1 42.6%Domestic equity 235.2 10.6% 269.3 10.4% 289.6 11.0%Overseas equity 103.8 4.4% 177.6 6.9% 222.3 8.4%Mortgage loans 56.8 2.4% 70.8 2.7% 75.2 2.9%Policy loans 49.2 2.1% 51.3 2.0% 50.9 1.9%Real estate 122.5 5.2% 152.5 5.9% 167.4 6.3%
Total Investments 2,342.3 100.0% 2,588.0 100.0% 2,636. 4 100.0%
Domestic 1,223.3 52.2% 1,233.1 47.6% 1,238.6 47.0%Overseas 1,119.0 47.8% 1,354.9 52.4% 1,397.9 53.0%
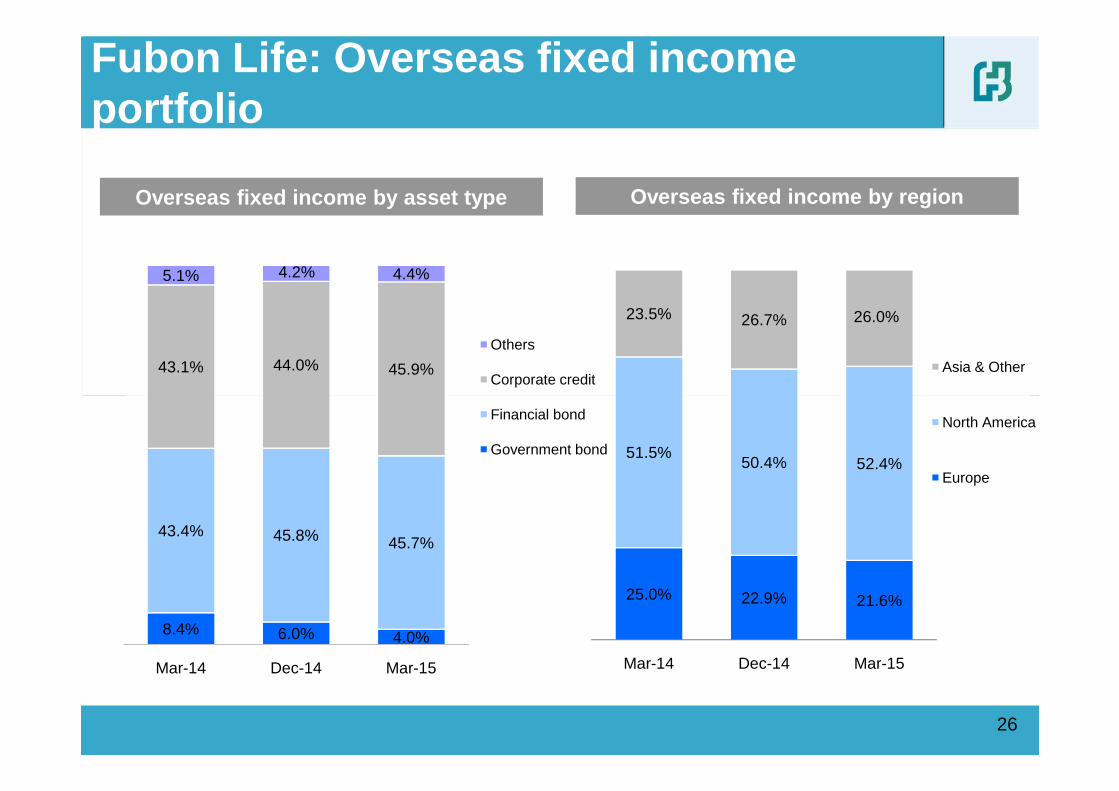
Overseas fixed income by asset type
Fubon Life: Overseas fixed income portfolio
Overseas fixed income by region
23.5% 26.7% 26.0%
Asia & Other43.1% 44.0% 45.9%
5.1% 4.2% 4.4%
Others
Corporate credit
26
25.0% 22.9% 21.6%
51.5%50.4% 52.4%
Mar-14 Dec-14 Mar-15
North America
Europe
8.4% 6.0% 4.0%
43.4% 45.8% 45.7%
Mar-14 Dec-14 Mar-15
Financial bond
Government bond
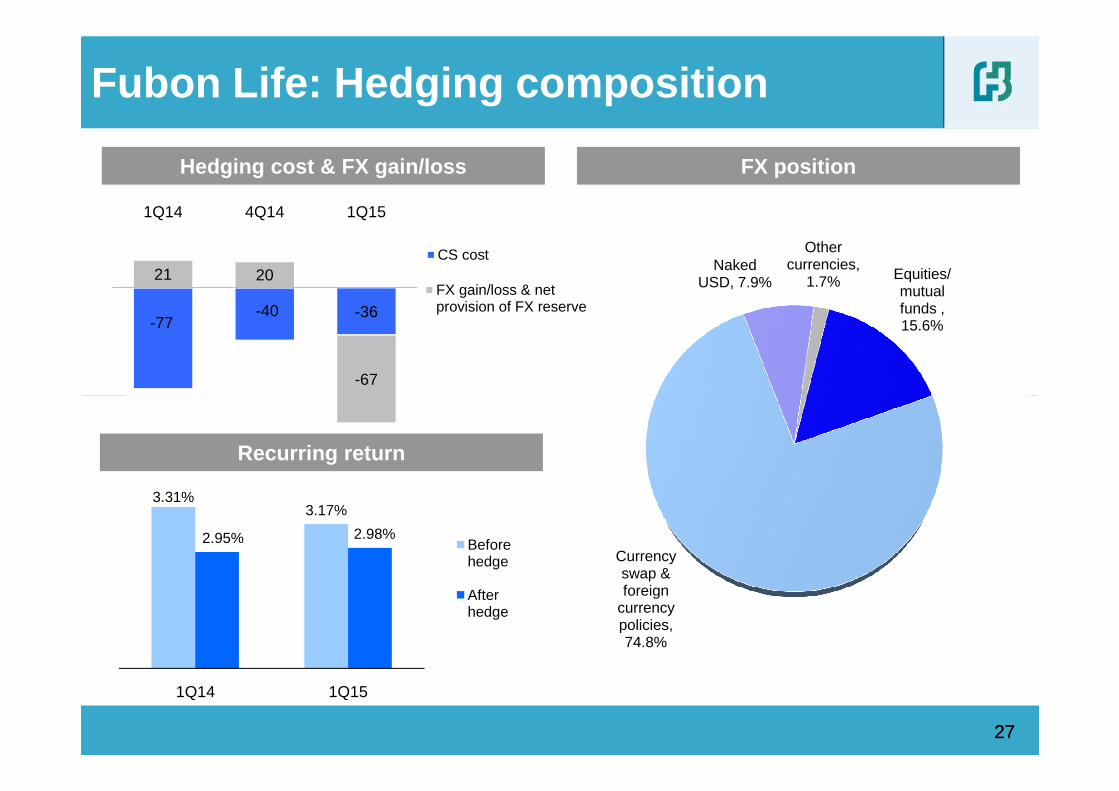
Hedging cost & FX gain/loss FX position
Fubon Life: Hedging composition
CS cost
FX gain/loss & netprovision of FX reserve
Naked USD, 7.9%
Other currencies,
1.7% Equities/ mutual funds , 15.6%-77
-40 -36
21 20
-67
1Q14 4Q14 1Q15
2727
Recurring return
Currency swap & foreign
currency policies, 74.8%
3.31%3.17%
2.95% 2.98%
1Q14 1Q15
Before hedge
After hedge
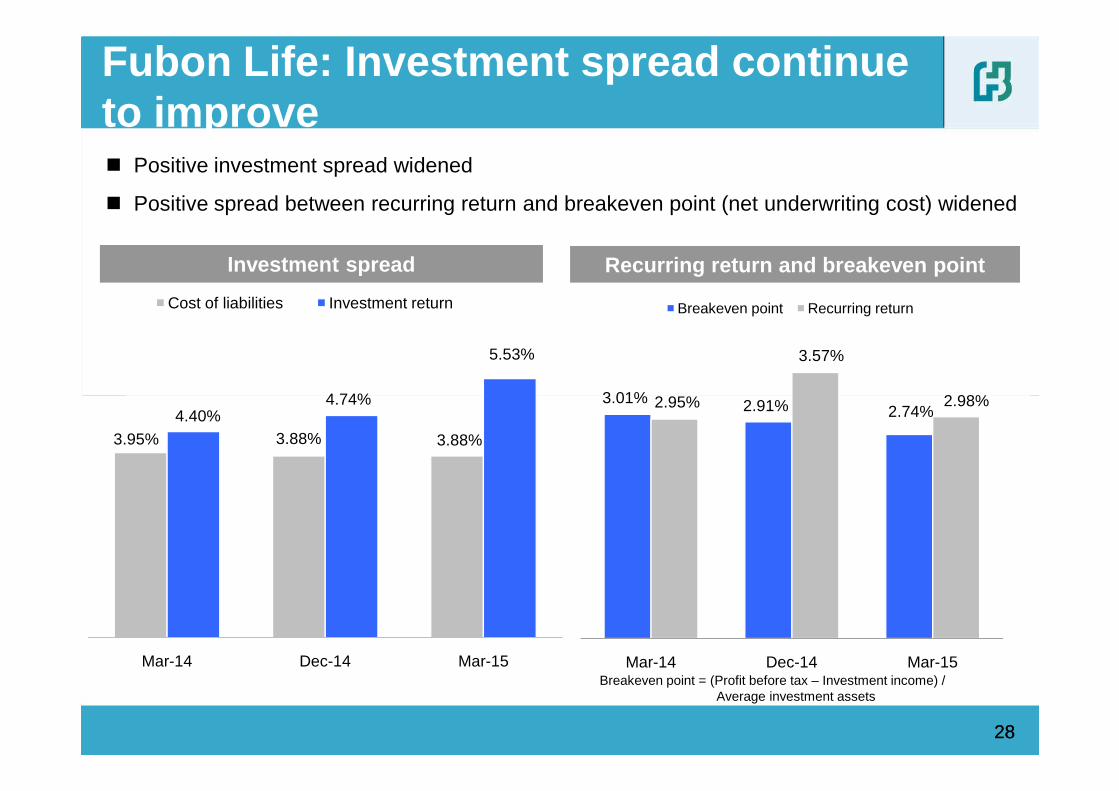
Fubon Life: Investment spread continue to improve� Positive investment spread widened
� Positive spread between recurring return and breakeven point (net underwriting cost) widened
Investment spread Recurring return and breakeven point
3.01% 2.95%
3.57%
2.98%
Breakeven point Recurring return
4.74%
5.53%
Cost of liabilities Investment return
2828
Breakeven point = (Profit before tax – Investment income) / Average investment assets
3.01% 2.91% 2.74%2.95% 2.98%
Mar-14 Dec-14 Mar-15
3.95% 3.88% 3.88%
4.40%4.74%
Mar-14 Dec-14 Mar-15
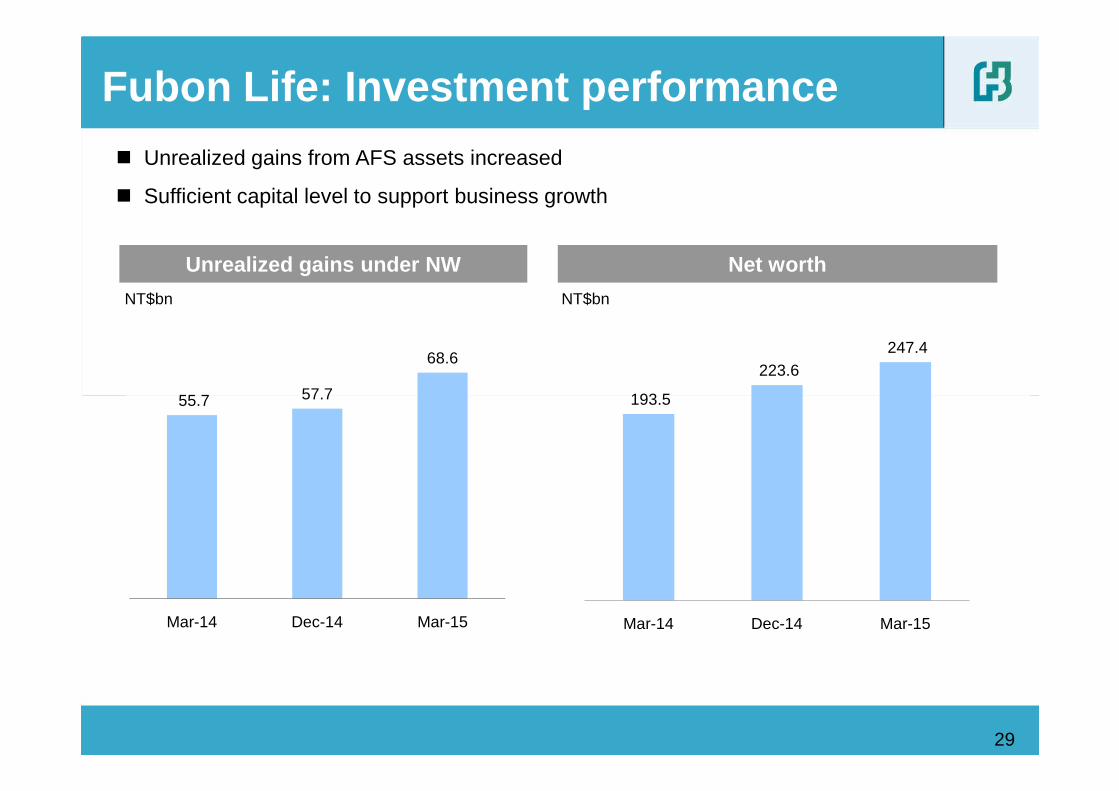
Net worthUnrealized gains under NW
NT$bn
� Unrealized gains from AFS assets increased
� Sufficient capital level to support business growth
Fubon Life: Investment performance
55.7 57.7
68.6
NT$bn
193.5
223.6 247.4
29
55.7 57.7
Mar-14 Dec-14 Mar-15
193.5
Mar-14 Dec-14 Mar-15
� Performance review by subsidiary
• Fubon Life
� Performance highlights of Fubon Financial Holdings
Agenda
• Taipei Fubon Bank
30
• Fubon Life
• Fubon Securities
• Fubon Insurance
• Fubon Bank (China)
� 2014 Embedded Value of Fubon Life
35.9% 34.7%1.10.7
0.7 0.7 Others
Net combined ratioNT$bn
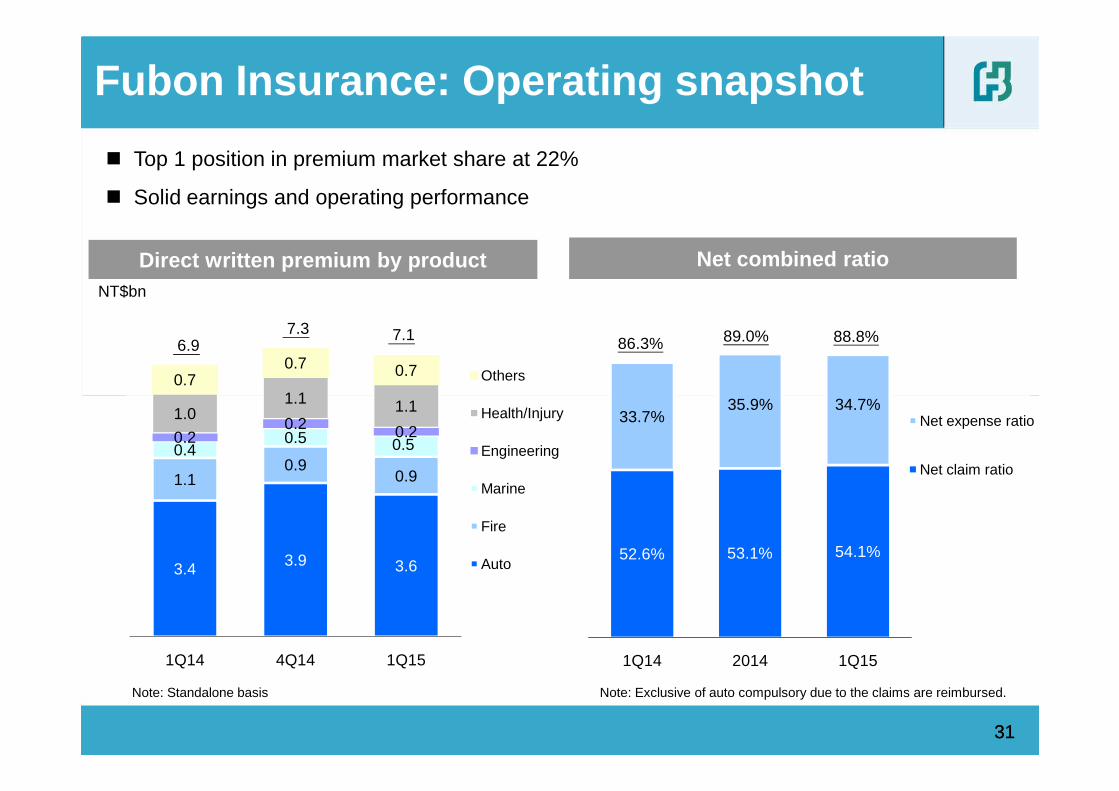
� Top 1 position in premium market share at 22%
� Solid earnings and operating performance
Fubon Insurance: Operating snapshot
Direct written premium by product
86.3%6.9 7.1 7.3 89.0% 88.8%
52.6% 53.1% 54.1%
33.7%35.9% 34.7%
1Q14 2014 1Q15
Net expense ratio
Net claim ratio
3.4 3.9 3.6
1.10.9
0.9
0.40.5 0.50.20.2 0.2
1.01.1 1.1
1Q14 4Q14 1Q15
Health/Injury
Engineering
Marine
Fire
Auto
3131
Note: Standalone basis Note: Exclusive of auto compulsory due to the claims are reimbursed.
� Performance review by subsidiary
• Fubon Life
� Performance highlights of Fubon Financial Holdings
Agenda
• Taipei Fubon Bank
32
• Fubon Life
• Fubon Securities
• Fubon Insurance
• Fubon Bank (China)
� 2014 Embedded Value of Fubon Life
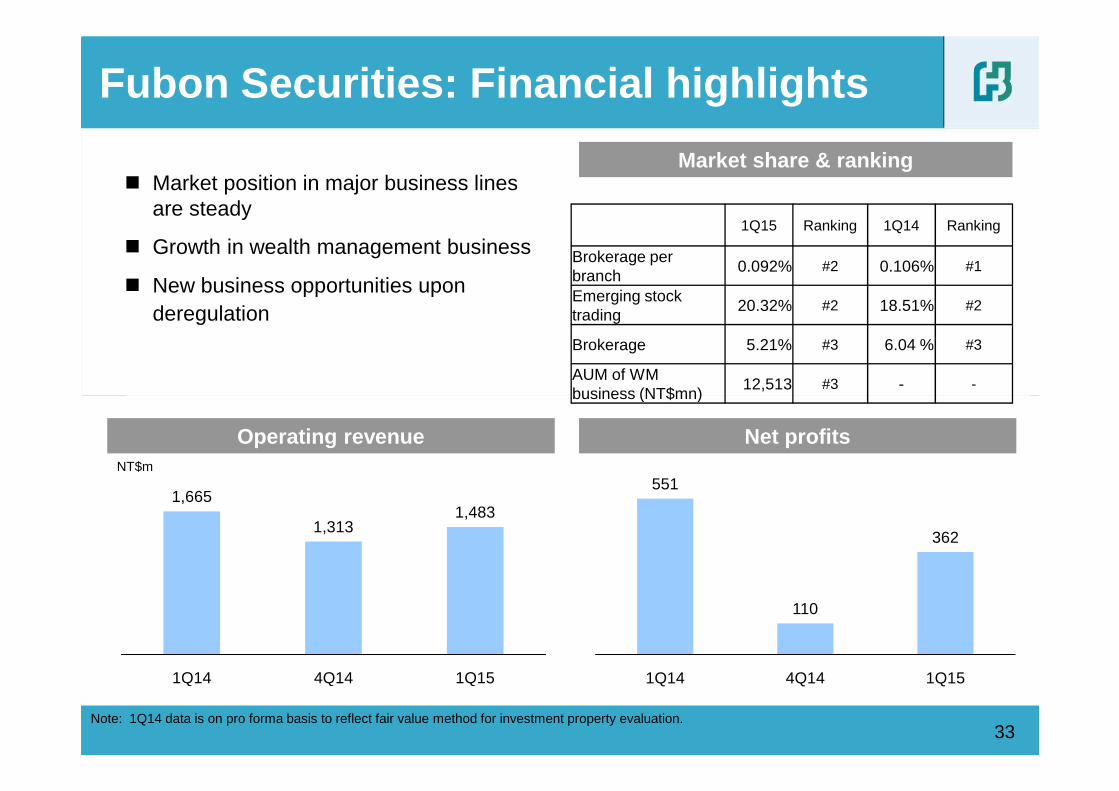
Fubon Securities: Financial highlights
Market share & ranking� Market position in major business lines
are steady
� Growth in wealth management business
� New business opportunities upon deregulation
1Q15 Ranking 1Q14 Ranking
Brokerage per branch
0.092% #2 0.106% #1
Emerging stock trading
20.32% #2 18.51% #2
Brokerage 5.21% #3 6.04 % #3
AUM of WM business (NT$mn)
12,513 #3 - -
33
Operating revenueNT$m
Net profits
business (NT$mn)
Note: 1Q14 data is on pro forma basis to reflect fair value method for investment property evaluation.
1,665
1,3131,483
1Q14 4Q14 1Q15
551
110
362
1Q14 4Q14 1Q15
� Performance review by subsidiary
• Fubon Life
� Performance highlights of Fubon Financial Holdings
Agenda
• Taipei Fubon Bank
34
• Fubon Life
• Fubon Securities
• Fubon Insurance
• Fubon Bank (China)
� 2014 Embedded Value of Fubon Life
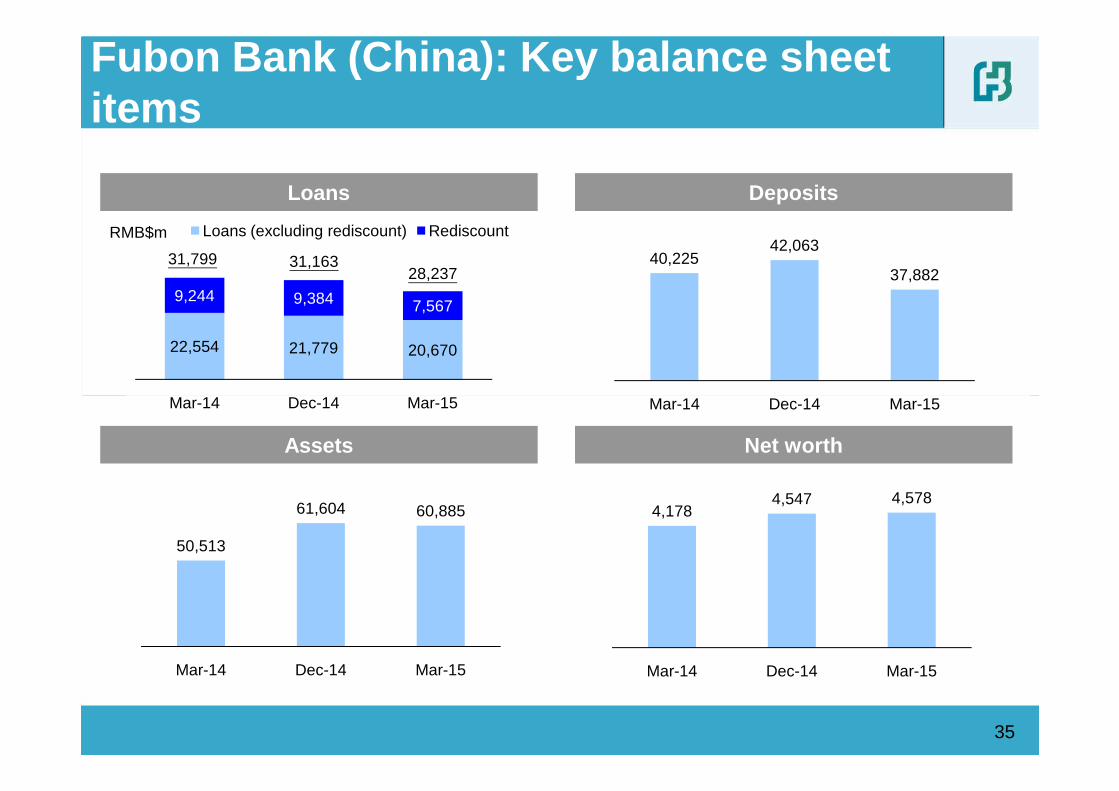
22,554 21,779 20,670
9,244 9,384 7,567
Mar-14 Dec-14 Mar-15
Loans (excluding rediscount) Rediscount
Fubon Bank (China): Key balance sheet items
DepositsLoans
RMB$m
40,22542,063
37,882
Mar-14 Dec-14 Mar-15
31,799 31,16328,237
Mar-14 Dec-14 Mar-15
35
Assets Net worth
4,1784,547 4,578
Mar-14 Dec-14 Mar-15
Mar-14 Dec-14 Mar-15
50,513
61,604 60,885
Mar-14 Dec-14 Mar-15
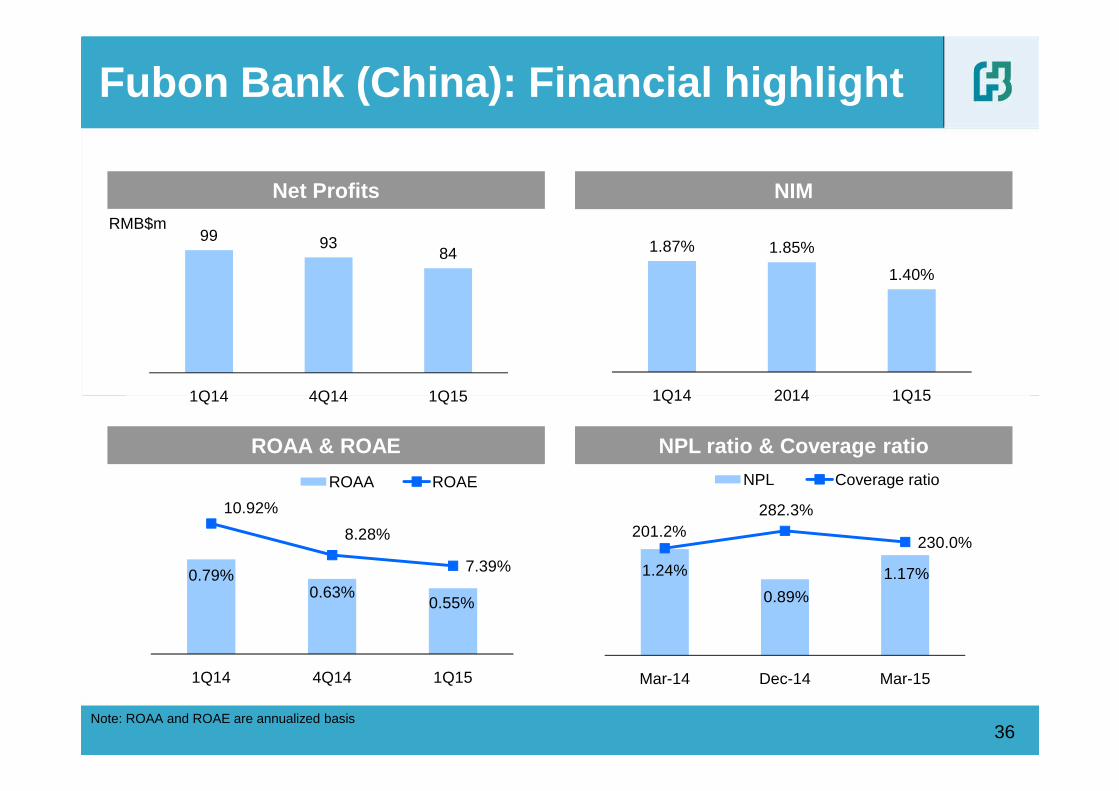
99 9384
1Q14 4Q14 1Q15
Fubon Bank (China): Financial highlight
NIMNet ProfitsRMB$m
1.87% 1.85%
1.40%
1Q14 2014 1Q151Q14 4Q14 1Q15
36
ROAA & ROAE NPL ratio & Coverage ratio
1Q14 2014 1Q15
Note: ROAA and ROAE are annualized basis
0.79%0.63%
0.55%
10.92%
8.28%
7.39%
1Q14 4Q14 1Q15
ROAA ROAE
1.24%
0.89%
1.17%
201.2%282.3%
230.0%
Mar-14 Dec-14 Mar-15
NPL Coverage ratio
� Debit card issuance
5,296 cards issuance as of 1Q15. Target to reach 13,000 cards in 2Q15 and
40,000 cards in 2015
� New branch expansion
(1) Target 20 branches by end-2015
(2) Grand opening of Shanghai sub-branch in 2Q15
Fubon Bank (China): Business outlook
37
(3) Nanjing branch and Shanghai Free Trade Zone sub-branch to open in July
� NIM improvement from funding costs reduction
� Target NPL ratio to lower to below 1% by end-2015 along with bad debt recovery.
Coverage ratio target to be above 250%
� Performance review by subsidiary
• Fubon Life
� Performance highlights of Fubon Financial Holdings
Agenda
• Taipei Fubon Bank
38
• Fubon Life
• Fubon Securities
• Fubon Insurance
• Fubon Bank (China)
� 2014 Embedded Value of Fubon Life
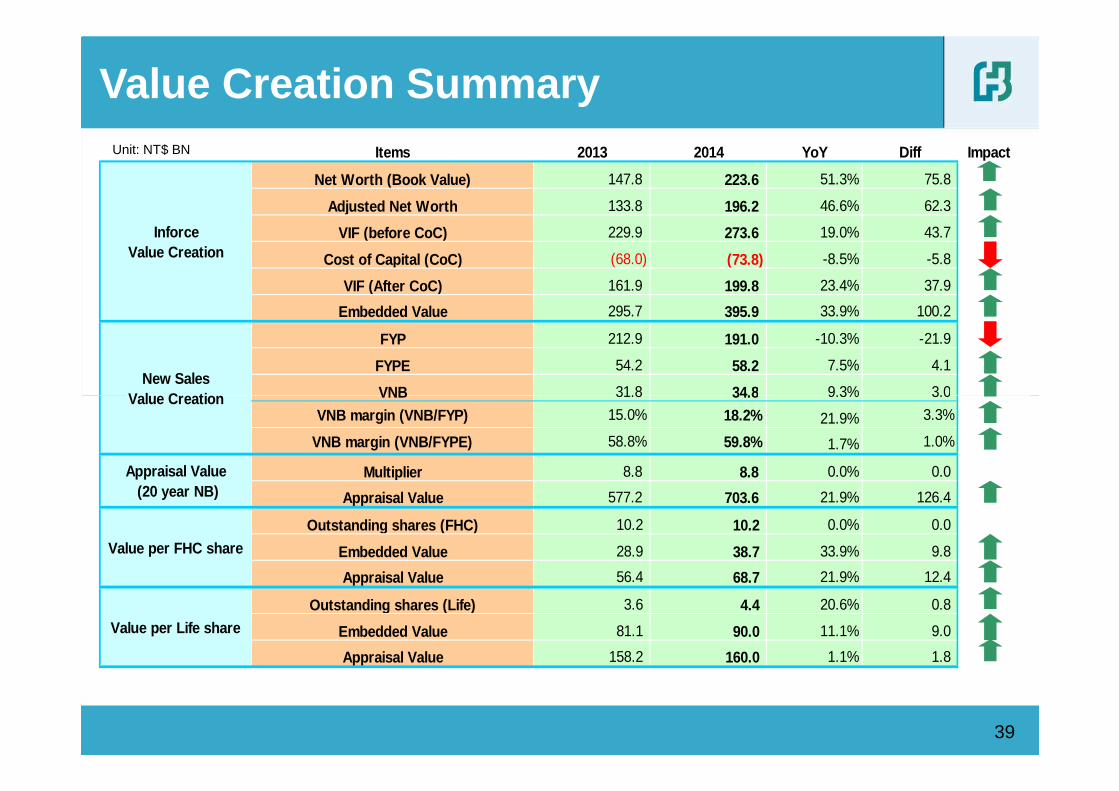
Value Creation SummaryUnit: NT$ BN Items 2013 2014 YoY Diff Impact
Net Worth (Book Value) 147.8 223.6 51.3% 75.8
Adjusted Net Worth 133.8 196.2 46.6% 62.3
VIF (before CoC) 229.9 273.6 19.0% 43.7
Cost of Capital (CoC) (68.0) (73.8) -8.5% -5.8
VIF (After CoC) 161.9 199.8 23.4% 37.9
Embedded Value 295.7 395.9 33.9% 100.2
FYP 212.9 191.0 -10.3% -21.9
FYPE 54.2 58.2 7.5% 4.1
VNB 31.8 34.8 9.3% 3.0
InforceValue Creation
New SalesValue Creation
39
VNB 31.8 34.8 9.3% 3.0
VNB margin (VNB/FYP) 15.0% 18.2% 21.9% 3.3%
VNB margin (VNB/FYPE) 58.8% 59.8% 1.7% 1.0%
Multiplier 8.8 8.8 0.0% 0.0
Appraisal Value 577.2 703.6 21.9% 126.4
Outstanding shares (FHC) 10.2 10.2 0.0% 0.0
Embedded Value 28.9 38.7 33.9% 9.8
Appraisal Value 56.4 68.7 21.9% 12.4
Outstanding shares (Life) 3.6 4.4 20.6% 0.8
Embedded Value 81.1 90.0 11.1% 9.0
Appraisal Value 158.2 160.0 1.1% 1.8
Value per FHC share
Value per Life share
Value Creation
Appraisal Value (20 year NB)
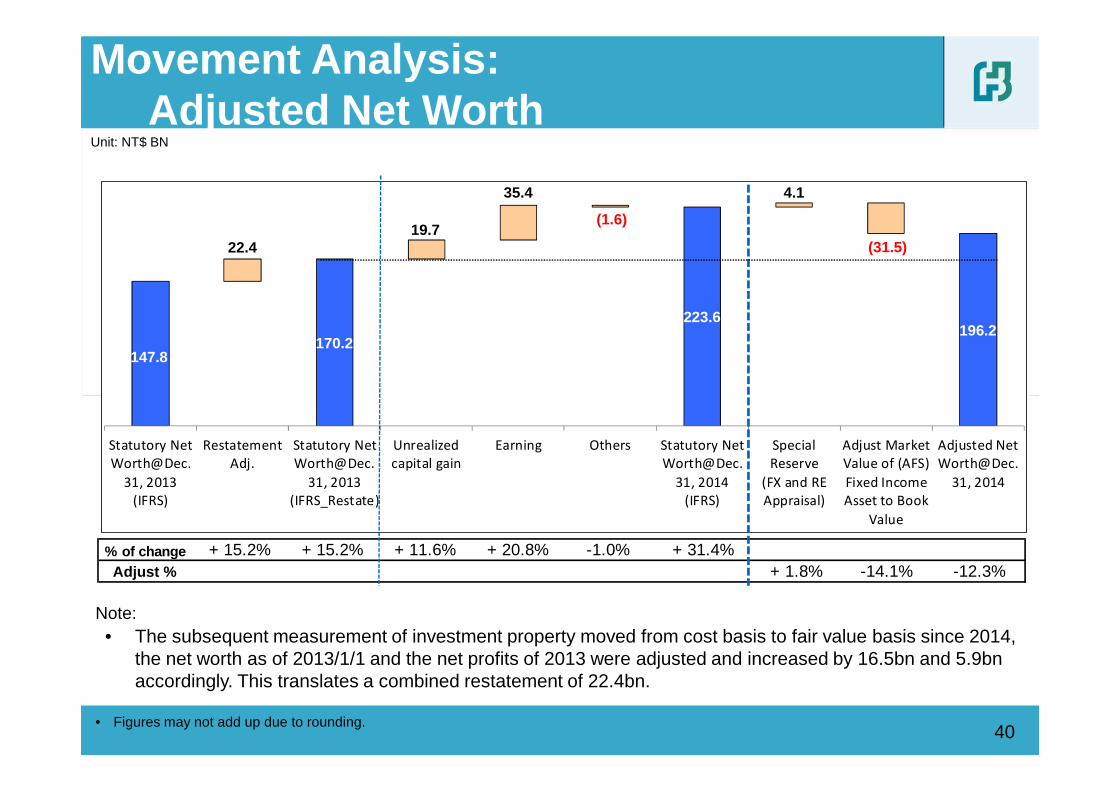
Movement Analysis: Adjusted Net Worth
Unit: NT$ BN
147.8
22.4
170.2
19.7
35.4
(1.6)
223.6
4.1
(31.5)
196.2
40
% of change + 15.2% + 15.2% + 11.6% + 20.8% -1.0% + 31.4%Adjust % + 1.8% -14.1% -12.3%
Statutory NetWorth@Dec.
31, 2013(IFRS)
RestatementAdj.
Statutory NetWorth@Dec.
31, 2013(IFRS_Restate)
Unrealizedcapital gain
Earning Others Statutory NetWorth@Dec.
31, 2014(IFRS)
SpecialReserve
(FX and REAppraisal)
Adjust MarketValue of (AFS)Fixed IncomeAsset to Book
Value
Adjusted NetWorth@Dec.
31, 2014
• Figures may not add up due to rounding.
Note:• The subsequent measurement of investment property moved from cost basis to fair value basis since 2014,
the net worth as of 2013/1/1 and the net profits of 2013 were adjusted and increased by 16.5bn and 5.9bn accordingly. This translates a combined restatement of 22.4bn.
229.9
(1.4) (24.6)
27.2
(0.3) (1.6)
2.5 1.3
40.5
273.6
50.0
100. 0
150. 0
200. 0
250. 0
300. 0
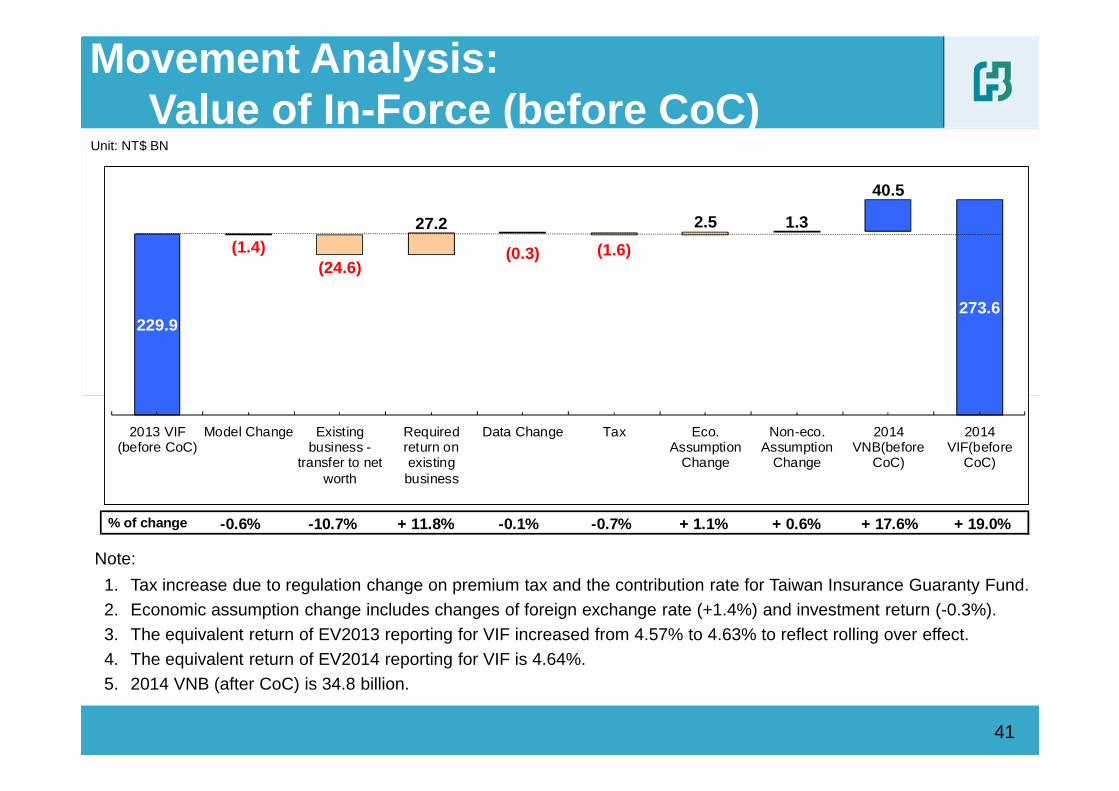
Movement Analysis:Value of In-Force (before CoC)
Unit: NT$ BN
% of change -0.6% -10.7% + 11.8% -0.1% -0.7% + 1.1% + 0.6% + 17.6% + 19.0%
- 50.0
0.0
2013 VIF(before CoC)
Model Change Existingbusiness -
transfer to networth
Requiredreturn onexistingbusiness
Data Change Tax Eco.Assumption
Change
Non-eco.Assumption
Change
2014VNB(before
CoC)
2014VIF(before
CoC)
41
Note:
1. Tax increase due to regulation change on premium tax and the contribution rate for Taiwan Insurance Guaranty Fund.2. Economic assumption change includes changes of foreign exchange rate (+1.4%) and investment return (-0.3%).3. The equivalent return of EV2013 reporting for VIF increased from 4.57% to 4.63% to reflect rolling over effect.4. The equivalent return of EV2014 reporting for VIF is 4.64%.5. 2014 VNB (after CoC) is 34.8 billion.
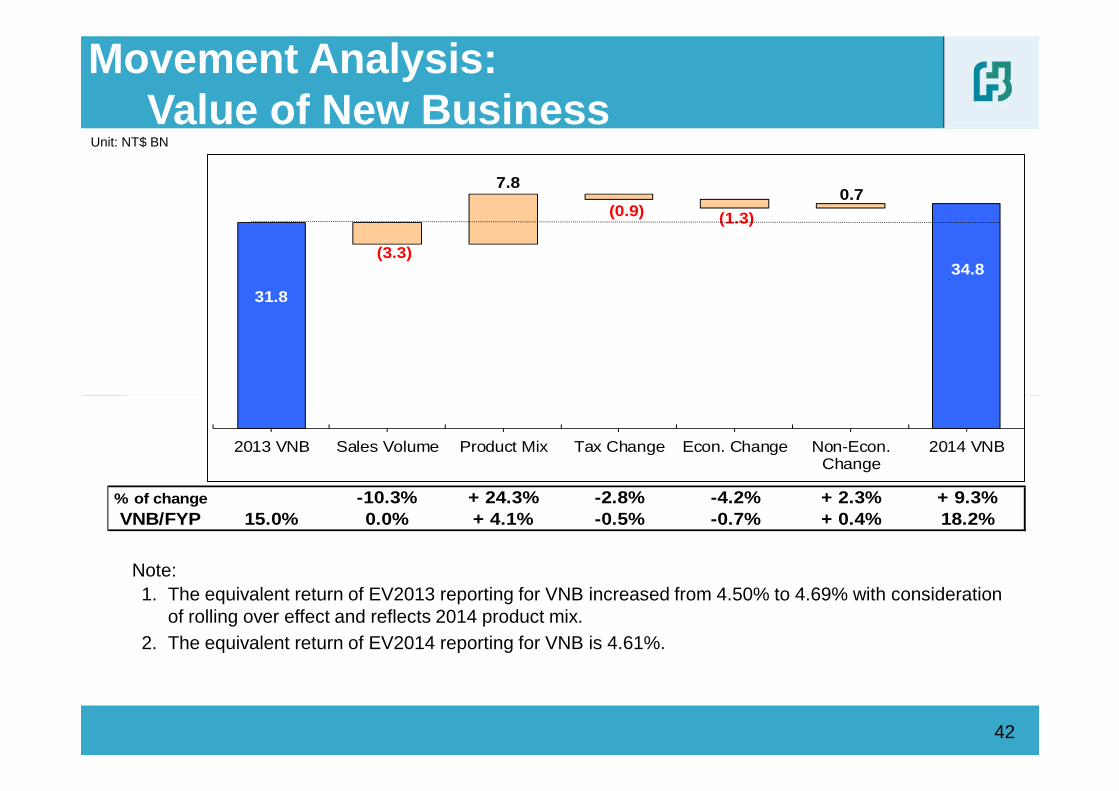
Movement Analysis: Value of New Business
Unit: NT$ BN
31.8
(3.3)
7.8
(0.9) (1.3)
0.7
34.8
6.0
8.0
10.0
12.0
14.0
16.0
18.0
20.0
22.0
24.0
26.0
28.0
30.0
32.0
34.0
36.0
38.0
40.0
42
% of change -10.3% + 24.3% -2.8% -4.2% + 2.3% + 9.3%VNB/FYP 15.0% 0.0% + 4.1% -0.5% -0.7% + 0.4% 18.2%
-8. 0
-6. 0
-4. 0
-2. 0
0.0
2.0
4.0
2013 VNB Sales Volume Product Mix Tax Change Econ. Change Non-Econ.Change
2014 VNB
Note:1. The equivalent return of EV2013 reporting for VNB increased from 4.50% to 4.69% with consideration
of rolling over effect and reflects 2014 product mix.2. The equivalent return of EV2014 reporting for VNB is 4.61%.
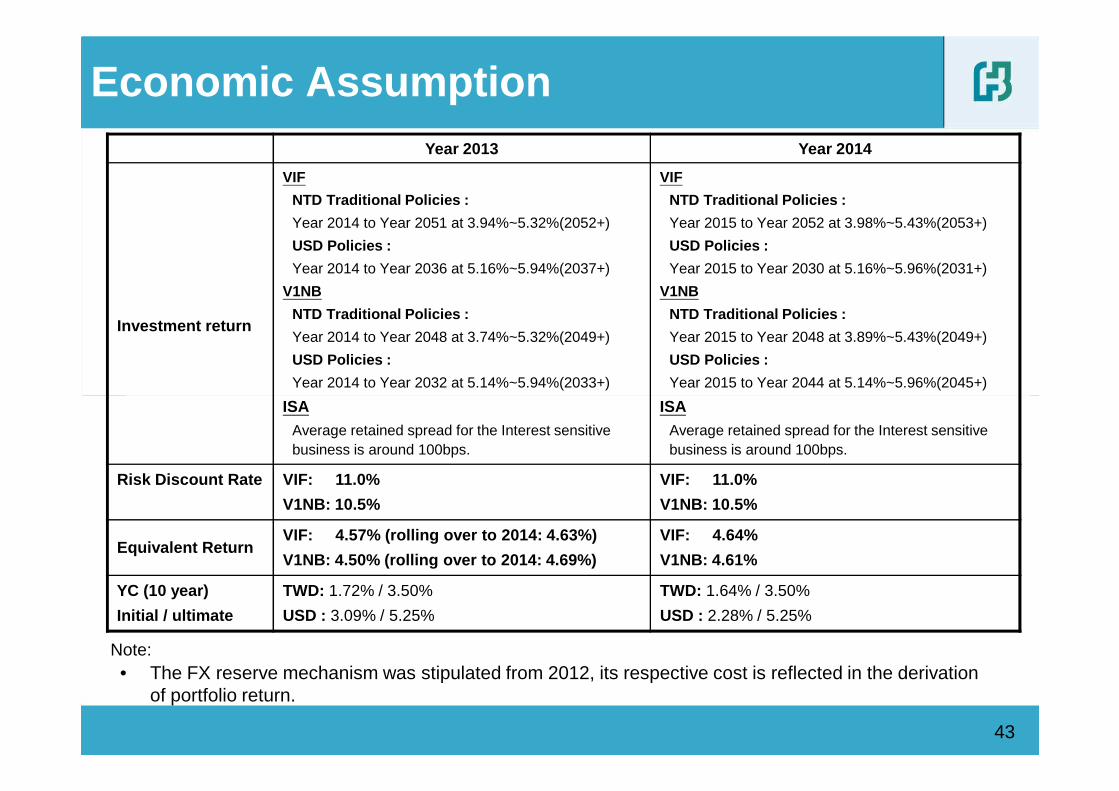
Economic AssumptionYear 2013 Year 2014
Investment return
VIF
NTD Traditional Policies :
Year 2014 to Year 2051 at 3.94%~5.32%(2052+)
USD Policies :
Year 2014 to Year 2036 at 5.16%~5.94%(2037+)
V1NB
NTD Traditional Policies :
Year 2014 to Year 2048 at 3.74%~5.32%(2049+)
USD Policies :
Year 2014 to Year 2032 at 5.14%~5.94%(2033+)
VIF
NTD Traditional Policies :
Year 2015 to Year 2052 at 3.98%~5.43%(2053+)
USD Policies :
Year 2015 to Year 2030 at 5.16%~5.96%(2031+)
V1NB
NTD Traditional Policies :
Year 2015 to Year 2048 at 3.89%~5.43%(2049+)
USD Policies :
Year 2015 to Year 2044 at 5.14%~5.96%(2045+)
43
ISAAverage retained spread for the Interest sensitive business is around 100bps.
ISAAverage retained spread for the Interest sensitive business is around 100bps.
Risk Discount Rate VIF: 11.0%
V1NB: 10.5%
VIF: 11.0%
V1NB: 10.5%
Equivalent ReturnVIF: 4.57% (rolling over to 2014: 4.63%)
V1NB: 4.50% (rolling over to 2014: 4.69%)
VIF: 4.64%
V1NB: 4.61%
YC (10 year)
Initial / ultimate
TWD: 1.72% / 3.50%
USD : 3.09% / 5.25%
TWD: 1.64% / 3.50%
USD : 2.28% / 5.25%
Note:• The FX reserve mechanism was stipulated from 2012, its respective cost is reflected in the derivation
of portfolio return.
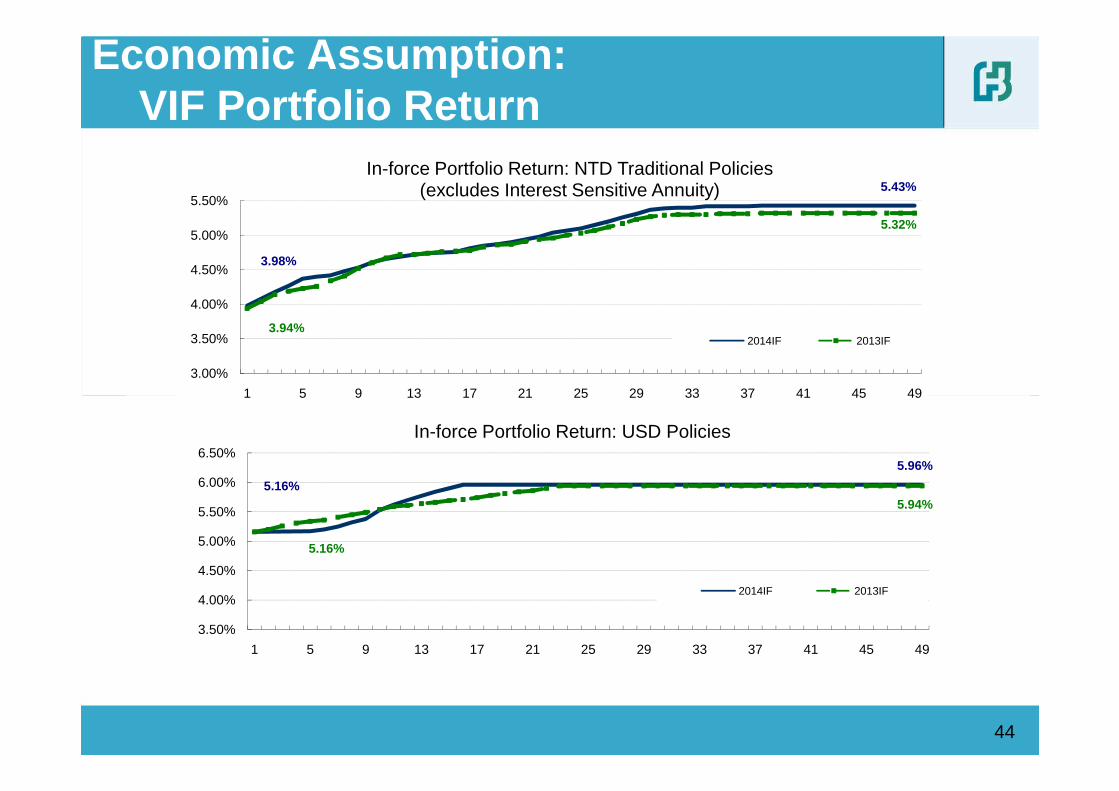
Economic Assumption:VIF Portfolio Return
3.98%
5.43%
3.94%
5.32%
3.00%
3.50%
4.00%
4.50%
5.00%
5.50%
1 5 9 13 17 21 25 29 33 37 41 45 49
In-force Portfolio Return: NTD Traditional Policies(excludes Interest Sensitive Annuity)
2014IF 2013IF
44
1 5 9 13 17 21 25 29 33 37 41 45 49
5.16%
5.96%
5.16%
5.94%
3.50%
4.00%
4.50%
5.00%
5.50%
6.00%
6.50%
1 5 9 13 17 21 25 29 33 37 41 45 49
In-force Portfolio Return: USD Policies
2014IF 2013IF
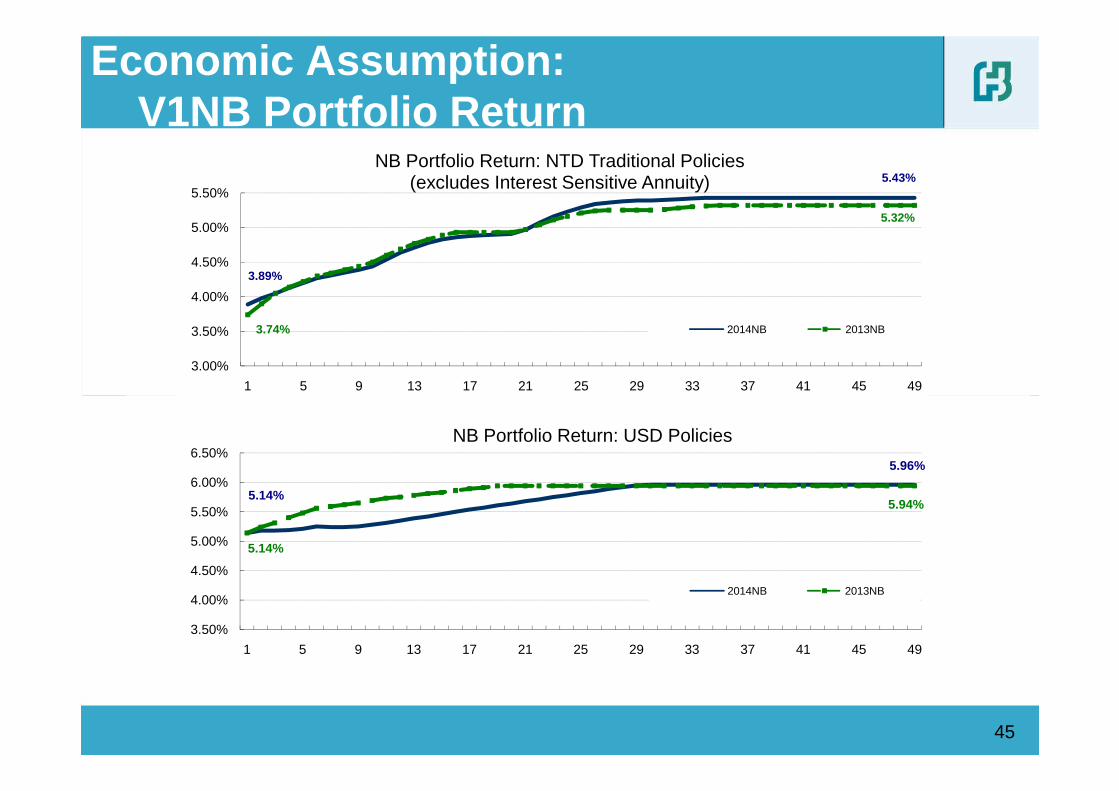
Economic Assumption:V1NB Portfolio Return
3.89%
5.43%
3.74%
5.32%
3.00%
3.50%
4.00%
4.50%
5.00%
5.50%
1 5 9 13 17 21 25 29 33 37 41 45 49
NB Portfolio Return: NTD Traditional Policies(excludes Interest Sensitive Annuity)
2014NB 2013NB
45
5.14%
5.96%
5.14%
5.94%
3.50%
4.00%
4.50%
5.00%
5.50%
6.00%
6.50%
1 5 9 13 17 21 25 29 33 37 41 45 49
NB Portfolio Return: USD Policies
2014NB 2013NB
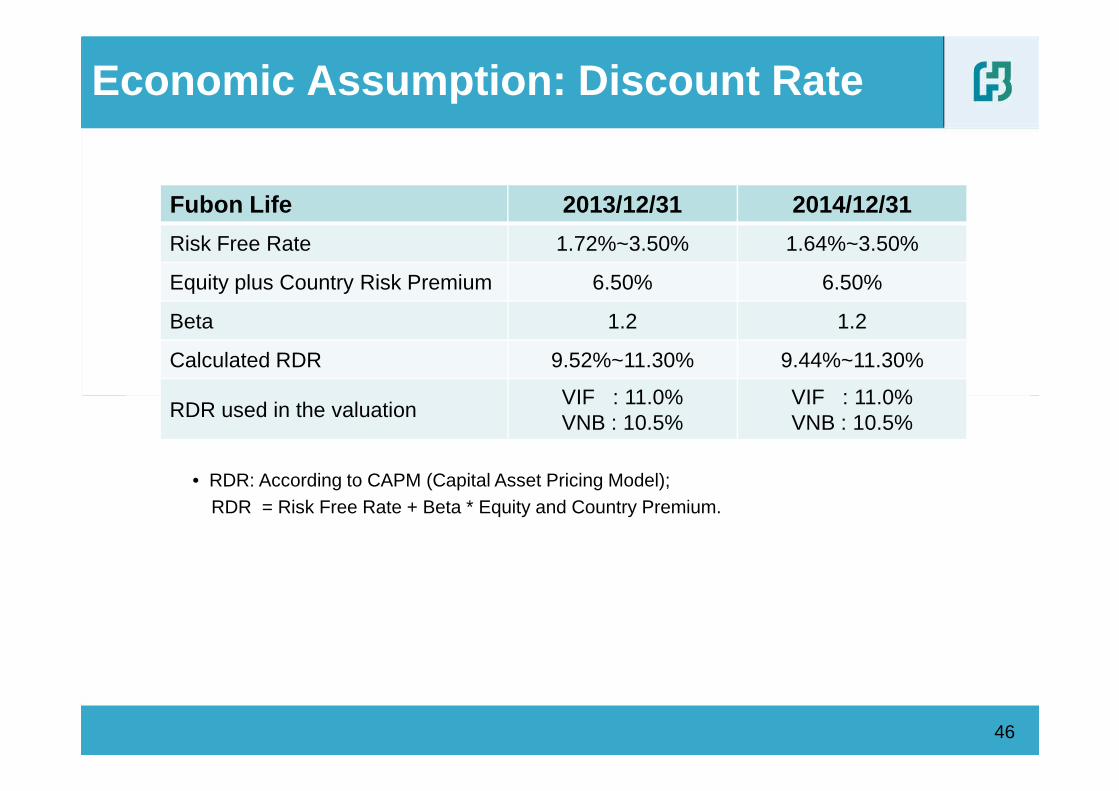
Economic Assumption: Discount Rate
Fubon Life 2013/12/31 2014/12/31
Risk Free Rate 1.72%~3.50% 1.64%~3.50%
Equity plus Country Risk Premium 6.50% 6.50%
Beta 1.2 1.2
Calculated RDR 9.52%~11.30% 9.44%~11.30%
VIF : 11.0% VIF : 11.0%
46
• RDR: According to CAPM (Capital Asset Pricing Model);RDR = Risk Free Rate + Beta * Equity and Country Premium.
RDR used in the valuationVIF : 11.0%VNB : 10.5%
VIF : 11.0%VNB : 10.5%
Cost of Capital
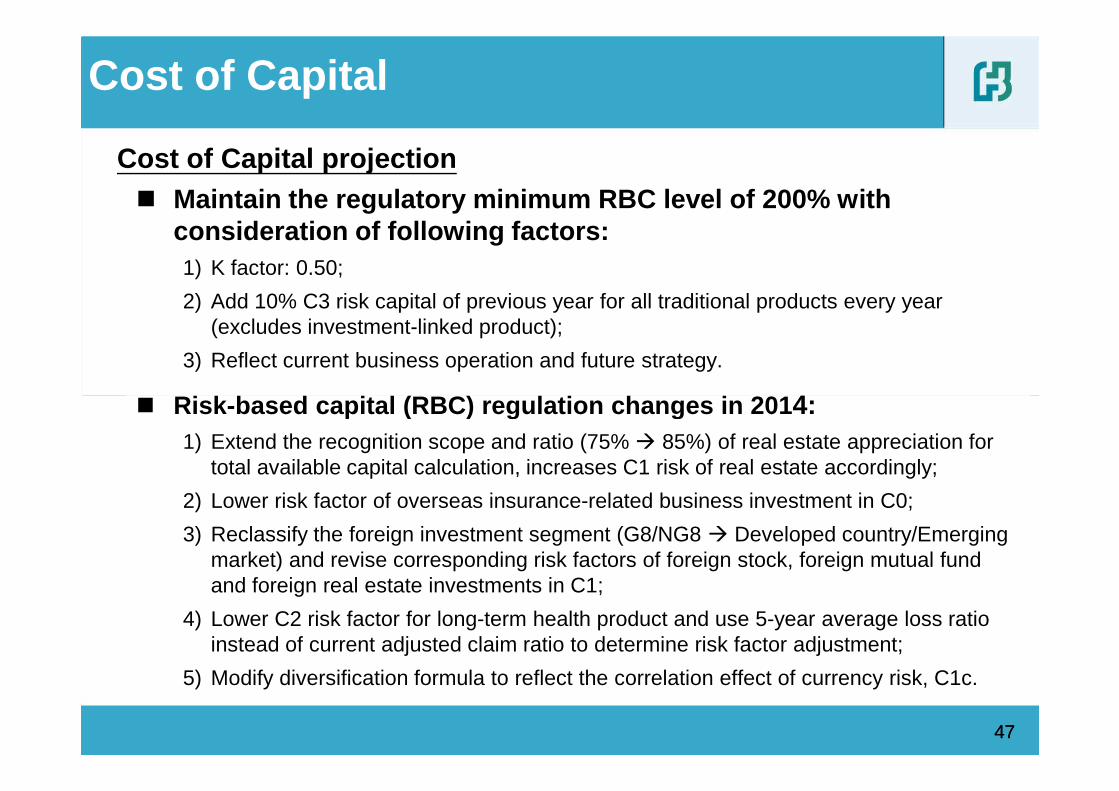
Cost of Capital projection� Maintain the regulatory minimum RBC level of 200% w ith
consideration of following factors: 1) K factor: 0.50;
2) Add 10% C3 risk capital of previous year for all traditional products every year (excludes investment-linked product);
3) Reflect current business operation and future strategy.
� Risk -based capital (RBC) regulation changes in 201 4:
47
� Risk -based capital (RBC) regulation changes in 201 4:1) Extend the recognition scope and ratio (75% � 85%) of real estate appreciation for
total available capital calculation, increases C1 risk of real estate accordingly;
2) Lower risk factor of overseas insurance-related business investment in C0;
3) Reclassify the foreign investment segment (G8/NG8 � Developed country/Emerging market) and revise corresponding risk factors of foreign stock, foreign mutual fund and foreign real estate investments in C1;
4) Lower C2 risk factor for long-term health product and use 5-year average loss ratio instead of current adjusted claim ratio to determine risk factor adjustment;
5) Modify diversification formula to reflect the correlation effect of currency risk, C1c.
47
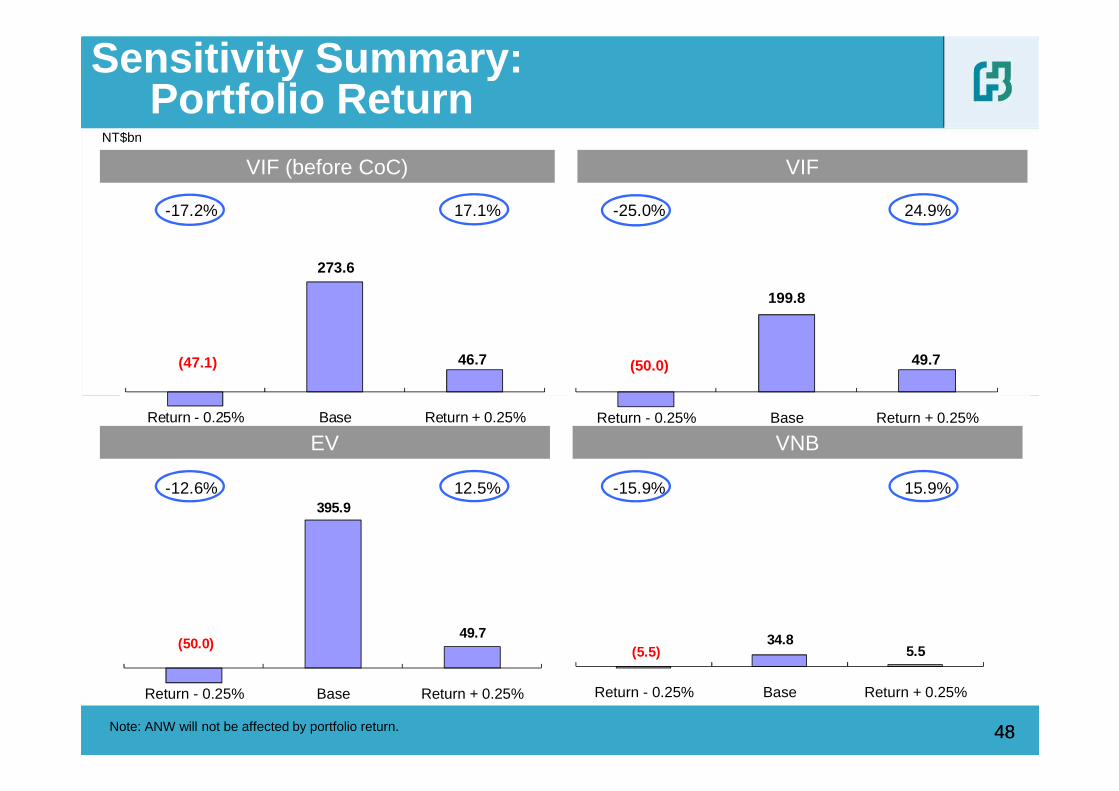
-17.2% 17.1% -25.0% 24.9%
(47.1)
273.6
46.7 (50.0)
199.8
49.7
Sensitivity Summary:Portfolio Return
VIF (before CoC) VIF
NT$bn
-12.6% 12.5% -15.9% 15.9%
Return - 0.25% Base Return + 0.25%
(50.0)
395.9
49.7
Return - 0.25% Base Return + 0.25%
Return - 0.25% Base Return + 0.25%
(5.5)34.8
5.5
Return - 0.25% Base Return + 0.25%
48Note: ANW will not be affected by portfolio return.
EV VNB
48
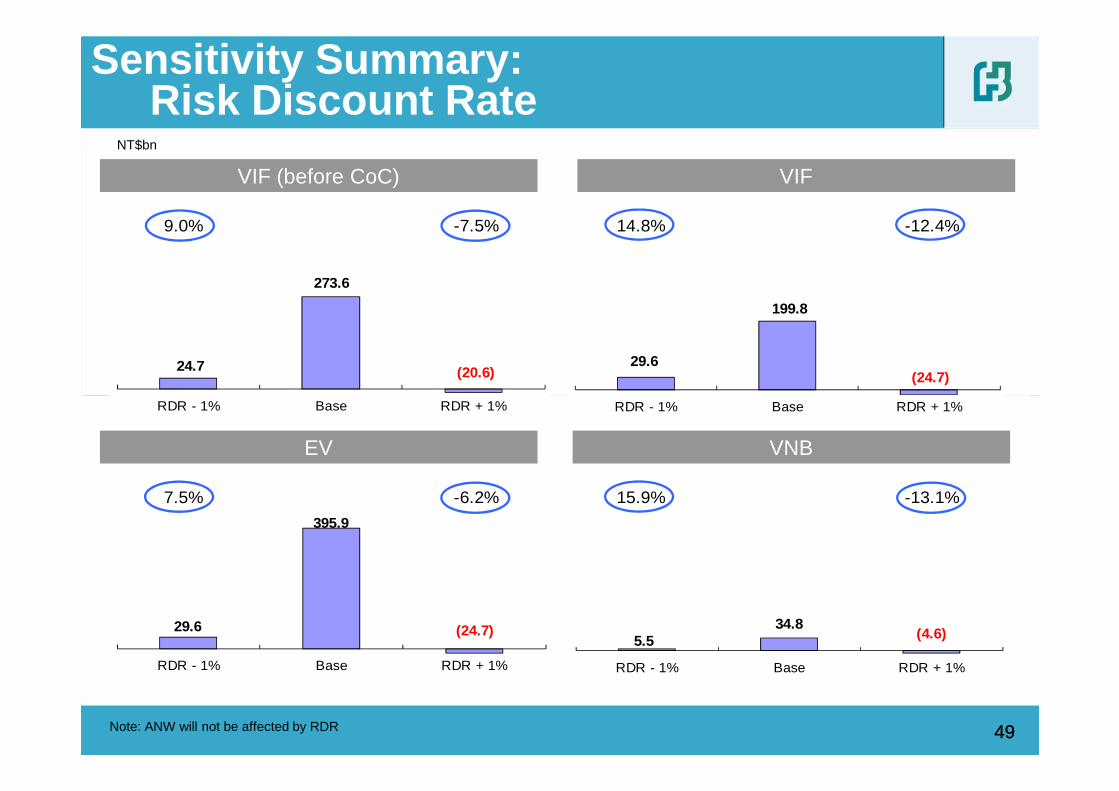
9.0% -7.5% 14.8% -12.4%
24.7
273.6
(20.6)29.6
199.8
(24.7)
VIF (before CoC) VIF
Sensitivity Summary: Risk Discount Rate
NT$bn
49
7.5% -6.2% 15.9% -13.1%
RDR - 1% Base RDR + 1%
29.6
395.9
(24.7)
RDR - 1% Base RDR + 1%
RDR - 1% Base RDR + 1%
5.5 34.8
(4.6)
RDR - 1% Base RDR + 1%
Note: ANW will not be affected by RDR
EV VNB
49
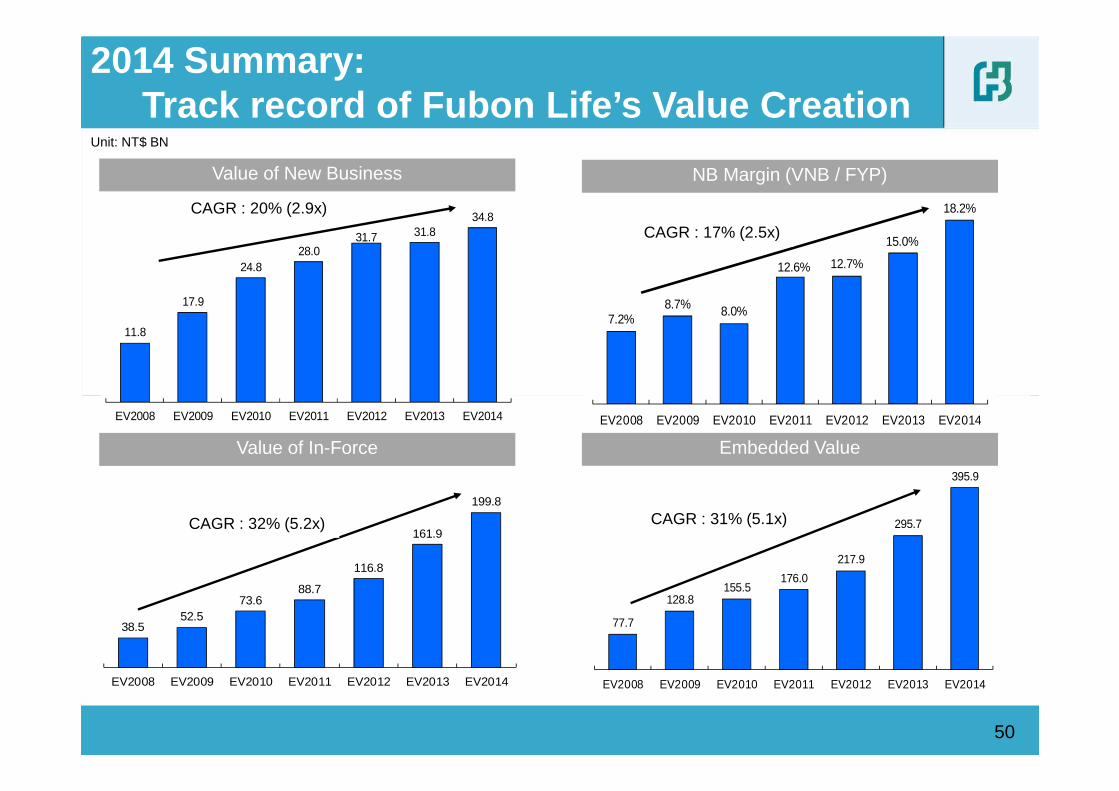
7.2%8.7% 8.0%
12.6% 12.7%
15.0%
18.2%
CAGR: 17%
Unit: NT$ BN
NB Margin (VNB / FYP)
11.8
17.9
24.8 28.0
31.7 31.8 34.8 CAGR: 20%
Value of New Business
CAGR : 20% (2.9x)
CAGR : 17% (2.5x)
2014 Summary: Track record of Fubon Life’s Value Creation
77.7
128.8 155.5
176.0
217.9
295.7
395.9
EV2008 EV2009 EV2010 EV2011 EV2012 EV2013 EV2014
CAGR: 31%
EV2008 EV2009 EV2010 EV2011 EV2012 EV2013 EV2014
50
EV2008 EV2009 EV2010 EV2011 EV2012 EV2013 EV2014
38.5 52.5
73.6 88.7
116.8
161.9
199.8
EV2008 EV2009 EV2010 EV2011 EV2012 EV2013 EV2014
CAGR: 32%
Value of In-Force Embedded Value
CAGR : 32% (5.2x) CAGR : 31% (5.1x)
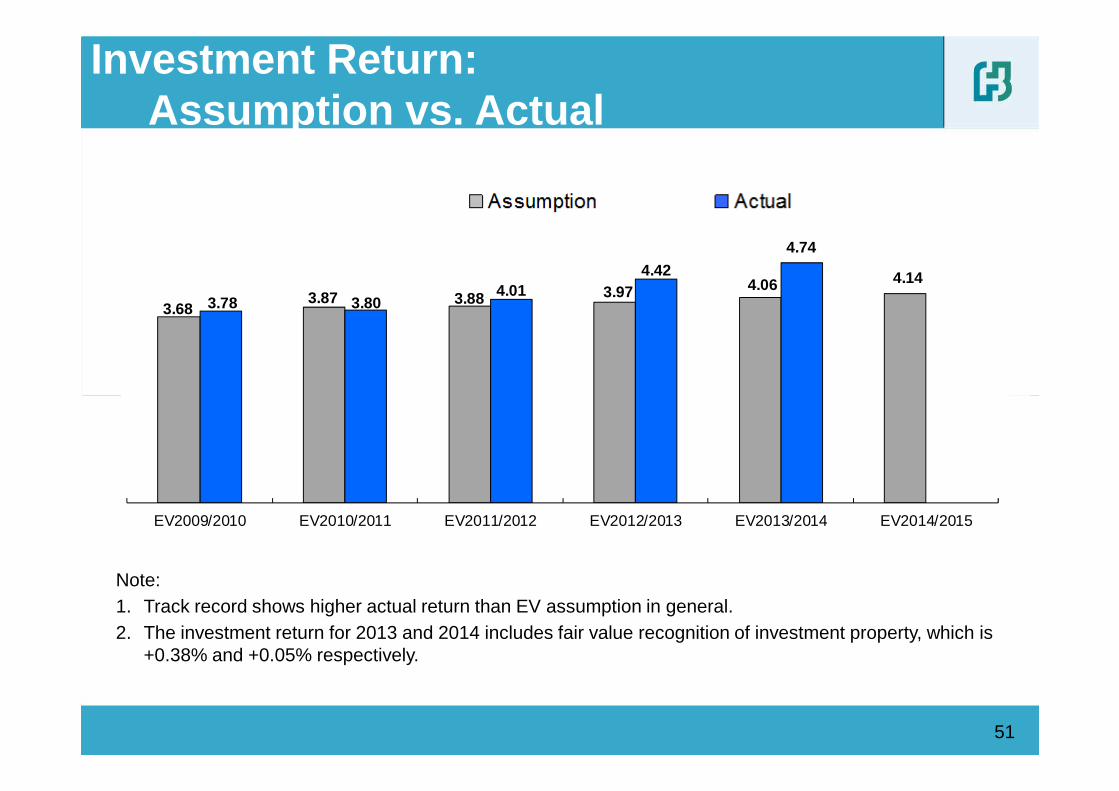
Investment Return:Assumption vs. Actual
3.68 3.87 3.88 3.97 4.06 4.14
3.78 3.80 4.01
4.42
4.74
51
Note:1. Track record shows higher actual return than EV assumption in general.2. The investment return for 2013 and 2014 includes fair value recognition of investment property, which is
+0.38% and +0.05% respectively.
EV2009/2010 EV2010/2011 EV2011/2012 EV2012/2013 EV2013/2014 EV2014/2015
Independent Review by Deloitte Consulting
Deloitte ConsultingThe Engagement• Deloitte Consulting (Hong Kong) Limited (“Deloitte Consulting”) were retained by Fubon Life to perform an
independent review of the Embedded Value (EV) as at 31 December 2014 and the Value of One Year’s NewBusiness (V1NB) written over the period of 1 January 2014 to 31 December 2014.
Scope of Deloitte Consulting’s Involvement• Review and opine on the reasonableness of the EV and V1NB as calculated by the Company;
• Review of the reasonableness of the assumptions used in the calculations, taking into consideration both theCompany’s recent experience and the experience of the Taiwanese life insurance market;
5252
Company’s recent experience and the experience of the Taiwanese life insurance market;
• Review, at a high-level, model changes to the actuarial projection model since the previous valuation date;• Review of the Company’s projection approach of the Cost of Capital;• Review of the data put through the model compared to the policy data on the Company’s policy
administration systems to judge the extent to which the business has been valued in the financial model and to identify the portion (if any) omitted and how that was valued;
• Review of the approach used to determine the Adjusted Net Worth (“ANW”), in particular, the adjustments made in deriving the ANW, and any other adjustments made outside of the actuarial projection model;
• Review of the Company's analysis of change in the Value of In-Force Business (“VIF”) between 31 December 2013 and 31 December 2014.
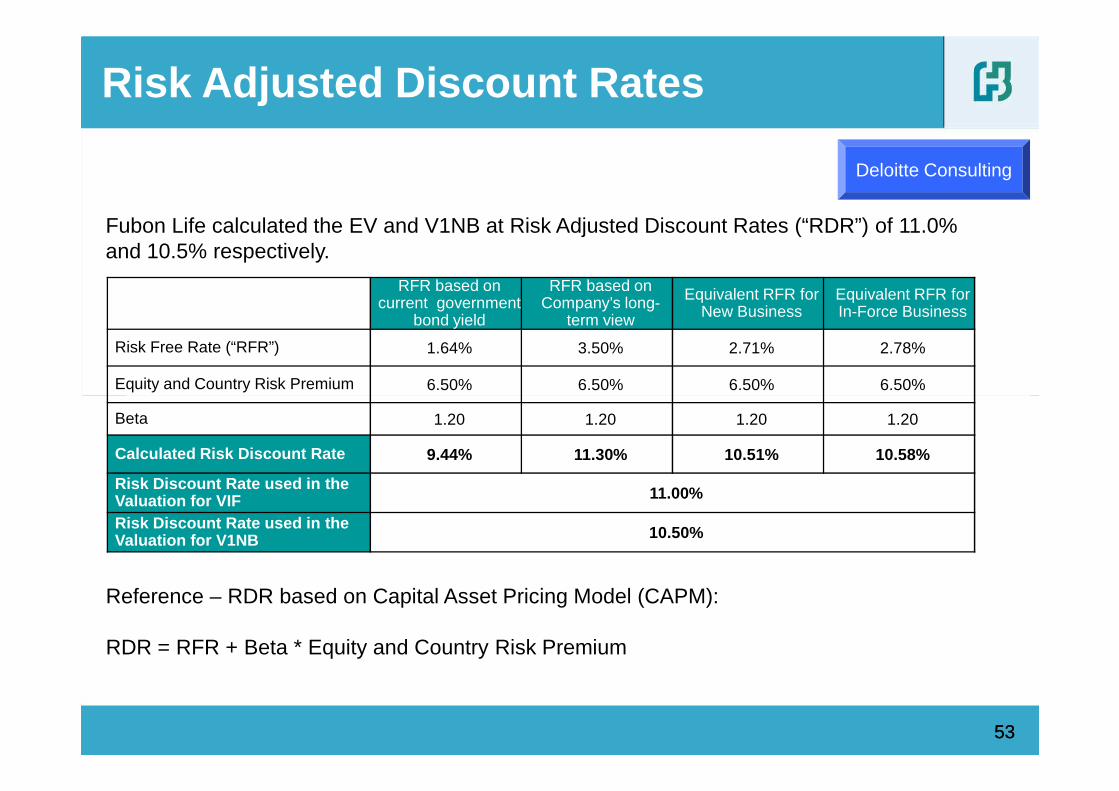
Risk Adjusted Discount Rates
Fubon Life calculated the EV and V1NB at Risk Adjusted Discount Rates (“RDR”) of 11.0% and 10.5% respectively.
RFR based on current government
bond yield
RFR based on Company’s long-
term view
Equivalent RFR for New Business
Equivalent RFR for In-Force Business
Risk Free Rate (“RFR”) 1.64% 3.50% 2.71% 2.78%
Equity and Country Risk Premium 6.50% 6.50% 6.50% 6.50%
Deloitte Consulting
5353
Beta 1.20 1.20 1.20 1.20
Calculated Risk Discount Rate 9.44% 11.30% 10.51% 10.58%
Risk Discount Rate used in the Valuation for VIF 11.00%
Risk Discount Rate used in the Valuation for V1NB 10.50%
Reference – RDR based on Capital Asset Pricing Model (CAPM):
RDR = RFR + Beta * Equity and Country Risk Premium
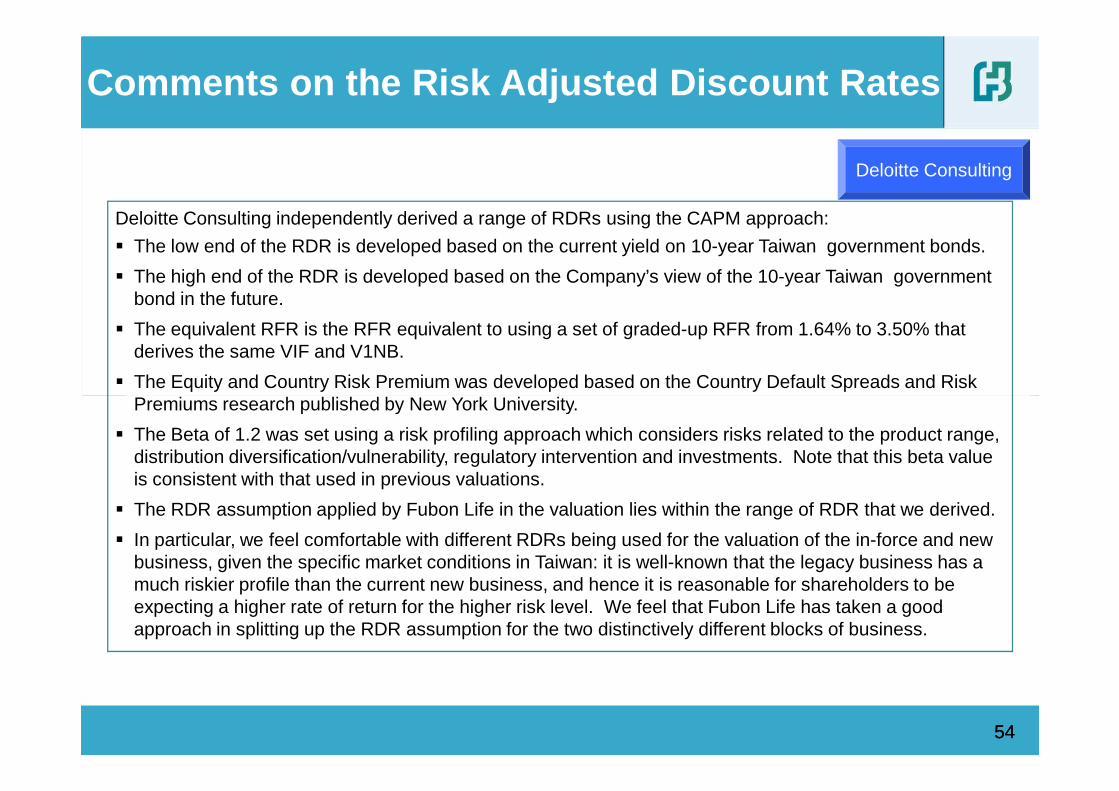
Comments on the Risk Adjusted Discount Rates
Deloitte Consulting independently derived a range of RDRs using the CAPM approach:
� The low end of the RDR is developed based on the current yield on 10-year Taiwan government bonds.
� The high end of the RDR is developed based on the Company’s view of the 10-year Taiwan government bond in the future.
� The equivalent RFR is the RFR equivalent to using a set of graded-up RFR from 1.64% to 3.50% that derives the same VIF and V1NB.
� The Equity and Country Risk Premium was developed based on the Country Default Spreads and Risk Premiums research published by New York University.
Deloitte Consulting
5454
Premiums research published by New York University.
� The Beta of 1.2 was set using a risk profiling approach which considers risks related to the product range, distribution diversification/vulnerability, regulatory intervention and investments. Note that this beta value is consistent with that used in previous valuations.
� The RDR assumption applied by Fubon Life in the valuation lies within the range of RDR that we derived.
� In particular, we feel comfortable with different RDRs being used for the valuation of the in-force and new business, given the specific market conditions in Taiwan: it is well-known that the legacy business has a much riskier profile than the current new business, and hence it is reasonable for shareholders to be expecting a higher rate of return for the higher risk level. We feel that Fubon Life has taken a good approach in splitting up the RDR assumption for the two distinctively different blocks of business.
Comments on Investment Return (1)
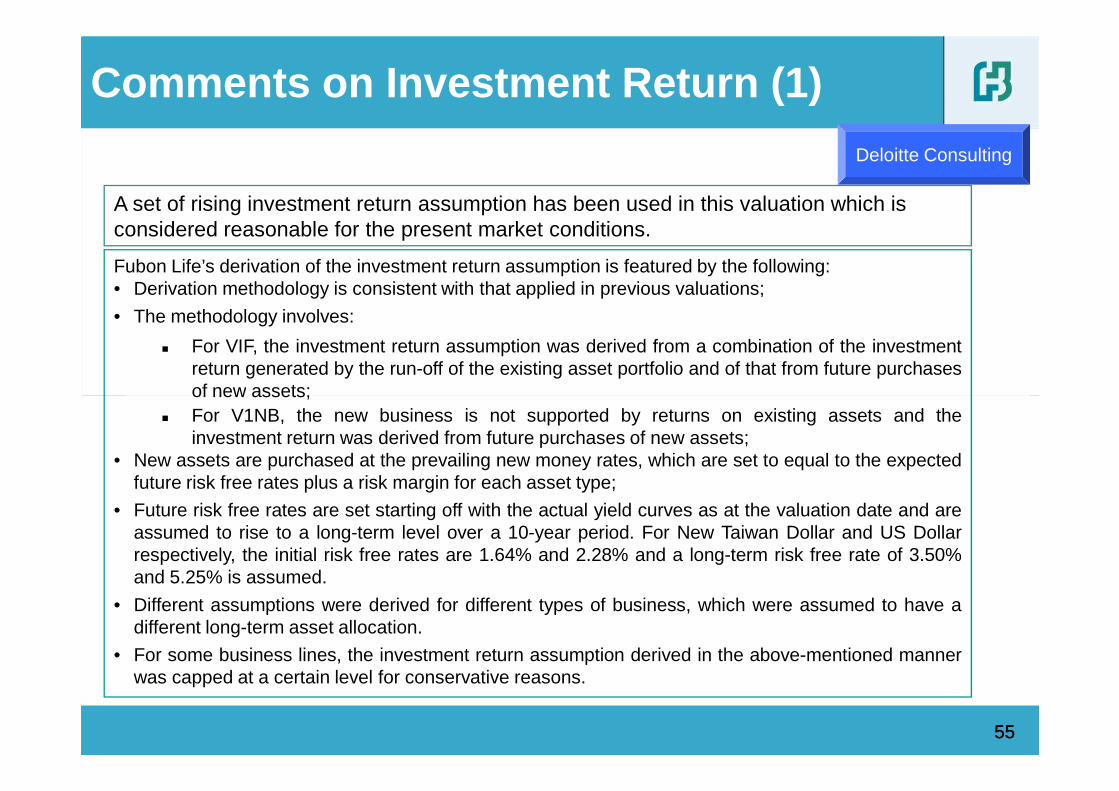
A set of rising investment return assumption has been used in this valuation which is considered reasonable for the present market conditions.
Fubon Life’s derivation of the investment return assumption is featured by the following:• Derivation methodology is consistent with that applied in previous valuations;
• The methodology involves:
� For VIF, the investment return assumption was derived from a combination of the investmentreturn generated by the run-off of the existing asset portfolio and of that from future purchasesof new assets;
Deloitte Consulting
5555
of new assets;� For V1NB, the new business is not supported by returns on existing assets and the
investment return was derived from future purchases of new assets;• New assets are purchased at the prevailing new money rates, which are set to equal to the expected
future risk free rates plus a risk margin for each asset type;
• Future risk free rates are set starting off with the actual yield curves as at the valuation date and areassumed to rise to a long-term level over a 10-year period. For New Taiwan Dollar and US Dollarrespectively, the initial risk free rates are 1.64% and 2.28% and a long-term risk free rate of 3.50%and 5.25% is assumed.
• Different assumptions were derived for different types of business, which were assumed to have adifferent long-term asset allocation.
• For some business lines, the investment return assumption derived in the above-mentioned mannerwas capped at a certain level for conservative reasons.
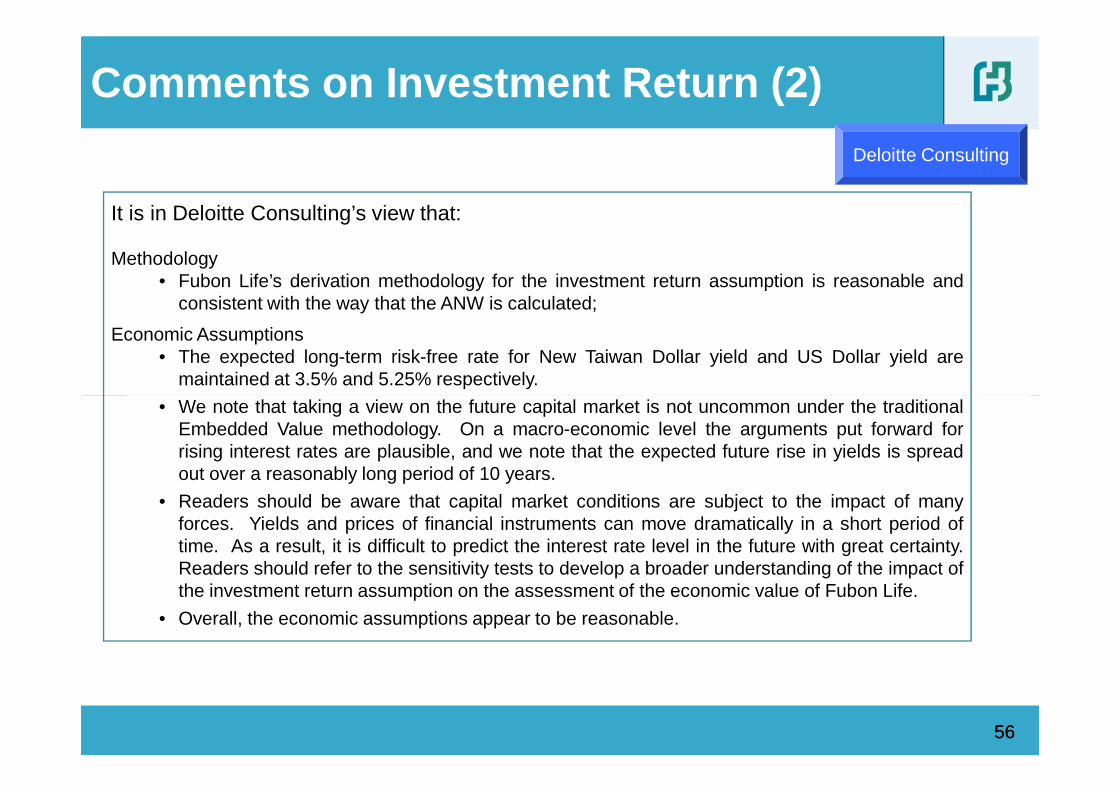
Comments on Investment Return (2)
It is in Deloitte Consulting’s view that:
Methodology• Fubon Life’s derivation methodology for the investment return assumption is reasonable and
consistent with the way that the ANW is calculated;
Economic Assumptions• The expected long-term risk-free rate for New Taiwan Dollar yield and US Dollar yield are
maintained at 3.5% and 5.25% respectively.
Deloitte Consulting
5656
• We note that taking a view on the future capital market is not uncommon under the traditionalEmbedded Value methodology. On a macro-economic level the arguments put forward forrising interest rates are plausible, and we note that the expected future rise in yields is spreadout over a reasonably long period of 10 years.
• Readers should be aware that capital market conditions are subject to the impact of manyforces. Yields and prices of financial instruments can move dramatically in a short period oftime. As a result, it is difficult to predict the interest rate level in the future with great certainty.Readers should refer to the sensitivity tests to develop a broader understanding of the impact ofthe investment return assumption on the assessment of the economic value of Fubon Life.
• Overall, the economic assumptions appear to be reasonable.
Comments on Non-Economic Assumptions
Non - Economic Assumptions• The non-economic assumptions reflect Fubon Life’s best estimate of future operating
experience, and are appropriately supported by the company’s historical operating experience.
Deloitte Consulting
5757
Comments on EV and V1NB Results
Deloitte Consulting have reviewed the Embedded Value and Value of OneYear’s New Business results at a high-level under the generally acceptedmethod for calculating traditional embedded values in Taiwan:
• Review of the changes in the VIF relative to the assumption changes and modelchanges from 2013 to 2014;
• Review of the changes in the new business profit margin relative to that in 2013 based
Deloitte Consulting
5858
• Review of the changes in the new business profit margin relative to that in 2013 basedon information on changes in sales mix, sales volume and valuation assumptions;
• Review of the sensitivities relative to the base case results.
The Embedded Value and Value of One Year’s New Business results appear tobe reasonable within the above context.Deloitte Consulting’s detailed opinion can be found in their opinion letter.

Thank you
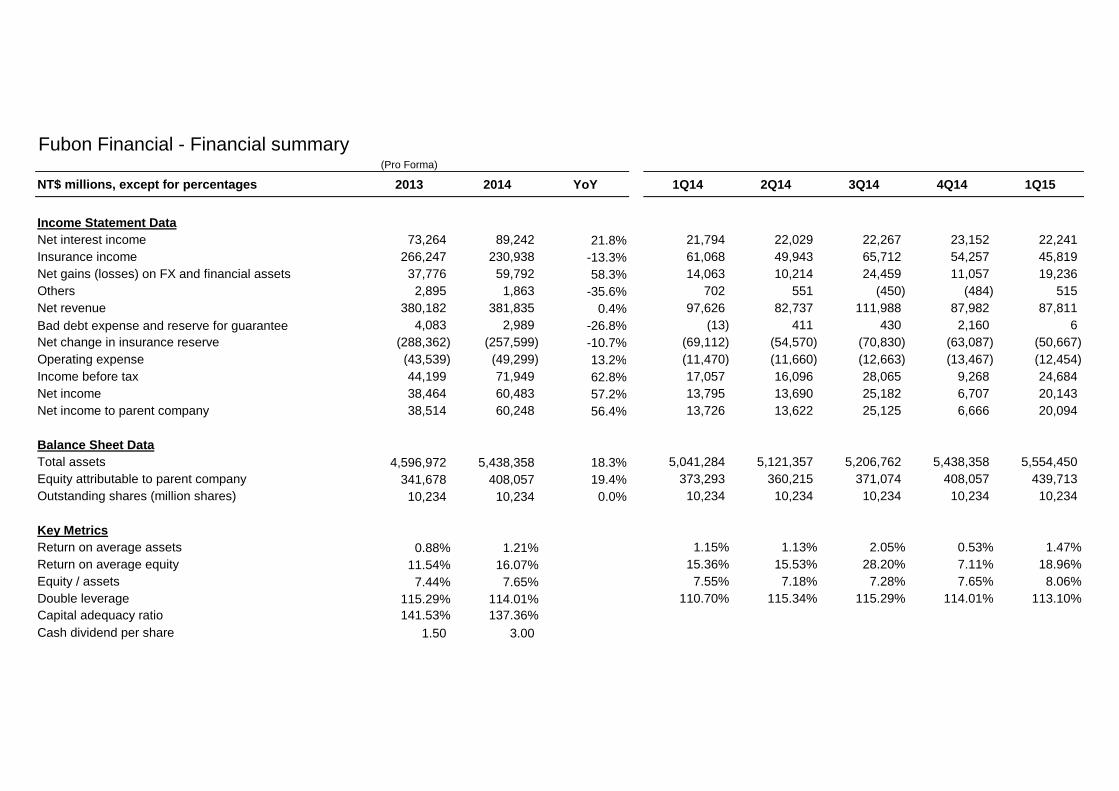
Fubon Financial - Financial summary(Pro Forma)
NT$ millions, except for percentages 2013 2014 YoY 1Q14 2Q14 3Q14 4Q14 1Q15
Income Statement DataNet interest income 73,264 89,242 21.8% 21,794 22,029 22,267 23,152 22,241Insurance income 266,247 230,938 -13.3% 61,068 49,943 65,712 54,257 45,819Net gains (losses) on FX and financial assets 37,776 59,792 58.3% 14,063 10,214 24,459 11,057 19,236Others 2,895 1,863 -35.6% 702 551 (450) (484) 515Net revenue 380,182 381,835 0.4% 97,626 82,737 111,988 87,982 87,811Bad debt expense and reserve for guarantee 4,083 2,989 -26.8% (13) 411 430 2,160 6Net change in insurance reserve (288,362) (257,599) -10.7% (69,112) (54,570) (70,830) (63,087) (50,667)Operating expense (43,539) (49,299) 13.2% (11,470) (11,660) (12,663) (13,467) (12,454)Operating expense (43,539) (49,299) 13.2% (11,470) (11,660) (12,663) (13,467) (12,454)Income before tax 44,199 71,949 62.8% 17,057 16,096 28,065 9,268 24,684Net income 38,464 60,483 57.2% 13,795 13,690 25,182 6,707 20,143Net income to parent company 38,514 60,248 56.4% 13,726 13,622 25,125 6,666 20,094
Balance Sheet DataTotal assets 4,596,972 5,438,358 18.3% 5,041,284 5,121,357 5,206,762 5,438,358 5,554,450Equity attributable to parent company 341,678 408,057 19.4% 373,293 360,215 371,074 408,057 439,713Outstanding shares (million shares) 10,234 10,234 0.0% 10,234 10,234 10,234 10,234 10,234
Key MetricsReturn on average assets 0.88% 1.21% 1.15% 1.13% 2.05% 0.53% 1.47%Return on average equity 11.54% 16.07% 15.36% 15.53% 28.20% 7.11% 18.96%Equity / assets 7.44% 7.65% 7.55% 7.18% 7.28% 7.65% 8.06%Double leverage 115.29% 114.01% 110.70% 115.34% 115.29% 114.01% 113.10%Capital adequacy ratio 141.53% 137.36%Cash dividend per share 1.50 3.00
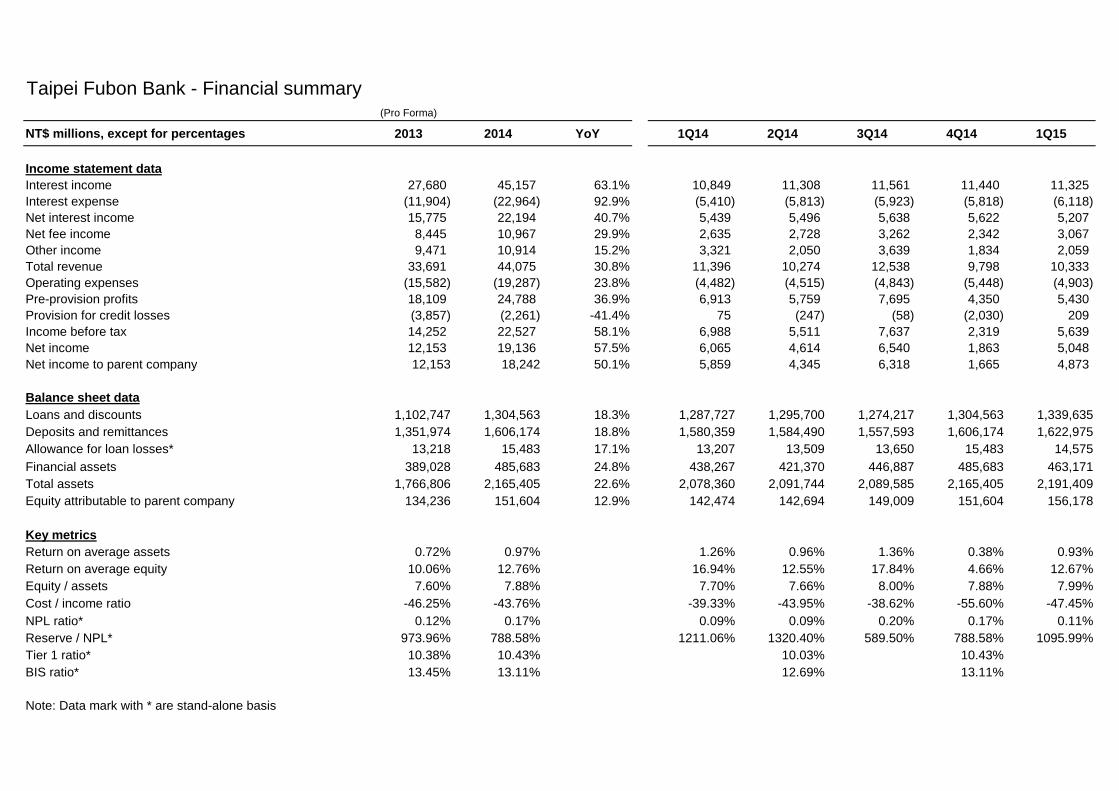
Taipei Fubon Bank - Financial summary(Pro Forma)
NT$ millions, except for percentages 2013 2014 YoY 1Q14 2Q14 3Q14 4Q14 1Q15
Income statement dataInterest income 27,680 45,157 63.1% 10,849 11,308 11,561 11,440 11,325Interest expense (11,904) (22,964) 92.9% (5,410) (5,813) (5,923) (5,818) (6,118)Net interest income 15,775 22,194 40.7% 5,439 5,496 5,638 5,622 5,207Net fee income 8,445 10,967 29.9% 2,635 2,728 3,262 2,342 3,067Other income 9,471 10,914 15.2% 3,321 2,050 3,639 1,834 2,059Total revenue 33,691 44,075 30.8% 11,396 10,274 12,538 9,798 10,333Operating expenses (15,582) (19,287) 23.8% (4,482) (4,515) (4,843) (5,448) (4,903)Pre-provision profits 18,109 24,788 36.9% 6,913 5,759 7,695 4,350 5,430Provision for credit losses (3,857) (2,261) -41.4% 75 (247) (58) (2,030) 209Income before tax 14,252 22,527 58.1% 6,988 5,511 7,637 2,319 5,639Net income 12,153 19,136 57.5% 6,065 4,614 6,540 1,863 5,048Net income to parent company 12,153 18,242 50.1% 5,859 4,345 6,318 1,665 4,873Net income to parent company 12,153 18,242 50.1% 5,859 4,345 6,318 1,665 4,873
Balance sheet dataLoans and discounts 1,102,747 1,304,563 18.3% 1,287,727 1,295,700 1,274,217 1,304,563 1,339,635Deposits and remittances 1,351,974 1,606,174 18.8% 1,580,359 1,584,490 1,557,593 1,606,174 1,622,975Allowance for loan losses* 13,218 15,483 17.1% 13,207 13,509 13,650 15,483 14,575Financial assets 389,028 485,683 24.8% 438,267 421,370 446,887 485,683 463,171Total assets 1,766,806 2,165,405 22.6% 2,078,360 2,091,744 2,089,585 2,165,405 2,191,409Equity attributable to parent company 134,236 151,604 12.9% 142,474 142,694 149,009 151,604 156,178
Key metricsReturn on average assets 0.72% 0.97% 1.26% 0.96% 1.36% 0.38% 0.93%Return on average equity 10.06% 12.76% 16.94% 12.55% 17.84% 4.66% 12.67%Equity / assets 7.60% 7.88% 7.70% 7.66% 8.00% 7.88% 7.99%Cost / income ratio -46.25% -43.76% -39.33% -43.95% -38.62% -55.60% -47.45%NPL ratio* 0.12% 0.17% 0.09% 0.09% 0.20% 0.17% 0.11%Reserve / NPL* 973.96% 788.58% 1211.06% 1320.40% 589.50% 788.58% 1095.99%Tier 1 ratio* 10.38% 10.43% 10.03% 10.43%BIS ratio* 13.45% 13.11% 12.69% 13.11%
Note: Data mark with * are stand-alone basis
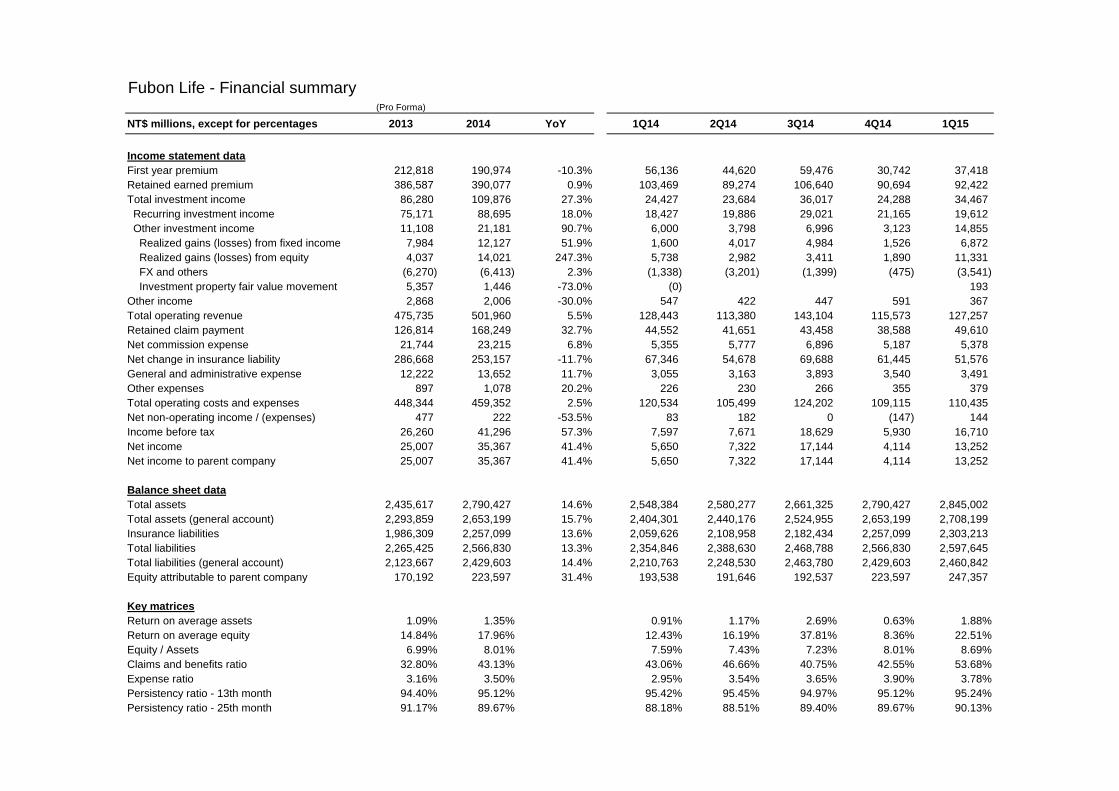
Fubon Life - Financial summary(Pro Forma)
NT$ millions, except for percentages 2013 2014 YoY 1Q14 2Q14 3Q14 4Q14 1Q15
Income statement dataFirst year premium 212,818 190,974 -10.3% 56,136 44,620 59,476 30,742 37,418Retained earned premium 386,587 390,077 0.9% 103,469 89,274 106,640 90,694 92,422Total investment income 86,280 109,876 27.3% 24,427 23,684 36,017 24,288 34,467 Recurring investment income 75,171 88,695 18.0% 18,427 19,886 29,021 21,165 19,612 Other investment income 11,108 21,181 90.7% 6,000 3,798 6,996 3,123 14,855 Realized gains (losses) from fixed income 7,984 12,127 51.9% 1,600 4,017 4,984 1,526 6,872 Realized gains (losses) from equity 4,037 14,021 247.3% 5,738 2,982 3,411 1,890 11,331 FX and others (6,270) (6,413) 2.3% (1,338) (3,201) (1,399) (475) (3,541) Investment property fair value movement 5,357 1,446 -73.0% (0) 193Other income 2,868 2,006 -30.0% 547 422 447 591 367Total operating revenue 475,735 501,960 5.5% 128,443 113,380 143,104 115,573 127,257Retained claim payment 126,814 168,249 32.7% 44,552 41,651 43,458 38,588 49,610Net commission expense 21,744 23,215 6.8% 5,355 5,777 6,896 5,187 5,378Net change in insurance liability 286,668 253,157 -11.7% 67,346 54,678 69,688 61,445 51,576Net change in insurance liability 286,668 253,157 -11.7% 67,346 54,678 69,688 61,445 51,576General and administrative expense 12,222 13,652 11.7% 3,055 3,163 3,893 3,540 3,491Other expenses 897 1,078 20.2% 226 230 266 355 379Total operating costs and expenses 448,344 459,352 2.5% 120,534 105,499 124,202 109,115 110,435Net non-operating income / (expenses) 477 222 -53.5% 83 182 0 (147) 144Income before tax 26,260 41,296 57.3% 7,597 7,671 18,629 5,930 16,710Net income 25,007 35,367 41.4% 5,650 7,322 17,144 4,114 13,252Net income to parent company 25,007 35,367 41.4% 5,650 7,322 17,144 4,114 13,252
Balance sheet dataTotal assets 2,435,617 2,790,427 14.6% 2,548,384 2,580,277 2,661,325 2,790,427 2,845,002Total assets (general account) 2,293,859 2,653,199 15.7% 2,404,301 2,440,176 2,524,955 2,653,199 2,708,199Insurance liabilities 1,986,309 2,257,099 13.6% 2,059,626 2,108,958 2,182,434 2,257,099 2,303,213Total liabilities 2,265,425 2,566,830 13.3% 2,354,846 2,388,630 2,468,788 2,566,830 2,597,645Total liabilities (general account) 2,123,667 2,429,603 14.4% 2,210,763 2,248,530 2,463,780 2,429,603 2,460,842Equity attributable to parent company 170,192 223,597 31.4% 193,538 191,646 192,537 223,597 247,357
Key matricesReturn on average assets 1.09% 1.35% 0.91% 1.17% 2.69% 0.63% 1.88%Return on average equity 14.84% 17.96% 12.43% 16.19% 37.81% 8.36% 22.51%Equity / Assets 6.99% 8.01% 7.59% 7.43% 7.23% 8.01% 8.69%Claims and benefits ratio 32.80% 43.13% 43.06% 46.66% 40.75% 42.55% 53.68%Expense ratio 3.16% 3.50% 2.95% 3.54% 3.65% 3.90% 3.78%Persistency ratio - 13th month 94.40% 95.12% 95.42% 95.45% 94.97% 95.12% 95.24%Persistency ratio - 25th month 91.17% 89.67% 88.18% 88.51% 89.40% 89.67% 90.13%
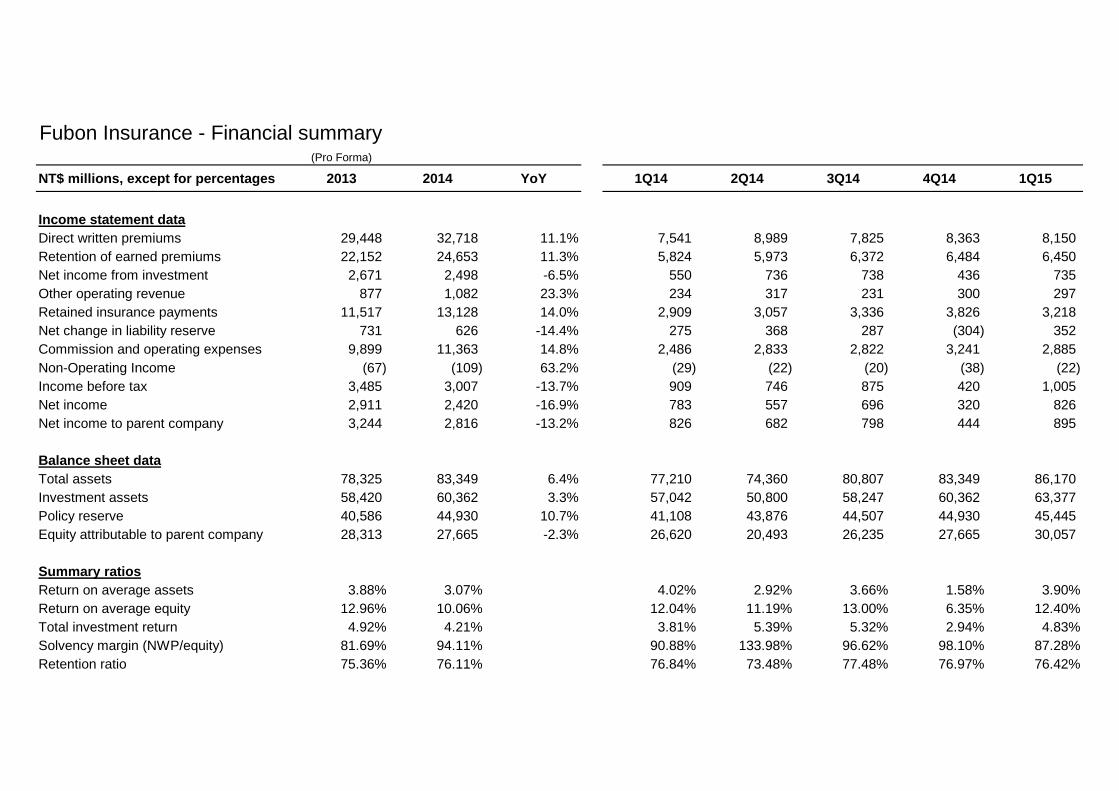
Fubon Insurance - Financial summary(Pro Forma)
NT$ millions, except for percentages 2013 2014 YoY 1Q14 2Q14 3Q14 4Q14 1Q15
Income statement dataDirect written premiums 29,448 32,718 11.1% 7,541 8,989 7,825 8,363 8,150Retention of earned premiums 22,152 24,653 11.3% 5,824 5,973 6,372 6,484 6,450Net income from investment 2,671 2,498 -6.5% 550 736 738 436 735Other operating revenue 877 1,082 23.3% 234 317 231 300 297Retained insurance payments 11,517 13,128 14.0% 2,909 3,057 3,336 3,826 3,218Net change in liability reserve 731 626 -14.4% 275 368 287 (304) 352Commission and operating expenses 9,899 11,363 14.8% 2,486 2,833 2,822 3,241 2,885Non-Operating Income (67) (109) 63.2% (29) (22) (20) (38) (22)Income before tax 3,485 3,007 -13.7% 909 746 875 420 1,005Net income 2,911 2,420 -16.9% 783 557 696 320 826Net income to parent company 3,244 2,816 -13.2% 826 682 798 444 895
Balance sheet dataTotal assets 78,325 83,349 6.4% 77,210 74,360 80,807 83,349 86,170Investment assets 58,420 60,362 3.3% 57,042 50,800 58,247 60,362 63,377Policy reserve 40,586 44,930 10.7% 41,108 43,876 44,507 44,930 45,445Equity attributable to parent company 28,313 27,665 -2.3% 26,620 20,493 26,235 27,665 30,057
Summary ratiosReturn on average assets 3.88% 3.07% 4.02% 2.92% 3.66% 1.58% 3.90%Return on average equity 12.96% 10.06% 12.04% 11.19% 13.00% 6.35% 12.40%Total investment return 4.92% 4.21% 3.81% 5.39% 5.32% 2.94% 4.83%Solvency margin (NWP/equity) 81.69% 94.11% 90.88% 133.98% 96.62% 98.10% 87.28%Retention ratio 75.36% 76.11% 76.84% 73.48% 77.48% 76.97% 76.42%
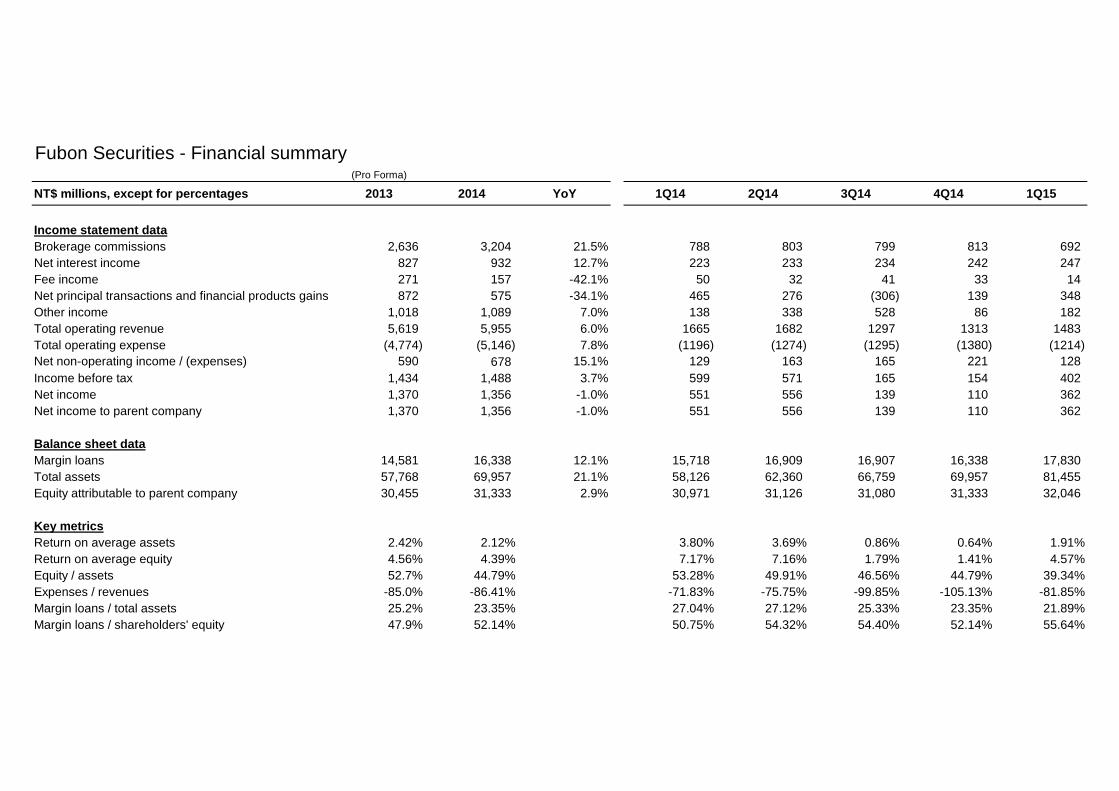
Fubon Securities - Financial summary(Pro Forma)
NT$ millions, except for percentages 2013 2014 YoY 1Q14 2Q14 3Q14 4Q14 1Q15
Income statement dataBrokerage commissions 2,636 3,204 21.5% 788 803 799 813 692Net interest income 827 932 12.7% 223 233 234 242 247Fee income 271 157 -42.1% 50 32 41 33 14Net principal transactions and financial products gains 872 575 -34.1% 465 276 (306) 139 348Other income 1,018 1,089 7.0% 138 338 528 86 182Total operating revenue 5,619 5,955 6.0% 1665 1682 1297 1313 1483Total operating expense (4,774) (5,146) 7.8% (1196) (1274) (1295) (1380) (1214)Net non-operating income / (expenses) 590 678 15.1% 129 163 165 221 128Net non-operating income / (expenses) 590 678 15.1% 129 163 165 221 128Income before tax 1,434 1,488 3.7% 599 571 165 154 402Net income 1,370 1,356 -1.0% 551 556 139 110 362Net income to parent company 1,370 1,356 -1.0% 551 556 139 110 362
Balance sheet dataMargin loans 14,581 16,338 12.1% 15,718 16,909 16,907 16,338 17,830 Total assets 57,768 69,957 21.1% 58,126 62,360 66,759 69,957 81,455 Equity attributable to parent company 30,455 31,333 2.9% 30,971 31,126 31,080 31,333 32,046
Key metricsReturn on average assets 2.42% 2.12% 3.80% 3.69% 0.86% 0.64% 1.91%Return on average equity 4.56% 4.39% 7.17% 7.16% 1.79% 1.41% 4.57%Equity / assets 52.7% 44.79% 53.28% 49.91% 46.56% 44.79% 39.34%Expenses / revenues -85.0% -86.41% -71.83% -75.75% -99.85% -105.13% -81.85%Margin loans / total assets 25.2% 23.35% 27.04% 27.12% 25.33% 23.35% 21.89%Margin loans / shareholders' equity 47.9% 52.14% 50.75% 54.32% 54.40% 52.14% 55.64%
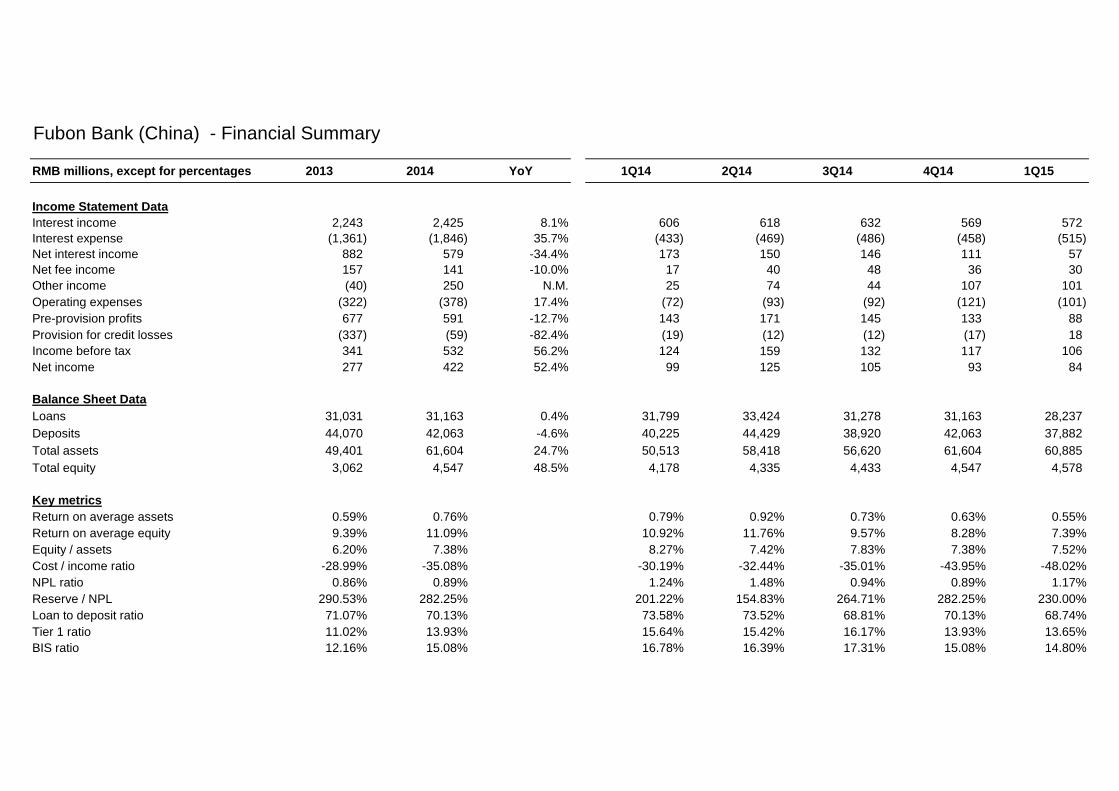
Fubon Bank (China) - Financial Summary
RMB millions, except for percentages 2013 2014 YoY 1Q14 2Q14 3Q14 4Q14 1Q15
Income Statement DataInterest income 2,243 2,425 8.1% 606 618 632 569 572Interest expense (1,361) (1,846) 35.7% (433) (469) (486) (458) (515)Net interest income 882 579 -34.4% 173 150 146 111 57Net fee income 157 141 -10.0% 17 40 48 36 30Other income (40) 250 N.M. 25 74 44 107 101Operating expenses (322) (378) 17.4% (72) (93) (92) (121) (101)Pre-provision profits 677 591 -12.7% 143 171 145 133 88Provision for credit losses (337) (59) -82.4% (19) (12) (12) (17) 18Income before tax 341 532 56.2% 124 159 132 117 106Income before tax 341 532 56.2% 124 159 132 117 106Net income 277 422 52.4% 99 125 105 93 84
Balance Sheet DataLoans 31,031 31,163 0.4% 31,799 33,424 31,278 31,163 28,237 Deposits 44,070 42,063 -4.6% 40,225 44,429 38,920 42,063 37,882 Total assets 49,401 61,604 24.7% 50,513 58,418 56,620 61,604 60,885 Total equity 3,062 4,547 48.5% 4,178 4,335 4,433 4,547 4,578
Key metricsReturn on average assets 0.59% 0.76% 0.79% 0.92% 0.73% 0.63% 0.55%Return on average equity 9.39% 11.09% 10.92% 11.76% 9.57% 8.28% 7.39%Equity / assets 6.20% 7.38% 8.27% 7.42% 7.83% 7.38% 7.52%Cost / income ratio -28.99% -35.08% -30.19% -32.44% -35.01% -43.95% -48.02%NPL ratio 0.86% 0.89% 1.24% 1.48% 0.94% 0.89% 1.17%Reserve / NPL 290.53% 282.25% 201.22% 154.83% 264.71% 282.25% 230.00%Loan to deposit ratio 71.07% 70.13% 73.58% 73.52% 68.81% 70.13% 68.74%Tier 1 ratio 11.02% 13.93% 15.64% 15.42% 16.17% 13.93% 13.65%BIS ratio 12.16% 15.08% 16.78% 16.39% 17.31% 15.08% 14.80%
4 M
ay 2015
Fubon Life Insurance Com
pany Limited
14F, No. 108, Section 1
Tun Hw
a South Road
Taipei 10557 Taiw
an, R.O.C
For the attention of: M
r. Chun-Pan C
hen, President
Ms. Tsai-Ling C
hao, EVP D
ear Sirs,
Review
of Embedded V
alue as at 31 Decem
ber 2014 and Value of O
ne Year's N
ew
Business of Fubon Life Insurance C
ompany Lim
ited D
eloitte Consulting (H
ong Kong) Lim
ited (“Deloitte C
onsulting”, or "we") have been retained by
Fubon Life Insurance Com
pany Limited (“Fubon Life” or "the C
ompany") to prepare an independent
opinion in respect of the Embedded Value (“EV”) as at 31 D
ecember 2014 and the Value of O
ne Year of N
ew Business (“V1N
B”) sold during the calendar year 2014 as calculated and published by the
Com
pany. The
purpose of
the publication
of the
EV and
V1NB
figures w
as to
provide supplem
entary information to investors, analysts and other stakeholders.
This opinion letter ("the Opinion Letter") sets out the w
ork carried out and findings from that w
ork and has been prepared in accordance w
ith the Work O
rder dated 18 February 2015 between Fubon
Life and Deloitte C
onsulting.
This engagement is solely w
ith Fubon Life and this Opinion Letter is solely for the use of Fubon Life
and its Directors as a body for the stated purpose only. To the fullest extent perm
itted by law w
e do not accept or assum
e responsibility or liability (including without lim
itation, those arising from
negligence) to anyone other than Fubon Life's Directors as a body for our w
ork in respect of this O
pinion Letter or for the conclusions that we have reached.
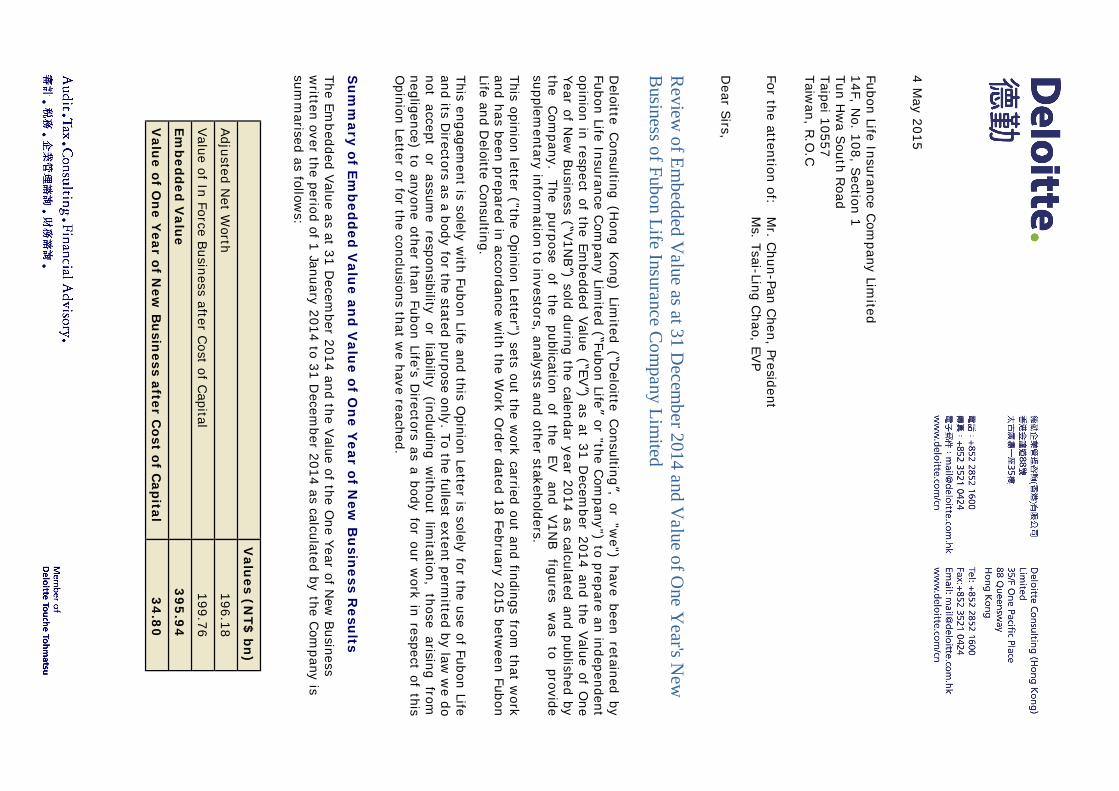
Su
mm
ary of Em
bed
ded
Valu
e and
Valu
e of On
e Year of N
ew B
usin
ess Resu
lts The Em
bedded Value as at 31 Decem
ber 2014 and the Value of the One Year of N
ew Business
written over the period of 1 January 2014 to 31 D
ecember 2014 as calculated by the C
ompany is
summ
arised as follows:
V
alues (N
T$ bn)
Adjusted Net W
orth 196.18
Value of In Force Business after Cost of C
apital 199.76
Emb
edded V
alue
39
5.9
4
Valu
e of On
e Year of N
ew B
usin
ess after Cost of C
apital 3
4.8
0
2
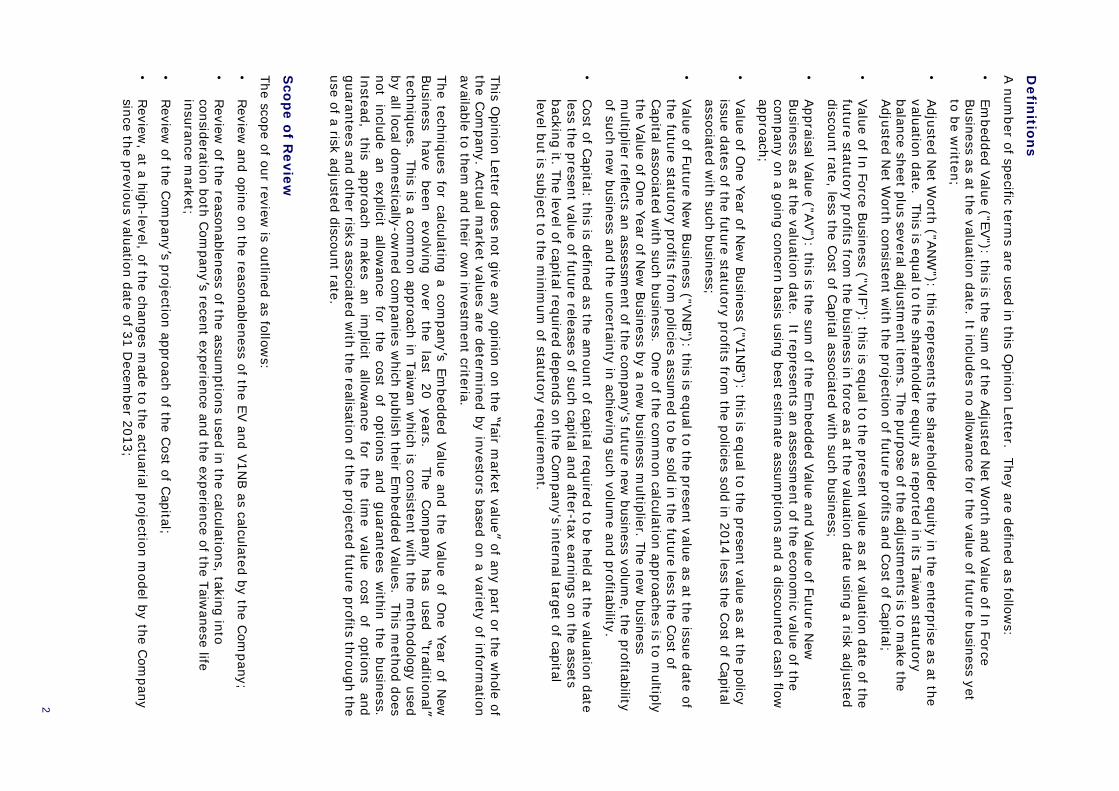
Defin
ition
s A num
ber of specific terms are used in this O
pinion Letter. They are defined as follows:
• Em
bedded Value ("EV"): this is the sum of the Adjusted N
et Worth and Value of In Force
Business as at the valuation date. It includes no allowance for the value of future business yet
to be written;
• Adjusted N
et Worth ("AN
W"): this represents the shareholder equity in the enterprise as at the
valuation date. This is equal to the shareholder equity as reported in its Taiwan statutory
balance sheet plus several adjustment item
s. The purpose of the adjustments is to m
ake the Adjusted N
et Worth consistent w
ith the projection of future profits and Cost of C
apital;
• Value of In Force Business ("VIF"): this is equal to the present value as at valuation date of the future statutory profits from
the business in force as at the valuation date using a risk adjusted discount rate, less the C
ost of Capital associated with such business;
• Appraisal Value ("AV"): this is the sum
of the Embedded Value and Value of Future N
ew
Business as at the valuation date. It represents an assessment of the econom
ic value of the com
pany on a going concern basis using best estimate assum
ptions and a discounted cash flow
approach;
• Value of O
ne Year of New
Business ("V1NB"): this is equal to the present value as at the policy
issue dates of the future statutory profits from the policies sold in 2014 less the C
ost of Capital associated w
ith such business;
• Value of Future N
ew Business ("VN
B"): this is equal to the present value as at the issue date of the future statutory profits from
policies assumed to be sold in the future less the C
ost of Capital associated w
ith such business. One of the com
mon calculation approaches is to m
ultiply the Value of O
ne Year of New
Business by a new business m
ultiplier. The new business
multiplier reflects an assessm
ent of the company's future new
business volume, the profitability
of such new business and the uncertainty in achieving such volum
e and profitability.
• Cost of C
apital: this is defined as the amount of capital required to be held at the valuation date
less the present value of future releases of such capital and after-tax earnings on the assets backing it. The level of capital required depends on the C
ompany's internal target of capital
level but is subject to the minim
um of statutory requirem
ent.
This Opinion Letter does not give any opinion on the “fair m
arket value” of any part or the whole of
the Com
pany. Actual market values are determ
ined by investors based on a variety of information
available to them and their ow
n investment criteria.
The techniques for calculating a company’s Em
bedded Value and the Value of One Year of N
ew
Business have
been evolving
over the
last 20
years.
The Com
pany has
used “traditional”
techniques. This is a comm
on approach in Taiwan w
hich is consistent with the m
ethodology used by all local dom
estically-owned com
panies which publish their Em
bedded Values. This method does
not include an explicit allowance for the cost of options and guarantees w
ithin the business. Instead,
this approach
makes
an im
plicit allow
ance for
the tim
e value
cost of
options and
guarantees and other risks associated with the realisation of the projected future profits through the
use of a risk adjusted discount rate.
Sco
pe of R
eview
The scope of our review is outlined as follow
s:
• Review
and opine on the reasonableness of the EV and V1NB as calculated by the C
ompany;
• Review
of the reasonableness of the assumptions used in the calculations, taking into
consideration both Com
pany’s recent experience and the experience of the Taiwanese life
insurance market;
• Review
of the Com
pany’s projection approach of the Cost of C
apital;
• Review
, at a high-level, of the changes made to the actuarial projection m
odel by the Com
pany since the previous valuation date of 31 D
ecember 2013;

3
• Review
of the data put through the model com
pared to the policy data on the Com
pany’s policy adm
inistration systems to judge the extent to w
hich the business has been valued in the financial m
odel and to identify the portion (if any) omitted and how
that was valued;
• Review
of the approach used to determine the Adjusted N
et Worth (“AN
W”), in particular, the
adjustments m
ade in deriving the ANW
, and any other adjustments m
ade outside of the actuarial projection m
odel;
• Review
of the Com
pany's analysis of change in the VIF between 31 D
ecember 2013 and 31
Decem
ber 2014.
The scope of our review did not include the follow
ing aspects:
• Review
of the policy data on the Com
pany’s administration system
s;
Our review
did not cover an audit of the accuracy or completeness of the policy data item
s and w
e offer no comm
ent on the quality of the policy data used by the Com
pany in the valuation, and readers should not assum
e our review verifies the data is free from
error.
• Review
or audit of the valuation of the assets or any items unless specifically stated on the
Com
pany’s balance sheet;
We referred to the C
ompany’s audited financial statem
ents and placed reliance on them.
• Review
of the calculation of the RBC
(risk based capital) of the Com
pany as at 31 Decem
ber 2014; and
Whilst w
e reviewed the projection of the R
BC into future periods, w
e relied on the accuracy and com
pleteness of the starting RBC
figures as at 31 Decem
ber 2014 as submitted by the C
ompany
to the Taiwanese regulator.
• Any other actuarial or other valuation figures, such as an Appraisal Value, Value of Future N
ew
Business, New
Business Multiplier, or any “Fair Value” or potential transaction price.
Only the EV
and V1NB fell in the scope of our review
, and we offer no opinion on any other
values.
Our review
was conducted in accordance w
ith current generally accepted actuarial practices and processes for review
s of traditional Embedded Value calculations. In particular, w
e made reference
to the methods, approach and other considerations as set out in:
• The relevant parts of Practice G
uideline 199.03 of the Institute of Actuaries of Australia entitled “Econom
ic Valuations”; and
• Professional C
onduct Standards as defined by the Professional Affairs Board of the Institute and Faculty of Actuaries in the U
K.
Find
ing
s from
ou
r Review
O
ur findings are summ
arised as follows:
• W
ith respect to the calculation methodology adopted by the C
ompany in the calculations:
− The chosen traditional EV m
ethodology used by the Com
pany has been applied in line with
generally accepted actuarial practice and relevant guidance; and
− The m
ethodology was in line w
ith the purpose stated by the Com
pany, and is consistent w
ith a “going concern” approach.
• W
ith respect to the policy data used in the calculations:
− The C
ompany has used policy data that is, in aggregate, consistent w
ith the policy data held on the C
ompany's adm
inistration systems as at the appropriate dates.
• W
ith respect to the actuarial projection and valuation systems and the results produced by the
Com
pany:
4
− O
ver 99% of the policy data has been included in the valuation and a zero value has been
assigned to that part which w
as not included in the valuation;
− At the aggregate level, the m
odel outputs for each major block of business that w
e reviewed
appear to be consistent with the assum
ptions applied in the calculations, the features of the products
included in
each block
of business,
the prevailing
applicable and
relevant regulations in Taiw
an.
• W
ith respect to the assumptions used in the calculations:
− The assum
ptions, taken as a whole, are reasonable for the C
ompany and the environm
ent in w
hich it conducts business;
− The econom
ic assumptions, including rate of investm
ent return, risk adjusted discount rate and inflation rate, w
ere set consistently with one another and w
ith the way in w
hich the adjusted net w
orth was calculated;
− The econom
ic assumptions represent plausible future outcom
es for expected future total returns (including the release of risk m
argins) and lie within a reasonable range of such
plausible future outcomes; and
− The non-econom
ic assumptions have been set w
ith regard to relevant actual historical experience of both the C
ompany and the industry, and the C
ompany has provided plausible,
reasoned arguments in relation to their expectations of future trends and developm
ents for these assum
ptions.
• W
ith respect to the calculation of the Adjusted Net W
orth:
− The C
ompany has m
ade adjustments to the N
et Worth as reported on the statutory balance
sheet which are appropriate for the purpose of this valuation.
In conclusion, we find the results of the Em
bedded Value and Value of One Year of N
ew Business
calculated by the Com
pany to be reasonable within the purpose and chosen m
ethodology of their calculation,
and that
the m
ethodology is
consistent w
ith the
approach taken
by all
local dom
estically-owned life insurers w
hich publish similar figures in Taiw
an and with one generally
accepted method for their calculation.
In stating the above opinion, we draw
attention to the uncertainty related to such calculations.
The calculations of EV and V1NB results necessarily m
ake numerous assum
ptions with respect to
economic conditions, operating conditions, taxes and other m
atters, many of w
hich are not fully w
ithin the control of the Com
pany. Although the assumptions used represent estim
ates which fall
within a reasonable range of expectations, actual experience in the future is alm
ost certain to vary from
that assumed in the calculation of the results and any such variations m
ay be material.
Deviations from
assumed experience are norm
al and are to be expected.
We note, and draw
the attention of readers to the sensitivity of the results to assumptions, and in
particular, to the assumed rate of future investm
ent return and the risk discount rate; this is illustrated quantitatively in the C
ompany's disclosures. A deviation from
the assumed future
investment return, even still w
ithin a reasonably plausible range of such assumptions, m
ay lead to a m
aterially different result. We note that future investm
ent returns are subject to market factors
beyond the control of the Com
pany and hence it is not possible for the Com
pany to fully imm
unise future profitability against m
ovements in future investm
ent returns.
Yours faithfully,
Deloitte C
onsulting (Hong K
ong) Limited