Embed Size (px)
Citation preview
2017.05.15
Fubon Financial 2017 Q1 Interim Results
and
2016 Embedded Value of Fubon Life
2
Disclaimer
This meeting may contain forward-looking statements with respect to the financial
condition, results of operations and business of the company. These forward-looking
statements represent the company’s expectations or beliefs concerning future events
and involve known and unknown risks and uncertainty that could cause actual
results, performance or events to differ materially from those expressed. Certain
statements, such as those that include the words “potential”, “estimated”, and similar
expressions or variations on such expressions may be considered “forward-looking
statements”. Financial numbers in this report may include preliminary unaudited
numbers or management accounts.
3
Performance review by subsidiary
• Fubon Life
• Fubon Securities
Performance highlights of Fubon Financial Holdings
• Fubon Insurance
Agenda
• Taipei Fubon Bank
• Fubon Bank (China)
• Fubon Bank (China)
2016 Embedded value of Fubon Life
4
Fubon Financial Holdings: Operation highlights
Taipei Fubon Bank
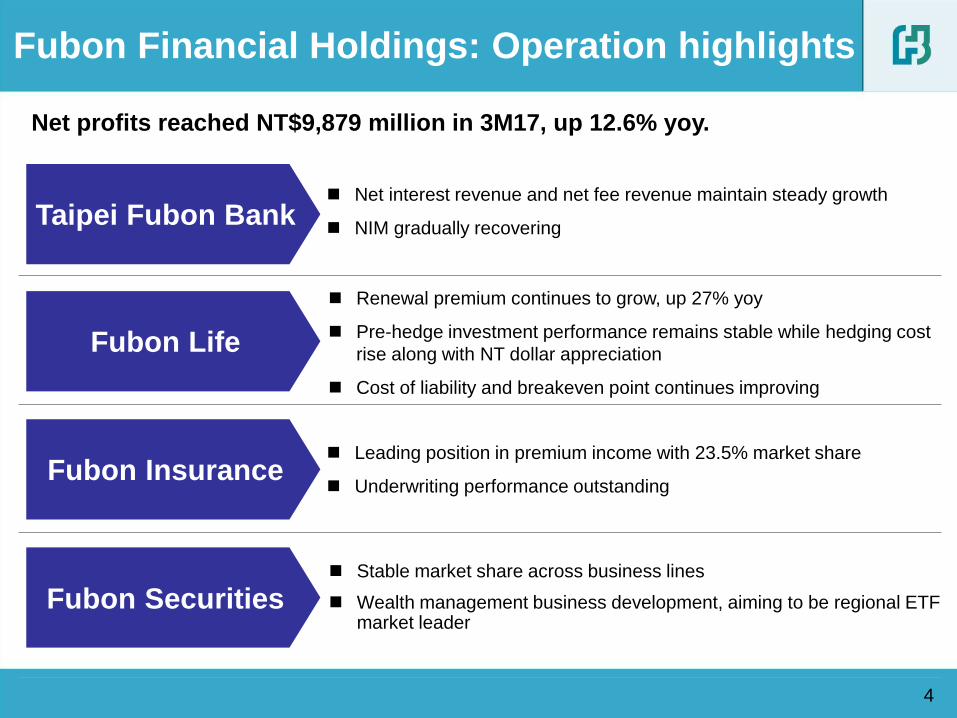
Stable market share across business lines
Wealth management business development, aiming to be regional ETF market leader
Fubon Life
Fubon Insurance
Fubon Securities
Net profits reached NT$9,879 million in 3M17, up 12.6% yoy.
Renewal premium continues to grow, up 27% yoy
Pre-hedge investment performance remains stable while hedging cost
rise along with NT dollar appreciation
Cost of liability and breakeven point continues improving
Net interest revenue and net fee revenue maintain steady growth
NIM gradually recovering
Leading position in premium income with 23.5% market share
Underwriting performance outstanding
5
Net profits
Earning per share (EPS)
NT$
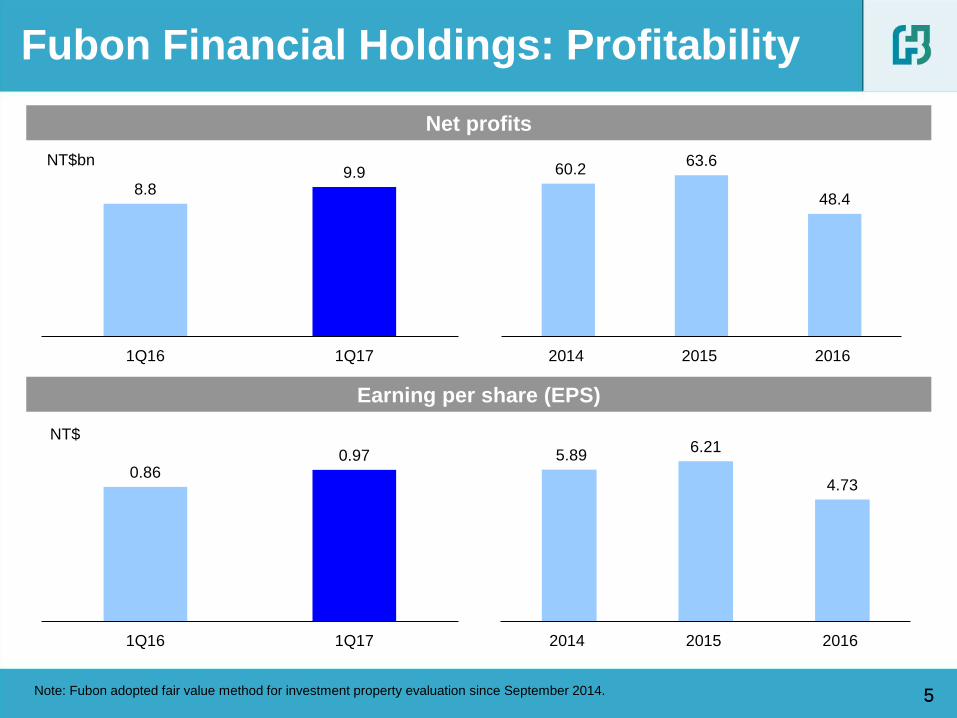
Note: Fubon adopted fair value method for investment property evaluation since September 2014.
NT$bn
5
Fubon Financial Holdings: Profitability
8.8 9.9
1Q16 1Q17
0.86 0.97
1Q16 1Q17
60.2 63.6
48.4
2014 2015 2016
5.89 6.21
4.73
2014 2015 2016
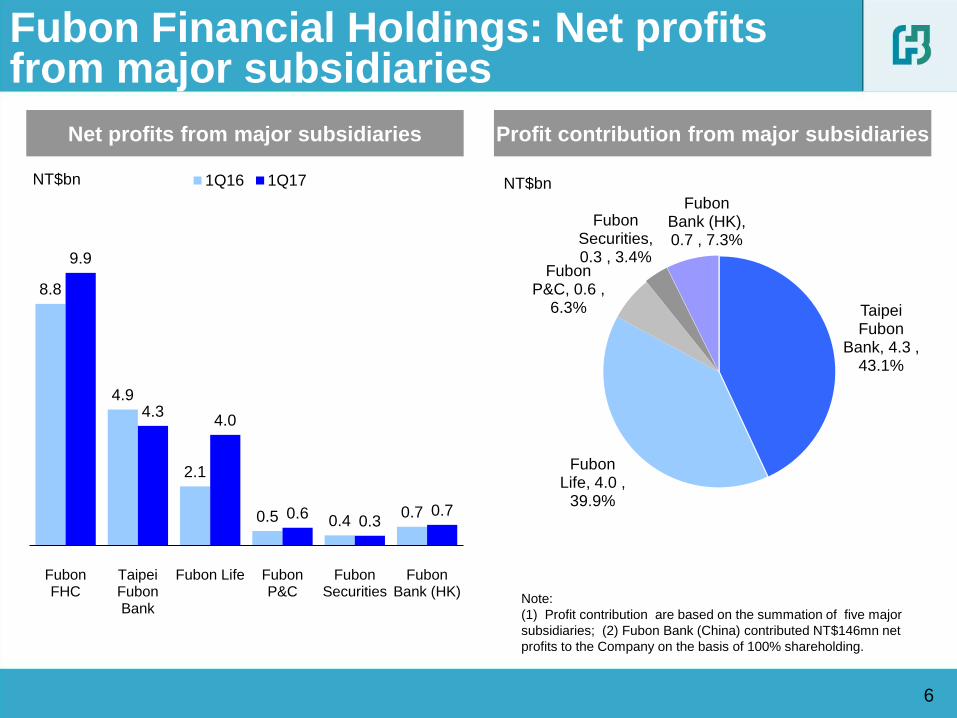
Taipei Fubon
Bank, 4.3 , 43.1%
Fubon Life, 4.0 ,
39.9%
Fubon P&C, 0.6 ,
6.3%
Fubon Securities, 0.3 , 3.4%
Fubon Bank (HK), 0.7 , 7.3%
8.8
4.9
2.1
0.5 0.4 0.7
9.9
4.3 4.0
0.6 0.3
0.7
FubonFHC
TaipeiFubonBank
Fubon Life FubonP&C
FubonSecurities
FubonBank (HK)
1Q16 1Q17
6
Fubon Financial Holdings: Net profits from major subsidiaries
Net profits from major subsidiaries Profit contribution from major subsidiaries
NT$bn NT$bn
Note:
(1) Profit contribution are based on the summation of five major
subsidiaries; (2) Fubon Bank (China) contributed NT$146mn net
profits to the Company on the basis of 100% shareholding.
7 7
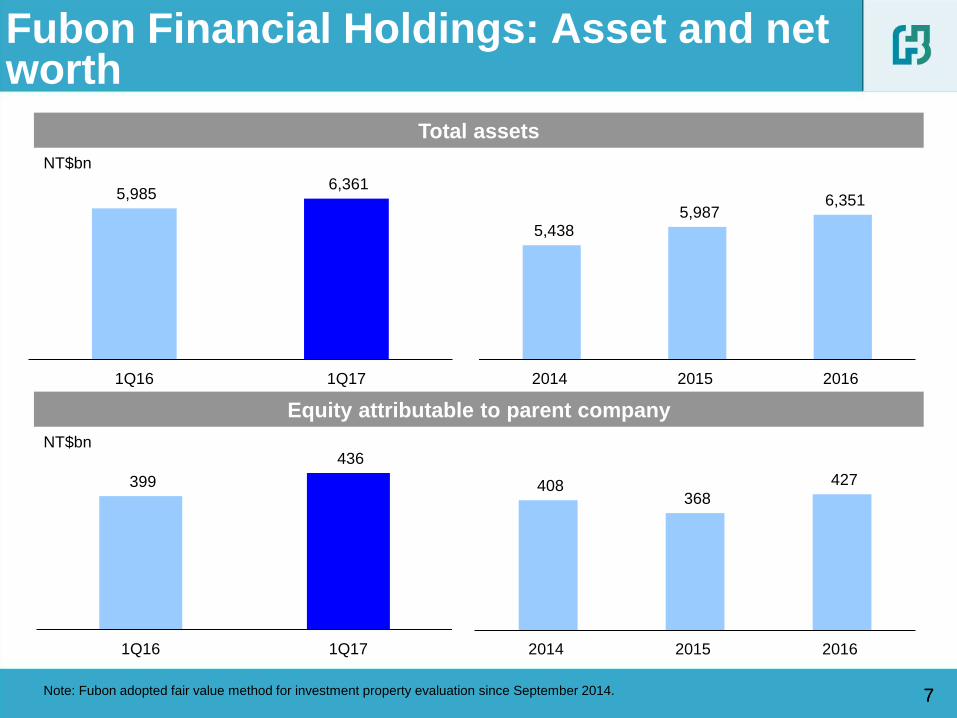
Total assets
Equity attributable to parent company
NT$bn
NT$bn
Fubon Financial Holdings: Asset and net worth
Note: Fubon adopted fair value method for investment property evaluation since September 2014.
5,985 6,361
1Q16 1Q17
5,438 5,987
6,351
2014 2015 2016
399
436
1Q16 1Q17
408 368
427
2014 2015 2016
8 8
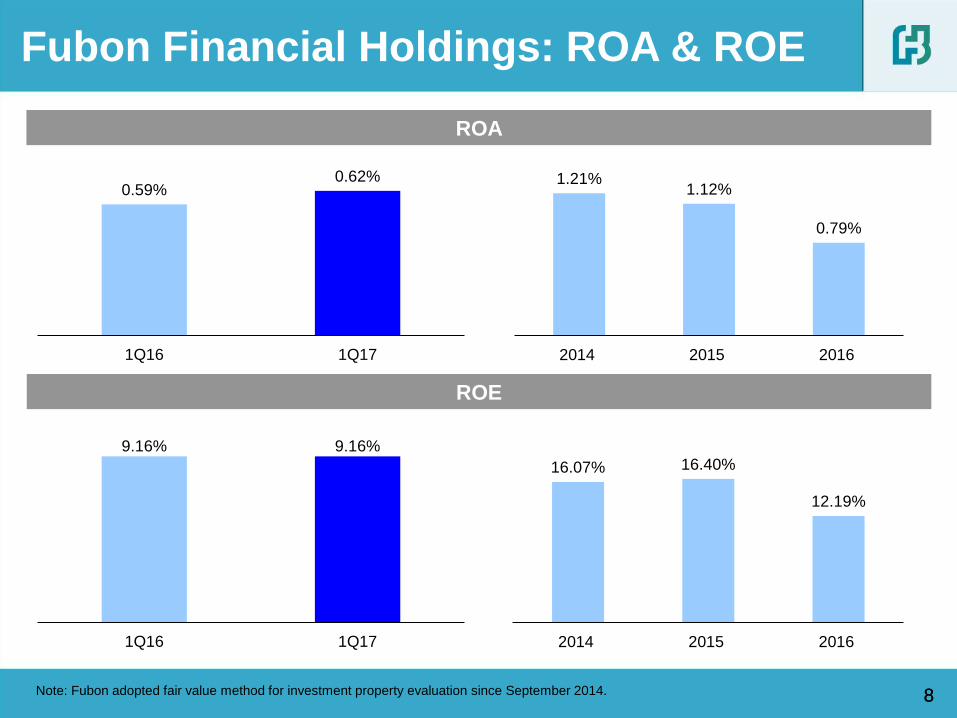
ROA
ROE
Fubon Financial Holdings: ROA & ROE
Note: Fubon adopted fair value method for investment property evaluation since September 2014.
1.21% 1.12%
0.79%
2014 2015 2016
0.59% 0.62%
1Q16 1Q17
16.07% 16.40%
12.19%
2014 2015 2016
9.16% 9.16%
1Q16 1Q17
9
Performance review by subsidiary
• Fubon Life
• Fubon Securities
Performance highlights of Fubon Financial Holdings
• Fubon Insurance
Agenda
• Taipei Fubon Bank
• Fubon Bank (China)
2016 Embedded value of Fubon Life
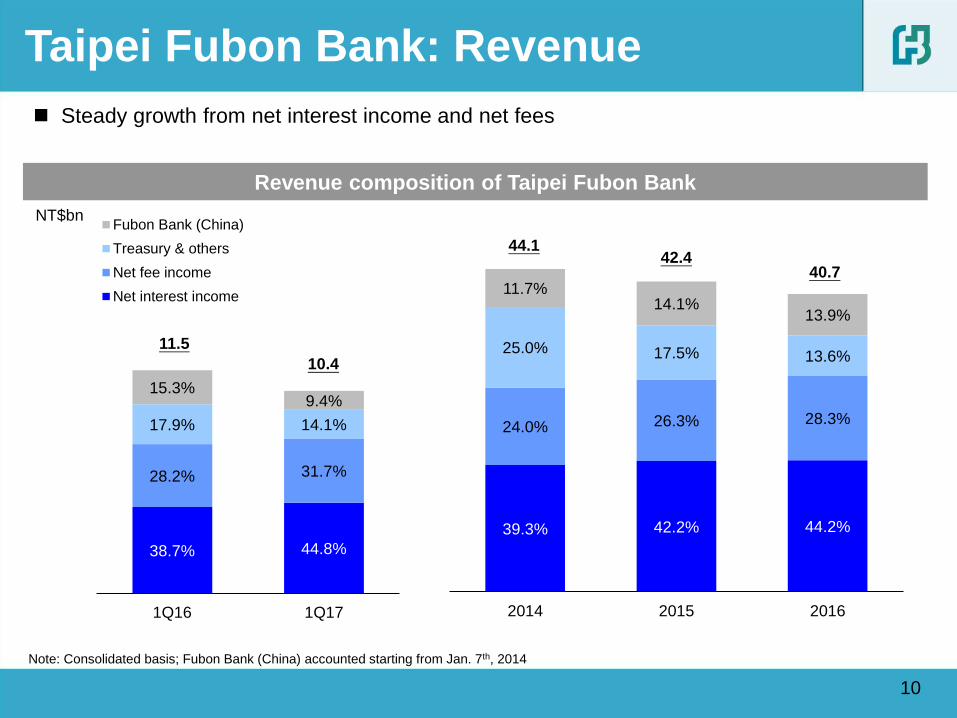
38.7% 44.8%
28.2% 31.7%
17.9% 14.1%
15.3% 9.4%
1Q16 1Q17
Fubon Bank (China)
Treasury & others
Net fee income
Net interest income
39.3% 42.2% 44.2%
24.0% 26.3% 28.3%
25.0% 17.5% 13.6%
11.7% 14.1%
13.9%
2014 2015 2016
10
Taipei Fubon Bank: Revenue
Revenue composition of Taipei Fubon Bank
NT$bn
Steady growth from net interest income and net fees
44.1
Note: Consolidated basis; Fubon Bank (China) accounted starting from Jan. 7th, 2014
42.4 40.7
11.5
10.4
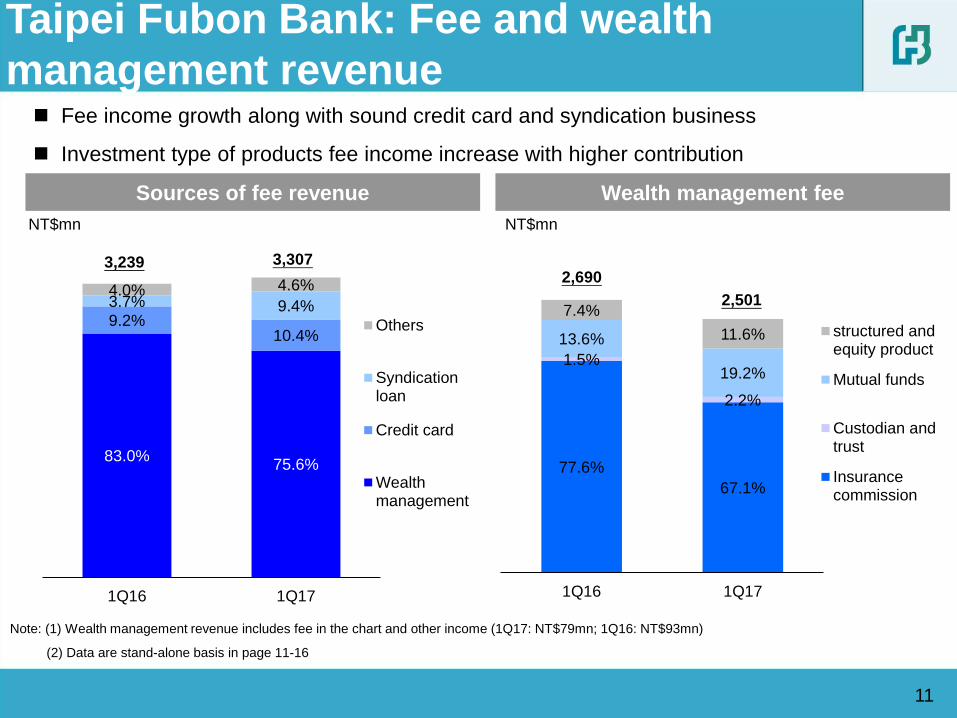
77.6%
67.1%
1.5%
2.2%
13.6%
19.2%
7.4%
11.6%
1Q16 1Q17
structured andequity product
Mutual funds
Custodian andtrust
Insurancecommission
83.0% 75.6%
9.2% 10.4%
3.7% 9.4% 4.0% 4.6%
1Q16 1Q17
Others
Syndicationloan
Credit card
Wealthmanagement
11
Taipei Fubon Bank: Fee and wealth
management revenue
Sources of fee revenue Wealth management fee
NT$mn NT$mn
Note: (1) Wealth management revenue includes fee in the chart and other income (1Q17: NT$79mn; 1Q16: NT$93mn)
(2) Data are stand-alone basis in page 11-16
3,239 3,307
2,501
2,690
Fee income growth along with sound credit card and syndication business
Investment type of products fee income increase with higher contribution
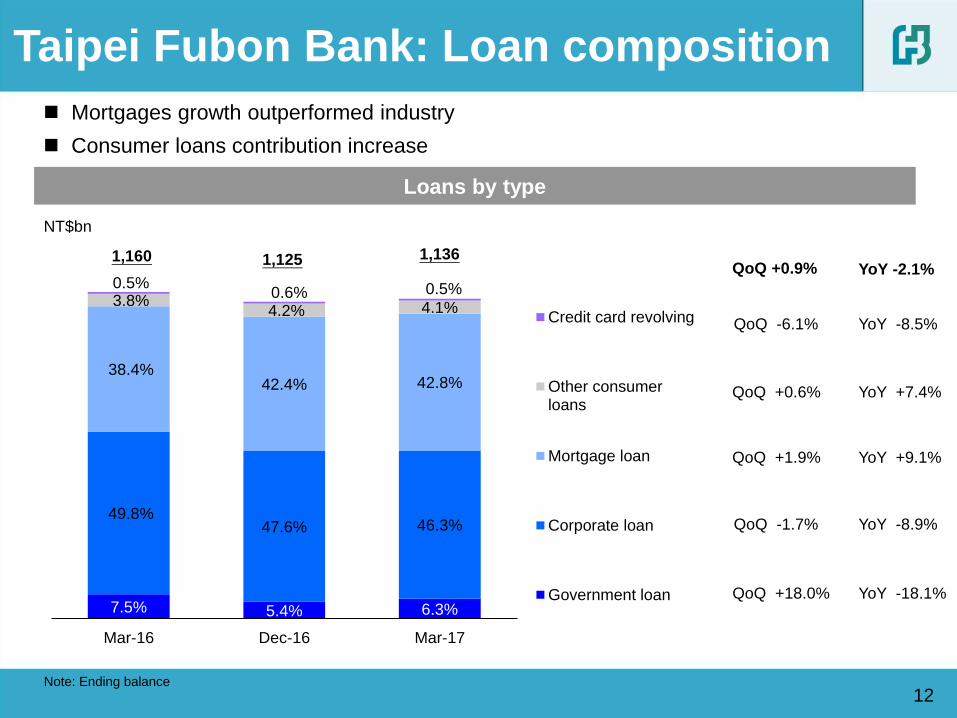
7.5% 5.4% 6.3%
49.8% 47.6% 46.3%
38.4% 42.4% 42.8%
3.8% 4.2% 4.1%
0.5% 0.6% 0.5%
Mar-16 Dec-16 Mar-17
Credit card revolving
Other consumerloans
Mortgage loan
Corporate loan
Government loan
Loans by type
12
Taipei Fubon Bank: Loan composition
NT$bn
Mortgages growth outperformed industry
Consumer loans contribution increase
Note: Ending balance
YoY -2.1%
YoY -8.5%
YoY +7.4%
YoY +9.1%
YoY -8.9%
YoY -18.1%
QoQ +0.9%
QoQ -6.1%
QoQ +0.6%
QoQ +1.9%
QoQ -1.7%
QoQ +18.0%
1,136 1,160 1,125
13
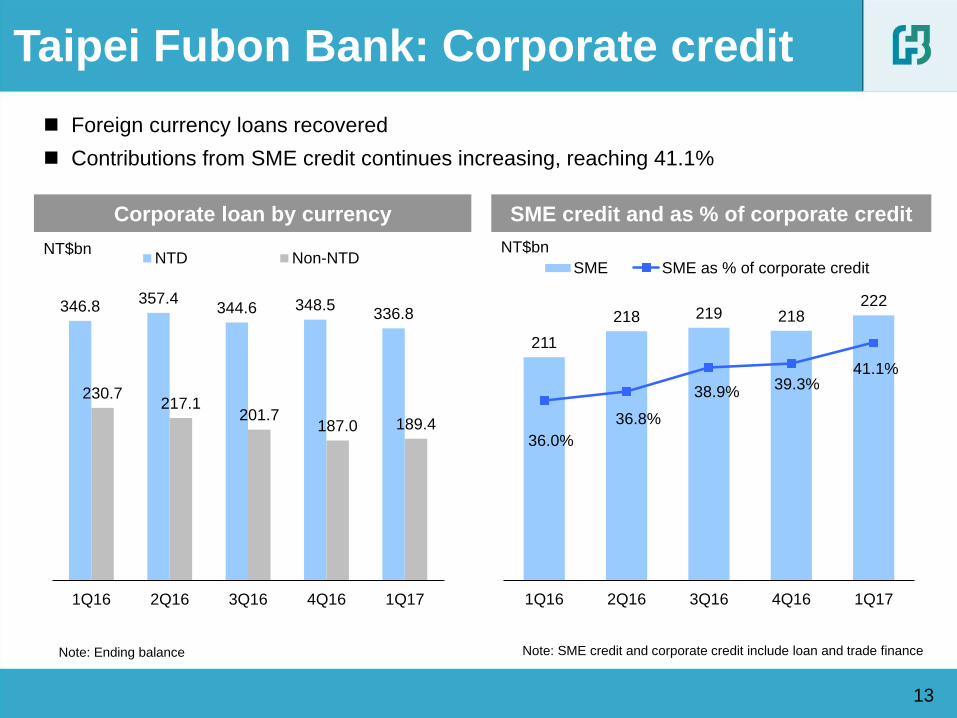
Taipei Fubon Bank: Corporate credit
Corporate loan by currency SME credit and as % of corporate credit
NT$bn
Foreign currency loans recovered
Contributions from SME credit continues increasing, reaching 41.1%
NT$bn
Note: SME credit and corporate credit include loan and trade finance Note: Ending balance
211
218 219 218 222
36.0%
36.8%
38.9% 39.3%
41.1%
1Q16 2Q16 3Q16 4Q16 1Q17
SME SME as % of corporate credit
346.8 357.4
344.6 348.5 336.8
230.7 217.1
201.7 187.0 189.4
1Q16 2Q16 3Q16 4Q16 1Q17
NTD Non-NTD
14
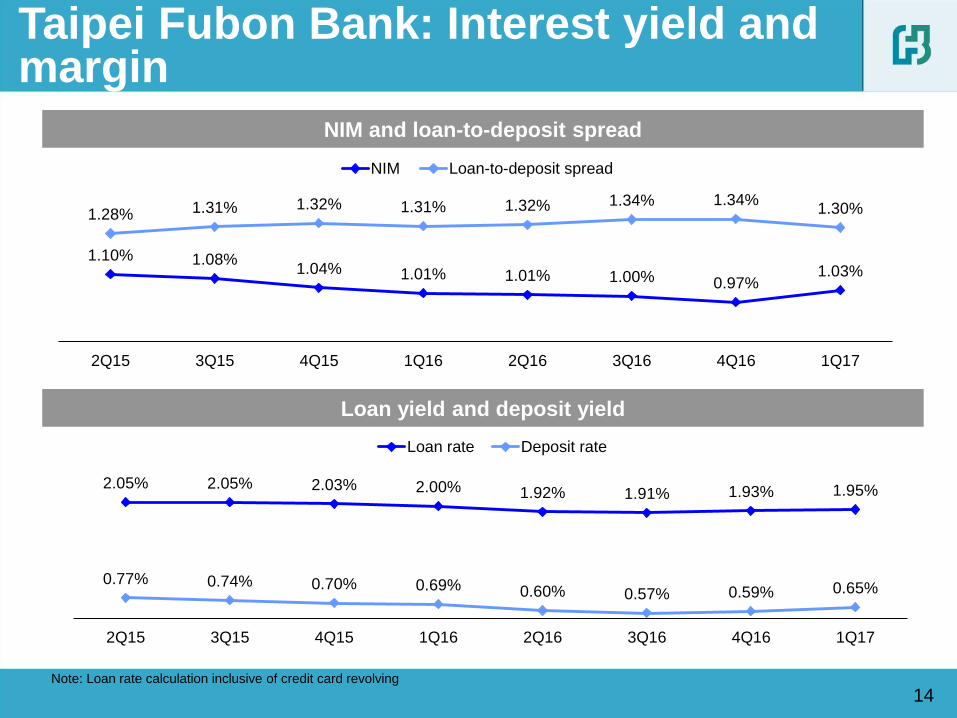
Taipei Fubon Bank: Interest yield and margin
NIM and loan-to-deposit spread
Loan yield and deposit yield
Note: Loan rate calculation inclusive of credit card revolving
1.10% 1.08% 1.04% 1.01% 1.01% 1.00% 0.97%
1.03%
1.28% 1.31% 1.32% 1.31% 1.32% 1.34% 1.34% 1.30%
2Q15 3Q15 4Q15 1Q16 2Q16 3Q16 4Q16 1Q17
NIM Loan-to-deposit spread
2.05% 2.05% 2.03% 2.00% 1.92% 1.91% 1.93% 1.95%
0.77% 0.74% 0.70% 0.69% 0.60% 0.57% 0.59% 0.65%
2Q15 3Q15 4Q15 1Q16 2Q16 3Q16 4Q16 1Q17
Loan rate Deposit rate
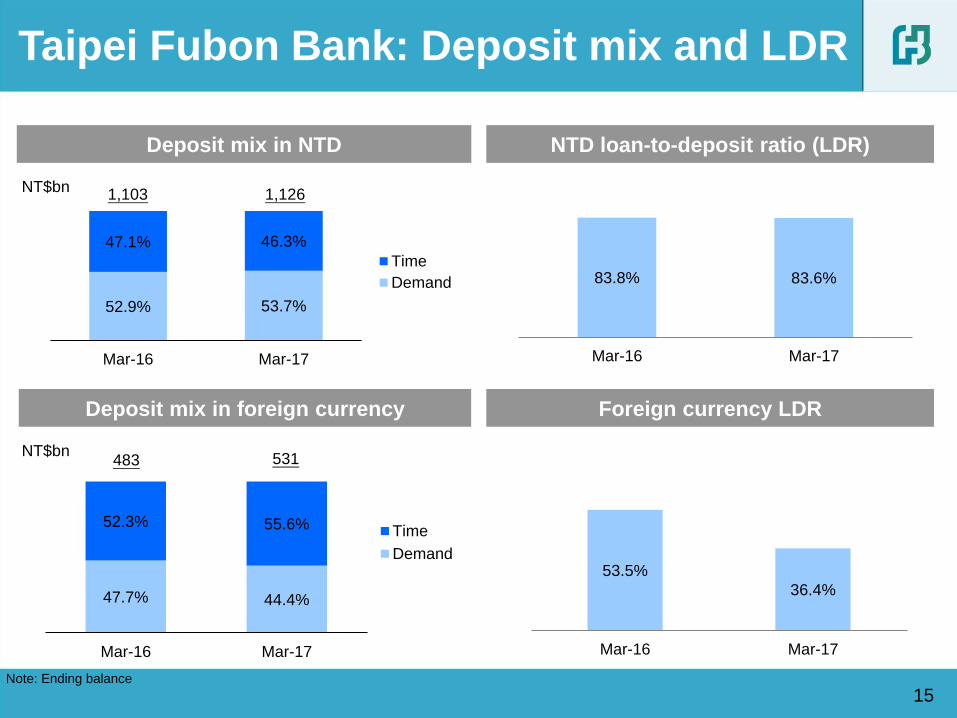
52.9% 53.7%
47.1% 46.3%
Mar-16 Mar-17
Time
Demand
47.7% 44.4%
52.3% 55.6%
Mar-16 Mar-17
Time
Demand
15
Taipei Fubon Bank: Deposit mix and LDR
NTD loan-to-deposit ratio (LDR) Deposit mix in NTD
Deposit mix in foreign currency
NT$bn
NT$bn
Foreign currency LDR
1,103 1,126
483 531
Note: Ending balance
83.8% 83.6%
Mar-16 Mar-17
53.5%
36.4%
Mar-16 Mar-17
0.18% 0.18% 0.19% 0.20% 0.20%
Mar-16 Jun-16 Sep-16 Dec-16 Mar-17
16
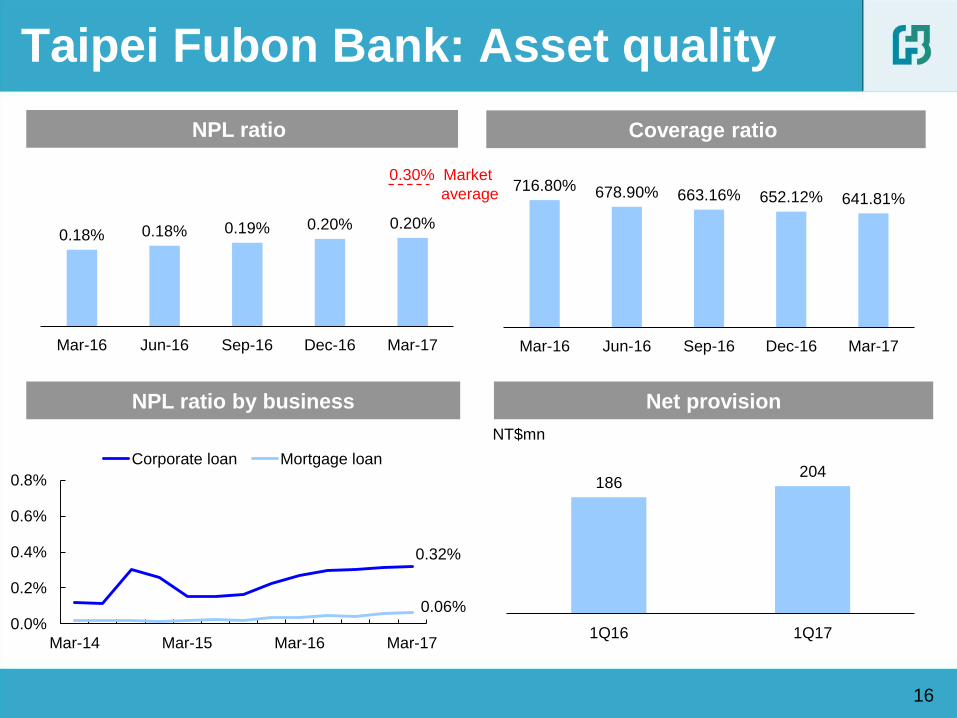
Taipei Fubon Bank: Asset quality
NPL ratio
NPL ratio by business Net provision
Coverage ratio
NT$mn
0.30% Market
average 716.80% 678.90% 663.16% 652.12% 641.81%
Mar-16 Jun-16 Sep-16 Dec-16 Mar-17
186 204
1Q16 1Q17
市場平均更新
0.32%
0.06% 0.0%
0.2%
0.4%
0.6%
0.8%
Mar-14 Mar-15 Mar-16 Mar-17
Corporate loan Mortgage loan
17
Performance review by subsidiary
• Fubon Life
• Fubon Securities
Performance highlights of Fubon Financial Holdings
• Fubon Insurance
Agenda
• Taipei Fubon Bank
• Fubon Bank (China)
2016 Embedded value of Fubon Life
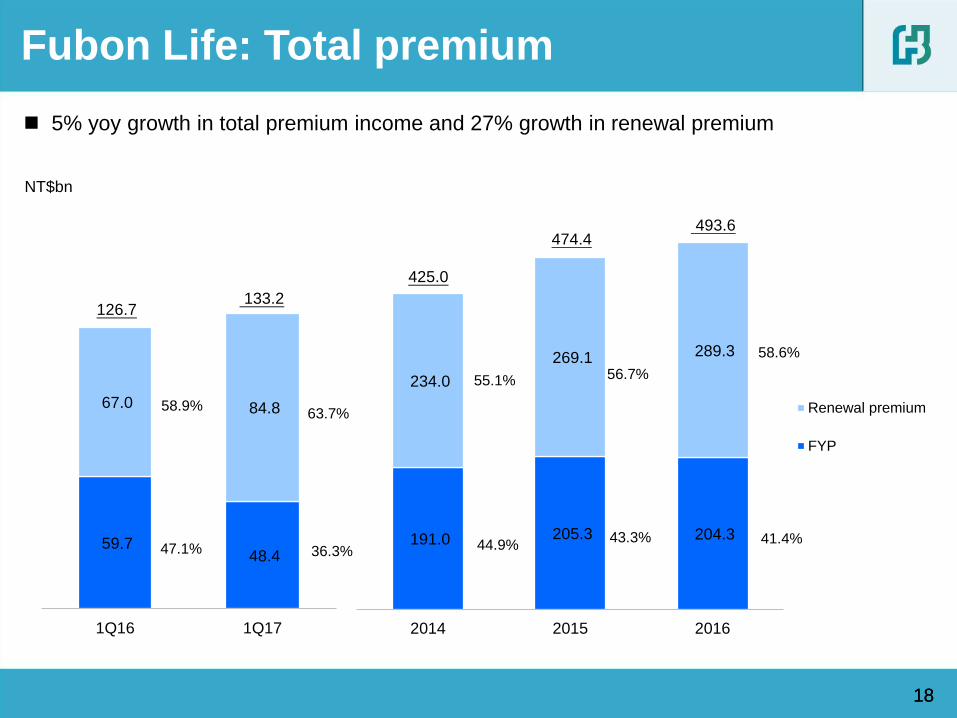
191.0 205.3 204.3
234.0
269.1 289.3
2014 2015 2016
Renewal premium
FYP
59.7 48.4
67.0 84.8
1Q16 1Q17
5% yoy growth in total premium income and 27% growth in renewal premium
18 18
NT$bn
Fubon Life: Total premium
425.0
474.4 493.6
58.6%
41.4%
56.7%
43.3%
55.1%
44.9%
126.7 133.2
63.7%
36.3%
58.9%
47.1%
FYP composition
19
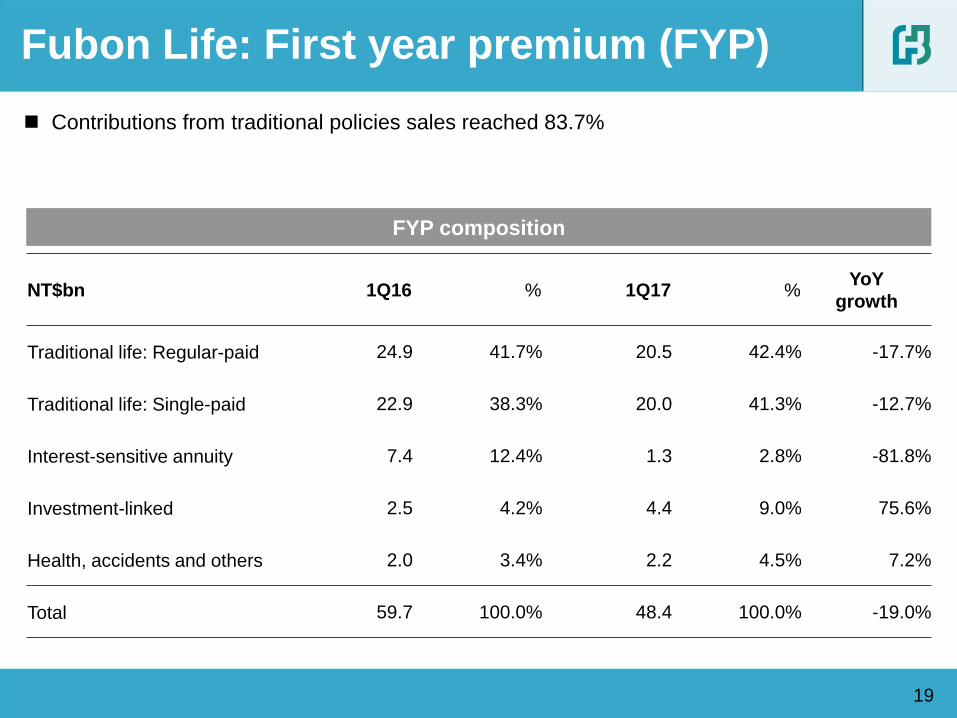
Fubon Life: First year premium (FYP)
Contributions from traditional policies sales reached 83.7%
NT$bn 1Q16 % 1Q17 % YoY
growth
Traditional life: Regular-paid 24.9 41.7% 20.5 42.4% -17.7%
Traditional life: Single-paid 22.9 38.3% 20.0 41.3% -12.7%
Interest-sensitive annuity 7.4 12.4% 1.3 2.8% -81.8%
Investment-linked 2.5 4.2% 4.4 9.0% 75.6%
Health, accidents and others 2.0 3.4% 2.2 4.5% 7.2%
Total 59.7 100.0% 48.4 100.0% -19.0%
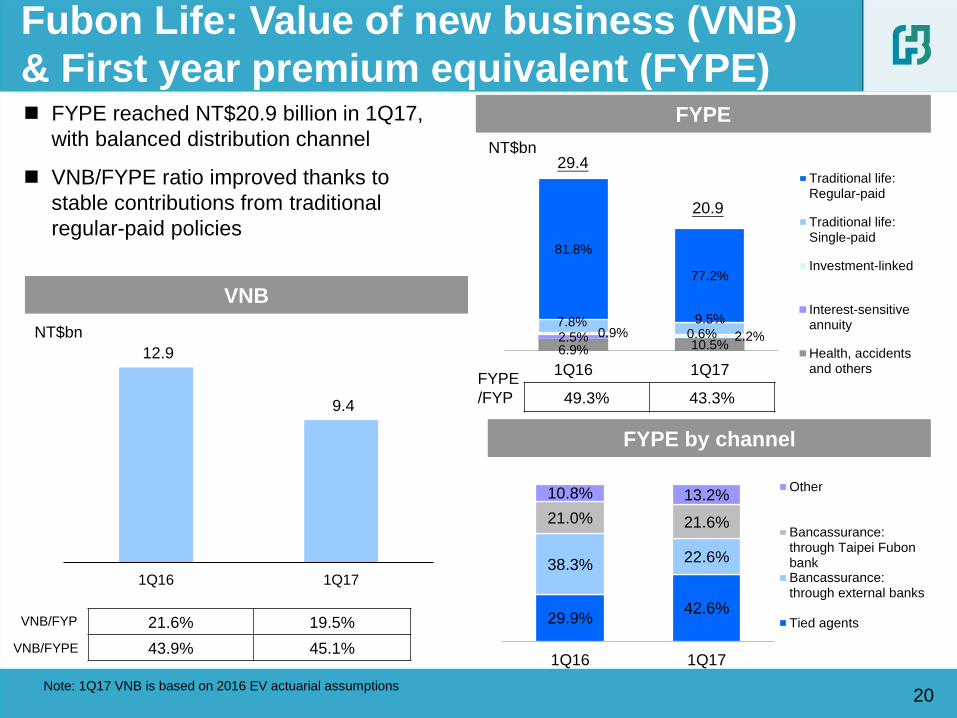
6.9% 10.5% 2.5% 0.6% 0.9% 2.2% 7.8% 9.5%
81.8%
77.2%
1Q16 1Q17
Traditional life:Regular-paid
Traditional life:Single-paid
Investment-linked
Interest-sensitiveannuity
Health, accidentsand others
FYPE reached NT$20.9 billion in 1Q17,
with balanced distribution channel
VNB/FYPE ratio improved thanks to
stable contributions from traditional
regular-paid policies
20
Fubon Life: Value of new business (VNB)
& First year premium equivalent (FYPE)
FYPE
/FYP
NT$bn
29.4
20.9
49.3% 43.3%
VNB
FYPE
NT$bn
Note: 1Q17 VNB is based on 2016 EV actuarial assumptions
FYPE by channel
29.9% 42.6%
38.3% 22.6%
21.0% 21.6%
10.8% 13.2%
1Q16 1Q17
Other
Bancassurance:through Taipei FubonbankBancassurance:through external banks
Tied agentsVNB/FYP 21.6% 19.5%
43.9% 45.1%
12.9
9.4
1Q16 1Q17
VNB/FYPE
NT$bn 1Q16 1Q17 YoY 2014 2015 2016
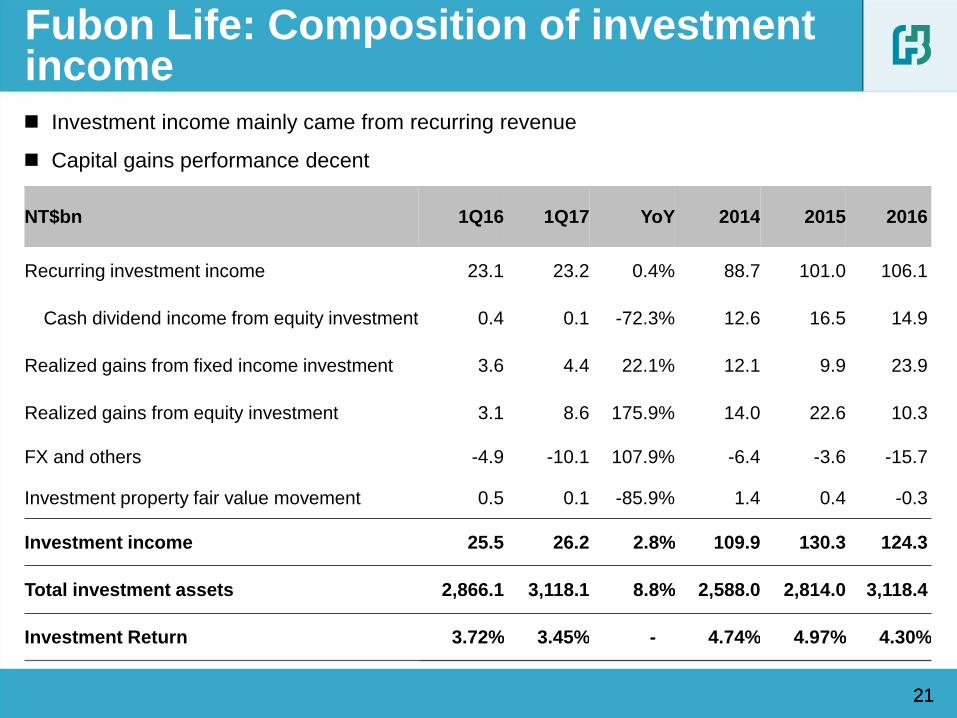
Recurring investment income 23.1 23.2 0.4% 88.7 101.0 106.1
Cash dividend income from equity investment 0.4 0.1 -72.3% 12.6 16.5 14.9
Realized gains from fixed income investment 3.6 4.4 22.1% 12.1 9.9 23.9
Realized gains from equity investment 3.1 8.6 175.9% 14.0 22.6 10.3
FX and others -4.9 -10.1 107.9% -6.4 -3.6 -15.7
Investment property fair value movement 0.5 0.1 -85.9% 1.4 0.4 -0.3
Investment income 25.5 26.2 2.8% 109.9 130.3 124.3
Total investment assets 2,866.1 3,118.1 8.8% 2,588.0 2,814.0 3,118.4
Investment Return 3.72% 3.45% - 4.74% 4.97% 4.30%
21 21
Investment income mainly came from recurring revenue
Capital gains performance decent
Fubon Life: Composition of investment income
22 22
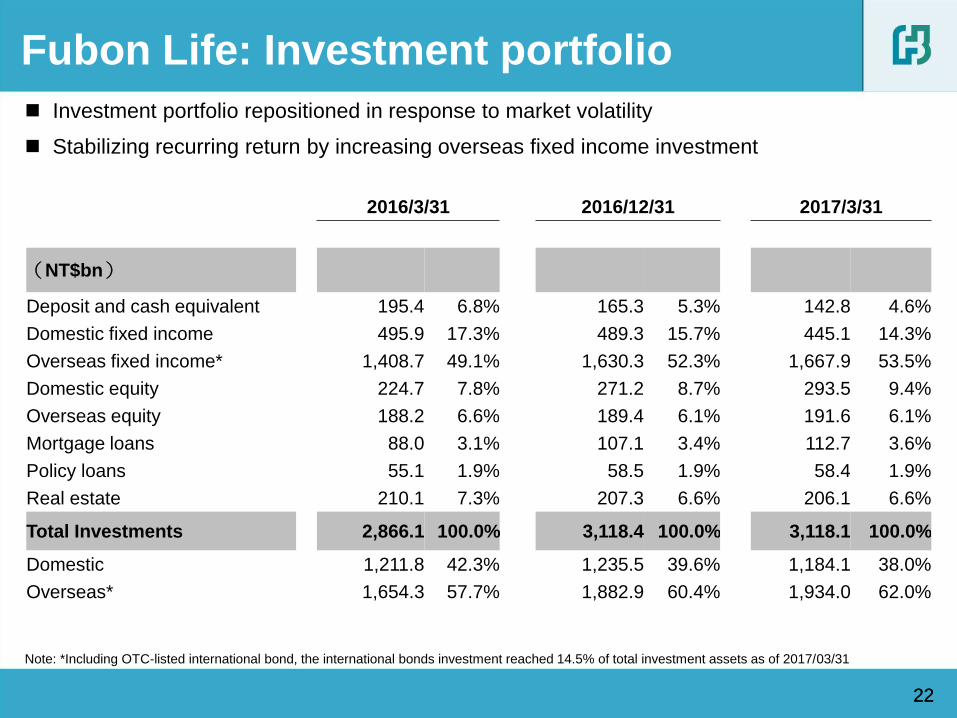
Investment portfolio repositioned in response to market volatility
Stabilizing recurring return by increasing overseas fixed income investment
Fubon Life: Investment portfolio
Note: *Including OTC-listed international bond, the international bonds investment reached 14.5% of total investment assets as of 2017/03/31
2016/3/31 2016/12/31 2017/3/31
(NT$bn)
Deposit and cash equivalent 195.4 6.8% 165.3 5.3% 142.8 4.6%
Domestic fixed income 495.9 17.3% 489.3 15.7% 445.1 14.3%
Overseas fixed income* 1,408.7 49.1% 1,630.3 52.3% 1,667.9 53.5%
Domestic equity 224.7 7.8% 271.2 8.7% 293.5 9.4%
Overseas equity 188.2 6.6% 189.4 6.1% 191.6 6.1%
Mortgage loans 88.0 3.1% 107.1 3.4% 112.7 3.6%
Policy loans 55.1 1.9% 58.5 1.9% 58.4 1.9%
Real estate 210.1 7.3% 207.3 6.6% 206.1 6.6%
Total Investments 2,866.1 100.0% 3,118.4 100.0% 3,118.1 100.0%
Domestic 1,211.8 42.3% 1,235.5 39.6% 1,184.1 38.0%
Overseas* 1,654.3 57.7% 1,882.9 60.4% 1,934.0 62.0%
23
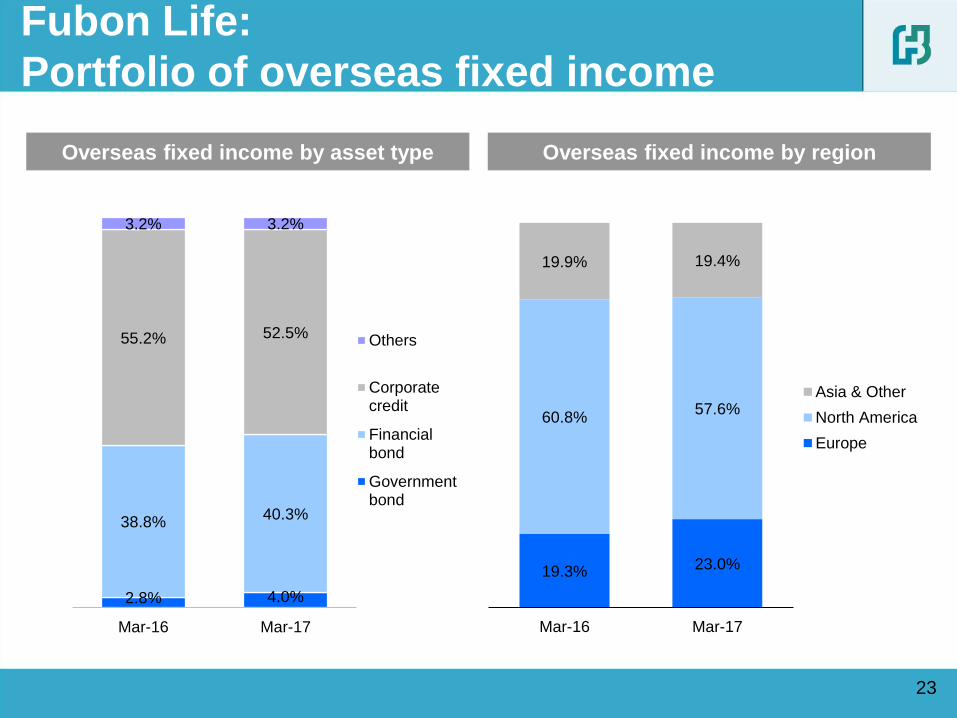
Fubon Life:
Portfolio of overseas fixed income
Overseas fixed income by region Overseas fixed income by asset type
2.8% 4.0%
38.8% 40.3%
55.2% 52.5%
3.2% 3.2%
Mar-16 Mar-17
Others
Corporatecredit
Financialbond
Governmentbond
19.3% 23.0%
60.8% 57.6%
19.9% 19.4%
Mar-16 Mar-17
Asia & Other
North America
Europe
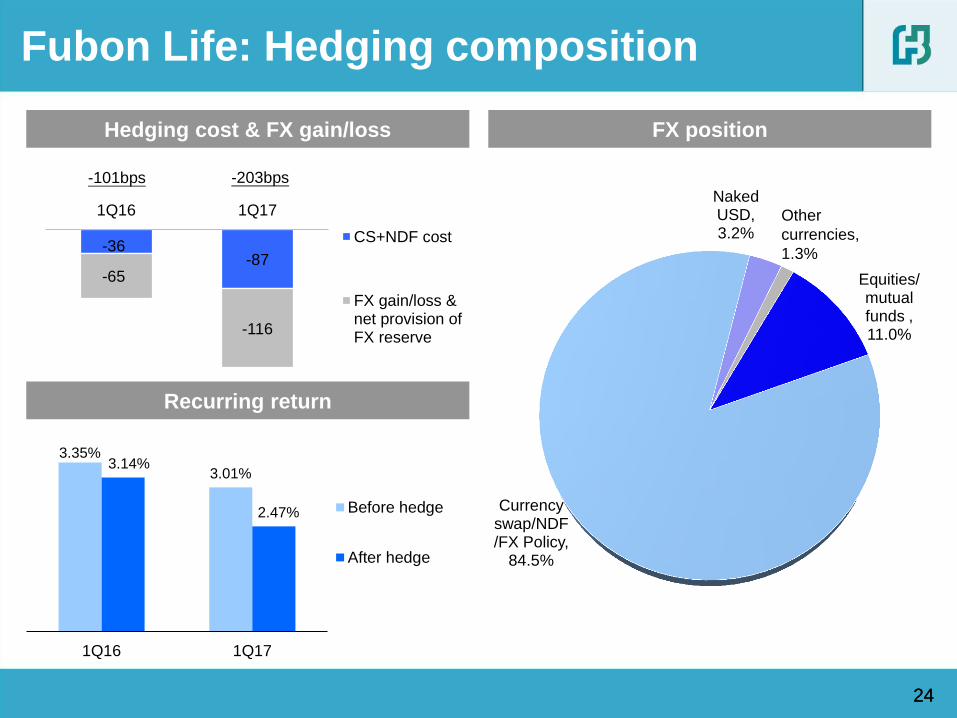
-36 -87
-65
-116
1Q16 1Q17
CS+NDF cost
FX gain/loss &net provision ofFX reserve
24 24
Hedging cost & FX gain/loss FX position
Recurring return
Fubon Life: Hedging composition
-101bps -203bps
3.35%
3.01% 3.14%
2.47%
1Q16 1Q17
Before hedge
After hedge
Currency swap/NDF/FX Policy,
84.5%
Naked USD, 3.2%
Equities/ mutual funds , 11.0%
Other
currencies,
1.3%
25 25
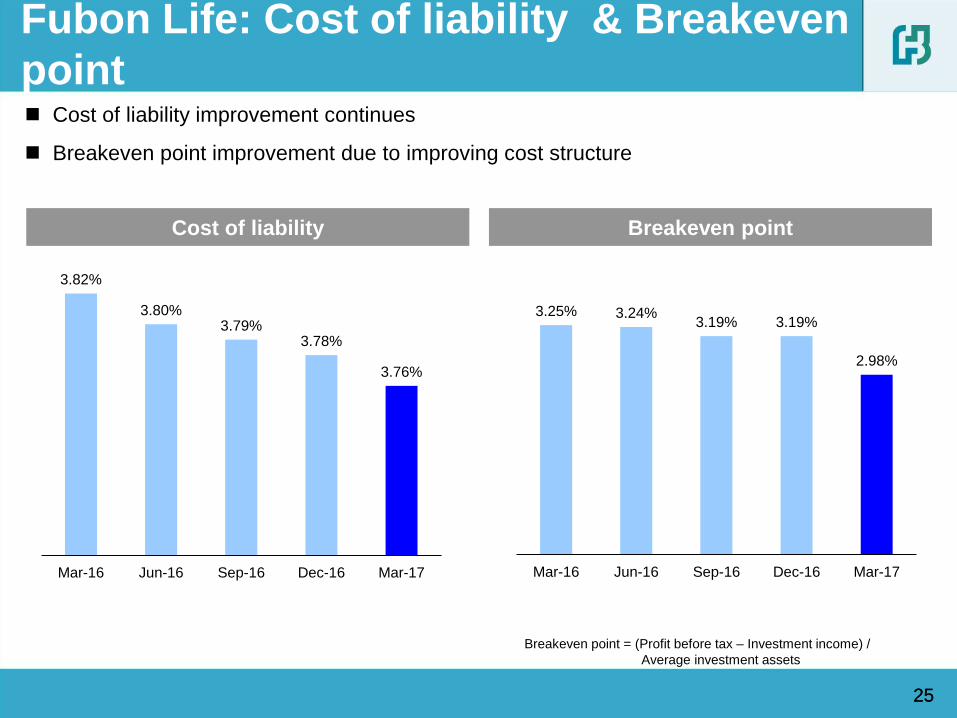
Fubon Life: Cost of liability & Breakeven
point Cost of liability improvement continues
Breakeven point improvement due to improving cost structure
Breakeven point = (Profit before tax – Investment income) /
Average investment assets
Cost of liability Breakeven point
3.82%
3.80% 3.79%
3.78%
3.76%
Mar-16 Jun-16 Sep-16 Dec-16 Mar-17
3.25% 3.24% 3.19% 3.19%
2.98%
Mar-16 Jun-16 Sep-16 Dec-16 Mar-17
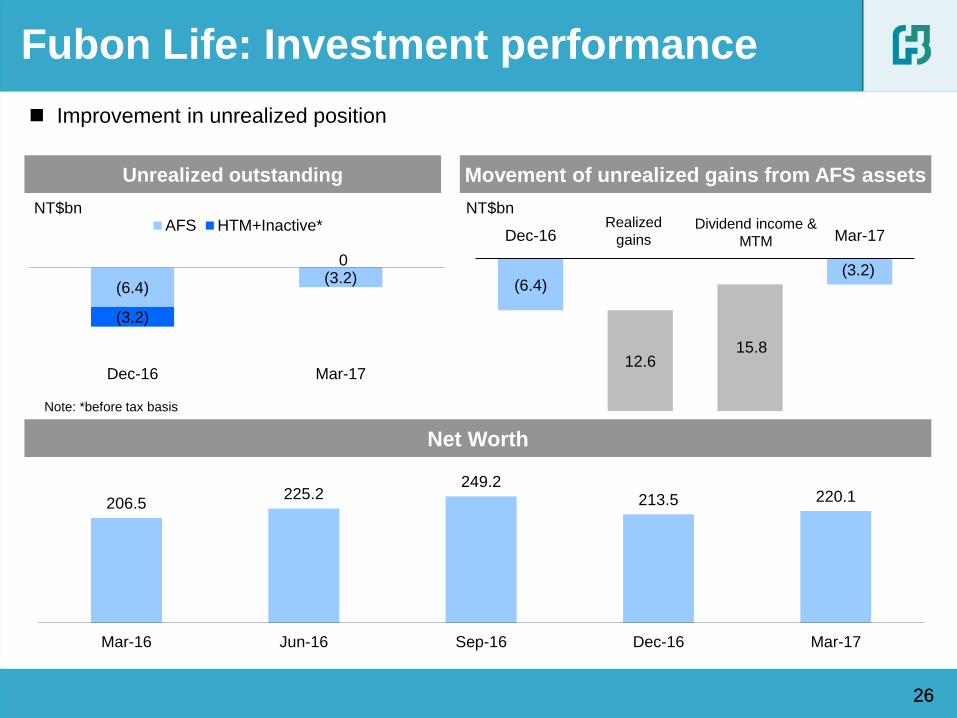
(6.4) (3.2)
12.6 15.8
Dec-16 Mar-17
26 26
Net Worth
Unrealized outstanding
Fubon Life: Investment performance
Improvement in unrealized position
NT$bn NT$bn Realized
gains Dividend income &
MTM
Movement of unrealized gains from AFS assets
Note: *before tax basis
206.5 225.2
249.2 213.5 220.1
Mar-16 Jun-16 Sep-16 Dec-16 Mar-17
(6.4) (3.2)
(3.2)
0
Dec-16 Mar-17
AFS HTM+Inactive*
27
Performance review by subsidiary
• Fubon Life
• Fubon Securities
Performance highlights of Fubon Financial Holdings
• Fubon Insurance
Agenda
• Taipei Fubon Bank
• Fubon Bank (China)
2016 Embedded value of Fubon Life
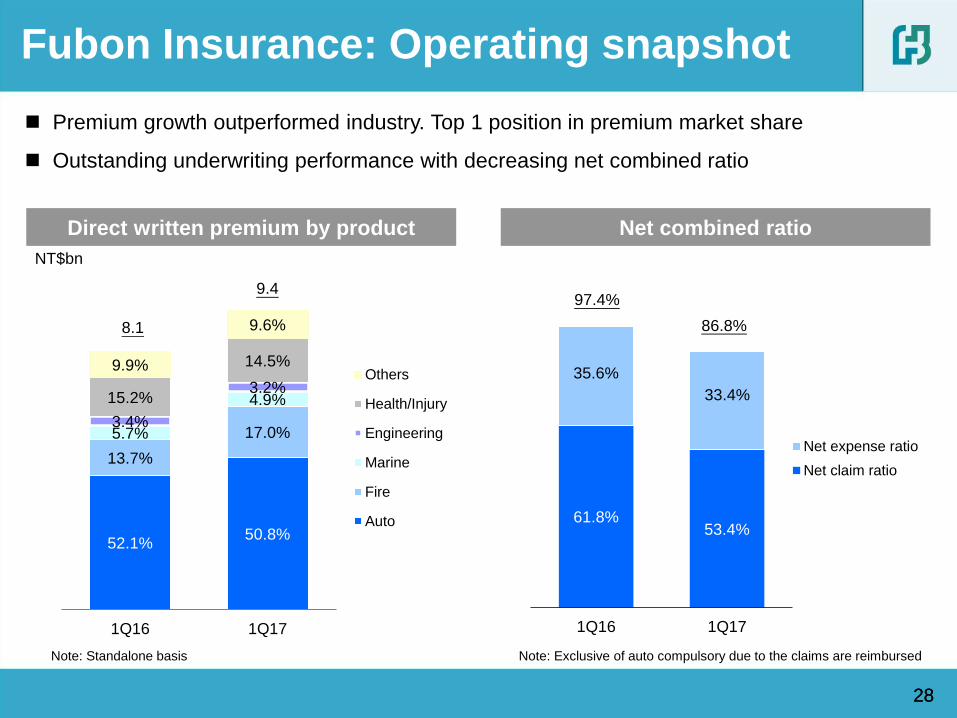
61.8% 53.4%
35.6%
33.4%
1Q16 1Q17
Net expense ratio
Net claim ratio
52.1% 50.8%
13.7%
17.0% 5.7%
4.9%
3.4%
3.2% 15.2%
14.5% 9.9%
9.6%
1Q16 1Q17
Others
Health/Injury
Engineering
Marine
Fire
Auto
28
Net combined ratio
28
NT$bn
Premium growth outperformed industry. Top 1 position in premium market share
Outstanding underwriting performance with decreasing net combined ratio
Note: Standalone basis Note: Exclusive of auto compulsory due to the claims are reimbursed
Fubon Insurance: Operating snapshot
Direct written premium by product
8.1
9.4
86.8%
97.4%
29
Performance review by subsidiary
• Fubon Life
• Fubon Securities
Performance highlights of Fubon Financial Holdings
• Fubon Insurance
Agenda
• Taipei Fubon Bank
• Fubon Bank (China)
2016 Embedded value of Fubon Life
30
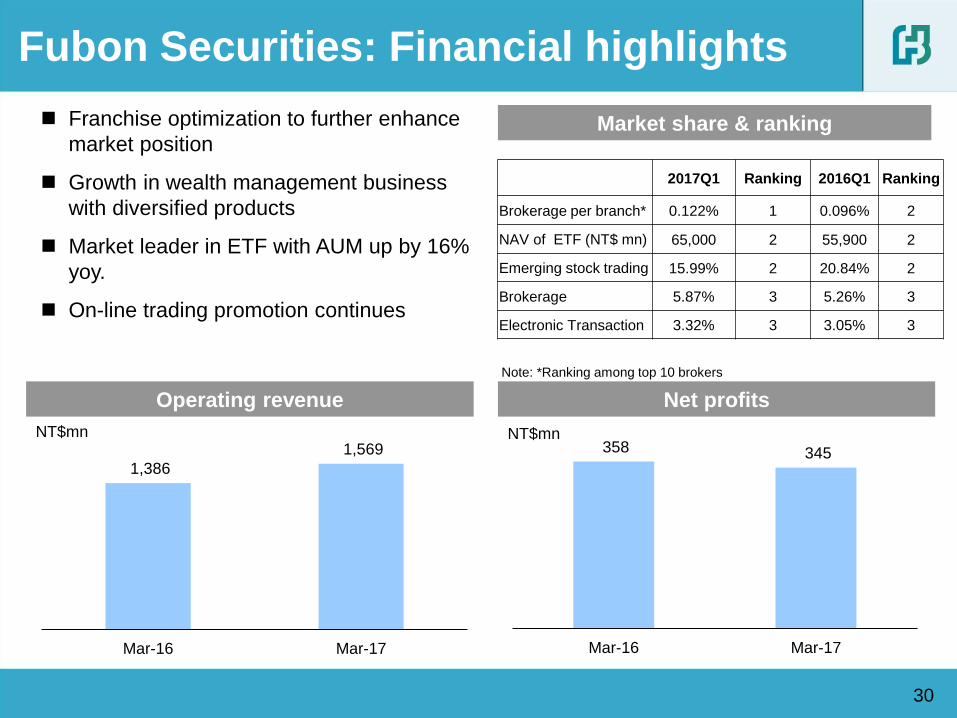
Fubon Securities: Financial highlights
Market share & ranking
Operating revenue
NT$mn
Franchise optimization to further enhance
market position
Growth in wealth management business
with diversified products
Market leader in ETF with AUM up by 16%
yoy.
On-line trading promotion continues
Net profits
NT$mn
Note: *Ranking among top 10 brokers
358 345
Mar-16 Mar-17
1,386
1,569
Mar-16 Mar-17
2017Q1 Ranking 2016Q1 Ranking
Brokerage per branch* 0.122% 1 0.096% 2
NAV of ETF (NT$ mn) 65,000 2 55,900 2
Emerging stock trading 15.99% 2 20.84% 2
Brokerage 5.87% 3 5.26% 3
Electronic Transaction 3.32% 3 3.05% 3
31
Performance review by subsidiary
• Fubon Life
• Fubon Securities
Performance highlights of Fubon Financial Holdings
• Fubon Insurance
Agenda
• Taipei Fubon Bank
• Fubon Bank (China)
2016 Embedded value of Fubon Life
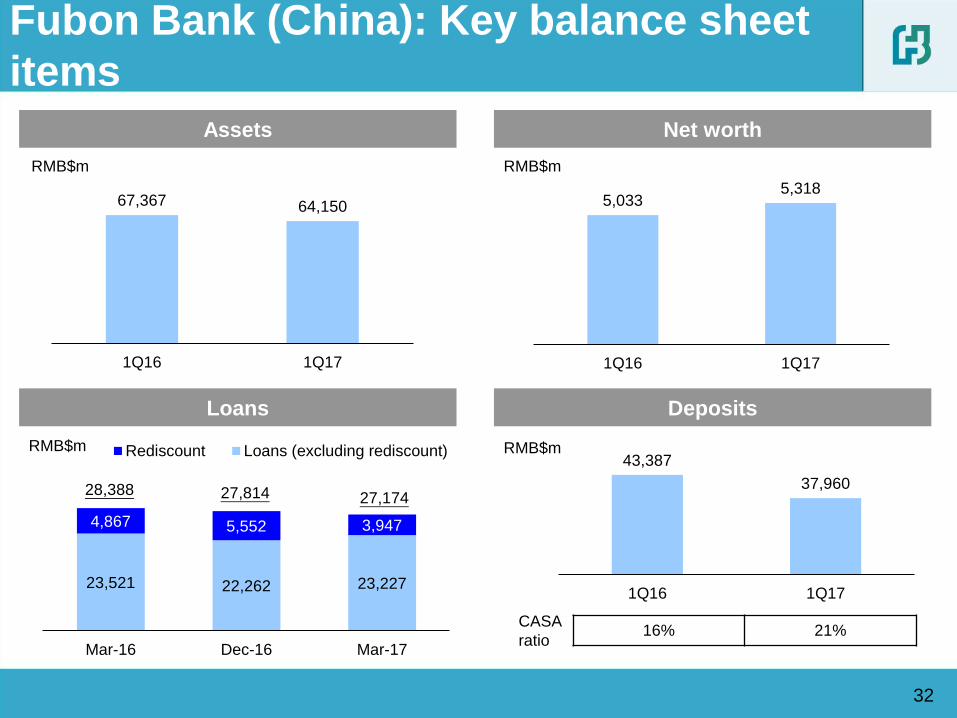
67,367 64,150
1Q16 1Q17
23,521 22,262 23,227
4,867 5,552 3,947
Mar-16 Dec-16 Mar-17
Rediscount Loans (excluding rediscount)
32
Fubon Bank (China): Key balance sheet
items
Assets Net worth
Deposits Loans
RMB$m
28,388
RMB$m RMB$m
RMB$m
5,033 5,318
1Q16 1Q17
43,387
37,960
1Q16 1Q17
27,814 27,174
16% 21% CASA
ratio
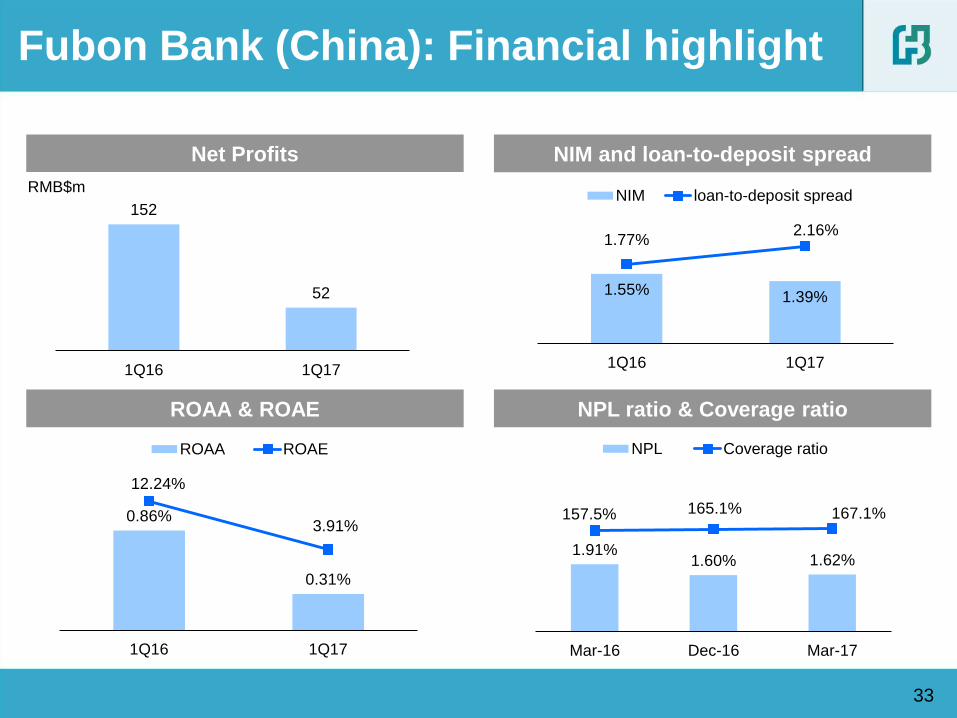
33
Fubon Bank (China): Financial highlight
ROAA & ROAE
NIM and loan-to-deposit spread Net Profits
NPL ratio & Coverage ratio
RMB$m
152
52
1Q16 1Q17
0.86%
0.31%
12.24%
3.91%
1Q16 1Q17
ROAA ROAE
1.91% 1.60% 1.62%
157.5% 165.1% 167.1%
Mar-16 Dec-16 Mar-17
NPL Coverage ratio
1.55% 1.39%
1.77% 2.16%
1Q16 1Q17
NIM loan-to-deposit spread
34
Performance review by subsidiary
• Fubon Life
• Fubon Securities
Performance highlights of Fubon Financial Holdings
• Fubon Insurance
Agenda
• Taipei Fubon Bank
• Fubon Bank (China)
2016 Embedded value of Fubon Life
35
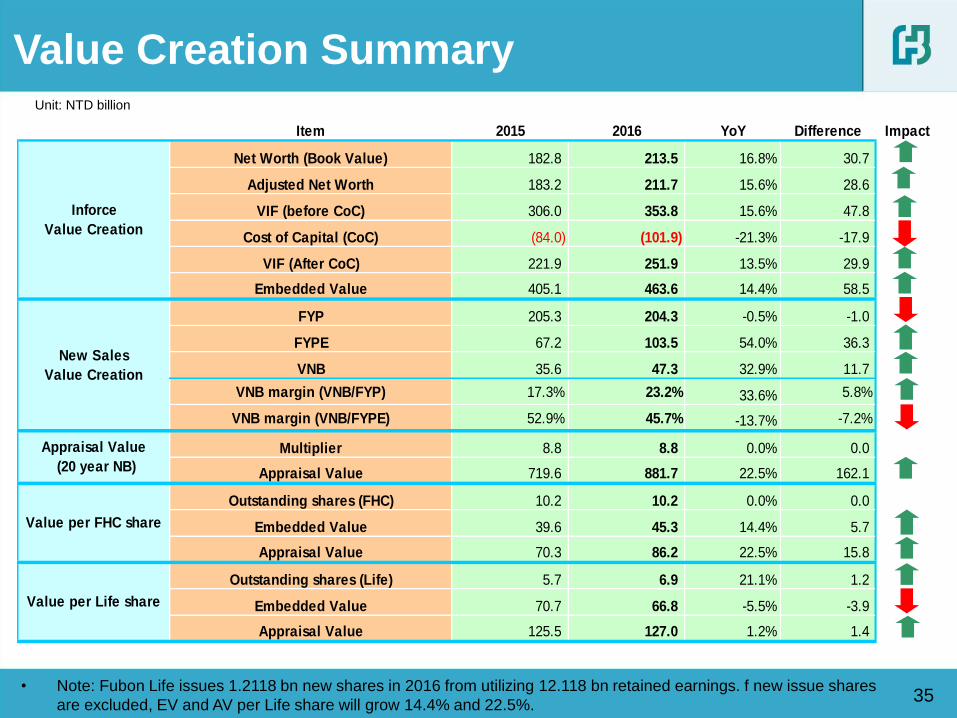
Value Creation Summary Unit: NTD billion
Item 2015 2016 YoY Difference Impact
Net Worth (Book Value) 182.8 213.5 16.8% 30.7
Adjusted Net Worth 183.2 211.7 15.6% 28.6
VIF (before CoC) 306.0 353.8 15.6% 47.8
Cost of Capital (CoC) (84.0) (101.9) -21.3% -17.9
VIF (After CoC) 221.9 251.9 13.5% 29.9
Embedded Value 405.1 463.6 14.4% 58.5
FYP 205.3 204.3 -0.5% -1.0
FYPE 67.2 103.5 54.0% 36.3
VNB 35.6 47.3 32.9% 11.7
VNB margin (VNB/FYP) 17.3% 23.2% 33.6% 5.8%
VNB margin (VNB/FYPE) 52.9% 45.7% -13.7% -7.2%
Multiplier 8.8 8.8 0.0% 0.0
Appraisal Value 719.6 881.7 22.5% 162.1
Outstanding shares (FHC) 10.2 10.2 0.0% 0.0
Embedded Value 39.6 45.3 14.4% 5.7
Appraisal Value 70.3 86.2 22.5% 15.8
Outstanding shares (Life) 5.7 6.9 21.1% 1.2
Embedded Value 70.7 66.8 -5.5% -3.9
Appraisal Value 125.5 127.0 1.2% 1.4
Value per FHC share
Value per Life share
Inforce
Value Creation
New Sales
Value Creation
Appraisal Value
(20 year NB)
• Note: Fubon Life issues 1.2118 bn new shares in 2016 from utilizing 12.118 bn retained earnings. f new issue shares
are excluded, EV and AV per Life share will grow 14.4% and 22.5%.
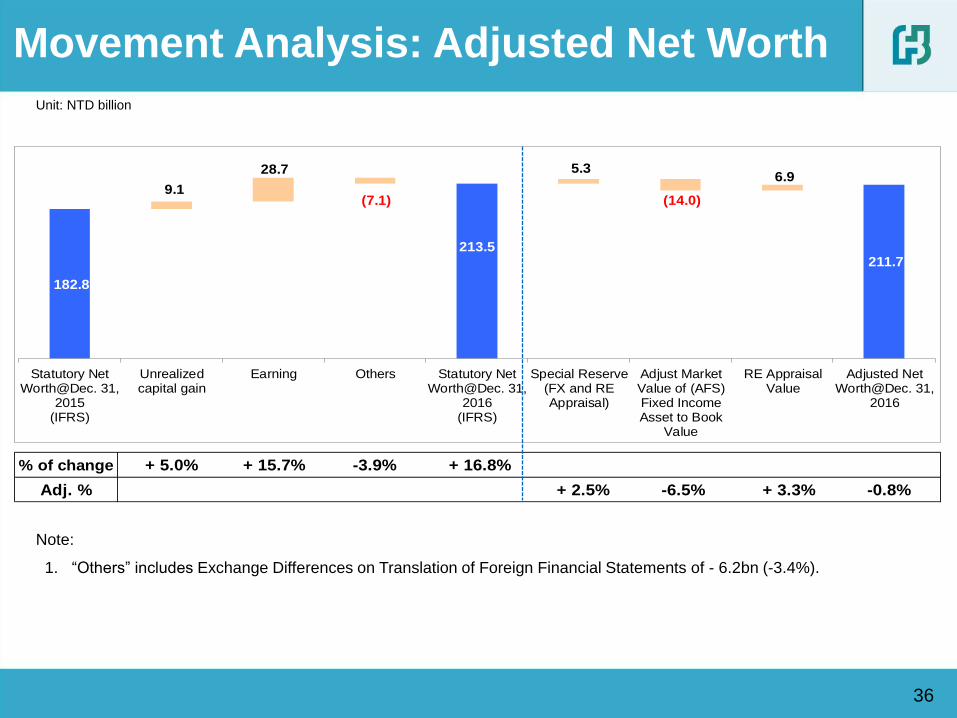
% of change + 5.0% + 15.7% -3.9% + 16.8%
Adj. % + 2.5% -6.5% + 3.3% -0.8%
182.8
9.1
28.7
(7.1)
213.5
5.3
(14.0)
6.9
211.7
Statutory NetWorth@Dec. 31,
2015(IFRS)
Unrealizedcapital gain
Earning Others Statutory NetWorth@Dec. 31,
2016(IFRS)
Special Reserve(FX and REAppraisal)
Adjust MarketValue of (AFS)Fixed IncomeAsset to Book
Value
RE AppraisalValue
Adjusted NetWorth@Dec. 31,
2016
36
Note:
1. “Others” includes Exchange Differences on Translation of Foreign Financial Statements of - 6.2bn (-3.4%).
Movement Analysis: Adjusted Net Worth
Unit: NTD billion
37
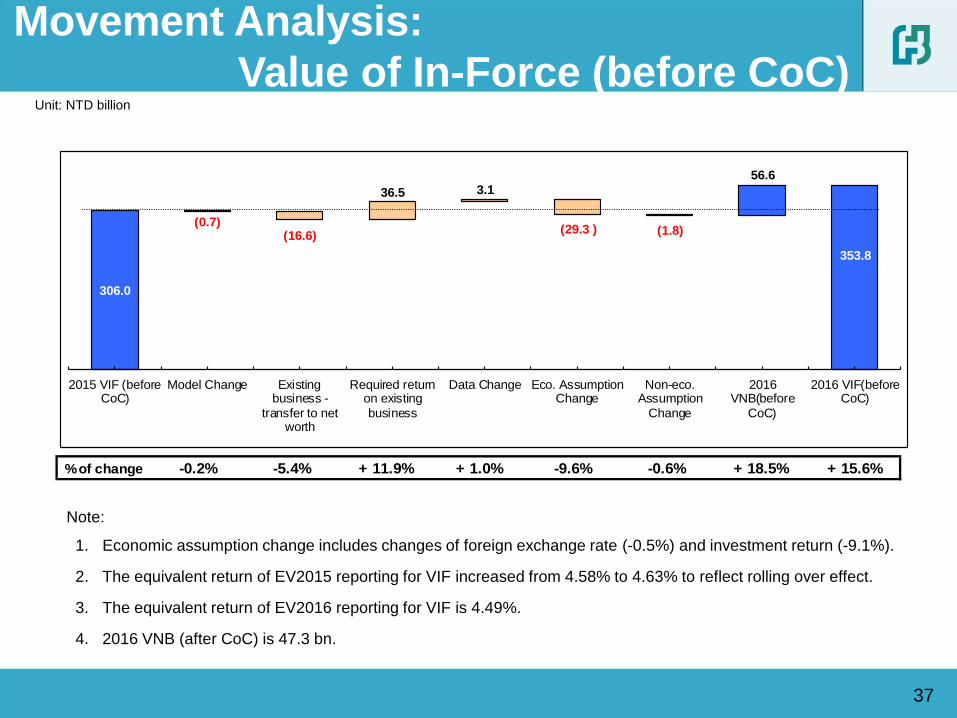
Note:
1. Economic assumption change includes changes of foreign exchange rate (-0.5%) and investment return (-9.1%).
2. The equivalent return of EV2015 reporting for VIF increased from 4.58% to 4.63% to reflect rolling over effect.
3. The equivalent return of EV2016 reporting for VIF is 4.49%.
4. 2016 VNB (after CoC) is 47.3 bn.
Unit: NTD billion
Movement Analysis:
Value of In-Force (before CoC)
% of change -0.2% -5.4% + 11.9% + 1.0% -9.6% -0.6% + 18.5% + 15.6%
306.0
(0.7) (16.6)
36.5 3.1
(29.3 ) (1.8)
56.6
353.8
-50.0
0.0
50. 0
100.0
150.0
200.0
250.0
300.0
350.0
400.0
2015 VIF (beforeCoC)
Model Change Existingbusiness -
transfer to networth
Required returnon existing
business
Data Change Eco. AssumptionChange
Non-eco.Assumption
Change
2016VNB(before
CoC)
2016 VIF(beforeCoC)
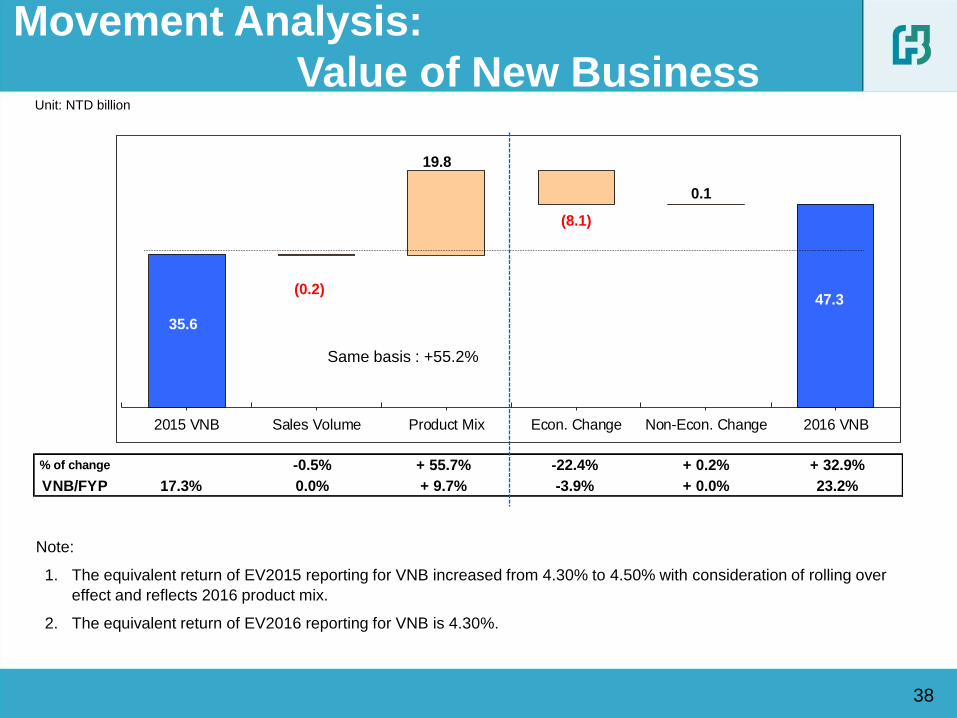
% of change -0.5% + 55.7% -22.4% + 0.2% + 32.9%
VNB/FYP 17.3% 0.0% + 9.7% -3.9% + 0.0% 23.2%
(8.1)
35.6
(0.2)
19.8
0.1
47.3
-8. 0
-6. 0
-4. 0
-2. 0
0.0
2.0
4.0
6.0
8.0
10.0
12.0
14.0
16.0
18.0
20.0
22.0
24.0
26.0
28.0
30.0
32.0
34.0
36.0
38.0
40.0
42.0
44.0
46.0
48.0
50.0
52.0
54.0
56.0
58.0
60.0
2015 VNB Sales Volume Product Mix Econ. Change Non-Econ. Change 2016 VNB
38
Note:
1. The equivalent return of EV2015 reporting for VNB increased from 4.30% to 4.50% with consideration of rolling over
effect and reflects 2016 product mix.
2. The equivalent return of EV2016 reporting for VNB is 4.30%.
Movement Analysis:
Value of New Business Unit: NTD billion
Same basis : +55.2%
39
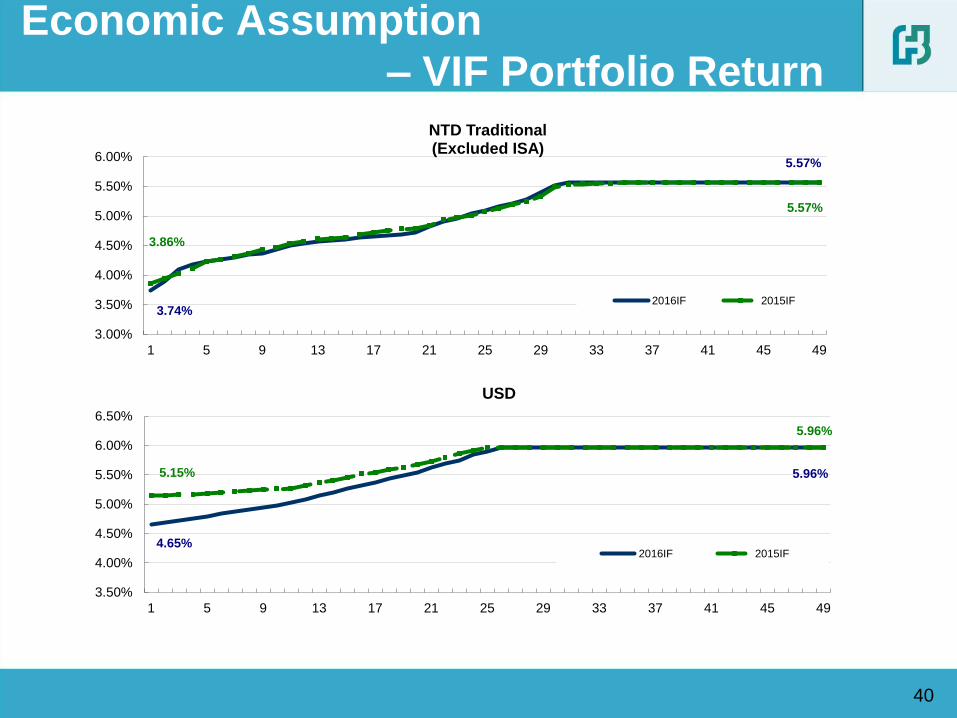
Economic Assumption
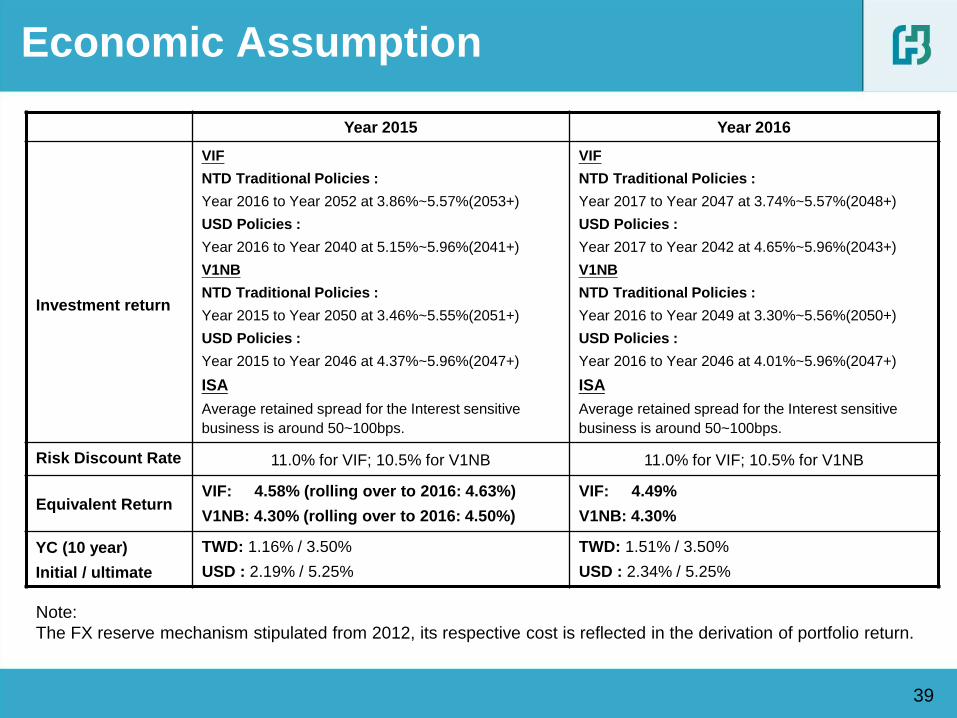
Note:
The FX reserve mechanism stipulated from 2012, its respective cost is reflected in the derivation of portfolio return.
Year 2015 Year 2016
Investment return
VIF
NTD Traditional Policies :
Year 2016 to Year 2052 at 3.86%~5.57%(2053+)
USD Policies :
Year 2016 to Year 2040 at 5.15%~5.96%(2041+)
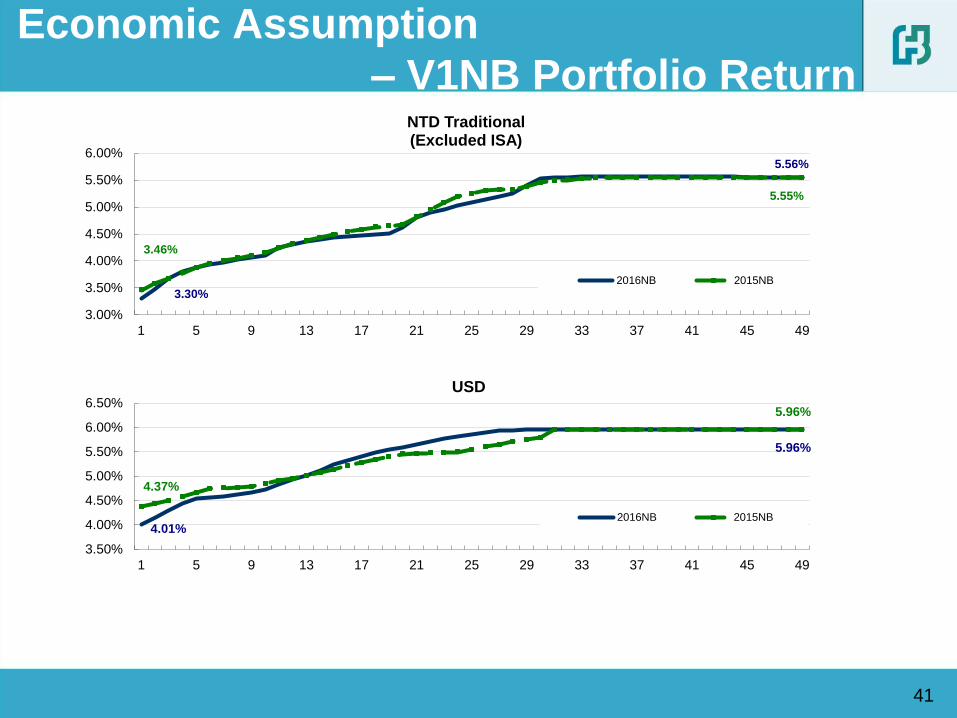
V1NB
NTD Traditional Policies :
Year 2015 to Year 2050 at 3.46%~5.55%(2051+)
USD Policies :
Year 2015 to Year 2046 at 4.37%~5.96%(2047+)
ISA
Average retained spread for the Interest sensitive
business is around 50~100bps.
VIF
NTD Traditional Policies :
Year 2017 to Year 2047 at 3.74%~5.57%(2048+)
USD Policies :
Year 2017 to Year 2042 at 4.65%~5.96%(2043+)
V1NB
NTD Traditional Policies :
Year 2016 to Year 2049 at 3.30%~5.56%(2050+)
USD Policies :
Year 2016 to Year 2046 at 4.01%~5.96%(2047+)
ISA
Average retained spread for the Interest sensitive
business is around 50~100bps.
Risk Discount Rate 11.0% for VIF; 10.5% for V1NB 11.0% for VIF; 10.5% for V1NB
Equivalent Return VIF: 4.58% (rolling over to 2016: 4.63%)
V1NB: 4.30% (rolling over to 2016: 4.50%)
VIF: 4.49%
V1NB: 4.30%
YC (10 year)
Initial / ultimate
TWD: 1.16% / 3.50%
USD : 2.19% / 5.25%
TWD: 1.51% / 3.50%
USD : 2.34% / 5.25%
40
Economic Assumption
– VIF Portfolio Return
3.74%
5.57%
3.86%
5.57%
3.00%
3.50%
4.00%
4.50%
5.00%
5.50%
6.00%
1 5 9 13 17 21 25 29 33 37 41 45 49
NTD Traditional (Excluded ISA)
2016IF 2015IF
4.65%
5.96% 5.15%
5.96%
3.50%
4.00%
4.50%
5.00%
5.50%
6.00%
6.50%
1 5 9 13 17 21 25 29 33 37 41 45 49
USD
2016IF 2015IF
41
Economic Assumption
– V1NB Portfolio Return
3.30%
5.56%
3.46%
5.55%
3.00%
3.50%
4.00%
4.50%
5.00%
5.50%
6.00%
1 5 9 13 17 21 25 29 33 37 41 45 49
NTD Traditional (Excluded ISA)
2016NB 2015NB
4.01%
5.96%
4.37%
5.96%
3.50%
4.00%
4.50%
5.00%
5.50%
6.00%
6.50%
1 5 9 13 17 21 25 29 33 37 41 45 49
USD
2016NB 2015NB
42
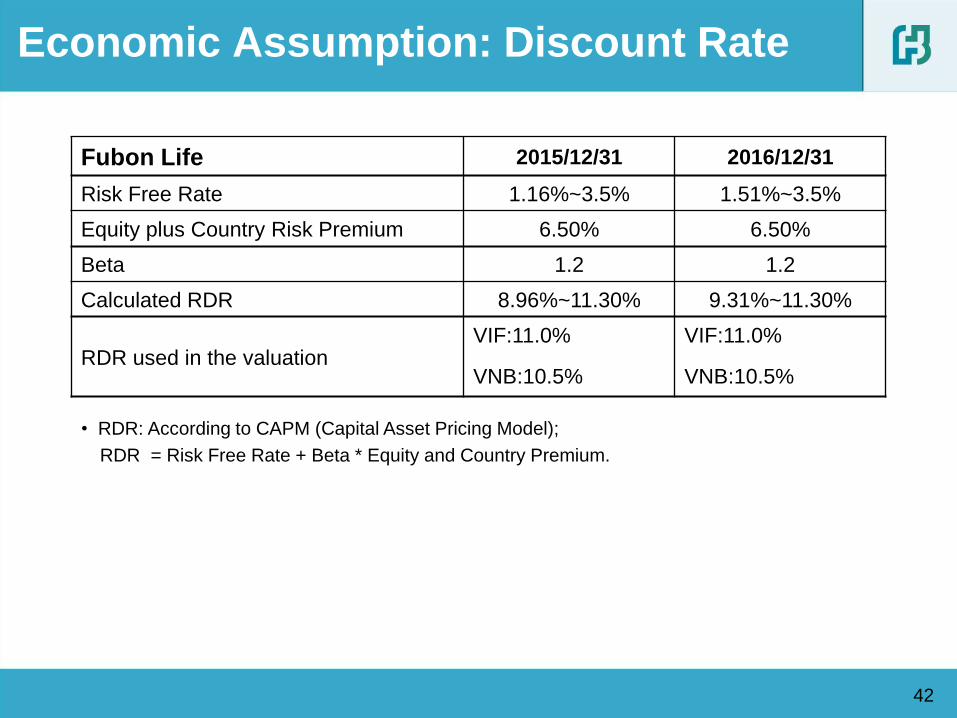
Economic Assumption: Discount Rate
Fubon Life 2015/12/31 2016/12/31
Risk Free Rate 1.16%~3.5% 1.51%~3.5%
Equity plus Country Risk Premium 6.50% 6.50%
Beta 1.2 1.2
Calculated RDR 8.96%~11.30% 9.31%~11.30%
RDR used in the valuation VIF:11.0%
VNB:10.5% VIF:11.0%
VNB:10.5%
• RDR: According to CAPM (Capital Asset Pricing Model);
RDR = Risk Free Rate + Beta * Equity and Country Premium.
43
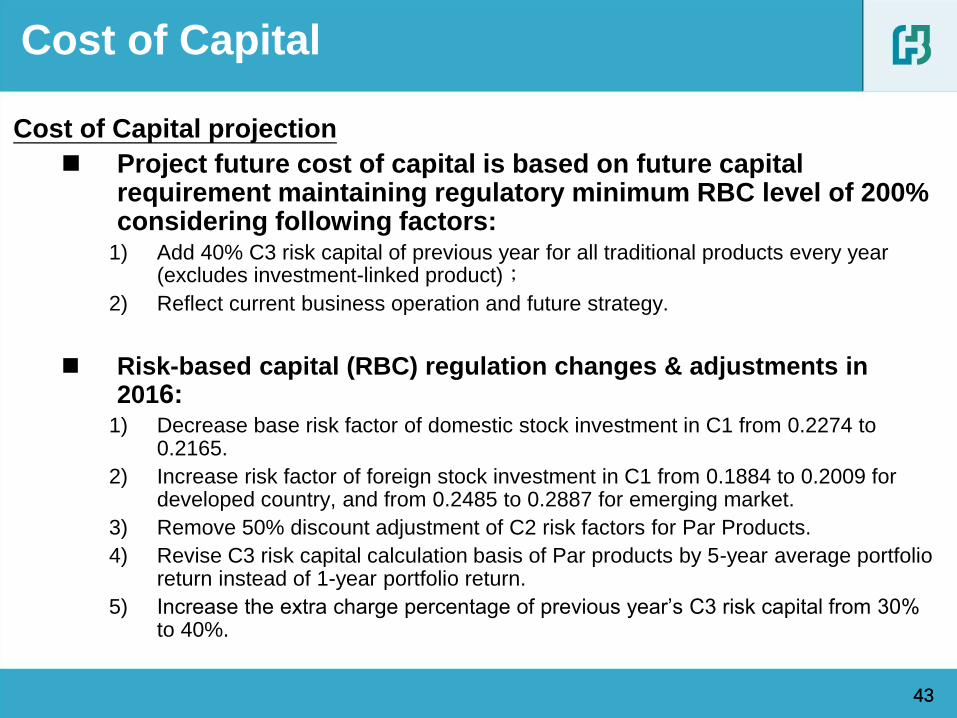
Cost of Capital
Cost of Capital projection
Project future cost of capital is based on future capital requirement maintaining regulatory minimum RBC level of 200% considering following factors:
1) Add 40% C3 risk capital of previous year for all traditional products every year (excludes investment-linked product);
2) Reflect current business operation and future strategy.
Risk-based capital (RBC) regulation changes & adjustments in 2016:
1) Decrease base risk factor of domestic stock investment in C1 from 0.2274 to 0.2165.
2) Increase risk factor of foreign stock investment in C1 from 0.1884 to 0.2009 for developed country, and from 0.2485 to 0.2887 for emerging market.
3) Remove 50% discount adjustment of C2 risk factors for Par Products.
4) Revise C3 risk capital calculation basis of Par products by 5-year average portfolio return instead of 1-year portfolio return.
5) Increase the extra charge percentage of previous year’s C3 risk capital from 30% to 40%.
43
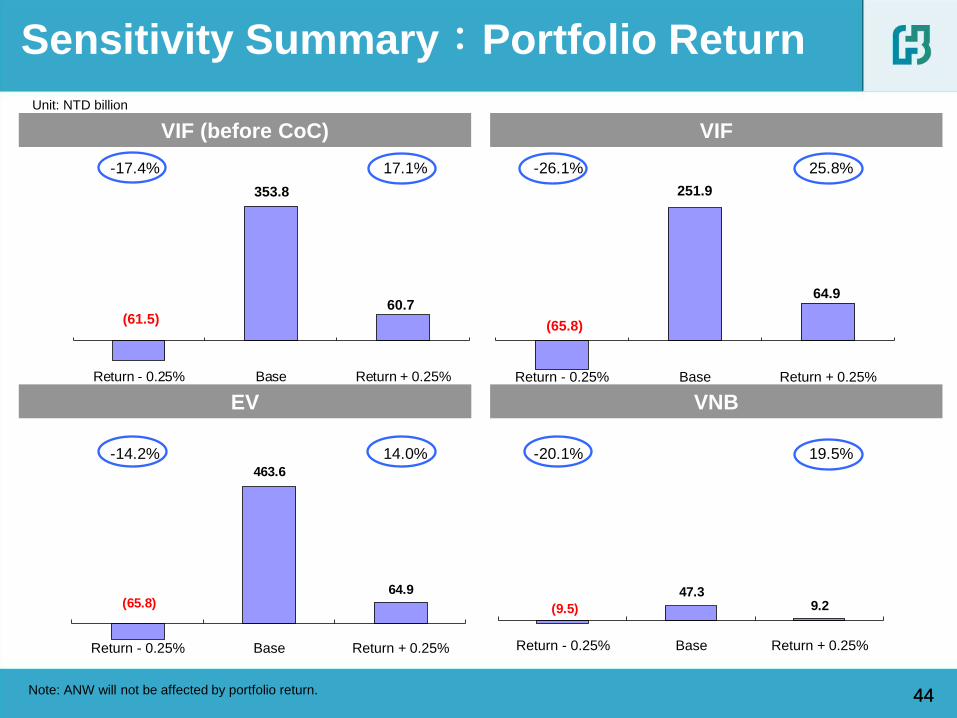
-17.4% 17.1% -26.1% 25.8%
-14.2% 14.0% -20.1% 19.5%
(61.5)
353.8
60.7
Return - 0.25% Base Return + 0.25%
(65.8)
463.6
64.9
Return - 0.25% Base Return + 0.25%
(65.8)
251.9
64.9
Return - 0.25% Base Return + 0.25%
(9.5)
47.3 9.2
Return - 0.25% Base Return + 0.25%
44
Sensitivity Summary:Portfolio Return
Note: ANW will not be affected by portfolio return.
VIF (before CoC) VIF
EV VNB
44
Unit: NTD billion
VIF (before CoC) VIF
VNB
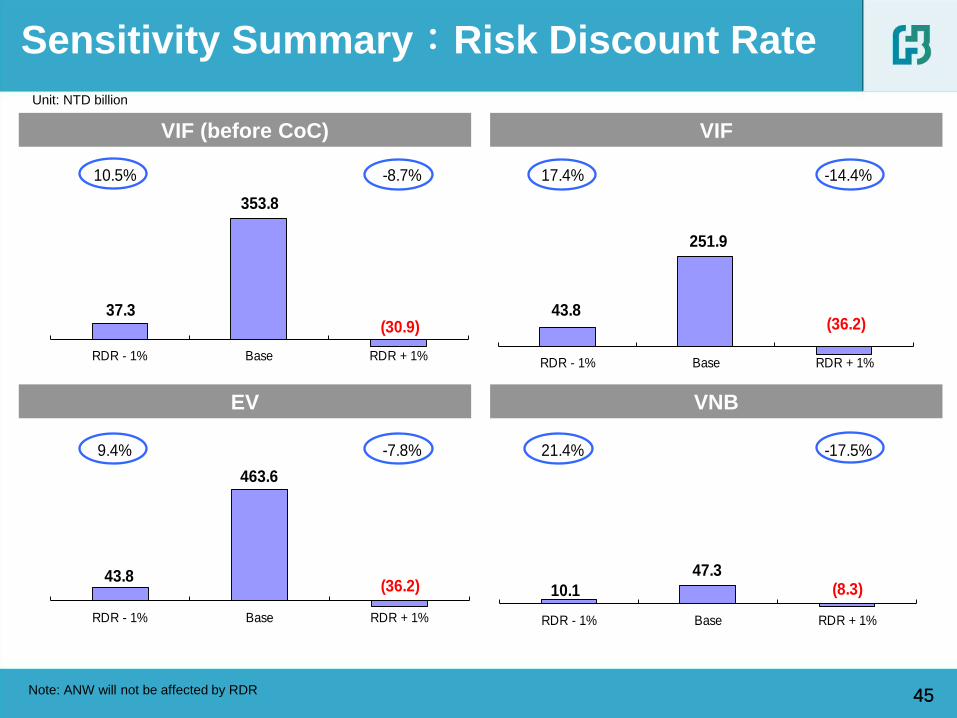
10.5% -8.7% 17.4% -14.4%
9.4% -7.8% 21.4% -17.5%
37.3
353.8
(30.9)
RDR - 1% Base RDR + 1%
43.8
463.6
(36.2)
RDR - 1% Base RDR + 1%
43.8
251.9
(36.2)
RDR - 1% Base RDR + 1%
10.1
47.3 (8.3)
RDR - 1% Base RDR + 1%
45
EV
Sensitivity Summary:Risk Discount Rate
45 Note: ANW will not be affected by RDR
Unit: NTD billion
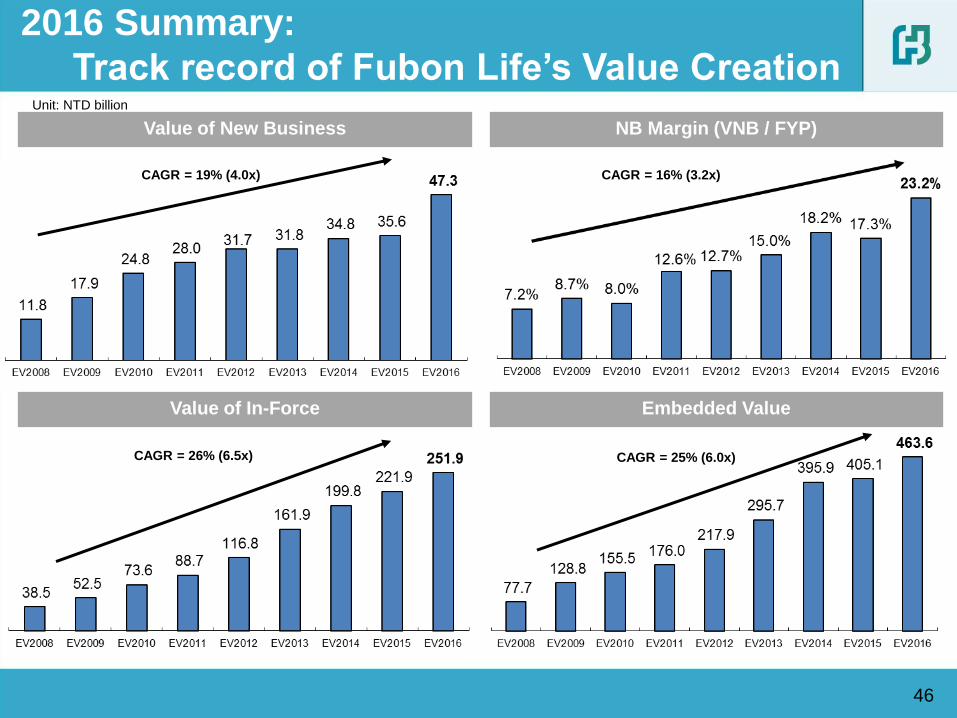
Value of New Business
46
單位: 新台幣十億元
CAGR = 19% (4.0x) CAGR = 16% (3.2x)
CAGR = 26% (6.5x) CAGR = 25% (6.0x)
2016 Summary:
Track record of Fubon Life’s Value Creation
NB Margin (VNB / FYP)
Value of In-Force Embedded Value
Unit: NTD billion
47
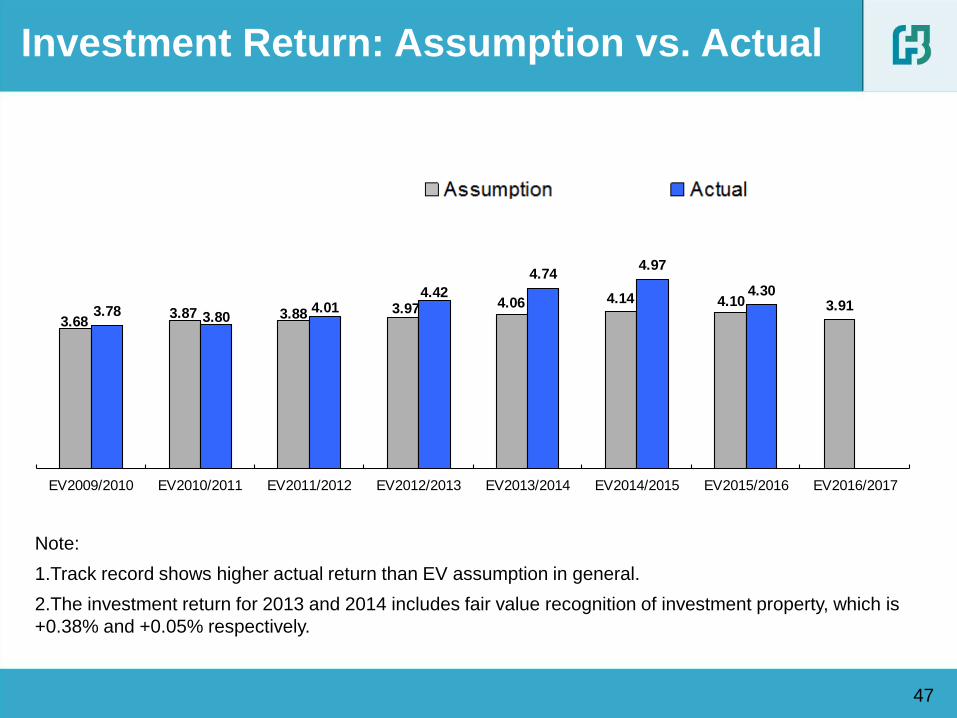
Investment Return: Assumption vs. Actual
Note:
1.Track record shows higher actual return than EV assumption in general.
2.The investment return for 2013 and 2014 includes fair value recognition of investment property, which is
+0.38% and +0.05% respectively.
3.68 3.87 3.88 3.97 4.06 4.14 4.10 3.913.78 3.80
4.01 4.42
4.74 4.97
4.30
EV2009/2010 EV2010/2011 EV2011/2012 EV2012/2013 EV2013/2014 EV2014/2015 EV2015/2016 EV2016/2017
48 48
Independent Review by Deloitte Consulting
Deloitte Consulting The Engagement
• Deloitte Advisory (Hong Kong) Limited (“Deloitte Consulting”) were retained by Fubon Life to perform an
independent review of the Embedded Value (EV) as at 31 December 2016 and the Value of One Year’s
New Business (V1NB) written over the period of 1 January 2016 to 31 December 2016.
Scope of Deloitte Consulting’s Involvement
• Review and opine on the reasonableness of the EV and V1NB as calculated by the Company;
• Review of the reasonableness of the assumptions used in the calculations, taking into consideration both
the Company’s recent experience and the experience of the Taiwanese life insurance market;
• Review, at a high-level, model changes to the actuarial projection model since the previous valuation date;
• Review of the Company’s projection approach of the Cost of Capital;
• Review of the data put through the model compared to the policy data on the Company’s policy
administration systems to judge the extent to which the business has been valued in the financial model
and to identify the portion (if any) omitted and how that was valued;
• Review of the approach used to determine the Adjusted Net Worth (“ANW”), in particular, the adjustments
made in deriving the ANW, and any other adjustments made outside of the actuarial projection model;
• Review of the Company's analysis of change in the Value of In-Force Business (“VIF”) between 31
December 2015 and 31 December 2016.
49 49
Risk Adjusted Discount Rates
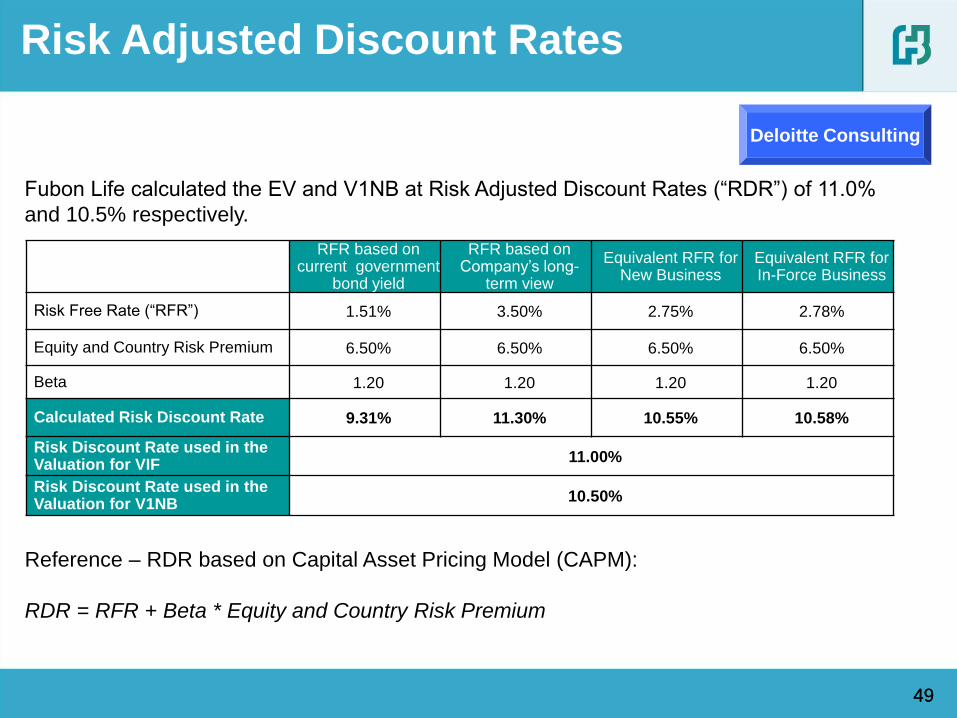
Fubon Life calculated the EV and V1NB at Risk Adjusted Discount Rates (“RDR”) of 11.0%
and 10.5% respectively.
RFR based on current government
bond yield
RFR based on Company’s long-
term view
Equivalent RFR for New Business
Equivalent RFR for In-Force Business
Risk Free Rate (“RFR”) 1.51% 3.50% 2.75% 2.78%
Equity and Country Risk Premium 6.50% 6.50% 6.50% 6.50%
Beta 1.20 1.20 1.20 1.20
Calculated Risk Discount Rate 9.31% 11.30% 10.55% 10.58%
Risk Discount Rate used in the Valuation for VIF
11.00%
Risk Discount Rate used in the Valuation for V1NB
10.50%
Reference – RDR based on Capital Asset Pricing Model (CAPM):
RDR = RFR + Beta * Equity and Country Risk Premium
Deloitte Consulting
50 50
Comments on the Risk Adjusted Discount Rates
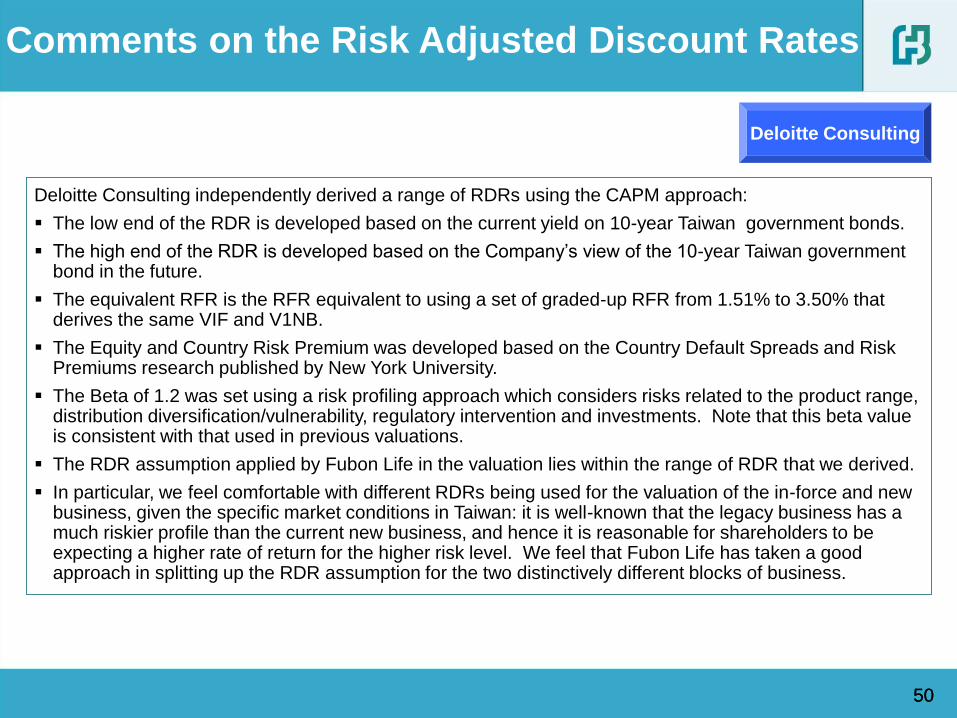
Deloitte Consulting independently derived a range of RDRs using the CAPM approach:
The low end of the RDR is developed based on the current yield on 10-year Taiwan government bonds.
The high end of the RDR is developed based on the Company’s view of the 10-year Taiwan government bond in the future.
The equivalent RFR is the RFR equivalent to using a set of graded-up RFR from 1.51% to 3.50% that derives the same VIF and V1NB.
The Equity and Country Risk Premium was developed based on the Country Default Spreads and Risk Premiums research published by New York University.
The Beta of 1.2 was set using a risk profiling approach which considers risks related to the product range, distribution diversification/vulnerability, regulatory intervention and investments. Note that this beta value is consistent with that used in previous valuations.
The RDR assumption applied by Fubon Life in the valuation lies within the range of RDR that we derived.
In particular, we feel comfortable with different RDRs being used for the valuation of the in-force and new business, given the specific market conditions in Taiwan: it is well-known that the legacy business has a much riskier profile than the current new business, and hence it is reasonable for shareholders to be expecting a higher rate of return for the higher risk level. We feel that Fubon Life has taken a good approach in splitting up the RDR assumption for the two distinctively different blocks of business.
Deloitte Consulting
51 51
Comments on Investment Return (1)
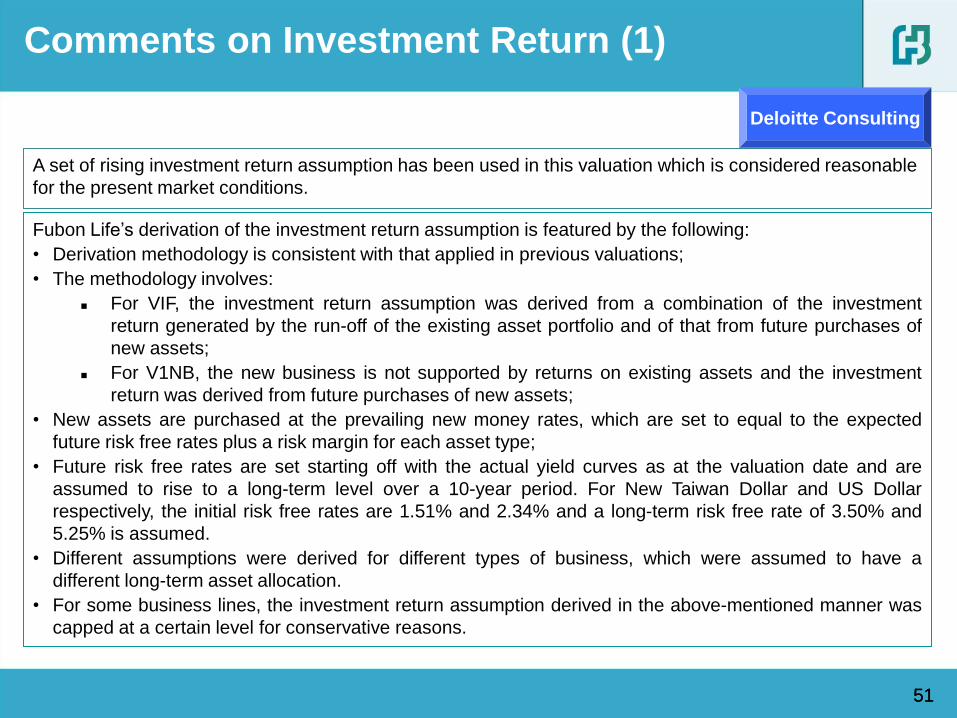
A set of rising investment return assumption has been used in this valuation which is considered reasonable
for the present market conditions.
Fubon Life’s derivation of the investment return assumption is featured by the following:
• Derivation methodology is consistent with that applied in previous valuations;
• The methodology involves:
For VIF, the investment return assumption was derived from a combination of the investment
return generated by the run-off of the existing asset portfolio and of that from future purchases of
new assets;
For V1NB, the new business is not supported by returns on existing assets and the investment
return was derived from future purchases of new assets;
• New assets are purchased at the prevailing new money rates, which are set to equal to the expected
future risk free rates plus a risk margin for each asset type;
• Future risk free rates are set starting off with the actual yield curves as at the valuation date and are
assumed to rise to a long-term level over a 10-year period. For New Taiwan Dollar and US Dollar
respectively, the initial risk free rates are 1.51% and 2.34% and a long-term risk free rate of 3.50% and
5.25% is assumed.
• Different assumptions were derived for different types of business, which were assumed to have a
different long-term asset allocation.
• For some business lines, the investment return assumption derived in the above-mentioned manner was
capped at a certain level for conservative reasons.
Deloitte Consulting
52 52
Comments on Investment Return (2)
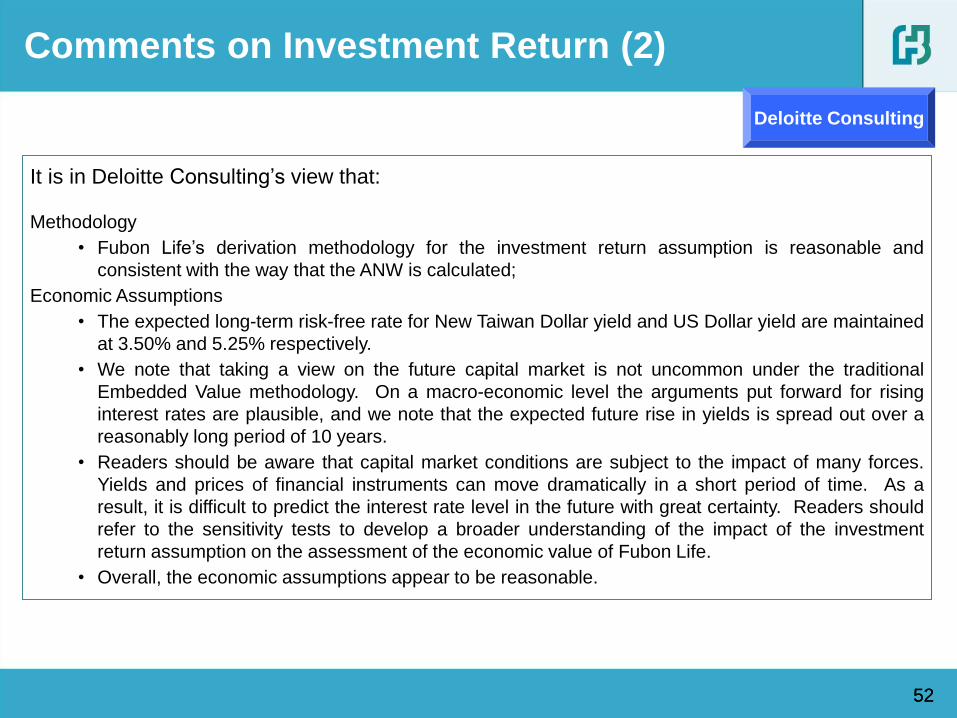
It is in Deloitte Consulting’s view that:
Methodology
• Fubon Life’s derivation methodology for the investment return assumption is reasonable and
consistent with the way that the ANW is calculated;
Economic Assumptions
• The expected long-term risk-free rate for New Taiwan Dollar yield and US Dollar yield are maintained
at 3.50% and 5.25% respectively.
• We note that taking a view on the future capital market is not uncommon under the traditional
Embedded Value methodology. On a macro-economic level the arguments put forward for rising
interest rates are plausible, and we note that the expected future rise in yields is spread out over a
reasonably long period of 10 years.
• Readers should be aware that capital market conditions are subject to the impact of many forces.
Yields and prices of financial instruments can move dramatically in a short period of time. As a
result, it is difficult to predict the interest rate level in the future with great certainty. Readers should
refer to the sensitivity tests to develop a broader understanding of the impact of the investment
return assumption on the assessment of the economic value of Fubon Life.
• Overall, the economic assumptions appear to be reasonable.
Deloitte Consulting
53 53
Comments on Non-Economic Assumptions
Non - Economic Assumptions
• The non-economic assumptions reflect Fubon Life’s best estimate of future operating experience,
and are appropriately supported by the company’s historical operating experience.
Deloitte Consulting
54 54
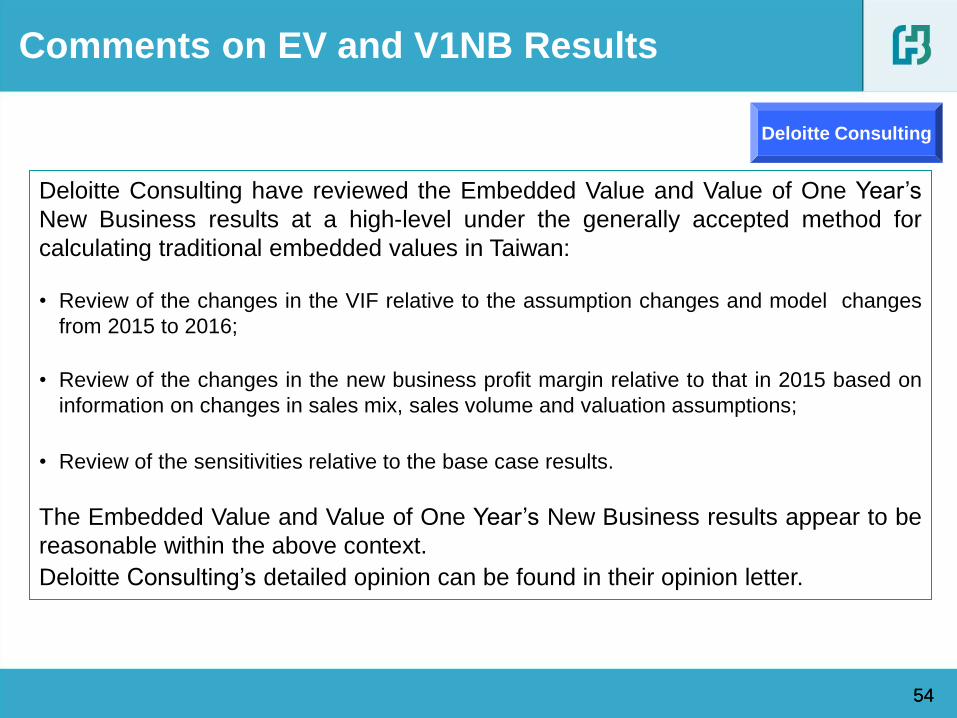
Comments on EV and V1NB Results
Deloitte Consulting have reviewed the Embedded Value and Value of One Year’s
New Business results at a high-level under the generally accepted method for
calculating traditional embedded values in Taiwan:
• Review of the changes in the VIF relative to the assumption changes and model changes
from 2015 to 2016;
• Review of the changes in the new business profit margin relative to that in 2015 based on
information on changes in sales mix, sales volume and valuation assumptions;
• Review of the sensitivities relative to the base case results.
The Embedded Value and Value of One Year’s New Business results appear to be
reasonable within the above context.
Deloitte Consulting’s detailed opinion can be found in their opinion letter.
Deloitte Consulting

Thank you
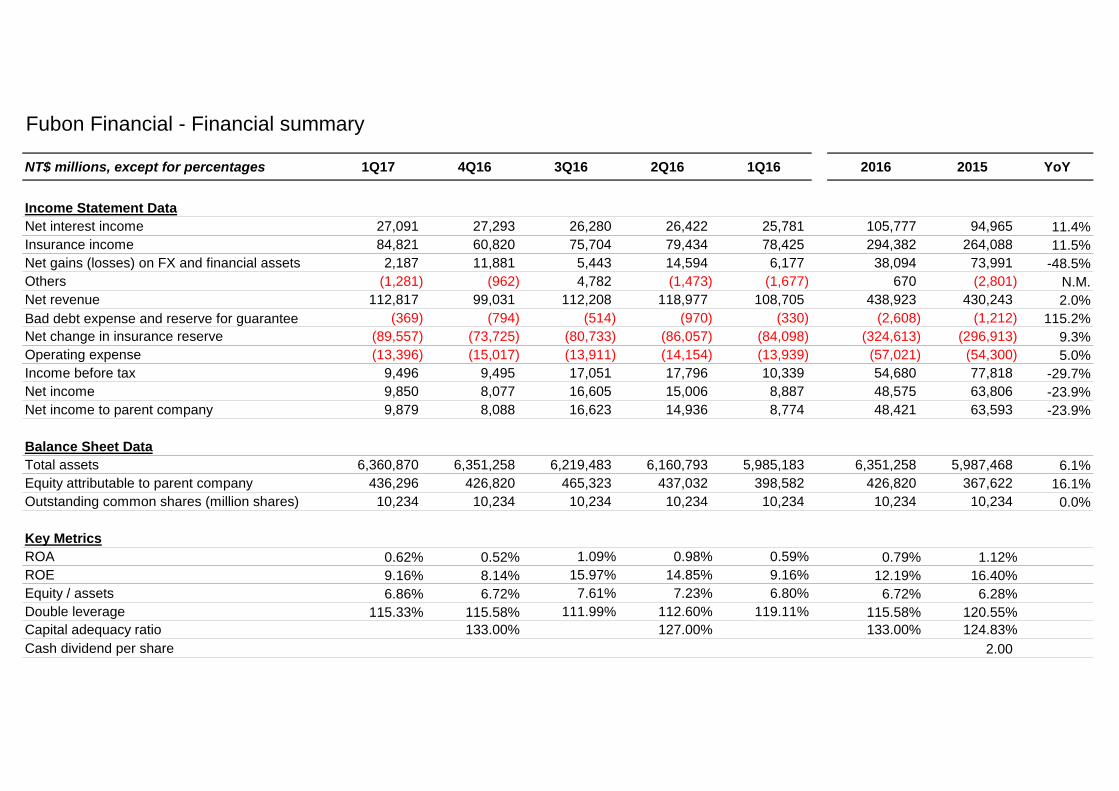
Fubon Financial - Financial summary
NT$ millions, except for percentages 1Q17 4Q16 3Q16 2Q16 1Q16 2016 2015 YoY
Income Statement DataNet interest income 27,091 27,293 26,280 26,422 25,781 105,777 94,965 11.4%Insurance income 84,821 60,820 75,704 79,434 78,425 294,382 264,088 11.5%Net gains (losses) on FX and financial assets 2,187 11,881 5,443 14,594 6,177 38,094 73,991 -48.5%Others (1,281) (962) 4,782 (1,473) (1,677) 670 (2,801) N.M.Net revenue 112,817 99,031 112,208 118,977 108,705 438,923 430,243 2.0%Bad debt expense and reserve for guarantee (369) (794) (514) (970) (330) (2,608) (1,212) 115.2%Net change in insurance reserve (89,557) (73,725) (80,733) (86,057) (84,098) (324,613) (296,913) 9.3%Operating expense (13,396) (15,017) (13,911) (14,154) (13,939) (57,021) (54,300) 5.0%Income before tax 9,496 9,495 17,051 17,796 10,339 54,680 77,818 -29.7%Net income 9,850 8,077 16,605 15,006 8,887 48,575 63,806 -23.9%Net income to parent company 9,879 8,088 16,623 14,936 8,774 48,421 63,593 -23.9%
Balance Sheet DataTotal assets 6,360,870 6,351,258 6,219,483 6,160,793 5,985,183 6,351,258 5,987,468 6.1%Equity attributable to parent company 436,296 426,820 465,323 437,032 398,582 426,820 367,622 16.1%Outstanding common shares (million shares) 10,234 10,234 10,234 10,234 10,234 10,234 10,234 0.0%
Key MetricsROA 0.62% 0.52% 1.09% 0.98% 0.59% 0.79% 1.12%ROE 9.16% 8.14% 15.97% 14.85% 9.16% 12.19% 16.40%Equity / assets 6.86% 6.72% 7.61% 7.23% 6.80% 6.72% 6.28%Double leverage 115.33% 115.58% 111.99% 112.60% 119.11% 115.58% 120.55%Capital adequacy ratio 133.00% 127.00% 133.00% 124.83%Cash dividend per share 2.00
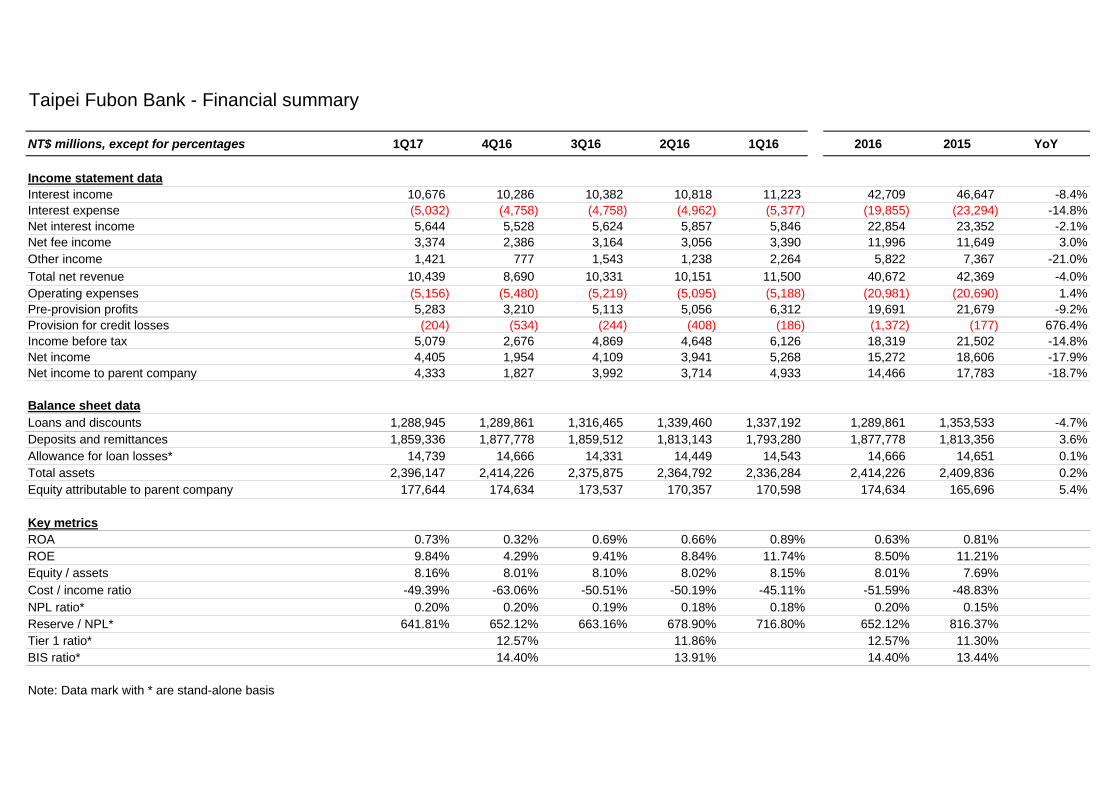
Taipei Fubon Bank - Financial summary
NT$ millions, except for percentages 1Q17 4Q16 3Q16 2Q16 1Q16 2016 2015 YoY
Income statement dataInterest income 10,676 10,286 10,382 10,818 11,223 42,709 46,647 -8.4%Interest expense (5,032) (4,758) (4,758) (4,962) (5,377) (19,855) (23,294) -14.8%Net interest income 5,644 5,528 5,624 5,857 5,846 22,854 23,352 -2.1%Net fee income 3,374 2,386 3,164 3,056 3,390 11,996 11,649 3.0%Other income 1,421 777 1,543 1,238 2,264 5,822 7,367 -21.0%Total net revenue 10,439 8,690 10,331 10,151 11,500 40,672 42,369 -4.0%Operating expenses (5,156) (5,480) (5,219) (5,095) (5,188) (20,981) (20,690) 1.4%Pre-provision profits 5,283 3,210 5,113 5,056 6,312 19,691 21,679 -9.2%Provision for credit losses (204) (534) (244) (408) (186) (1,372) (177) 676.4%Income before tax 5,079 2,676 4,869 4,648 6,126 18,319 21,502 -14.8%Net income 4,405 1,954 4,109 3,941 5,268 15,272 18,606 -17.9%Net income to parent company 4,333 1,827 3,992 3,714 4,933 14,466 17,783 -18.7%
Balance sheet dataLoans and discounts 1,288,945 1,289,861 1,316,465 1,339,460 1,337,192 1,289,861 1,353,533 -4.7%Deposits and remittances 1,859,336 1,877,778 1,859,512 1,813,143 1,793,280 1,877,778 1,813,356 3.6%Allowance for loan losses* 14,739 14,666 14,331 14,449 14,543 14,666 14,651 0.1%Total assets 2,396,147 2,414,226 2,375,875 2,364,792 2,336,284 2,414,226 2,409,836 0.2%Equity attributable to parent company 177,644 174,634 173,537 170,357 170,598 174,634 165,696 5.4%
Key metricsROA 0.73% 0.32% 0.69% 0.66% 0.89% 0.63% 0.81%ROE 9.84% 4.29% 9.41% 8.84% 11.74% 8.50% 11.21%Equity / assets 8.16% 8.01% 8.10% 8.02% 8.15% 8.01% 7.69%Cost / income ratio -49.39% -63.06% -50.51% -50.19% -45.11% -51.59% -48.83%NPL ratio* 0.20% 0.20% 0.19% 0.18% 0.18% 0.20% 0.15%Reserve / NPL* 641.81% 652.12% 663.16% 678.90% 716.80% 652.12% 816.37%Tier 1 ratio* 12.57% 11.86% 12.57% 11.30%BIS ratio* 14.40% 13.91% 14.40% 13.44%
Note: Data mark with * are stand-alone basis
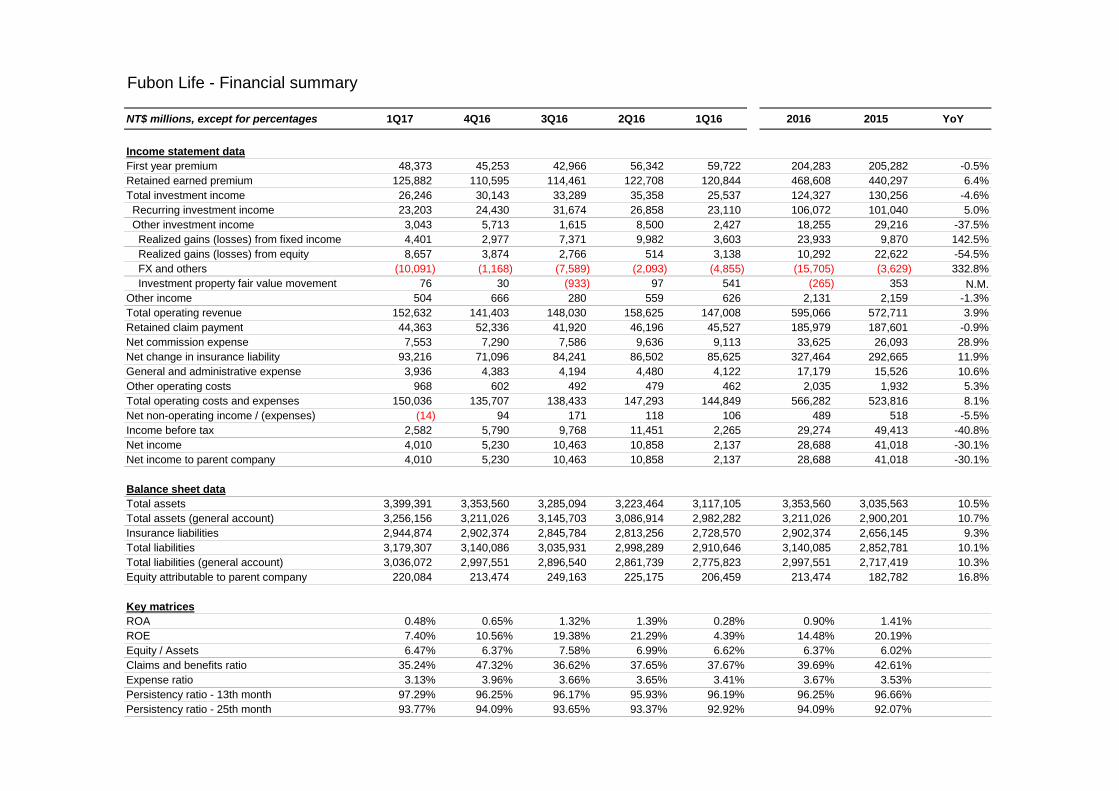
Fubon Life - Financial summary
NT$ millions, except for percentages 1Q17 4Q16 3Q16 2Q16 1Q16 2016 2015 YoY
Income statement dataFirst year premium 48,373 45,253 42,966 56,342 59,722 204,283 205,282 -0.5%Retained earned premium 125,882 110,595 114,461 122,708 120,844 468,608 440,297 6.4%Total investment income 26,246 30,143 33,289 35,358 25,537 124,327 130,256 -4.6% Recurring investment income 23,203 24,430 31,674 26,858 23,110 106,072 101,040 5.0% Other investment income 3,043 5,713 1,615 8,500 2,427 18,255 29,216 -37.5% Realized gains (losses) from fixed income 4,401 2,977 7,371 9,982 3,603 23,933 9,870 142.5% Realized gains (losses) from equity 8,657 3,874 2,766 514 3,138 10,292 22,622 -54.5% FX and others (10,091) (1,168) (7,589) (2,093) (4,855) (15,705) (3,629) 332.8% Investment property fair value movement 76 30 (933) 97 541 (265) 353 N.M.Other income 504 666 280 559 626 2,131 2,159 -1.3%Total operating revenue 152,632 141,403 148,030 158,625 147,008 595,066 572,711 3.9%Retained claim payment 44,363 52,336 41,920 46,196 45,527 185,979 187,601 -0.9%Net commission expense 7,553 7,290 7,586 9,636 9,113 33,625 26,093 28.9%Net change in insurance liability 93,216 71,096 84,241 86,502 85,625 327,464 292,665 11.9%General and administrative expense 3,936 4,383 4,194 4,480 4,122 17,179 15,526 10.6%Other operating costs 968 602 492 479 462 2,035 1,932 5.3%Total operating costs and expenses 150,036 135,707 138,433 147,293 144,849 566,282 523,816 8.1%Net non-operating income / (expenses) (14) 94 171 118 106 489 518 -5.5%Income before tax 2,582 5,790 9,768 11,451 2,265 29,274 49,413 -40.8%Net income 4,010 5,230 10,463 10,858 2,137 28,688 41,018 -30.1%Net income to parent company 4,010 5,230 10,463 10,858 2,137 28,688 41,018 -30.1%
Balance sheet dataTotal assets 3,399,391 3,353,560 3,285,094 3,223,464 3,117,105 3,353,560 3,035,563 10.5%Total assets (general account) 3,256,156 3,211,026 3,145,703 3,086,914 2,982,282 3,211,026 2,900,201 10.7%Insurance liabilities 2,944,874 2,902,374 2,845,784 2,813,256 2,728,570 2,902,374 2,656,145 9.3%Total liabilities 3,179,307 3,140,086 3,035,931 2,998,289 2,910,646 3,140,085 2,852,781 10.1%Total liabilities (general account) 3,036,072 2,997,551 2,896,540 2,861,739 2,775,823 2,997,551 2,717,419 10.3%Equity attributable to parent company 220,084 213,474 249,163 225,175 206,459 213,474 182,782 16.8%
Key matricesROA 0.48% 0.65% 1.32% 1.39% 0.28% 0.90% 1.41%ROE 7.40% 10.56% 19.38% 21.29% 4.39% 14.48% 20.19%Equity / Assets 6.47% 6.37% 7.58% 6.99% 6.62% 6.37% 6.02%Claims and benefits ratio 35.24% 47.32% 36.62% 37.65% 37.67% 39.69% 42.61%Expense ratio 3.13% 3.96% 3.66% 3.65% 3.41% 3.67% 3.53%Persistency ratio - 13th month 97.29% 96.25% 96.17% 95.93% 96.19% 96.25% 96.66%Persistency ratio - 25th month 93.77% 94.09% 93.65% 93.37% 92.92% 94.09% 92.07%
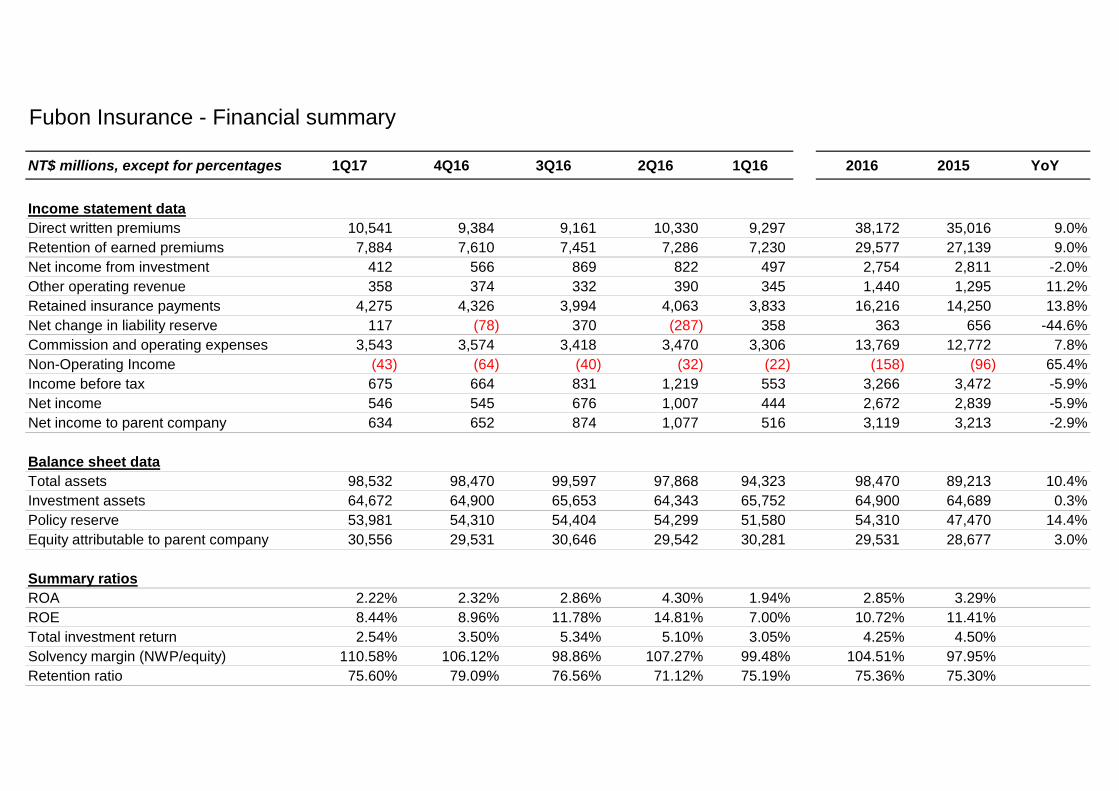
Fubon Insurance - Financial summary
NT$ millions, except for percentages 1Q17 4Q16 3Q16 2Q16 1Q16 2016 2015 YoY
Income statement dataDirect written premiums 10,541 9,384 9,161 10,330 9,297 38,172 35,016 9.0%Retention of earned premiums 7,884 7,610 7,451 7,286 7,230 29,577 27,139 9.0%Net income from investment 412 566 869 822 497 2,754 2,811 -2.0%Other operating revenue 358 374 332 390 345 1,440 1,295 11.2%Retained insurance payments 4,275 4,326 3,994 4,063 3,833 16,216 14,250 13.8%Net change in liability reserve 117 (78) 370 (287) 358 363 656 -44.6%Commission and operating expenses 3,543 3,574 3,418 3,470 3,306 13,769 12,772 7.8%Non-Operating Income (43) (64) (40) (32) (22) (158) (96) 65.4%Income before tax 675 664 831 1,219 553 3,266 3,472 -5.9%Net income 546 545 676 1,007 444 2,672 2,839 -5.9%Net income to parent company 634 652 874 1,077 516 3,119 3,213 -2.9%
Balance sheet dataTotal assets 98,532 98,470 99,597 97,868 94,323 98,470 89,213 10.4%Investment assets 64,672 64,900 65,653 64,343 65,752 64,900 64,689 0.3%Policy reserve 53,981 54,310 54,404 54,299 51,580 54,310 47,470 14.4%Equity attributable to parent company 30,556 29,531 30,646 29,542 30,281 29,531 28,677 3.0%
Summary ratiosROA 2.22% 2.32% 2.86% 4.30% 1.94% 2.85% 3.29%ROE 8.44% 8.96% 11.78% 14.81% 7.00% 10.72% 11.41%Total investment return 2.54% 3.50% 5.34% 5.10% 3.05% 4.25% 4.50%Solvency margin (NWP/equity) 110.58% 106.12% 98.86% 107.27% 99.48% 104.51% 97.95%Retention ratio 75.60% 79.09% 76.56% 71.12% 75.19% 75.36% 75.30%
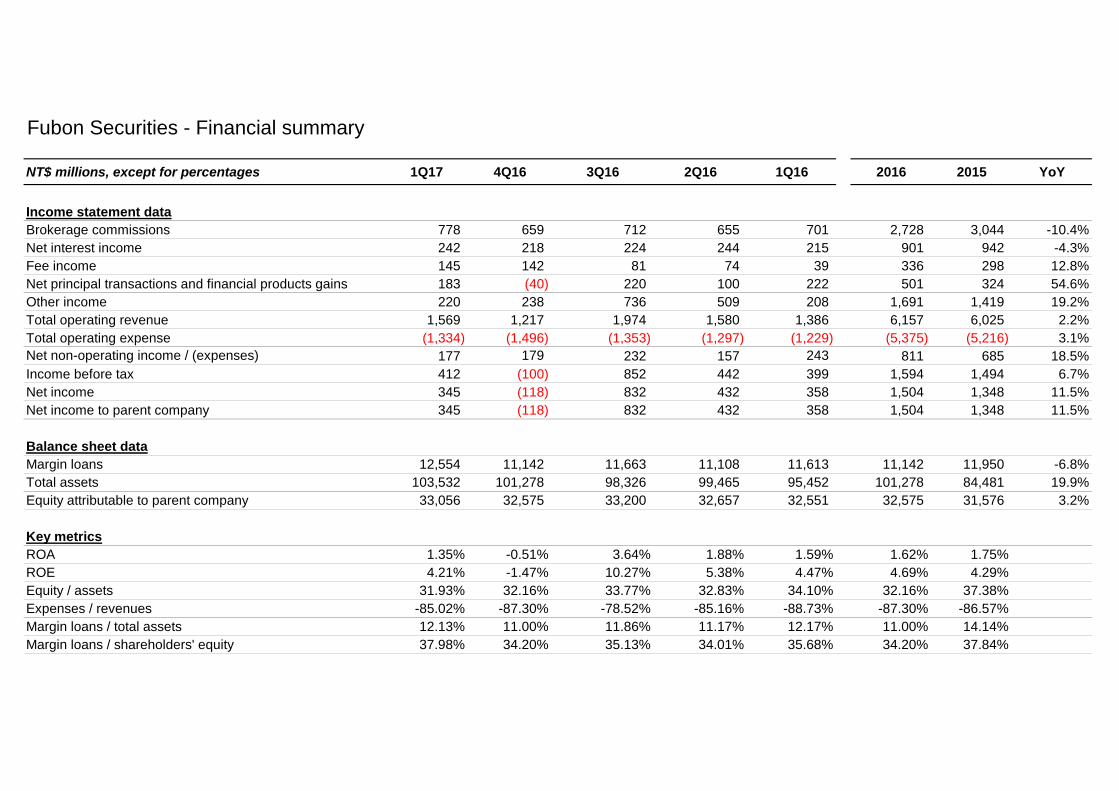
Fubon Securities - Financial summary
NT$ millions, except for percentages 1Q17 4Q16 3Q16 2Q16 1Q16 2016 2015 YoY
Income statement dataBrokerage commissions 778 659 712 655 701 2,728 3,044 -10.4%Net interest income 242 218 224 244 215 901 942 -4.3%Fee income 145 142 81 74 39 336 298 12.8%Net principal transactions and financial products gains 183 (40) 220 100 222 501 324 54.6%Other income 220 238 736 509 208 1,691 1,419 19.2%Total operating revenue 1,569 1,217 1,974 1,580 1,386 6,157 6,025 2.2%Total operating expense (1,334) (1,496) (1,353) (1,297) (1,229) (5,375) (5,216) 3.1%Net non-operating income / (expenses) 177 179 232 157 243 811 685 18.5%Income before tax 412 (100) 852 442 399 1,594 1,494 6.7%Net income 345 (118) 832 432 358 1,504 1,348 11.5%Net income to parent company 345 (118) 832 432 358 1,504 1,348 11.5%
Balance sheet dataMargin loans 12,554 11,142 11,663 11,108 11,613 11,142 11,950 -6.8%Total assets 103,532 101,278 98,326 99,465 95,452 101,278 84,481 19.9%Equity attributable to parent company 33,056 32,575 33,200 32,657 32,551 32,575 31,576 3.2%
Key metricsROA 1.35% -0.51% 3.64% 1.88% 1.59% 1.62% 1.75%ROE 4.21% -1.47% 10.27% 5.38% 4.47% 4.69% 4.29%Equity / assets 31.93% 32.16% 33.77% 32.83% 34.10% 32.16% 37.38%Expenses / revenues -85.02% -87.30% -78.52% -85.16% -88.73% -87.30% -86.57%Margin loans / total assets 12.13% 11.00% 11.86% 11.17% 12.17% 11.00% 14.14%Margin loans / shareholders' equity 37.98% 34.20% 35.13% 34.01% 35.68% 34.20% 37.84%
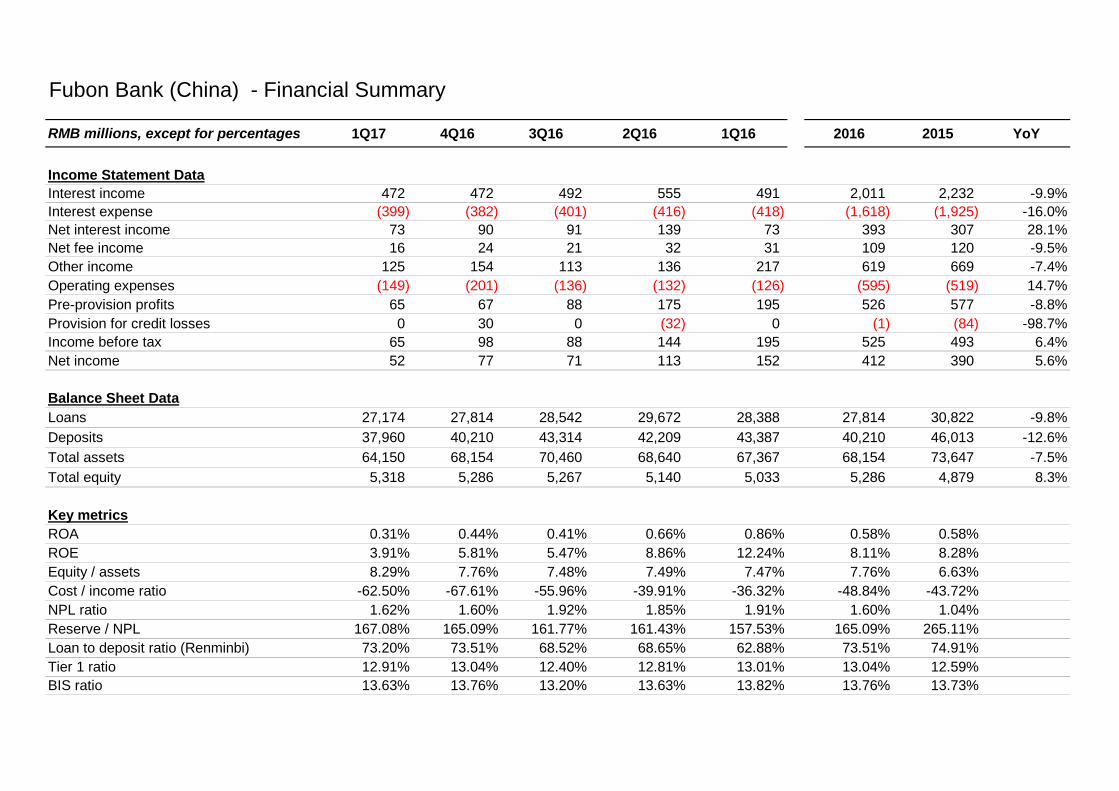
Fubon Bank (China) - Financial Summary
RMB millions, except for percentages 1Q17 4Q16 3Q16 2Q16 1Q16 2016 2015 YoY
Income Statement DataInterest income 472 472 492 555 491 2,011 2,232 -9.9%Interest expense (399) (382) (401) (416) (418) (1,618) (1,925) -16.0%Net interest income 73 90 91 139 73 393 307 28.1%Net fee income 16 24 21 32 31 109 120 -9.5%Other income 125 154 113 136 217 619 669 -7.4%Operating expenses (149) (201) (136) (132) (126) (595) (519) 14.7%Pre-provision profits 65 67 88 175 195 526 577 -8.8%Provision for credit losses 0 30 0 (32) 0 (1) (84) -98.7%Income before tax 65 98 88 144 195 525 493 6.4%Net income 52 77 71 113 152 412 390 5.6%
Balance Sheet DataLoans 27,174 27,814 28,542 29,672 28,388 27,814 30,822 -9.8%Deposits 37,960 40,210 43,314 42,209 43,387 40,210 46,013 -12.6%Total assets 64,150 68,154 70,460 68,640 67,367 68,154 73,647 -7.5%Total equity 5,318 5,286 5,267 5,140 5,033 5,286 4,879 8.3%
Key metricsROA 0.31% 0.44% 0.41% 0.66% 0.86% 0.58% 0.58%ROE 3.91% 5.81% 5.47% 8.86% 12.24% 8.11% 8.28%Equity / assets 8.29% 7.76% 7.48% 7.49% 7.47% 7.76% 6.63%Cost / income ratio -62.50% -67.61% -55.96% -39.91% -36.32% -48.84% -43.72%NPL ratio 1.62% 1.60% 1.92% 1.85% 1.91% 1.60% 1.04%Reserve / NPL 167.08% 165.09% 161.77% 161.43% 157.53% 165.09% 265.11%Loan to deposit ratio (Renminbi) 73.20% 73.51% 68.52% 68.65% 62.88% 73.51% 74.91%Tier 1 ratio 12.91% 13.04% 12.40% 12.81% 13.01% 13.04% 12.59%BIS ratio 13.63% 13.76% 13.20% 13.63% 13.82% 13.76% 13.73%
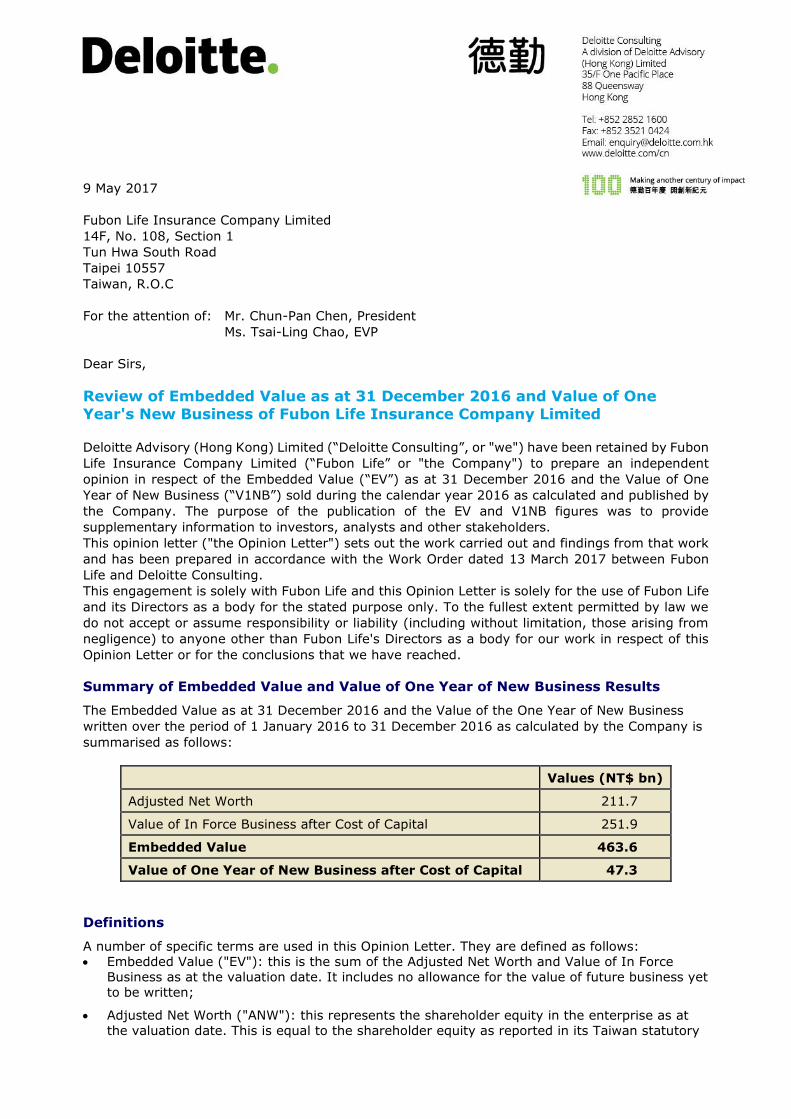
9 May 2017
Fubon Life Insurance Company Limited
14F, No. 108, Section 1
Tun Hwa South Road
Taipei 10557
Taiwan, R.O.C
For the attention of: Mr. Chun-Pan Chen, President
Ms. Tsai-Ling Chao, EVP
Dear Sirs,
Review of Embedded Value as at 31 December 2016 and Value of One
Year's New Business of Fubon Life Insurance Company Limited
Deloitte Advisory (Hong Kong) Limited (“Deloitte Consulting”, or "we") have been retained by Fubon
Life Insurance Company Limited (“Fubon Life” or "the Company") to prepare an independent
opinion in respect of the Embedded Value (“EV”) as at 31 December 2016 and the Value of One
Year of New Business (“V1NB”) sold during the calendar year 2016 as calculated and published by
the Company. The purpose of the publication of the EV and V1NB figures was to provide
supplementary information to investors, analysts and other stakeholders.
This opinion letter ("the Opinion Letter") sets out the work carried out and findings from that work
and has been prepared in accordance with the Work Order dated 13 March 2017 between Fubon
Life and Deloitte Consulting.
This engagement is solely with Fubon Life and this Opinion Letter is solely for the use of Fubon Life
and its Directors as a body for the stated purpose only. To the fullest extent permitted by law we
do not accept or assume responsibility or liability (including without limitation, those arising from
negligence) to anyone other than Fubon Life's Directors as a body for our work in respect of this
Opinion Letter or for the conclusions that we have reached.
Summary of Embedded Value and Value of One Year of New Business Results
The Embedded Value as at 31 December 2016 and the Value of the One Year of New Business
written over the period of 1 January 2016 to 31 December 2016 as calculated by the Company is
summarised as follows:
Values (NT$ bn)
Adjusted Net Worth 211.7
Value of In Force Business after Cost of Capital 251.9
Embedded Value 463.6
Value of One Year of New Business after Cost of Capital 47.3
Definitions
A number of specific terms are used in this Opinion Letter. They are defined as follows:
Embedded Value ("EV"): this is the sum of the Adjusted Net Worth and Value of In Force
Business as at the valuation date. It includes no allowance for the value of future business yet
to be written;
Adjusted Net Worth ("ANW"): this represents the shareholder equity in the enterprise as at
the valuation date. This is equal to the shareholder equity as reported in its Taiwan statutory
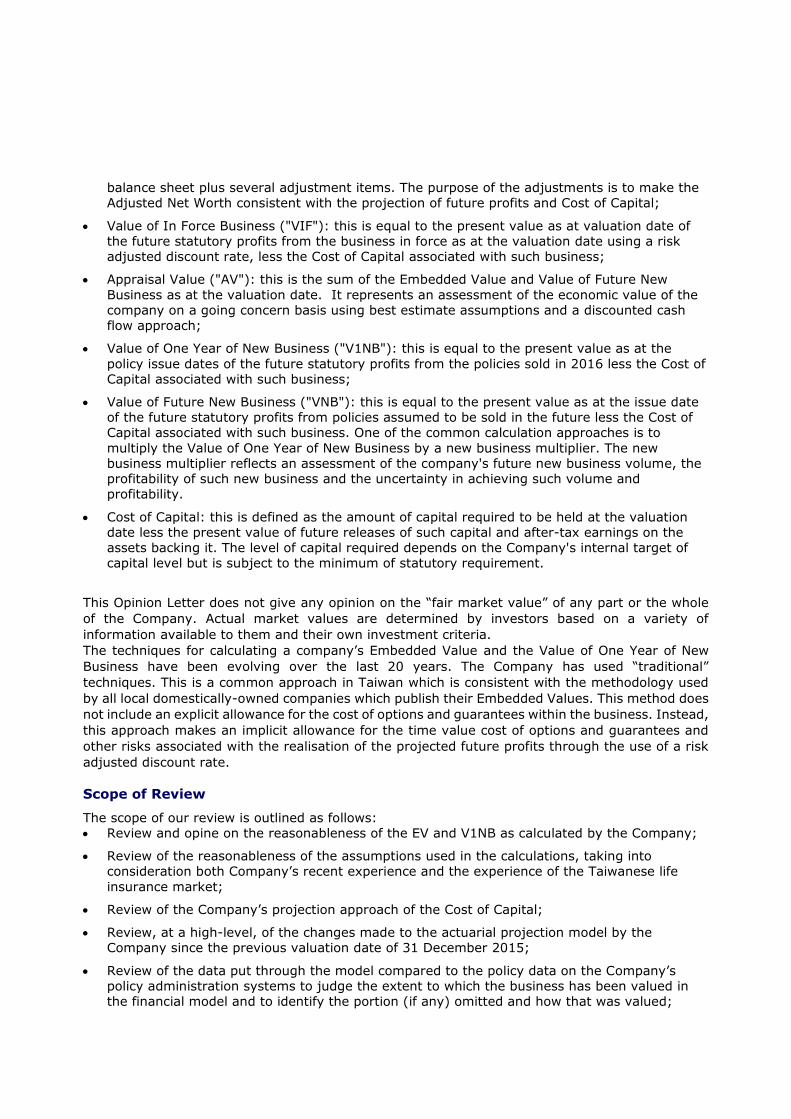
balance sheet plus several adjustment items. The purpose of the adjustments is to make the
Adjusted Net Worth consistent with the projection of future profits and Cost of Capital;
Value of In Force Business ("VIF"): this is equal to the present value as at valuation date of
the future statutory profits from the business in force as at the valuation date using a risk
adjusted discount rate, less the Cost of Capital associated with such business;
Appraisal Value ("AV"): this is the sum of the Embedded Value and Value of Future New
Business as at the valuation date. It represents an assessment of the economic value of the
company on a going concern basis using best estimate assumptions and a discounted cash
flow approach;
Value of One Year of New Business ("V1NB"): this is equal to the present value as at the
policy issue dates of the future statutory profits from the policies sold in 2016 less the Cost of
Capital associated with such business;
Value of Future New Business ("VNB"): this is equal to the present value as at the issue date
of the future statutory profits from policies assumed to be sold in the future less the Cost of
Capital associated with such business. One of the common calculation approaches is to
multiply the Value of One Year of New Business by a new business multiplier. The new
business multiplier reflects an assessment of the company's future new business volume, the
profitability of such new business and the uncertainty in achieving such volume and
profitability.
Cost of Capital: this is defined as the amount of capital required to be held at the valuation
date less the present value of future releases of such capital and after-tax earnings on the
assets backing it. The level of capital required depends on the Company's internal target of
capital level but is subject to the minimum of statutory requirement.
This Opinion Letter does not give any opinion on the “fair market value” of any part or the whole
of the Company. Actual market values are determined by investors based on a variety of
information available to them and their own investment criteria.
The techniques for calculating a company’s Embedded Value and the Value of One Year of New
Business have been evolving over the last 20 years. The Company has used “traditional”
techniques. This is a common approach in Taiwan which is consistent with the methodology used
by all local domestically-owned companies which publish their Embedded Values. This method does
not include an explicit allowance for the cost of options and guarantees within the business. Instead,
this approach makes an implicit allowance for the time value cost of options and guarantees and
other risks associated with the realisation of the projected future profits through the use of a risk
adjusted discount rate.
Scope of Review
The scope of our review is outlined as follows:
Review and opine on the reasonableness of the EV and V1NB as calculated by the Company;
Review of the reasonableness of the assumptions used in the calculations, taking into
consideration both Company’s recent experience and the experience of the Taiwanese life
insurance market;
Review of the Company’s projection approach of the Cost of Capital;
Review, at a high-level, of the changes made to the actuarial projection model by the
Company since the previous valuation date of 31 December 2015;
Review of the data put through the model compared to the policy data on the Company’s
policy administration systems to judge the extent to which the business has been valued in
the financial model and to identify the portion (if any) omitted and how that was valued;
Review of the approach used to determine the Adjusted Net Worth (“ANW”), in particular, the
adjustments made in deriving the ANW, and any other adjustments made outside of the
actuarial projection model;
Review of the Company's analysis of change in the VIF between 31 December 2015 and 31
December 2016.
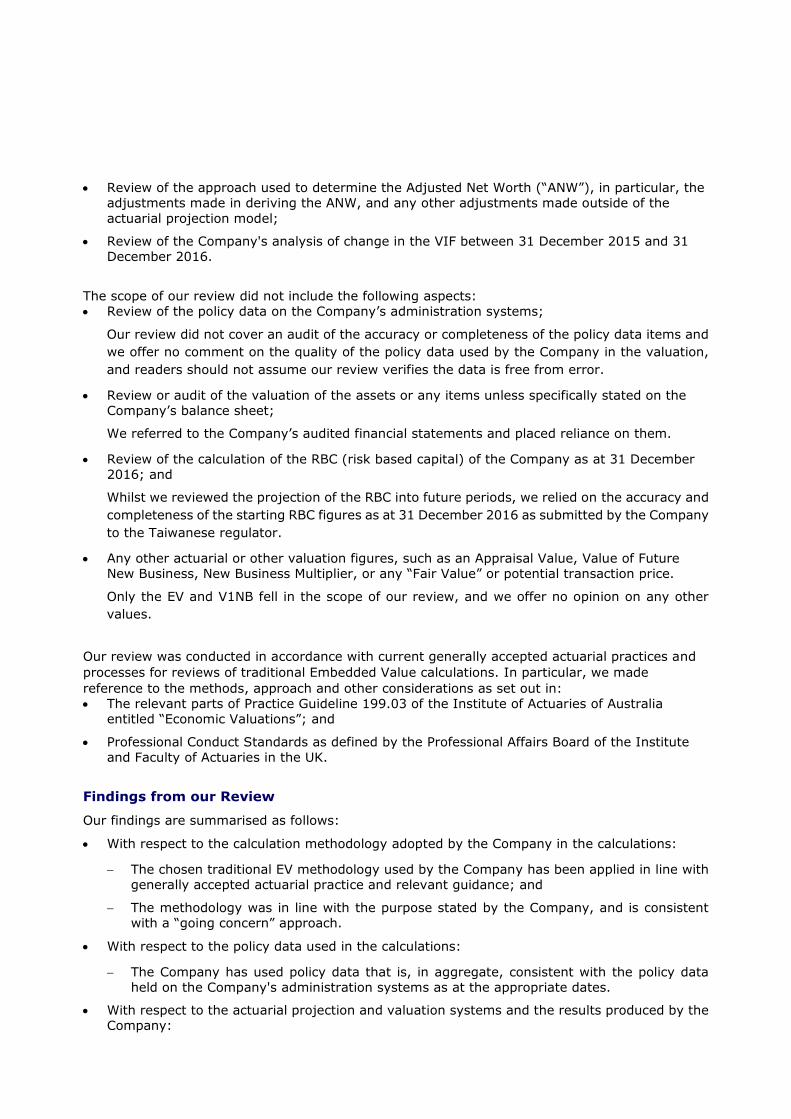
The scope of our review did not include the following aspects:
Review of the policy data on the Company’s administration systems;
Our review did not cover an audit of the accuracy or completeness of the policy data items and
we offer no comment on the quality of the policy data used by the Company in the valuation,
and readers should not assume our review verifies the data is free from error.
Review or audit of the valuation of the assets or any items unless specifically stated on the
Company’s balance sheet;
We referred to the Company’s audited financial statements and placed reliance on them.
Review of the calculation of the RBC (risk based capital) of the Company as at 31 December
2016; and
Whilst we reviewed the projection of the RBC into future periods, we relied on the accuracy and
completeness of the starting RBC figures as at 31 December 2016 as submitted by the Company
to the Taiwanese regulator.
Any other actuarial or other valuation figures, such as an Appraisal Value, Value of Future
New Business, New Business Multiplier, or any “Fair Value” or potential transaction price.
Only the EV and V1NB fell in the scope of our review, and we offer no opinion on any other
values.
Our review was conducted in accordance with current generally accepted actuarial practices and
processes for reviews of traditional Embedded Value calculations. In particular, we made
reference to the methods, approach and other considerations as set out in:
The relevant parts of Practice Guideline 199.03 of the Institute of Actuaries of Australia
entitled “Economic Valuations”; and
Professional Conduct Standards as defined by the Professional Affairs Board of the Institute
and Faculty of Actuaries in the UK.
Findings from our Review
Our findings are summarised as follows:
With respect to the calculation methodology adopted by the Company in the calculations:
The chosen traditional EV methodology used by the Company has been applied in line with
generally accepted actuarial practice and relevant guidance; and
The methodology was in line with the purpose stated by the Company, and is consistent
with a “going concern” approach.
With respect to the policy data used in the calculations:
The Company has used policy data that is, in aggregate, consistent with the policy data
held on the Company's administration systems as at the appropriate dates.
With respect to the actuarial projection and valuation systems and the results produced by the
Company:
Over 99% of the policy data has been included in the valuation and a zero value has been
assigned to that part which was not included in the valuation;
At the aggregate level, the model outputs for each major block of business that we reviewed
appear to be consistent with the assumptions applied in the calculations, the features of the
products included in each block of business, the prevailing applicable and relevant
regulations in Taiwan.
With respect to the assumptions used in the calculations:
The assumptions, taken as a whole, are reasonable for the Company and the environment
in which it conducts business;
The economic assumptions, including rate of investment return, risk adjusted discount rate
and inflation rate, were set consistently with one another and with the way in which the
adjusted net worth was calculated;
The economic assumptions represent plausible future outcomes for expected future total
returns (including the release of risk margins) and lie within a reasonable range of such
plausible future outcomes; and
The non-economic assumptions have been set with regard to relevant actual historical
experience of both the Company and the industry, and the Company has provided plausible,
reasoned arguments in relation to their expectations of future trends and developments for
these assumptions.
With respect to the calculation of the Adjusted Net Worth:
The Company has made adjustments to the Net Worth as reported on the statutory balance
sheet which are appropriate for the purpose of this valuation.
In conclusion, we find the results of the Embedded Value and Value of One Year of New Business
calculated by the Company to be reasonable within the purpose and chosen methodology of their
calculation, and that the methodology is consistent with the approach taken by all local
domestically-owned life insurers which publish similar figures in Taiwan and with one generally
accepted method for their calculation.
In stating the above opinion, we draw attention to the uncertainty related to such calculations.
The calculations of EV and V1NB results necessarily make numerous assumptions with respect to
economic conditions, operating conditions, taxes and other matters, many of which are not fully
within the control of the Company. Although the assumptions used represent estimates which fall
within a reasonable range of expectations, actual experience in the future is almost certain to vary
from that assumed in the calculation of the results and any such variations may be material.
Deviations from assumed experience are normal and are to be expected.
We note, and draw the attention of readers to the sensitivity of the results to assumptions, and in
particular, to the assumed rate of future investment return and the risk discount rate; this is
illustrated quantitatively in the Company's disclosures. A deviation from the assumed future
investment return, even still within a reasonably plausible range of such assumptions, may lead to
a materially different result. We note that future investment returns are subject to market factors
beyond the control of the Company and hence it is not possible for the Company to fully immunise
future profitability against movements in future investment returns.
Yours faithfully,
Deloitte Advisory (Hong Kong) Limited