Embed Size (px)
Citation preview
FUNDAMENTAL STUDY OF THE AUSTENITE FORMATION AND DECOMPOSITION IN LOW-Si, Al ADDED TRIP STEELS
by
Jose Enrique Garcia-Gonzalez
B.S. Materials Engineering, Instituto Tecnologico de Saltillo, 1999
M.S. Materials Science and Engineering, University of Pittsburgh, 2002
Submitted to the Graduate Faculty of
School of Engineering in partial fulfillment
of the requirements for the degree of
Doctor of Philosophy
University of Pittsburgh
2005
UNIVERSITY OF PITTSBURGH
SCHOOL OF ENGINEERING
This dissertation was presented
by
Jose Enrique Garcia-Gonzalez
It was defended on
April 15, 2005
and approved by
Dr Judith Yang, Materials Science and Engineering
Dr Calixto I. Garcia, Materials Science and Engineering
Dr Dennis Haezebrouck, US Steel Laboratories
Dr Michael Lovell, Industrial Engineering
Dr Anthony J. DeArdo, Materials Science and Engineering Dissertation Director
ii
FUNDAMENTAL STUDY OF THE AUSTENITE FORMATION AND DECOMPOSITION IN LOW-SI, AL ADDED TRIP STEELS
Jose Enrique Garcia-Gonzalez, PhD
University of Pittsburgh, 2005
TRIP (Transformation Induced Plasticity) steels are under development for automotive applications that
require high strength and excellent formability. Conventional TRIP steels consist of a multiphase
microstructure comprised of a ferrite matrix with a dispersion of bainite and metastable retained austenite.
The high ductility exhibited by these steels results from the transformation of the metastable retained
austenite to martensite during straining. In conventional TRIP steel processing, the multiphase
microstructure is obtained by controlled cooling from the α+γ region to an isothermal holding
temperature. During this holding, bainite forms and carbon is rejected out into the austenite, which lowers
the Ms temperature and stabilizes the austenite to room temperature.
In this research project, a fundamental study of a low-Si, Mo-Nb added cold rolled TRIP steel with and
without Al additions was conducted. In this study, the recrystallization of cold-rolled ferrite, the
formation of austenite during intercritical annealing and the characteristics of the decomposition of the
intercritically annealed austenite by controlled cooling rates were systematically assessed. Of special
interest were: (i) the effect of the initial hot band microstructure, (ii) the formation of epitaxial ferrite
during cooling from the intercritical annealing temperature to the isothermal holding temperature, (iii) the
influence of the intercritically annealed austenite on the formation of bainite during the isothermal
holding temperature, and (iv) the influence of the processing variables on the type, amount, composition
and stability of the retained austenite. During this research study, techniques such as OM, SEM, EBSD,
TEM, XRD and Magnetometry were used to fully characterize the microstructures. Furthermore, a
Gleeble 3500 unit at US Steel Laboratories was used for dilatometry studies and to simulate different
CGL processing routes, from which specimens were obtained to evaluate the mechanical properties.
iii
TABLE OF CONTENTS ABSTRACT................................................................................................................................... iii LIST OF TABLES........................................................................................................................ vii
LIST OF FIGURES ..................................................................................................................... viii
ACKNOWLEDGEMENTS....................................................................................................... xviii
1.0 INTRODUCTION ................................................................................................................... 1
2.0 BACKGROUND ..................................................................................................................... 3
2.1 PROCESSING OF TRIP STEEL ................................................................................... 4
2.1.1 Intercritical annealing ............................................................................................. 5
2.1.2 Isothermal Bainitic Transformation (IBT)............................................................ 10
2.2 MECHANISMS OF BAINITE TRANSFORMATION............................................... 13
2.2.1 Continuously cooled transformed bainite ............................................................. 13
2.2.2 Isothermally transformed bainite .......................................................................... 14
2.2.3 Alloy partition during the bainite transformation ................................................. 20
2.3 AUSTENITE STABILITY........................................................................................... 24
2.3.1 Effect of Austenite Morphology ........................................................................... 35
2.4 EFFECT OF PRIOR PROCESSING HISTORY ......................................................... 42
2.5 ALLOYING EFFECTS ................................................................................................ 45
2.5.1 Si and Mn.............................................................................................................. 45
2.5.2 Al........................................................................................................................... 55
iv
2.5.3 Mo......................................................................................................................... 62
2.5.4 Nb.......................................................................................................................... 62
3.0 STATEMENT OF OBJECTIVES ......................................................................................... 66
4.0 EXPERIMENTAL PROCEDURE ........................................................................................ 68
4.1 MATERIALS / ALLOY DESIGN ............................................................................... 68
4.2 THERMOMECHANICAL PROCESSING (TMP)...................................................... 69
4.3 COLD ROLLING ......................................................................................................... 70
4.4 INTERCRITICAL ANNEALING HEAT TREATMENTS......................................... 71
4.5 AUSTENITE DECOMPOSITION STUDY................................................................. 72
4.6 ISOTHERMAL HOLDING TEMPERATURE TRANSFORMATION...................... 73
4.7 MICROSTRUCTURAL ANALYSIS .......................................................................... 73
4.7.1 Optical Microscopy............................................................................................... 73
4.7.2 Scanning Electron Microscopy (SEM)/EBSD...................................................... 74
4.7.3 Transmission Electron Microscopy (TEM) .......................................................... 75
4.7.4 X-ray diffraction ................................................................................................... 76
4.7.5 Magnetometry ....................................................................................................... 78
4.8 MECHANICAL TESTING .......................................................................................... 80
5.0 RESULTS .............................................................................................................................. 81
5.1 STAGE I - INTERCRITICAL ANNEALING ............................................................. 83
5.1.1 Recrystallization of ferrite .................................................................................... 84
5.1.2 Austenite Formation.............................................................................................. 92
5.2 STAGE II - AUSTENITE DECOMPOSITION DURING COOLING FROM THE INTERCRITICAL ANNEALING TEMPERATURE (TIA) TO THE ISOTHERMAL HOLDING TEMPERATURE (IHT)...................................................................................... 100
v
5.2.1 CCT diagrams ..................................................................................................... 100
5.2.2 Austenite Decomposition after cooling to IBT=450°C ...................................... 107
5.3 STAGE III - AUSTENITE DECOMPOSITION DURING ISOTHERMAL HOLDING AT 450 C................................................................................................................................. 118
5.3.1 Austenite Decomposition Maps.......................................................................... 118
5.4 MECHANICAL PROPERTIES ................................................................................. 130
5.4.1 Yield Stress ......................................................................................................... 130
5.4.2 UTS..................................................................................................................... 132
5.4.3 Total Elongation.................................................................................................. 134
5.4.4 UTS x Total Elongation...................................................................................... 136
6.0 DISCUSSION...................................................................................................................... 138
6.1 MICROSTRUCTURAL BEHAVIOR DURING INTERCRITICAL ANNEALING 138
6.2 COOLING RATE FROM THE INTERCRITICAL ANNEALING TEMPERATURE TO THE ISOTHERMAL HOLDING TEMPERATURE ...................................................... 145 6.3 ISOTHERMAL HOLDING TEMPERATURE ......................................................... 154
6.4 MECHANICAL PROPERTIES DISCUSSION......................................................... 158
6.4.1 Yield Stress (Continuous and Discontinuous Yielding) ..................................... 158
6.4.2 UTS..................................................................................................................... 162
6.4.3 Uniform and Total Elongation............................................................................ 170
7.0 CONCLUSIONS.................................................................................................................. 172
APPENDIX................................................................................................................................. 174
Appendix A VOLUME FRACTION OF MICROCONSTITUENTS OF THE STEELS......... 174
Appendix B MECHANICAL PROPERTIES OF THE TRIP STEELS ................................... 177
BIBLIOGRAPHY....................................................................................................................... 180
vi
LIST OF TABLES Table 1 Chemical composition of TRIP steels used in this research study ................................. 68
Table 2 Design of thermomechanical processing temperatures .................................................. 69
Table 3 Average aspect ratio of ferrite grains as a function of intercritical annealing temperature and prior coiling temperature................................................................................................ 87
Table 4 Quantitative microstructural IQ analysis of specimens intercritically annealed to obtain
an initial γ=35% and γ=55%, followed by quench, 0.05Al-550 and 1.0Al-550 alloys......... 91
vii
LIST OF FIGURES Figure 1 Relationship between fuel mileage and automotive weight .......................................... 2 Figure 2 Continuous cooling transformation diagram of a Fe-0.11C-0.55Si-0.18Mo steel
intercritically annealed at 790 C for 90 seconds..................................................................... 8 Figure 3 Schematic illustration of the condition which has to be satisfied before cementite may
precipitate from the remaining austenite............................................................................... 11 Figure 4 Room temperature phase composition and Cγ content are shown as a function of
isothermal transformation ..................................................................................................... 12 Figure 5 A model of upper bainite formation. The growth direction of either the bainite subunits
or the bainitic lath which lies close to the invariant line is normal to this figure. Thus, these figures show the cross sections normal to the growth direction for either the bainite subunits or the laths. (a) nucleation of bainite subunit, (b) autocatalytic nucleation of ferrite subunits and (c) the lath formation by the coalescence of them. ........................................................ 16
Figure 6 Schematic free energy curves for the analysis of ferrite growth involving partial-
supersaturation. This illustrates the sort of composition profiles to be expected across the transformation interface, under conditions of steady-state growth, with carbon content and position relative to the interface plotted on the ordinate and abscissa respectively. Lines such as ab mark the tie-line compositions involved in difussion controlled growth (the general corresponding set of compositions linked by a tie line such as ab are labeled Xα
1 and Xγ
1) ................................................................................................................................. 19 Figure 7 Effect of kP on the TS*El and C content in retained austenite of bainite transformed
0.4%C-l.5%Si-0.8%Mn steels. The properties only in the case of kP=94 have longer bainite transformation time than the time which gives the maximum TS*El. ................................. 21
Figure 8 Diffusional migration of an interphase boundary with keeping coherency at the
interface; (a) exchange of lattice sites, (b) migration of interphase boundary and slight displacements of atomic sites, and (c) further migration of the interface and the enrichment of alloying elements in the vicinity of the interface. ............................................................ 23
Figure 9 Effect of bainite transformation time (t) on change in volume fraction of retained
austenite with deformation.................................................................................................... 27
viii
Figure 10 Variation in volume fraction of retained austenite fv with tempering temperature for various steels. TH in the figure represents critical temperature at which retained austenite starts to decompose to bainite ............................................................................................... 29
Figure 11 Relationship between critical decomposition temperature of retained austenite to
bainite TH and Ms temperature of retained austenite for unstrained steels. Numerals in the figure represent tempering time. ........................................................................................... 29
Figure 12 (a) Evolution of the martensitic nucleation stress with temperature, (b) Gibbs free
energy curves versus temperature and effect of an applied stress σ ..................................... 31 Figure 13 True stress-true strain curves of a) specimens of high silicon and b) specimens of low
silicon.................................................................................................................................... 34 Figure 14 Incremental work-hardening curves (nincr) of the different specimens of high and low
Si steels ................................................................................................................................. 35 Figure 15 Variation of the retained austenite volume fraction with the amount of ferrite; (a) steel
A with the prior austenite grain size of 40 um and (b) steel B with the prior austenite grain size of 45um.......................................................................................................................... 39
Figure 16 Variation of the retained austenite volume fraction with the ferrite quantity of steel A
for different prior austenite grain sizes; (a) 70 um and (b) 230 um...................................... 40 Figure 17 (a) A portion of the FeFe3Cphase diagram, (b) carbon concentration profile along a
direction perpendicular to the austenite/ferrite interface, (c) carbon concentration profile in front of growing ferrite at different time intervals or different volume fractions of ferrite.. 40
Figure 18 Heat treatments routes to achieve different hot band microstructures ........................ 43 Figure 19 True strain-stress curves of tensile test for the samples in Figure 18 after the
intercritical annealing treatment ........................................................................................... 44 Figure 20 Mechanical properties as a function of annealed temperature for the steels annealed at
various temperatures for 51 s, followed by austempering at 450°C for 300 sec. ................. 48 Figure 21 Mechanical properties as a function of austempering start temperature for the steels
obtained by annealing at 830°C for 51 s, followed by austempering at various temperatures for 300s ................................................................................................................................. 49
Figure 22 Martensite start temperature, Ms, for a 1.0Si-2.4Mn steel as a function of the volume
fraction of bainite transformed during austempering, ∆VB , at various temperatures. ......... 50 Figure 23 Volume percentage of retained austenite for a 1.0Si–2.4Mn TRIP steel as a function
of the volume fraction of bainite transformed during austempering, ∆VB, at various temperatures.......................................................................................................................... 50
ix
Figure 24 Change in volume fraction of retained austenite as functions of silicon and manganese content in steels at an isothermal holding temperature of 400C for simulating coiling process................................................................................................................................... 52
Figure 25 Change of CCT diagrams as function of Si and Mn content....................................... 53 Figure 26 Changes in tensile strength, yield strength, total elongation and TSxEl value as
functions of silicon and manganese content. ........................................................................ 55 Figure 27 Equilibrium austenite fraction as a function of the temperature ................................. 56 Figure 28 Calculated TTT diagram for the Fe-0.2%C-1.5%Mn-1.5%Si TRIP steel .................. 57 Figure 29 Calculated phase distribution and evolution of carbon content for the Fe-0.2%C-
1.5%Mn-1.5%Si TRIP steel.................................................................................................. 58 Figure 30 Strain hardening coefficient variation with true strain for Si and Si-Al TRIP steel.... 59 Figure 31 Variation of volume fraction of retained austenite during tensile testing ................... 60 Figure 32 Variation of the VRA with holding time at 400C; (a) Nb added steel, (b) No niobium
added..................................................................................................................................... 64 Figure 33 Variation of the VRA with the temperature of bainite formation; (a) Nb added steel, (b)
No niobium added................................................................................................................. 65 Figure 34 Hot Rolling Variables................................................................................................... 70 Figure 35 Schematic representation of the sub-size tensile specimens used for tensile testing .. 80 Figure 36 Effect of the variation in coiling temperature (a) 700°C and (b) 550°C on the
microstructure of the 0.05Al TRIP steel ............................................................................... 82 Figure 37 Effect of the variation in coiling temperature (a) 700°C and (b) 550°C on the
microstructure of the 0.5Al TRIP steel ................................................................................. 82 Figure 38 Effect of the variation in coiling temperature (a) 700°C and (b) 550°C on the
microstructure of the 1.0Al TRIP steel ................................................................................. 83 Figure 39 Percent of ferrite grains with aspect ratio <1.6 as a function of intercritical annealing
temperature and prior coiling temperature, 0.05Al alloy...................................................... 85 Figure 40 Percent of ferrite grains with aspect ratio <1.6 as a function of intercritical annealing
temperature and prior coiling temperature, 0.5Al alloy........................................................ 85
x

Figure 41 Percent of ferrite grains with aspect ratio <1.6 as a function of intercritical annealing temperature and prior coiling temperature, 1.0Al alloy........................................................ 86
Figure 42 IQ Analysis without grain boundary data in the 0.05Al-550 alloy, TIA=750°C (35%γ),
held 60 seconds and quenched.............................................................................................. 89 Figure 43 IQ Analysis without grain boundary data in the 0.05Al-550 alloy, TIA=790°C (55%γ),
held 60 seconds and quenched.............................................................................................. 89 Figure 44 IQ Analysis without grain boundary data in the 1.0Al-550 alloy, TIA=770°C (35%γ),
held 60 seconds and quenched.............................................................................................. 90 Figure 45 IQ Analysis without grain boundary data in the 1.0Al-550 alloy, TIA=860°C (55%γ),
held 60 seconds and quenched.............................................................................................. 90 Figure 46 J-Mat Pro simulation of the effect of Al wt% on the austenite volume fraction......... 93 Figure 47 Effect of Al wt% on the Fe-C Phase Diagram. Addition of Al rises the Ac1 and Ac3
temperature, and above 1.0 wt% Al, a loop in the γ-phase is obtained ................................ 93 Figure 48 Austenite volume fraction vs intercritical annealing temperature (after 60secs), 0.05Al
alloy....................................................................................................................................... 94 Figure 49 Optical micrographs of ferrite (light) and austenite (dark) distribution after
intercritical annealing at 730°C and 780°C for 60 seconds followed by quench. (a) and (b) 0.05Al alloy prior-coiled at 550°C, (c) and (d) 0.05Al alloy prior-coiled at 700°C (etchant: 3%Nital + 10% Na2S2O5) ..................................................................................................... 95
Figure 50 Austenite volume fraction vs intercritical annealing temperature (after 60secs), 0.5Al
alloy....................................................................................................................................... 96 Figure 51 Austenite volume fraction vs intercritical annealing temperature (after 60secs), 1.0Al
alloy....................................................................................................................................... 97 Figure 52 Optical micrographs of ferrite (light) and austenite (dark) distribution after
intercritical annealing at 760°C (35%γ) and 810°C (55%γ) for 60 seconds followed by quench. (a) and (b) 0.5Al alloy prior-coiled at 550°C, (c) and (d) 0.5Al alloy prior-coiled at 700°C (etchant: 3%Nital )..................................................................................................... 98
Figure 53 Optical micrographs of ferrite (light) and austenite (dark) distribution after
intercritical annealing at 770°C (35%γ) and 860°C (55%γ) for 60 seconds followed by quench. (a) and (b) 1.0Al alloy prior-coiled at 550°C, (c) and (d) 1.0Al alloy prior-coiled at 700°C (etchant: 3%Nital )..................................................................................................... 99
Figure 54 CCT diagram from TIA=750°C (35%γ), 0.05Al-550 TRIP steel............................... 101
xi
Figure 55 CCT diagram from TIA=790°C (55%γ), 0.05Al-550 TRIP steel............................... 101 Figure 56 SEM micrographs of microconstituents observed after intercritical annealing at 790°C
(55%γ) in 0.05Al-550 TRIP steel and cooling to room temperature at various rates: a) 1 °C/sec, b) 15°C/sec, c) 30 °C/sec........................................................................................ 102
Figure 57 CCT diagram from TIA=765 C (35%γ), 0.05Al-700 TRIP steel ............................... 103 Figure 58 CCT diagram from TIA=760 C (35%γ), 0.5Al-550 TRIP steel ................................. 104 Figure 59 CCT diagram from TIA=770°C (35%γ), 1.0Al-550 TRIP steel................................ 105 Figure 60 CCT diagram from TIA=860 C (55%γ), 1.0Al-550 TRIP steel ................................. 105 Figure 61 SEM micrographs of microconstituents observed after intercritical annealing at 770°C
(35%γ) in 1.0Al-550 TRIP steel and cooling to room temperature at various rates: a) 1 °C/sec, b) 15°C/sec. In a) second phase is mostly granular bainite, whereas in b) second phase is retained austenite................................................................................................... 106
Figure 62 SEM micrographs of microconstituents observed after intercritical annealing at 860°C
(55%γ) in 1.0Al-550 TRIP steel and cooling to room temperature at various rates: a) 1 °C/sec, b) 15°C/sec, c) 30°C/sec......................................................................................... 107
Figure 63 Effect of Al addition on the volume fraction of new ferrite formed during cooling at
15C/sec from TIA= 35%γ to IHT=450°C, followed by quench .......................................... 109 Figure 64 Effect of Al addition and intercritically annealed austenite on the volume fraction of
new ferrite formed during cooling at 15C/sec from TIA= 35%γ and TIA= 55%γ to IHT=450°C, followed by quench........................................................................................ 109
Figure 65 Optical micrographs showing the typical microstructure of the 1.0Al-550 alloy
intercritically annealed at (a) 35%γ and (b) 55%γ and cooled at 15C/sec to 450°C followed by quench. White regions show the M-A microconstituent and dark, brown regions show the overall ferrite microconstituent..................................................................................... 110
Figure 66 Effect of the variation in cooling rate from TIA= 35%γ to 450°C on the volume
fraction of new ferrite ......................................................................................................... 110 Figure 67 Optical micrographs showing the typical microstructure of the 1.0Al-550 alloy
intercritically annealed at 35%γ and cooled at (a) 5°C/sec and (b) 15°C/sec to 450°C followed by quench. White regions show the M-A microconstituent and dark, brown regions show the overall ferrite microconstituent............................................................... 111
Figure 68 IQ multi-peak quantitative analysis of the microconstituents in the 1.0Al-550 alloy
after (a) TIA=770°C (35%γ), held 60s followed by quenched, and (b) TIA=770°C (35%γ), held 60s followed by cooling at 15°C/sec to 450°C and immediately quenched ............... 114
xii
Figure 69 IQ multi-peak quantitative analysis of the microconstituents in the 1.0Al-550 alloy after TIA=860°C (55%γ), held 60s followed by cooling at 15°C/sec to 450°C and immediately quenched ........................................................................................................ 114
Figure 70 IQ multi-peak quantitative analysis of the microconstituents in the 1.0Al-700 alloy
after TIA=770°C (35%γ), held 60s followed by cooling at 15°C/sec to 450°C and immediately quenched ........................................................................................................ 115
Figure 71 IQ multi-peak quantitative analysis of the microconstituents in the 0.5Al-550 alloy
after TIA=810°C (55%γ), held 60s followed by cooling at 15°C/sec to 450°C and immediately quenched ........................................................................................................ 115
Figure 72 IQ multi-peak quantitative analysis of the microconstituents in the 0.05Al-550 alloy
after TIA=750°C (35%γ), held 60s followed by cooling at 15°C/sec to 450°C and immediately quenched ........................................................................................................ 116
Figure 73 IQ multi-peak quantitative analysis of the microconstituents in the 0.05Al-550 alloy
after TIA=790°C (55%γ), held 60s followed by cooling at 15°C/sec to 450°C and immediately quenched ........................................................................................................ 116
Figure 74 IQ multi-peak quantitative analysis of the microconstituents in the 0.05Al-700 alloy
after TIA=765°C (35%γ), held 60s followed by cooling at 15°C/sec to 450°C and immediately quenched ........................................................................................................ 117
Figure 75 Austenite decomposition behavior during isothermal holding at 450°C after cooling
from TIA=35%γ, 1.0Al-550 TRIP steel ............................................................................... 119 Figure 76 Austenite decomposition behavior during isothermal holding at 450°C after cooling
from TIA=55%γ, 1.0Al-550 TRIP steel ............................................................................... 120 Figure 77 Austenite decomposition behavior during isothermal holding at 450°C after cooling
from TIA=35%γ, 0.5Al-550 TRIP steel ............................................................................... 120 Figure 78 Austenite decomposition behavior during isothermal holding at 450°C after cooling
from TIA=35%γ, 0.05Al-550 TRIP steel ............................................................................. 121 Figure 79 Optical and SEM micrographs of typical microstructure in the 1.0Al-550 TRIP steel
after cooling from TIA=770°C (35%γ) at 15C°/sec to IHT=450°C, and held at: (a) 2s + Q, (b) 30s + AC, and (c) 120 + AC ......................................................................................... 122
Figure 80 IQ multi-peak quantitative analysis of the microconstituents in the 1.0Al-550 alloy
after TIA=770°C (35%γ), cooled at 15°C/sec to 450°C and immediately quenched .......... 123 Figure 81 IQ multi-peak quantitative analysis of the microconstituents in the 1.0Al-550 alloy
after TIA=770°C (35%γ), cooled at 15°C/sec to 450°C and then air cooled to room temperature (ACRT) ........................................................................................................... 123
xiii
Figure 82 IQ multi-peak quantitative analysis of the microconstituents in the 1.0Al-550 TRIP steel after TIA=770°C (35%γ), cooled at 15°C/sec to 450°C, held 120 seconds and then ACRT.................................................................................................................................. 124
Figure 83 IQ multi-peak quantitative analysis of the microconstituents in the 0.05Al-550 alloy
after TIA=750°C (35%γ), cooled at 15°C/sec to 450°C and immediately quenched .......... 124 Figure 84 IQ multi-peak quantitative analysis of the microconstituents in the 0.05Al-550 TRIP
steel after TIA=750°C (35%γ), cooled at 15°C/sec to 450°C, held 30 seconds and then ACRT.................................................................................................................................. 125
Figure 85 IQ multi-peak quantitative analysis of the microconstituents in the 0.05Al-550 TRIP
steel after TIA=750°C (35%γ), cooled at 15°C/sec to 450°C, held 120 seconds and then ACRT.................................................................................................................................. 125
Figure 86 IQ multi-peak quantitative analysis of the microconstituents in the 0.05Al-700 alloy
after TIA=765°C (35%γ), cooled at 15°C/sec to 450°C and immediately quenched .......... 126 Figure 87 IQ multi-peak quantitative analysis of the microconstituents in the 0.05Al-700 alloy
after TIA=765°C (35%γ), cooled at 15°C/sec to 450°C, held 30 seconds and then ACRT 126 Figure 88 IQ multi-peak quantitative analysis of the microconstituents in the 0.05Al-700 TRIP
steel after TIA=765°C (35%γ), cooled at 15°C/sec to 450°C, held 120 seconds and then ACRT.................................................................................................................................. 127
Figure 89 Effect of the cooling rate from IHT=450°C to RT after holding for various times on
the volume fraction of retained austenite in the 1.0Al-550 TRIP steel .............................. 128 Figure 90 Effect of prior coiling temperature on the volume fraction of retained austenite after
holding at various times (followed by air cool) at IHT=450°C, 1.0Al steel....................... 129 Figure 91 Effect of holding time at IHT=450°C followed by air cooling in the yield stress in the
1.0Al-550 and 0.5Al-550 TRIP steels................................................................................. 131 Figure 92 Effect of the cooling rate from IHT=450°C (30 seconds hold) to room temperature in
the yield stress in the 1.0Al-550 and 0.5Al-550 TRIP steels.............................................. 132 Figure 93 Effect of holding time at IHT=450°C followed by air cooling in the UTS in the 1.0Al-
550 and 0.5Al-550 TRIP steels........................................................................................... 133 Figure 94 Effect of the cooling rate from IHT=450°C (30 seconds hold) to room temperature in
the UTS in the 1.0Al-550 and 0.5Al-550 TRIP steels ........................................................ 134 Figure 95 Effect of holding time at IHT=450°C followed by air cooling in the total elongation
(%) in the 1.0Al-550 and 0.5Al-550 TRIP steels................................................................ 135
xiv
Figure 96 Effect of the cooling rate from IHT=450°C (30 seconds hold) to room temperature in the total elongation (%) in the 1.0Al-550 and 0.5Al-550 TRIP steels................................ 136
Figure 97 Effect of holding time at IHT=450°C followed by air cooling in the product of UTS x
Total Elongation in the 1.0Al-550 and 0.5Al-550 TRIP steels........................................... 137 Figure 98 Effect of the cooling rate from IHT=450°C (30 seconds hold) to room temperature in
the product of UTS x Total Elongation in the 1.0Al-550 and 0.5Al-550 TRIP steels........ 137 Figure 99 Effect of molybdenum on the rate of growth of recrystallized grains in iron (After
W.C. Leslie, 1961) .............................................................................................................. 141 Figure 100 Austenite volume fraction vs temperature using both JMat Pro simulation and
measured observations in the 1.0Al-550 TRIP steel. Arrow shows the temperature at which 50% of recrystallized ferrite grains are observed, and at~60%γ the observed and simulated results do not correlate with each other .............................................................................. 143
Figure 101 Austenite volume fraction vs temperature using both JMat Pro simulation and
measured observations in the 0.5Al-550 TRIP steel. Arrow shows the temperature at which 50% of recrystallized ferrite grains are observed, and note that the observed and simulated results correlate well with each other up to that temperature ............................................. 144
Figure 102 CCT curve of a 0.12C-1.28Mn-0.5Si-0.13Mo steel cooled from the intercritical
region. γ=austenite, α=polygonal ferrite, α’=acicular ferrite, B=bainite, M-A=martensite-austenite constituent (After Eldis, 1979) ............................................................................ 147
Figure 103 Schematic illustration of the effect of cooling rate on the average carbon content of
austenite during cooling from intercritical temperatures (After Eldis, 1979)..................... 147 Figure 104 Effect of cooling rate and intercritical temperature on the volume fraction of
epitaxial ferrite in a 0.06C-1.5Mn-0.25Si steel, (a) TIA=810°C, and (b) TIA=760°C ......... 148 Figure 105 Diagram of ferrite growing into austenite (Adapted from Porter and Easterling) .. 149 Figure 106 CCT diagram of a 0.2C-1.8Mn-1.0Al-0.5Si steel intercritically annealed at 840°C
(60%γ). (After Parish, 2003)............................................................................................... 151 Figure 107 Effect of intercritical annealing temperature and cooling rate to room temperature on
the volume fraction of M-A constituent (After Speich and Miller).................................... 152 Figure 108 Twinned Martensite in the 1.0Al-550 alloy after intercritical annealing at γ=35%,
IHT=450°C and immediately quench ................................................................................. 153 Figure 109 Dilatometry curves for the 0.05Al, 0.5Al and 1.0Al TRIP steels after intercritical
annealing at γ=35%, IHT=450°C, and held for 5minutes................................................... 155
xv
Figure 110 Schematic illustration of carbon enrichment with TRIP steel processing............... 156 Figure 111 Typical retained austenite particles observed in the 1.0Al-550 alloy after holding for
30 seconds or more at IHT=450°C. Note that the retained austenite is present as isolated particles inside the ferrite grains and along grains boundaries. No association of retained austenite with bainite was observed.................................................................................... 157
Figure 112 Twinned retained austenite particle observed in the 1.0Al-550 alloy after holding for
30 seconds or more at IHT=450°C. This type of retained austenite was frequently observed along grain boundaries........................................................................................................ 157
Figure 113 Yielding behavior in the 0.5Al-550 alloy. Curves shift from continuous yielding to
discontinuous yielding as holding time increases at IHT=450°C....................................... 159 Figure 114 Yielding behavior in the 1.0Al-550 alloy. Curves shift from continuous yielding to
discontinuous yielding as holding time increases at IHT=450°C....................................... 159 Figure 115 Effect of residual stress on the yielding behavior, (a) Initial distribution of residual
stress, (b) rounding of a yield point due to the residual stress distribution in (a), and (c) rounding of a yield point due to non-homogeneous deformation of ferrite grains, containing the residual stress distribution in (a), and a gradual decrease with strain of the number of grains containing the residual stress ................................................................................... 160
Figure 116 Effect of cooling rate from TIA=750°C on internal friction, AC= air cooled,
WQ=water quench, WQ-T=water quenched and tempered at 250°C for 1 minute............ 161 Figure 117 Effect of holding time at 450°C after cooling at 15 C/sec from TIA= 770°C and
860°C on the hardness (Vickers) of the 1.0Al-550 steel .................................................... 163 Figure 118 Hypothetical effect of IHT on carbon distribution within austenite islands, (a) no
holding time at IHT, (b) after holding at ∆t during IHT.................................................... 165 Figure 119 TEM micrographs showing retained austenite and martensite coexisting in the same
grain, 1.0Al-550 alloy, after holding 30 seconds at IHT=450°C........................................ 166 Figure 120 Bright field and dark field TEM micrographs showing retained austenite and
martensite coexisting in the same grain, 1.0Al-550 alloy, after holding 30 seconds at IHT=450°C ......................................................................................................................... 166
Figure 121 Percent carbon in retained austenite after holding for 30 and 120 seconds at 450°C,
for both TIA=770°C and 860°C, with cooling rate from TIA to IHT= 15 C/sec.................. 167 Figure 122 Percent carbon in retained austenite after holding for 30 and 120 seconds at 450°C,
for TIA=770°C, with cooling rate from TIA to IHT= 15 C/sec and 5C/sec ......................... 167
xvi
Figure 123 Variation of yield and UTS versus % bainite. Bainite strengthening effect is ~1.5ksi per 10% bainite volume fraction......................................................................................... 169
Figure 124 Variation of UTS versus % bainite in the 0.5Al-550 and 1.0Al-550 TRIP steel. The
corresponding M-A volume fraction is also shown in parenthesis..................................... 169 Figure 125 Instantaneous work hardening behavior versus strain in the 1.0Al-550 and 0.5Al-550
TRIP steel. Specimens were intercritical annealed at γ=35%, cooled at 15C/sec to IHT=450°C and held for 30 seconds followed by ACRT .................................................. 171
xvii
ACKNOWLEDGEMENTS
I would like to express my appreciation and gratitude to my advisors Dr. A.J DeArdo and Dr.
C.I. Garcia for their guidance and encouragement throughout the course of this research project.
I would also like to thank Dr. Hua for his guidance with the TEM and STEM during the
last years. I want to thank all BAMPRI and graduate students for their friendship, support, and
stimulating discussions during my years here at the University of Pittsburgh. Also, I want to
express my gratitude to all the faculty and staff in the MSE department. Thanks to Jinghui Wu
for his help and training on the IQ analysis and to Andreas Kulovits for his help with the
magnetometer. Special thanks to Dr. K. Goldman for all his advises and patient proof-reading, as
well as for making corrections to my drafts.
I would like to thank US Steel and Dr. Dennis Haezebrouck for his help with the Gleeble
testing, as well as for the hot and cold rolling of steel specimens. Similarly, I want to thank
POSCO for their help with additional hot and cold rolling, and for the use of their simulation
facilities.
Gratitude is expressed to National Council of Science and Technology in Mexico
(CONACYT) for their financial support during the course of my PhD.
Furthermore, I would like to thank my parents, relatives and friends in Mexico, for their
constant support and encouragement.
Finally, I would like to thank my wife Nadia, and my son Dante, for their constant
praying and love, without whom this could not have been achieved. They have been my
inspiration and I dedicate this work to them.
xviii

1.0 INTRODUCTION
High strength sheet steel grades have attracted the interest of the automotive industry because of
the necessity to reduce car weight and to improve the safety of cars. A very promising approach
to increase the ductility of high strength steels grades are TRIP (Transformation Induced
Plasticity) steels. In these grades metastable austenite is transformed into martensite during
deformation processes such as forming and stretching, thus yielding an outstanding uniform
elongation and formability at a very high strength level.
In low alloyed TRIP steels, the retained austenite is mainly stabilized by carbon, C. The
carbon enrichment in the austenite and the prevention of precipitation of iron carbides are
achieved by lowering the activity of carbon in cementite, by the addition of alloying elements
such as Si and an appropriate heat treatment of the cold-rolled sample.
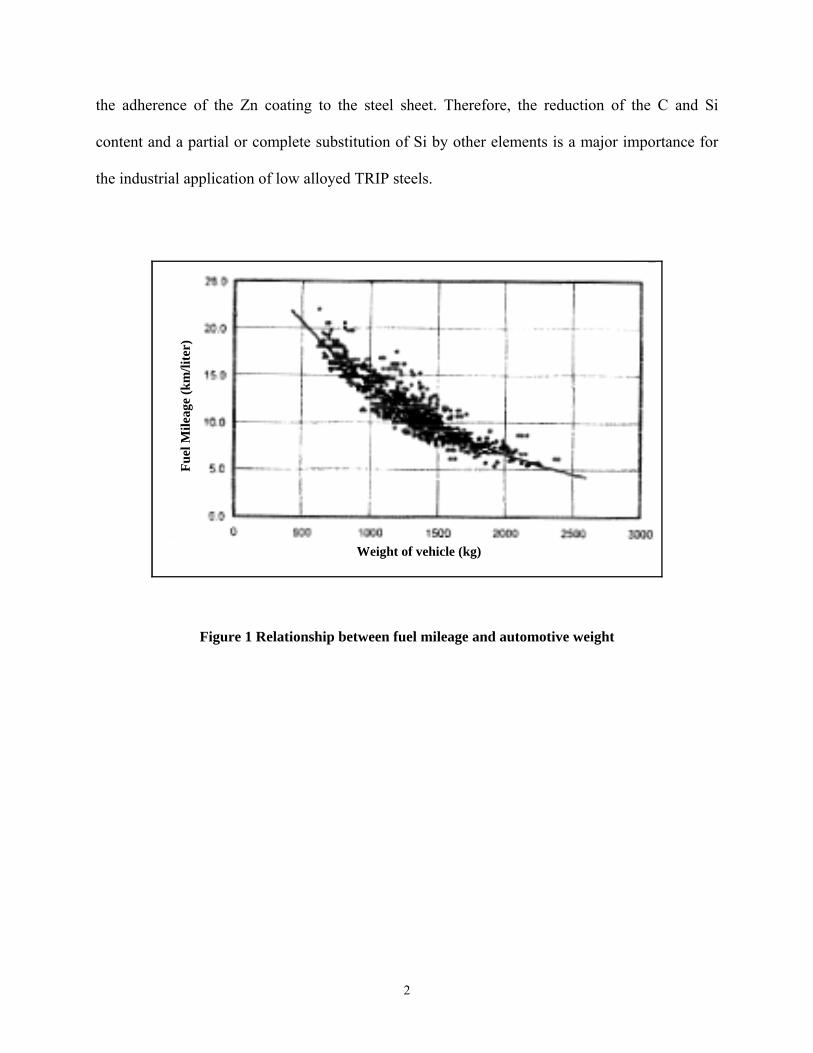
Figure 1 shows a relationship between the fuel mileage and automotive weight(1). The
weight reduction directly contributes to the improvement of the fuel consumption of
automobiles. In order to succeed in car weight reduction, it is necessary to develop sophisticated
high strength steels. Unfortunately, there are various factors that hinder the application of high
strength steels sheets for automotive parts, such as high production costs, poor formability, poor
shape fixability, weldability problems, and hot dip Zn coating. The latter is a problem that is due
to the high Si content in conventional TRIP steels, which results in surface defects and decreases
1
the adherence of the Zn coating to the steel sheet. Therefore, the reduction of the C and Si
content and a partial or complete substitution of Si by other elements is a major importance for
the industrial application of low alloyed TRIP steels.
Fuel
Mile
age
(km
/lite
r)
Weight of vehicle (kg)
Figure 1 Relationship between fuel mileage and automotive weight
2
2.0 BACKGROUND
TRIP steels are known to combine high strength levels with high ductility and therefore are very
attractive for the automotive industry, in particular for stretch forming applications and
crashworthiness. The high ductility of this type of steel results from the transformation of
metastable retained austenite to martensite under straining. This transformation is accompanied
by a volume expansion and results in a localized increase of the strain hardening coefficient
during straining, which delays the onset of necking and ultimately leads to a higher uniform and
total elongation. TRIP steels consist of a multiphase structure consisting of an intercritical ferrite
+ “new” ferrite matrix with a dispersion of bainite, metastable retained austenite, and martensite.
The TRIP effect improves strength and ductility by helping to maintain a high work-hardening
rate during straining. This can be explained due to two mechanisms(2):
the stress assisted nucleation of martensite variants favorably oriented with respect to the applied
stress, and the plastic straining of the surrounding phases due to the volume and shape changes
associated with the displacive transformation.
3
2.1 PROCESSING OF TRIP STEEL
There are two principal thermomechanical methods for TRIP processing:
a) Intercritical annealing of a cold rolled product, combined with a holding period in the bainitic
field, to obtain cold-rolled TRIP steel, and
b) Austenitic hot rolling, combined with a holding period in the austenite + ferrite field, followed
by coiling in the bainitic range, to obtain a hot-rolled TRIP steel.
The chemical composition and processing routes of the TRIP-assisted multiphase steels are
designed for the retention of austenite within a multiphase microstructure. In hot rolled TRIP
steels, thermomechanical processing is employed to control the microstructural evolution, in
order to optimize the characteristics of retained austenite. TMP is comprised of five stages: a)
deformation in the austenite recrystallization region, b) deformation in the austenite non–
recrystallization region: c) holding in the two phase, austenite + ferrite region, d) cooling during
the transformation (run-out table), and e) coiling. Coiling takes place in the temperature range of
the austenite to bainite transformation, thus, the final microstructure is strongly affected by the
coiling conditions.
In the case of cold-rolled and annealed steels, the TRIP-aided steels are obtained at the end of a
two-stage heat treatment. The first stage consists in an intercritical annealing (as for Dual-Phase
steels) during which a controlled volume fraction of austenite is formed together with the
intercritical ferrite. This intercritical annealing is followed by a fast cooling rate (15-25°C/sec) to
an isothermal holding stage in the bainite transformation temperature range of 350°C to 450°C.
4
During this holding, part of the austenite transforms to bainite, whereas residual austenite (i.e.
non-bainitically transformed austenite) may become sufficiently stabilized by carbon rejection
from bainitic ferrite as to not transform to martensite during the final quenching to room
temperature. As a consequence, the high carbon content in this residual austenite brings the Ms
temperature below room temperature(2,3,71). It is worth pointing out that the bainite
transformation is accompanied by the carbon redistribution from the bainitic ferrite to the
surrounding residual austenite. The bainite morphology appears to be in the form of upper
bainite (ferrite laths) above 350°C. Below this temperature, the carbide precipitation
characteristics of bainitic ferrite changes to lower bainite. All these variations in the bainite
characteristics can affect the state of the retained austenite and the final mechanical properties(4).
2.1.1 Intercritical annealing
During intercritical annealing of cold rolled TRIP-assisted steel, new equiaxed ferrite is formed,
and the remaining untransformed austenite is available for further transformation. Next, the steel
is cooled at approximately 15-25°C/sec to an isothermal bainitic temperature (IBT) of 350°C -
450°C. Here the bainite is formed, which in turn, stabilizes the remaining austenite even down to
room temperature. Most of the studies are focused on the second stage of the thermal scheme,
despite the fact that intercritical annealing itself offers a significant contribution to the final
microstructure and properties. Two distinct transformations take place during the intercritical
annealing stage: the deformed ferrite matrix recrystallizes and austenite forms. Only part of that
austenite is retained at room temperature as metastable austenite, while the other part transforms
to new or equiaxed ferrite and bainite.
5
Samajdar et al.(5) have characterized the transformations during intercritical annealing in a Fe-
0.11C-1.53Mn-1.5Si steel, and they reported that the initial formation of austenite was observed
inside pearlite colonies. They claimed that the transformation may be divided in two stages:
spheroidization of cementite and formation of austenite from the spheroidized cementite
particles. Below 1 min annealing, they observed the austenite structure to be very fine. When the
intercritical soaking time increased, a general coarsening of the austenite particles was observed
while the volume fraction of the austenitic phase leveled off. Also, the Ms temperature
determined by dilatometry was found to increase with longer soaking time. Even after a few
seconds annealing, about 5% of retained austenite could be detected, and the measured carbon
content of the retained austenite steadily dropped with longer annealing times. The rate of
austenite formation was much slower than that of ferrite recrystallization, the completion of the
latter being observed within about 5 seconds at 750°C. Pure austenite grain coarsening was
observed for prolonged holding, beyond 4 minutes at 750°C. Austenite, in general, was less
stable at long intercritical annealing times. This was in part interpreted by the influence of grain
size on the stability of austenite. For a given chemical composition, larger austenite grains are
expected to be less stable. Also, the high stability of intercritical austenite in the very beginning
of the soaking treatment was a direct consequence of its formation process from spheroidized
cementite, i.e., high C austenite. By this, the new austenite particles resulted with a high carbon
content leading to a considerable stability.
The decrease in the carbon content of the retained austenite for long holding times was a
direct consequence of the carbon homogenization process(5). At the initial stages of intercritical
annealing, the relative high carbon content of the austenite domains may strongly influence its
stability.
6
Garcia and DeArdo(6) have established in previous work that the nucleation of austenite from
ferrite-Fe3C structures occurs at the interface between the α and the Fe3C. In addition, the
formation of austenite was characterized by a three stage mechanism: a) preferential nucleation
of austenite at pearlite colony intersections or grain boundary cementite particles, followed by a
rapid growth of austenite accompanied by cementite dissolution, b) spheroidization of the
cementite particles due to their continuing dissolution and diffusion of the carbon from these
particles towards the growing austenite, c) very slow growth of the austenite into the ferrite. The
very final step involves the equilibration of ferrite and austenite which is controlled by Mn
diffusion in austenite.
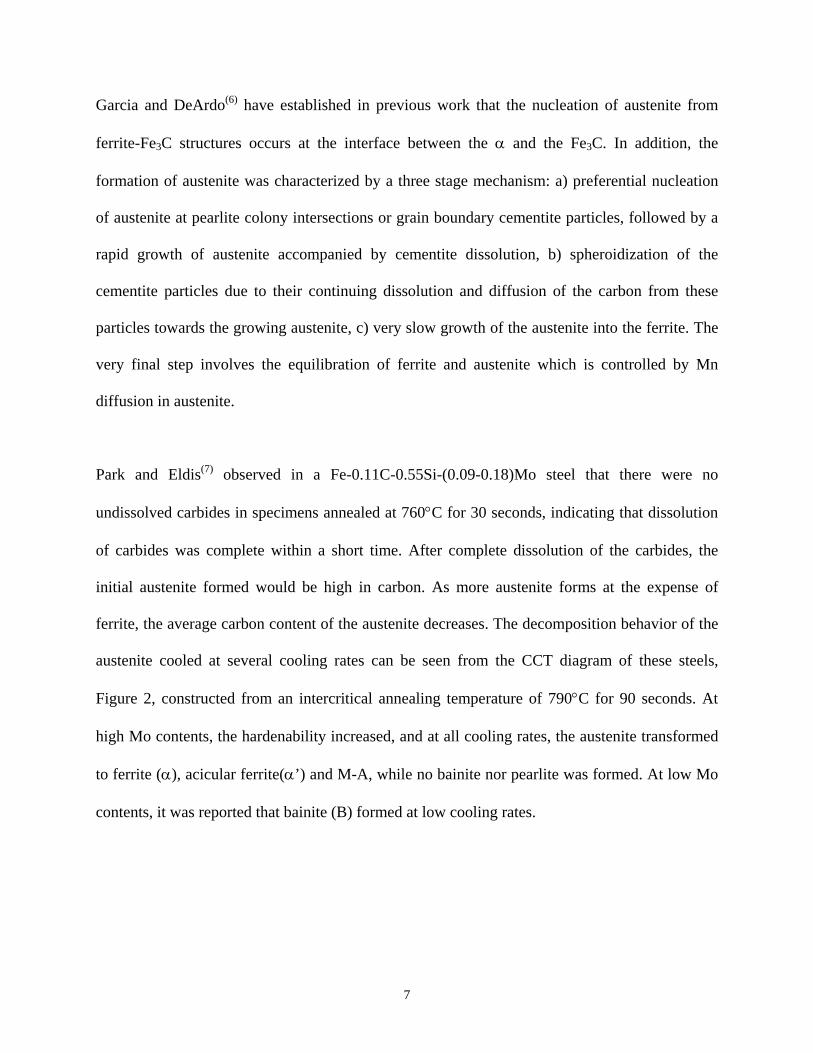
Park and Eldis(7) observed in a Fe-0.11C-0.55Si-(0.09-0.18)Mo steel that there were no
undissolved carbides in specimens annealed at 760°C for 30 seconds, indicating that dissolution
of carbides was complete within a short time. After complete dissolution of the carbides, the
initial austenite formed would be high in carbon. As more austenite forms at the expense of
ferrite, the average carbon content of the austenite decreases. The decomposition behavior of the
austenite cooled at several cooling rates can be seen from the CCT diagram of these steels,
Figure 2, constructed from an intercritical annealing temperature of 790°C for 90 seconds. At
high Mo contents, the hardenability increased, and at all cooling rates, the austenite transformed
to ferrite (α), acicular ferrite(α’) and M-A, while no bainite nor pearlite was formed. At low Mo
contents, it was reported that bainite (B) formed at low cooling rates.
7
Figure 2 Continuous cooling transformation diagram of a Fe-0.11C-0.55Si-0.18Mo steel intercritically annealed at 790 C for 90 seconds
The variations in the fraction of retained austenite with respect to intercritical annealing
temperature and the isothermal treatment temperature and time have been found to be quite
substantial in a study by Lee et al(8). In the case of an intercritical annealing temperature of
810°C and isothermally treated at 450°C (in a Fe-0.1C-1.5Mn-0.94Si steel), the fraction of
retained austenite was close to 10% when the isothermal treatment time was 1 minute, but was
reduced to 2% when isothermally treated for 10 minutes. When intercritically annealed at 780°C,
it was slightly over 10% at the initial stage of isothermal treatment, and then decreased to about
4% after 10-minute isothermal treatment; this case thus showed the higher fraction of retained
austenite overall than the 810°C case. Isothermal treatment at 450°C also resulted in the higher
fraction of retained austenite in comparison with 470°C. Therefore, lowering both the
intercritical annealing temperature and the isothermal treatment temperature worked more
8
favorably for the increased fraction of retained austenite and the subsequent improvement in
strength and elongation.
Microstructures and fractions of retained austenite of cold-rolled steels substantially vary
with the intercritical annealing conditions due to the redistribution of solute elements,
particularly carbon. At a high intercritical annealing temperature, the austenite fraction increases,
but a large amount of retained austenite (after the IBT) cannot be obtained because the carbon
content in austenite decreases. At low intercritical annealing temperatures, the carbon content in
austenite can increase, but the obtainable amount of retained austenite is also reduced because of
the initially low austenite fraction. It has been reported(8) that the intercritical annealing
temperature to obtain the higher fraction of retained austenite is (Ac1+Ac3)/2, however, this may
not always be the best choice. The intercritical annealing should be conducted at a temperature at
which the stability of austenite can be raised by increasing the concentration of alloying elements
in austenite by lowering the fraction of austenite formed during the intercritical annealing. When
the intercritical annealing temperature is set too low, the mechanical properties do not improve
much because the fraction of retained austenite is reduced due to the reduction of the absolute
amount of austenite and because retained austenite with higher stability than an appropriate
stability level is formed. It is often believed that the appropriate temperature is the one at which
the fraction ratio of ferrite and austenite is 50:50(8). Furthermore, it has also been reported that
the bainitic isothermal treatment at Ms+(20-30°C) produces the highest fraction of retained
austenite and excellent mechanical properties.
9
2.1.2 Isothermal Bainitic Transformation (IBT)
The bainite transformation can be described as both diffusionless as well as a short range
diffusion transformation in which the growth of a sheaf occurs by the martensitic propagation of
subunits, and redistribution of carbon from these subunits to the residual austenite mainly occurs
after the actual transformation has taken place. Hence, austenite is retained due to a lowered Ms
point by the enrichment of carbon even after cooling to room temperature(4,9,33,38,65). The
stabilization of austenite at room temperature is due to its carbon enrichment all along the
thermal scheme. Firstly, carbon concentrates within austenite during the intercritical annealing.
Secondly, the bainite transformation is accompanied by carbon redistribution from bainitic ferrite
to the surrounding residual austenite(2,3,9,10).
The carbide phase associated with upper and lower bainite, precipitates from the carbon
enriched austenite, and is always cementite. If the carbon concentration of the remaining
austenite exceeds the value given by the extrapolated γ/(γ+θ) phase boundary shown in Figure 3,
then cementite precipitation from the enriched austenite lying adjacent to the platelets of bainitic
ferrite, becomes possible. The shaded area in this figure represents austenite which is unstable
with respect to the precipitation of cementite. Similarly, bainite growth stops when the carbon
concentration of the remaining austenite exceeds the T'o phase boundary. This "stasis" between
the T'o phase boundary and the extrapolated γ/(γ+θ) phase boundary, Tc, results in carbon
enrichment in the remaining austenite, thereby assisting austenite stabilization. Furthermore,
carbide precipitation is expected to accompany the continuation of the growth of upper bainite
from the remaining austenite, if the transformation temperature is below Tc or the holding time
10
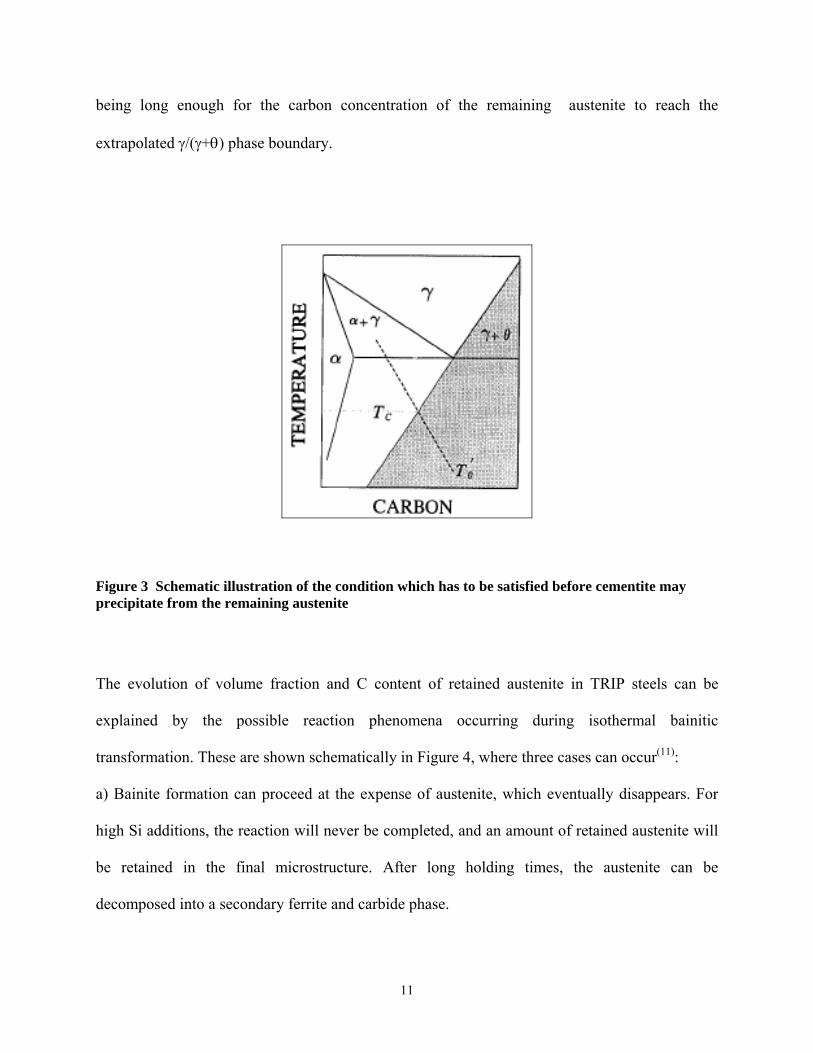
being long enough for the carbon concentration of the remaining austenite to reach the
extrapolated γ/(γ+θ) phase boundary.
Figure 3 Schematic illustration of the condition which has to be satisfied before cementite may precipitate from the remaining austenite
The evolution of volume fraction and C content of retained austenite in TRIP steels can be
explained by the possible reaction phenomena occurring during isothermal bainitic
transformation. These are shown schematically in Figure 4, where three cases can occur(11):
a) Bainite formation can proceed at the expense of austenite, which eventually disappears. For
high Si additions, the reaction will never be completed, and an amount of retained austenite will
be retained in the final microstructure. After long holding times, the austenite can be
decomposed into a secondary ferrite and carbide phase.
11
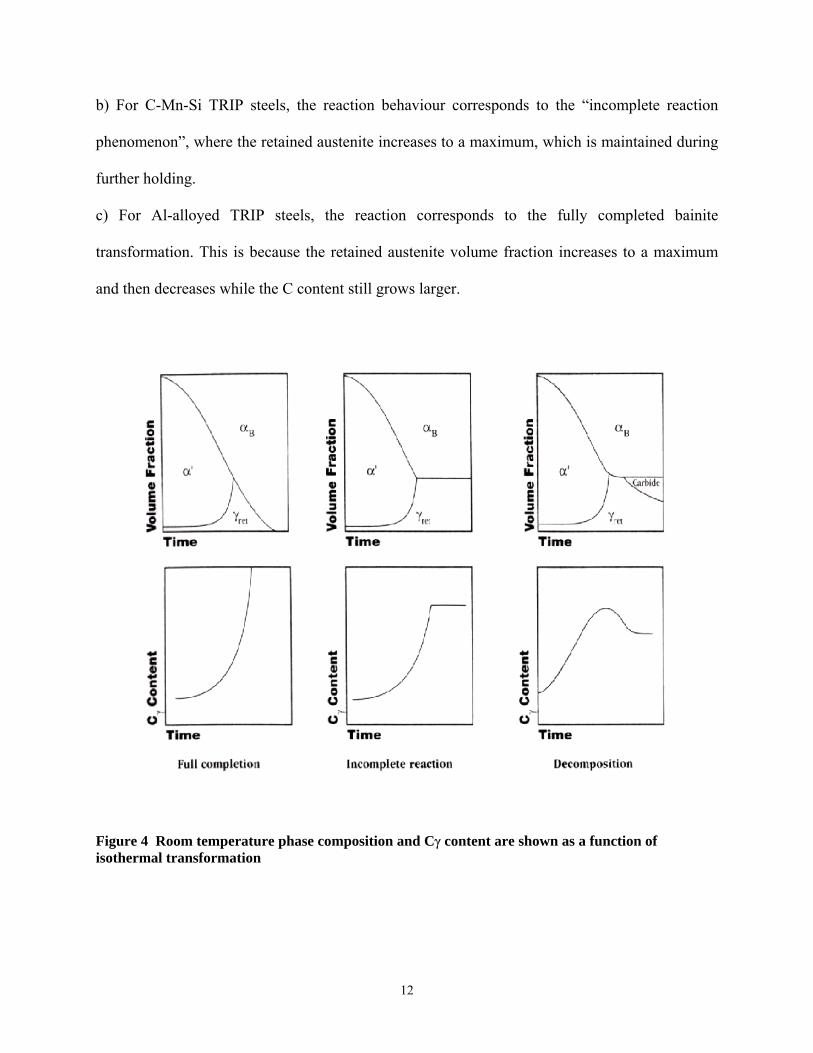
b) For C-Mn-Si TRIP steels, the reaction behaviour corresponds to the “incomplete reaction
phenomenon”, where the retained austenite increases to a maximum, which is maintained during
further holding.
c) For Al-alloyed TRIP steels, the reaction corresponds to the fully completed bainite
transformation. This is because the retained austenite volume fraction increases to a maximum
and then decreases while the C content still grows larger.
Figure 4 Room temperature phase composition and Cγ content are shown as a function of isothermal transformation
12
2.2 MECHANISMS OF BAINITE TRANSFORMATION
2.2.1 Continuously cooled transformed bainite
In commercially important steels, typical CCT diagrams features the polygonal ferrite
transformation region shifted rightwards to regions of very slow cooling rate, exposing a broad,
flat bainite transformation region. This has the advantage of an almost constant transformation
start temperature for bainite over a wide range of cooling rates. However, this situation is
complicated because of the wide variations in bainite microstructures that can be observed. The
transformation in the bainite region does not produce a single microconstituent despite the
uniformity in the transformation temperature range. The microstructures produced in this region
are very complex and result from the growth of an acicular ferrite phase associated with a second
constituent which may consist of carbides, martensite and/or austenite depending upon
supersaturation of carbon in the austenite, the kinetics of carbon diffusion, steel compositions,
etc. Acicular bainite will form at fast cooling rates, whereas granular bainite appears at slow
cooling rates. At fast cooling rates within the bainitic region, a steep carbon concentration
gradient is developed in the austenite, with a high carbon supersaturation at the ferrite/austenite
interface. As a consequence, cementite precipitation can occur at the ferrite/austenite interface
during the growth process. At slow cooling rates, the carbon gradient extends over a greater
distance into the austenite and the carbon concentration is lower at the interface, making the
cementite precipitation process very difficult. This increased carbon concentration in the
remaining austenite can stabilize the austenite from further transformation, resulting in retained
austenite which leads to the formation of a granular bainite morphology.
13
2.2.2 Isothermally transformed bainite
From an industrial point of view, many types of steel are processed under continuous cooling
conditions and it is rare that steel is processed under isothermal conditions in the bainitic region.
In conventional TRIP steels, bainite is formed by isothermal treatment. The mechanism of
isothermal bainitic transformation has been the subject of numerous investigations and three
distinct models have been proposed so far, and these are(12), a) displacive, b) diffusional, and c)
coupled diffusional/displacive models. In the displacive model for the transformations from
austenite to ferrite, it is assumed that, although the product ferrite nucleates with carbon
partitioning, its growth involves a full carbon supersaturation as in the case of martensite, the
alloy partitioning occurring mostly after transformation. In the case of diffusional
(reconstructive) transformation, it has been reported that one-to-one atomic site correspondence
at the coherent parent/product interfaces as expected in the case of ledge mechanism can produce
surface reliefs similar to those in displacive transformation. The other model in an intermediate
case is the coupled diffusional/displacive transformation mechanism. In this case, as far as
substitutional atoms are concerned, the bainitic transformation is assumed to be in a displacive
fashion but the partition of interstitial atoms is thought to occur at the advancing product/parent
interfaces. This implies that bainitic reaction in interstitial-free steels should be the same as that
of martensite.
The formation of surface reliefs has often been referred to as an evidence of displacive
transformation. However, surface reliefs can also be formed by the diffusional ledge
mechanism(12). In the latter case, if the elastic strain due to the phase change by the ledge
mechanism were built up, the progress of phase transition would be stopped by the strain energy
14
which consumes the driving force in the early stage of transformation, producing rather small
surface reliefs. While, if such an elastic strain were relaxed also by a diffusional process, very
sharp surface reliefs at higher temperatures would not be expected and the surface rumpling due
to the volume change would be produced.
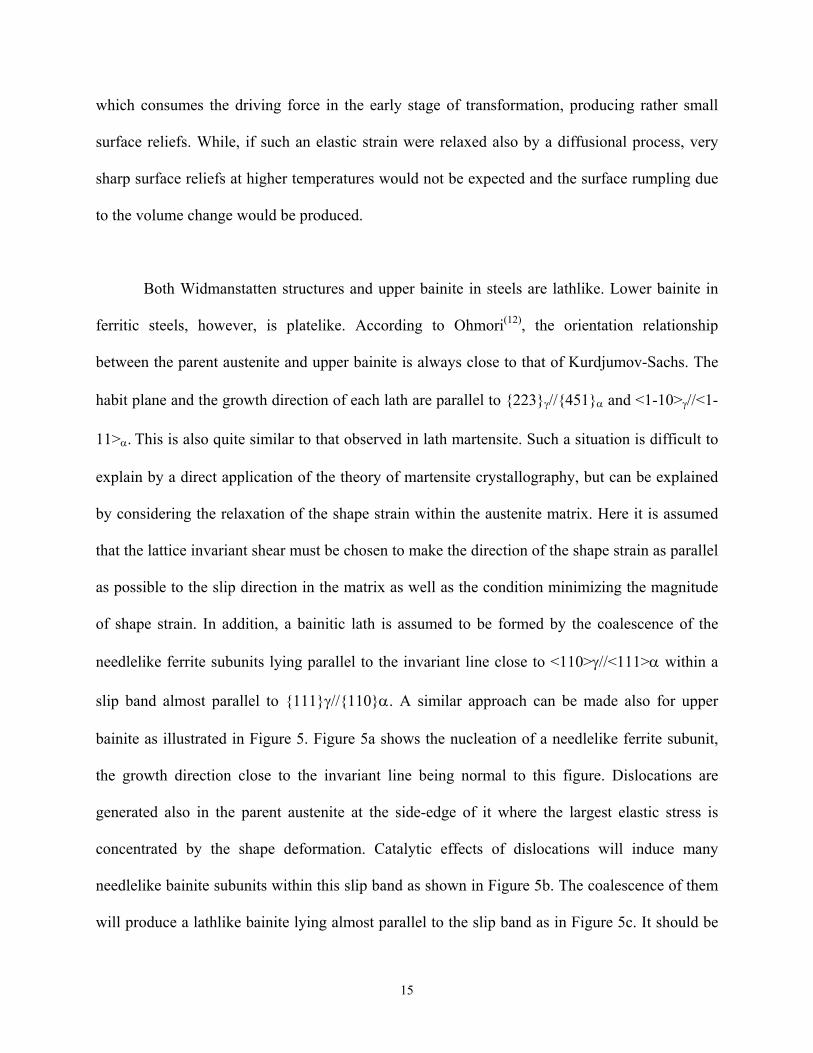
Both Widmanstatten structures and upper bainite in steels are lathlike. Lower bainite in
ferritic steels, however, is platelike. According to Ohmori(12), the orientation relationship
between the parent austenite and upper bainite is always close to that of Kurdjumov-Sachs. The
habit plane and the growth direction of each lath are parallel to {223}γ//{451}α and <1-10>γ//<1-
11>α. This is also quite similar to that observed in lath martensite. Such a situation is difficult to
explain by a direct application of the theory of martensite crystallography, but can be explained
by considering the relaxation of the shape strain within the austenite matrix. Here it is assumed
that the lattice invariant shear must be chosen to make the direction of the shape strain as parallel
as possible to the slip direction in the matrix as well as the condition minimizing the magnitude
of shape strain. In addition, a bainitic lath is assumed to be formed by the coalescence of the
needlelike ferrite subunits lying parallel to the invariant line close to <110>γ//<111>α within a
slip band almost parallel to {111}γ//{110}α. A similar approach can be made also for upper
bainite as illustrated in Figure 5. Figure 5a shows the nucleation of a needlelike ferrite subunit,
the growth direction close to the invariant line being normal to this figure. Dislocations are
generated also in the parent austenite at the side-edge of it where the largest elastic stress is
concentrated by the shape deformation. Catalytic effects of dislocations will induce many
needlelike bainite subunits within this slip band as shown in Figure 5b. The coalescence of them
will produce a lathlike bainite lying almost parallel to the slip band as in Figure 5c. It should be
15

noted that the growth direction of a lath is normal to the figure and only the sidewise growth
direction can be recognized in Figure 5c.
Figure 5 A model of upper bainite formation. The growth direction of either the bainite subunits or the bainitic lath which lies close to the invariant line is normal to this figure. Thus, these figures show the cross sections normal to the growth direction for either the bainite subunits or the laths. (a) nucleation of bainite subunit, (b) autocatalytic nucleation of ferrite subunits and (c) the lath formation by the coalescence of them.
Bhadeshia and Edmonds(18,19) have measured the extent of isothermally transformed bainite at
the point where the bainite reaction ceases, and found that this approximately conformed with
the To line, but was in disagreement with the Ae3 composition. This effect, is known as the
“incomplete reaction phenomenon”, and implies that bainite does grow with a supersaturation of
carbon. They pointed out that exact agreement with the To line cannot be expected since the
16
distribution of carbon in the austenite was not uniform. This should lead to a greater than
expected volume fraction of transformation even if bainite formation involved full carbon
supersaturation. Therefore, the existence of an inhomogeneous distribution of carbon is an
important factor in the development of the bainite transformation.
Bhadeshia(18) demonstrated this existence of the non-uniform distribution of carbon in the
austenite retained after bainitic transformation, where the carbon concentration in many cases
exceeded that given by the To curve. The results, however, could be interpreted to be in accord
with the contention that bainite initially forms with a full supersaturation of carbon, despite the
apparent disagreement with the To criterion. This becomes clear when it is realized that austenite
can continue to accumulate carbon from suitable sources, up to a maximum corresponding to the
Ae3 limit, although it cannot then transform to fully supersaturated ferrite. A small region of
austenite which has already been affected by the dumping of carbon from a bainite plate may
become isolated by the formation of further supersaturated platelets in close proximity. The
subsequent rejection of carbon from the latter can then raise the carbon content of entrapped
austenite to levels beyond the To curve. The probability of such a sequence of events is high
because of the nature of bainite sheaf development. An inhomogeneous distribution of carbon is
also to be expected under these circumstances, since the local carbon content of any isolated
region of austenite must depend on the state of isolation, the morphology and the exact sequence
of transformation.
An alternative interpretation could arise if bainite growth, at all stages of transformation,
involved only a partial supersaturation, the remainder being pushed ahead of the transformation
interface, giving diffusion controlled kinetics. It might be assumed that the level of carbon in the
17
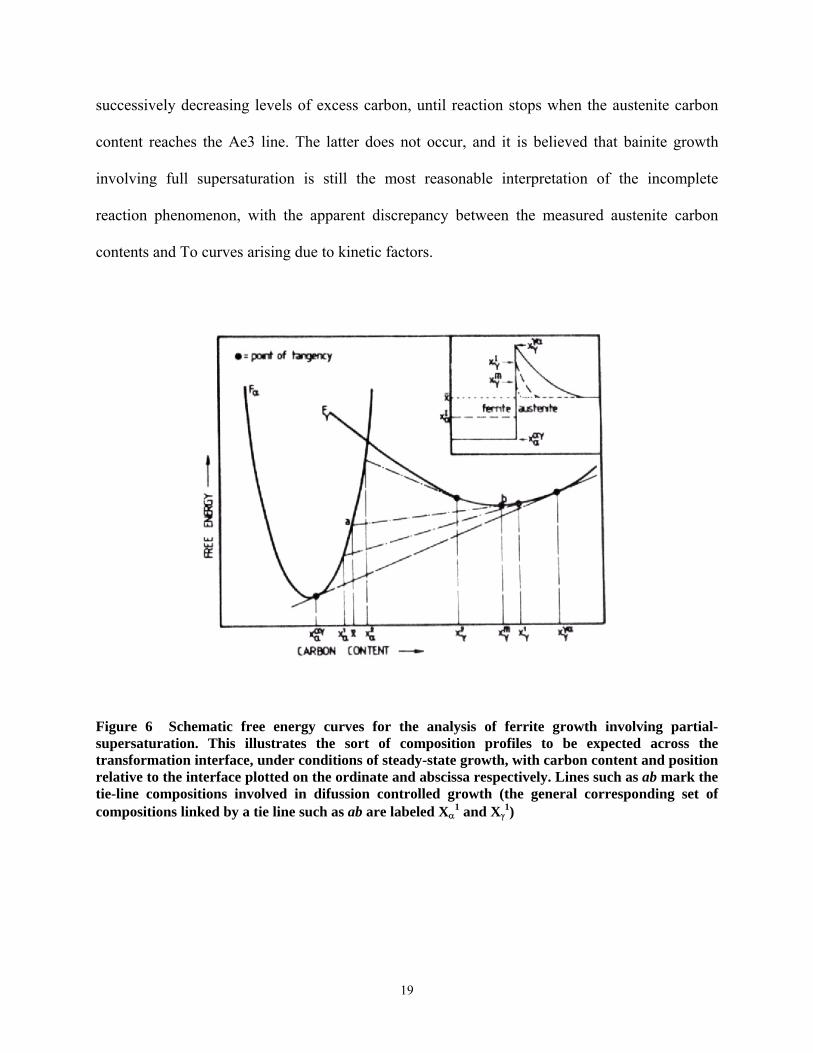
ferrite during growth must have been less than (avg. alloy carbon content) although greater
than the corresponding equilibrium concentration. It is possible to calculate the interface tie-line
compositions for growth involving partial supersaturation, as shown in Figure 6. If is the
average alloy carbon concentration, the tie line X
_
x
_
x
α1 - Xγ1 refers to the formation of bainitic ferrite
with a carbon excess of (Xα1 - Xα
αγ), with reaction termination occurring when the austenite
carbon level reaches Xγ1. Figure 6 properly depicts the conditions involved in Bhadeshia’s work,
since falls to the left of the intersection of the alpha and gamma free energy curves. If the
supersaturation in the ferrite is now allowed to approach , then Xγ
_
x
_
x1 tends towards Xγ
m. In the
limit that Xα1= , we obtain the unexpected result that growth involving partial supersaturation
must have a minimum terminal carbon level in the austenite, given by X
_
x
γm. Clearly, an austenite
tie-line composition less than Xγm., i.e., Xγ2, is physically unreasonable since it corresponds to a
ferrite supersaturation exceeding . It should be pointed out, that if growth does involve the
formation of partially supersaturated ferrite, it is not obvious as to why the level of
supersaturation should vary as it does. It would also appear that growth under these
circumstances of partial supersaturation would be unstable, and should rapidly degenerate to that
involving a zero excess of carbon in the ferrite. While it seems reasonable that the hypothesis of
ferrite growth involving supersaturations less than - X
_
x
_
x ααγ can be discounted, there is yet
another possible interpretation. In this, the sub-units of bainite may first grow martensitically,
with subsequent carbon rejection into the residual austenite, until the carbon content of the latter
reaches the To line. At this point, the bainite could start growing with a lower carbon content
than the now enriched remaining austenite. However, such an interpretation seems unsatisfactory
since there is then no clear reason why the bainite-ferrite should not continue to grow with
18
successively decreasing levels of excess carbon, until reaction stops when the austenite carbon
content reaches the Ae3 line. The latter does not occur, and it is believed that bainite growth
involving full supersaturation is still the most reasonable interpretation of the incomplete
reaction phenomenon, with the apparent discrepancy between the measured austenite carbon
contents and To curves arising due to kinetic factors.
Figure 6 Schematic free energy curves for the analysis of ferrite growth involving partial-supersaturation. This illustrates the sort of composition profiles to be expected across the transformation interface, under conditions of steady-state growth, with carbon content and position relative to the interface plotted on the ordinate and abscissa respectively. Lines such as ab mark the tie-line compositions involved in difussion controlled growth (the general corresponding set of compositions linked by a tie line such as ab are labeled Xα
1 and Xγ1)
19
2.2.3 Alloy partition during the bainite transformation
Carbon atoms are enriched in the untransformed austenite during the progress of bainite
transformation in steels. The stage where such partition of carbon atoms occurs has been the
subject for numerous arguments. In the diffusional and the coupled diffusional/displacive
models, the partition is expected to occur during the progress of bainitic transformation, whereas
in the displacive mechanism martensitic structure supersaturated in interstitial atoms forms first
at temperatures below To and then carbon atoms are depleted from martensite.
Bainite and enriched austenite are in thermodynamical equilibrium, if the To carbon
concentration is reached, which is a function of chemical composition, temperature and stress
state of the austenite(13,14,21,22), Figure 3. Also, cementite precipitation in the austenite during
bainite holding can occur, if the carbon concentration is situated in the extrapolated γ+θ field.
The kinetics of cementite precipitation can be reduced when lowering the temperature due to
slower diffusion processes. The addition of graphitizing elements, will also slow the nucleation
and growth of cementite embryos.
Similarly, the bainite transformation kinetics decrease when lowering the temperature
due to a slower diffusion of the carbon out of the bainite sheaves and an obstruction of the plastic
accommodation of the surrounding austenite caused by its strengthening.
Matsumura et al(15) have expressed the kinetics for the bainite transformed 0.4C-1.5Si-
0.8Mn steel in the form of :
pp
pk
VVε
γγ⎟⎟⎠
⎞⎜⎜⎝
⎛=−
0
11
20
where Vγ is the volume fraction of austenite, Vγ0 is the initial austenite volume fraction, kp is a
constant relating to the stability of retained austenite against deformation, and p is the strain
exponent concerning auto-catalytic effect. The strain exponent p was assumed to be 1 for dual-
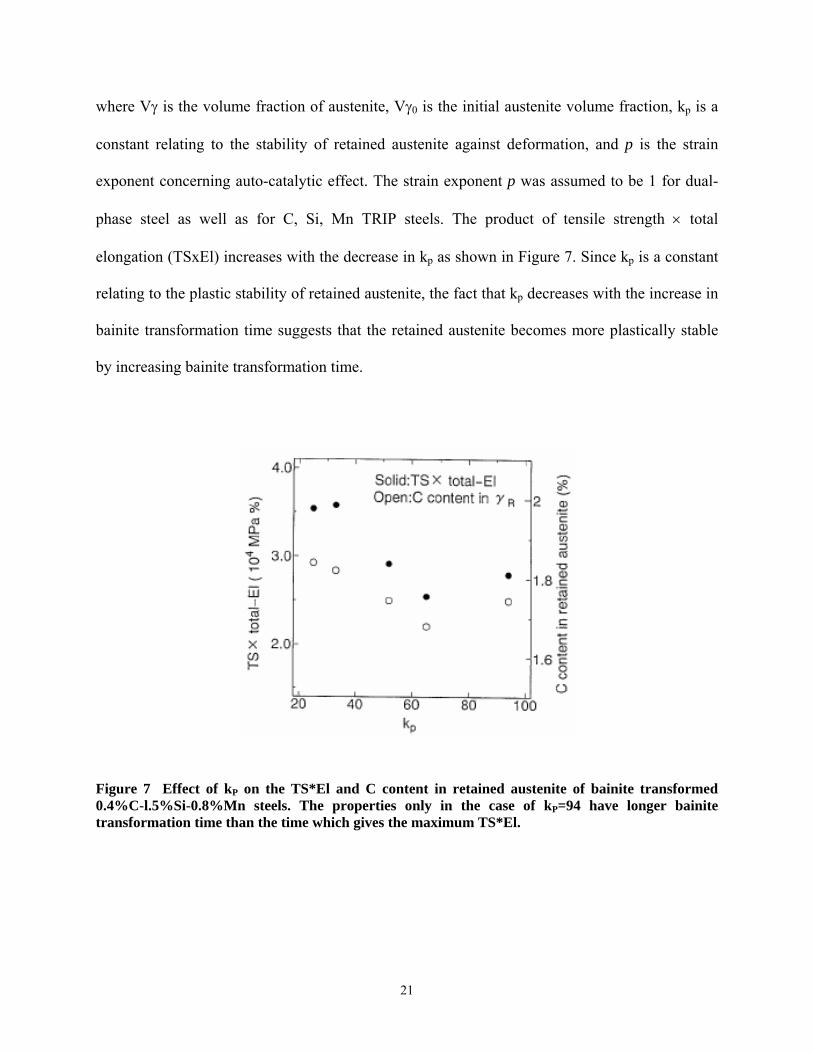
phase steel as well as for C, Si, Mn TRIP steels. The product of tensile strength × total
elongation (TSxEl) increases with the decrease in kp as shown in Figure 7. Since kp is a constant
relating to the plastic stability of retained austenite, the fact that kp decreases with the increase in
bainite transformation time suggests that the retained austenite becomes more plastically stable
by increasing bainite transformation time.
Figure 7 Effect of kP on the TS*El and C content in retained austenite of bainite transformed 0.4%C-l.5%Si-0.8%Mn steels. The properties only in the case of kP=94 have longer bainite transformation time than the time which gives the maximum TS*El.
21
Experimental evidence indicate that the kinetic properties and the partition of alloying elements
in bainitic structures arise definitely out of a reconstructive phase change and are difficult to be
explained by a displacive mechanism. The crystallographic properties, however, are much easily
understood in terms of a displacive theory. In order to interpret these observations
comprehensively, a model where the lattice change from the parent to the product phase occurs
via a reconstructive mechanism and then the elastic strain due to the lattice change is partially
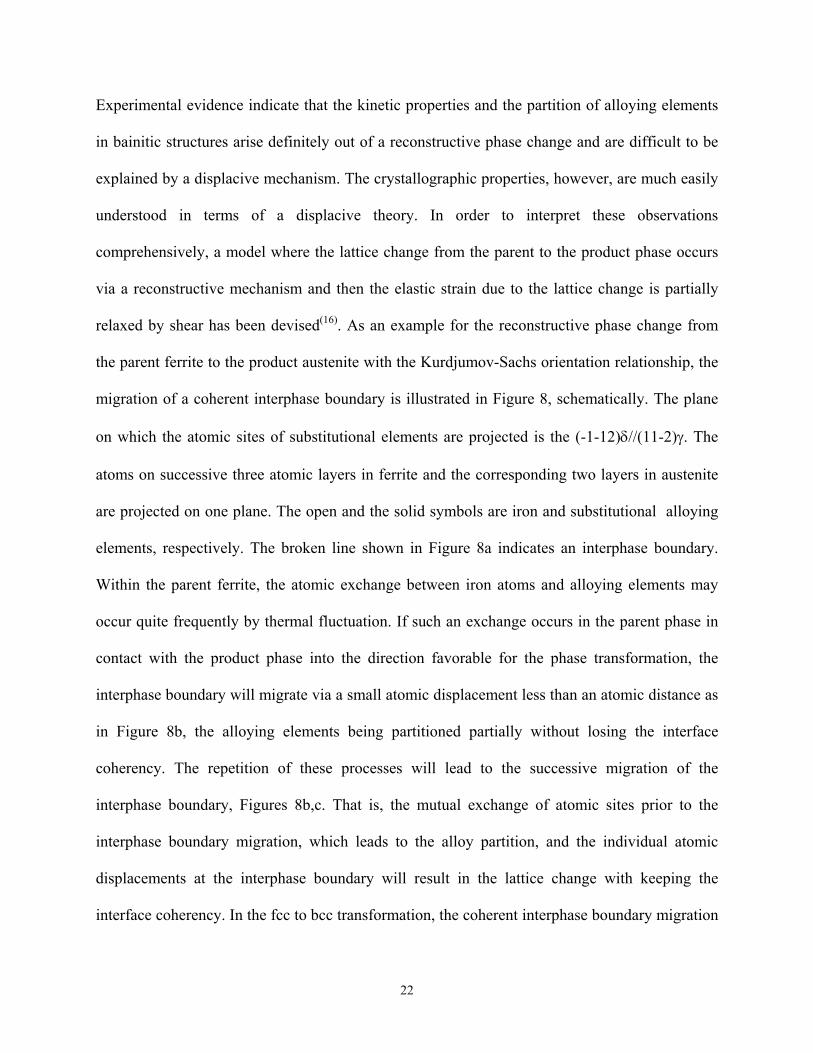
relaxed by shear has been devised(16). As an example for the reconstructive phase change from
the parent ferrite to the product austenite with the Kurdjumov-Sachs orientation relationship, the
migration of a coherent interphase boundary is illustrated in Figure 8, schematically. The plane
on which the atomic sites of substitutional elements are projected is the (-1-12)δ//(11-2)γ. The
atoms on successive three atomic layers in ferrite and the corresponding two layers in austenite
are projected on one plane. The open and the solid symbols are iron and substitutional alloying
elements, respectively. The broken line shown in Figure 8a indicates an interphase boundary.
Within the parent ferrite, the atomic exchange between iron atoms and alloying elements may
occur quite frequently by thermal fluctuation. If such an exchange occurs in the parent phase in
contact with the product phase into the direction favorable for the phase transformation, the
interphase boundary will migrate via a small atomic displacement less than an atomic distance as
in Figure 8b, the alloying elements being partitioned partially without losing the interface
coherency. The repetition of these processes will lead to the successive migration of the
interphase boundary, Figures 8b,c. That is, the mutual exchange of atomic sites prior to the
interphase boundary migration, which leads to the alloy partition, and the individual atomic
displacements at the interphase boundary will result in the lattice change with keeping the
interface coherency. In the fcc to bcc transformation, the coherent interphase boundary migration
22
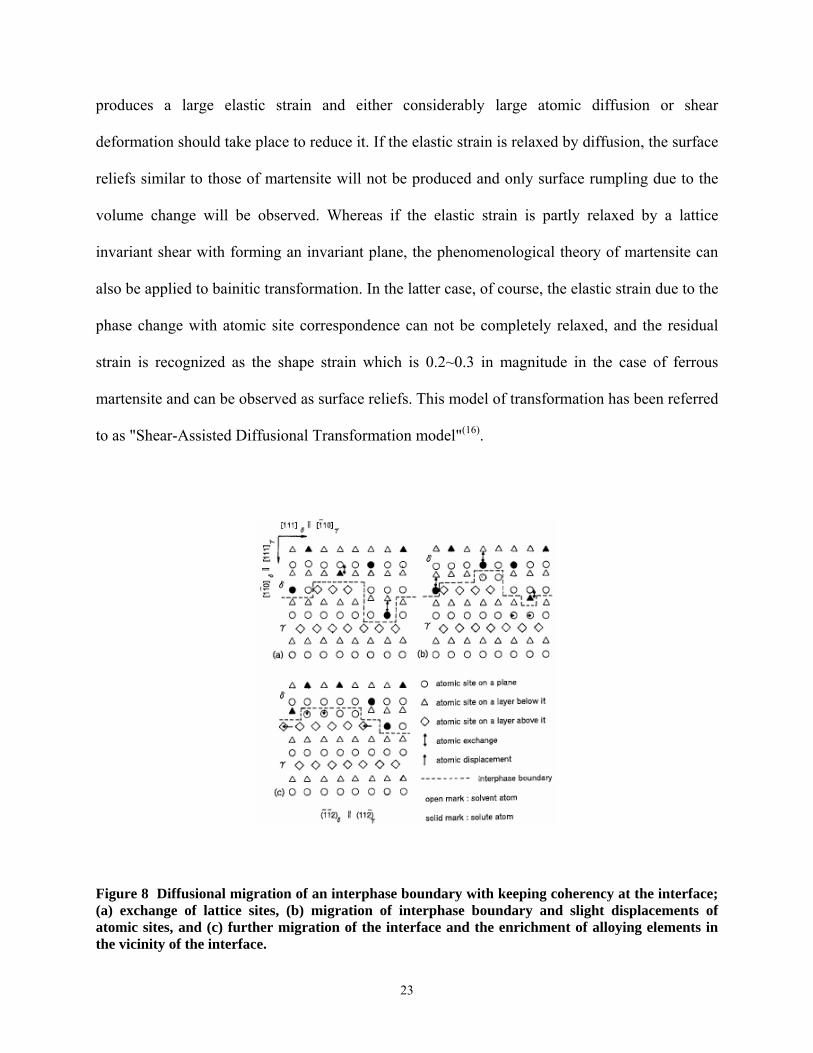
produces a large elastic strain and either considerably large atomic diffusion or shear
deformation should take place to reduce it. If the elastic strain is relaxed by diffusion, the surface
reliefs similar to those of martensite will not be produced and only surface rumpling due to the
volume change will be observed. Whereas if the elastic strain is partly relaxed by a lattice
invariant shear with forming an invariant plane, the phenomenological theory of martensite can
also be applied to bainitic transformation. In the latter case, of course, the elastic strain due to the
phase change with atomic site correspondence can not be completely relaxed, and the residual
strain is recognized as the shape strain which is 0.2~0.3 in magnitude in the case of ferrous
martensite and can be observed as surface reliefs. This model of transformation has been referred
to as "Shear-Assisted Diffusional Transformation model"(16).
Figure 8 Diffusional migration of an interphase boundary with keeping coherency at the interface; (a) exchange of lattice sites, (b) migration of interphase boundary and slight displacements of atomic sites, and (c) further migration of the interface and the enrichment of alloying elements in the vicinity of the interface.
23
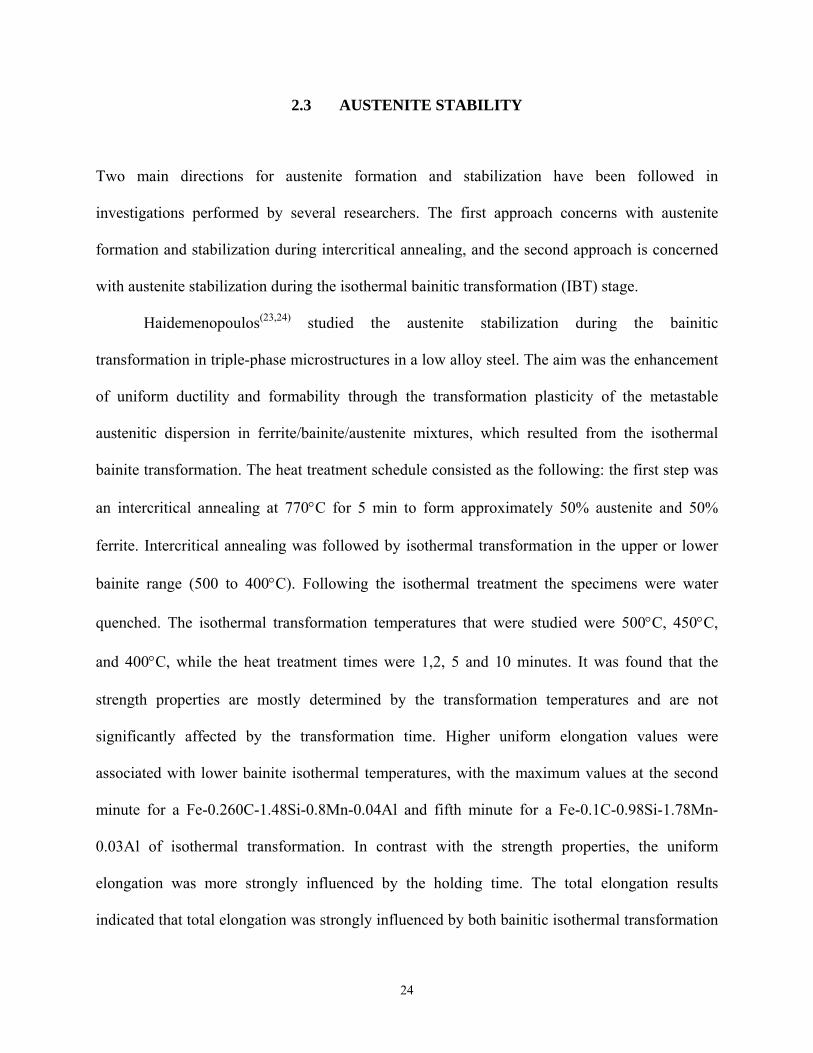
2.3 AUSTENITE STABILITY
Two main directions for austenite formation and stabilization have been followed in
investigations performed by several researchers. The first approach concerns with austenite
formation and stabilization during intercritical annealing, and the second approach is concerned
with austenite stabilization during the isothermal bainitic transformation (IBT) stage.
Haidemenopoulos(23,24) studied the austenite stabilization during the bainitic
transformation in triple-phase microstructures in a low alloy steel. The aim was the enhancement
of uniform ductility and formability through the transformation plasticity of the metastable
austenitic dispersion in ferrite/bainite/austenite mixtures, which resulted from the isothermal
bainite transformation. The heat treatment schedule consisted as the following: the first step was
an intercritical annealing at 770°C for 5 min to form approximately 50% austenite and 50%
ferrite. Intercritical annealing was followed by isothermal transformation in the upper or lower
bainite range (500 to 400°C). Following the isothermal treatment the specimens were water
quenched. The isothermal transformation temperatures that were studied were 500°C, 450°C,
and 400°C, while the heat treatment times were 1,2, 5 and 10 minutes. It was found that the
strength properties are mostly determined by the transformation temperatures and are not
significantly affected by the transformation time. Higher uniform elongation values were
associated with lower bainite isothermal temperatures, with the maximum values at the second
minute for a Fe-0.260C-1.48Si-0.8Mn-0.04Al and fifth minute for a Fe-0.1C-0.98Si-1.78Mn-
0.03Al of isothermal transformation. In contrast with the strength properties, the uniform
elongation was more strongly influenced by the holding time. The total elongation results
indicated that total elongation was strongly influenced by both bainitic isothermal transformation
24
(BIT) time and temperature. The higher total and uniform elongation were associated with the
lower transformation temperatures. Retained austenite was found to increase first and then
decrease with BIT time, regardless of temperature. This behavior was attributed to the variation
of austenite stability with BIT time.
At short times, the growing bainite rejects carbon to the austenite, and the carbon
enrichment stabilizes the austenite. At longer times, carbide precipitation starts and carbon
content of the austenite decreases and its stability drops. The maximum in the amount of retained
austenite coincides with the maximum of uniform elongation, indicating a strong influence of
transformation plasticity of retained austenite in plastic flow stabilization.
Itami et al(20) investigated the influence of stability of retained austenite on tensile
properties in a Fe-0.14C-1.66Mn-1.94Si. Only the bainite transformation time during the IBT in
the continuous annealing process was varied in order to change the C content in retained
austenite. No significant difference in microstructures was detected for the specimens bainite
transformed for 10, 60 and 480s, and the second phases seem to be located in grain boundaries
and in ferrite matrices. Tensile strength and elongation increased with the increase in bainite
transformation time. The strength-ductility balance deteriorated with the decrease in bainite
transformation time. YP and yield ratio (YP/TS) become remarkably low when the bainite
transformation time was short. On the other hand, the observed volume fraction of retained
austenite increased from 9.5, 12.7 to 13.2% when the bainite transformation time is 10, 60 and
480s, respectively, showing the effect of austenite stabilization at longer holding times. Short
bainite transformation treatment times are considered to result in unstable austenite which will
transform to martensite during air-cooling after the bainite transformation treatment, therefore
25
decreasing the total amount of retained austenite. Figure 9 shows that the volume fraction of
retained austenite decreases with the increase in strain, the behavior of which depends on bainite
transformation time. The longer the bainite transformation time, the higher the volume fraction
of retained austenite remains.
Work hardening occurs when the retained austenite transforms to martensite. Since the
plastically unstable retained austenite transforms in the early stage of deformation, it leads to the
high ‘n’ value only at this deformation stage. Therefore, this kind of austenite is not thought to
improve the strength-ductility balance. A local neck is avoided by work hardening of ferrite,
bainite and retained austenite before the critical stress when the martensitic transformation takes
place. After the critical stress, ‘n’ value increases due to the martensitic transformation of
retained austenite, and the strength-ductility balance is improved. The strength-ductility balance
and plastic stability of retained austenite are improved with the increase in C content in retained
austenite after optimizing the bainite transformation time. Martensitic transformation is
considered to occur from the plastically unstable retained austenite with low C content.
26
Figure 9 Effect of bainite transformation time (t) on change in volume fraction of retained austenite with deformation
Figure 10 shows the typical variation in retained austenite content with tempering treatments for
600 sec at 400°C(21). The retained austenite is completely stable against the tempering below a
given critical temperature TH, and above this temperature TH the volume fraction decreases
drastically (TH is therefore defined as the decomposition temperature of the retained austenite to
bainite). A relationship was observed between Ms and TH temperatures, as observed in Figure
11, for two different BIT holding times. It is found that the temperature TH increases linearly
with an increase in the Ms temperature, and these are related as:
TH= 395-Ms
27
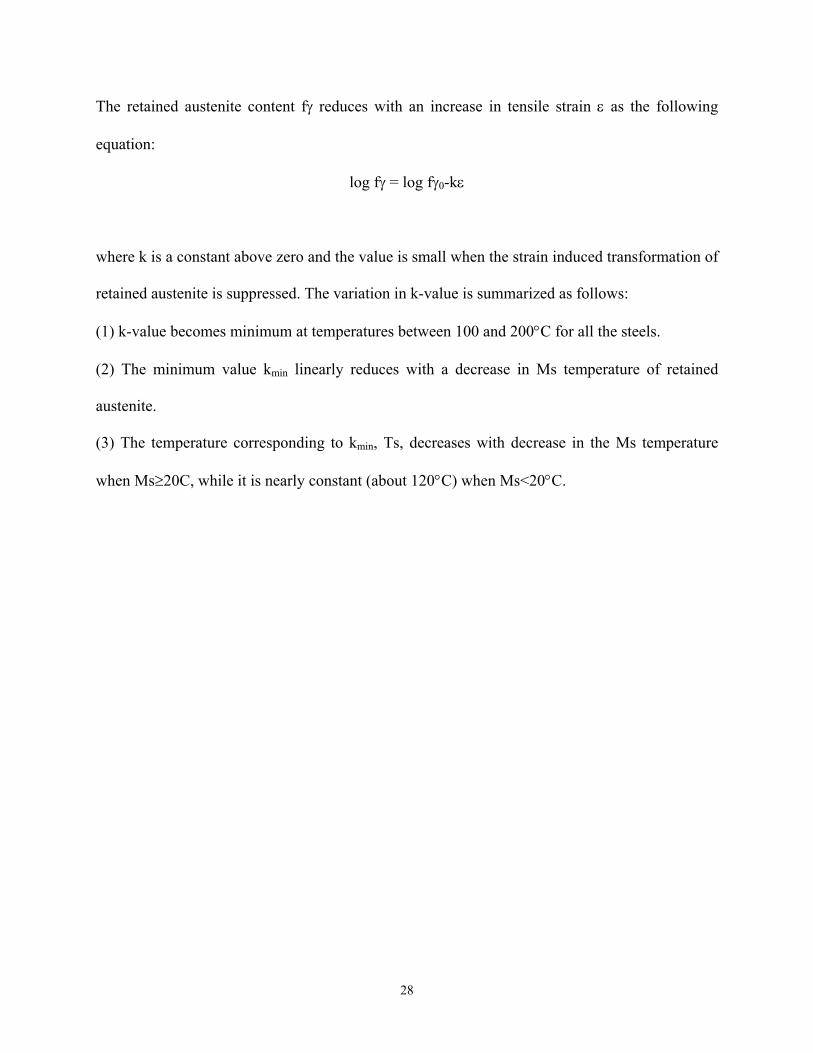
The retained austenite content fγ reduces with an increase in tensile strain ε as the following
equation:
log fγ = log fγ0-kε
where k is a constant above zero and the value is small when the strain induced transformation of
retained austenite is suppressed. The variation in k-value is summarized as follows:
(1) k-value becomes minimum at temperatures between 100 and 200°C for all the steels.
(2) The minimum value kmin linearly reduces with a decrease in Ms temperature of retained
austenite.
(3) The temperature corresponding to kmin, Ts, decreases with decrease in the Ms temperature
when Ms≥20C, while it is nearly constant (about 120°C) when Ms<20°C.
28
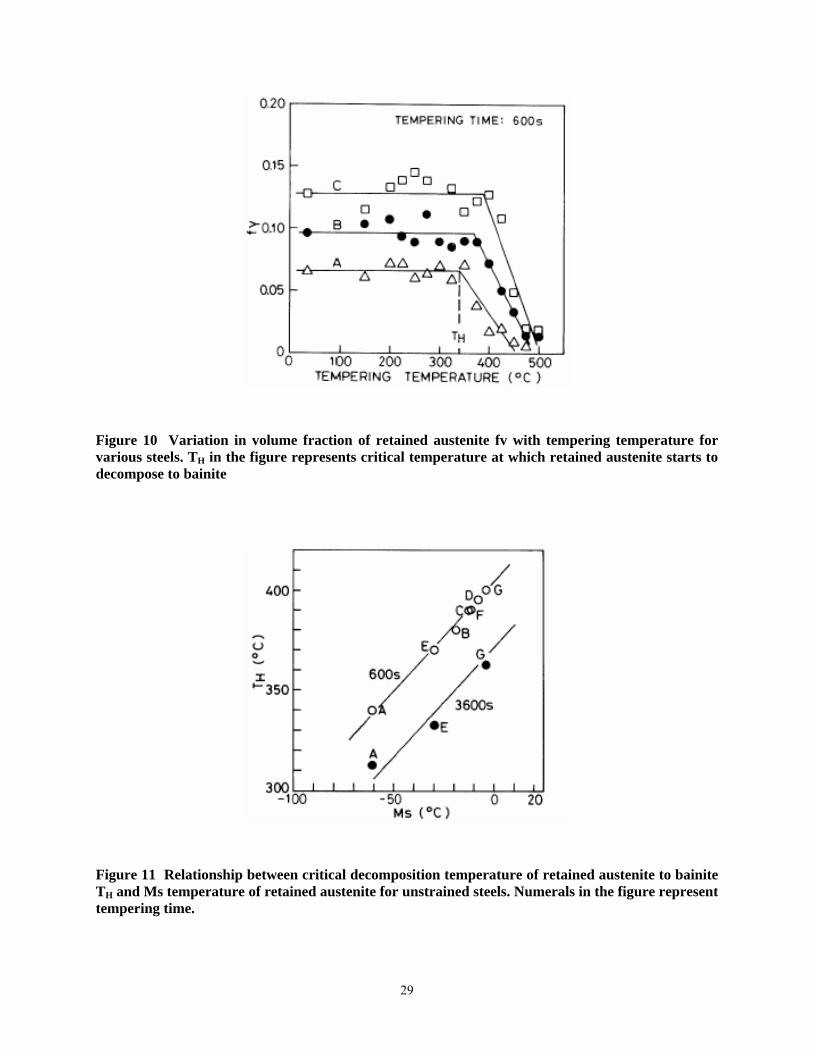
Figure 10 Variation in volume fraction of retained austenite fv with tempering temperature for various steels. TH in the figure represents critical temperature at which retained austenite starts to decompose to bainite
Figure 11 Relationship between critical decomposition temperature of retained austenite to bainite TH and Ms temperature of retained austenite for unstrained steels. Numerals in the figure represent tempering time.
29
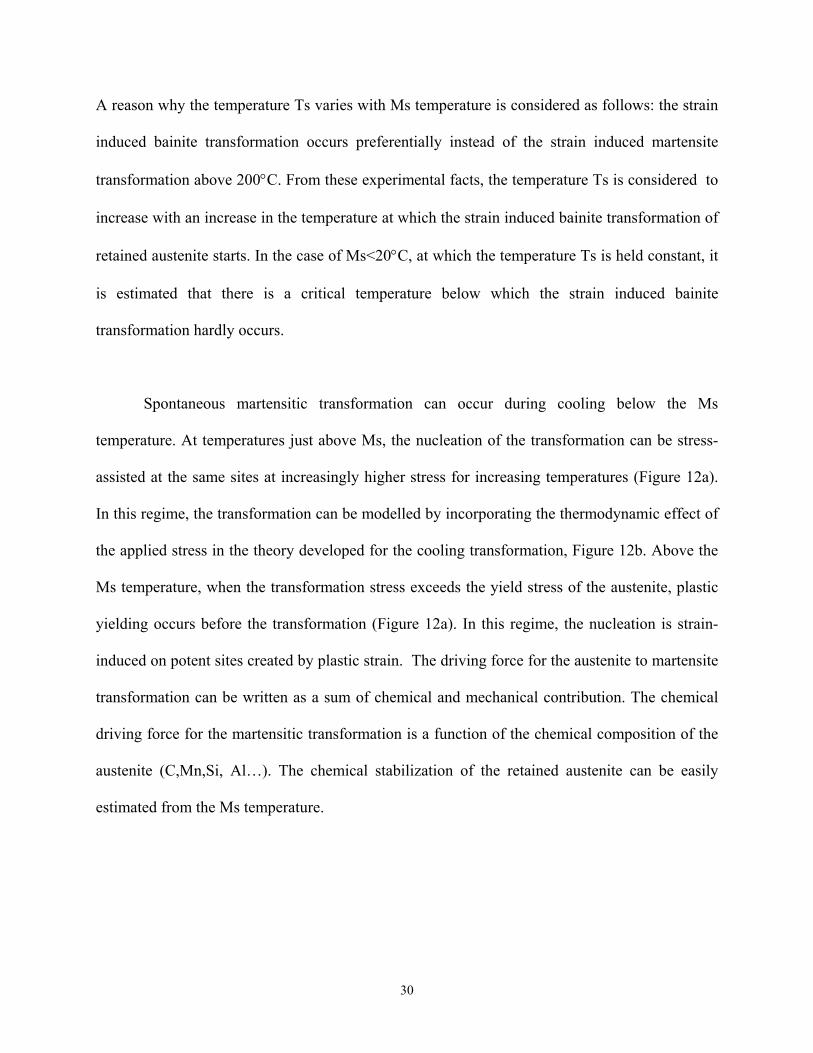
A reason why the temperature Ts varies with Ms temperature is considered as follows: the strain
induced bainite transformation occurs preferentially instead of the strain induced martensite
transformation above 200°C. From these experimental facts, the temperature Ts is considered to
increase with an increase in the temperature at which the strain induced bainite transformation of
retained austenite starts. In the case of Ms<20°C, at which the temperature Ts is held constant, it
is estimated that there is a critical temperature below which the strain induced bainite
transformation hardly occurs.
Spontaneous martensitic transformation can occur during cooling below the Ms
temperature. At temperatures just above Ms, the nucleation of the transformation can be stress-
assisted at the same sites at increasingly higher stress for increasing temperatures (Figure 12a).
In this regime, the transformation can be modelled by incorporating the thermodynamic effect of
the applied stress in the theory developed for the cooling transformation, Figure 12b. Above the
Ms temperature, when the transformation stress exceeds the yield stress of the austenite, plastic
yielding occurs before the transformation (Figure 12a). In this regime, the nucleation is strain-
induced on potent sites created by plastic strain. The driving force for the austenite to martensite
transformation can be written as a sum of chemical and mechanical contribution. The chemical
driving force for the martensitic transformation is a function of the chemical composition of the
austenite (C,Mn,Si, Al…). The chemical stabilization of the retained austenite can be easily
estimated from the Ms temperature.
30
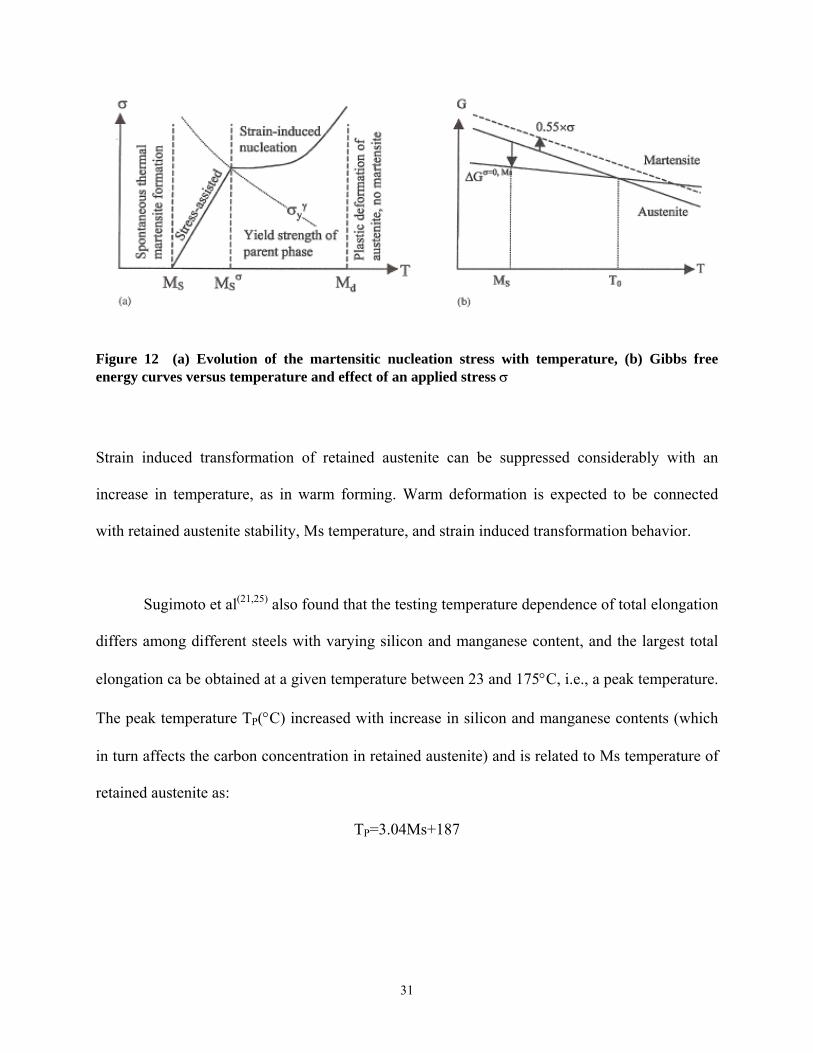
Figure 12 (a) Evolution of the martensitic nucleation stress with temperature, (b) Gibbs free energy curves versus temperature and effect of an applied stress σ
Strain induced transformation of retained austenite can be suppressed considerably with an
increase in temperature, as in warm forming. Warm deformation is expected to be connected
with retained austenite stability, Ms temperature, and strain induced transformation behavior.
Sugimoto et al(21,25) also found that the testing temperature dependence of total elongation
differs among different steels with varying silicon and manganese content, and the largest total
elongation ca be obtained at a given temperature between 23 and 175°C, i.e., a peak temperature.
The peak temperature TP(°C) increased with increase in silicon and manganese contents (which
in turn affects the carbon concentration in retained austenite) and is related to Ms temperature of
retained austenite as:
TP=3.04Ms+187
31
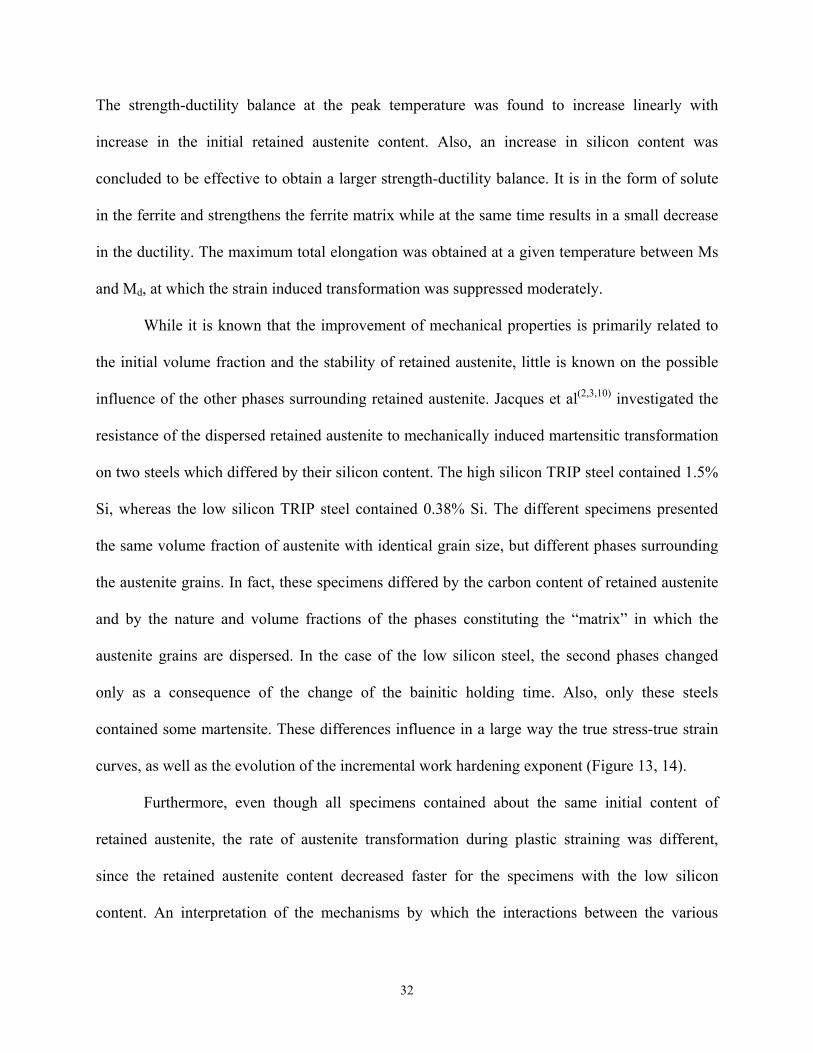
The strength-ductility balance at the peak temperature was found to increase linearly with
increase in the initial retained austenite content. Also, an increase in silicon content was
concluded to be effective to obtain a larger strength-ductility balance. It is in the form of solute
in the ferrite and strengthens the ferrite matrix while at the same time results in a small decrease
in the ductility. The maximum total elongation was obtained at a given temperature between Ms
and Md, at which the strain induced transformation was suppressed moderately.
While it is known that the improvement of mechanical properties is primarily related to
the initial volume fraction and the stability of retained austenite, little is known on the possible
influence of the other phases surrounding retained austenite. Jacques et al(2,3,10) investigated the
resistance of the dispersed retained austenite to mechanically induced martensitic transformation
on two steels which differed by their silicon content. The high silicon TRIP steel contained 1.5%
Si, whereas the low silicon TRIP steel contained 0.38% Si. The different specimens presented
the same volume fraction of austenite with identical grain size, but different phases surrounding
the austenite grains. In fact, these specimens differed by the carbon content of retained austenite
and by the nature and volume fractions of the phases constituting the “matrix” in which the
austenite grains are dispersed. In the case of the low silicon steel, the second phases changed
only as a consequence of the change of the bainitic holding time. Also, only these steels
contained some martensite. These differences influence in a large way the true stress-true strain
curves, as well as the evolution of the incremental work hardening exponent (Figure 13, 14).
Furthermore, even though all specimens contained about the same initial content of
retained austenite, the rate of austenite transformation during plastic straining was different,
since the retained austenite content decreased faster for the specimens with the low silicon
content. An interpretation of the mechanisms by which the interactions between the various
32
phases constituting the microstructure affect the austenite stability is as follows. The present
microstructures can be considered to consist of a discontinuous composite in which the austenite
grains constitute the reinforcing phase dispersed in a ferrite-based matrix that globally presents a
lower flow strength than the reinforcement particles. Also, the presence of hard martensite grains
in the matrix can be assimilated to a strengthening of the matrix that leads to a change in the
partition of the stress between the constitutive phases. The strengthening of the matrix by
martensite, brings about a sort of “shielding” effect that causes a decrease of the austenite
transformation rate. This stronger matrix leads to a smaller mean-stress level within the austenite
grains and thus, a postponed triggering of the martensitic transformation. Another important
observation is that, the film-type austenite located between bainitic ferrite laths cannot easily
transform during straining.
33
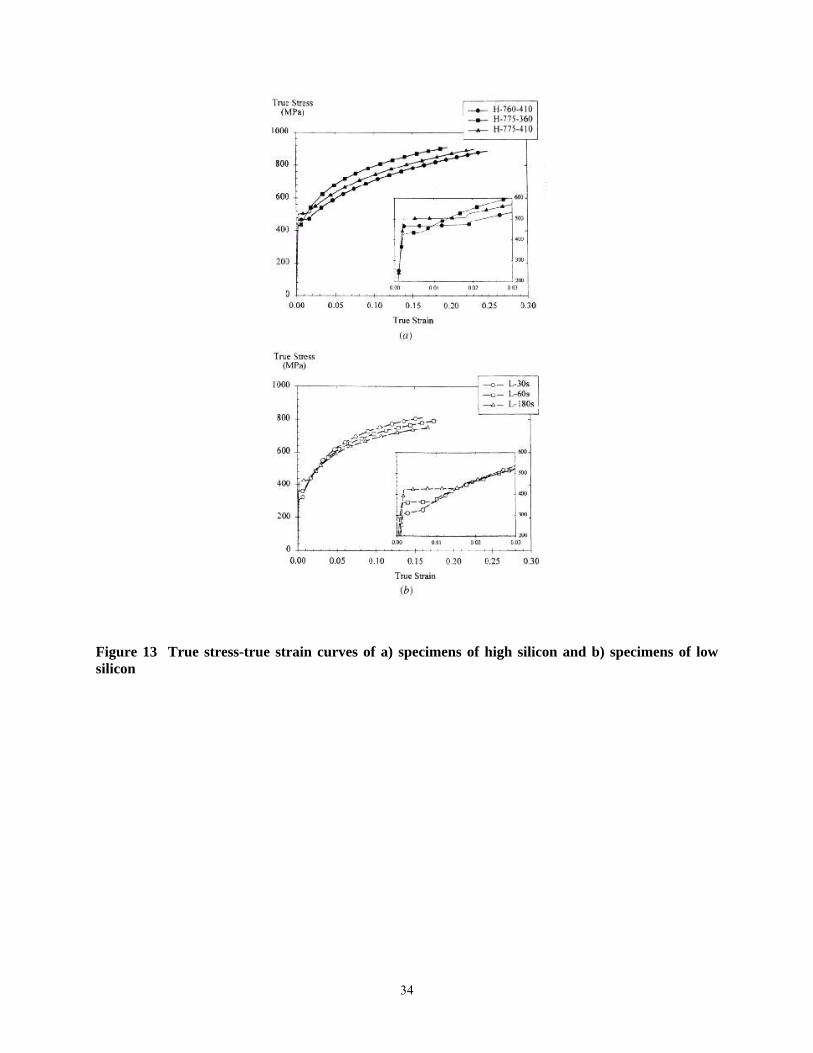
Figure 13 True stress-true strain curves of a) specimens of high silicon and b) specimens of low silicon
34

Figure 14 Incremental work-hardening curves (nincr) of the different specimens of high and low Si steels
2.3.1 Effect of Austenite Morphology
In general, retained austenite morphology in TRIP steels is classified into two groups by the type
of phase surrounding it as follows(25).
(Type 1) Isolated retained austenite islands, and granular retained austenite, lying in a soft ferrite
matrix or on the grain boundary, adjacent to or away from the other hard second phases such as
bainite or martensite.
(Type 2) Retained austenite thin films existing along martensite or bainite lath boundary, or
blocky retained austenite in these hard second phases.
35
The Ms temperature of the retained austenite is expected to be mainly affected by hydrostatic
pressure as well as carbon concentration. Hydrostatic pressure constrains a volume expansion
and shear deformation accompanied with strain induced martensite transformation. If an
isotropic transformation strain expressed as ε* =0.0058+0.0045Cγ occurs on the martensite
transformation, the resultant hydrostatic pressure σp can be estimated using the following
equation(25):
[ ] ( )[ ]0*
0*
00 1/ln322
32 YEYHYP υεεσ −++=
where Y0, H0 are yield stress and strain hardening rate of a given phase surrounding retained
austenite particle, respectively. E and ν are respectively Young’s modulus and Poisson’s ratio,
and are assumed to be equal for all constituents. From this equation, high hydrostatic pressure of
about 1560Mpa occurs in retained austenite films of type 2 (γr-type 2), if Y0= 1000 Mpa and
H0=5000 Mpa for bainite phase, Cγ=1.34 mass%, E=206000 and ν=0.28.
On the other hand, lower hydrostatic pressure of about 900Mpa arises in the retained
austenite islands of type 1 (γr-type 1), if Y0=400 MPa and H0=1000 MPa for ferrite phase and
Cγ= 1.26 mass%. According to the work of Radcliffe and Schatz(26) using plain 0.3-1.2%C steels,
the Ms temperature decreases by about 6°C per hydrostatic pressure of 100 MPa. Therefore, Ms
temperature of retained austenite in γr-type 2, should be estimated to be reduced by 40°C due to
hydrostatic pressure, compared to γr-type 1.
The effects of second phase morphology on volume fraction, stability and morphology of
retained austenite in a 0.17C-1.41Si-2.0Mn TRIP-aided dual phase steel was investigated by
Sugimoto and Misu(25). They found that when the second phase morphology was a network
36
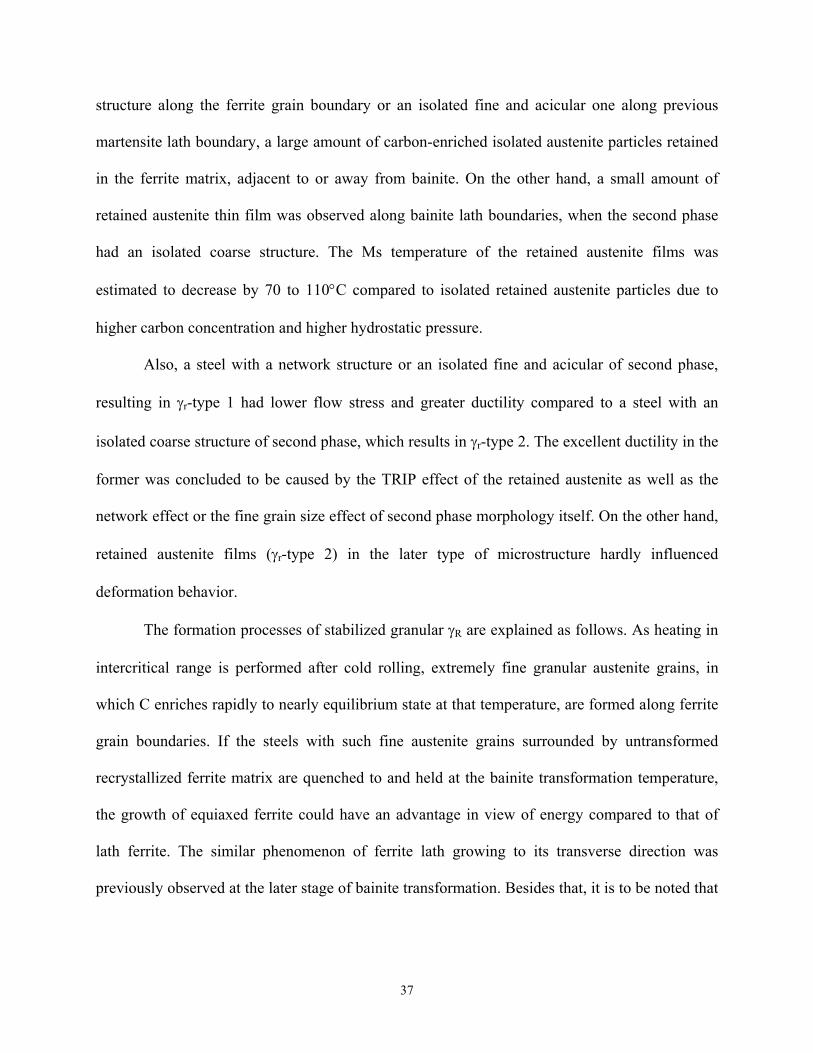
structure along the ferrite grain boundary or an isolated fine and acicular one along previous
martensite lath boundary, a large amount of carbon-enriched isolated austenite particles retained
in the ferrite matrix, adjacent to or away from bainite. On the other hand, a small amount of
retained austenite thin film was observed along bainite lath boundaries, when the second phase
had an isolated coarse structure. The Ms temperature of the retained austenite films was
estimated to decrease by 70 to 110°C compared to isolated retained austenite particles due to
higher carbon concentration and higher hydrostatic pressure.
Also, a steel with a network structure or an isolated fine and acicular of second phase,
resulting in γr-type 1 had lower flow stress and greater ductility compared to a steel with an
isolated coarse structure of second phase, which results in γr-type 2. The excellent ductility in the
former was concluded to be caused by the TRIP effect of the retained austenite as well as the
network effect or the fine grain size effect of second phase morphology itself. On the other hand,
retained austenite films (γr-type 2) in the later type of microstructure hardly influenced
deformation behavior.
The formation processes of stabilized granular γR are explained as follows. As heating in
intercritical range is performed after cold rolling, extremely fine granular austenite grains, in
which C enriches rapidly to nearly equilibrium state at that temperature, are formed along ferrite
grain boundaries. If the steels with such fine austenite grains surrounded by untransformed
recrystallized ferrite matrix are quenched to and held at the bainite transformation temperature,
the growth of equiaxed ferrite could have an advantage in view of energy compared to that of
lath ferrite. The similar phenomenon of ferrite lath growing to its transverse direction was
previously observed at the later stage of bainite transformation. Besides that, it is to be noted that
37
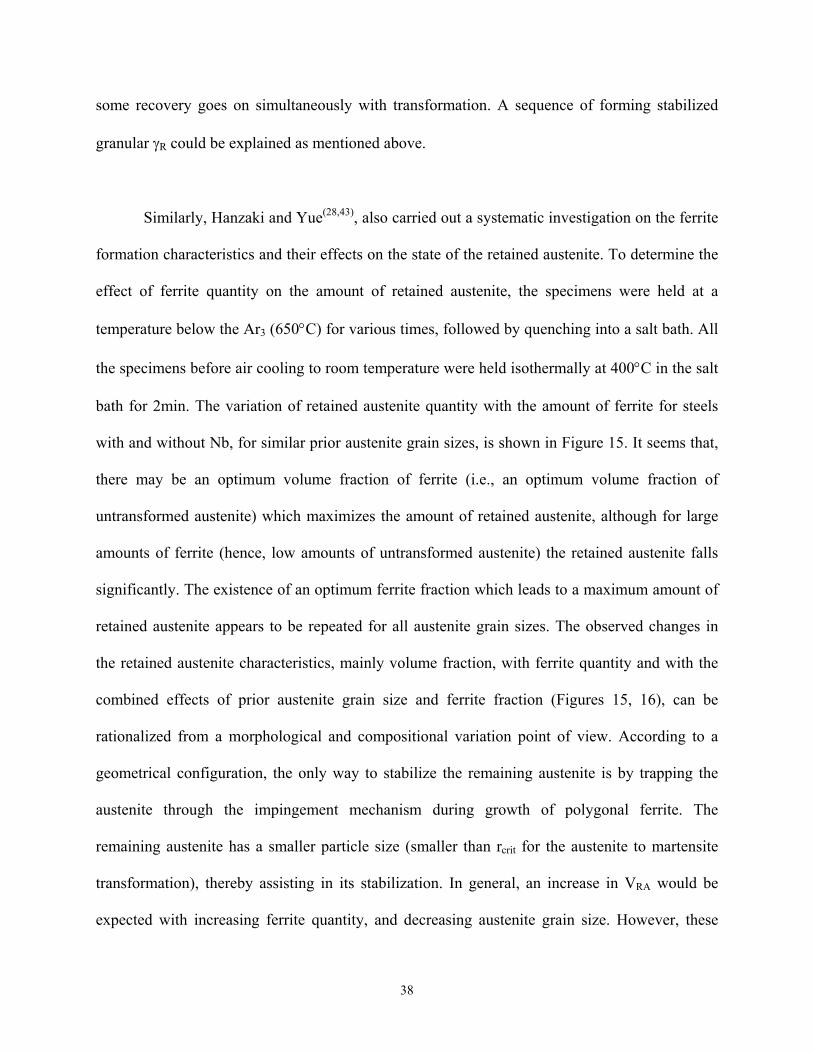
some recovery goes on simultaneously with transformation. A sequence of forming stabilized
granular γR could be explained as mentioned above.
Similarly, Hanzaki and Yue(28,43), also carried out a systematic investigation on the ferrite
formation characteristics and their effects on the state of the retained austenite. To determine the
effect of ferrite quantity on the amount of retained austenite, the specimens were held at a
temperature below the Ar3 (650°C) for various times, followed by quenching into a salt bath. All
the specimens before air cooling to room temperature were held isothermally at 400°C in the salt
bath for 2min. The variation of retained austenite quantity with the amount of ferrite for steels
with and without Nb, for similar prior austenite grain sizes, is shown in Figure 15. It seems that,
there may be an optimum volume fraction of ferrite (i.e., an optimum volume fraction of
untransformed austenite) which maximizes the amount of retained austenite, although for large
amounts of ferrite (hence, low amounts of untransformed austenite) the retained austenite falls
significantly. The existence of an optimum ferrite fraction which leads to a maximum amount of
retained austenite appears to be repeated for all austenite grain sizes. The observed changes in
the retained austenite characteristics, mainly volume fraction, with ferrite quantity and with the
combined effects of prior austenite grain size and ferrite fraction (Figures 15, 16), can be
rationalized from a morphological and compositional variation point of view. According to a
geometrical configuration, the only way to stabilize the remaining austenite is by trapping the
austenite through the impingement mechanism during growth of polygonal ferrite. The
remaining austenite has a smaller particle size (smaller than rcrit for the austenite to martensite
transformation), thereby assisting in its stabilization. In general, an increase in VRA would be
expected with increasing ferrite quantity, and decreasing austenite grain size. However, these
38
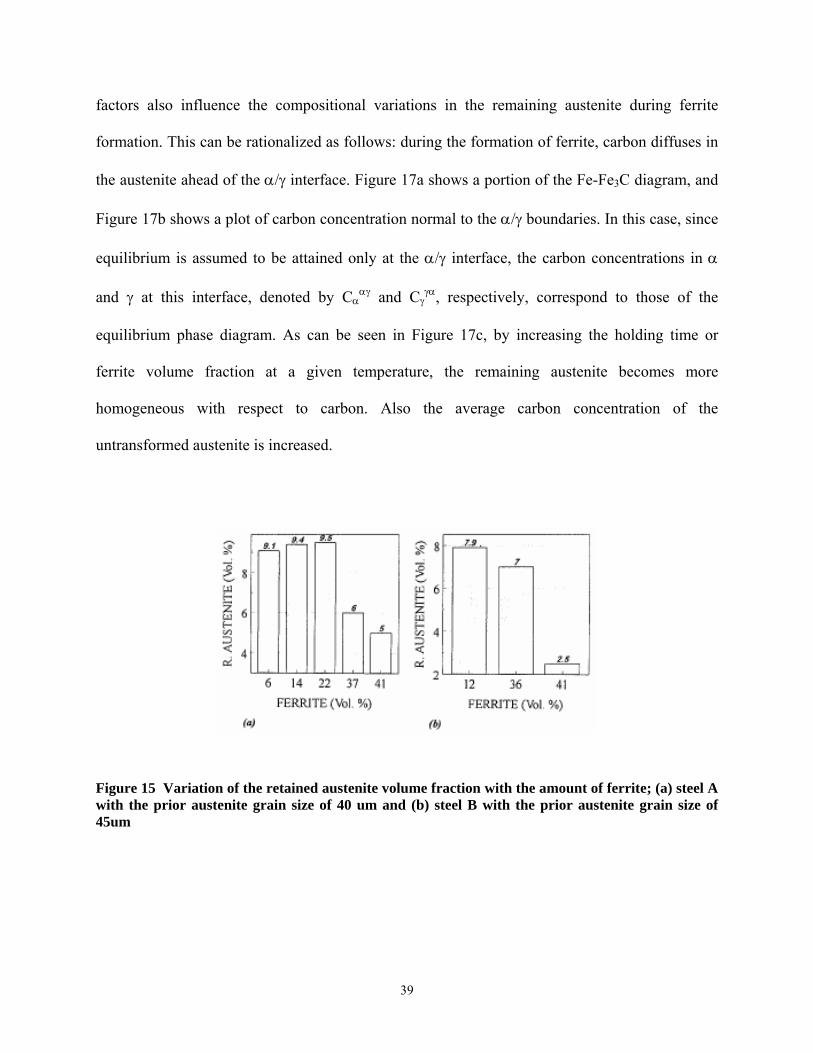
factors also influence the compositional variations in the remaining austenite during ferrite
formation. This can be rationalized as follows: during the formation of ferrite, carbon diffuses in
the austenite ahead of the α/γ interface. Figure 17a shows a portion of the Fe-Fe3C diagram, and
Figure 17b shows a plot of carbon concentration normal to the α/γ boundaries. In this case, since
equilibrium is assumed to be attained only at the α/γ interface, the carbon concentrations in α
and γ at this interface, denoted by Cααγ and Cγ
γα, respectively, correspond to those of the
equilibrium phase diagram. As can be seen in Figure 17c, by increasing the holding time or
ferrite volume fraction at a given temperature, the remaining austenite becomes more
homogeneous with respect to carbon. Also the average carbon concentration of the
untransformed austenite is increased.
Figure 15 Variation of the retained austenite volume fraction with the amount of ferrite; (a) steel A with the prior austenite grain size of 40 um and (b) steel B with the prior austenite grain size of 45um
39
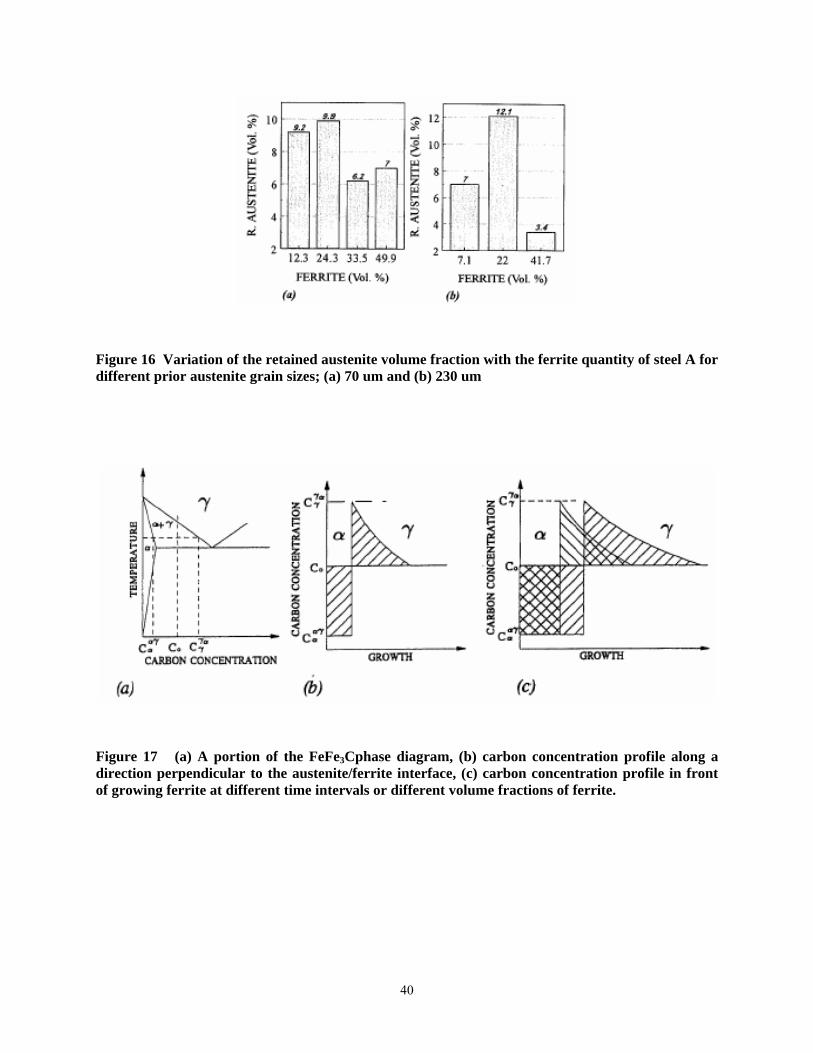
Figure 16 Variation of the retained austenite volume fraction with the ferrite quantity of steel A for different prior austenite grain sizes; (a) 70 um and (b) 230 um
Figure 17 (a) A portion of the FeFe3Cphase diagram, (b) carbon concentration profile along a direction perpendicular to the austenite/ferrite interface, (c) carbon concentration profile in front of growing ferrite at different time intervals or different volume fractions of ferrite.
40
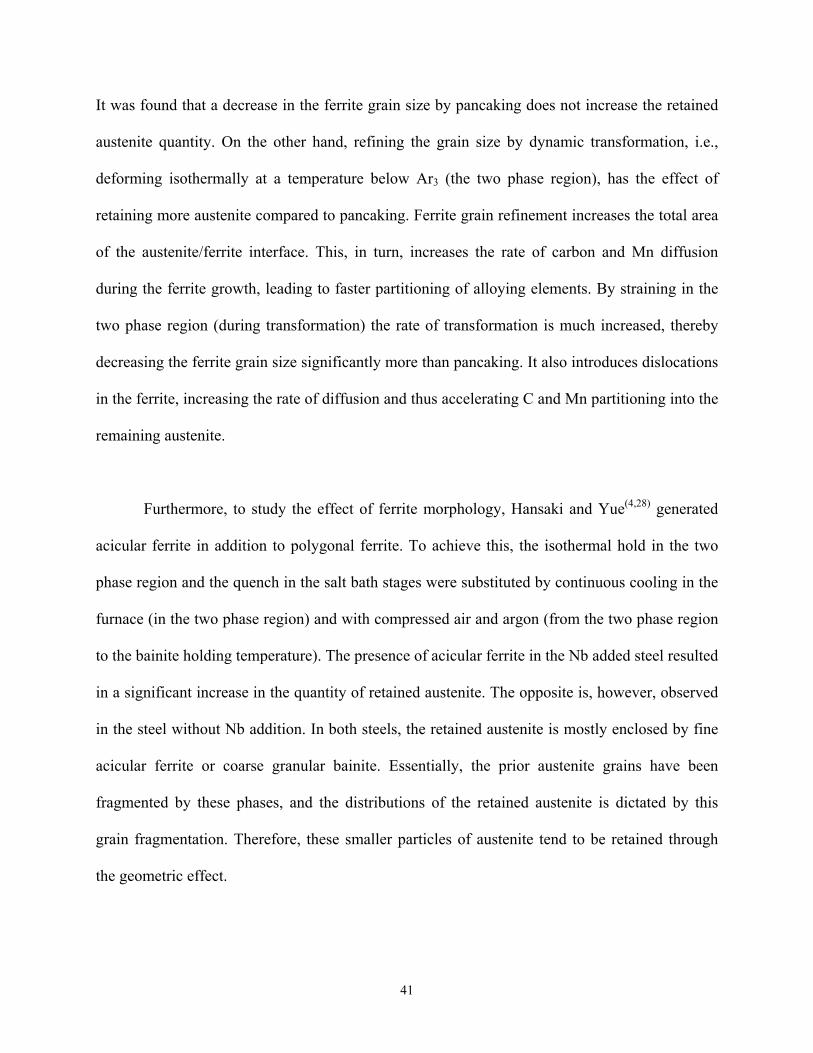
It was found that a decrease in the ferrite grain size by pancaking does not increase the retained
austenite quantity. On the other hand, refining the grain size by dynamic transformation, i.e.,
deforming isothermally at a temperature below Ar3 (the two phase region), has the effect of
retaining more austenite compared to pancaking. Ferrite grain refinement increases the total area
of the austenite/ferrite interface. This, in turn, increases the rate of carbon and Mn diffusion
during the ferrite growth, leading to faster partitioning of alloying elements. By straining in the
two phase region (during transformation) the rate of transformation is much increased, thereby
decreasing the ferrite grain size significantly more than pancaking. It also introduces dislocations
in the ferrite, increasing the rate of diffusion and thus accelerating C and Mn partitioning into the
remaining austenite.
Furthermore, to study the effect of ferrite morphology, Hansaki and Yue(4,28) generated
acicular ferrite in addition to polygonal ferrite. To achieve this, the isothermal hold in the two
phase region and the quench in the salt bath stages were substituted by continuous cooling in the
furnace (in the two phase region) and with compressed air and argon (from the two phase region
to the bainite holding temperature). The presence of acicular ferrite in the Nb added steel resulted
in a significant increase in the quantity of retained austenite. The opposite is, however, observed
in the steel without Nb addition. In both steels, the retained austenite is mostly enclosed by fine
acicular ferrite or coarse granular bainite. Essentially, the prior austenite grains have been
fragmented by these phases, and the distributions of the retained austenite is dictated by this
grain fragmentation. Therefore, these smaller particles of austenite tend to be retained through
the geometric effect.
41

The results of the steel without Nb addition are contradictory because of the presence of pearlite
in its microstructure. This is because the pearlite transformation start temperature of this steel is
higher than that of the Nb-added steel, and the same continuous cooling procedure was used
regardless of this effect. The formation of pearlite decreases the carbon in the remaining
austenite, leading to a reduction in the retained austenite volume fraction.
2.4 EFFECT OF PRIOR PROCESSING HISTORY
Although much work has been generated on cold-rolled and annealed TRIP steels, little attention
has been paid to the effect of prior hot rolling of these steels. It is usually assumed that the
subsequent processing after hot rolling radically alters the microstructure, presumably much
reducing any effect of the prior microstructure.
Jiao et al(29) studied a Si–Mn TRIP steel microalloyed with Mo and Nb which was
subjected to heat treatments (no effect of rolling schedule was studied) designed to create several
different types of ferrite microstructures. These were then subjected to cold rolling and TRIP
annealing, and the subsequent tensile properties and retained austenite characteristics were then
determined. The heat treatments, are shown schematically in Figure 18. The main difference in
the resulting microstructures is a variation in the respective volume fractions of bainite and
proeutectoid ferrite. At 650°C, longer times led to increased levels of proeutectoid ferrite. The
true tensile strain-stress curves from tensile test after intercritical annealing are shown in Figure
19. In general, the specimens that had prior microstructures that were predominantly bainitic had
significantly inferior ductility. Also, the steels with the highest fractions of prior proeutectoid
42
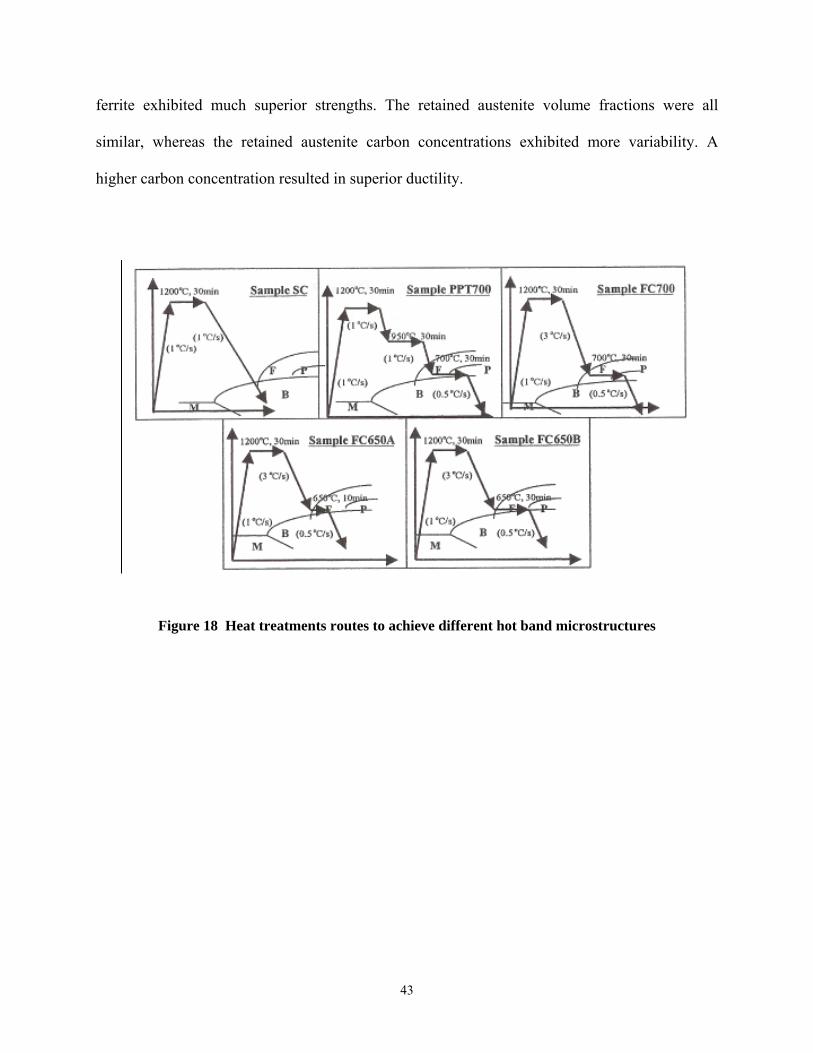
ferrite exhibited much superior strengths. The retained austenite volume fractions were all
similar, whereas the retained austenite carbon concentrations exhibited more variability. A
higher carbon concentration resulted in superior ductility.
Figure 18 Heat treatments routes to achieve different hot band microstructures
43
Figure 19 True strain-stress curves of tensile test for the samples in Figure 18 after the intercritical annealing treatment
The variation in enrichment level of retained austenite for different samples was reported to be
due to the different proeutectoid ferrite volume fractions in the microstructures. It also appeared
that good mechanical properties did not always coincide with high fraction of retained austenite,
while on the other hand, the variation of carbon concentration in retained austenite corresponded
far better with the mechanical properties. The stability of the retained austenite increased with
increasing retained austenite carbon concentration and decreasing retained austenite particle size.
44
2.5 ALLOYING EFFECTS
2.5.1 Si and Mn
Silicon is known to inhibit cementite formation in steels. This is explained by the relative
insolubility of silicon in cementite requiring the diffusion controlled rejection of silicon at the
transformation front which in turn results in a silicon concentration build-up during an early
stage of growth. This locally increases the activity of carbon so that the carbon flux is reduced
and further development of the cementite embryos is inhibited(29). A significant amount of
austenite is retained in steels containing about 2%Si when cooled to room temperature through
the bainite transformation region. While it has been established that carbon is one of the most
beneficial elements for retaining austenite, sheet steels with a high carbon content (over 0.2%)
are disadvantageous in applications which require spot welding.
Sugimoto and Usui(21) investigated the effects of silicon and manganese content on the
volume fraction and stability of retained austenite particles in a cold rolled Fe-0.2C-(1.0-2.5)Si-
(1.0-2.5)Mn TRIP steel. The BIT was 400°C for 1000 seconds followed by cooling in oil. The
cooling rate from the intercritical annealing to 400°C was 120 C/sec (which is very high
compared to the 5-25°C/sec in continuous galvanizing lines). They observed that the volume
fraction of second phases increases with increasing manganese or silicon content, and the initial
volume fraction of retained austenite increases with increasing silicon and manganese content,
up to a 2.0%Mn. On the other hand, the carbon concentration Cγ reduces with increase in silicon
and manganese contents.
45
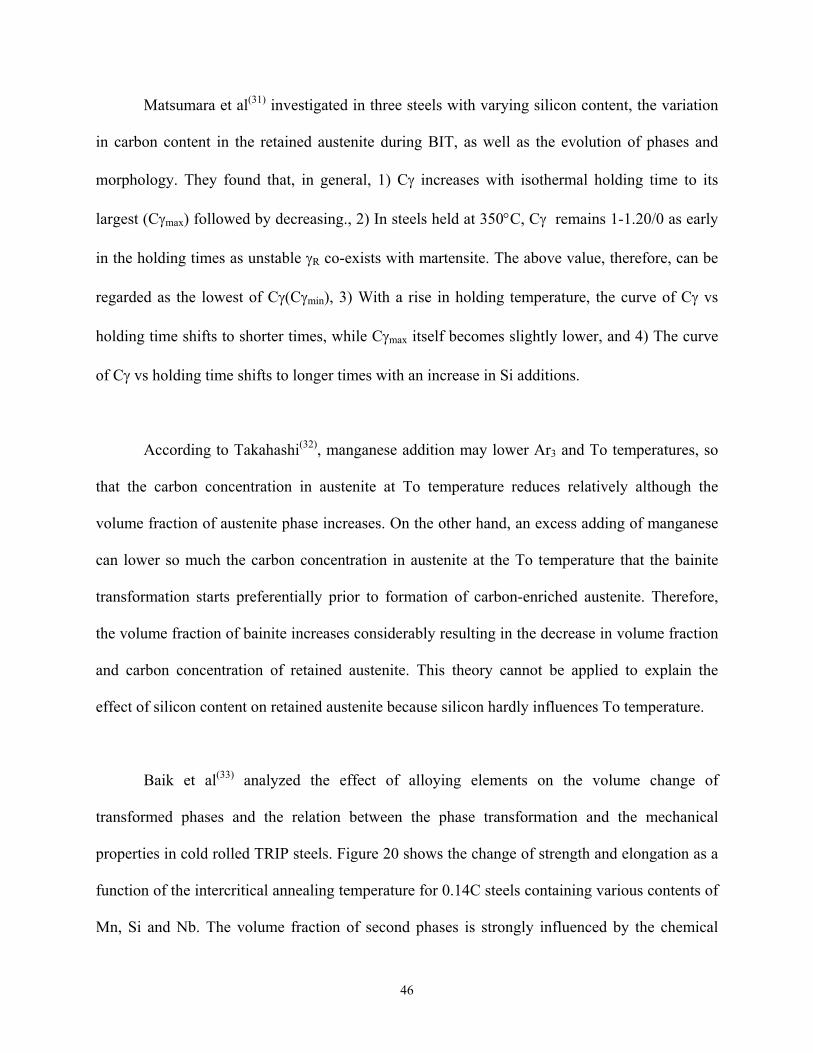
Matsumara et al(31) investigated in three steels with varying silicon content, the variation
in carbon content in the retained austenite during BIT, as well as the evolution of phases and
morphology. They found that, in general, 1) Cγ increases with isothermal holding time to its
largest (Cγmax) followed by decreasing., 2) In steels held at 350°C, Cγ remains 1-1.20/0 as early
in the holding times as unstable γR co-exists with martensite. The above value, therefore, can be
regarded as the lowest of Cγ(Cγmin), 3) With a rise in holding temperature, the curve of Cγ vs
holding time shifts to shorter times, while Cγmax itself becomes slightly lower, and 4) The curve
of Cγ vs holding time shifts to longer times with an increase in Si additions.
According to Takahashi(32), manganese addition may lower Ar3 and To temperatures, so
that the carbon concentration in austenite at To temperature reduces relatively although the
volume fraction of austenite phase increases. On the other hand, an excess adding of manganese
can lower so much the carbon concentration in austenite at the To temperature that the bainite
transformation starts preferentially prior to formation of carbon-enriched austenite. Therefore,
the volume fraction of bainite increases considerably resulting in the decrease in volume fraction
and carbon concentration of retained austenite. This theory cannot be applied to explain the
effect of silicon content on retained austenite because silicon hardly influences To temperature.
Baik et al(33) analyzed the effect of alloying elements on the volume change of
transformed phases and the relation between the phase transformation and the mechanical
properties in cold rolled TRIP steels. Figure 20 shows the change of strength and elongation as a
function of the intercritical annealing temperature for 0.14C steels containing various contents of
Mn, Si and Nb. The volume fraction of second phases is strongly influenced by the chemical
46
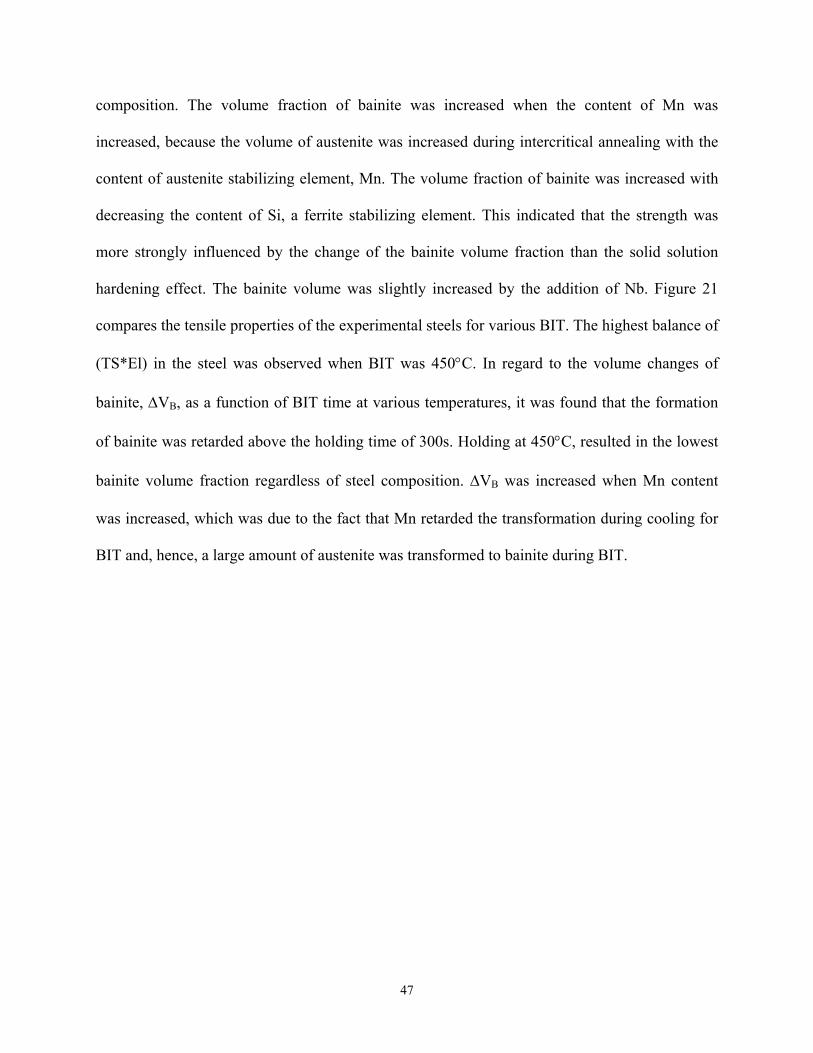
composition. The volume fraction of bainite was increased when the content of Mn was
increased, because the volume of austenite was increased during intercritical annealing with the
content of austenite stabilizing element, Mn. The volume fraction of bainite was increased with
decreasing the content of Si, a ferrite stabilizing element. This indicated that the strength was
more strongly influenced by the change of the bainite volume fraction than the solid solution
hardening effect. The bainite volume was slightly increased by the addition of Nb. Figure 21
compares the tensile properties of the experimental steels for various BIT. The highest balance of
(TS*El) in the steel was observed when BIT was 450°C. In regard to the volume changes of
bainite, ∆VB, as a function of BIT time at various temperatures, it was found that the formation
of bainite was retarded above the holding time of 300s. Holding at 450°C, resulted in the lowest
bainite volume fraction regardless of steel composition. ∆VB was increased when Mn content
was increased, which was due to the fact that Mn retarded the transformation during cooling for
BIT and, hence, a large amount of austenite was transformed to bainite during BIT.
47
Figure 20 Mechanical properties as a function of annealed temperature for the steels annealed at various temperatures for 51 s, followed by austempering at 450°C for 300 sec.
48
Figure 21 Mechanical properties as a function of austempering start temperature for the steels obtained by annealing at 830°C for 51 s, followed by austempering at various temperatures for 300s
In a 1.0Si-2.4Mn steel, it was observed that Ms linearly decreased with increasing ∆VB,
exhibiting a maximum rate of the Ms decrease when the BIT was 450°C, Figure 22. The volume
fraction of retained austenite as a function of ∆VB is shown in Figure 23. It can also be observed
that the maximum rate of volume fraction of retained austenite is obtained at 450°C, which
coincides with the observed largest elongation.
49
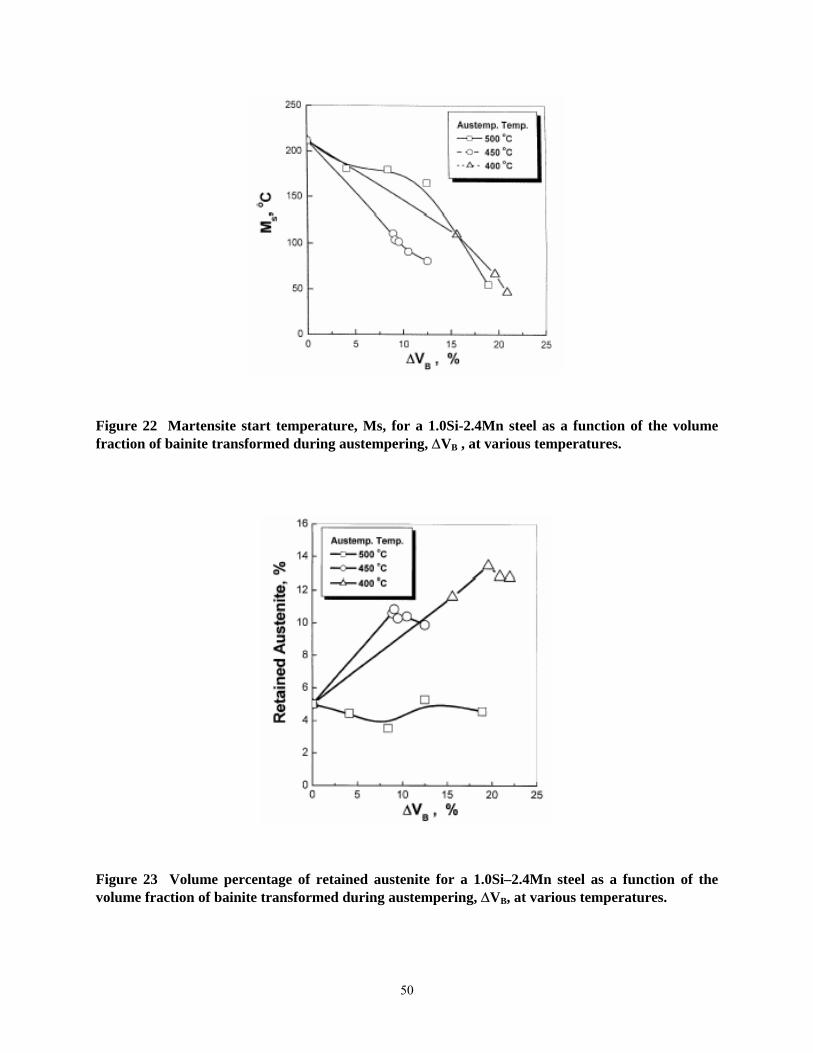
Figure 22 Martensite start temperature, Ms, for a 1.0Si-2.4Mn steel as a function of the volume fraction of bainite transformed during austempering, ∆VB , at various temperatures.
Figure 23 Volume percentage of retained austenite for a 1.0Si–2.4Mn steel as a function of the volume fraction of bainite transformed during austempering, ∆VB, at various temperatures.
50
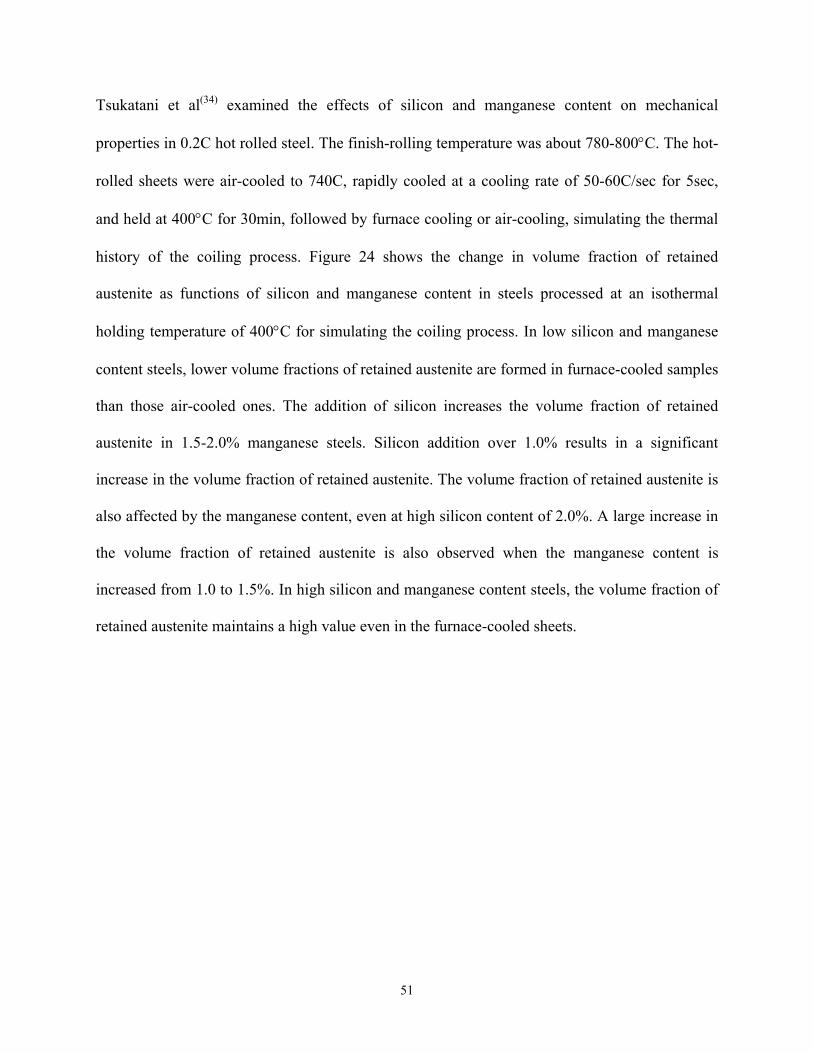
Tsukatani et al(34) examined the effects of silicon and manganese content on mechanical
properties in 0.2C hot rolled steel. The finish-rolling temperature was about 780-800°C. The hot-
rolled sheets were air-cooled to 740C, rapidly cooled at a cooling rate of 50-60C/sec for 5sec,
and held at 400°C for 30min, followed by furnace cooling or air-cooling, simulating the thermal
history of the coiling process. Figure 24 shows the change in volume fraction of retained
austenite as functions of silicon and manganese content in steels processed at an isothermal
holding temperature of 400°C for simulating the coiling process. In low silicon and manganese
content steels, lower volume fractions of retained austenite are formed in furnace-cooled samples
than those air-cooled ones. The addition of silicon increases the volume fraction of retained
austenite in 1.5-2.0% manganese steels. Silicon addition over 1.0% results in a significant
increase in the volume fraction of retained austenite. The volume fraction of retained austenite is
also affected by the manganese content, even at high silicon content of 2.0%. A large increase in
the volume fraction of retained austenite is also observed when the manganese content is
increased from 1.0 to 1.5%. In high silicon and manganese content steels, the volume fraction of
retained austenite maintains a high value even in the furnace-cooled sheets.
51
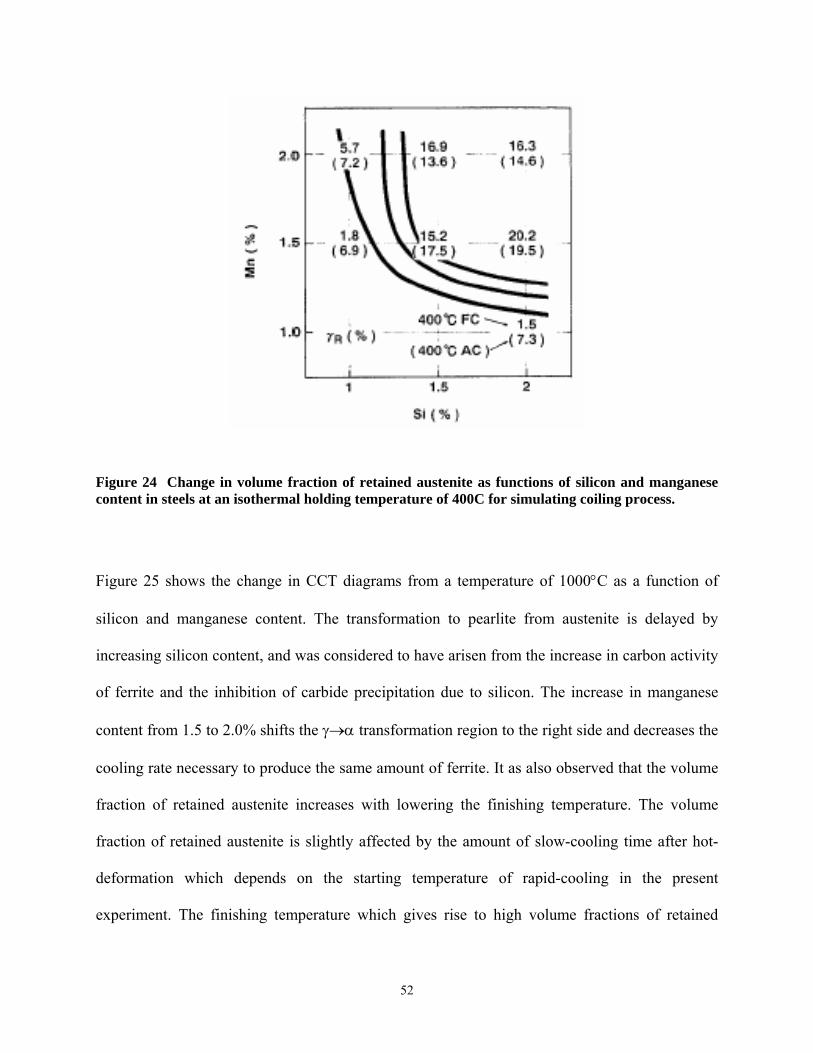
Figure 24 Change in volume fraction of retained austenite as functions of silicon and manganese content in steels at an isothermal holding temperature of 400C for simulating coiling process.
Figure 25 shows the change in CCT diagrams from a temperature of 1000°C as a function of
silicon and manganese content. The transformation to pearlite from austenite is delayed by
increasing silicon content, and was considered to have arisen from the increase in carbon activity
of ferrite and the inhibition of carbide precipitation due to silicon. The increase in manganese
content from 1.5 to 2.0% shifts the γ→α transformation region to the right side and decreases the
cooling rate necessary to produce the same amount of ferrite. It as also observed that the volume
fraction of retained austenite increases with lowering the finishing temperature. The volume
fraction of retained austenite is slightly affected by the amount of slow-cooling time after hot-
deformation which depends on the starting temperature of rapid-cooling in the present
experiment. The finishing temperature which gives rise to high volume fractions of retained
52
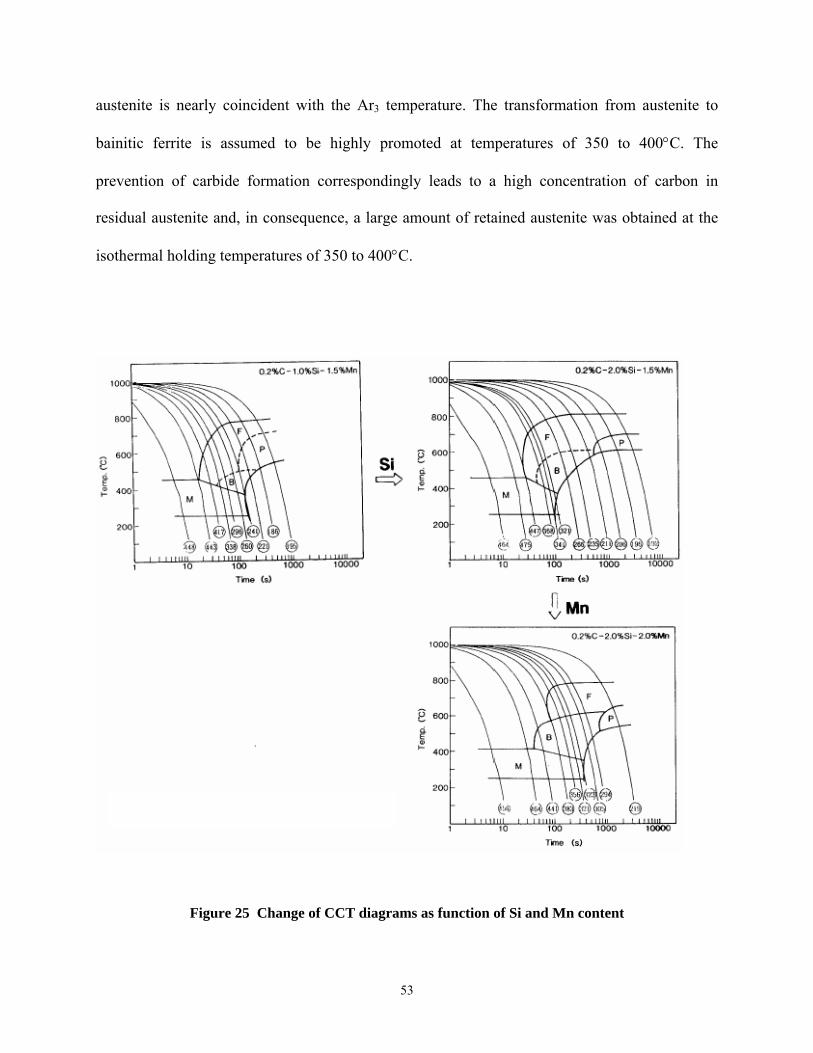
austenite is nearly coincident with the Ar3 temperature. The transformation from austenite to
bainitic ferrite is assumed to be highly promoted at temperatures of 350 to 400°C. The
prevention of carbide formation correspondingly leads to a high concentration of carbon in
residual austenite and, in consequence, a large amount of retained austenite was obtained at the
isothermal holding temperatures of 350 to 400°C.
Figure 25 Change of CCT diagrams as function of Si and Mn content
53
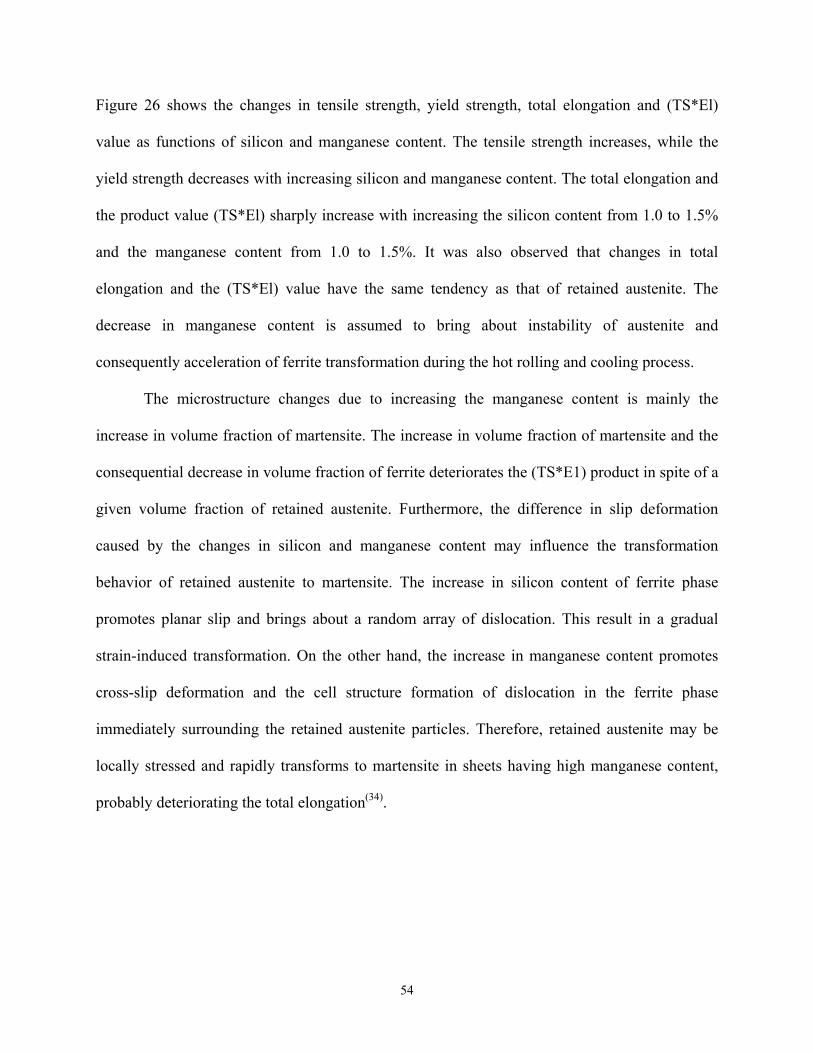
Figure 26 shows the changes in tensile strength, yield strength, total elongation and (TS*El)
value as functions of silicon and manganese content. The tensile strength increases, while the
yield strength decreases with increasing silicon and manganese content. The total elongation and
the product value (TS*El) sharply increase with increasing the silicon content from 1.0 to 1.5%
and the manganese content from 1.0 to 1.5%. It was also observed that changes in total
elongation and the (TS*El) value have the same tendency as that of retained austenite. The
decrease in manganese content is assumed to bring about instability of austenite and
consequently acceleration of ferrite transformation during the hot rolling and cooling process.
The microstructure changes due to increasing the manganese content is mainly the
increase in volume fraction of martensite. The increase in volume fraction of martensite and the
consequential decrease in volume fraction of ferrite deteriorates the (TS*E1) product in spite of a
given volume fraction of retained austenite. Furthermore, the difference in slip deformation
caused by the changes in silicon and manganese content may influence the transformation
behavior of retained austenite to martensite. The increase in silicon content of ferrite phase
promotes planar slip and brings about a random array of dislocation. This result in a gradual
strain-induced transformation. On the other hand, the increase in manganese content promotes
cross-slip deformation and the cell structure formation of dislocation in the ferrite phase
immediately surrounding the retained austenite particles. Therefore, retained austenite may be
locally stressed and rapidly transforms to martensite in sheets having high manganese content,
probably deteriorating the total elongation(34).
54

Figure 26 Changes in tensile strength, yield strength, total elongation and TSxEl value as functions of silicon and manganese content.
2.5.2 Al
Some research now is focused on the investigation of the use of other alloying elements as an
alternative for Si(35,36,38,40,65). Al and P, in addition to being strong ferrite stabilizers, retard the
tempering reaction and inhibit the formation of cementite. Al is also an element which is not
soluble in cementite, Little is known about the effect of small Al additions on the galvanizing of
sheet, but as a solute element Al does not segregate. Hence, Al additions are not expected to
influence the coatability adversely(35,40,41,68).
55
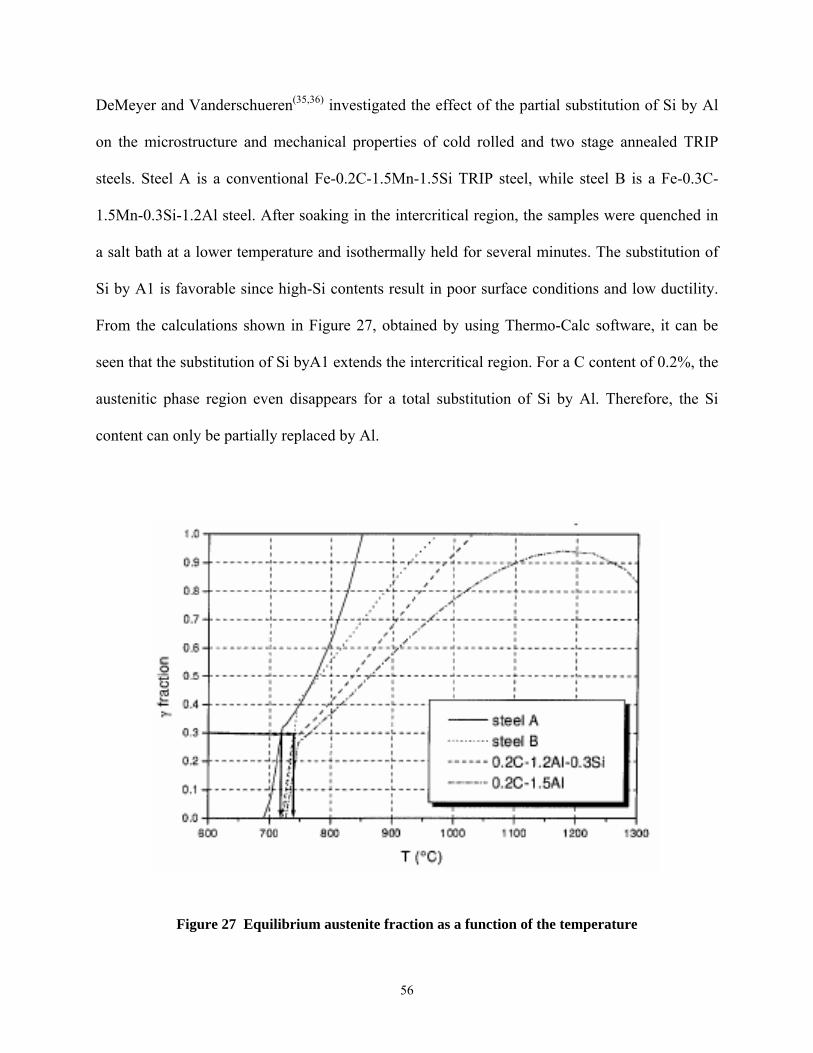
DeMeyer and Vanderschueren(35,36) investigated the effect of the partial substitution of Si by Al
on the microstructure and mechanical properties of cold rolled and two stage annealed TRIP
steels. Steel A is a conventional Fe-0.2C-1.5Mn-1.5Si TRIP steel, while steel B is a Fe-0.3C-
1.5Mn-0.3Si-1.2Al steel. After soaking in the intercritical region, the samples were quenched in
a salt bath at a lower temperature and isothermally held for several minutes. The substitution of
Si by A1 is favorable since high-Si contents result in poor surface conditions and low ductility.
From the calculations shown in Figure 27, obtained by using Thermo-Calc software, it can be
seen that the substitution of Si byA1 extends the intercritical region. For a C content of 0.2%, the
austenitic phase region even disappears for a total substitution of Si by Al. Therefore, the Si
content can only be partially replaced by Al.
Figure 27 Equilibrium austenite fraction as a function of the temperature
56
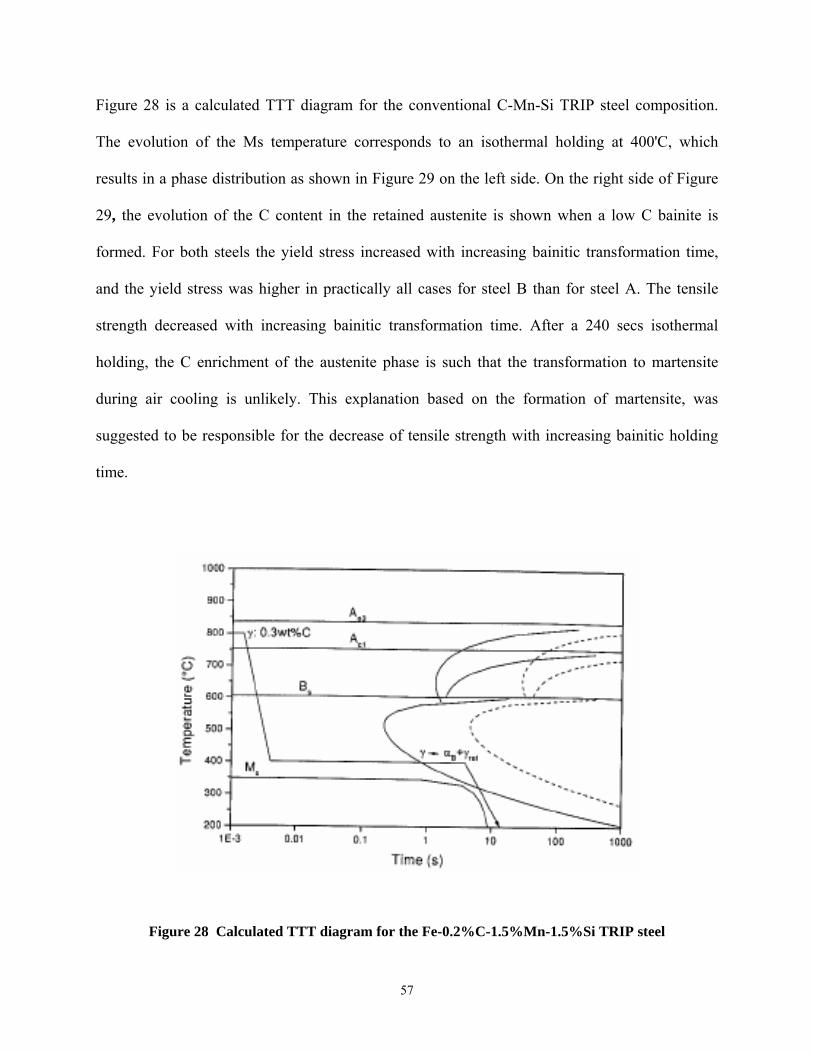
Figure 28 is a calculated TTT diagram for the conventional C-Mn-Si TRIP steel composition.
The evolution of the Ms temperature corresponds to an isothermal holding at 400'C, which
results in a phase distribution as shown in Figure 29 on the left side. On the right side of Figure
29, the evolution of the C content in the retained austenite is shown when a low C bainite is
formed. For both steels the yield stress increased with increasing bainitic transformation time,
and the yield stress was higher in practically all cases for steel B than for steel A. The tensile
strength decreased with increasing bainitic transformation time. After a 240 secs isothermal
holding, the C enrichment of the austenite phase is such that the transformation to martensite
during air cooling is unlikely. This explanation based on the formation of martensite, was
suggested to be responsible for the decrease of tensile strength with increasing bainitic holding
time.
Figure 28 Calculated TTT diagram for the Fe-0.2%C-1.5%Mn-1.5%Si TRIP steel
57
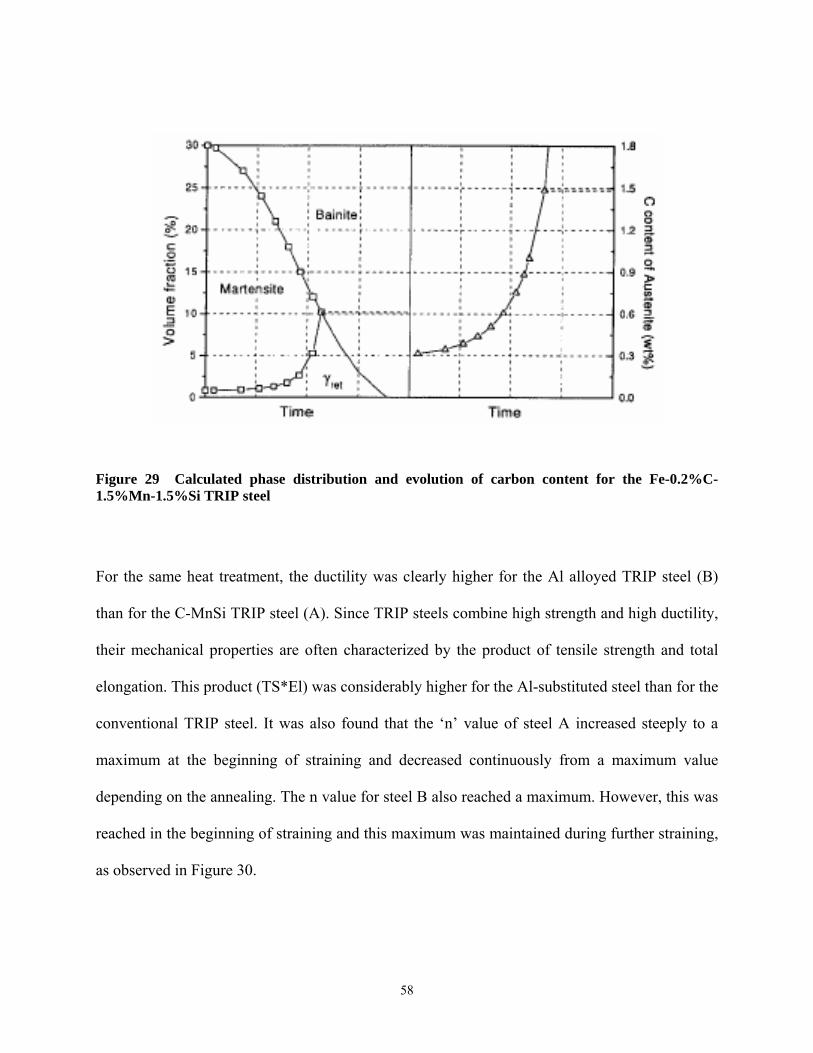
Figure 29 Calculated phase distribution and evolution of carbon content for the Fe-0.2%C-1.5%Mn-1.5%Si TRIP steel
For the same heat treatment, the ductility was clearly higher for the Al alloyed TRIP steel (B)
than for the C-MnSi TRIP steel (A). Since TRIP steels combine high strength and high ductility,
their mechanical properties are often characterized by the product of tensile strength and total
elongation. This product (TS*El) was considerably higher for the Al-substituted steel than for the
conventional TRIP steel. It was also found that the ‘n’ value of steel A increased steeply to a
maximum at the beginning of straining and decreased continuously from a maximum value
depending on the annealing. The n value for steel B also reached a maximum. However, this was
reached in the beginning of straining and this maximum was maintained during further straining,
as observed in Figure 30.
58
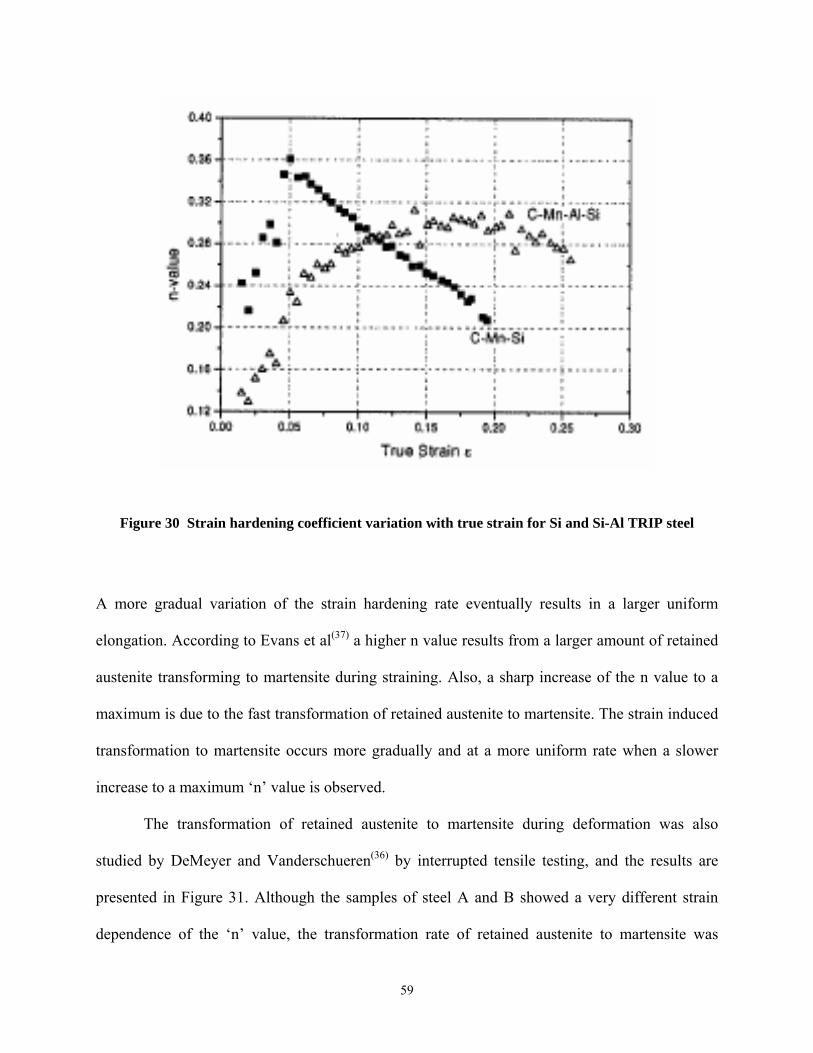
Figure 30 Strain hardening coefficient variation with true strain for Si and Si-Al TRIP steel
A more gradual variation of the strain hardening rate eventually results in a larger uniform
elongation. According to Evans et al(37) a higher n value results from a larger amount of retained
austenite transforming to martensite during straining. Also, a sharp increase of the n value to a
maximum is due to the fast transformation of retained austenite to martensite. The strain induced
transformation to martensite occurs more gradually and at a more uniform rate when a slower
increase to a maximum ‘n’ value is observed.
The transformation of retained austenite to martensite during deformation was also
studied by DeMeyer and Vanderschueren(36) by interrupted tensile testing, and the results are
presented in Figure 31. Although the samples of steel A and B showed a very different strain
dependence of the ‘n’ value, the transformation rate of retained austenite to martensite was
59
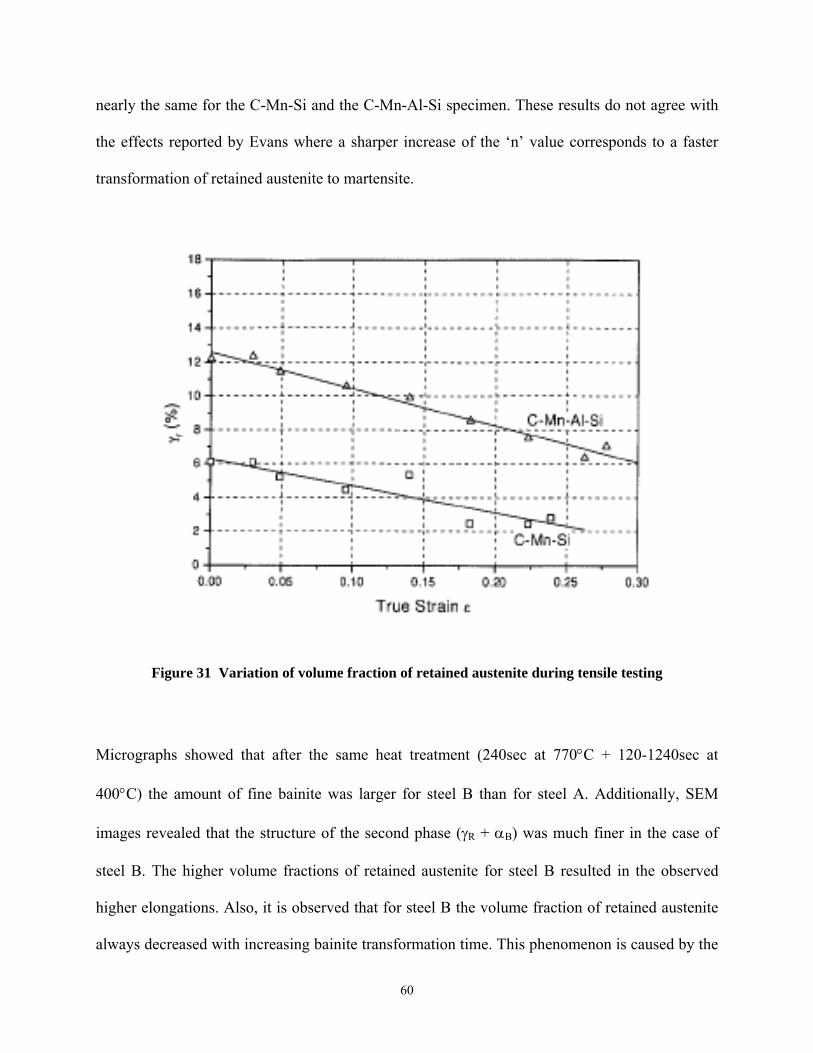
nearly the same for the C-Mn-Si and the C-Mn-Al-Si specimen. These results do not agree with
the effects reported by Evans where a sharper increase of the ‘n’ value corresponds to a faster
transformation of retained austenite to martensite.
Figure 31 Variation of volume fraction of retained austenite during tensile testing
Micrographs showed that after the same heat treatment (240sec at 770°C + 120-1240sec at
400°C) the amount of fine bainite was larger for steel B than for steel A. Additionally, SEM
images revealed that the structure of the second phase (γR + αB) was much finer in the case of
steel B. The higher volume fractions of retained austenite for steel B resulted in the observed
higher elongations. Also, it is observed that for steel B the volume fraction of retained austenite
always decreased with increasing bainite transformation time. This phenomenon is caused by the
60
decomposition of the C-enriched metastable retained austenite into a mixture of carbide and
ferrite, which occurs after too long isothermal holding. The decomposition of retained austenite
already started after 240sec at 400°C for the Al alloyed TRIP steel.
Finally, the C content of the retained austenite was higher for the C-Mn-A1-Si TRIP steel
than for the conventional C-Mn-Si steel. As a result of this higher C content, the Ms temperature
of the retained austenite is lower for the specimens of steel B than for those of steel A,
expressing a greater thermal stability of the retained austenite in the former. However, the larger
C content of the retained austenite for the Al alloyed TRIP steel did not result in a slower
transformation of the retained austenite during deformation. This is contradictory with the results
found by Jacques et al(39), where the retained austenite in the low Si steel, which had a lower C
content than the austenite in the conventional TRIP steel, transformed more rapidly during
plastic straining. Consequently, the constant high ‘n’ value obtained for the Al-alloyed TRIP
steel cannot be explained by the higher stability due to the C content. Al additions increase the
stacking fault energy of austenite, whereas Si decreases the stacking fault energy of the γ phase.
In stainless steels the stacking fault energy strongly influences strain hardening, and therefore a
similar effect could be related to the characteristic strain dependence of the ‘n’ value of the Al-
alloyed TRIP steel.
It is known that in TRIP aided steels the strengthening of the ferrite matrix by silicon
plays an important role in the improvement of the mechanical properties of Si-alloyed TRIP-
aided steels. On the other hand, aluminum is not as effective for solid-solution strengthening.
Leslie and Pickering(30) proposed a strengthening effect by silicon of the order of 100MPa for 1
wt% of solute while they reported that aluminum exhibits no solid-solution strengthening.
61
This difference perfectly fits with the change of hardening observed when silicon is substituted
by aluminum in TRIP-assisted multiphase steels. The mixed addition of Si and Al in steel Al-Si
thus allows a good compromise between the austenite stabilizing effect of both of these elements
during the bainite transformation and the solid-solution strengthening effect of the ferritic
matrix(39).
2.5.3 Mo
Molybdenum has a strong solute drag effect in steel, resulting in recrystallization and
precipitation delays(66,67). Molybdenum also acts as an austenite stabilizer when added in small
quantities, but as ferrite stabilizer at large amounts. Therefore, Mo can have a retardation effect
on the transformations to both ferrite and pearlite. This would greatly reduce the cementite
formation kinetics facilitating TRIP steel processing(29). Furthermore, Mo can enhance the
effectiveness of both Nb and C in retaining and stabilizing austenite by delaying the precipitation
of Nb(C,N) in Nb steels.
2.5.4 Nb
Hanzaki et al(4,28,43) investigated the variations in the bainite characteristics, residual phases and,
the state of the retained austenite with the final mechanical properties in two steels with a similar
chemical composition (0.20C, 1.50Si, 1.55Mn, 0.024Al) with the difference being only the Nb
addition (0.035%) in one of them. Different thermal cycles and deformation schedules were
applied to generate different conditions of bainite formation from an austenite with
62
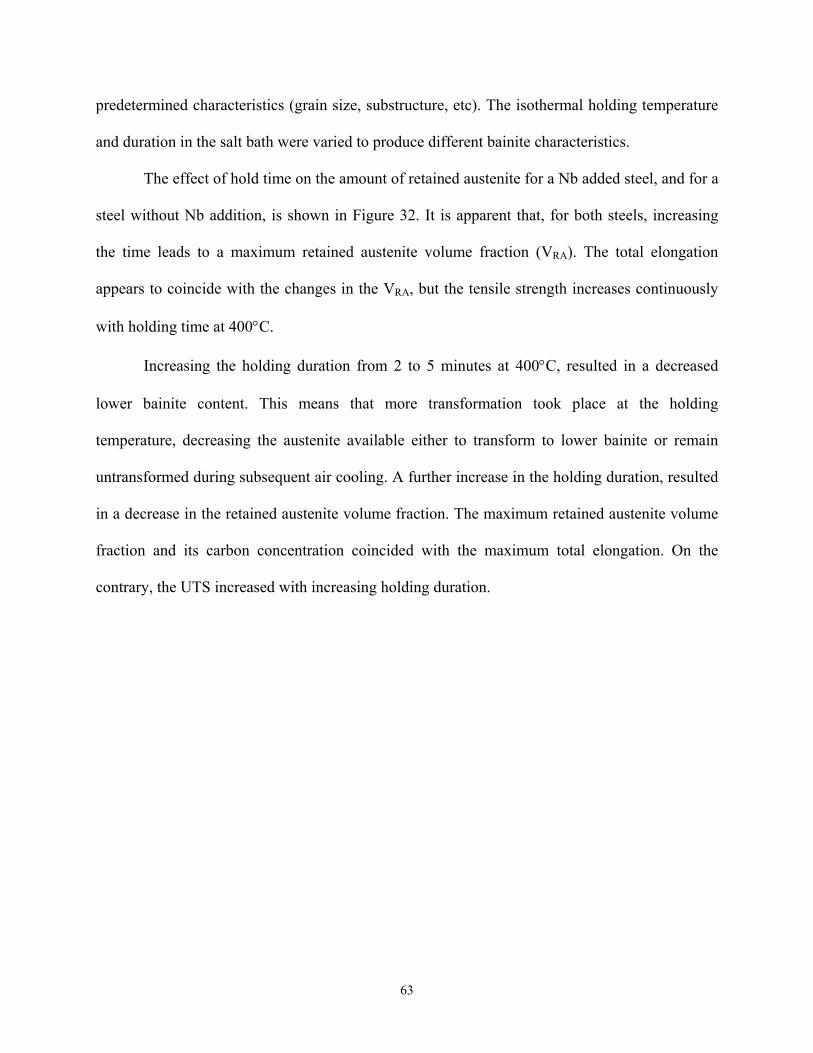
predetermined characteristics (grain size, substructure, etc). The isothermal holding temperature
and duration in the salt bath were varied to produce different bainite characteristics.
The effect of hold time on the amount of retained austenite for a Nb added steel, and for a
steel without Nb addition, is shown in Figure 32. It is apparent that, for both steels, increasing
the time leads to a maximum retained austenite volume fraction (VRA). The total elongation
appears to coincide with the changes in the VRA, but the tensile strength increases continuously
with holding time at 400°C.
Increasing the holding duration from 2 to 5 minutes at 400°C, resulted in a decreased
lower bainite content. This means that more transformation took place at the holding
temperature, decreasing the austenite available either to transform to lower bainite or remain
untransformed during subsequent air cooling. A further increase in the holding duration, resulted
in a decrease in the retained austenite volume fraction. The maximum retained austenite volume
fraction and its carbon concentration coincided with the maximum total elongation. On the
contrary, the UTS increased with increasing holding duration.
63
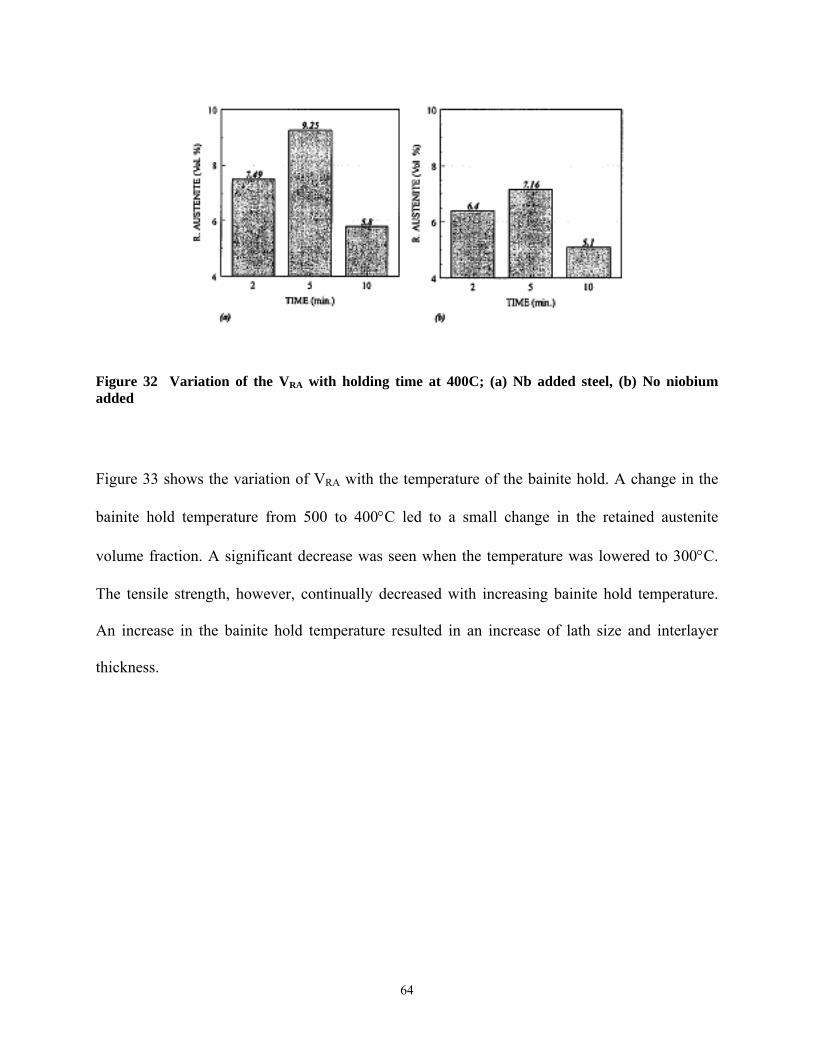
Figure 32 Variation of the VRA with holding time at 400C; (a) Nb added steel, (b) No niobium added
Figure 33 shows the variation of VRA with the temperature of the bainite hold. A change in the
bainite hold temperature from 500 to 400°C led to a small change in the retained austenite
volume fraction. A significant decrease was seen when the temperature was lowered to 300°C.
The tensile strength, however, continually decreased with increasing bainite hold temperature.
An increase in the bainite hold temperature resulted in an increase of lath size and interlayer
thickness.
64
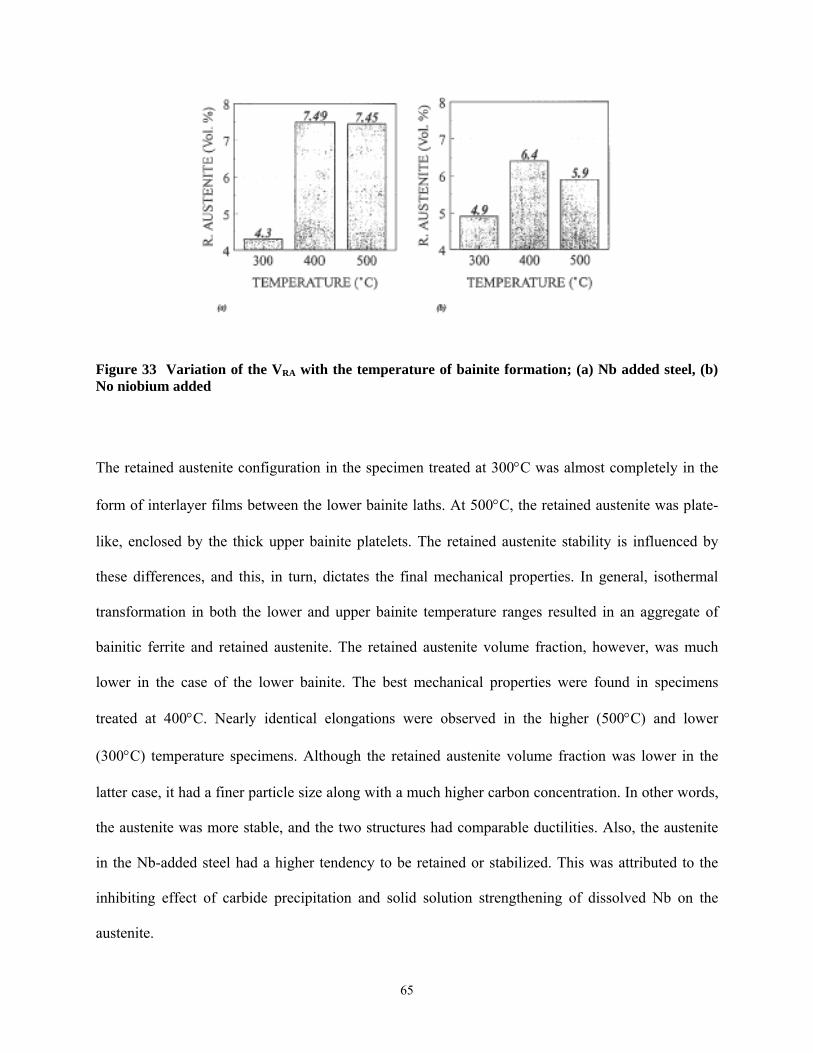
Figure 33 Variation of the VRA with the temperature of bainite formation; (a) Nb added steel, (b) No niobium added
The retained austenite configuration in the specimen treated at 300°C was almost completely in the
form of interlayer films between the lower bainite laths. At 500°C, the retained austenite was plate-
like, enclosed by the thick upper bainite platelets. The retained austenite stability is influenced by
these differences, and this, in turn, dictates the final mechanical properties. In general, isothermal
transformation in both the lower and upper bainite temperature ranges resulted in an aggregate of
bainitic ferrite and retained austenite. The retained austenite volume fraction, however, was much
lower in the case of the lower bainite. The best mechanical properties were found in specimens
treated at 400°C. Nearly identical elongations were observed in the higher (500°C) and lower
(300°C) temperature specimens. Although the retained austenite volume fraction was lower in the
latter case, it had a finer particle size along with a much higher carbon concentration. In other words,
the austenite was more stable, and the two structures had comparable ductilities. Also, the austenite
in the Nb-added steel had a higher tendency to be retained or stabilized. This was attributed to the
inhibiting effect of carbide precipitation and solid solution strengthening of dissolved Nb on the
austenite.
65
3.0 STATEMENT OF OBJECTIVES
There are numerous investigations that have been conducted to obtain a fundamental knowledge
on the processing-structure-properties of TRIP steels. Most of them, unfortunately, have used
high aluminum and silicon contents (1.5% mass and up). It has already been mentioned that high
levels of silicon result in very poor coatability in the galvanizing line, and therefore, are not
suitable for production. Also, there are no systematic studies of the kinetics of bainite formation
in low Si steels nor a clear understanding of the differences between continuous cooled and
isothermally formed bainite in TRIP steels. Similarly, studies on the new ferrite formed during
cooling have been widely overlooked. Furthermore, there are no good studies based on
simulations of actual continuous galvanizing line (CGL) processing.
This study has the objective of developing a low Si TRIP steel that can be obtained
within the ranges of a production line speed observed in a typical CGL or hot dip galvanizing
line. Of particular interest in this study, is the evaluation of the influence of prior-hot rolling
conditions, that is, coiling temperature, and the variations in the processing parameters in a CGL
on the microstructure and properties in a series of low silicon, Al-Mo-Nb added steels.
66
This research study has two main goals:
1) A systematic study of the austenite formation and recrystallization of ferrite during the
intercritical annealing stage, as a function of:
a) Al content
b) Prior coiling temperature during hot rolling
2) A systematic study of the austenite decomposition into “new” epitaxial ferrite, bainite,
martensite, etc., during cooling from i) the intercritical annealing temperature and ii) during the
isothermal holding temperature, as a function of:
a) Al content
b) Prior coiling temperature
c) Intercritical Annealing Temperature
In addition, it is also of great interest the evaluation of the amount and composition of retained
austenite and its stability through its decomposition from the intercritical annealing temperature
as a function of a) cooling rate from the TIA to the isothermal holding temperature, b) holding
time and c) cooling rate from the isothermal holding temperature to room temperature
Finally, it is necessary to evaluate the tensile properties and correlate the processing routes with
the observed microstructures and mechanical properties, in order to provide guidelines to
develop a commercial 800 MPa low silicon Al added TRIP steel by CGL processing.
67
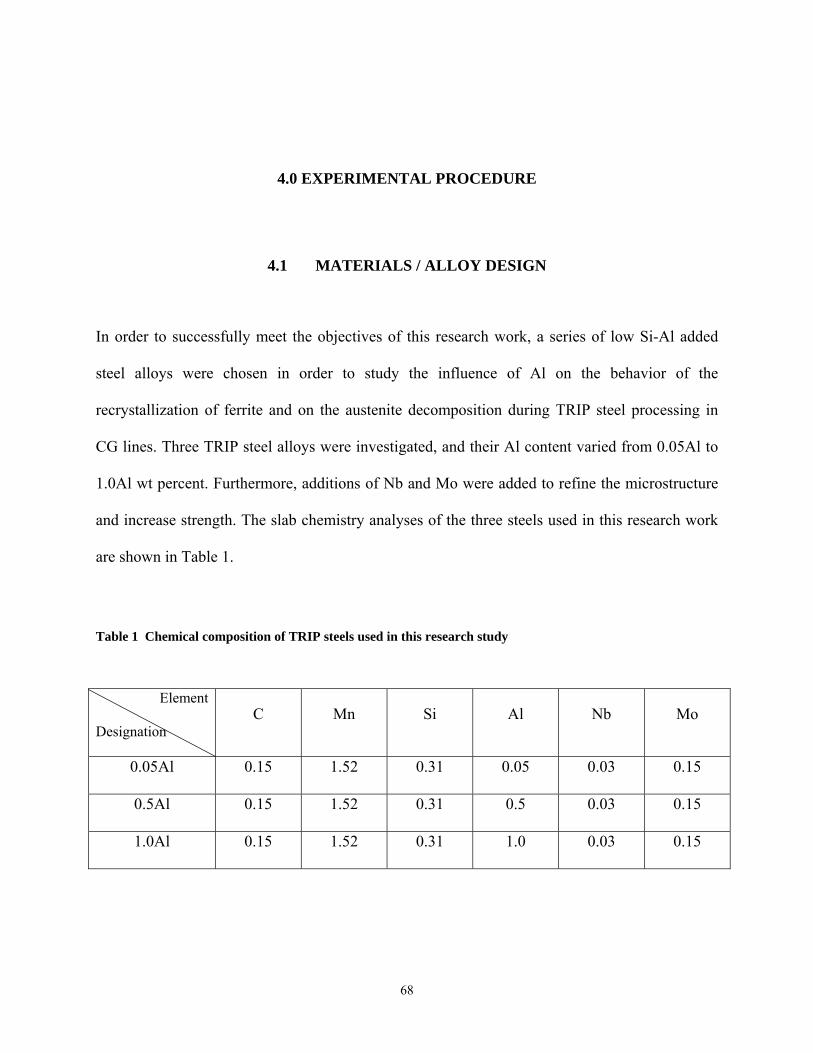
4.0 EXPERIMENTAL PROCEDURE
4.1 MATERIALS / ALLOY DESIGN
In order to successfully meet the objectives of this research work, a series of low Si-Al added
steel alloys were chosen in order to study the influence of Al on the behavior of the
recrystallization of ferrite and on the austenite decomposition during TRIP steel processing in
CG lines. Three TRIP steel alloys were investigated, and their Al content varied from 0.05Al to
1.0Al wt percent. Furthermore, additions of Nb and Mo were added to refine the microstructure
and increase strength. The slab chemistry analyses of the three steels used in this research work
are shown in Table 1.
Table 1 Chemical composition of TRIP steels used in this research study
Element
DC Mn Si Al Nb Mo
esignation
0.05Al 0.15 1.52 0.31 0.05 0.03 0.15
0.5Al 0.15 1.52 0.31 0.5 0.03 0.15
1.0Al 0.15 1.52 0.31 1.0 0.03 0.15
68
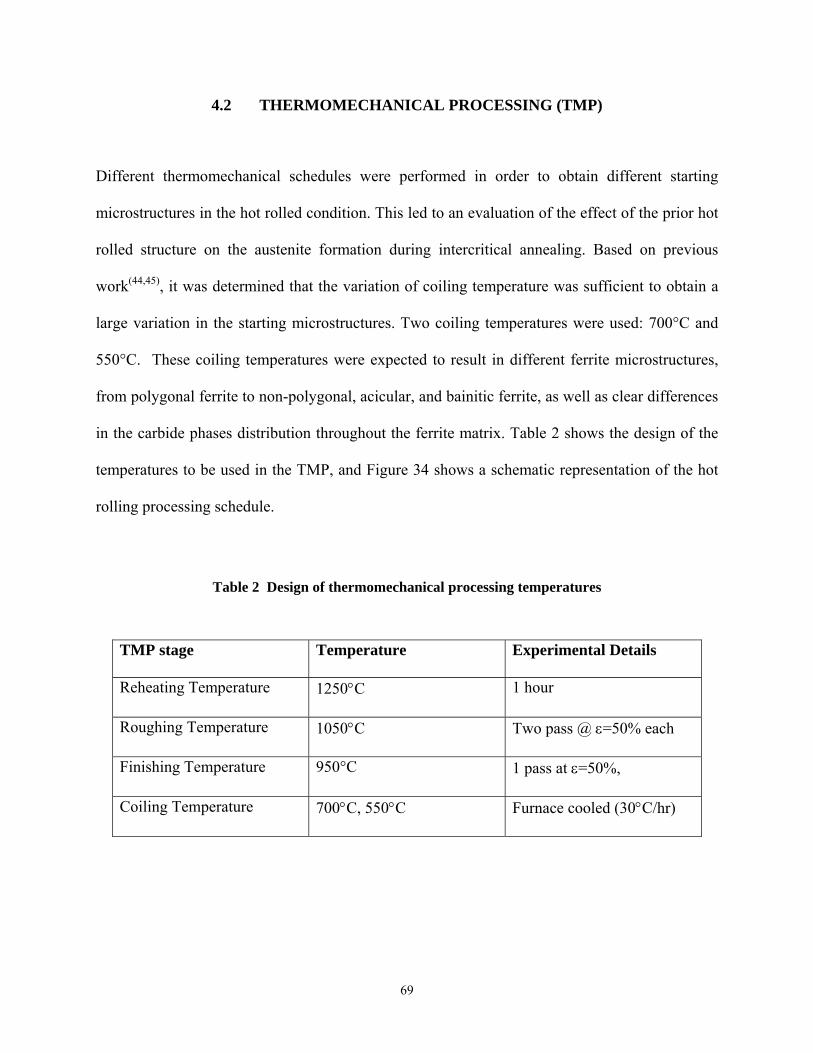
4.2 THERMOMECHANICAL PROCESSING (TMP)
Different thermomechanical schedules were performed in order to obtain different starting
microstructures in the hot rolled condition. This led to an evaluation of the effect of the prior hot
rolled structure on the austenite formation during intercritical annealing. Based on previous
work(44,45), it was determined that the variation of coiling temperature was sufficient to obtain a
large variation in the starting microstructures. Two coiling temperatures were used: 700°C and
550°C. These coiling temperatures were expected to result in different ferrite microstructures,
from polygonal ferrite to non-polygonal, acicular, and bainitic ferrite, as well as clear differences
in the carbide phases distribution throughout the ferrite matrix. Table 2 shows the design of the
temperatures to be used in the TMP, and Figure 34 shows a schematic representation of the hot
rolling processing schedule.
Table 2 Design of thermomechanical processing temperatures
TMP stage Details Temperature Experimental
Reheating Temperature 1250°C 1 hour
Roughing Temperature 1050°C Two pass @ ε=50% each
Finishing Temperature 950°C 1 pass at ε=50%,
C 700 °C Furnace coooiling Temperature °C, 550 led (30°C/hr)
69
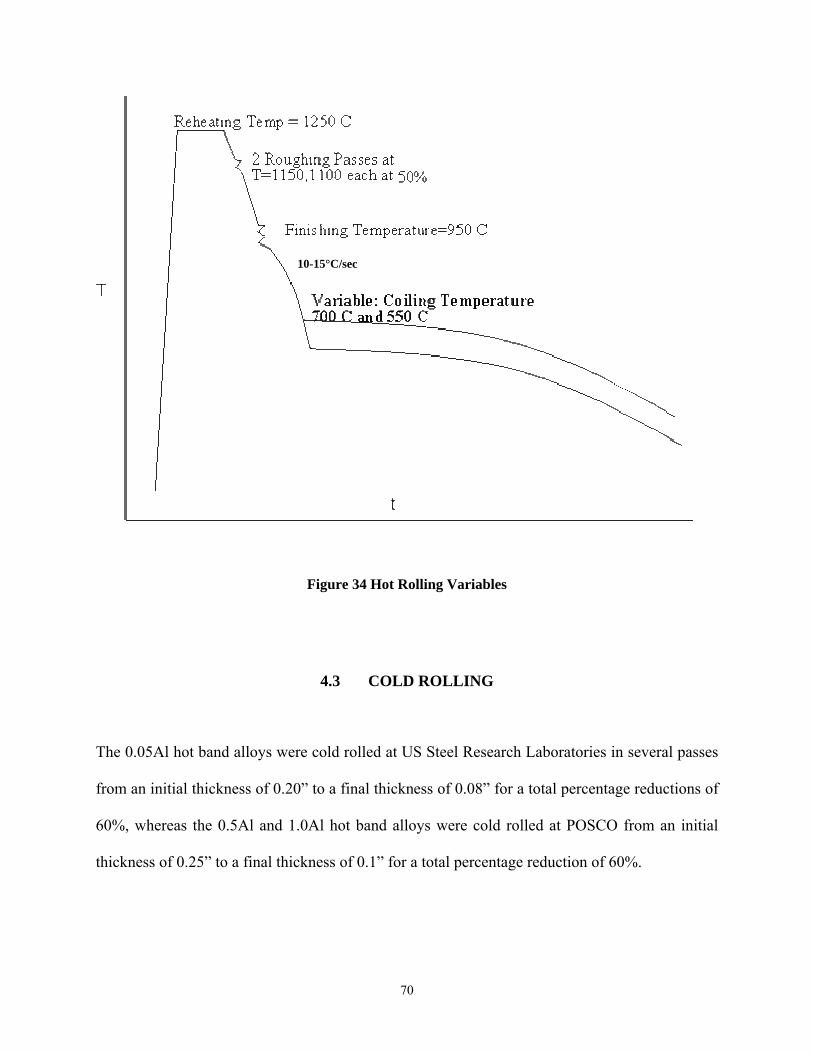
10-15°C/sec
Figure 34 Hot Rolling Variables
4.3 COLD ROLLING
he 0.05Al hot band alloys were cold rolled at US Steel Research Laboratories in several passes T
from an initial thickness of 0.20” to a final thickness of 0.08” for a total percentage reductions of
60%, whereas the 0.5Al and 1.0Al hot band alloys were cold rolled at POSCO from an initial
thickness of 0.25” to a final thickness of 0.1” for a total percentage reduction of 60%.
70
4.4 INTERCRITICAL ANNEALING HEAT TREATMENTS
JMat-Pro software was used to predict the Ac1 and Ac3 temperatures, as well as the austenite
volume fraction formation during different intercritical annealing temperatures as a function of
Al content. Based on these predictions, a number of intercritical annealing temperatures that
would result within a 20-80% initial austenite percent range for the different alloys were chosen.
After cold rolling each of the hot band conditions, the samples were heated at 3°C/sec and
intercritically annealed for 60 seconds at various temperatures (based on the JMat Pro results)
followed by quenching in ice brine solution. The austenite and ferrite volume fractions were then
measured to compare the predicted vs observed results.
The austenite (observed as martensite) and ferrite volume fractions, and austenite and
ferrite grain size were measured using optical microscopy plus point counting, as well as SEM-
EBSD (Image Quality) analysis(62,78). The ferrite recrystallization behavior was also investigated
during the intercritical annealing stage. Optical microscopy plus the Bioquant IV system were
used to measure the aspect ratio of the ferrite grains at different intercritical annealing
temperatures. It is generally accepted that for a ferrite grain to be considered recrystallized, the
aspect ratio should be less or equal to 1.6(79). Ferrite recrystallization was also quantified by
SEM-EBSD, using the Image Quality (IQ) analysis of ferrite grains. Furthermore, microhardness
testing was also used to study the extent to which ferrite recrystallizes as a function of time and
temperature.
71

4.5 AUSTENITE DECOMPOSITION STUDY
In order to evaluate the effect of varying intercritical annealing temperatures and cooling rates to
the IBT, it was necessary to develop microstructural maps a) during cooling from the TIA to IBT
(CCT diagrams) and b) during the isothermal holding temperature IHT. A Theta Dilatronic II
Dilatometer and a Gleeble 3500 unit fitted with a laser width sensor were used to study the
transformation behavior of austenite during continuous cooling from two intercritical annealing
temperatures, those that represent an initial austenite percent of 35% and 55%. The cold rolled
samples were heated to the starting intercritical annealing temperature at a constant heating rate
of 3°C/sec, and held for 60 seconds before continuous cooling at 1, 15 and 30 °C/sec to room
temperature. Based on the CCT diagrams, varying cooling rates from the TIA to the IHT were
used to evaluate the austenite decomposition behavior.
Similarly, in order to study and quantify the austenite decomposition products during
cooling from the intercritical annealing temperature to the isothermal holding temperature (IHT),
interrupted quench experiments were carried out in a MTS-458 unit with a mounted radiation
furnace. During these experiments, samples were also heated at a constant rate of 3 °C/sec to the
intercritical annealing temperature (equal to 35% and 55% austenite percent), held for 60
seconds and cooled at 5 and 15°C/sec to the isothermal holding temperature of 450 °C, followed
by a 2-3 second holding and immediately quenched into iced brine solution. The ferrite and
austenite volume fraction were then measured by point counting and the results confirmed by
SEM-EBSD (IQ) analysis(62,78).
72
4.6 ISOTHERMAL HOLDING TEMPERATURE TRANSFORMATION
The variation of the holding time (2s, 30s, 60s, 90, and 120s) at the bainite transformation
temperature of 450 °C, temperature at which the galvanizing of the steel sheet takes place, was
investigated. The maximum holding time at this temperature was defined by the line speed
observed in a typical continuous annealing line or hot dip galvanizing line (up to 120 seconds
from the TIA to the exit of the zinc pot). Furthermore, the cooling rate after each holding time
was varied in order to study the effect of post-holding on the retained austenite stability.
Furthermore, a post-zinc heat treatment was performed in the 1.0Al steel to simulate a
galvannealing process and evaluate if it influences the austenite decomposition and/or austenite
stability. A qualitative and quantitative analysis of the amount of bainite at each stage was
obtained by optical microscopy, SEM-EBSD, TEM and dilatometry analysis. Finally, the
retained the austenite was measured by magnetometry and its microstructural appearance was
determined by SEM and TEM analysis.
4.7 MICROSTRUCTURAL ANALYSIS
4.7.1 Optical Microscopy
Optical microscopy was used for the initial examination and identification of the different types
of microstructures. The samples were sectioned perpendicular to the rolling plane, followed by
mounting in bakelite. The specimens were ground using 180, 240, 320, 400 and 600 grit abrasive
papers, and polished using 1 um alumina. All samples were then polished on 0.05µm alumina
73
immediately (i.e., within 15 seconds) before etching to eliminate passivation due to atmospheric
exposure.
Parish(38) has made an extensive review on different etching procedures and techniques
that are often used to observed the different phases in multiphase steels. Of these techniques,
Parish found that only two, LePera's(97,100) and 10% Na2S2O5(98,99) techniques, were found to give
satisfactory results. The 10% Na2S2O5 technique gave moderate metallographic contrast nearly
every time, especially when combined with an 8-10 second 3% nital pre-etch. Further, the
technique's simplicity resulted in highly consistent etching. LePera's technique was very
consistent if care was taken to prevent air contact by storing the sample under alcohol
immediately after polishing. LePera's technique gave the best austenite-ferrite contrast. However,
LePera’s technique was found to give inconsistent etching response in high-bainite-fraction (i.e.,
>5%) materials. The 10% Na2S2O5 technique, however, provided excellent bainite contrast, even
if its ferrite-austenite contrast was less pronounced.
Measurements of grain size, aspect ratio and volume fractions of microconstituents were
done using a computer controlled Bioquant IV system attached to an optical microscope.
4.7.2 Scanning Electron Microscopy (SEM)/EBSD
A Philips XL30 field emission gun SEM at the University of Pittsburgh was used to examine
specimens. Samples prepared for optical microscopy were used for a more comprehensive and
detailed identification of microconstituents. Furthermore, thin foils were prepared as described in
the following section, and were used for the identification of the different phases, specially the
retained austenite phase. Also, Electron Back Scattering Diffraction (EBSD) analysis was used to
74
determine the crystallographic texture and grain boundary misorientation between the different
phases. Furthermore, the image quality approach will also be used to evaluate the different
phases(62,78). The samples used for EBSD analysis were cut parallel to the rolling direction
(through thickness), grounded and polished as described in the previous section.
4.7.3 Transmission Electron Microscopy (TEM)
TEM examination of the specimens was conducted using a JEM-200CX electron microscope
operated at 200 kV. The analysis included bright field, dark field, and selected area diffraction.
The microstructural features that were studied included examination and identification of the
different phases and their distribution and morphology, and also for the presence of fine
precipitates. The procedure for preparing thin foils was as follows: the samples were sectioned
through the thickness (parallel to the rolling direction). A low speed saw was used and the
thickness of the slice obtained was close to 0.8 mm. No grinding needed to be used. The samples
were chemically thinned to a thickness of 80-90 um. Two separate solutions were used for the
chemical thinning. The first solution consisted of 50 ml H2O, 50 ml H2O2 (30%), and 7 ml HF.
The second solution consisted of 50 ml H2O, 30 ml HNO3, 15 ml HCl, and 10 ml HF. The foils
were immersed in the first solution to thin the samples to about 0.1 mm. Then the foils were
immersed in the second solution for a few seconds to obtain the final thickness. Finally, 3 mm
discs were punched from the foils, and subsequently polished with a twin jet polisher, using an
electrolytic solution of 95% acetic acid and 5% perchloric acid at approximately 70 mA.
75
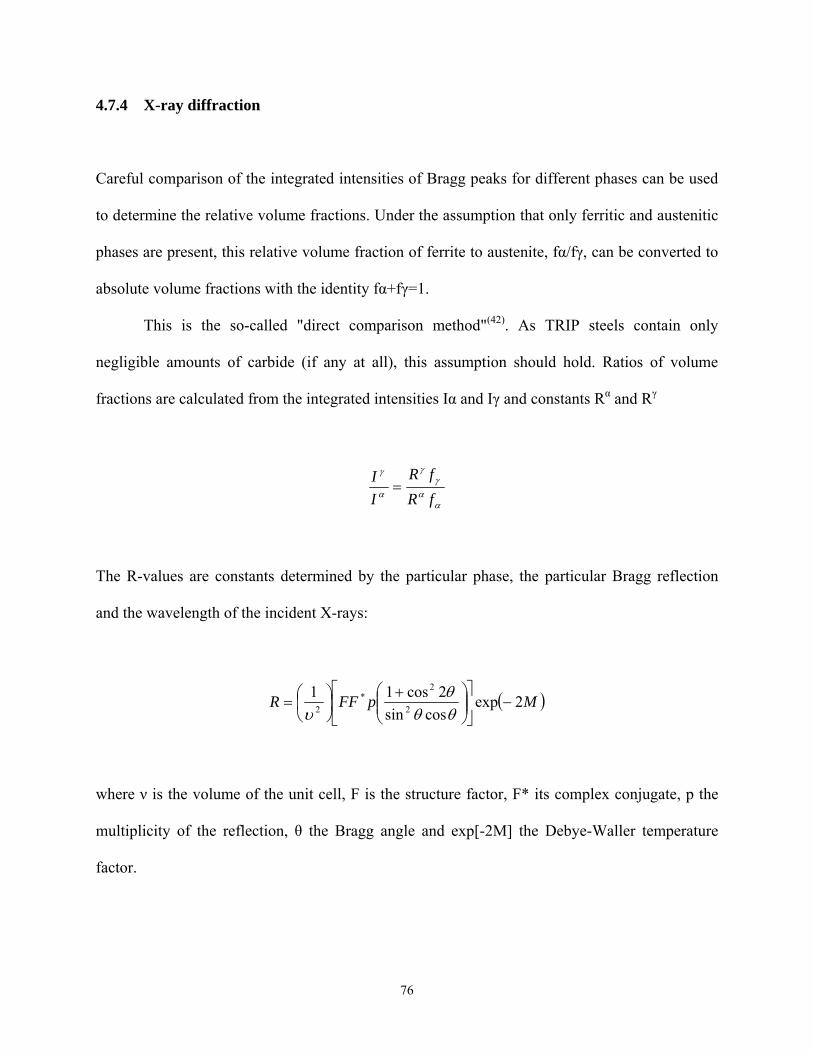
4.7.4 X-ray diffraction
Careful comparison of the integrated intensities of Bragg peaks for different phases can be used
to determine the relative volume fractions. Under the assumption that only ferritic and austenitic
phases are present, this relative volume fraction of ferrite to austenite, fα/fγ, can be converted to
absolute volume fractions with the identity fα+fγ=1.
This is the so-called "direct comparison method"(42). As TRIP steels contain only
negligible amounts of carbide (if any at all), this assumption should hold. Ratios of volume
fractions are calculated from the integrated intensities Iα and Iγ and constants Rα and Rγ
αα
γγ
α
γ
fRfR
II
=
The R-values are constants determined by the particular phase, the particular Bragg reflection
and the wavelength of the incident X-rays:
( )MpFFR 2expcossin
2cos112
2*
2 −⎥⎦
⎤⎢⎣
⎡⎟⎟⎠
⎞⎜⎜⎝
⎛ +⎟⎠⎞
⎜⎝⎛=
θθθ
υ
where ν is the volume of the unit cell, F is the structure factor, F* its complex conjugate, p the
multiplicity of the reflection, θ the Bragg angle and exp[-2M] the Debye-Waller temperature
factor.
76
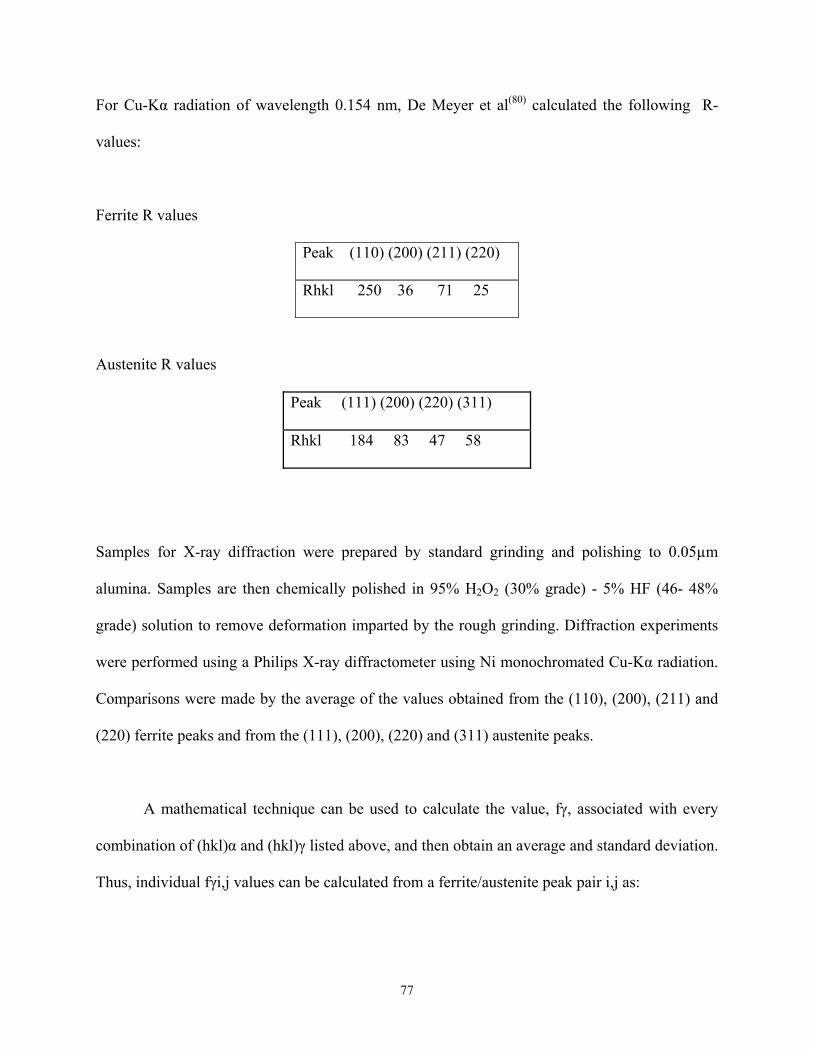
For Cu-Kα radiation of wavelength 0.154 nm, De Meyer et al(80) calculated the following R-
values:
Ferrite R values
Peak (110) (200) (211) (220)
Rhkl 250 36 71 25
Austenite R values
Peak (111) (200) (220) (311)
Rhkl 184 83 47 58
amples for X-ray diffraction were prepared by standard grinding and polishing to 0.05µm
lumina. Samples are then chemically polished in 95% H2O2 (30% grade) - 5% HF (46- 48%
ciated with every
ombination of (hkl)α and (hkl)γ listed above, and then obtain an average and standard deviation.
Thus, individual fγi,j values can be calculated from a ferrite/austenite peak pair i,j as:
S
a
grade) solution to remove deformation imparted by the rough grinding. Diffraction experiments
were performed using a Philips X-ray diffractometer using Ni monochromated Cu-Kα radiation.
Comparisons were made by the average of the values obtained from the (110), (200), (211) and
(220) ferrite peaks and from the (111), (200), (220) and (311) austenite peaks.
A mathematical technique can be used to calculate the value, fγ, asso
c
77
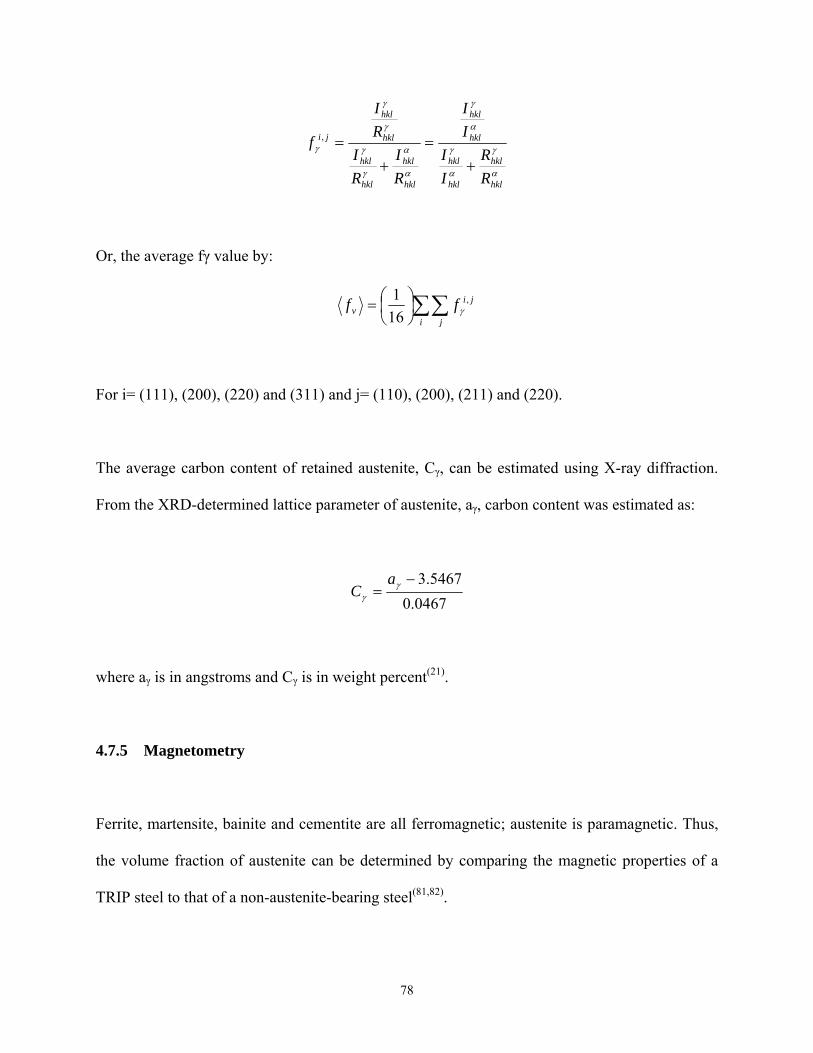
α
γ
α
γ
γ
α
α
γ
γ
γ
γ
hklhkl
hkl
hkl
hklhkl
hkl
hkl
ji
RR
II
II
RI
RI
RI
f ==, αγ
hklhklhklhkl ++
Or, the average fγ value by:
∑∑⎟⎞
⎜⎛= jiff ,1
⎠⎝ i jv 16 γ
For i= (111), (200), (220) and (311) a
he average carbon content of retained austenite, Cγ, can be estimated using X-ray diffraction.
t was estimated as:
nd j= (110), (200), (211) and (220).
T
From the XRD-determined lattice parameter of austenite, aγ, carbon conten
0467.05467.3−
= γaC γ
where aγ is in angstroms and Cγ(21)
4.7.5 Magnetometry
errite, martensite, bainite and cementite are all ferromagnetic; austenite is paramagnetic. Thus,
ustenite can be determined by comparing the magnetic properties of a
RIP steel to that of a non-austenite-bearing steel(81,82).
is in weight percent .
F
the volume fraction of a
T
78
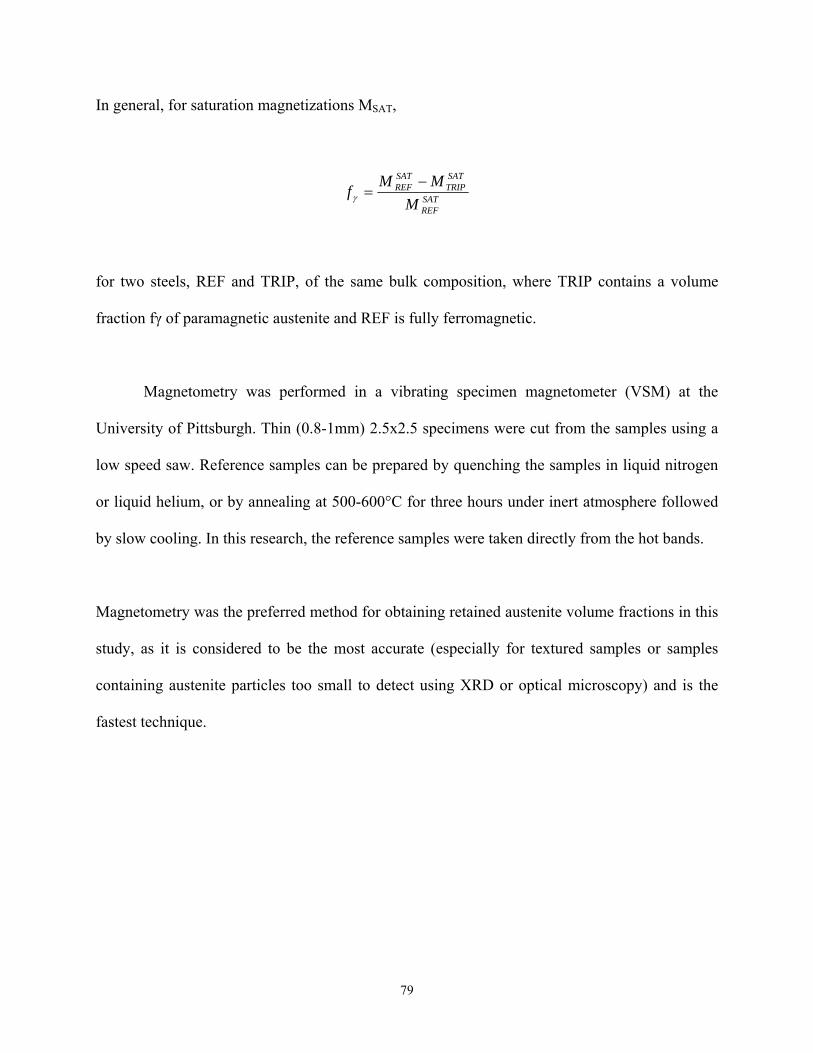
In general, for saturation magnetizations MSAT,
SATREF
TIP
Mγ
r two steels, REF and TRIP, of the same bulk composition, where TRIP contains a volume
fraction fγ of paramagnetic austenite a agnetic.
Magnetometry was performed in a vibrating specimen magnetometer (VSM) at the
samples in liquid nitrogen
r liquid helium, or by annealing at 500-600°C for three hours under inert atmosphere followed
by slow
e
stest technique.
SATR
SATREF MMf −
=
fo
nd REF is fully ferrom
University of Pittsburgh. Thin (0.8-1mm) 2.5x2.5 specimens were cut from the samples using a
low speed saw. Reference samples can be prepared by quenching the
o
cooling. In this research, the reference samples were taken directly from the hot bands.
Magnetometry was the preferred method for obtaining retained austenite volume fractions in this
study, as it is considered to be the most accurate (especially for textured samples or samples
containing austenite particles too small to detect using XRD or optical microscopy) and is th
fa
79
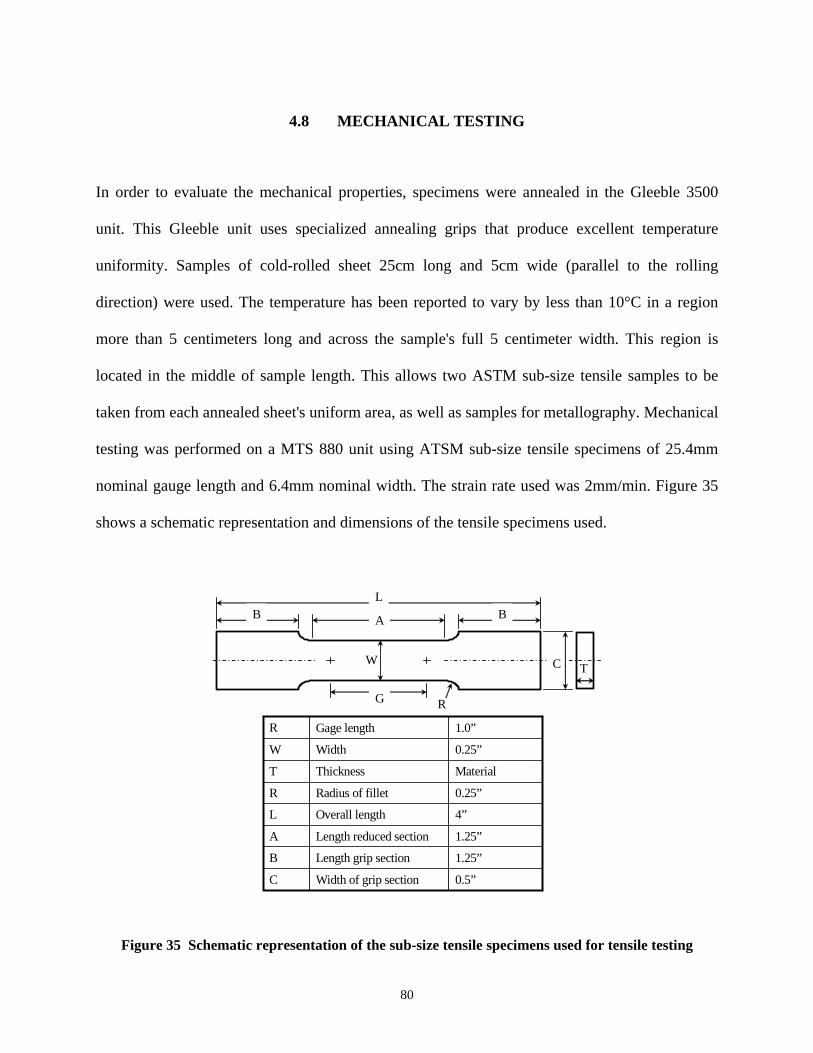
4.8 MECHANICAL TESTING
In order to evaluate the mechanical properties, specimens were annealed in the Gleeble 3500
unit. This Gleeble unit uses specialized annealing grips that produce excellent temperature
uniformity. Samples of cold-rolled sheet 25cm long and 5cm wide (parallel to the rolling
direction) were used. The temperature has been reported to vary by less than 10°C in a region
more than 5 centimeters long and across the sample's full 5 centimeter width. This region is
located in the middle of sample length. This allows two ASTM sub-size tensile samples to be
taken from each annealed sheet's uniform area, as well as samples for metallography. Mechanical
testing was performed on a MTS 880 unit using ATSM sub-size tensile specimens of 25.4mm
nominal gauge length and 6.4mm nominal width. The strain rate used was 2mm/min. Figure 35
shows a schematic representation and dimensions of the tensile specimens used.
LB BA
W
G R
0.5” Width of grip section C
1.25” Length grip section B
1.25” Length reduced section A
4” Overall length L
0.25” Radius of fillet R
Material (0.25”Thickness T
0.25” Width W
1.0” Gage length R
Figure 35 Schematic representation of the sub-size tensile specim
80
C T
)
ens used for tensile testing
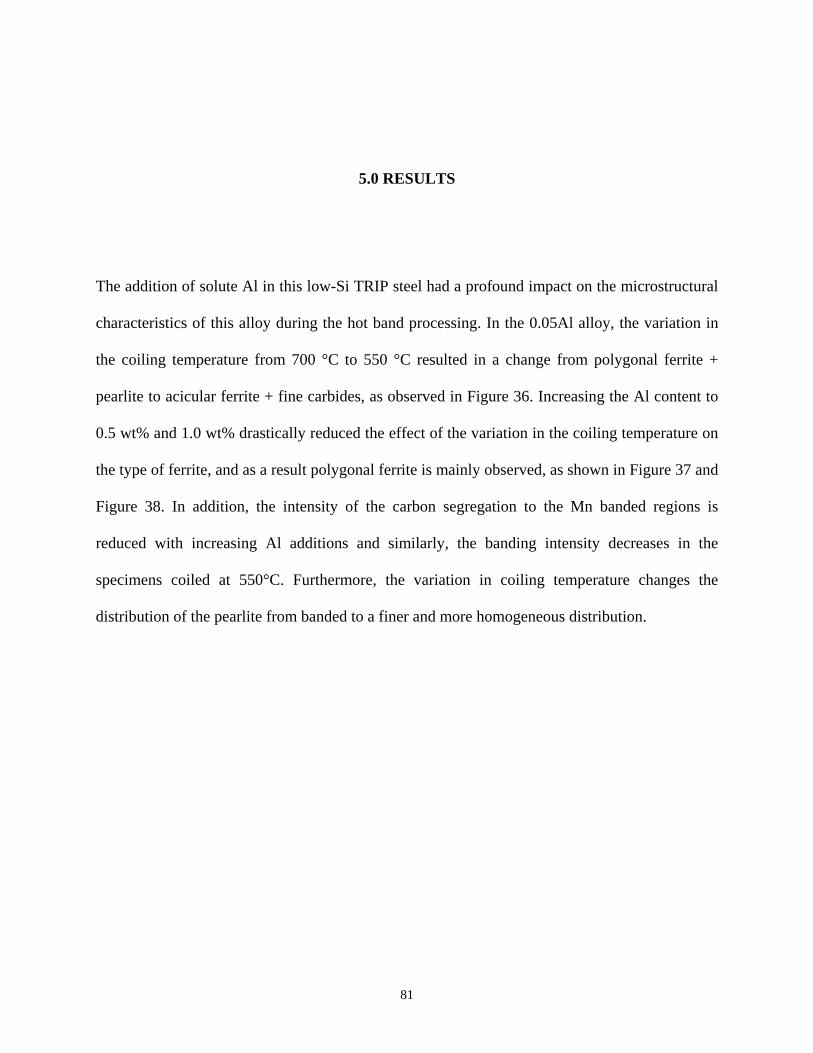
5.0 RESULTS
The addition of solute Al in this low-Si TRIP steel had a profound impact on the microstructural
characteristics of this alloy during the hot band processing. In the 0.05Al alloy, the variation in
the coiling temperature from 700 °C to 550 °C resulted in a change from polygonal ferrite +
pearlite to acicular ferrite + fine carbides, as observed in Figure 36. Increasing the Al content to
0.5 wt% and 1.0 wt% drastically reduced the effect of the variation in the coiling temperature on
the type of ferrite, and as a result polygonal ferrite is mainly observed, as shown in Figure 37 and
Figure 38. In addition, the intensity of the carbon segregation to the Mn banded regions is
reduced with increasing Al additions and similarly, the banding intensity decreases in the
specimens coiled at 550°C. Furthermore, the variation in coiling temperature changes the
distribution of the pearlite from banded to a finer and more homogeneous distribution.
81
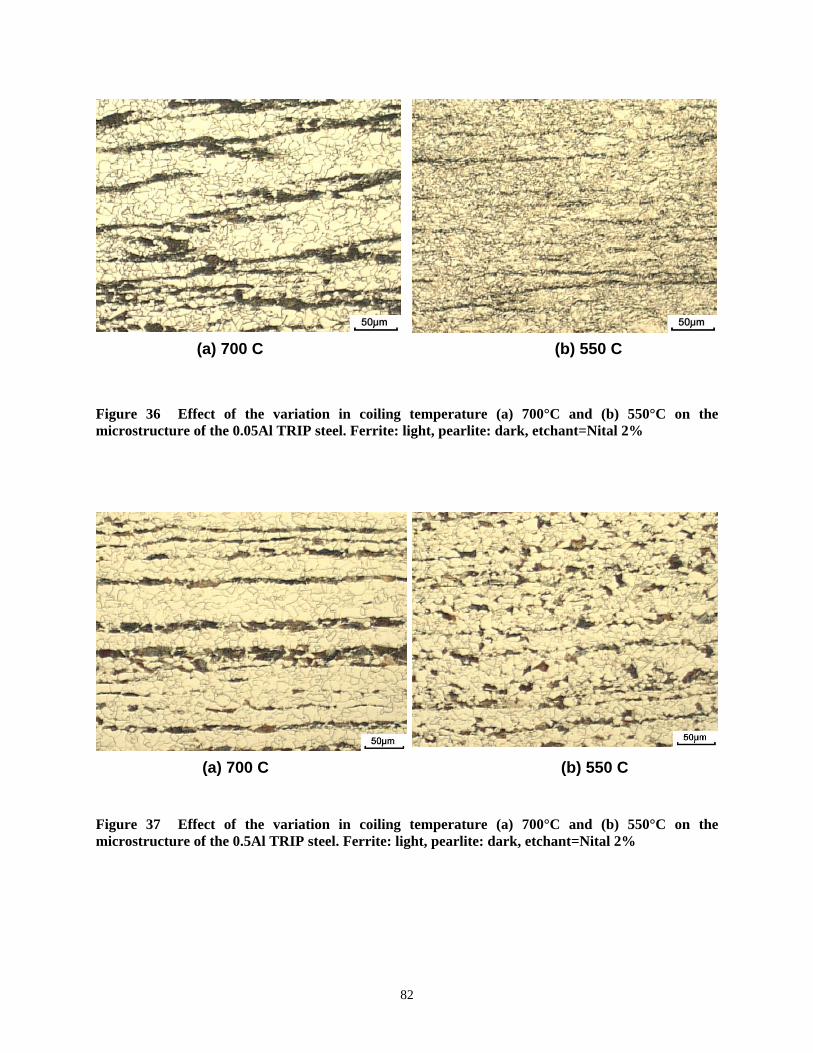
(a) 700 C (b) 550 C
Figure 36 Effect of the variation in coiling temperature (a) 700°C and (b) 550°C on the microstructure of the 0.05Al TRIP steel. Ferrite: light, pearlite: dark, etchant=Nital 2%
(a) 700 C (b) 550 C
Figure 37 Effect of the variation in coiling temperature (a) 700°C and (b) 550°C on the microstructure of the 0.5Al TRIP steel. Ferrite: light, pearlite: dark, etchant=Nital 2%
82
(b) 550 C (a) 700 C
Figure 38 Effect of the variation in coiling temperature (a) 700°C and (b) 550°C on the microstructure of the 1.0Al TRIP steel. Ferrite: light, pearlite: dark, etchant=Nital 2%
5.1 STAGE I - INTERCRITICAL ANNEALING
Two events take place during the intercritical annealing: recrystallization of the cold rolled
ferrite and the formation of austenite. The temperature used during intercritical annealing can
have a large effect on a number of microstructural features in the austenite and ferrite phases. On
heating, as soon as the Ac1 temperature is reached, austenite begins to form and the volume
fraction increases according to the level rule until it reaches completion at the Ac3 temperature.
Similarly, the ferrite grains at any given temperature will vary from non-recrystallized grains to
fully recrystallized grains. This study shows that the variation of Al content has indeed a large
effect on the microstructural characteristics of the austenite and ferrite at any given temperature
during intercritical annealing.
83
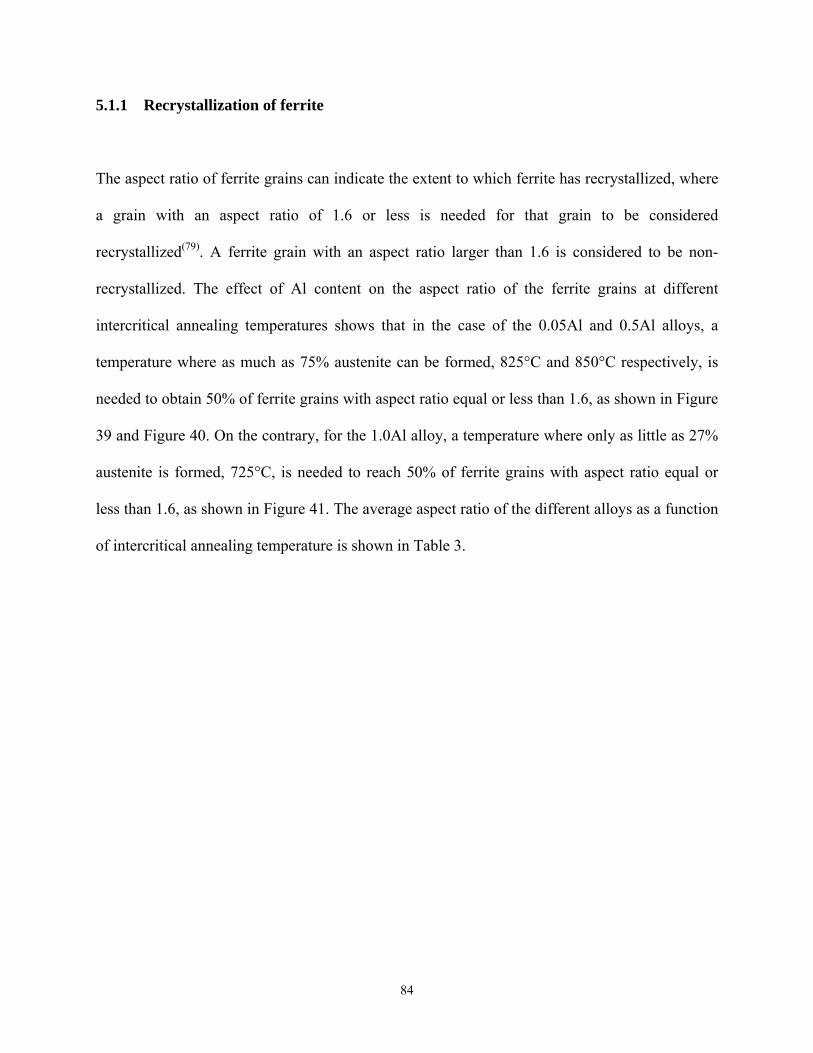
5.1.1 Recrystallization of ferrite
The aspect ratio of ferrite grains can indicate the extent to which ferrite has recrystallized, where
grain with an aspect ratio of 1.6 or less is needed for that grain to be considered
t h an aspect ratio larger than 1.6 is considered to be non-
ecrystallized. The effect of Al content on the aspect ratio of the ferrite grains at different
a
recrys allized(79). A ferrite grain wit
r
intercritical annealing temperatures shows that in the case of the 0.05Al and 0.5Al alloys, a
temperature where as much as 75% austenite can be formed, 825°C and 850°C respectively, is
needed to obtain 50% of ferrite grains with aspect ratio equal or less than 1.6, as shown in Figure
39 and Figure 40. On the contrary, for the 1.0Al alloy, a temperature where only as little as 27%
austenite is formed, 725°C, is needed to reach 50% of ferrite grains with aspect ratio equal or
less than 1.6, as shown in Figure 41. The average aspect ratio of the different alloys as a function
of intercritical annealing temperature is shown in Table 3.
84
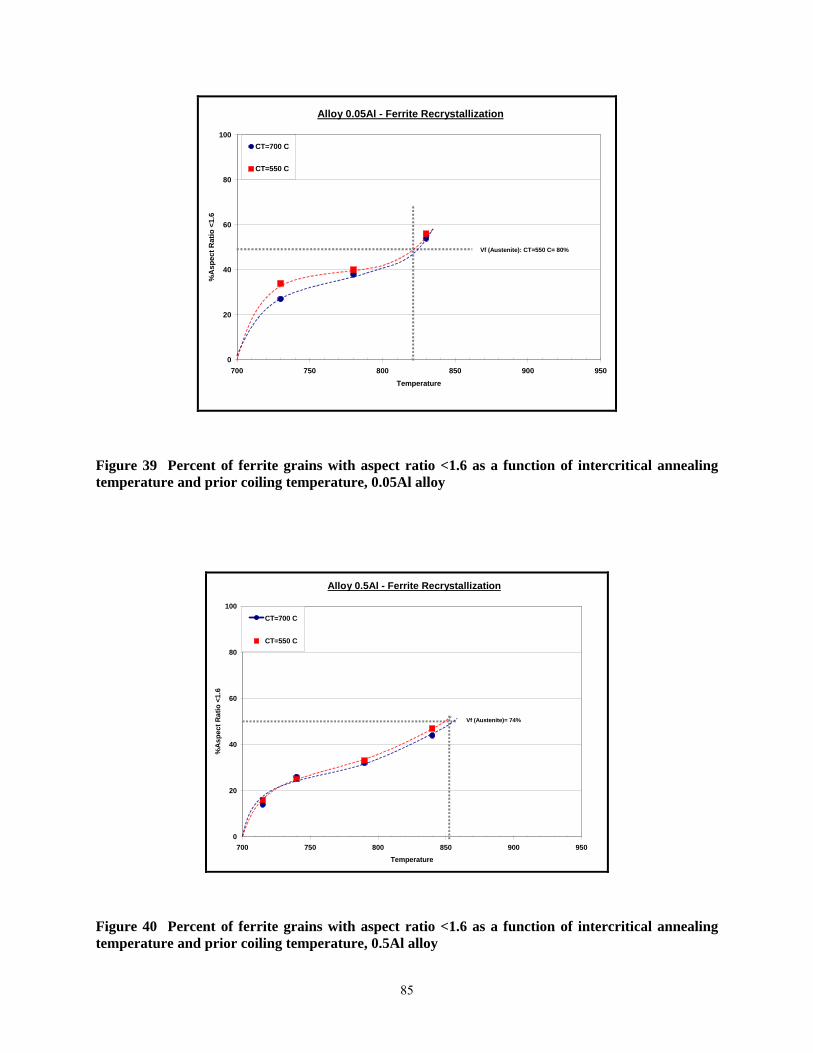
0
20
40
60
80
100
700 750 800 850 900 950Temperature
%A
spec
t Rat
io <
1.6
CT=700 C
CT=550 C
Vf (Austenite): CT=550 C= 80%
Alloy 0.05Al - Ferrite Recrystallization
Figure 39 Percent of ferrite grains with aspect ratio <1.6 as a function of intercritical annealing temperature and prior coiling temperature, 0.05Al alloy
0
20
40
60
80
100
700 750 800 850 900 950Temperature
%A
spec
t Rat
io <
1.6
CT=700 C
CT=550 C
Vf (Austenite)= 74%
Alloy 0.5Al - Ferrite Recrystallization
Figure 40 Percent of ferrite grains with aspect ratio <1.6 as a function of intercritical annealing temperature and prior coiling temperature, 0.5Al alloy
85
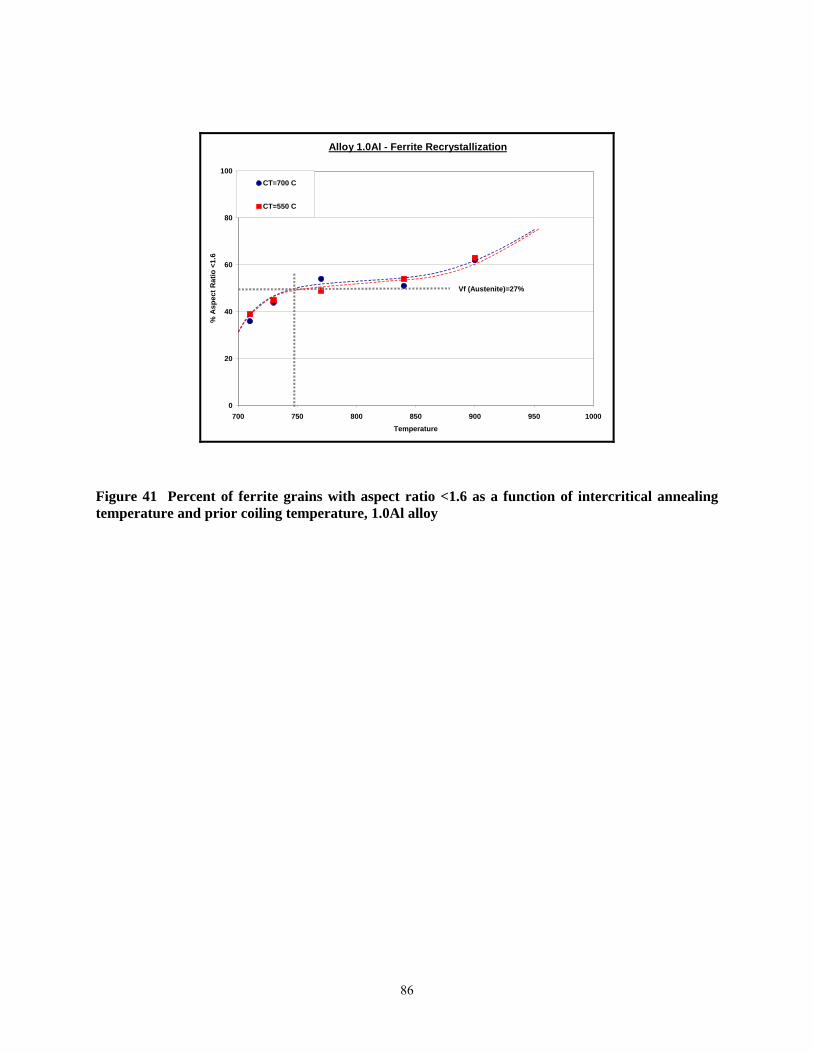
0
20
40
60
80
100
700 750 800 850 900 950 1000Temperature
% A
spec
t Rat
io <
1.6
CT=700 C
CT=550 C
Vf (Austenite)=27%
Alloy 1.0Al - Ferrite Recrystallization
Figure 41 Percent of ferrite grains with aspect ratio <1.6 as a function of intercritical annealing temperature and prior coiling temperature, 1.0Al alloy
86
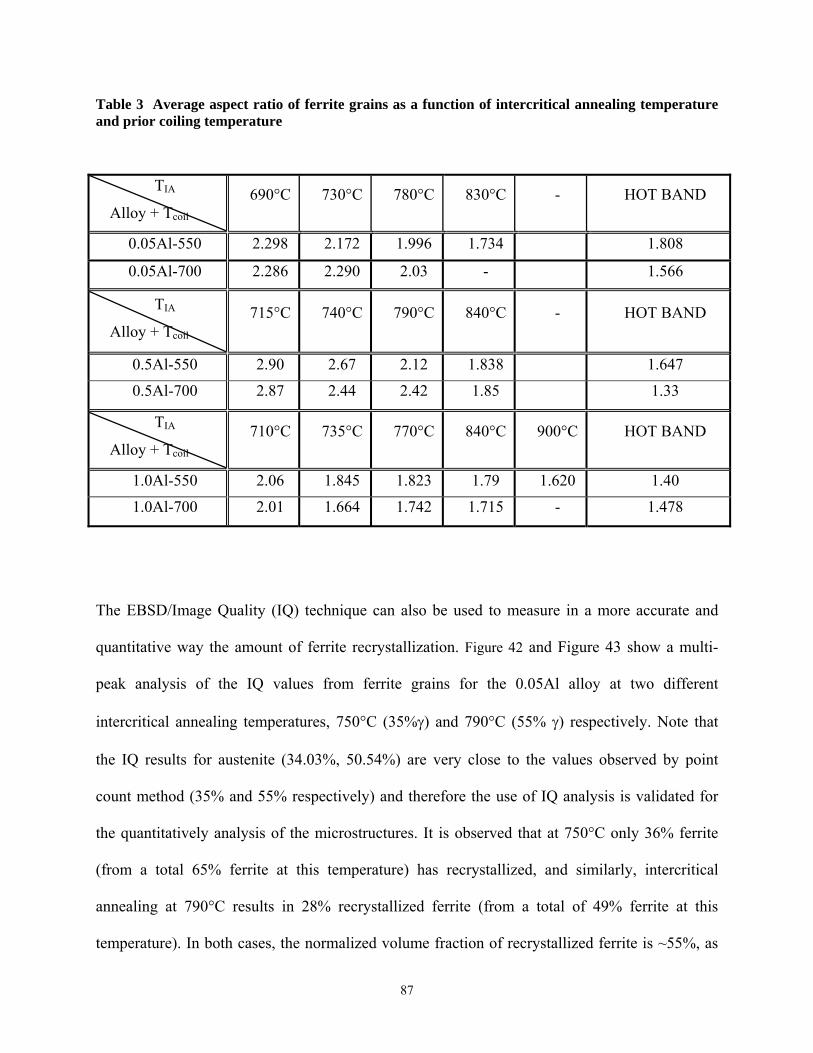
Table 3 Average aspect ratio of ferrite grains as a function of intercritical annealing temperature and prior coiling temperature
TIA
Alloy + Tcoil
690°C 730°C 780°C 830°C - HOT BAND
0.05Al-550 2.298 2.172 1.996 1.734 1.808
0.05Al-700 2.286 2.290 2.03 - 1.566
TIA
Alloy + Tcoil
715°C 740°C 790°C 840°C - HOT BAND
0.5Al-550 2.90 2.67 2.12 1.838 1.647
0.5Al-700 2.87 2.44 2.42 1.85 1.33
TIA
Alloy +710°C 735°C 770°C 840°C 900°C HOT BAND
Tcoil
1.0Al-550 2.06 1.845 1.823 1.79 1.620 1.40
1.0Al-700 2.01 1.664 1.742 1.715 - 1.478
he EBSD/Image Quality (IQ) technique can also be used to measure in a more accurate and
T
quantitative way the amount of ferrite recrystallization. Figure 42 and Figure 43 show a multi-
peak analysis of the IQ values from ferrite grains for the 0.05Al alloy at two different
intercritical annealing temperatures, 750°C (35%γ) and 790°C (55% γ) respectively. Note that
the IQ results for austenite (34.03%, 50.54%) are very close to the values observed by point
count method (35% and 55% respectively) and therefore the use of IQ analysis is validated for
the quantitatively analysis of the microstructures. It is observed that at 750°C only 36% ferrite
(from a total 65% ferrite at this temperature) has recrystallized, and similarly, intercritical
annealing at 790°C results in 28% recrystallized ferrite (from a total of 49% ferrite at this
temperature). In both cases, the normalized volume fraction of recrystallized ferrite is ~55%, as
87

shown in Table 4. This indicates that the variation in the intercritical annealing temperature in
the range of 750°C to 790°C has essentially no effect on the percent of ferrite recrystallization.
Increasing the Al content from 0.05 wt% to 1.0 wt% increased the volume fraction of
recrystallized ferrite. The IQ values from the ferrite grains in the 1.0Al-550 alloy show that for
the same percentage of total ferrite formed as in the 0.05Al alloy, a larger ferrite fraction is found
to be recrystallized. In fact, the percent of recrystallized grains is already 75% at a very low
intercritical annealing temperature, 770°C, as shown in Figure 44 and Figure 45. Also note that
the IQ results for austenite (30.2%, 57.5%) are very close to the values observed by point count
method (35% and 55% respectively). Furthermore, note that also in this 1.0Al alloy, despite the
large difference in temperature to obtain 35%γ and 55%γ during intercritical annealing, there is
essentially no difference in the volume fraction of recrystallized ferrite at the two given
temperatures. This is because ferrite is already recrystallized at low temperatures during heating
and therefore increasing the temperature has no significant effect.
88

0
0.05
0.1
0.15
0.2
0.25
0.3
0.35
0 10 20 30 40 50 60 70 80 90 100 110IQ
Freq
uenc
y
EBSD Data without GB ContributionRXD FerriteNon-RXD FerriteMartensiteSum of all simulated contributions
38.19%
27.78%34.03%
Figure 42 IQ Analysis without grain boundary data in the 0.05Al-550 alloy, TIA=750°C (35%γ), held 60 seconds and quenched
,
0
0.05
0.1
0.15
0.2
0.25
0.3
0 10 20 30 40 50 60 70 80 90 100 11
IQ
FREQ
UEN
CY
0
EBSD Data without GB Contribution
RXD FERRITE
NON-RXD FERRITE
MARTENSITE
Sum of all simulated contributions
27.26%
50.54%
22.20%
Figure 43 IQ Analysis without grain boundary data in the 0.05Al-550 alloy, TIA=790°C (55%γ), held 60 seconds and quenched
89
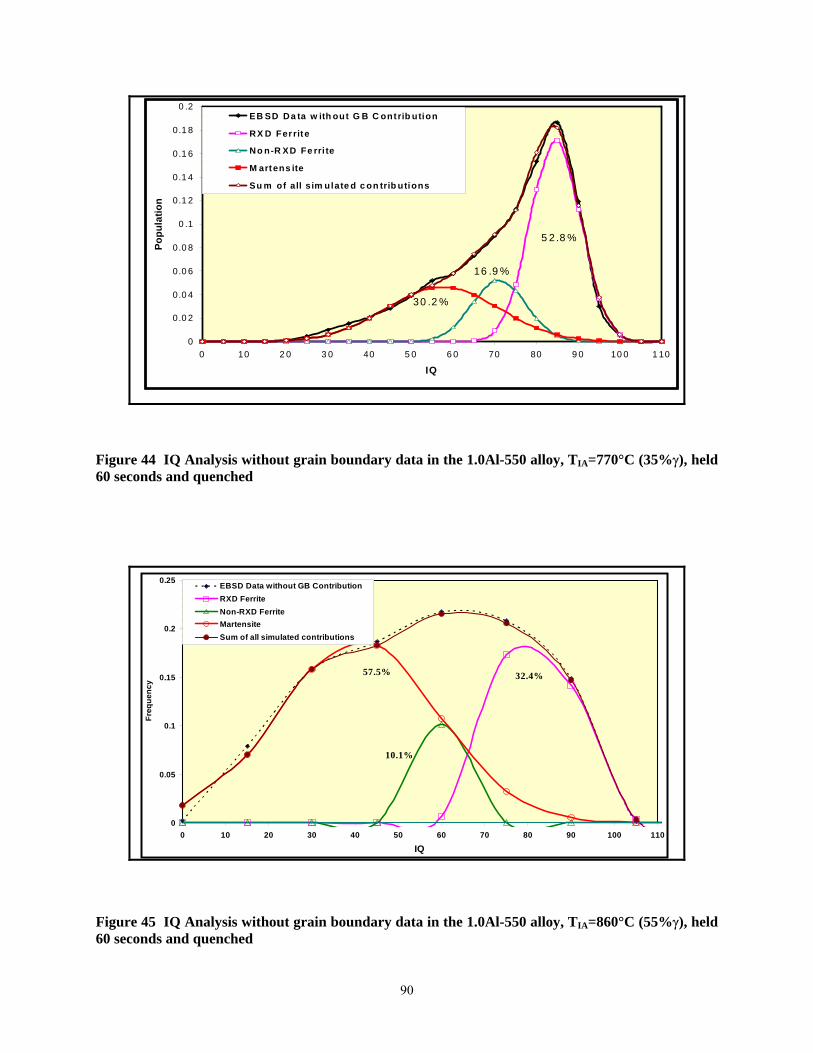
0
0.0 2
0.0 4
0.0 6
0.0 8
0 .1
0.1 2
0.1 4
0.1 6
0.1 8
0 .2
0 10 2 0 3 0 40 5 0 6 0 70 80 9 0 10 0 1 10
IQ
Popu
latio
n
EB SD Da ta w ith out G B C ontrib ution
RX D Fer rite
No n-R XD Fe rri te
M artens ite
Su m of all s im ulate d c on trib utions
5 2 .8 %
16 .9 %
30 .2 %
Figure 44 IQ Analysis without grain boundary data in the 1.0Al-550 alloy, TIA=770°C (35%γ), held 60 seconds and quenched
0
0.05
0.1
0.15
0.2
0.25
0 10 20 30 40 50 60 70 80 90 100 110
IQ
Freq
uenc
y
EBSD Data without GB ContributionRXD FerriteNon-RXD FerriteMartensiteSum of all simulated contributions
32.4%
10.1%
57.5%
Figure 45 IQ Analysis without grain boundary data in the 1.0Al-550 alloy, TIA=860°C (55%γ), held 60 seconds and quenched
90
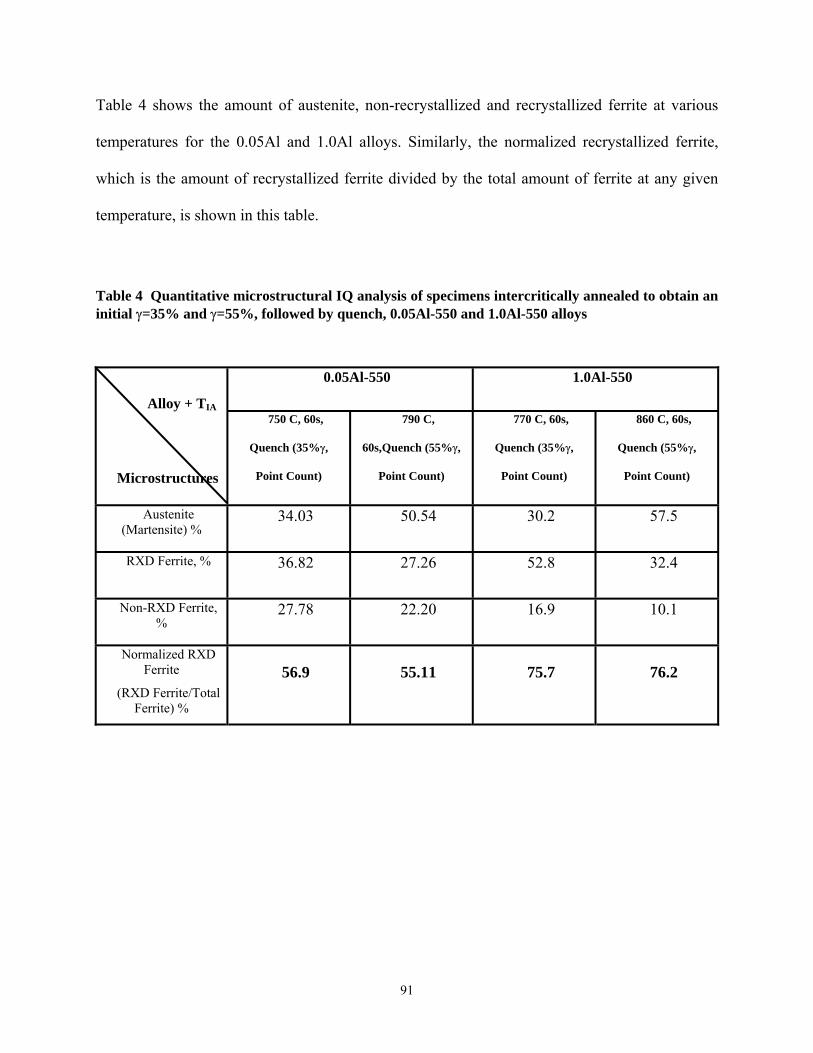
Table 4 shows the amount of austenite, non-recrystallized and recrystallized ferrite at various
temperatures for the 0.05Al and 1.0Al alloys. Similarly, the normalized recrystallized ferrite,
which is the amount of recrystallized ferrite divided by the total amount of ferrite at any given
temperature, is shown in this table.
Table 4 Quantitative microstructural IQ analysis of specimens intercritically annealed to obtain an initial γ=35% and γ=55%, followed by quench, 0.05Al-550 and 1.0Al-550 alloys
0.05Al-550 1.0Al-550 Alloy + TIA
Microstructures
750 C, 60s,
Quench (35%γ,
Point Count)
790 C,
60s,Quench (55%γ,
Point Count)
770 C, 60s,
Quench (35%γ,
Point Count)
860 C, 60s,
Quench (55%γ,
Point Count)
Austenite (Martensite) %
34.03 50.54 30.2 57.5
RXD Ferrite, % 36.82 27.26 52.8 32.4
Non-RXD Ferrite, %
27.78 22.20 16.9 10.1
Normalized RXD Ferrite
(RXD Ferrite/Total Ferrite) %
56.9 55.11 75.7 76.2
91
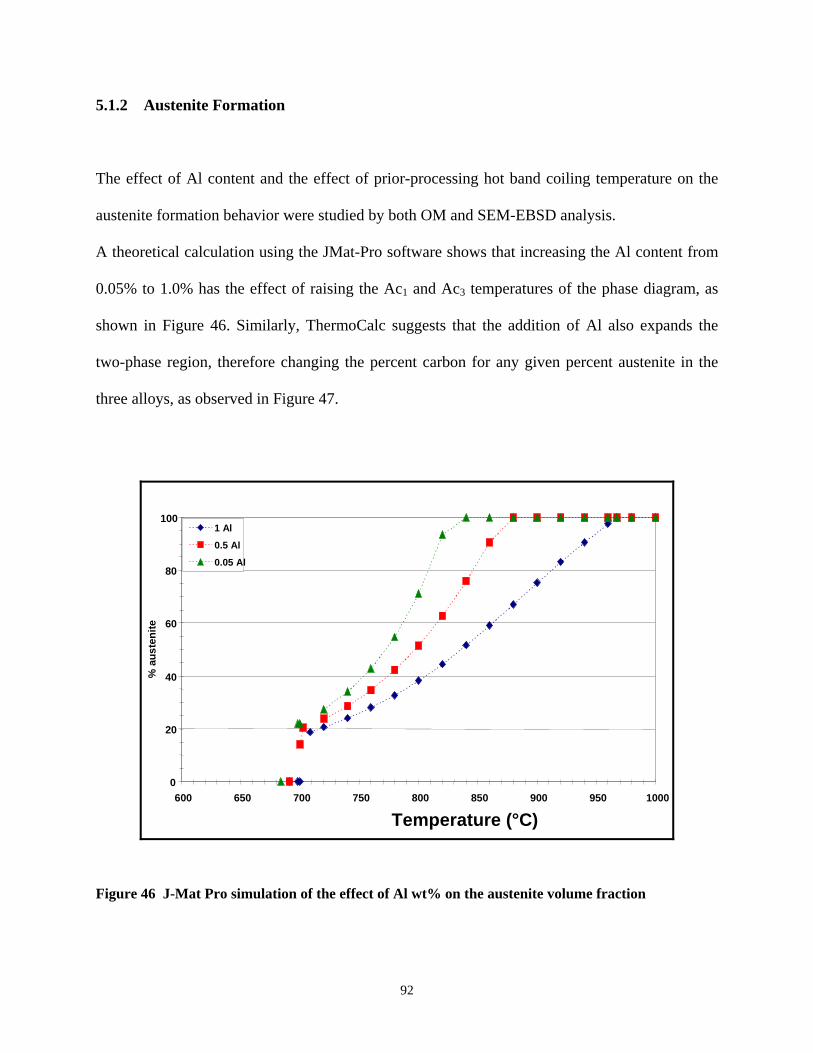
5.1.2 Austenite Formation
The effect of Al content and the effect of prior-processing hot band coiling temperature on the
austenite formation behavior were studied by both OM and SEM-EBSD analysis.
A theoretical calculation using the JMat-Pro software shows that increasing the Al content from
0.05% to 1.0% has the effect of raising the Ac1 and Ac3 temperatures of the phase diagram, as
shown in Figure 46. Similarly, ThermoCalc suggests that the addition of Al also expands the
two-phase region, therefore changing the percent carbon for any given percent austenite in the
three alloys, as observed in Figure 47.
0
20
40
60
80
100
600 650 700 750 800 850 900 950 1000
Temperature (°C)
% a
uste
nite
1 Al
0.5 Al
0.05 Al
Figure 46 J-Mat Pro simulation of the effect of Al wt% on the austenite volume fraction
92
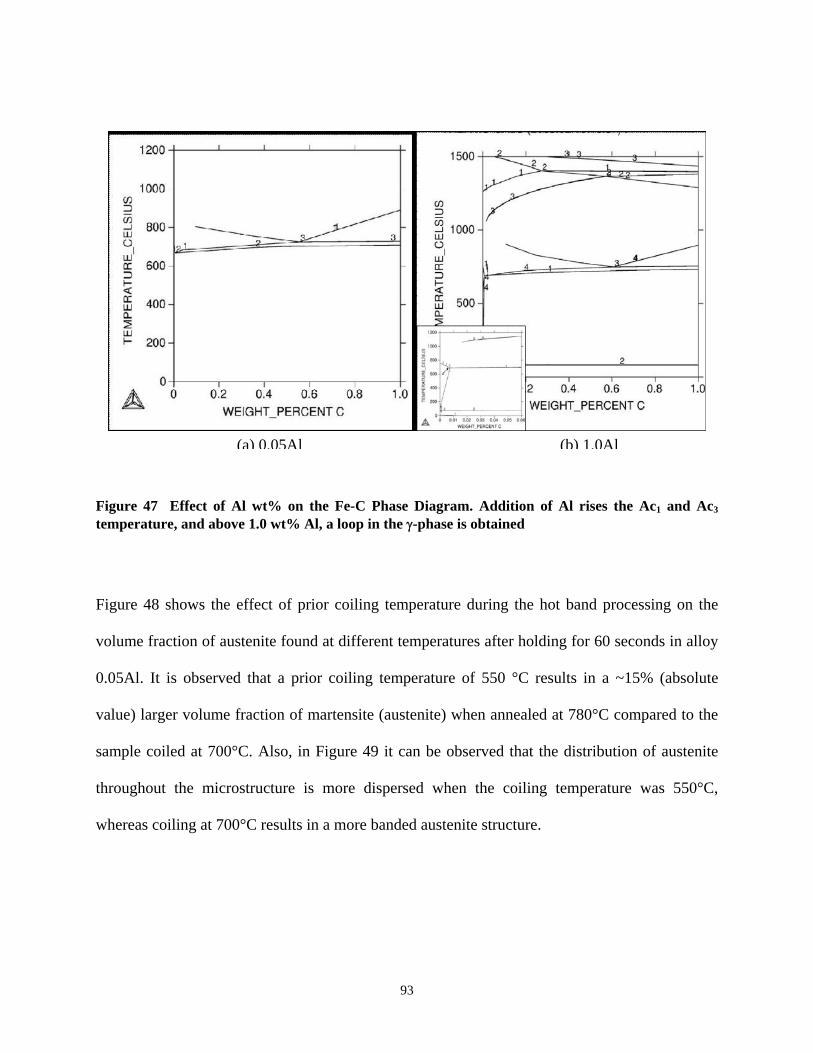
(a) 0.05Al (b) 1.0Al
Figure 47 Effect of Al wt% on the Fe-C Phase Diagram. Addition of Al rises the Ac1 and Ac3 temperature, and above 1.0 wt% Al, a loop in the γ-phase is obtained
Figure 48 shows the effect of prior coiling temperature during the hot band processing on the
volume fraction of austenite found at different temperatures after holding for 60 seconds in alloy
0.05Al. It is observed that a prior coiling temperature of 550 °C results in a ~15% (absolute
value) larger volume fraction of martensite (austenite) when annealed at 780°C compared to the
sample coiled at 700°C. Also, in Figure 49 it can be observed that the distribution of austenite
throughout the microstructure is more dispersed when the coiling temperature was 550°C,
whereas coiling at 700°C results in a more banded austenite structure.
93
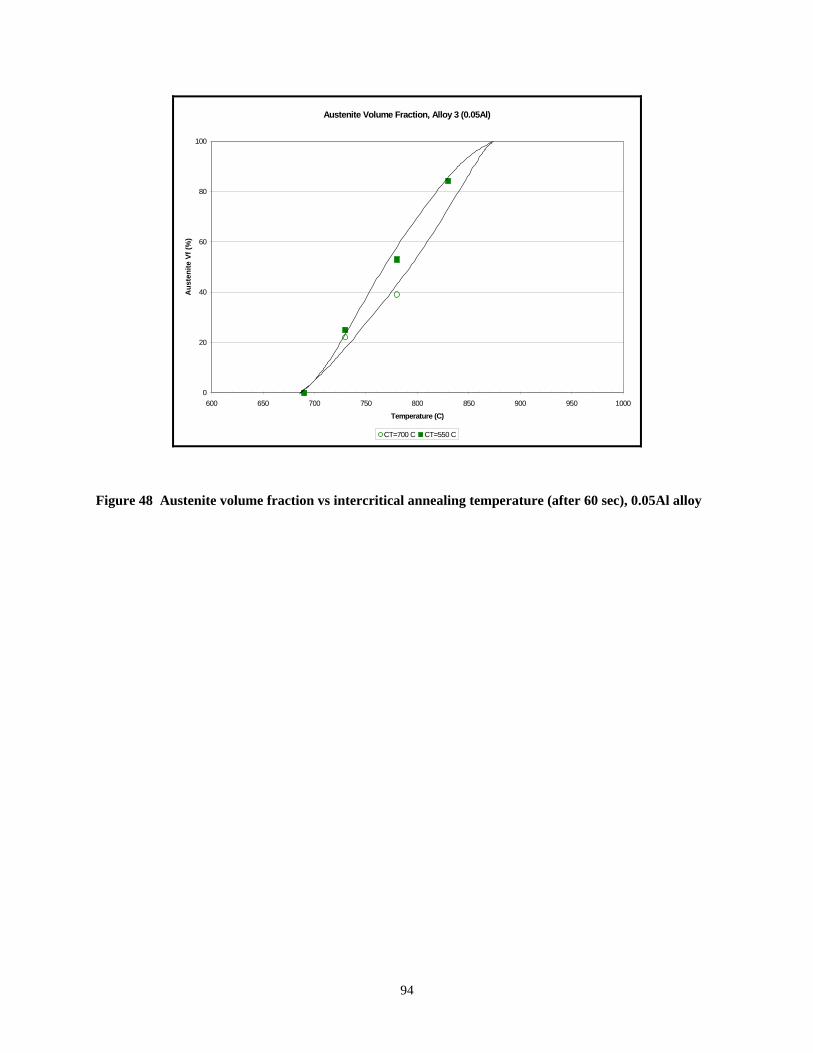
Austenite Volume Fraction, Alloy 3 (0.05Al)
0
20
40
60
80
100
600 650 700 750 800 850 900 950 1000
Temperature (C)
Aus
teni
te V
f (%
)
CT=700 C CT=550 C
Figure 48 Austenite volume fraction vs intercritical annealing temperature (after 60 sec), 0.05Al alloy
94
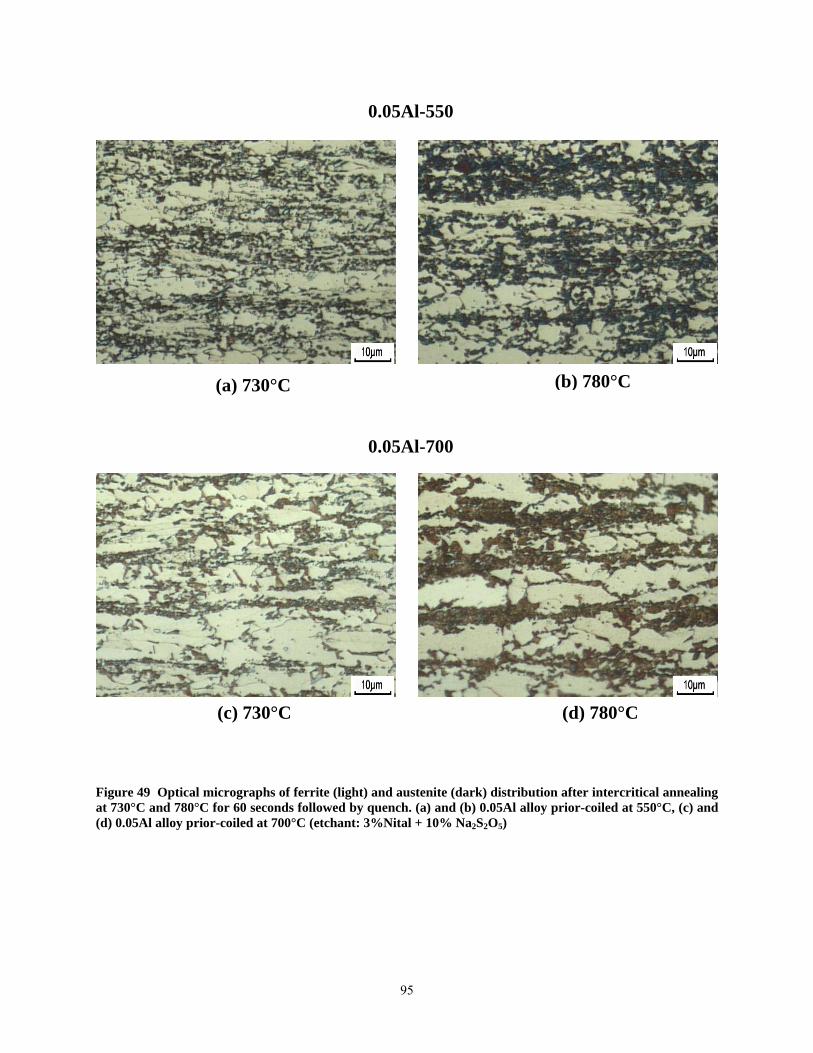
0.05Al-550
(b) 780°C
0.05Al-700
(a) 730°C
(c) 730°C (d) 780°C
Figure 49 Optical micrographs of ferrite (light) and austenite (dark) distribution after intercritical annealing at 730°C and 780°C for 60 seconds followed by quench. (a) and (b) 0.05Al alloy prior-coiled at 550°C, (c) and (d) 0.05Al alloy prior-coiled at 700°C (etchant: 3%Nital + 10% Na2S2O5)
95

The effect of prior coiling temperature on the austenite volume fraction is notably reduced with
an increase in Al addition to 0.5 and 1.0 wt%, as shown in Figure 50 and Figure 51. Note that the
variation of the coiling temperature in the difference in the austenite volume fraction is less than
5%. Similarly, it is also clear that an increasing Al content increases the Ac3 temperature, and
hence higher intercritical annealing temperatures must be used to obtain similar austenite volume
fractions. Figure 51 and Figure 52 show the typical distribution of austenite found in the 0.5Al
and 1.0Al alloys, respectively. In the latter, it can be observed that the austenite distribution
differs from the 0.05 and 0.5Al alloys, and has shifted from a banded distribution into a necklace
type distribution around the ferrite grains.
Austenite Volume Fraction, Alloy 6 (0.5Al)
0
10
20
30
40
50
60
70
80
90
100
600 650 700 750 800 850 900 950 1000
Temperature (C)
Aus
teni
te V
f
CT=700 CT=550
Figure 50 Austenite volume fraction vs intercritical annealing temperature (after 60secs), 0.5Al alloy
96
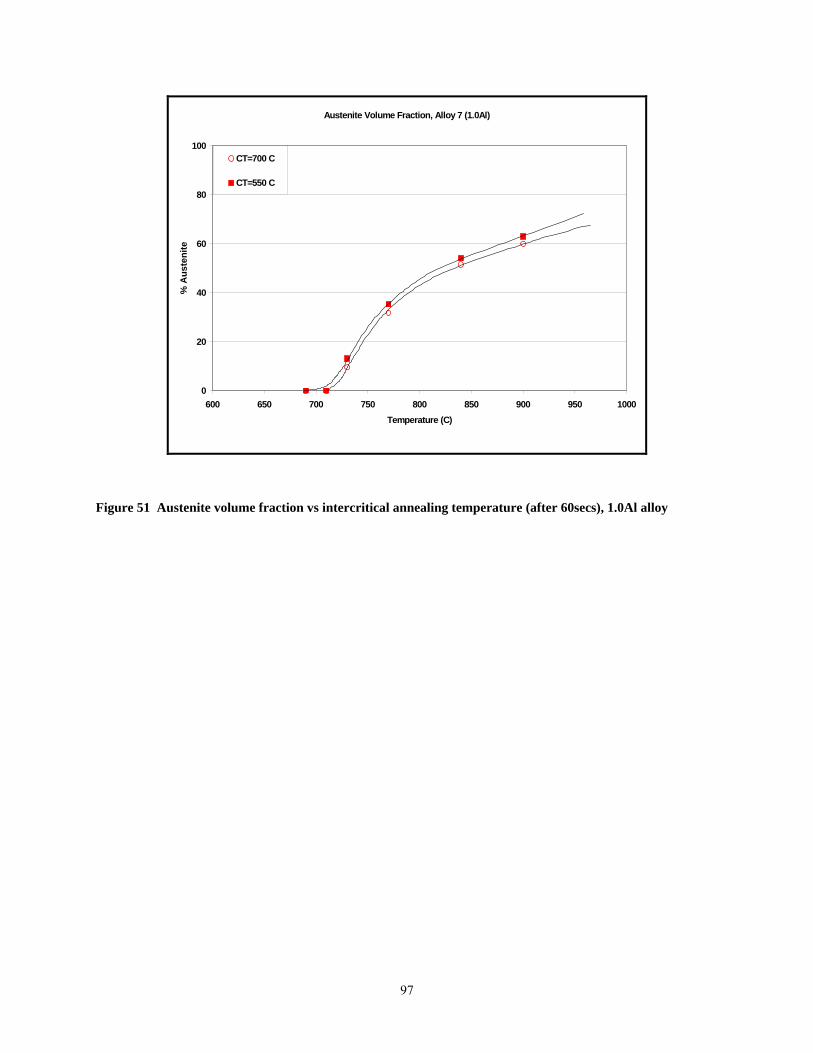
Austenite Volume Fraction, Alloy 7 (1.0Al)
0
20
40
60
80
100
600 650 700 750 800 850 900 950 1000Temperature (C)
% A
uste
nite
CT=700 C
CT=550 C
Figure 51 Austenite volume fraction vs intercritical annealing temperature (after 60secs), 1.0Al alloy
97
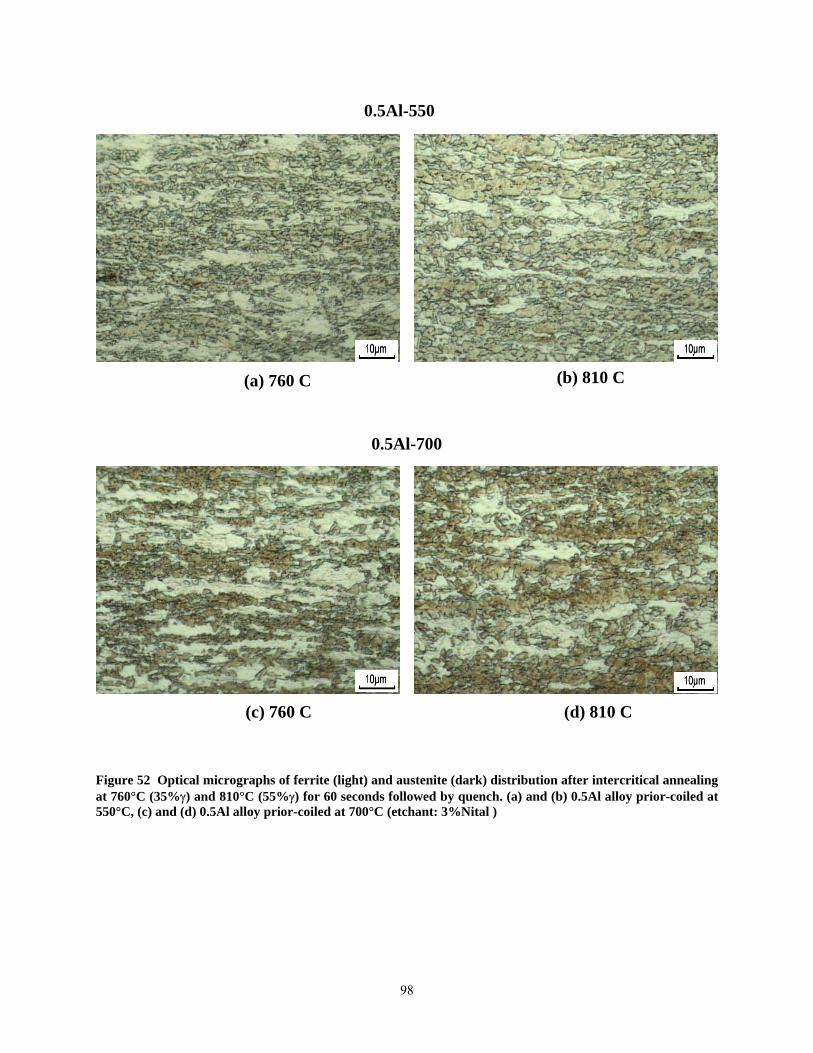
0.5Al-550
(b) 810 C
0.5Al-700
(a) 760 C
(c) 760 C (d) 810 C
Figure 52 Optical micrographs of ferrite (light) and austenite (dark) distribution after intercritical annealing at 760°C (35%γ) and 810°C (55%γ) for 60 seconds followed by quench. (a) and (b) 0.5Al alloy prior-coiled at 550°C, (c) and (d) 0.5Al alloy prior-coiled at 700°C (etchant: 3%Nital )
98
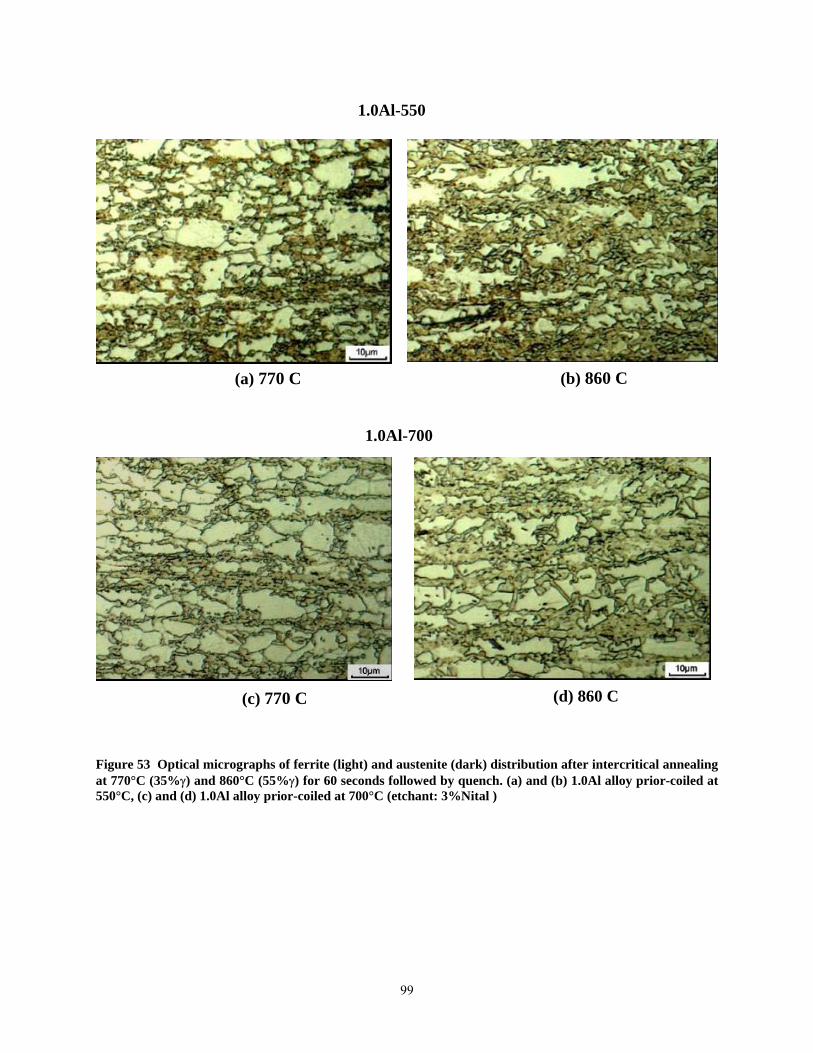
1.0Al-550
(b) 860 C (a) 770 C
1.0Al-700
(d) 860 C (c) 770 C
Figure 53 Optical micrographs of ferrite (light) and austenite (dark) distribution after intercritical annealing at 770°C (35%γ) and 860°C (55%γ) for 60 seconds followed by quench. (a) and (b) 1.0Al alloy prior-coiled at 550°C, (c) and (d) 1.0Al alloy prior-coiled at 700°C (etchant: 3%Nital )
99
5.2 STAGE II - AUSTENITE DECOMPOSITION DURING COOLING FROM THE INTERCRITICAL ANNEALING TEMPERATURE (TIA) TO THE
ISOTHERMAL HOLDING TEMPERATURE (IHT)
5.2.1 CCT diagrams
The austenite decomposition behavior during cooling was studied in the three Al-bearing TRIP
steels. The effects of annealing temperature (initial austenite percent) and prior coiling
temperature on the behavior during cooling at different rates to room temperature, as well as
cooling to the isothermal bainitic (holding) temperature were investigated.
Figure 54 and Figure 55 show the continuous cooling transformation diagrams (CCT) of
the 0.05Al-550, for an initial austenite percent of 35% (750°C) and 55% (790°C) respectively. In
the first case, it is observed that epitaxial or “new” ferrite is formed during cooling in the
temperature range of 705°C and ceases at ~620°C at essentially all cooling rates. Ferritic bainite
forms at a temperature close to 460°C at both 15 and 30°C/sec, and this start temperature
increases to 540°C at slower cooling rates, 1°C/sec. Furthermore, granular bainite is also
observed when cooling at 1 °C/sec. When cooling from an initial γ=55% condition, both ferrite
and bainitic ferrite start temperatures increased. Also, no granular bainite was found when
cooling at 1°C/sec. Furthermore, there appears to be a low temperature phase transformation,
presumably a martensitic phase transformation at both 30°C/sec and 15°C/sec in the range of
350°C - 250°C. The observed typical microstructures after different cooling rates from
TIA=790°C (55%γ) are shown in Figure 56. Similarly, the effect of a higher prior coiling
temperature, 0.05Al-700, on the CCT diagram, i.e., new ferrite and bainitic ferrite start and
finishing temperatures is shown in Figure 60 for an initial austenite percent of 35% (765°C).
100
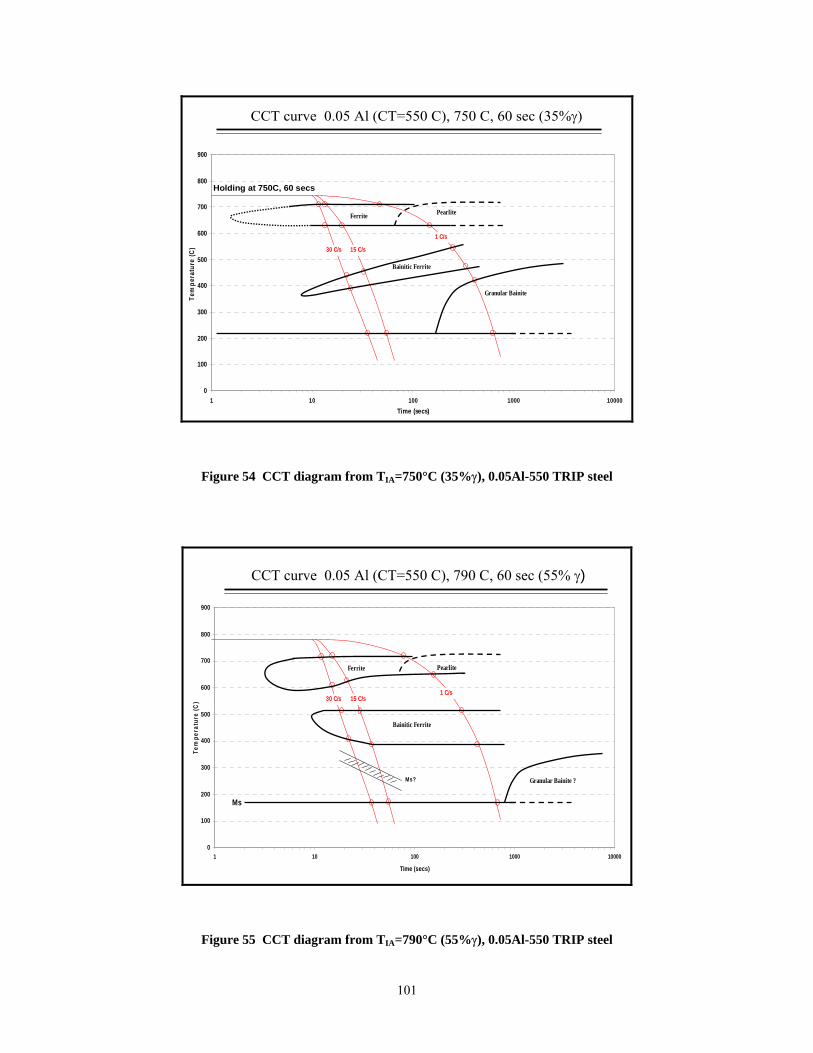
CCT curve 0.05 Al (CT=550 C), 750 C, 60 sec (35%γ)
0
100
200
300
400
500
600
700
800
900
1 10 100 1000 10000Time (secs)
Tem
pera
ture
(C)
Ferrite Pearlite
Bainitic Ferrite
Granular Bainite
30 C/s 15 C/s
1 C/s
Holding at 750C, 60 secs
Figure 54 CCT diagram from TIA=750°C (35%γ), 0.05Al-550 TRIP steel
CCT curve 0.05 Al (CT=550 C), 790 C, 60 sec (55% γ)
0
100
200
300
400
500
600
700
800
900
1 10 100 1000 10000
Time (secs)
Tem
pera
ture
(C)
Ferrite Pearlite
Bainitic Ferrite
Granular Bainite ?
30 C/s 15 C/s1 C/s
Ms
Ms?
Figure 55 CCT diagram from TIA=790°C (55%γ), 0.05Al-550 TRIP steel
101
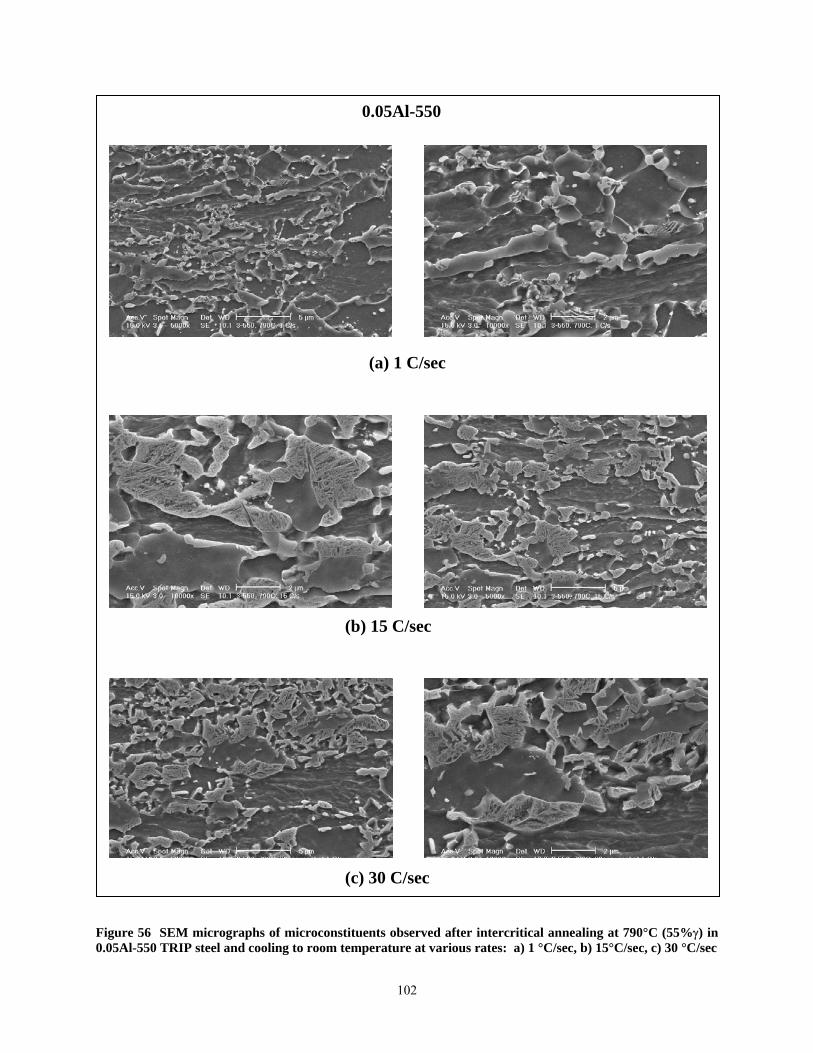
0.05Al-550
(a) 1 C/sec
(b) 15 C/sec
(c) 30 C/sec
Figure 56 SEM micrographs of microconstituents observed after intercritical annealing at 790°C (55%γ) in 0.05Al-550 TRIP steel and cooling to room temperature at various rates: a) 1 °C/sec, b) 15°C/sec, c) 30 °C/sec
102
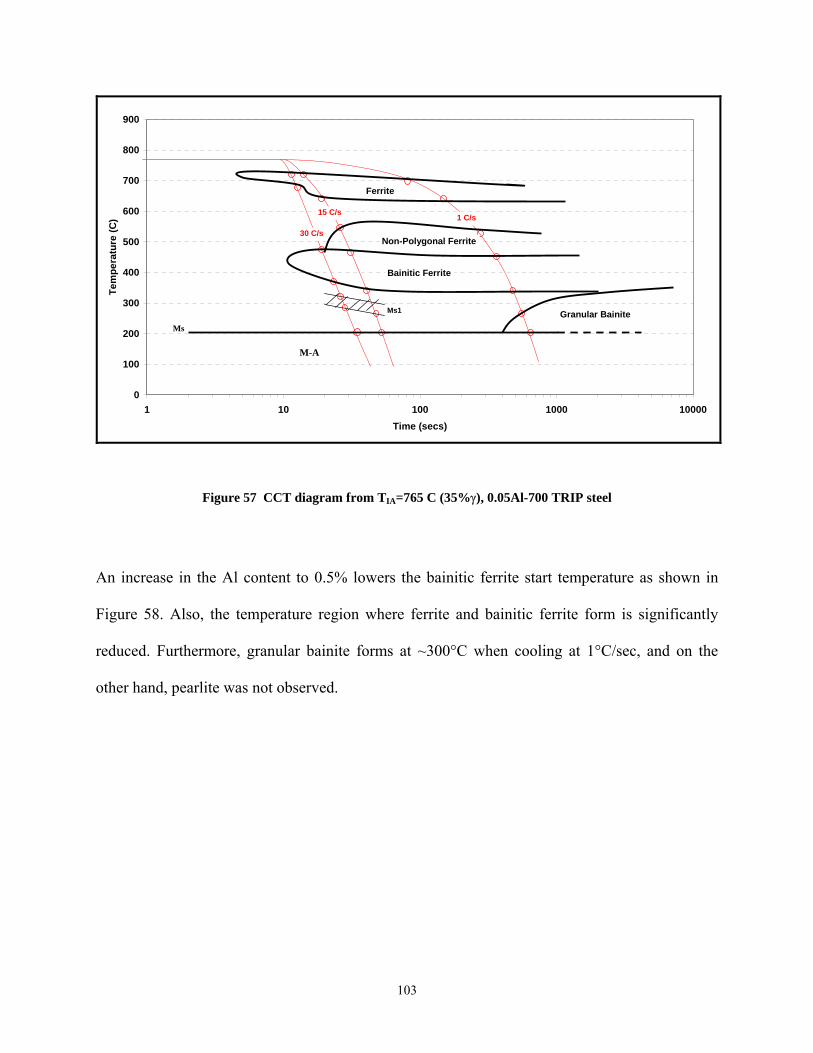
0
100
200
300
400
500
600
700
800
900
1 10 100 1000 10000Time (secs)
Tem
pera
ture
(C)
30 C/s
15 C/s 1 C/s
Ms
M-A
Ms1 Granular Bainite
Bainitic Ferrite
Non-Polygonal Ferrite
Ferrite
Figure 57 CCT diagram from TIA=765 C (35%γ), 0.05Al-700 TRIP steel
An increase in the Al content to 0.5% lowers the bainitic ferrite start temperature as shown in
Figure 58. Also, the temperature region where ferrite and bainitic ferrite form is significantly
reduced. Furthermore, granular bainite forms at ~300°C when cooling at 1°C/sec, and on the
other hand, pearlite was not observed.
103
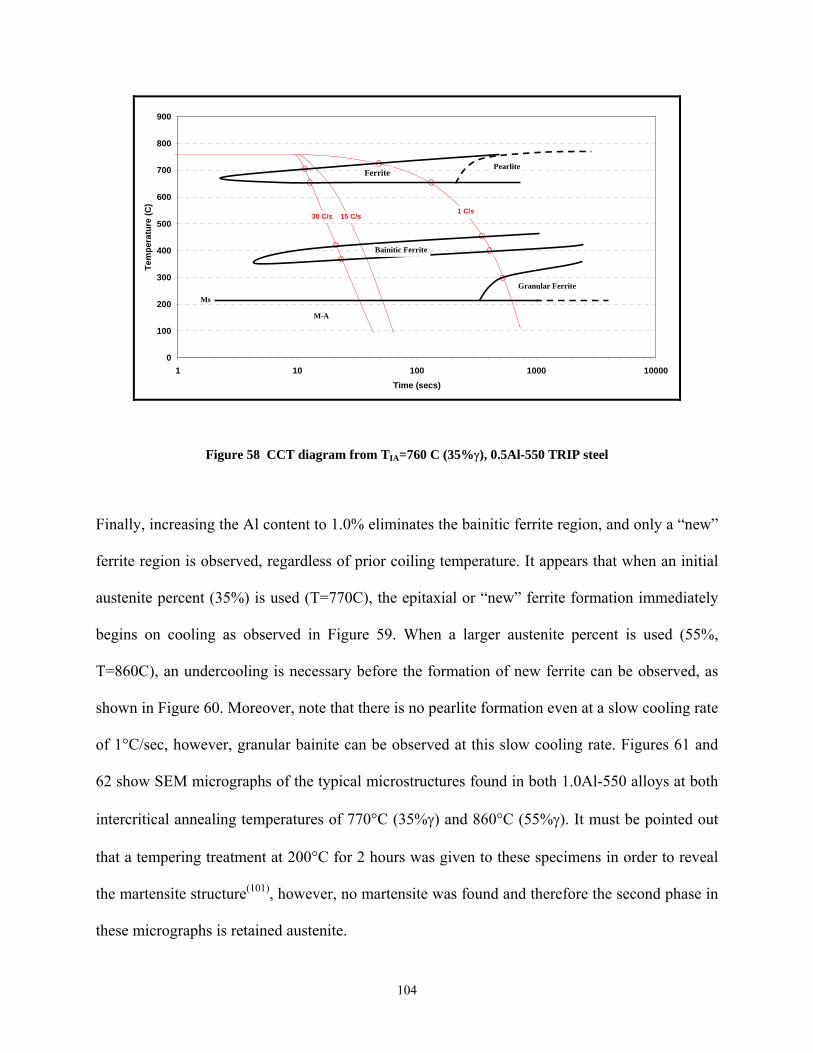
0
100
200
300
400
500
600
700
800
900
1 10 100 1000 10000Time (secs)
Tem
pera
ture
(C)
30 C/s 15 C/s1 C/s
Ms
M-A
Ferrite
Bainitic Ferrite
Granular Ferrite
Pearlite
Figure 58 CCT diagram from TIA=760 C (35%γ), 0.5Al-550 TRIP steel
Finally, increasing the Al content to 1.0% eliminates the bainitic ferrite region, and only a “new”
ferrite region is observed, regardless of prior coiling temperature. It appears that when an initial
austenite percent (35%) is used (T=770C), the epitaxial or “new” ferrite formation immediately
begins on cooling as observed in Figure 59. When a larger austenite percent is used (55%,
T=860C), an undercooling is necessary before the formation of new ferrite can be observed, as
shown in Figure 60. Moreover, note that there is no pearlite formation even at a slow cooling rate
of 1°C/sec, however, granular bainite can be observed at this slow cooling rate. Figures 61 and
62 show SEM micrographs of the typical microstructures found in both 1.0Al-550 alloys at both
intercritical annealing temperatures of 770°C (35%γ) and 860°C (55%γ). It must be pointed out
that a tempering treatment at 200°C for 2 hours was given to these specimens in order to reveal
the martensite structure(101), however, no martensite was found and therefore the second phase in
these micrographs is retained austenite.
104
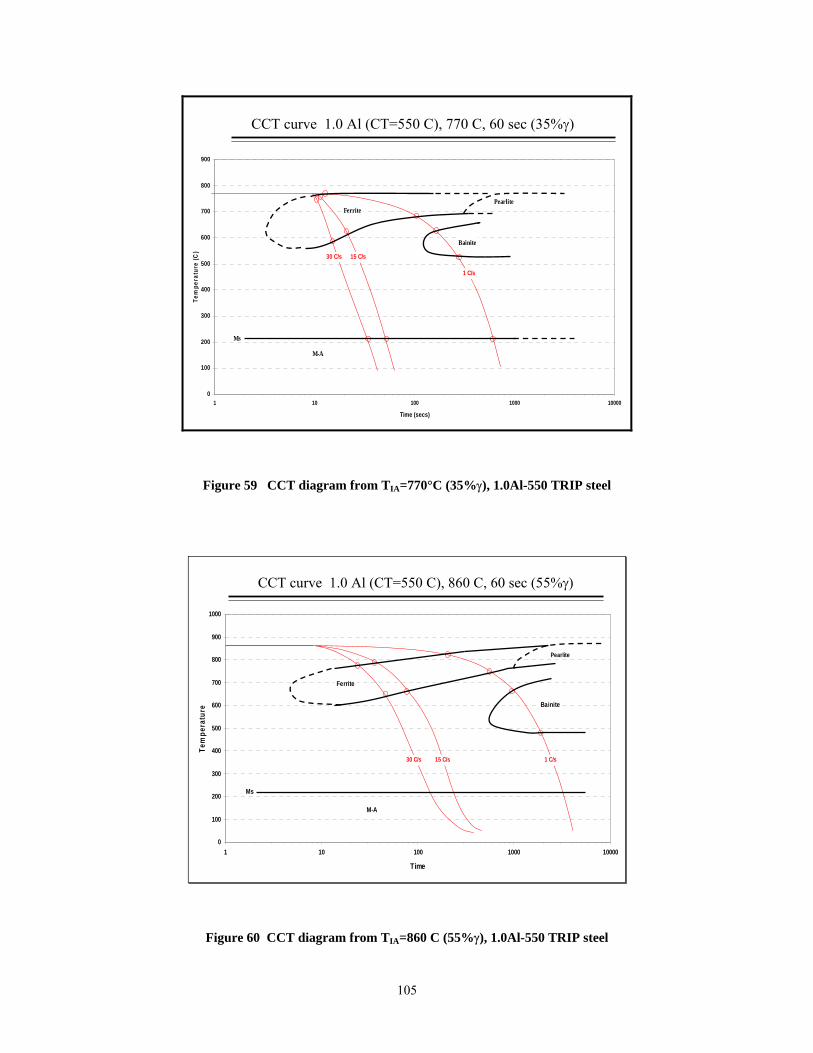
0
100
200
300
400
500
600
700
800
900
1 10 100 1000 10000
Time (secs)
Tem
pera
ture
(C)
Ferrite
Bainite
30 C/s 15 C/s
1 C/s
Pearlite
Ms
M-A
CCT curve 1.0 Al (CT=550 C), 770 C, 60 sec (35%γ)
Figure 59 CCT diagram from TIA=770°C (35%γ), 1.0Al-550 TRIP steel
CCT curve 1.0 Al (CT=550 C), 860 C, 60 sec (55%γ)
0
100
200
300
400
500
600
700
800
900
1000
1 10 100 1000 10000
Time
Tem
pera
ture
30 C/s 15 C/s 1 C/s
Ms
Ferrite
Bainite
Pearlite
M-A
Figure 60 CCT diagram from TIA=860 C (55%γ), 1.0Al-550 TRIP steel
105
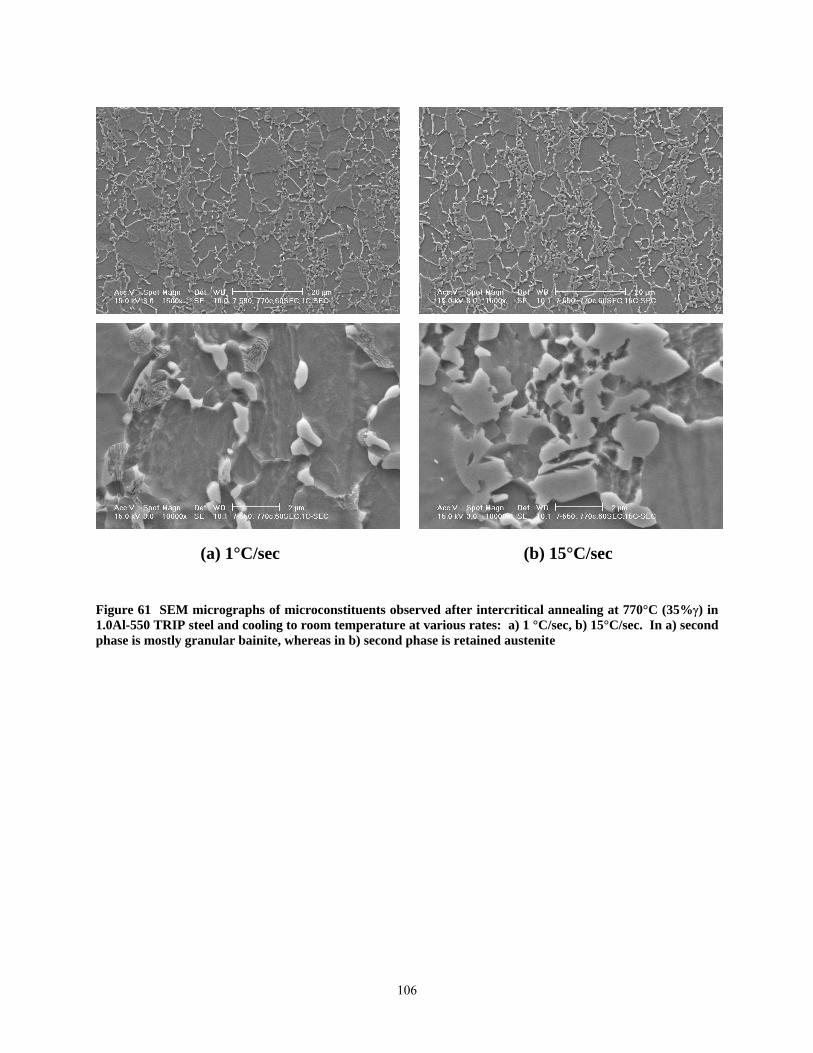
(a) 1°C/sec (b) 15°C/sec
Figure 61 SEM micrographs of microconstituents observed after intercritical annealing at 770°C (35%γ) in 1.0Al-550 TRIP steel and cooling to room temperature at various rates: a) 1 °C/sec, b) 15°C/sec. In a) second phase is mostly granular bainite, whereas in b) second phase is retained austenite
106
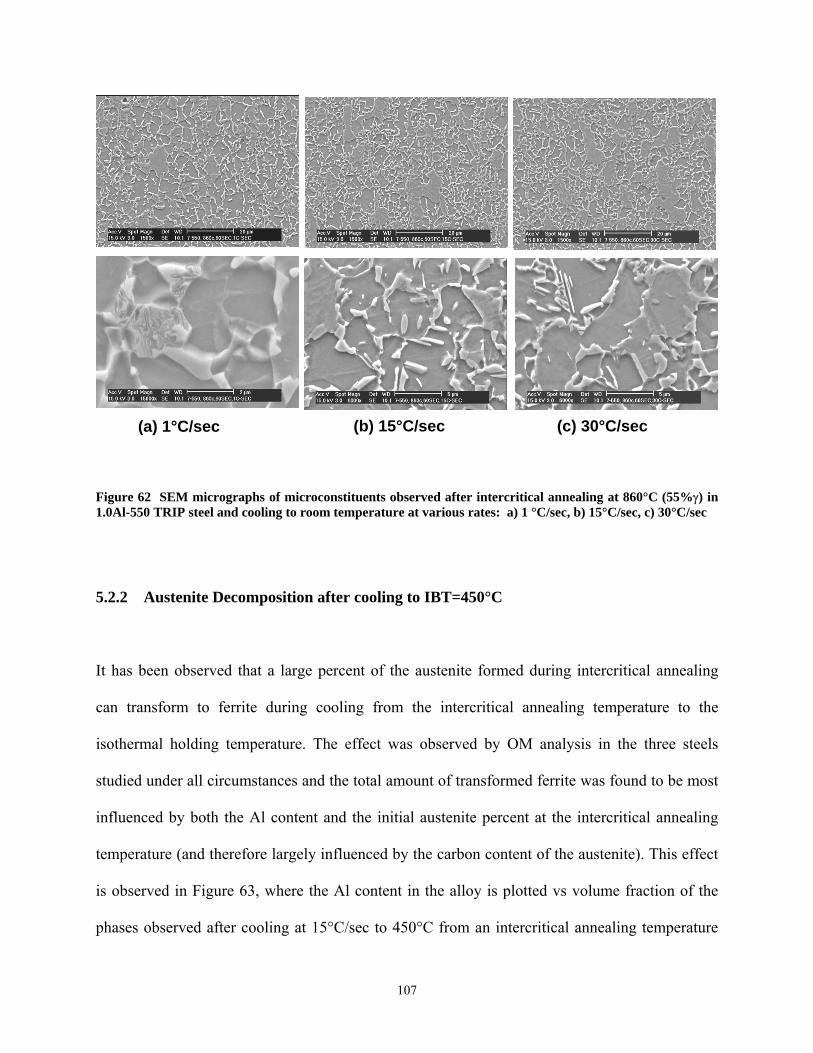
(b) 15°C/sec (c) 30°C/sec (a) 1°C/sec
Figure 62 SEM micrographs of microconstituents observed after intercritical annealing at 860°C (55%γ) in 1.0Al-550 TRIP steel and cooling to room temperature at various rates: a) 1 °C/sec, b) 15°C/sec, c) 30°C/sec
5.2.2 Austenite Decomposition after cooling to IBT=450°C
It has been observed that a large percent of the austenite formed during intercritical annealing
can transform to ferrite during cooling from the intercritical annealing temperature to the
isothermal holding temperature. The effect was observed by OM analysis in the three steels
studied under all circumstances and the total amount of transformed ferrite was found to be most
influenced by both the Al content and the initial austenite percent at the intercritical annealing
temperature (and therefore largely influenced by the carbon content of the austenite). This effect
is observed in Figure 63, where the Al content in the alloy is plotted vs volume fraction of the
phases observed after cooling at 15°C/sec to 450°C from an intercritical annealing temperature
107
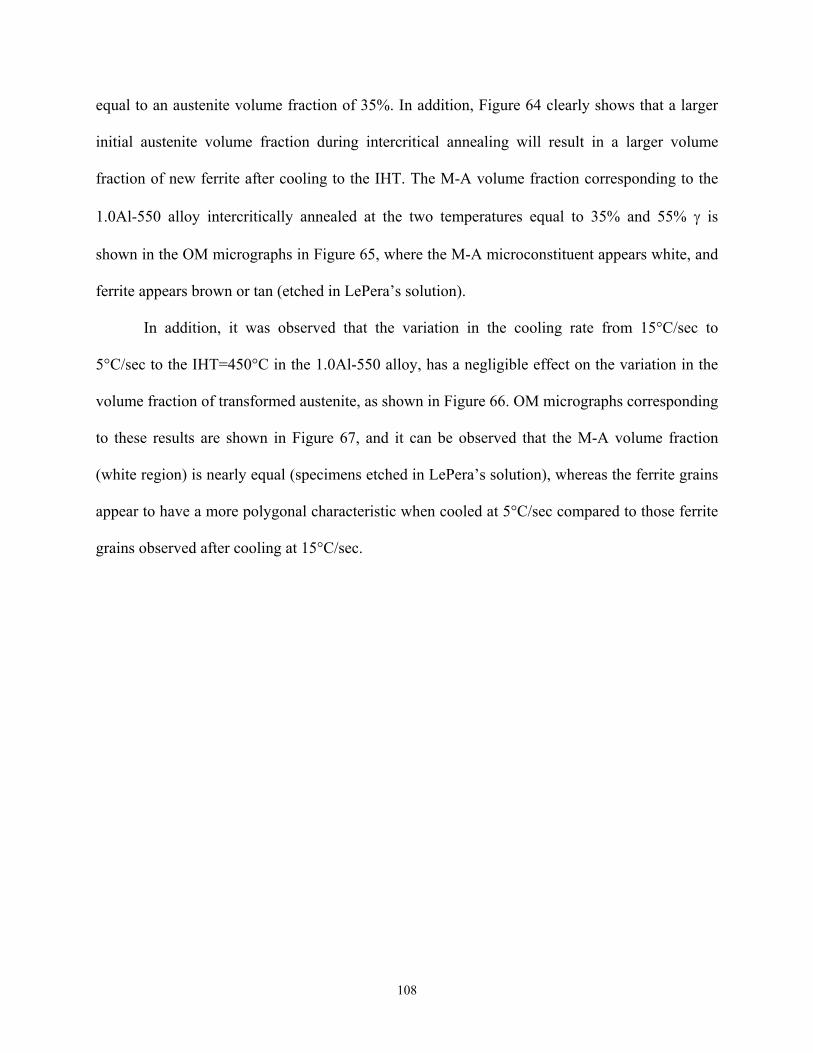
equal to an austenite volume fraction of 35%. In addition, Figure 64 clearly shows that a larger
initial austenite volume fraction during intercritical annealing will result in a larger volume
fraction of new ferrite after cooling to the IHT. The M-A volume fraction corresponding to the
1.0Al-550 alloy intercritically annealed at the two temperatures equal to 35% and 55% γ is
shown in the OM micrographs in Figure 65, where the M-A microconstituent appears white, and
ferrite appears brown or tan (etched in LePera’s solution).
In addition, it was observed that the variation in the cooling rate from 15°C/sec to
5°C/sec to the IHT=450°C in the 1.0Al-550 alloy, has a negligible effect on the variation in the
volume fraction of transformed austenite, as shown in Figure 66. OM micrographs corresponding
to these results are shown in Figure 67, and it can be observed that the M-A volume fraction
(white region) is nearly equal (specimens etched in LePera’s solution), whereas the ferrite grains
appear to have a more polygonal characteristic when cooled at 5°C/sec compared to those ferrite
grains observed after cooling at 15°C/sec.
108
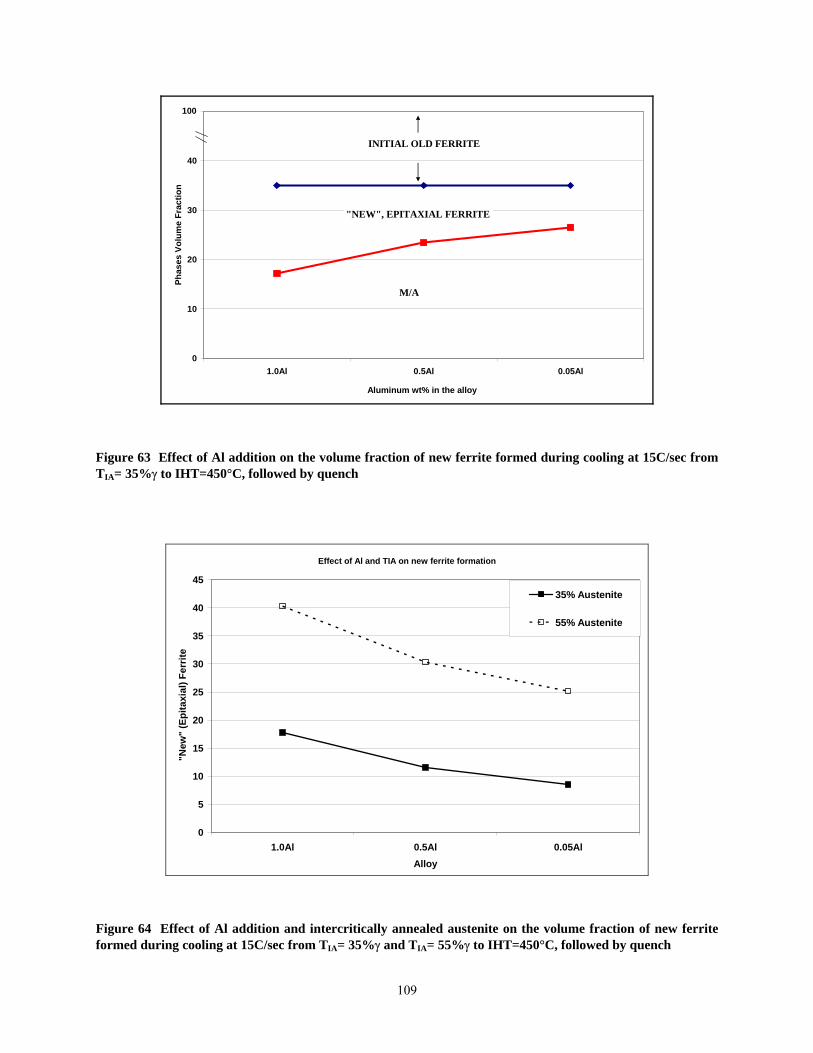
0
10
20
30
40
50
1.0Al 0.5Al 0.05Al
Aluminum wt% in the alloy
Phas
es V
olum
e Fr
actio
n
"NEW", EPITAXIAL FERRITE
INITIAL OLD FERRITE
M/A
100
Figure 63 Effect of Al addition on the volume fraction of new ferrite formed during cooling at 15C/sec from TIA= 35%γ to IHT=450°C, followed by quench
Effect of Al and TIA on new ferrite formation
0
5
10
15
20
25
30
35
40
45
1.0Al 0.5Al 0.05AlAlloy
"New
" (E
pita
xial
) Fer
rite
35% Austenite
55% Austenite
Figure 64 Effect of Al addition and intercritically annealed austenite on the volume fraction of new ferrite formed during cooling at 15C/sec from TIA= 35%γ and TIA= 55%γ to IHT=450°C, followed by quench
109
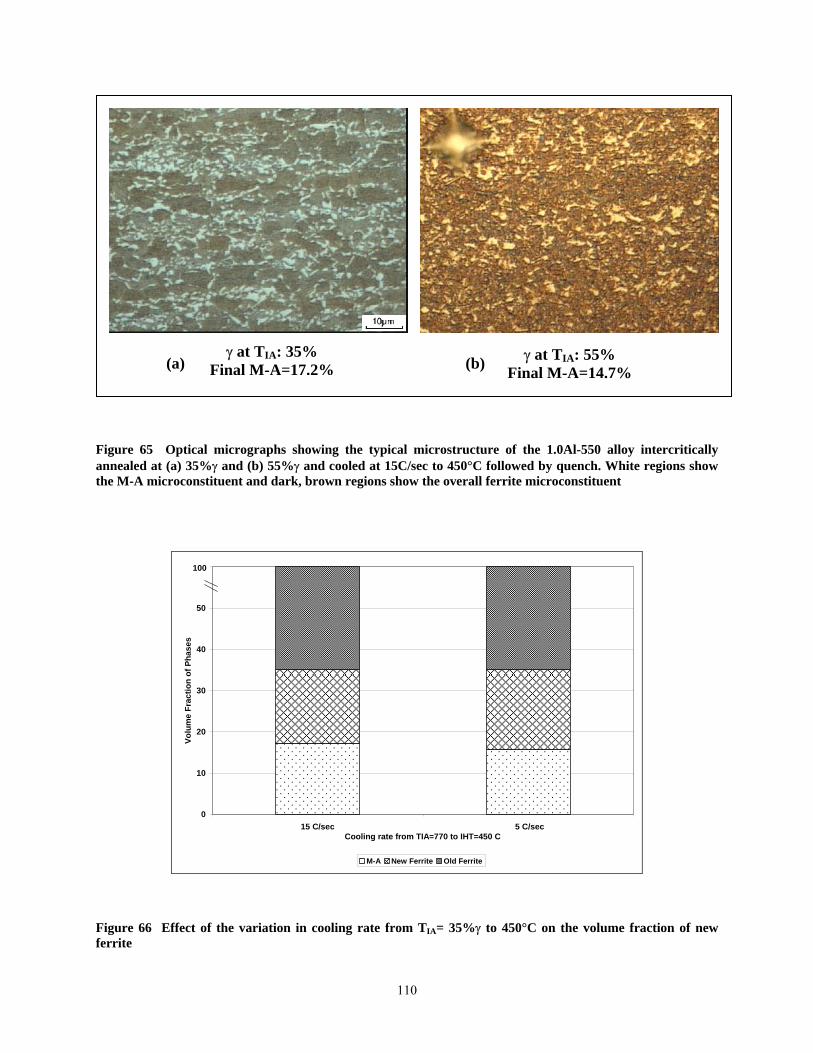
γ at TIA: 35% γ at TIA: 55% (a) (b) Final M-A=17.2% Final M-A=14.7%
Figure 65 Optical micrographs showing the typical microstructure of the 1.0Al-550 alloy intercritically annealed at (a) 35%γ and (b) 55%γ and cooled at 15C/sec to 450°C followed by quench. White regions show the M-A microconstituent and dark, brown regions show the overall ferrite microconstituent
0
10
20
30
40
50
60
15 C/sec 5 C/secCooling rate from TIA=770 to IHT=450 C
Volu
me
Frac
tion
of P
hase
s
M-A New Ferrite Old Ferrite
100
Figure 66 Effect of the variation in cooling rate from TIA= 35%γ to 450°C on the volume fraction of new ferrite
110
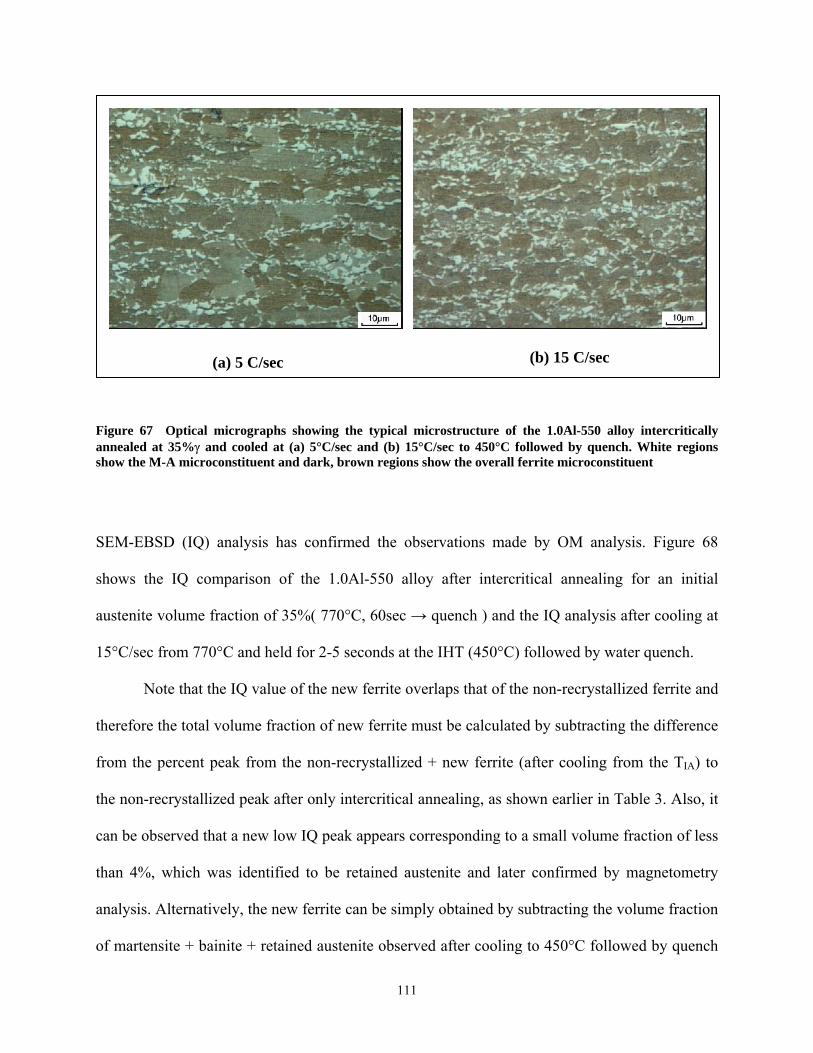
(b) 15 C/sec (a) 5 C/sec
Figure 67 Optical micrographs showing the typical microstructure of the 1.0Al-550 alloy intercritically annealed at 35%γ and cooled at (a) 5°C/sec and (b) 15°C/sec to 450°C followed by quench. White regions show the M-A microconstituent and dark, brown regions show the overall ferrite microconstituent
SEM-EBSD (IQ) analysis has confirmed the observations made by OM analysis. Figure 68
shows the IQ comparison of the 1.0Al-550 alloy after intercritical annealing for an initial
austenite volume fraction of 35%( 770°C, 60sec → quench ) and the IQ analysis after cooling at
15°C/sec from 770°C and held for 2-5 seconds at the IHT (450°C) followed by water quench.
Note that the IQ value of the new ferrite overlaps that of the non-recrystallized ferrite and
therefore the total volume fraction of new ferrite must be calculated by subtracting the difference
from the percent peak from the non-recrystallized + new ferrite (after cooling from the TIA) to
the non-recrystallized peak after only intercritical annealing, as shown earlier in Table 3. Also, it
can be observed that a new low IQ peak appears corresponding to a small volume fraction of less
than 4%, which was identified to be retained austenite and later confirmed by magnetometry
analysis. Alternatively, the new ferrite can be simply obtained by subtracting the volume fraction
of martensite + bainite + retained austenite observed after cooling to 450°C followed by quench
111
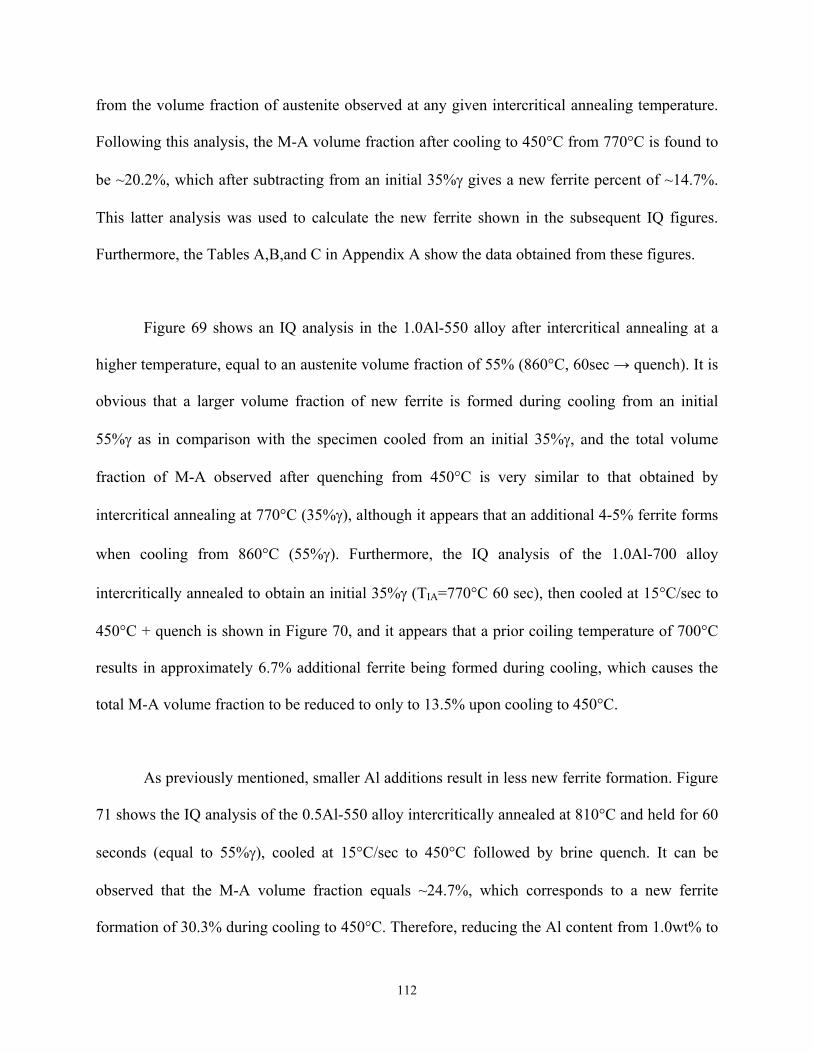
from the volume fraction of austenite observed at any given intercritical annealing temperature.
Following this analysis, the M-A volume fraction after cooling to 450°C from 770°C is found to
be ~20.2%, which after subtracting from an initial 35%γ gives a new ferrite percent of ~14.7%.
This latter analysis was used to calculate the new ferrite shown in the subsequent IQ figures.
Furthermore, the Tables A,B,and C in Appendix A show the data obtained from these figures.
Figure 69 shows an IQ analysis in the 1.0Al-550 alloy after intercritical annealing at a
higher temperature, equal to an austenite volume fraction of 55% (860°C, 60sec → quench). It is
obvious that a larger volume fraction of new ferrite is formed during cooling from an initial
55%γ as in comparison with the specimen cooled from an initial 35%γ, and the total volume
fraction of M-A observed after quenching from 450°C is very similar to that obtained by
intercritical annealing at 770°C (35%γ), although it appears that an additional 4-5% ferrite forms
when cooling from 860°C (55%γ). Furthermore, the IQ analysis of the 1.0Al-700 alloy
intercritically annealed to obtain an initial 35%γ (TIA=770°C 60 sec), then cooled at 15°C/sec to
450°C + quench is shown in Figure 70, and it appears that a prior coiling temperature of 700°C
results in approximately 6.7% additional ferrite being formed during cooling, which causes the
total M-A volume fraction to be reduced to only to 13.5% upon cooling to 450°C.
As previously mentioned, smaller Al additions result in less new ferrite formation. Figure
71 shows the IQ analysis of the 0.5Al-550 alloy intercritically annealed at 810°C and held for 60
seconds (equal to 55%γ), cooled at 15°C/sec to 450°C followed by brine quench. It can be
observed that the M-A volume fraction equals ~24.7%, which corresponds to a new ferrite
formation of 30.3% during cooling to 450°C. Therefore, reducing the Al content from 1.0wt% to
112
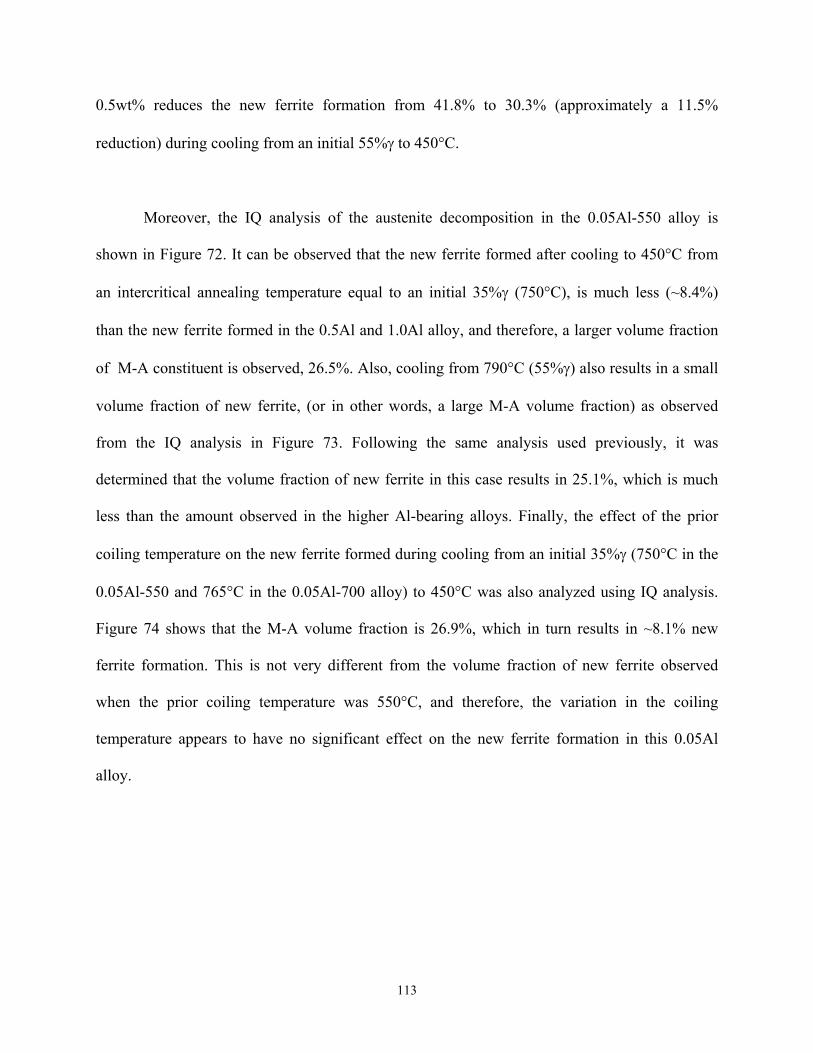
0.5wt% reduces the new ferrite formation from 41.8% to 30.3% (approximately a 11.5%
reduction) during cooling from an initial 55%γ to 450°C.
Moreover, the IQ analysis of the austenite decomposition in the 0.05Al-550 alloy is
shown in Figure 72. It can be observed that the new ferrite formed after cooling to 450°C from
an intercritical annealing temperature equal to an initial 35%γ (750°C), is much less (~8.4%)
than the new ferrite formed in the 0.5Al and 1.0Al alloy, and therefore, a larger volume fraction
of M-A constituent is observed, 26.5%. Also, cooling from 790°C (55%γ) also results in a small
volume fraction of new ferrite, (or in other words, a large M-A volume fraction) as observed
from the IQ analysis in Figure 73. Following the same analysis used previously, it was
determined that the volume fraction of new ferrite in this case results in 25.1%, which is much
less than the amount observed in the higher Al-bearing alloys. Finally, the effect of the prior
coiling temperature on the new ferrite formed during cooling from an initial 35%γ (750°C in the
0.05Al-550 and 765°C in the 0.05Al-700 alloy) to 450°C was also analyzed using IQ analysis.
Figure 74 shows that the M-A volume fraction is 26.9%, which in turn results in ~8.1% new
ferrite formation. This is not very different from the volume fraction of new ferrite observed
when the prior coiling temperature was 550°C, and therefore, the variation in the coiling
temperature appears to have no significant effect on the new ferrite formation in this 0.05Al
alloy.
113
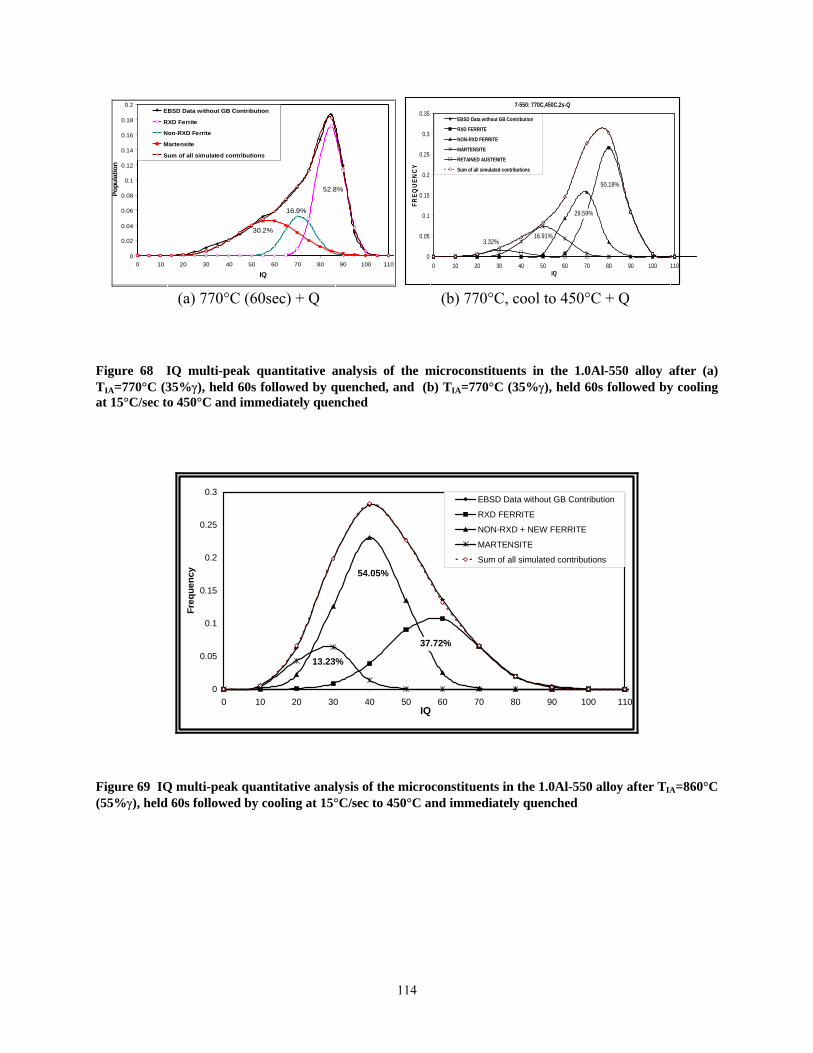
0
0.02
0.04
0.06
0.08
0.1
0.12
0.14
0.16
0.18
0.2
0 10 20 30 40 50 60 70 80 90 100 110
IQ
Popu
latio
nEBSD Data without GB Contribution
RXD Ferrite
Non-RXD Ferrite
Martensite
Sum of all simulated contributions
52.8%
16.9%
30.2%
7-550: 770C,450C,2s-Q
0
0.05
0.1
0.15
0.2
0.25
0.3
0.35
0 10 20 30 40 50 60 70 80 90 100 110IQ
FREQ
UEN
CY
EBSD Data without GB Contribution
RXD FERRITE
NON-RXD FERRITE
MARTENSITE
RETAINED AUSTENITE
Sum of all simulated contributions
50.18%
29.59%
16.91%3.32%
(a) 770°C (60sec) + Q (b) 770°C, cool to 450°C + Q
Figure 68 IQ multi-peak quantitative analysis of the microconstituents in the 1.0Al-550 alloy after (a) TIA=770°C (35%γ), held 60s followed by quenched, and (b) TIA=770°C (35%γ), held 60s followed by cooling at 15°C/sec to 450°C and immediately quenched
0
0.05
0.1
0.15
0.2
0.25
0.3
0 10 20 30 40 50 60 70 80 90 100 11IQ
Freq
uenc
y
0
EBSD Data without GB Contribution
RXD FERRITE
NON-RXD + NEW FERRITE
MARTENSITE
Sum of all simulated contributions
37.72%
13.23%
54.05%
Figure 69 IQ multi-peak quantitative analysis of the microconstituents in the 1.0Al-550 alloy after TIA=860°C (55%γ), held 60s followed by cooling at 15°C/sec to 450°C and immediately quenched
114
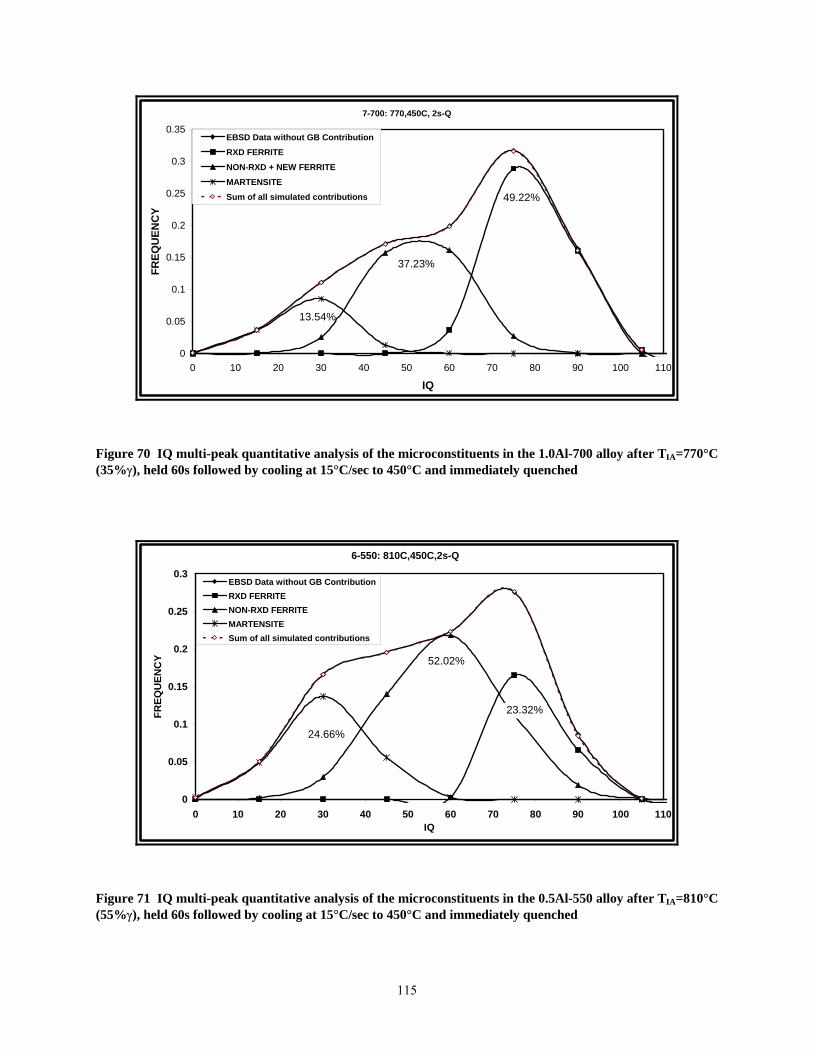
7-700: 770,450C, 2s-Q
0
0.05
0.1
0.15
0.2
0.25
0.3
0.35
0 10 20 30 40 50 60 70 80 90 100 1
IQ
FREQ
UEN
CY
10
EBSD Data without GB ContributionRXD FERRITENON-RXD + NEW FERRITEMARTENSITESum of all simulated contributions 49.22%
37.23%
13.54%
Figure 70 IQ multi-peak quantitative analysis of the microconstituents in the 1.0Al-700 alloy after TIA=770°C (35%γ), held 60s followed by cooling at 15°C/sec to 450°C and immediately quenched
6-550: 810C,450C,2s-Q
0
0.05
0.1
0.15
0.2
0.25
0.3
0 10 20 30 40 50 60 70 80 90 100 1IQ
FREQ
UEN
CY
10
EBSD Data without GB ContributionRXD FERRITENON-RXD FERRITEMARTENSITESum of all simulated contributions
52.02%
23.32%
24.66%
Figure 71 IQ multi-peak quantitative analysis of the microconstituents in the 0.5Al-550 alloy after TIA=810°C (55%γ), held 60s followed by cooling at 15°C/sec to 450°C and immediately quenched
115
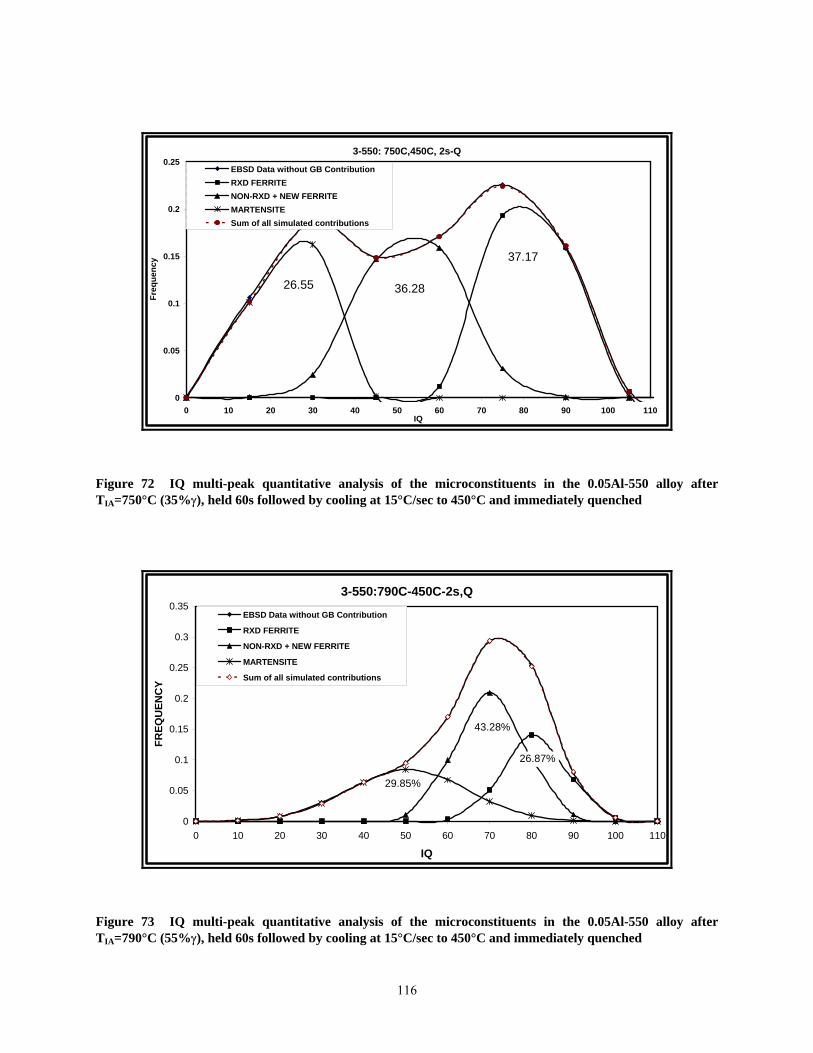
3-550: 750C,450C, 2s-Q
0
0.05
0.1
0.15
0.2
0.25
0 10 20 30 40 50 60 70 80 90 100 110IQ
Freq
uenc
y
EBSD Data without GB ContributionRXD FERRITENON-RXD + NEW FERRITEMARTENSITESum of all simulated contributions
37.17
36.2826.55
Figure 72 IQ multi-peak quantitative analysis of the microconstituents in the 0.05Al-550 alloy after TIA=750°C (35%γ), held 60s followed by cooling at 15°C/sec to 450°C and immediately quenched
3-550:790C-450C-2s,Q
0
0.05
0.1
0.15
0.2
0.25
0.3
0.35
0 10 20 30 40 50 60 70 80 90 100 1
IQ
FREQ
UEN
CY
10
EBSD Data without GB Contribution
RXD FERRITE
NON-RXD + NEW FERRITE
MARTENSITE
Sum of all simulated contributions
26.87%
43.28%
29.85%
Figure 73 IQ multi-peak quantitative analysis of the microconstituents in the 0.05Al-550 alloy after TIA=790°C (55%γ), held 60s followed by cooling at 15°C/sec to 450°C and immediately quenched
116
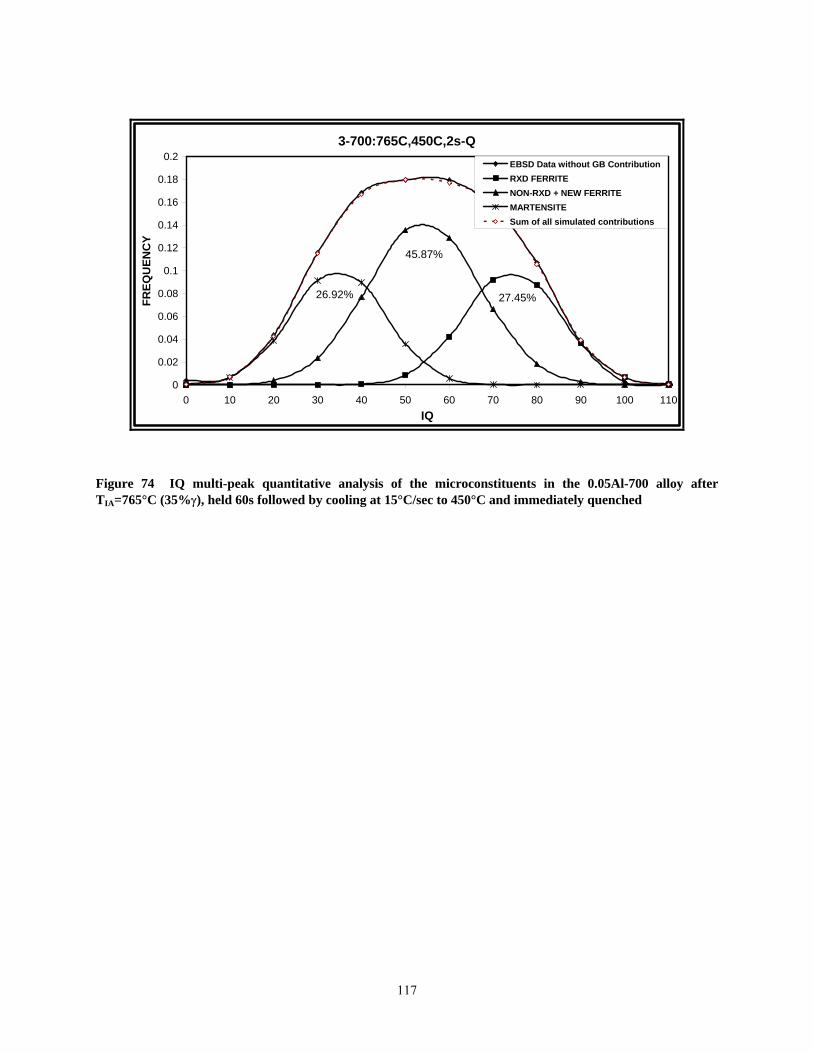
3-700:765C,450C,2s-Q
0
0.02
0.04
0.06
0.08
0.1
0.12
0.14
0.16
0.18
0.2
0 10 20 30 40 50 60 70 80 90 100 1IQ
FREQ
UEN
CY
10
EBSD Data without GB ContributionRXD FERRITENON-RXD + NEW FERRITEMARTENSITESum of all simulated contributions
27.45%
45.87%
26.92%
Figure 74 IQ multi-peak quantitative analysis of the microconstituents in the 0.05Al-700 alloy after TIA=765°C (35%γ), held 60s followed by cooling at 15°C/sec to 450°C and immediately quenched
117
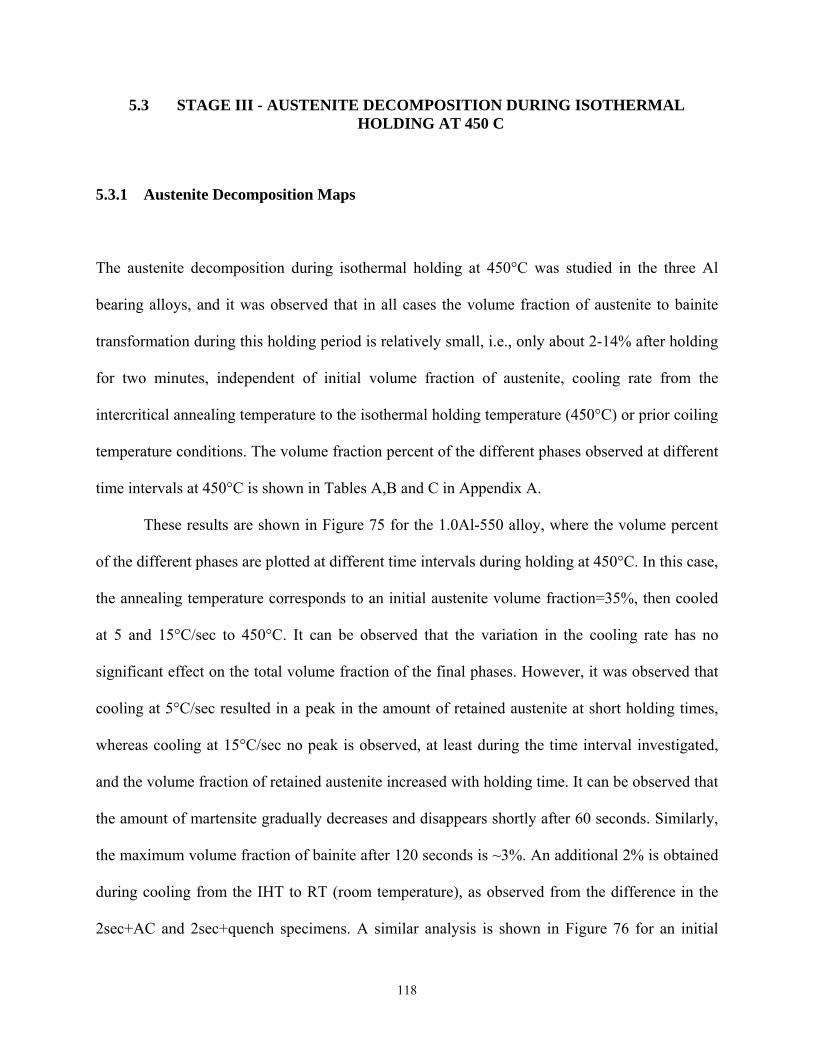
5.3 STAGE III - AUSTENITE DECOMPOSITION DURING ISOTHERMAL HOLDING AT 450 C
5.3.1 Austenite Decomposition Maps
The austenite decomposition during isothermal holding at 450°C was studied in the three Al
bearing alloys, and it was observed that in all cases the volume fraction of austenite to bainite
transformation during this holding period is relatively small, i.e., only about 2-14% after holding
for two minutes, independent of initial volume fraction of austenite, cooling rate from the
intercritical annealing temperature to the isothermal holding temperature (450°C) or prior coiling
temperature conditions. The volume fraction percent of the different phases observed at different
time intervals at 450°C is shown in Tables A,B and C in Appendix A.
These results are shown in Figure 75 for the 1.0Al-550 alloy, where the volume percent
of the different phases are plotted at different time intervals during holding at 450°C. In this case,
the annealing temperature corresponds to an initial austenite volume fraction=35%, then cooled
at 5 and 15°C/sec to 450°C. It can be observed that the variation in the cooling rate has no
significant effect on the total volume fraction of the final phases. However, it was observed that
cooling at 5°C/sec resulted in a peak in the amount of retained austenite at short holding times,
whereas cooling at 15°C/sec no peak is observed, at least during the time interval investigated,
and the volume fraction of retained austenite increased with holding time. It can be observed that
the amount of martensite gradually decreases and disappears shortly after 60 seconds. Similarly,
the maximum volume fraction of bainite after 120 seconds is ~3%. An additional 2% is obtained
during cooling from the IHT to RT (room temperature), as observed from the difference in the
2sec+AC and 2sec+quench specimens. A similar analysis is shown in Figure 76 for an initial
118
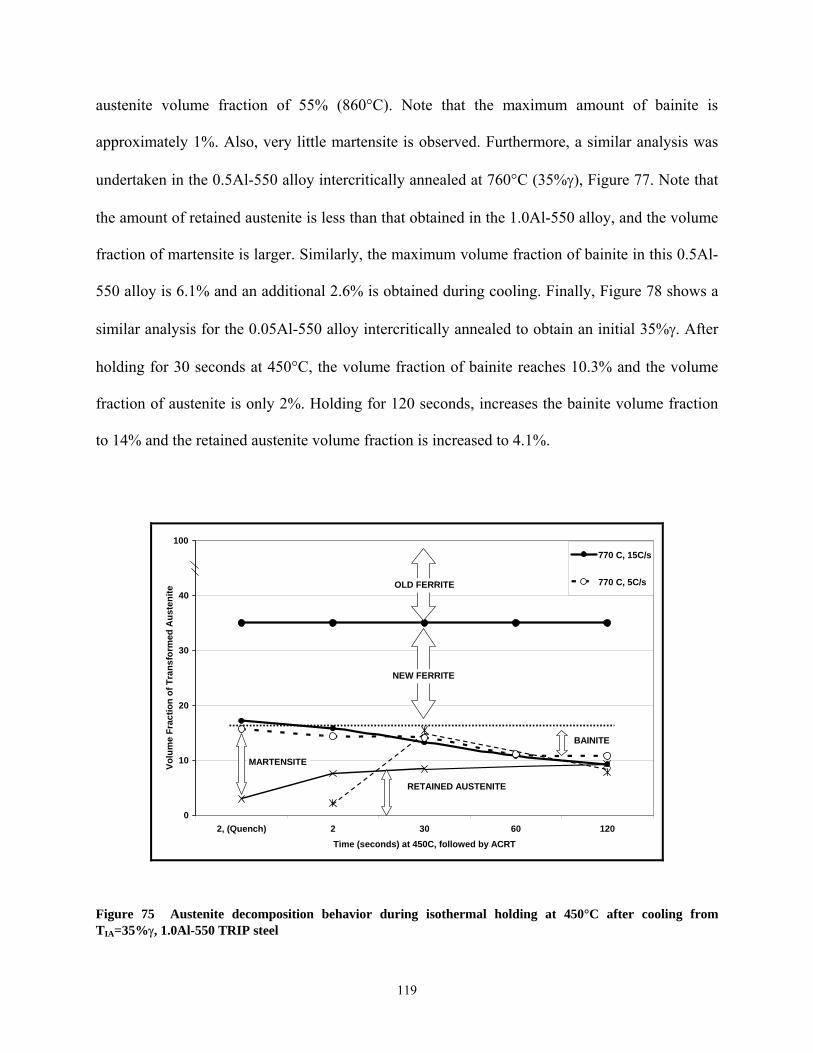
austenite volume fraction of 55% (860°C). Note that the maximum amount of bainite is
approximately 1%. Also, very little martensite is observed. Furthermore, a similar analysis was
undertaken in the 0.5Al-550 alloy intercritically annealed at 760°C (35%γ), Figure 77. Note that
the amount of retained austenite is less than that obtained in the 1.0Al-550 alloy, and the volume
fraction of martensite is larger. Similarly, the maximum volume fraction of bainite in this 0.5Al-
550 alloy is 6.1% and an additional 2.6% is obtained during cooling. Finally, Figure 78 shows a
similar analysis for the 0.05Al-550 alloy intercritically annealed to obtain an initial 35%γ. After
holding for 30 seconds at 450°C, the volume fraction of bainite reaches 10.3% and the volume
fraction of austenite is only 2%. Holding for 120 seconds, increases the bainite volume fraction
to 14% and the retained austenite volume fraction is increased to 4.1%.
0
10
20
30
40
50
2, (Quench) 2 30 60 120Time (seconds) at 450C, followed by ACRT
Volu
me
Frac
tion
of T
rans
form
ed A
uste
nite
770 C, 15C/s
770 C, 5C/s
100
NEW FERRITE
BAINITE
MARTENSITE
RETAINED AUSTENITE
OLD FERRITE
Figure 75 Austenite decomposition behavior during isothermal holding at 450°C after cooling from TIA=35%γ, 1.0Al-550 TRIP steel
119
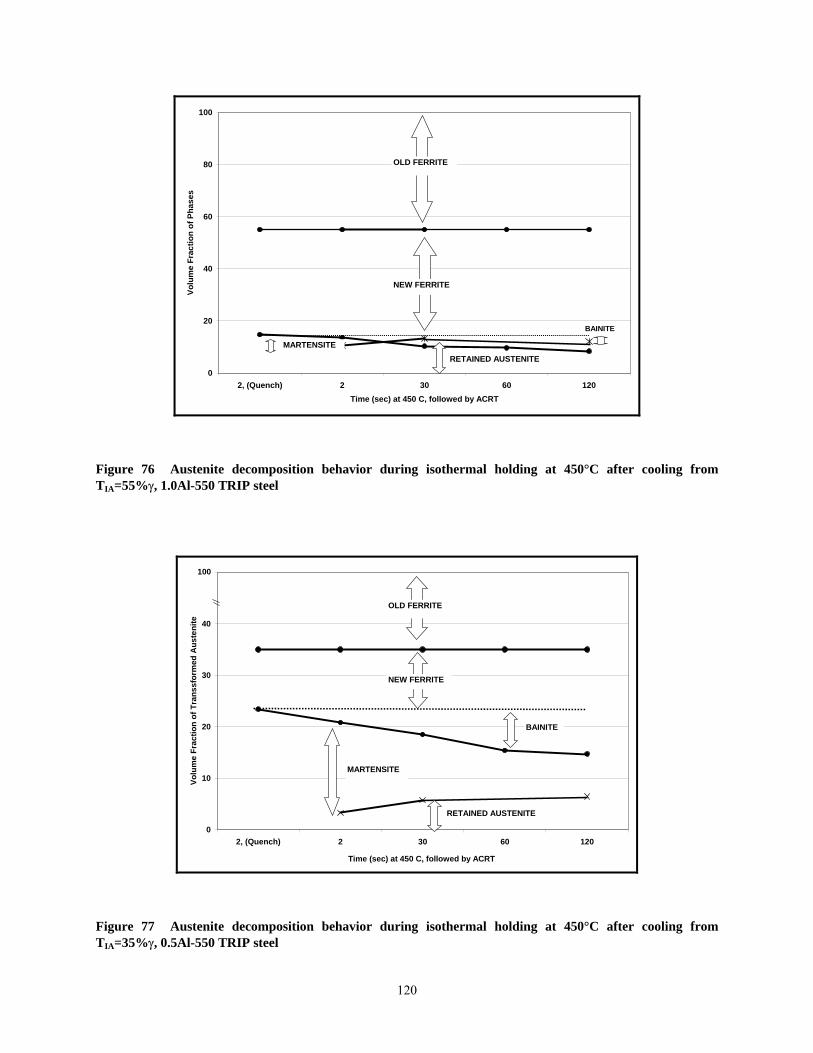
0
20
40
60
80
100
2, (Quench) 2 30 60 120Time (sec) at 450 C, followed by ACRT
Volu
me
Frac
tion
of P
hase
s
MARTENSITE
NEW FERRITE
BAINITE
RETAINED AUSTENITE
OLD FERRITE
Figure 76 Austenite decomposition behavior during isothermal holding at 450°C after cooling from TIA=55%γ, 1.0Al-550 TRIP steel
0
10
20
30
40
50
2, (Quench) 2 30 60 120
Time (sec) at 450 C, followed by ACRT
Volu
me
Frac
tion
of T
rans
sfor
med
Aus
teni
te
100
NEW FERRITE
BAINITE
MARTENSITE
RETAINED AUSTENITE
OLD FERRITE
Figure 77 Austenite decomposition behavior during isothermal holding at 450°C after cooling from TIA=35%γ, 0.5Al-550 TRIP steel
120
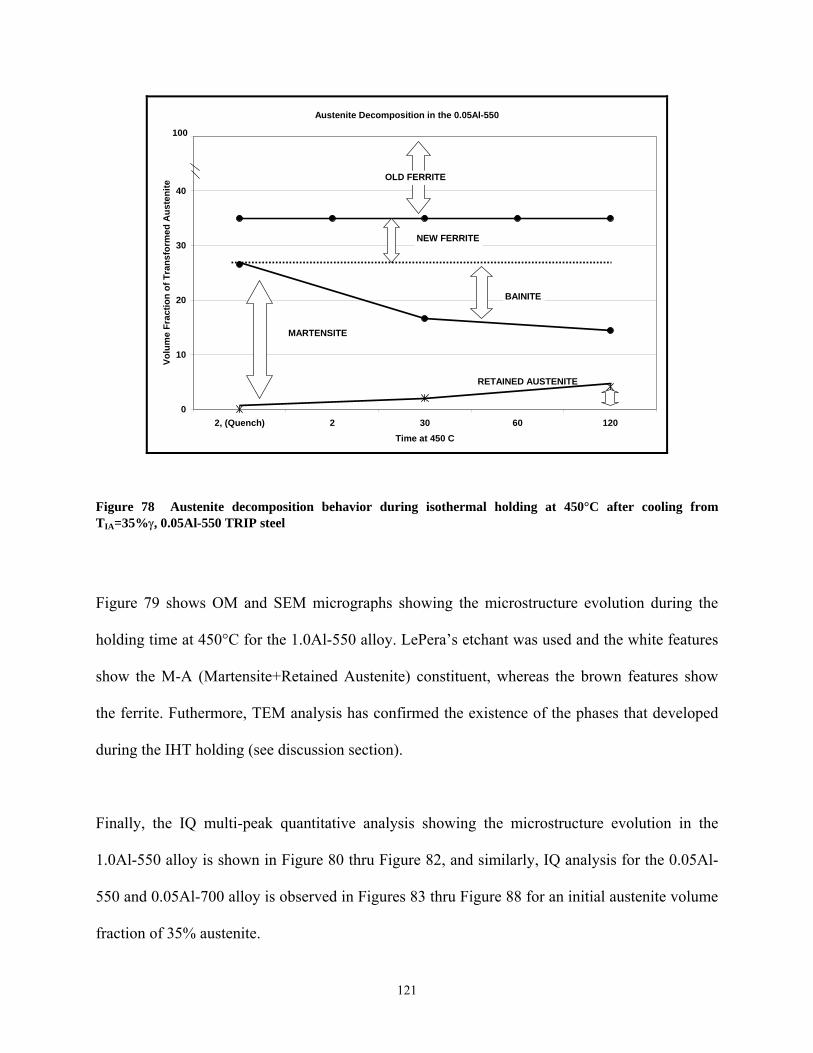
Austenite Decomposition in the 0.05Al-550
0
10
20
30
40
50
2, (Quench) 2 30 60 120Time at 450 C
Volu
me
Frac
tion
of T
rans
form
ed A
uste
nite
100
NEW FERRITE
BAINITE
MARTENSITE
RETAINED AUSTENITE
OLD FERRITE
Figure 78 Austenite decomposition behavior during isothermal holding at 450°C after cooling from TIA=35%γ, 0.05Al-550 TRIP steel
Figure 79 shows OM and SEM micrographs showing the microstructure evolution during the
holding time at 450°C for the 1.0Al-550 alloy. LePera’s etchant was used and the white features
show the M-A (Martensite+Retained Austenite) constituent, whereas the brown features show
the ferrite. Futhermore, TEM analysis has confirmed the existence of the phases that developed
during the IHT holding (see discussion section).
Finally, the IQ multi-peak quantitative analysis showing the microstructure evolution in the
1.0Al-550 alloy is shown in Figure 80 thru Figure 82, and similarly, IQ analysis for the 0.05Al-
550 and 0.05Al-700 alloy is observed in Figures 83 thru Figure 88 for an initial austenite volume
fraction of 35% austenite.
121
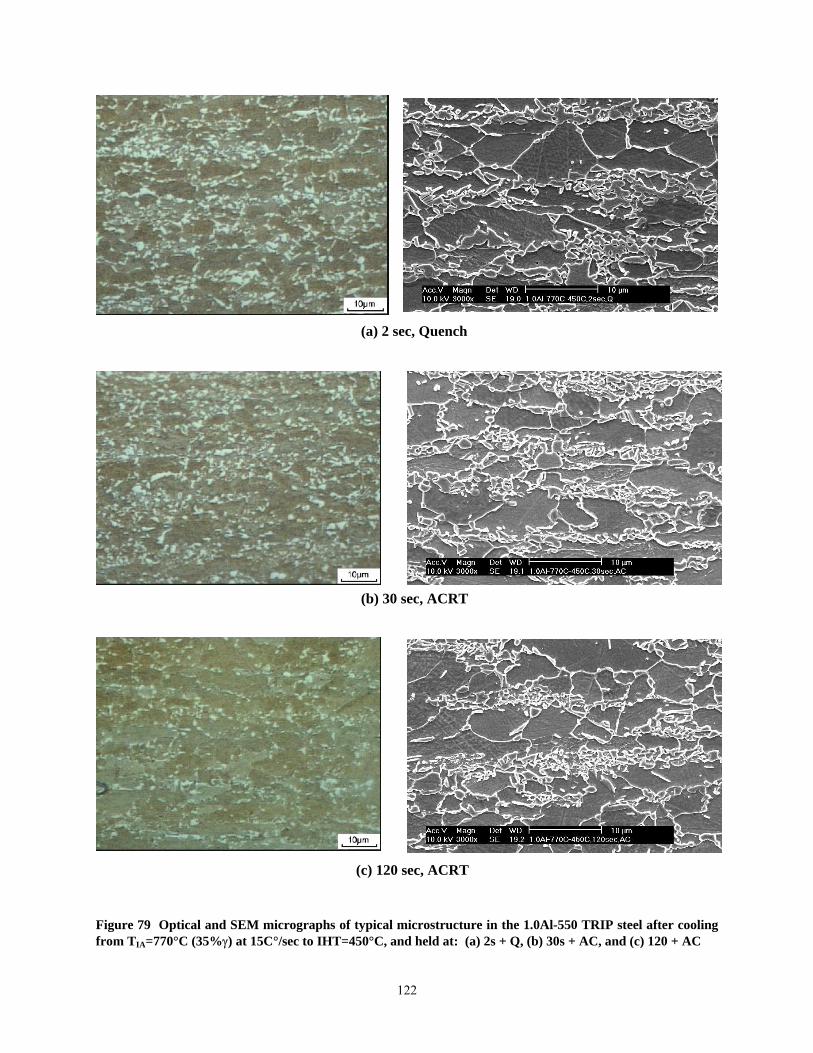
(a) 2 sec, Quench
(b) 30 sec, ACRT
(c) 120 sec, ACRT
Figure 79 Optical and SEM micrographs of typical microstructure in the 1.0Al-550 TRIP steel after cooling from TIA=770°C (35%γ) at 15C°/sec to IHT=450°C, and held at: (a) 2s + Q, (b) 30s + AC, and (c) 120 + AC
122

7-550: 770C,450C,2s-Q
0
0.05
0.1
0.15
0.2
0.25
0.3
0.35
0 10 20 30 40 50 60 70 80 90 100 1IQ
FREQ
UEN
CY
10
EBSD Data without GB Contribution
RXD FERRITE
NON-RXD FERRITE
MARTENSITE
RETAINED AUSTENITE
Sum of all simulated contributions
50.18%
29.59%
16.91%3.32%
Figure 80 IQ multi-peak quantitative analysis of the microconstituents in the 1.0Al-550 alloy after TIA=770°C (35%γ), cooled at 15°C/sec to 450°C and immediately quenched
7-550: 770C, 450C, 2s-ACRT
0
0.05
0.1
0.15
0.2
0.25
0.3
0 10 20 30 40 50 60 70 80 90 100 1IQ
FREQ
UEN
CY
10
EBSD Data without GB Contribution
RXD FERRITE
NON-RXD + NEW FERRITE
MARTENSITE
RETAINED AUSTENITE
Sum of all simulated contributions49.10%
30.66%
7.46% 12.78%
Figure 81 IQ multi-peak quantitative analysis of the microconstituents in the 1.0Al-550 alloy after TIA=770°C (35%γ), cooled at 15°C/sec to 450°C and then air cooled to room temperature (ACRT)
123
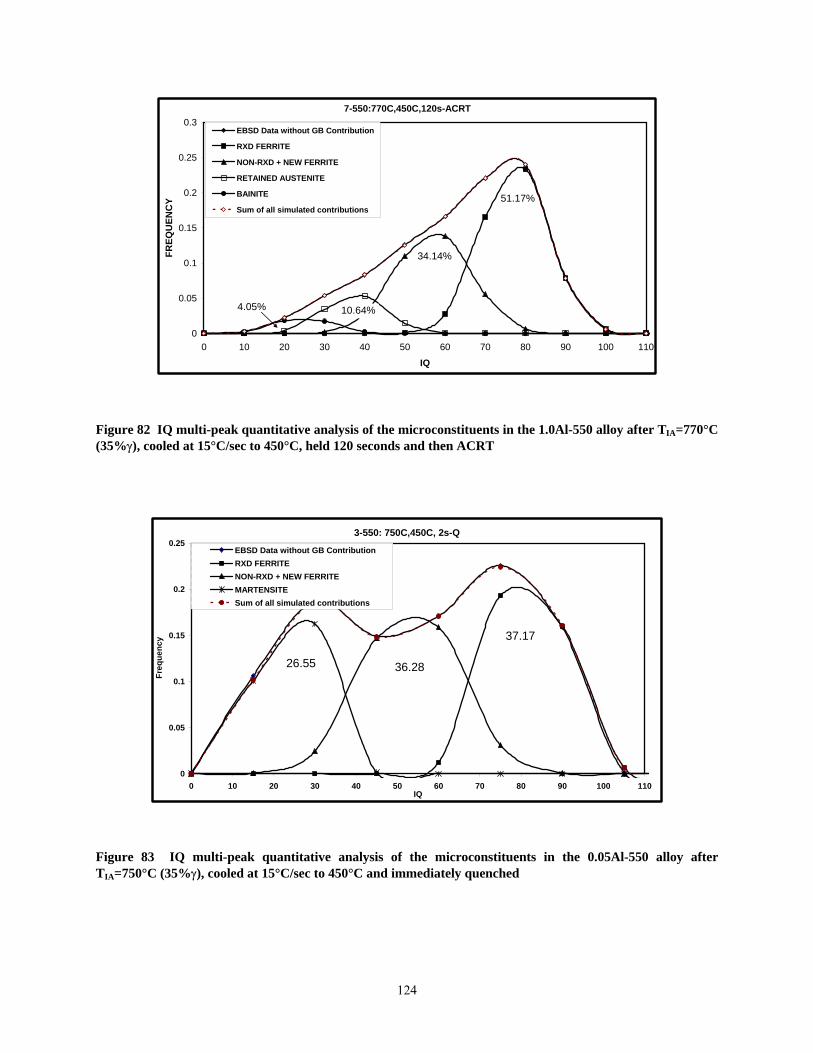
7-550:770C,450C,120s-ACRT
0
0.05
0.1
0.15
0.2
0.25
0.3
0 10 20 30 40 50 60 70 80 90 100 11
IQ
FREQ
UEN
CY
0
EBSD Data without GB Contribution
RXD FERRITE
NON-RXD + NEW FERRITE
RETAINED AUSTENITE
BAINITE
Sum of all simulated contributions51.17%
34.14%
10.64%4.05%
Figure 82 IQ multi-peak quantitative analysis of the microconstituents in the 1.0Al-550 alloy after TIA=770°C (35%γ), cooled at 15°C/sec to 450°C, held 120 seconds and then ACRT
3-550: 750C,450C, 2s-Q
0
0.05
0.1
0.15
0.2
0.25
0 10 20 30 40 50 60 70 80 90 100 110IQ
Freq
uenc
y
EBSD Data without GB ContributionRXD FERRITENON-RXD + NEW FERRITEMARTENSITESum of all simulated contributions
37.17
36.2826.55
Figure 83 IQ multi-peak quantitative analysis of the microconstituents in the 0.05Al-550 alloy after TIA=750°C (35%γ), cooled at 15°C/sec to 450°C and immediately quenched
124
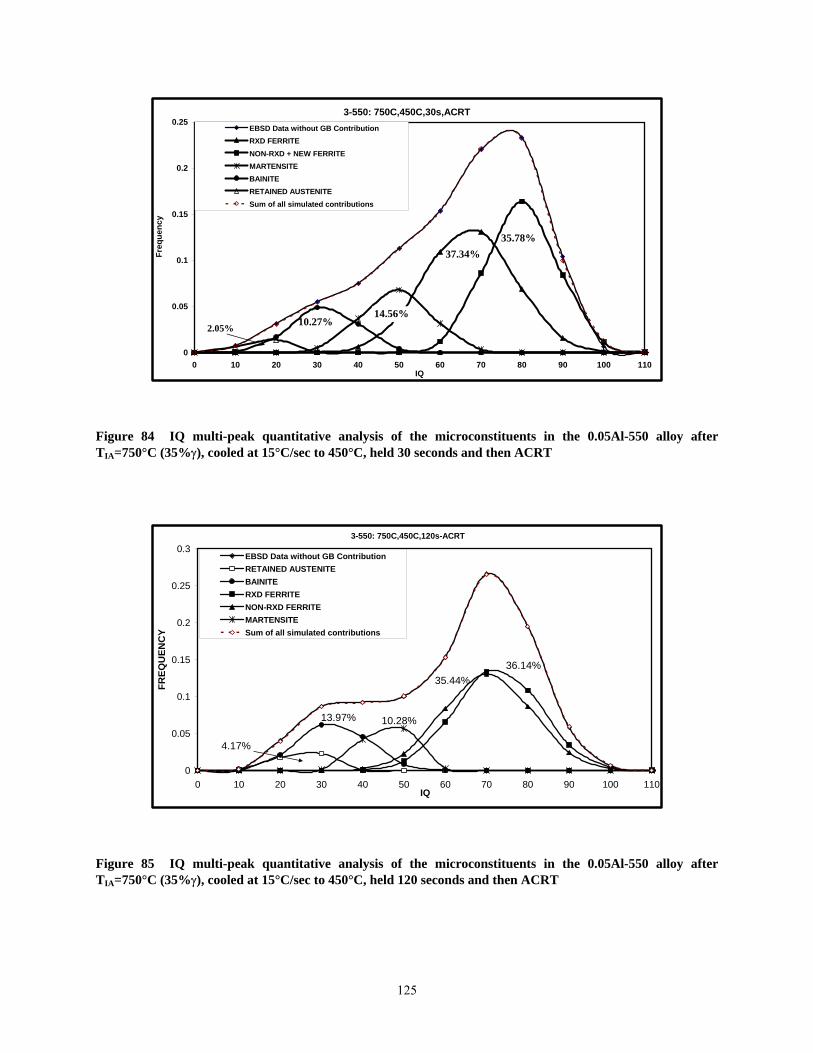
3-550: 750C,450C,30s,ACRT
0
0.05
0.1
0.15
0.2
0.25
0 10 20 30 40 50 60 70 80 90 100 110IQ
Freq
uenc
y
EBSD Data without GB ContributionRXD FERRITENON-RXD + NEW FERRITEMARTENSITEBAINITERETAINED AUSTENITESum of all simulated contributions
35.78%37.34%
14.56%10.27%2.05%
Figure 84 IQ multi-peak quantitative analysis of the microconstituents in the 0.05Al-550 alloy after TIA=750°C (35%γ), cooled at 15°C/sec to 450°C, held 30 seconds and then ACRT
3-550: 750C,450C,120s-ACRT
0
0.05
0.1
0.15
0.2
0.25
0.3
0 10 20 30 40 50 60 70 80 90 100 11IQ
FREQ
UEN
CY
0
EBSD Data without GB ContributionRETAINED AUSTENITEBAINITERXD FERRITENON-RXD FERRITEMARTENSITESum of all simulated contributions
36.14%
10.28%
35.44%
13.97%
4.17%
Figure 85 IQ multi-peak quantitative analysis of the microconstituents in the 0.05Al-550 alloy after TIA=750°C (35%γ), cooled at 15°C/sec to 450°C, held 120 seconds and then ACRT
125
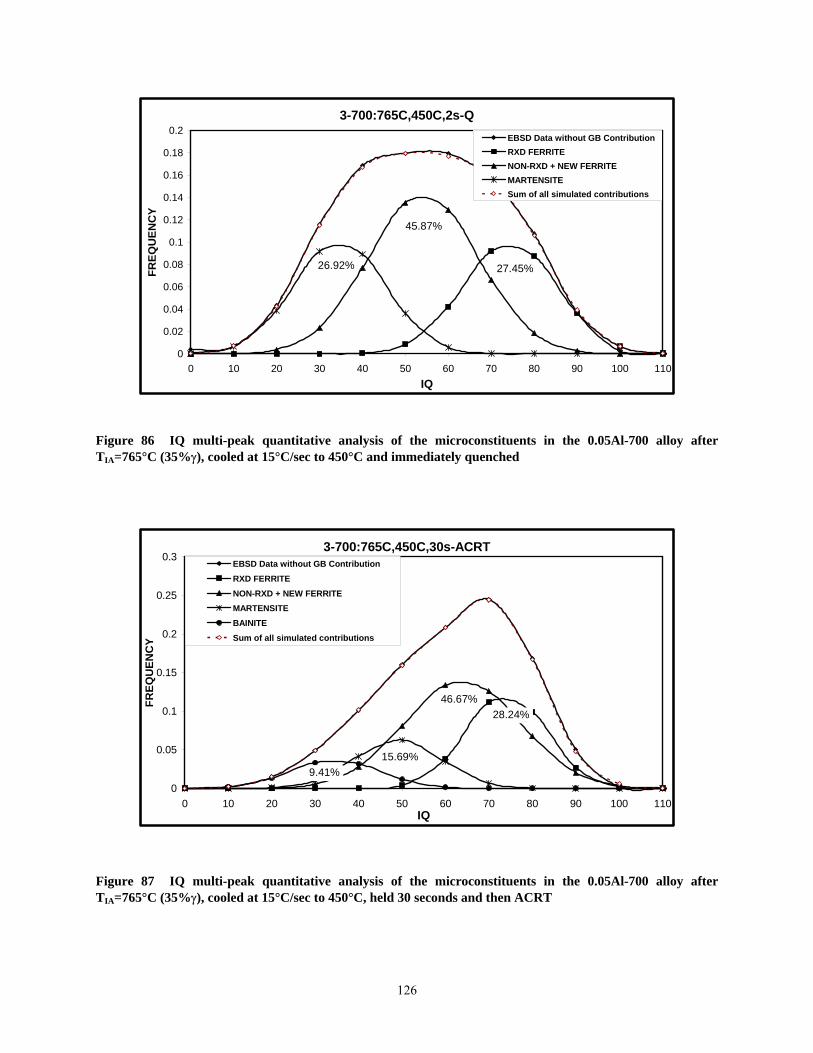
3-700:765C,450C,2s-Q
0
0.02
0.04
0.06
0.08
0.1
0.12
0.14
0.16
0.18
0.2
0 10 20 30 40 50 60 70 80 90 100 11IQ
FREQ
UEN
CY
0
EBSD Data without GB ContributionRXD FERRITENON-RXD + NEW FERRITEMARTENSITESum of all simulated contributions
27.45%
45.87%
26.92%
Figure 86 IQ multi-peak quantitative analysis of the microconstituents in the 0.05Al-700 alloy after TIA=765°C (35%γ), cooled at 15°C/sec to 450°C and immediately quenched
3-700:765C,450C,30s-ACRT
0
0.05
0.1
0.15
0.2
0.25
0.3
0 10 20 30 40 50 60 70 80 90 100 11IQ
FREQ
UEN
CY
0
EBSD Data without GB ContributionRXD FERRITENON-RXD + NEW FERRITEMARTENSITEBAINITESum of all simulated contributions
28.24%46.67%
15.69%9.41%
Figure 87 IQ multi-peak quantitative analysis of the microconstituents in the 0.05Al-700 alloy after TIA=765°C (35%γ), cooled at 15°C/sec to 450°C, held 30 seconds and then ACRT
126
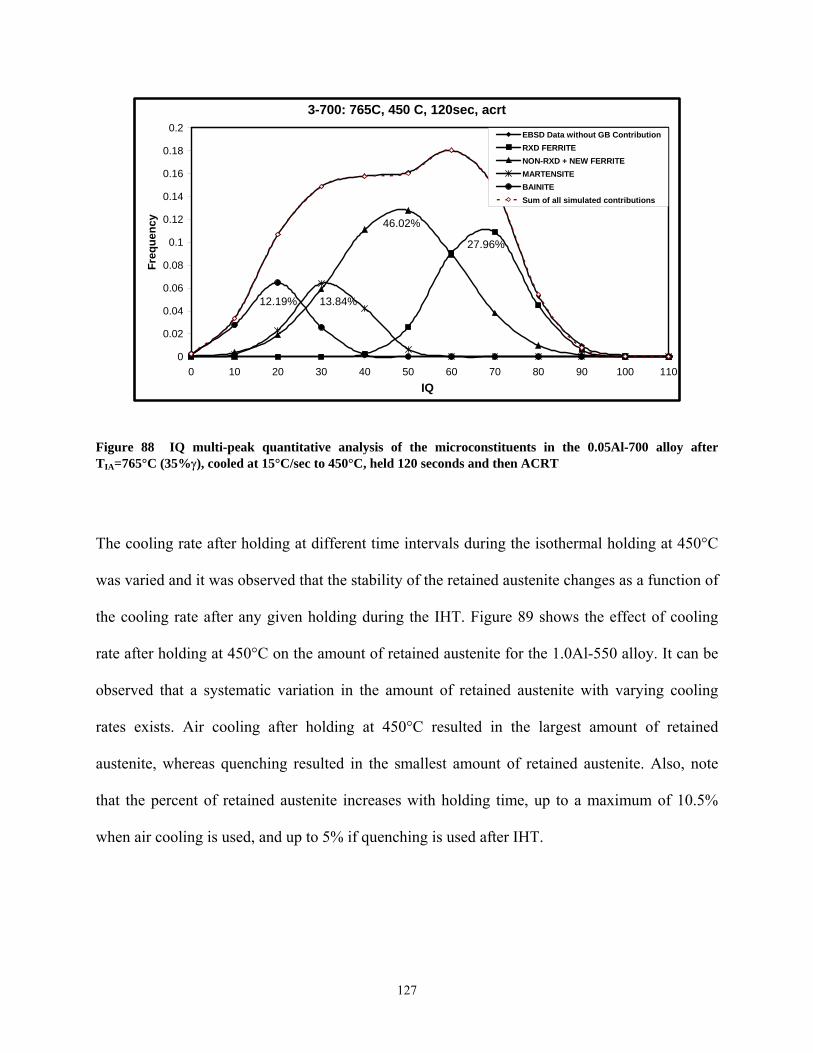
3-700: 765C, 450 C, 120sec, acrt
0
0.02
0.04
0.06
0.08
0.1
0.12
0.14
0.16
0.18
0.2
0 10 20 30 40 50 60 70 80 90 100 11IQ
Freq
uenc
y
0
EBSD Data without GB ContributionRXD FERRITENON-RXD + NEW FERRITEMARTENSITEBAINITESum of all simulated contributions
27.96%
46.02%
13.84%12.19%
Figure 88 IQ multi-peak quantitative analysis of the microconstituents in the 0.05Al-700 alloy after TIA=765°C (35%γ), cooled at 15°C/sec to 450°C, held 120 seconds and then ACRT
The cooling rate after holding at different time intervals during the isothermal holding at 450°C
was varied and it was observed that the stability of the retained austenite changes as a function of
the cooling rate after any given holding during the IHT. Figure 89 shows the effect of cooling
rate after holding at 450°C on the amount of retained austenite for the 1.0Al-550 alloy. It can be
observed that a systematic variation in the amount of retained austenite with varying cooling
rates exists. Air cooling after holding at 450°C resulted in the largest amount of retained
austenite, whereas quenching resulted in the smallest amount of retained austenite. Also, note
that the percent of retained austenite increases with holding time, up to a maximum of 10.5%
when air cooling is used, and up to 5% if quenching is used after IHT.
127
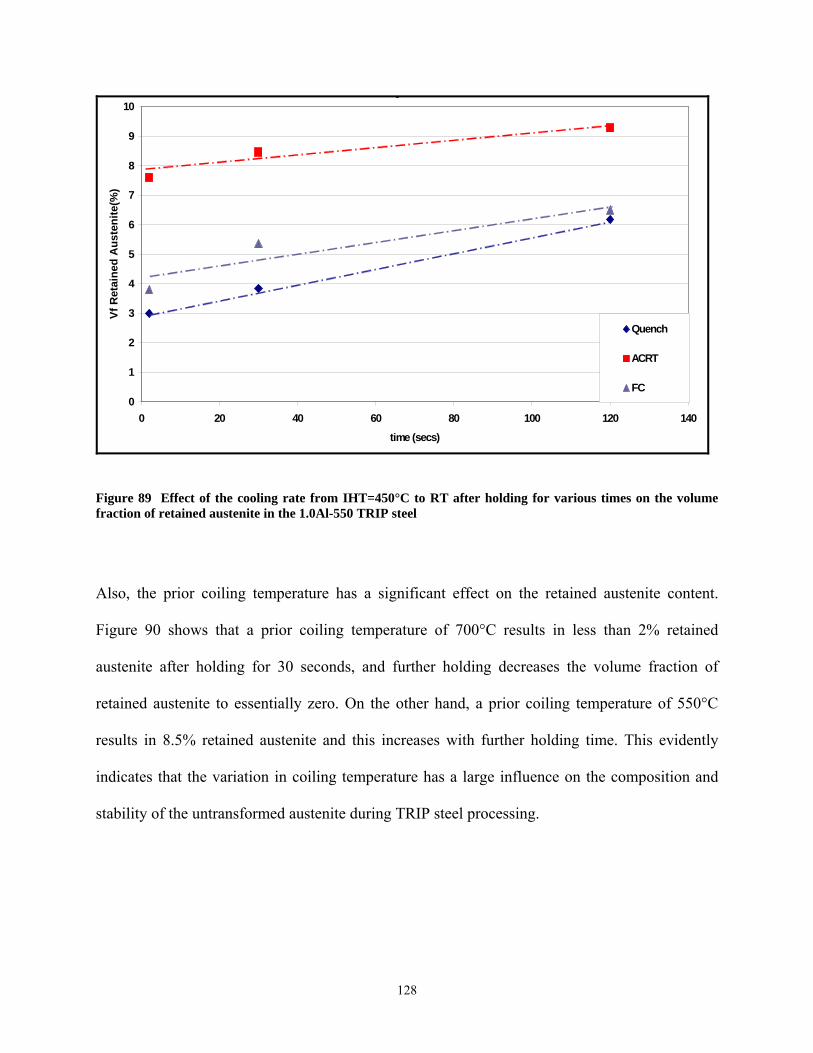
y
0
1
2
3
4
5
6
7
8
9
10
0 20 40 60 80 100 120 140
time (secs)
Vf R
etai
ned
Aus
teni
te(%
)
Quench
ACRT
FC
Figure 89 Effect of the cooling rate from IHT=450°C to RT after holding for various times on the volume fraction of retained austenite in the 1.0Al-550 TRIP steel
Also, the prior coiling temperature has a significant effect on the retained austenite content.
Figure 90 shows that a prior coiling temperature of 700°C results in less than 2% retained
austenite after holding for 30 seconds, and further holding decreases the volume fraction of
retained austenite to essentially zero. On the other hand, a prior coiling temperature of 550°C
results in 8.5% retained austenite and this increases with further holding time. This evidently
indicates that the variation in coiling temperature has a large influence on the composition and
stability of the untransformed austenite during TRIP steel processing.
128
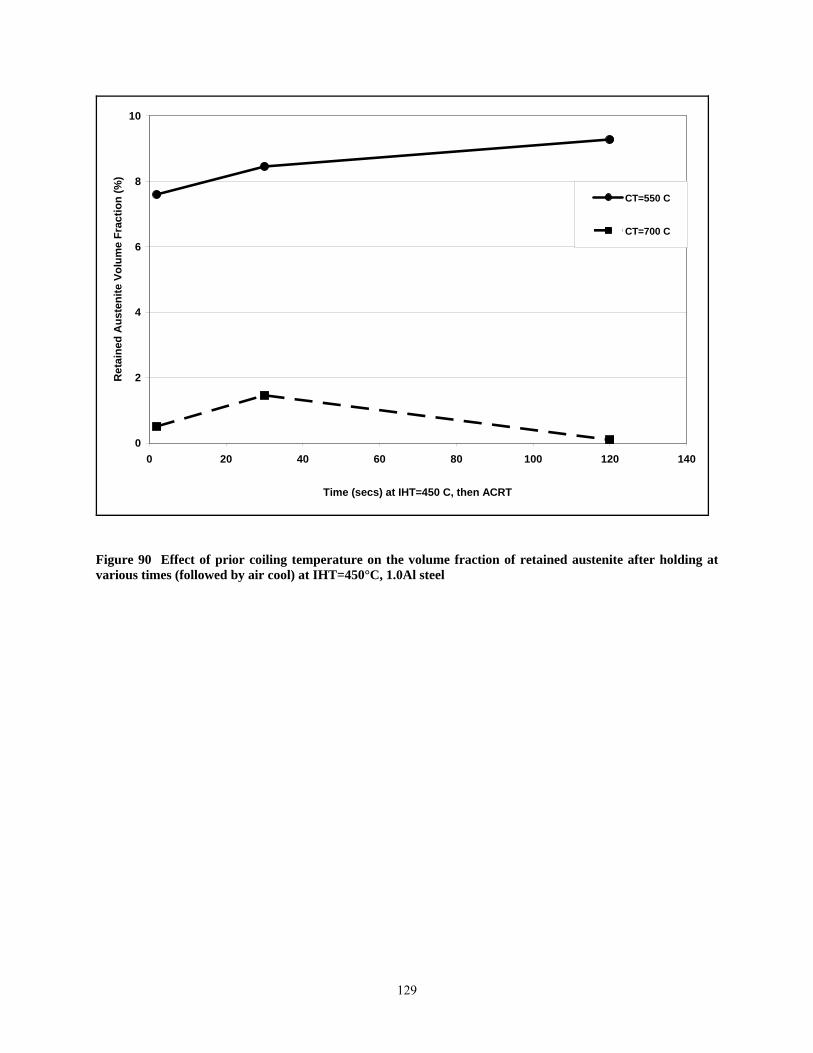
0
2
4
6
8
10
0 20 40 60 80 100 120 140
Time (secs) at IHT=450 C, then ACRT
Ret
aine
d A
uste
nite
Vol
ume
Frac
tion
(%)
CT=550 C
CT=700 C
Figure 90 Effect of prior coiling temperature on the volume fraction of retained austenite after holding at various times (followed by air cool) at IHT=450°C, 1.0Al steel
129
5.4 MECHANICAL PROPERTIES
The tensile properties for selected alloys and selected processing conditions were evaluated.
These consisted of: Yield stress (or lower yield point), UTS, uniform strain, total elongation, and
UTS x Total Elongation. Appendix B shows the tensile test results for the different alloys and
processing conditions that were selected for the mechanical testing.
5.4.1 Yield Stress
Figure 91 shows the yield and/or lower yield point stress values for the 0.5Al-550 and 1.0Al-550
as a function of holding time during the IHT. These samples were both intercritically annealed at
a temperature equal to 35% initial percent austenite, 760°C and 770°C, respectively. They were
subsequently cooled at 15°C/sec to 450°C, and held at different time intervals, followed by air
cooling. It is observed that the YS and/or LYP increases with holding time during the IHT in
both alloys. Moreover, the 0.5Al-550 alloy resulted in larger yield stress values than the 1.0Al-
550 alloy for identical processing conditions. Holding for a very short time, 5 seconds, resulted
in continuous yielding behavior, where as increasing the holding time changed the yielding
behavior from continuous to discontinuous yielding, and hence an UYP, LYP and a yield point
elongation was observed.
The variation of the cooling rate after holding at 450°C and its effect on the yield stress
was also examined. The 0.5Al-550 and 1.0Al-550 alloys were intercritically annealed at a
temperature equal to 35% initial percent austenite, 760°C and 770°C, respectively. They were
subsequently cooled at 15°C/sec to 450°C, and held for 30 seconds, followed by varying cooling
rates to room temperature. The cooling rates used were: a) quench (in water), b) air cooling, and
130
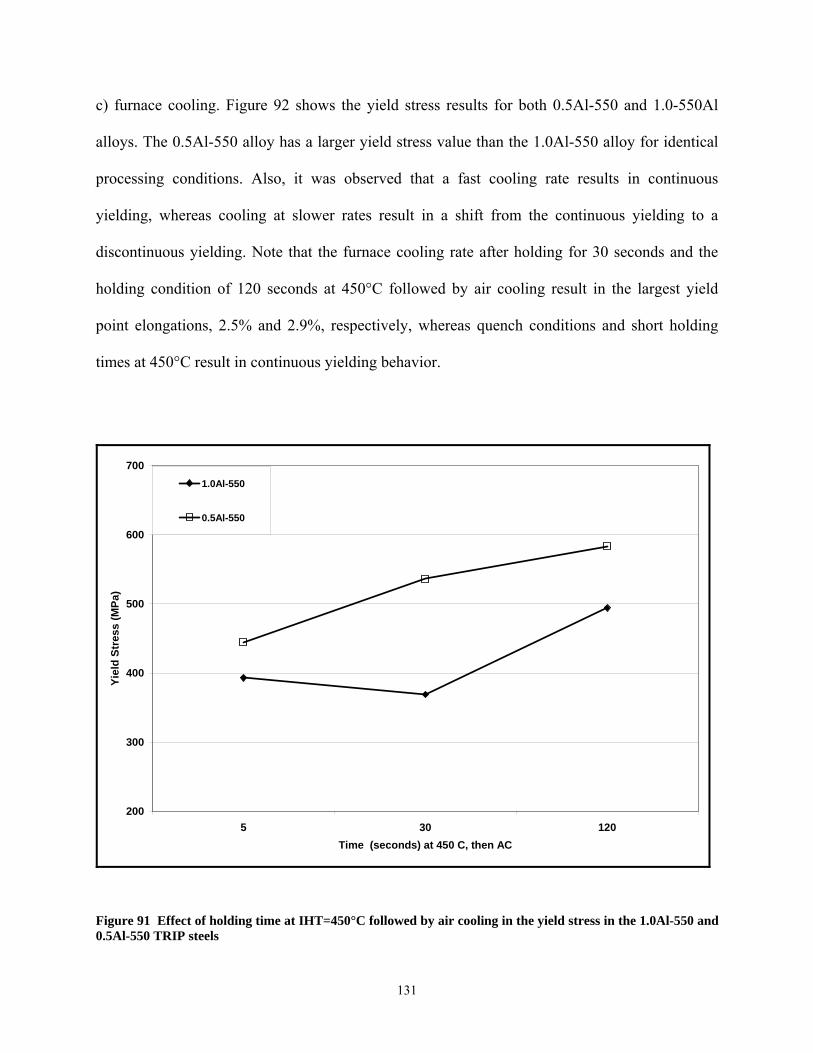
c) furnace cooling. Figure 92 shows the yield stress results for both 0.5Al-550 and 1.0-550Al
alloys. The 0.5Al-550 alloy has a larger yield stress value than the 1.0Al-550 alloy for identical
processing conditions. Also, it was observed that a fast cooling rate results in continuous
yielding, whereas cooling at slower rates result in a shift from the continuous yielding to a
discontinuous yielding. Note that the furnace cooling rate after holding for 30 seconds and the
holding condition of 120 seconds at 450°C followed by air cooling result in the largest yield
point elongations, 2.5% and 2.9%, respectively, whereas quench conditions and short holding
times at 450°C result in continuous yielding behavior.
200
300
400
500
600
700
5 30 120Time (seconds) at 450 C, then AC
Yiel
d St
ress
(MPa
)
1.0Al-550
0.5Al-550
Figure 91 Effect of holding time at IHT=450°C followed by air cooling in the yield stress in the 1.0Al-550 and 0.5Al-550 TRIP steels
131
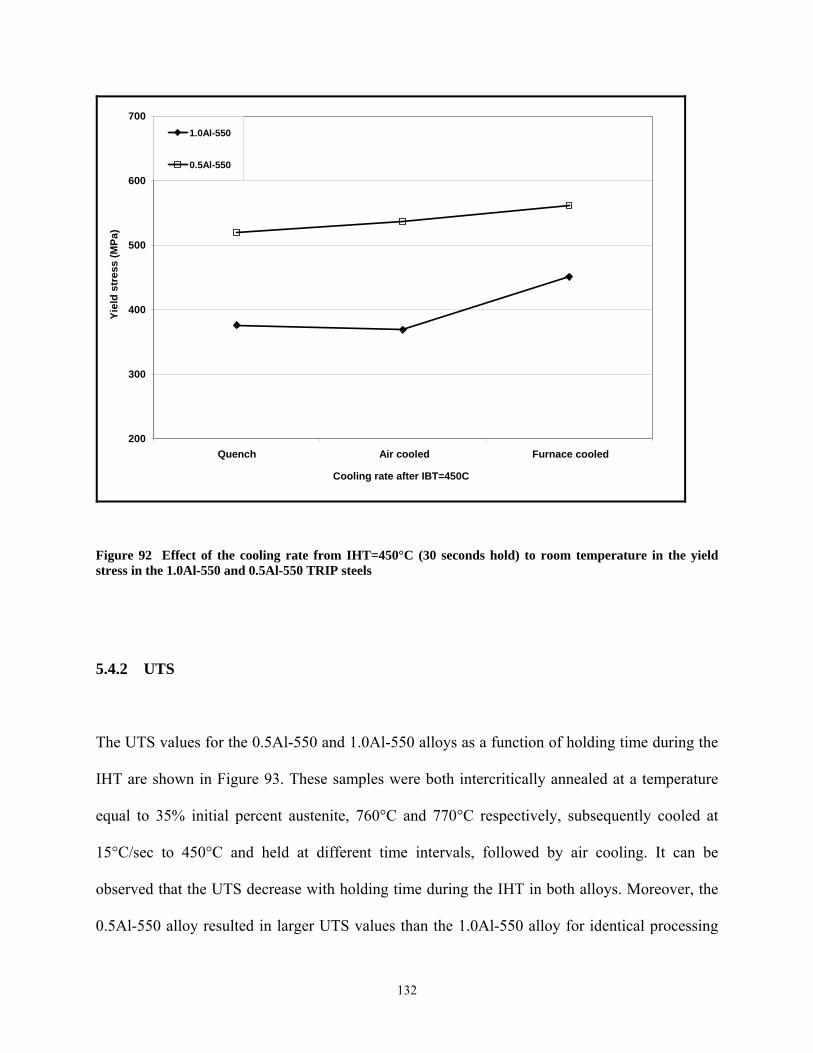
200
300
400
500
600
700
Quench Air cooled Furnace cooled
Cooling rate after IBT=450C
Yiel
d st
ress
(MPa
)
1.0Al-550
0.5Al-550
Figure 92 Effect of the cooling rate from IHT=450°C (30 seconds hold) to room temperature in the yield stress in the 1.0Al-550 and 0.5Al-550 TRIP steels
5.4.2 UTS
The UTS values for the 0.5Al-550 and 1.0Al-550 alloys as a function of holding time during the
IHT are shown in Figure 93. These samples were both intercritically annealed at a temperature
equal to 35% initial percent austenite, 760°C and 770°C respectively, subsequently cooled at
15°C/sec to 450°C and held at different time intervals, followed by air cooling. It can be
observed that the UTS decrease with holding time during the IHT in both alloys. Moreover, the
0.5Al-550 alloy resulted in larger UTS values than the 1.0Al-550 alloy for identical processing
132
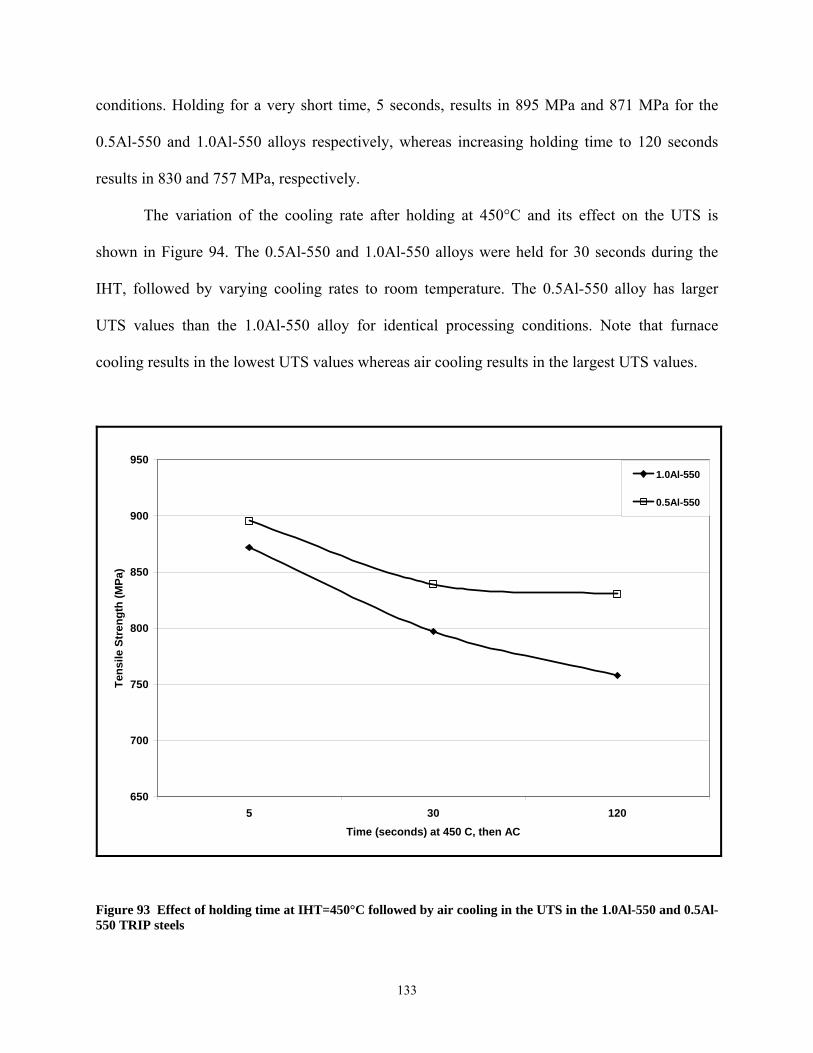
conditions. Holding for a very short time, 5 seconds, results in 895 MPa and 871 MPa for the
0.5Al-550 and 1.0Al-550 alloys respectively, whereas increasing holding time to 120 seconds
results in 830 and 757 MPa, respectively.
The variation of the cooling rate after holding at 450°C and its effect on the UTS is
shown in Figure 94. The 0.5Al-550 and 1.0Al-550 alloys were held for 30 seconds during the
IHT, followed by varying cooling rates to room temperature. The 0.5Al-550 alloy has larger
UTS values than the 1.0Al-550 alloy for identical processing conditions. Note that furnace
cooling results in the lowest UTS values whereas air cooling results in the largest UTS values.
650
700
750
800
850
900
950
5 30 120Time (seconds) at 450 C, then AC
Tens
ile S
tren
gth
(MPa
)
1.0Al-550
0.5Al-550
Figure 93 Effect of holding time at IHT=450°C followed by air cooling in the UTS in the 1.0Al-550 and 0.5Al-550 TRIP steels
133
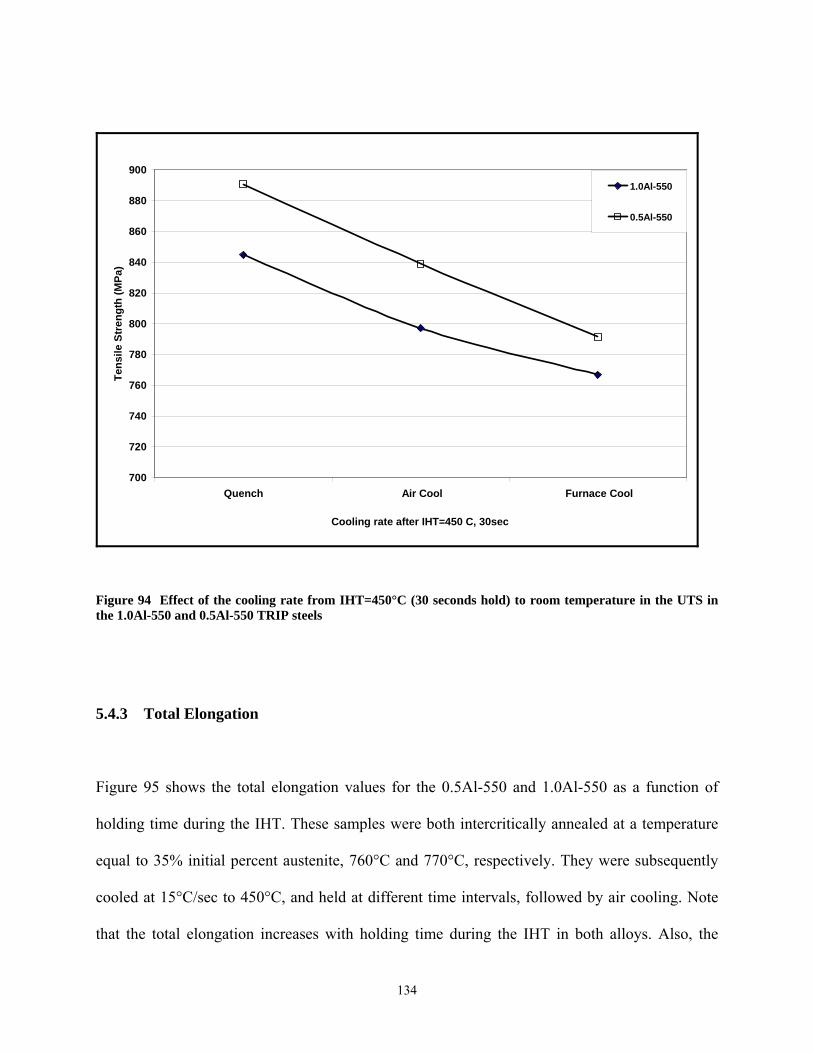
700
720
740
760
780
800
820
840
860
880
900
Quench Air Cool Furnace Cool
Cooling rate after IHT=450 C, 30sec
Tens
ile S
tren
gth
(MPa
)
1.0Al-550
0.5Al-550
Figure 94 Effect of the cooling rate from IHT=450°C (30 seconds hold) to room temperature in the UTS in the 1.0Al-550 and 0.5Al-550 TRIP steels
5.4.3 Total Elongation
Figure 95 shows the total elongation values for the 0.5Al-550 and 1.0Al-550 as a function of
holding time during the IHT. These samples were both intercritically annealed at a temperature
equal to 35% initial percent austenite, 760°C and 770°C, respectively. They were subsequently
cooled at 15°C/sec to 450°C, and held at different time intervals, followed by air cooling. Note
that the total elongation increases with holding time during the IHT in both alloys. Also, the
134
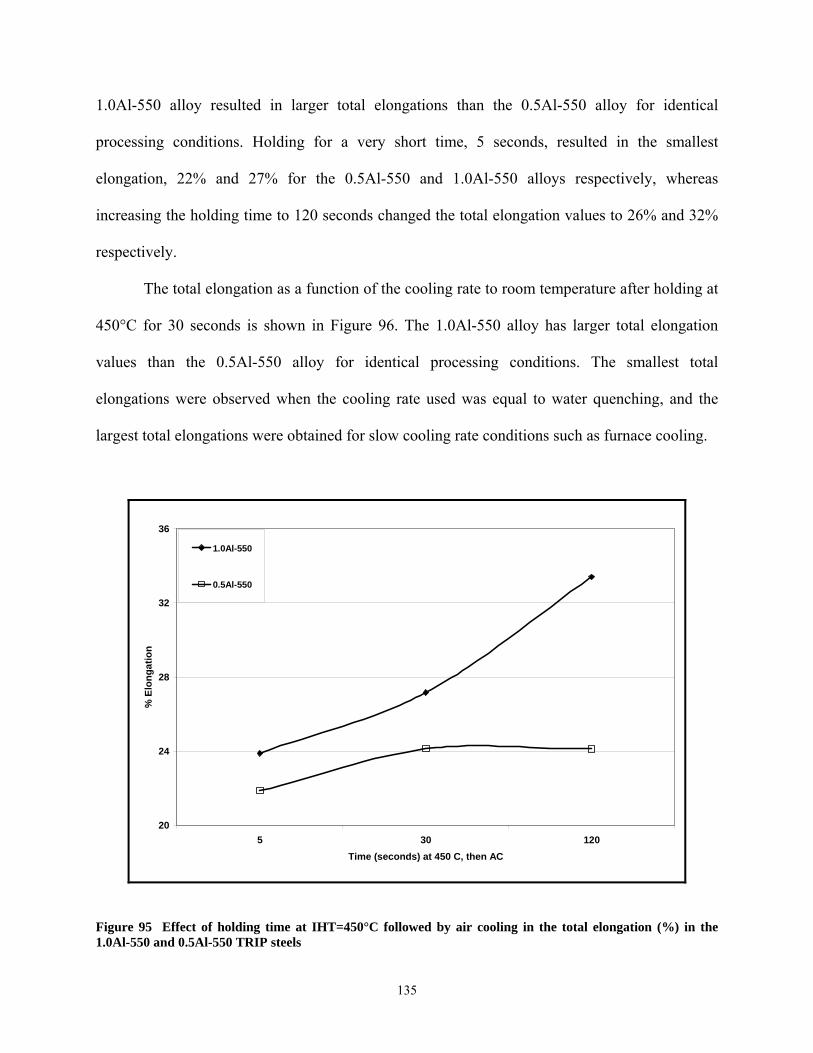
1.0Al-550 alloy resulted in larger total elongations than the 0.5Al-550 alloy for identical
processing conditions. Holding for a very short time, 5 seconds, resulted in the smallest
elongation, 22% and 27% for the 0.5Al-550 and 1.0Al-550 alloys respectively, whereas
increasing the holding time to 120 seconds changed the total elongation values to 26% and 32%
respectively.
The total elongation as a function of the cooling rate to room temperature after holding at
450°C for 30 seconds is shown in Figure 96. The 1.0Al-550 alloy has larger total elongation
values than the 0.5Al-550 alloy for identical processing conditions. The smallest total
elongations were observed when the cooling rate used was equal to water quenching, and the
largest total elongations were obtained for slow cooling rate conditions such as furnace cooling.
20
24
28
32
36
5 30 120Time (seconds) at 450 C, then AC
% E
long
atio
n
1.0Al-550
0.5Al-550
Figure 95 Effect of holding time at IHT=450°C followed by air cooling in the total elongation (%) in the 1.0Al-550 and 0.5Al-550 TRIP steels
135
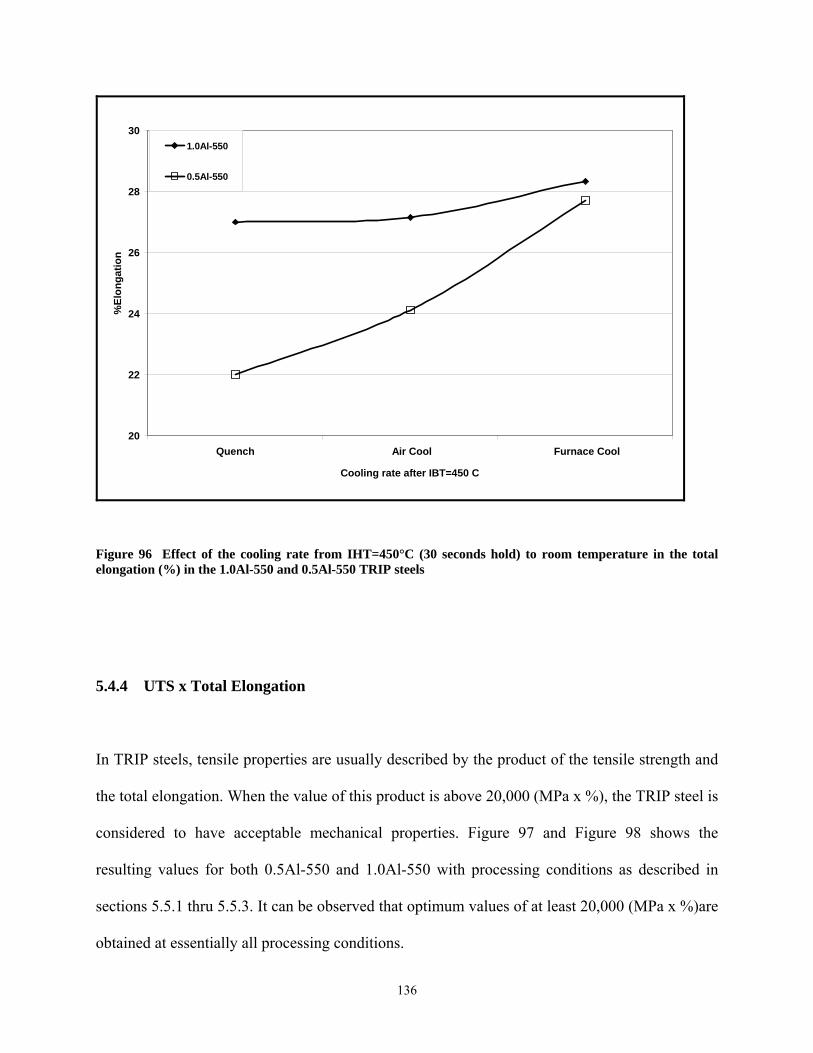
20
22
24
26
28
30
Quench Air Cool Furnace Cool
Cooling rate after IBT=450 C
%El
onga
tion
1.0Al-550
0.5Al-550
Figure 96 Effect of the cooling rate from IHT=450°C (30 seconds hold) to room temperature in the total elongation (%) in the 1.0Al-550 and 0.5Al-550 TRIP steels
5.4.4 UTS x Total Elongation
In TRIP steels, tensile properties are usually described by the product of the tensile strength and
the total elongation. When the value of this product is above 20,000 (MPa x %), the TRIP steel is
considered to have acceptable mechanical properties. Figure 97 and Figure 98 shows the
resulting values for both 0.5Al-550 and 1.0Al-550 with processing conditions as described in
sections 5.5.1 thru 5.5.3. It can be observed that optimum values of at least 20,000 (MPa x %)are
obtained at essentially all processing conditions.
136
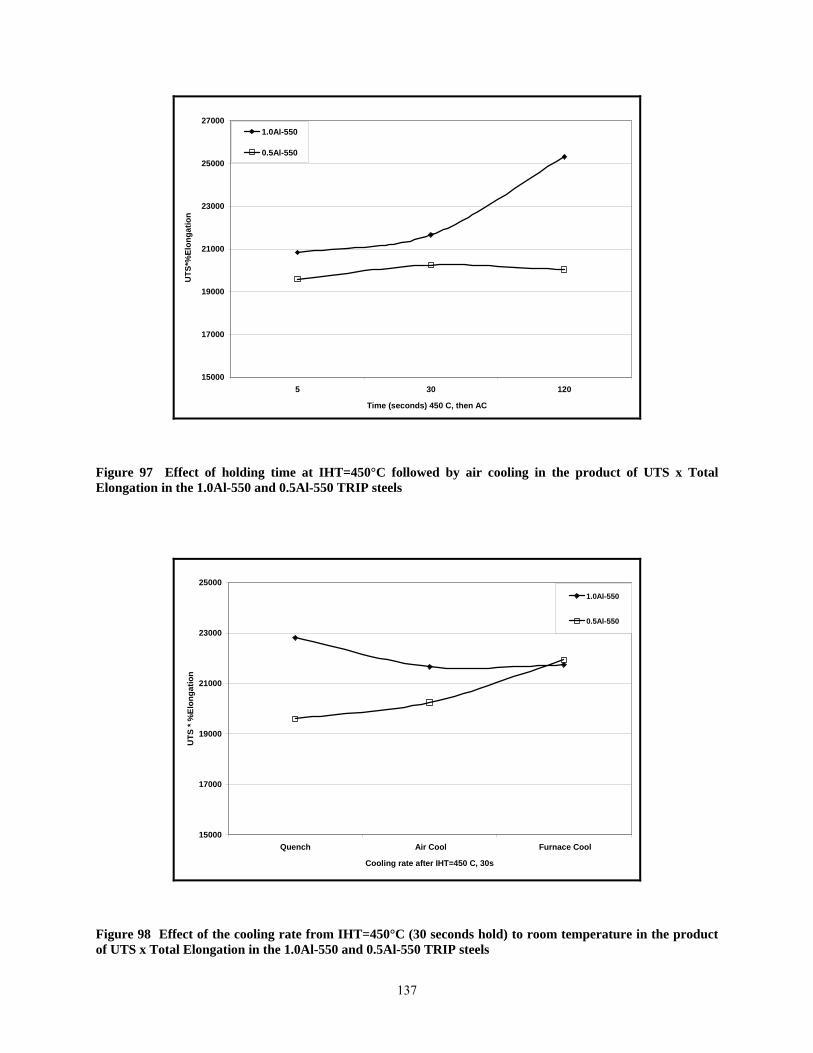
15000
17000
19000
21000
23000
25000
27000
5 30 120
Time (seconds) 450 C, then AC
UTS
*%El
onga
tion
1.0Al-550
0.5Al-550
Figure 97 Effect of holding time at IHT=450°C followed by air cooling in the product of UTS x Total Elongation in the 1.0Al-550 and 0.5Al-550 TRIP steels
15000
17000
19000
21000
23000
25000
Quench Air Cool Furnace Cool
Cooling rate after IHT=450 C, 30s
UTS
* %
Elon
gatio
n
1.0Al-550
0.5Al-550
Figure 98 Effect of the cooling rate from IHT=450°C (30 seconds hold) to room temperature in the product of UTS x Total Elongation in the 1.0Al-550 and 0.5Al-550 TRIP steels
137
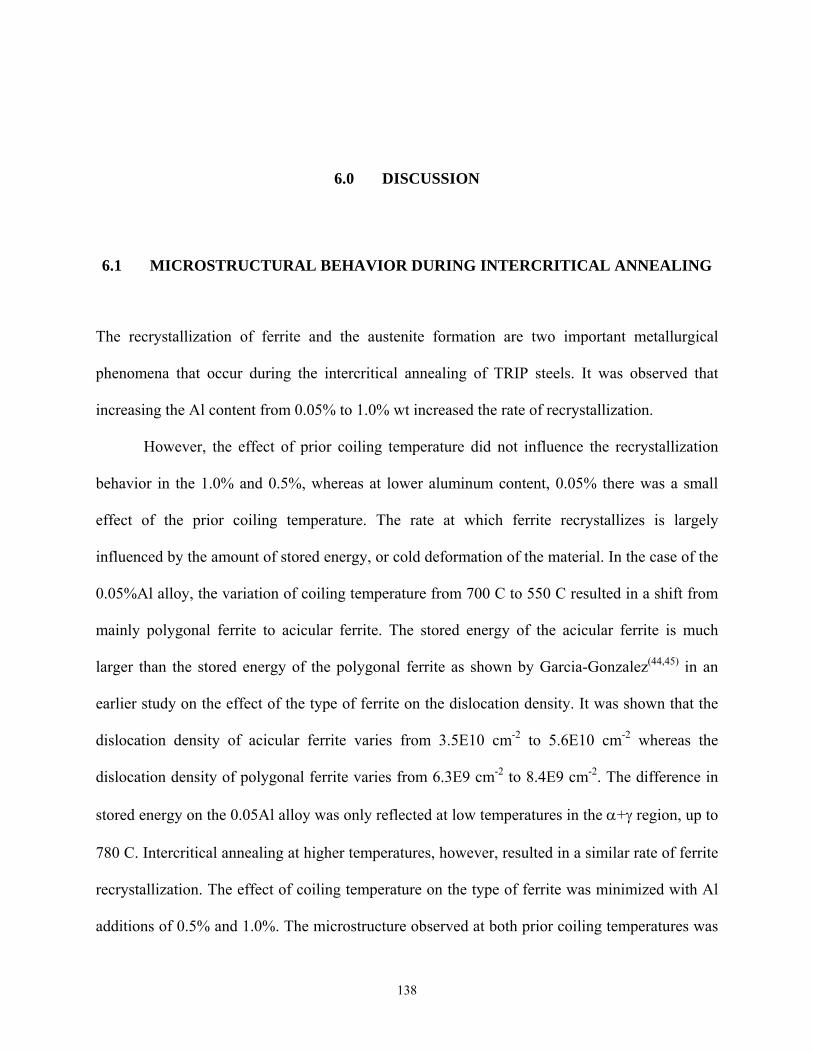
6.0 DISCUSSION
6.1 MICROSTRUCTURAL BEHAVIOR DURING INTERCRITICAL ANNEALING
The recrystallization of ferrite and the austenite formation are two important metallurgical
phenomena that occur during the intercritical annealing of TRIP steels. It was observed that
increasing the Al content from 0.05% to 1.0% wt increased the rate of recrystallization.
However, the effect of prior coiling temperature did not influence the recrystallization
behavior in the 1.0% and 0.5%, whereas at lower aluminum content, 0.05% there was a small
effect of the prior coiling temperature. The rate at which ferrite recrystallizes is largely
influenced by the amount of stored energy, or cold deformation of the material. In the case of the
0.05%Al alloy, the variation of coiling temperature from 700 C to 550 C resulted in a shift from
mainly polygonal ferrite to acicular ferrite. The stored energy of the acicular ferrite is much
larger than the stored energy of the polygonal ferrite as shown by Garcia-Gonzalez(44,45) in an
earlier study on the effect of the type of ferrite on the dislocation density. It was shown that the
dislocation density of acicular ferrite varies from 3.5E10 cm-2 to 5.6E10 cm-2 whereas the
dislocation density of polygonal ferrite varies from 6.3E9 cm-2 to 8.4E9 cm-2. The difference in
stored energy on the 0.05Al alloy was only reflected at low temperatures in the α+γ region, up to
780 C. Intercritical annealing at higher temperatures, however, resulted in a similar rate of ferrite
recrystallization. The effect of coiling temperature on the type of ferrite was minimized with Al
additions of 0.5% and 1.0%. The microstructure observed at both prior coiling temperatures was
138
polygonal ferrite. As a result, the driving force for the recrystallization of ferrite at both coiling
temperatures is expected to be very similar. In fact, this was observed to be the case, since it was
shown that the coiling temperature did not have any effect on the amount of the recrystallization
of ferrite at different temperatures in the α+γ region. According to the aspect ratio of the ferrite
grains, it must be noted that 50% of ferrite recrystallization in the 0.05Al and 0.5Al alloy only
occurred at relatively high temperatures in the two phase region, equal to an 80% and 74% of
austenite percent, respectively. However, in the 1.0Al alloy, 50% of ferrite recrystallization
occurred at a very low temperature in the two phase region, equal to 27% austenite. The
mechanism by which additions larger than 1.0% wt Al accelerate the recrystallization of ferrite is
not yet understood.
However, it is possible that Al prevents the solute atoms to migrate to the ferrite
boundaries, thereby decreasing the energy necessary for boundary migration. It is known that an
increase in solute content retards the mobility of grain boundaries. Brandt(83) has shown this
effect by studying the suppression of epitaxial ferrite during cooling. It was observed that
cooling rates close to 120°C/sec were necessary to suppress epitaxial ferrite formation in a
1.2%Mn steel, and about 50°C/sec in a 2.4%Mn steel. Higher manganese contents inhibit
epitaxial ferrite formation by the solute-drag-like effect(85,86) and the same effect would be
expected with regard to the mobility of grains boundaries during recrystallization. Manganese
decreases the activity of carbon in austenite and it also segregates to the austenite-ferrite
interface. Because of this, the driving force for diffusion of carbon away from the interface into
the austenite is reduced (i.e., manganese segregation attracts carbon to the interface, whereas the
reaction requires the carbon diffuse away from the interface), slowing the kinetics of the
transformation. Thus, smaller additions of manganese would result in less carbon being attracted
139
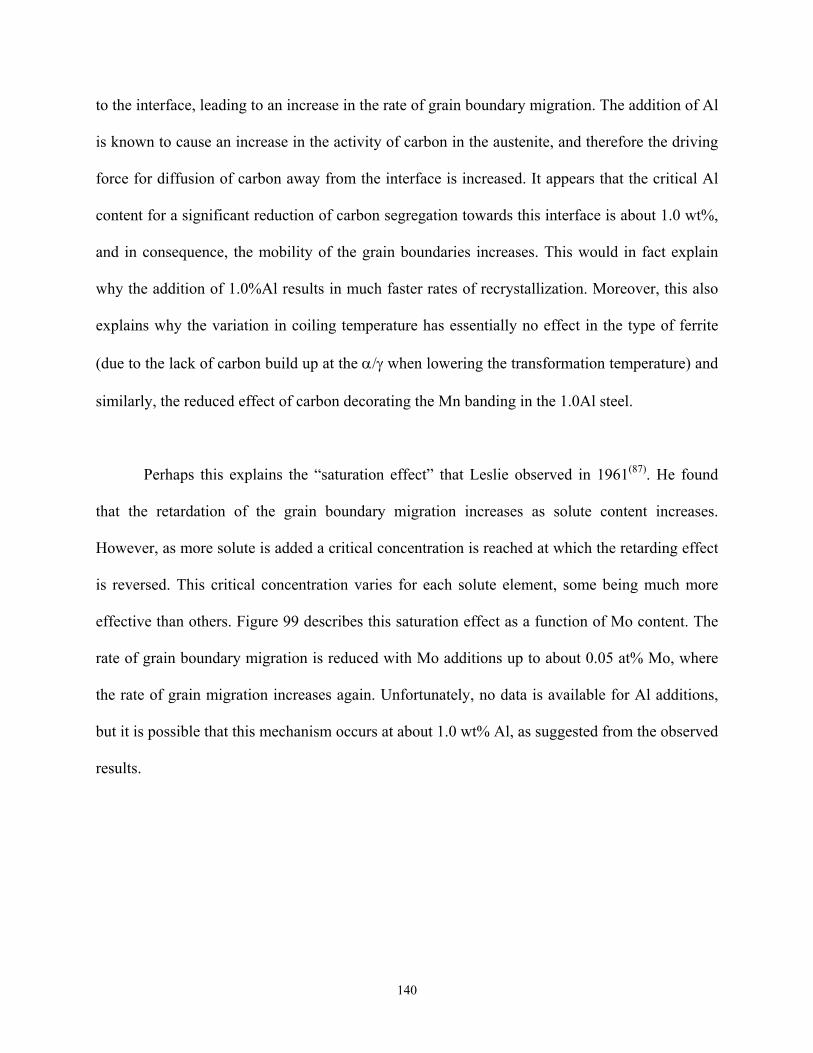
to the interface, leading to an increase in the rate of grain boundary migration. The addition of Al
is known to cause an increase in the activity of carbon in the austenite, and therefore the driving
force for diffusion of carbon away from the interface is increased. It appears that the critical Al
content for a significant reduction of carbon segregation towards this interface is about 1.0 wt%,
and in consequence, the mobility of the grain boundaries increases. This would in fact explain
why the addition of 1.0%Al results in much faster rates of recrystallization. Moreover, this also
explains why the variation in coiling temperature has essentially no effect in the type of ferrite
(due to the lack of carbon build up at the α/γ when lowering the transformation temperature) and
similarly, the reduced effect of carbon decorating the Mn banding in the 1.0Al steel.
Perhaps this explains the “saturation effect” that Leslie observed in 1961(87). He found
that the retardation of the grain boundary migration increases as solute content increases.
However, as more solute is added a critical concentration is reached at which the retarding effect
is reversed. This critical concentration varies for each solute element, some being much more
effective than others. Figure 99 describes this saturation effect as a function of Mo content. The
rate of grain boundary migration is reduced with Mo additions up to about 0.05 at% Mo, where
the rate of grain migration increases again. Unfortunately, no data is available for Al additions,
but it is possible that this mechanism occurs at about 1.0 wt% Al, as suggested from the observed
results.
140
Figure 99 Effect of molybdenum on the rate of growth of recrystallized grains in iron (After W.C. Leslie, 1961)
A very important effect of the addition of Al from 0.05 wt% to 1.0 wt% is the increase in the Ac3
temperature from 825 C to 970 C, as shown by the J-Mat Pro simulation in Figure 47 (results
section). It was observed that the effect of the prior coiling temperature on the variation in the
volume fraction of austenite after holding for 60 seconds at different intercritical annealing
temperatures was not significant in the 0.5% Al and 1.0%Al alloy, since no more than 5%
volume fraction difference existed at any given temperature. However, in the 0.05%Al, there
variation in coiling temperature resulted in an increase of as much as 15% volume fraction for
the coiling temperature of 550 C. At any given temperature, coiling at 550 C resulted in a higher
volume fraction than when the coiling temperature was 700 C. A possible explanation for the
141
observed increased in the kinetics of austenite formation at 550 C could be attributed to the
change in the type of ferrite from polygonal ferrite to acicular ferrite when coiling at 550 C and
to the fine distribution of carbides throughout the matrix, which spheroidize before dissolving
much faster than pearlite colonies. Also, the initial carbon content in these fine carbides at the
early stages of intercritical annealing is larger than a large pearlite colony and therefore an
increase in the rate of austenite formation is expected. The fact that the variation in coiling
temperature in the 0.5%Al and 1.0%Al resulted in no change in the type of ferrite in the hot
band, and that no significant variation on the rate of austenite formation was observed, indicates
that the initial type of ferrite has indeed an effect on the rate on austenite formation.
Simultaneous analysis of the austenite formation and the recrystallization of ferrite show
that there is a relation between these two metallurgical phenomena. It was observed in the 1.0Al
alloy that the rate of recrystallization was much faster than the austenite formation at
temperatures above [(Ac1+Ac3)/2], where as in the 0.05Al and 0.5Al alloy the rate of
recrystallization and austenite formation were similar. In the latter, the simulated (equilibrium)
and the measured volume fraction of austenite were very similar, Figure 100; however in the
1.0Al alloy, a significant deviation from equilibrium is observed after 850 C, Figure 101. This
suggests that the rate of austenite formation from cold rolled-unrecrystallized ferrite grains is
very rapid, and the rate of austenite formation decreases once the recrystallization of ferrite has
been completed. Militzer et(76) al observed this behavior in a 0.06C-1.86Mn-0.155Mo steel
intercritically annealed at 1 C/sec and 100 C/sec to 750 C, and holding for 100 seconds. The fast
heating rate condition resulted in unrecrystallized ferrite grains whereas the slow heating rate
conditions resulted in recrystallized ferrite grains. It was observed that after heating at 100 C/sec
the austenite formed at an increased rate and reached 30% whereas heating at 1C/sec resulted in
142
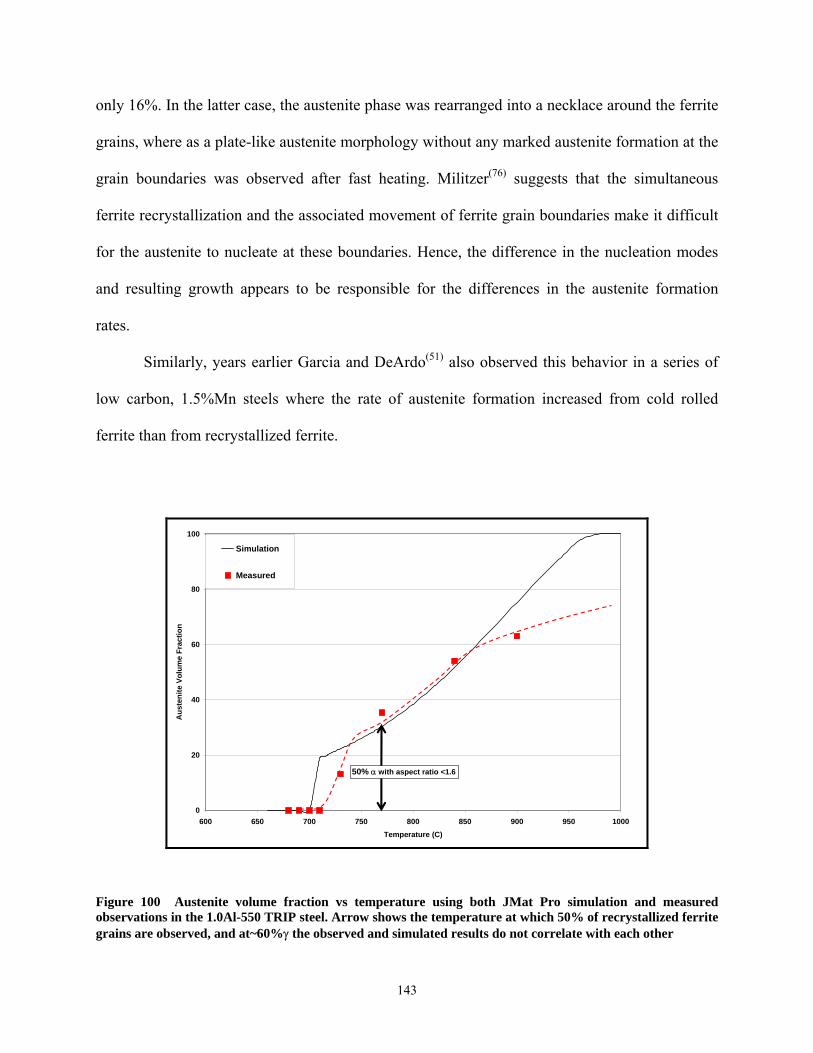
only 16%. In the latter case, the austenite phase was rearranged into a necklace around the ferrite
grains, where as a plate-like austenite morphology without any marked austenite formation at the
grain boundaries was observed after fast heating. Militzer(76) suggests that the simultaneous
ferrite recrystallization and the associated movement of ferrite grain boundaries make it difficult
for the austenite to nucleate at these boundaries. Hence, the difference in the nucleation modes
and resulting growth appears to be responsible for the differences in the austenite formation
rates.
Similarly, years earlier Garcia and DeArdo(51) also observed this behavior in a series of
low carbon, 1.5%Mn steels where the rate of austenite formation increased from cold rolled
ferrite than from recrystallized ferrite.
0
20
40
60
80
100
600 650 700 750 800 850 900 950 1000Temperature (C)
Aus
teni
te V
olum
e Fr
actio
n
Simulation
Measured
50% α with aspect ratio <1.6
Figure 100 Austenite volume fraction vs temperature using both JMat Pro simulation and measured observations in the 1.0Al-550 TRIP steel. Arrow shows the temperature at which 50% of recrystallized ferrite grains are observed, and at~60%γ the observed and simulated results do not correlate with each other
143

0
20
40
60
80
100
600 650 700 750 800 850 900 950 1000Temperature (C)
Aus
teni
te V
olum
e Fr
actio
n
Simulation
Measured
50% α with aspect ratio <1.6
Figure 101 Austenite volume fraction vs temperature using both JMat Pro simulation and measured observations in the 0.5Al-550 TRIP steel. Arrow shows the temperature at which 50% of recrystallized ferrite grains are observed, and note that the observed and simulated results correlate well with each other up to that temperature
144
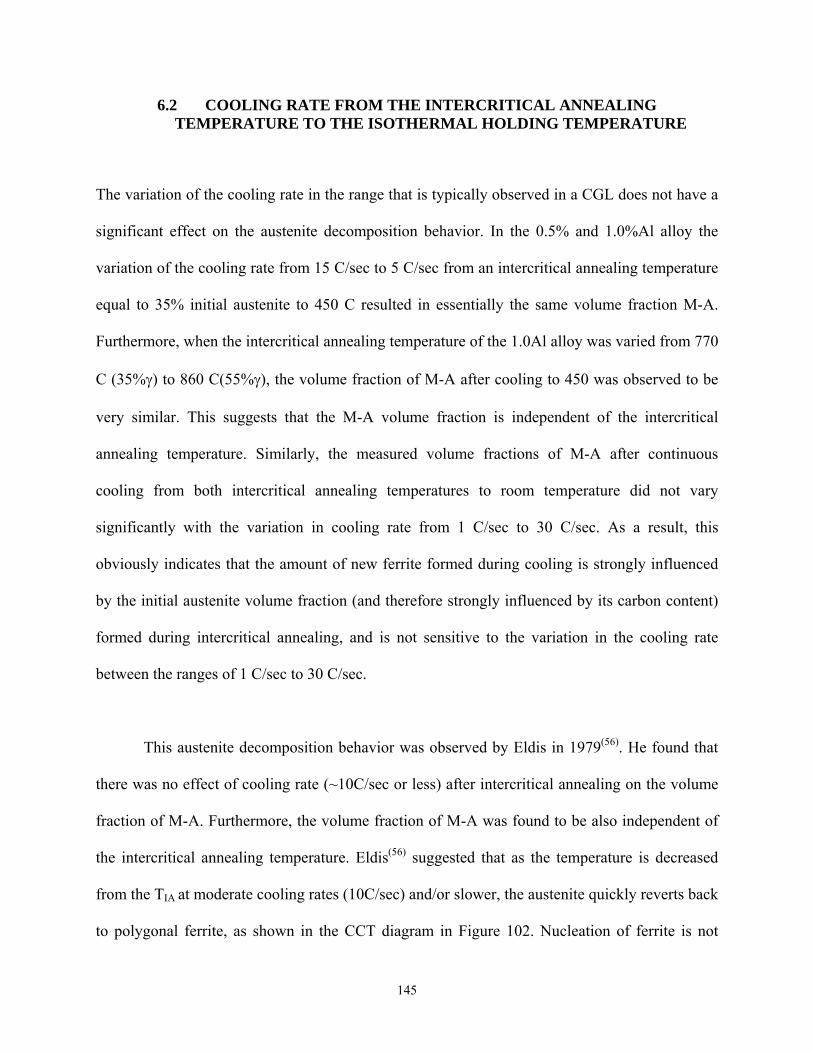
6.2 COOLING RATE FROM THE INTERCRITICAL ANNEALING TEMPERATURE TO THE ISOTHERMAL HOLDING TEMPERATURE
The variation of the cooling rate in the range that is typically observed in a CGL does not have a
significant effect on the austenite decomposition behavior. In the 0.5% and 1.0%Al alloy the
variation of the cooling rate from 15 C/sec to 5 C/sec from an intercritical annealing temperature
equal to 35% initial austenite to 450 C resulted in essentially the same volume fraction M-A.
Furthermore, when the intercritical annealing temperature of the 1.0Al alloy was varied from 770
C (35%γ) to 860 C(55%γ), the volume fraction of M-A after cooling to 450 was observed to be
very similar. This suggests that the M-A volume fraction is independent of the intercritical
annealing temperature. Similarly, the measured volume fractions of M-A after continuous
cooling from both intercritical annealing temperatures to room temperature did not vary
significantly with the variation in cooling rate from 1 C/sec to 30 C/sec. As a result, this
obviously indicates that the amount of new ferrite formed during cooling is strongly influenced
by the initial austenite volume fraction (and therefore strongly influenced by its carbon content)
formed during intercritical annealing, and is not sensitive to the variation in the cooling rate
between the ranges of 1 C/sec to 30 C/sec.
This austenite decomposition behavior was observed by Eldis in 1979(56). He found that
there was no effect of cooling rate (~10C/sec or less) after intercritical annealing on the volume
fraction of M-A. Furthermore, the volume fraction of M-A was found to be also independent of
the intercritical annealing temperature. Eldis(56) suggested that as the temperature is decreased
from the TIA at moderate cooling rates (10C/sec) and/or slower, the austenite quickly reverts back
to polygonal ferrite, as shown in the CCT diagram in Figure 102. Nucleation of ferrite is not
145
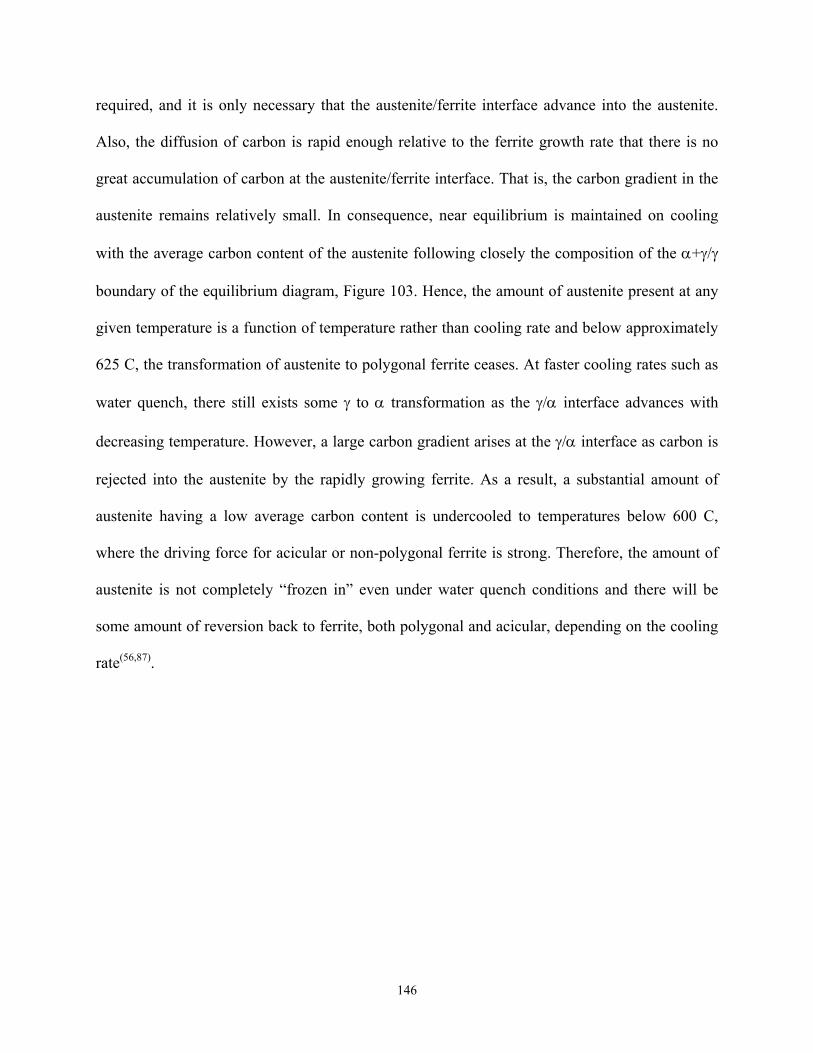
required, and it is only necessary that the austenite/ferrite interface advance into the austenite.
Also, the diffusion of carbon is rapid enough relative to the ferrite growth rate that there is no
great accumulation of carbon at the austenite/ferrite interface. That is, the carbon gradient in the
austenite remains relatively small. In consequence, near equilibrium is maintained on cooling
with the average carbon content of the austenite following closely the composition of the α+γ/γ
boundary of the equilibrium diagram, Figure 103. Hence, the amount of austenite present at any
given temperature is a function of temperature rather than cooling rate and below approximately
625 C, the transformation of austenite to polygonal ferrite ceases. At faster cooling rates such as
water quench, there still exists some γ to α transformation as the γ/α interface advances with
decreasing temperature. However, a large carbon gradient arises at the γ/α interface as carbon is
rejected into the austenite by the rapidly growing ferrite. As a result, a substantial amount of
austenite having a low average carbon content is undercooled to temperatures below 600 C,
where the driving force for acicular or non-polygonal ferrite is strong. Therefore, the amount of
austenite is not completely “frozen in” even under water quench conditions and there will be
some amount of reversion back to ferrite, both polygonal and acicular, depending on the cooling
rate(56,87).
146
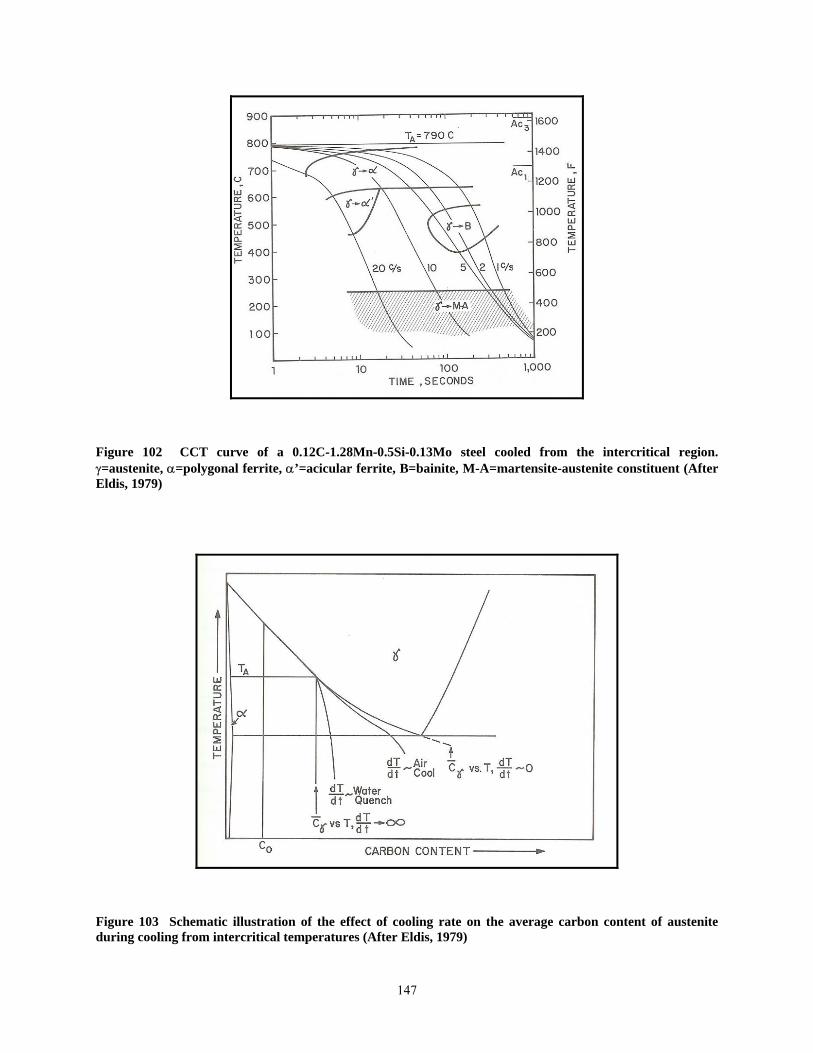
Figure 102 CCT curve of a 0.12C-1.28Mn-0.5Si-0.13Mo steel cooled from the intercritical region. γ=austenite, α=polygonal ferrite, α’=acicular ferrite, B=bainite, M-A=martensite-austenite constituent (After Eldis, 1979)
Figure 103 Schematic illustration of the effect of cooling rate on the average carbon content of austenite during cooling from intercritical temperatures (After Eldis, 1979)
147
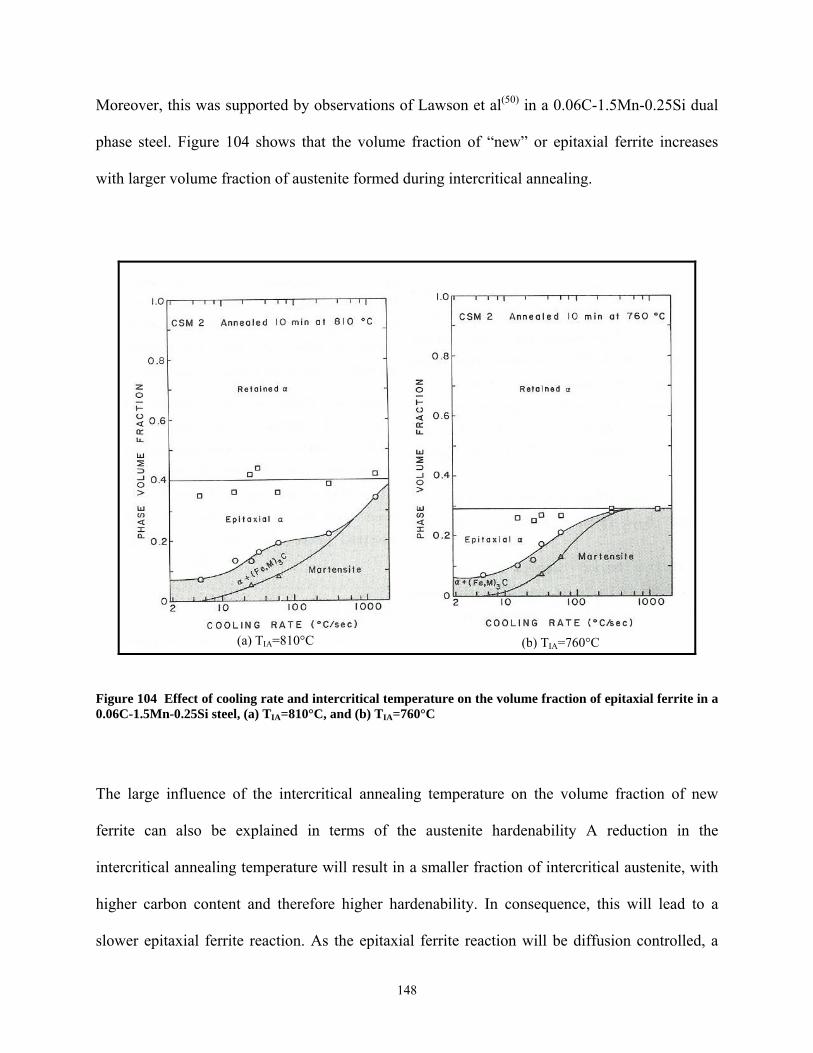
Moreover, this was supported by observations of Lawson et al(50) in a 0.06C-1.5Mn-0.25Si dual
phase steel. Figure 104 shows that the volume fraction of “new” or epitaxial ferrite increases
with larger volume fraction of austenite formed during intercritical annealing.
(a) TIA=810°C (b) TIA=760°C
Figure 104 Effect of cooling rate and intercritical temperature on the volume fraction of epitaxial ferrite in a 0.06C-1.5Mn-0.25Si steel, (a) TIA=810°C, and (b) TIA=760°C
The large influence of the intercritical annealing temperature on the volume fraction of new
ferrite can also be explained in terms of the austenite hardenability A reduction in the
intercritical annealing temperature will result in a smaller fraction of intercritical austenite, with
higher carbon content and therefore higher hardenability. In consequence, this will lead to a
slower epitaxial ferrite reaction. As the epitaxial ferrite reaction will be diffusion controlled, a
148
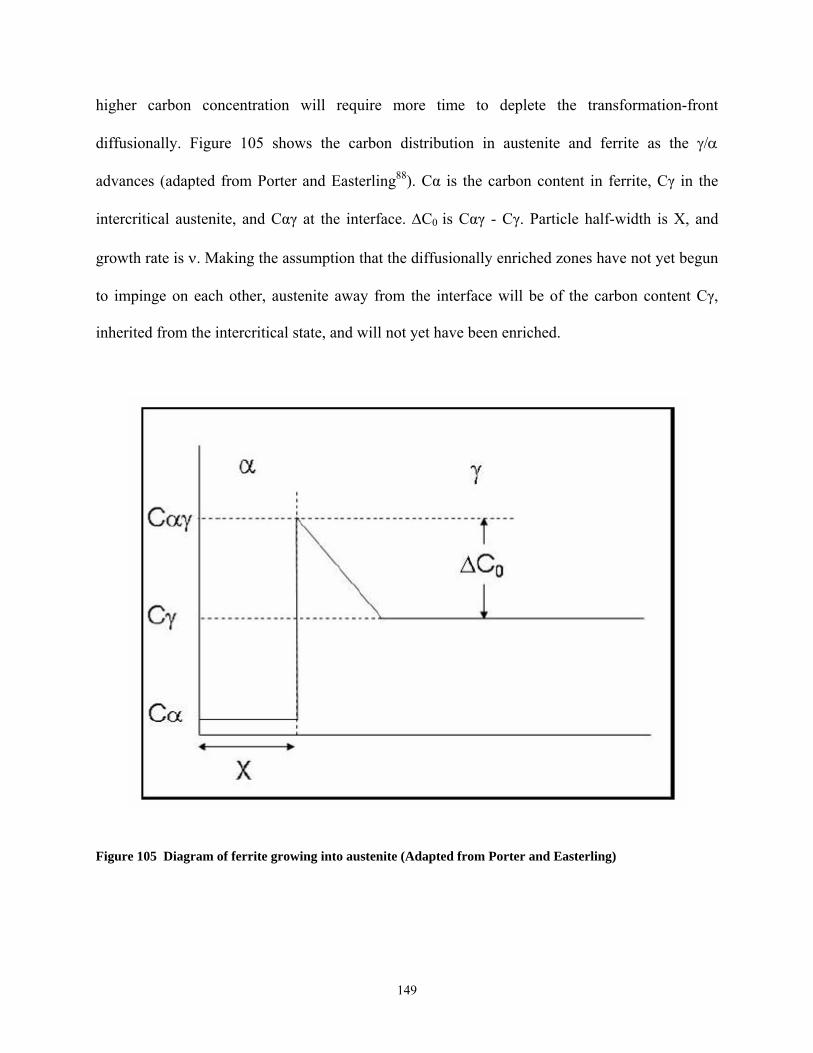
higher carbon concentration will require more time to deplete the transformation-front
diffusionally. Figure 105 shows the carbon distribution in austenite and ferrite as the γ/α
advances (adapted from Porter and Easterling88). Cα is the carbon content in ferrite, Cγ in the
intercritical austenite, and Cαγ at the interface. ∆C0 is Cαγ - Cγ. Particle half-width is X, and
growth rate is ν. Making the assumption that the diffusionally enriched zones have not yet begun
to impinge on each other, austenite away from the interface will be of the carbon content Cγ,
inherited from the intercritical state, and will not yet have been enriched.
Figure 105 Diagram of ferrite growing into austenite (Adapted from Porter and Easterling)
149
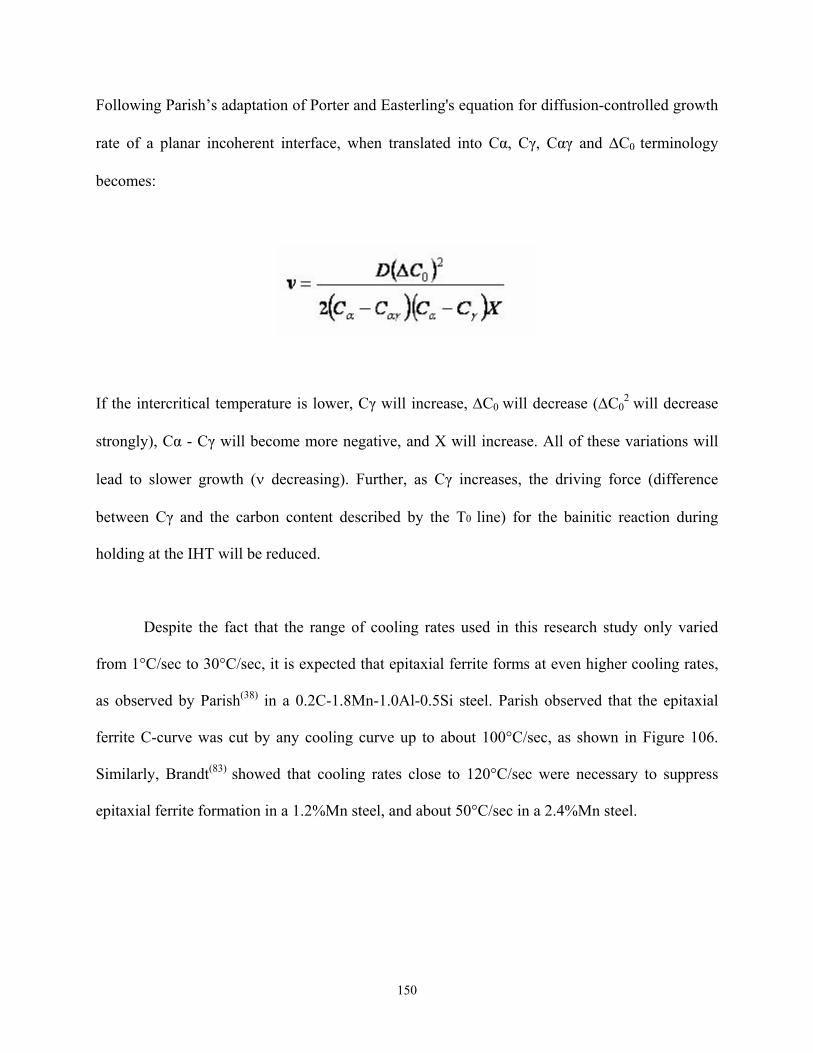
Following Parish’s adaptation of Porter and Easterling's equation for diffusion-controlled growth
rate of a planar incoherent interface, when translated into Cα, Cγ, Cαγ and ∆C0 terminology
becomes:
If the intercritical temperature is lower, Cγ will increase, ∆C0 will decrease (∆C02
will decrease
strongly), Cα - Cγ will become more negative, and X will increase. All of these variations will
lead to slower growth (ν decreasing). Further, as Cγ increases, the driving force (difference
between Cγ and the carbon content described by the T0 line) for the bainitic reaction during
holding at the IHT will be reduced.
Despite the fact that the range of cooling rates used in this research study only varied
from 1°C/sec to 30°C/sec, it is expected that epitaxial ferrite forms at even higher cooling rates,
as observed by Parish(38) in a 0.2C-1.8Mn-1.0Al-0.5Si steel. Parish observed that the epitaxial
ferrite C-curve was cut by any cooling curve up to about 100°C/sec, as shown in Figure 106.
Similarly, Brandt(83) showed that cooling rates close to 120°C/sec were necessary to suppress
epitaxial ferrite formation in a 1.2%Mn steel, and about 50°C/sec in a 2.4%Mn steel.
150
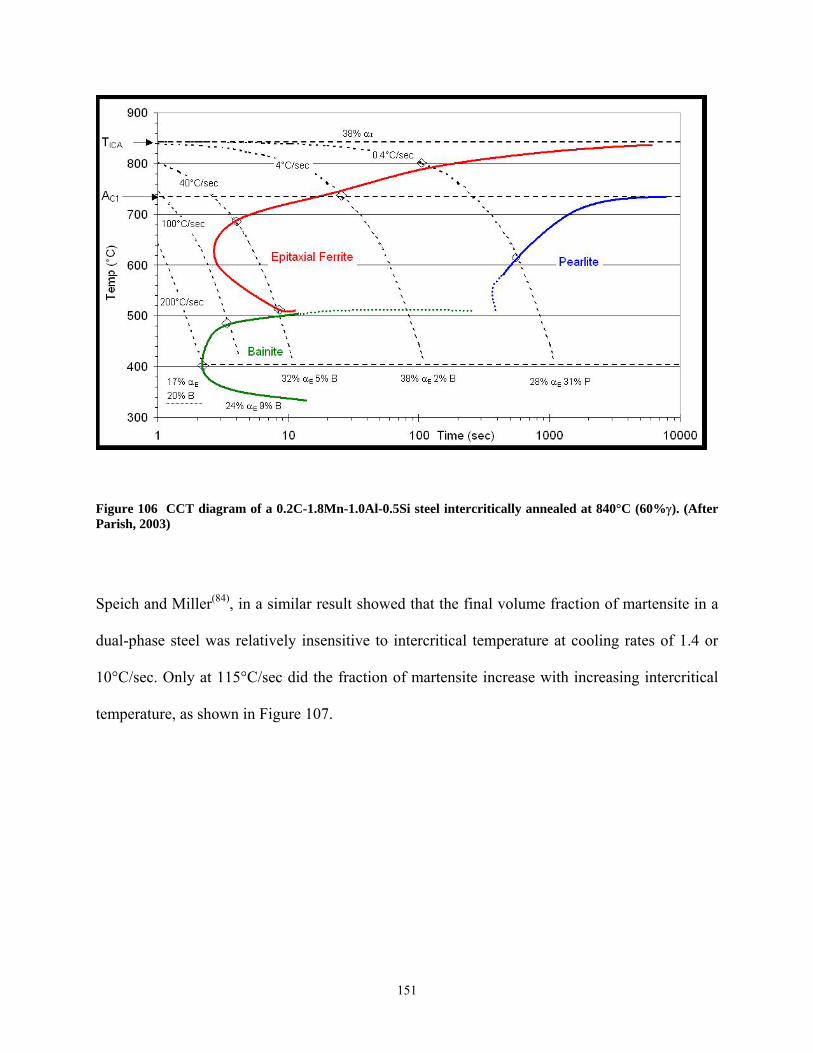
Figure 106 CCT diagram of a 0.2C-1.8Mn-1.0Al-0.5Si steel intercritically annealed at 840°C (60%γ). (After Parish, 2003)
Speich and Miller(84), in a similar result showed that the final volume fraction of martensite in a
dual-phase steel was relatively insensitive to intercritical temperature at cooling rates of 1.4 or
10°C/sec. Only at 115°C/sec did the fraction of martensite increase with increasing intercritical
temperature, as shown in Figure 107.
151
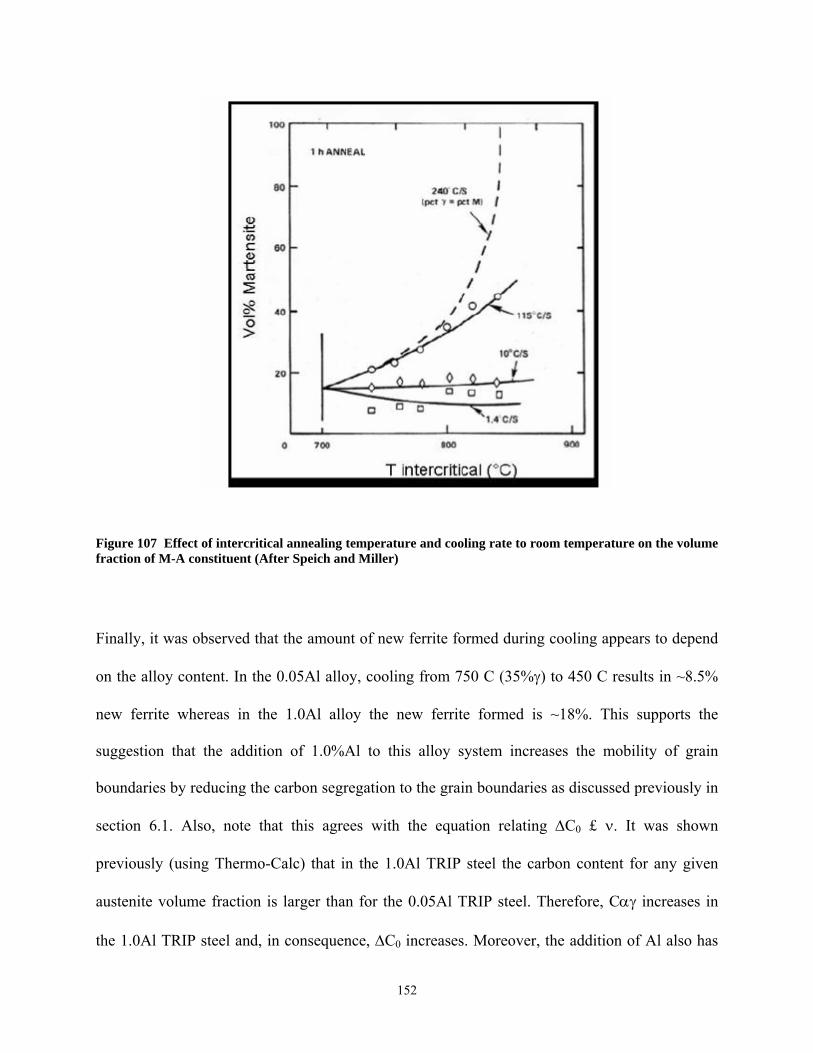
Figure 107 Effect of intercritical annealing temperature and cooling rate to room temperature on the volume fraction of M-A constituent (After Speich and Miller)
Finally, it was observed that the amount of new ferrite formed during cooling appears to depend
on the alloy content. In the 0.05Al alloy, cooling from 750 C (35%γ) to 450 C results in ~8.5%
new ferrite whereas in the 1.0Al alloy the new ferrite formed is ~18%. This supports the
suggestion that the addition of 1.0%Al to this alloy system increases the mobility of grain
boundaries by reducing the carbon segregation to the grain boundaries as discussed previously in
section 6.1. Also, note that this agrees with the equation relating ∆C0 £ ν. It was shown
previously (using Thermo-Calc) that in the 1.0Al TRIP steel the carbon content for any given
austenite volume fraction is larger than for the 0.05Al TRIP steel. Therefore, Cαγ increases in
the 1.0Al TRIP steel and, in consequence, ∆C0 increases. Moreover, the addition of Al also has
152
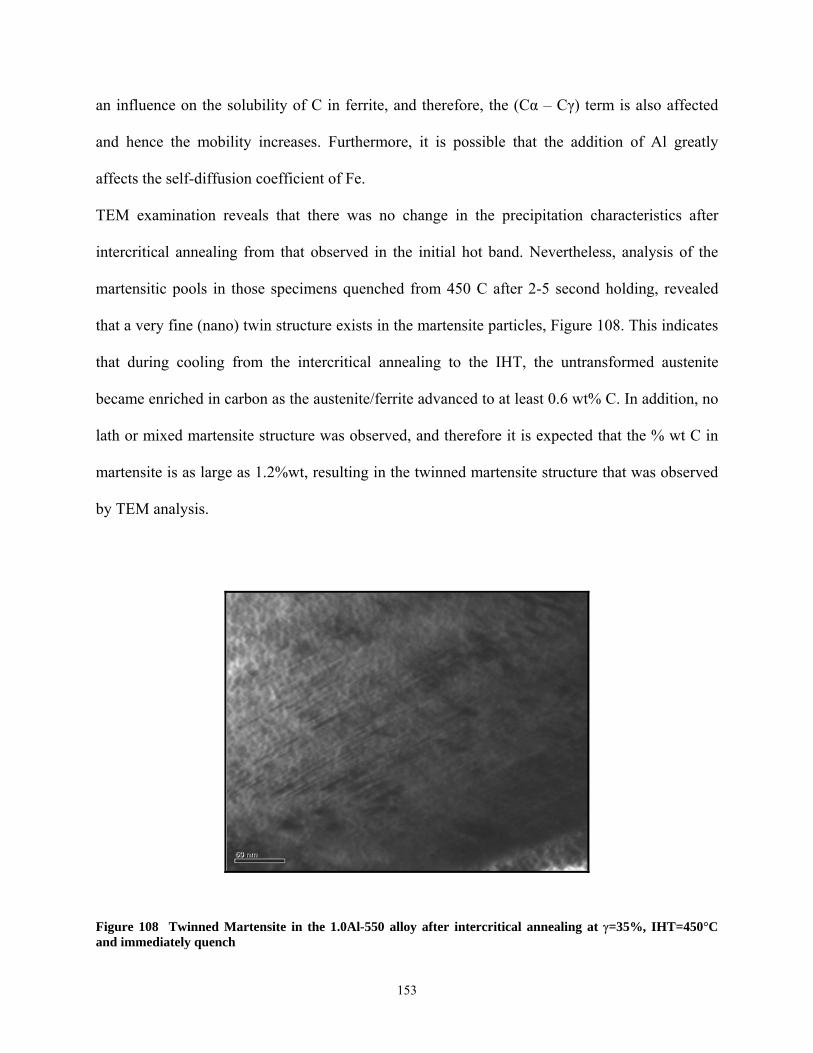
an influence on the solubility of C in ferrite, and therefore, the (Cα – Cγ) term is also affected
and hence the mobility increases. Furthermore, it is possible that the addition of Al greatly
affects the self-diffusion coefficient of Fe.
TEM examination reveals that there was no change in the precipitation characteristics after
intercritical annealing from that observed in the initial hot band. Nevertheless, analysis of the
martensitic pools in those specimens quenched from 450 C after 2-5 second holding, revealed
that a very fine (nano) twin structure exists in the martensite particles, Figure 108. This indicates
that during cooling from the intercritical annealing to the IHT, the untransformed austenite
became enriched in carbon as the austenite/ferrite advanced to at least 0.6 wt% C. In addition, no
lath or mixed martensite structure was observed, and therefore it is expected that the % wt C in
martensite is as large as 1.2%wt, resulting in the twinned martensite structure that was observed
by TEM analysis.
Figure 108 Twinned Martensite in the 1.0Al-550 alloy after intercritical annealing at γ=35%, IHT=450°C and immediately quench
153
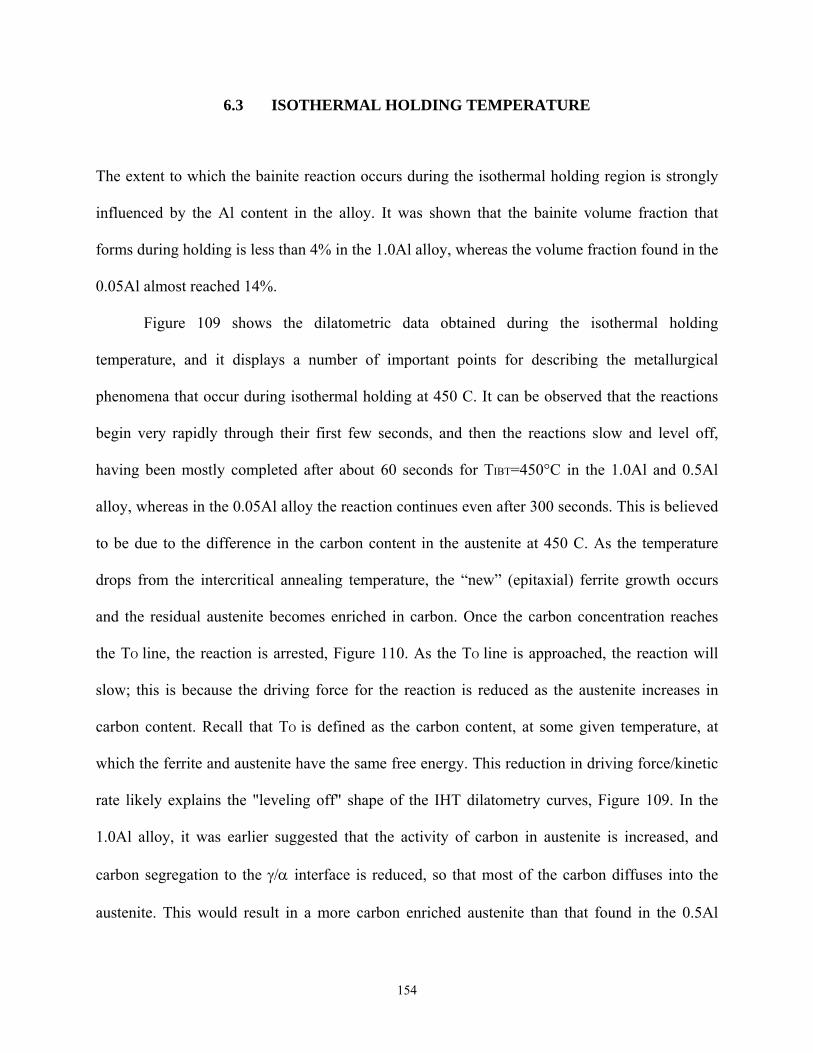
6.3 ISOTHERMAL HOLDING TEMPERATURE
The extent to which the bainite reaction occurs during the isothermal holding region is strongly
influenced by the Al content in the alloy. It was shown that the bainite volume fraction that
forms during holding is less than 4% in the 1.0Al alloy, whereas the volume fraction found in the
0.05Al almost reached 14%.
Figure 109 shows the dilatometric data obtained during the isothermal holding
temperature, and it displays a number of important points for describing the metallurgical
phenomena that occur during isothermal holding at 450 C. It can be observed that the reactions
begin very rapidly through their first few seconds, and then the reactions slow and level off,
having been mostly completed after about 60 seconds for TIBT=450°C in the 1.0Al and 0.5Al
alloy, whereas in the 0.05Al alloy the reaction continues even after 300 seconds. This is believed
to be due to the difference in the carbon content in the austenite at 450 C. As the temperature
drops from the intercritical annealing temperature, the “new” (epitaxial) ferrite growth occurs
and the residual austenite becomes enriched in carbon. Once the carbon concentration reaches
the TO line, the reaction is arrested, Figure 110. As the TO line is approached, the reaction will
slow; this is because the driving force for the reaction is reduced as the austenite increases in
carbon content. Recall that TO is defined as the carbon content, at some given temperature, at
which the ferrite and austenite have the same free energy. This reduction in driving force/kinetic
rate likely explains the "leveling off" shape of the IHT dilatometry curves, Figure 109. In the
1.0Al alloy, it was earlier suggested that the activity of carbon in austenite is increased, and
carbon segregation to the γ/α interface is reduced, so that most of the carbon diffuses into the
austenite. This would result in a more carbon enriched austenite than that found in the 0.5Al
154
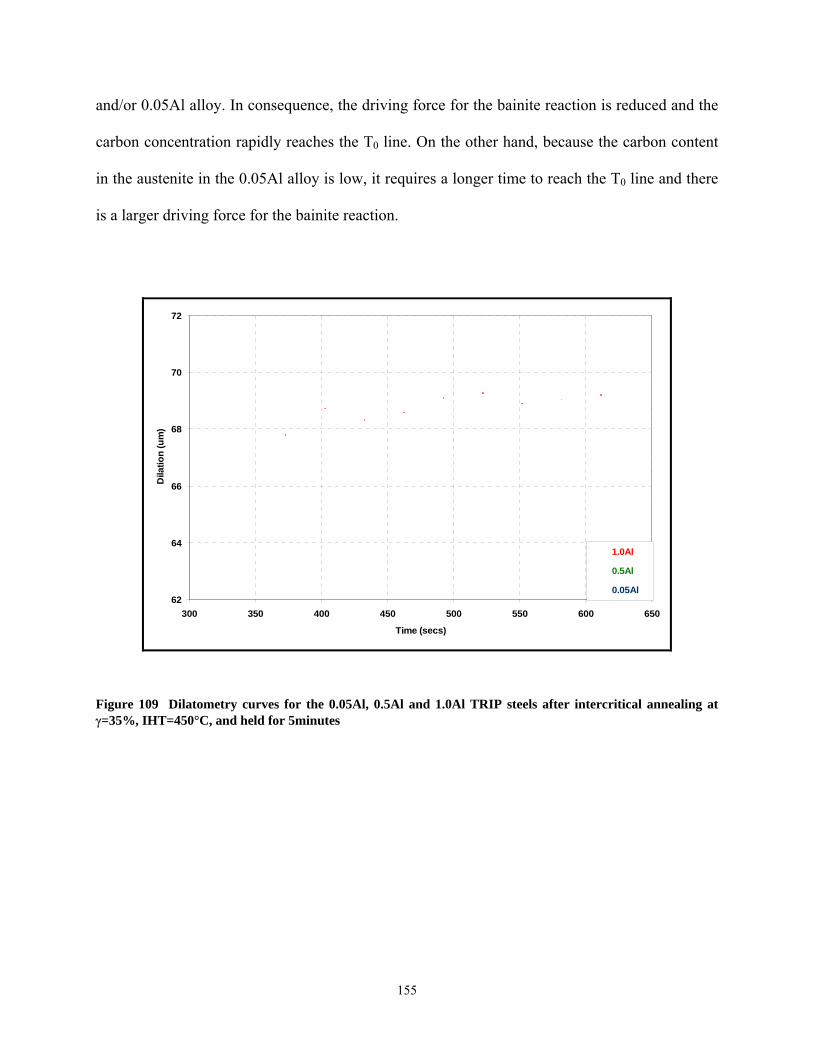
and/or 0.05Al alloy. In consequence, the driving force for the bainite reaction is reduced and the
carbon concentration rapidly reaches the T0 line. On the other hand, because the carbon content
in the austenite in the 0.05Al alloy is low, it requires a longer time to reach the T0 line and there
is a larger driving force for the bainite reaction.
62
64
66
68
70
72
300 350 400 450 500 550 600 650
Time (secs)
Dila
tion
(um
)
1.0Al
0.5Al
0.05Al
Figure 109 Dilatometry curves for the 0.05Al, 0.5Al and 1.0Al TRIP steels after intercritical annealing at γ=35%, IHT=450°C, and held for 5minutes
155
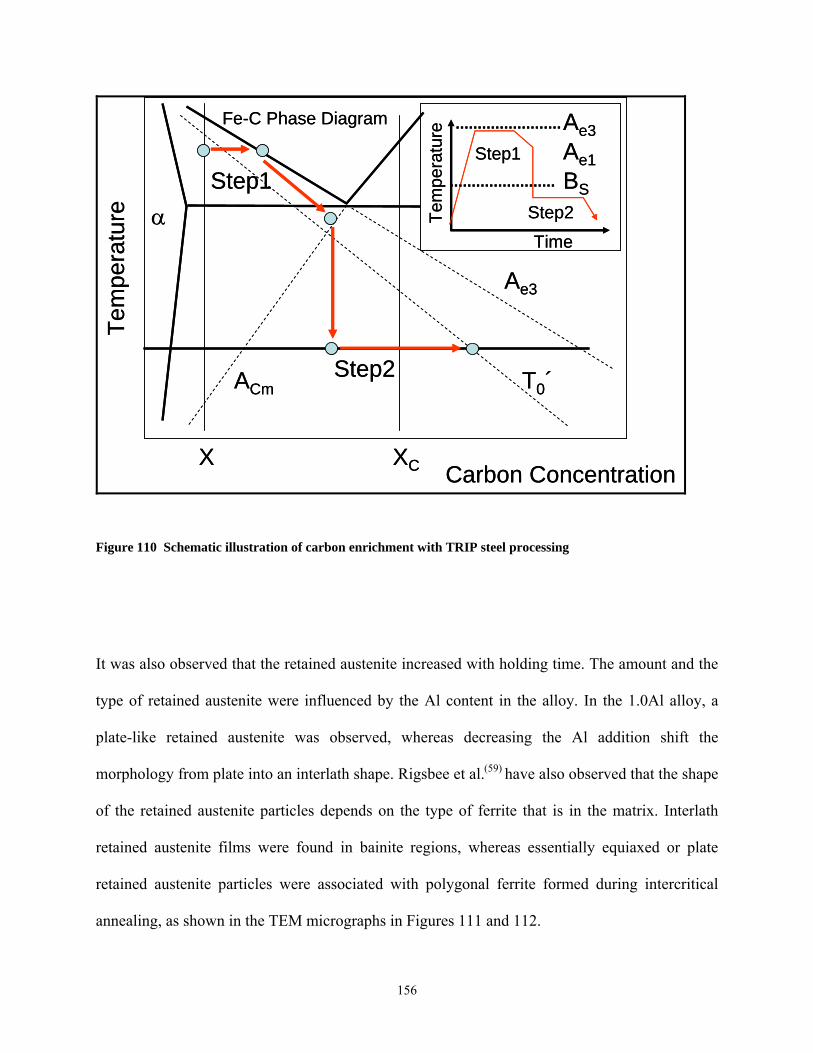
Carbon ConcentrationXC
Ae3
ACm
Ae3Ae1BS
T0´
X
Step1
Step2
Step1
Step2
Tem
pera
ture
Time
Tem
pera
ture
Fe-C Phase Diagram
α
Carbon ConcentrationXC
Ae3
ACm
Ae3Ae1BS
T0´
X
Step1
Step2
Step1
Step2
Tem
pera
ture
Time
Tem
pera
ture
Fe-C Phase Diagram
α
Figure 110 Schematic illustration of carbon enrichment with TRIP steel processing
It was also observed that the retained austenite increased with holding time. The amount and the
type of retained austenite were influenced by the Al content in the alloy. In the 1.0Al alloy, a
plate-like retained austenite was observed, whereas decreasing the Al addition shift the
morphology from plate into an interlath shape. Rigsbee et al.(59) have also observed that the shape
of the retained austenite particles depends on the type of ferrite that is in the matrix. Interlath
retained austenite films were found in bainite regions, whereas essentially equiaxed or plate
retained austenite particles were associated with polygonal ferrite formed during intercritical
annealing, as shown in the TEM micrographs in Figures 111 and 112.
156
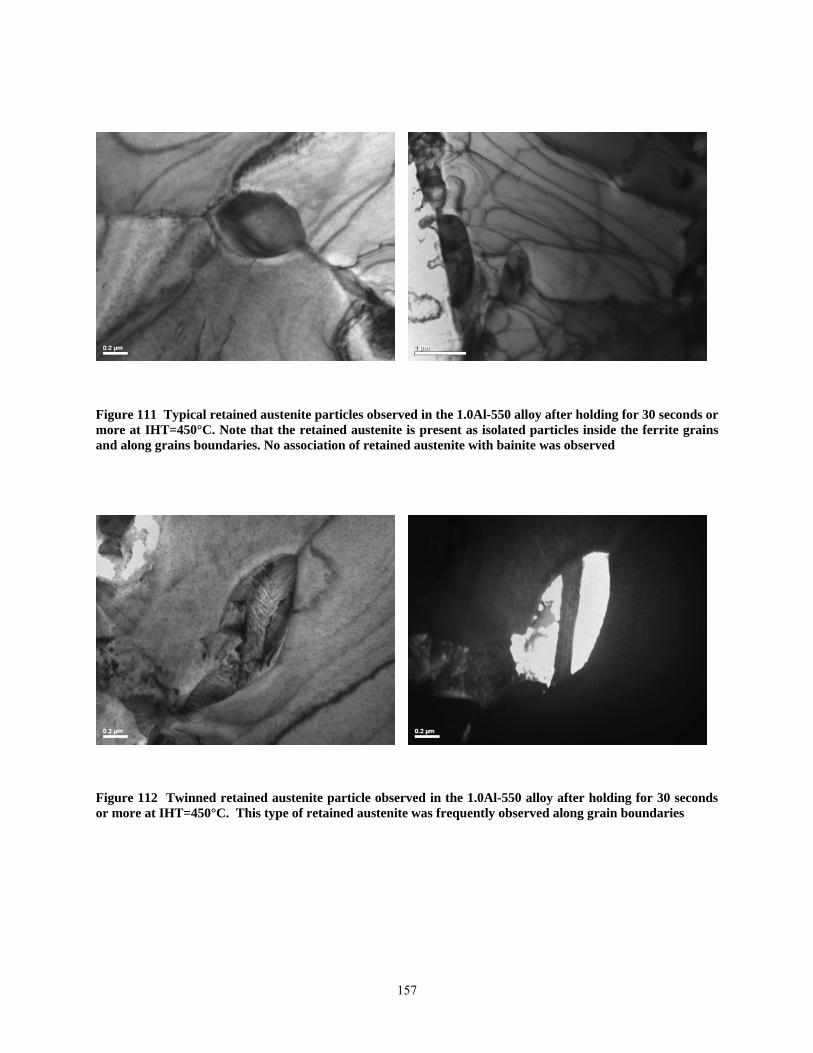
Figure 111 Typical retained austenite particles observed in the 1.0Al-550 alloy after holding for 30 seconds or more at IHT=450°C. Note that the retained austenite is present as isolated particles inside the ferrite grains and along grains boundaries. No association of retained austenite with bainite was observed
Figure 112 Twinned retained austenite particle observed in the 1.0Al-550 alloy after holding for 30 seconds or more at IHT=450°C. This type of retained austenite was frequently observed along grain boundaries
157
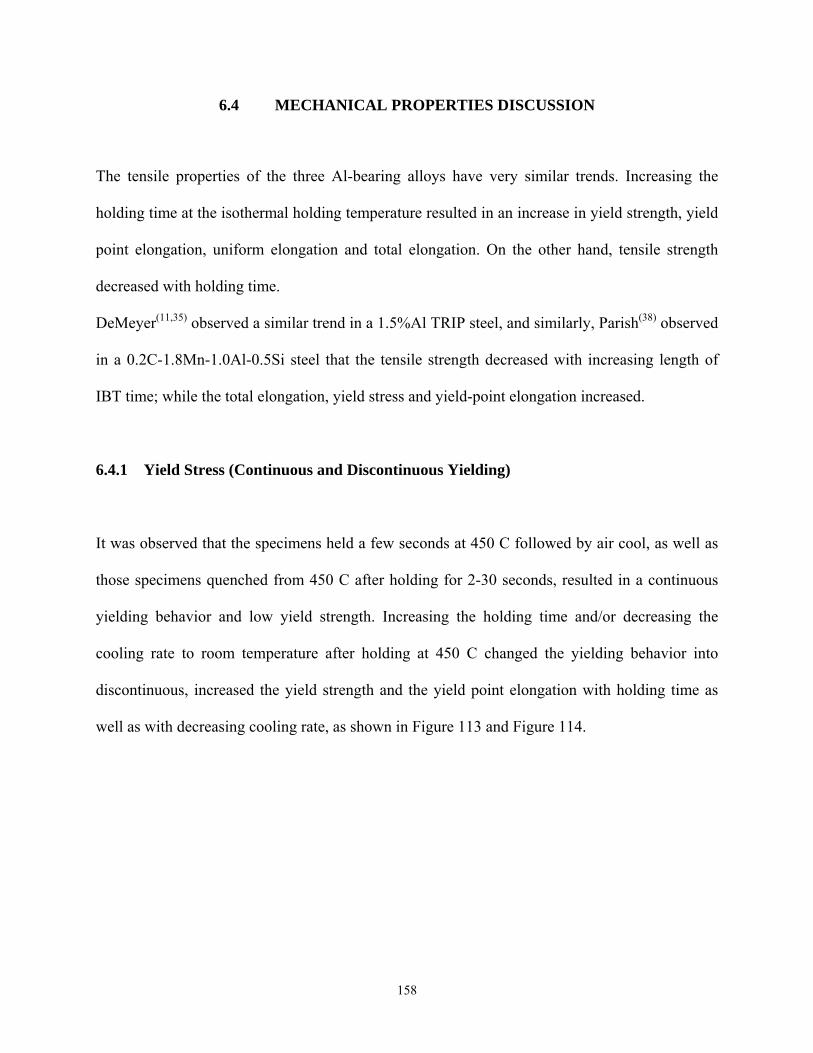
6.4 MECHANICAL PROPERTIES DISCUSSION
The tensile properties of the three Al-bearing alloys have very similar trends. Increasing the
holding time at the isothermal holding temperature resulted in an increase in yield strength, yield
point elongation, uniform elongation and total elongation. On the other hand, tensile strength
decreased with holding time.
DeMeyer(11,35) observed a similar trend in a 1.5%Al TRIP steel, and similarly, Parish(38) observed
in a 0.2C-1.8Mn-1.0Al-0.5Si steel that the tensile strength decreased with increasing length of
IBT time; while the total elongation, yield stress and yield-point elongation increased.
6.4.1 Yield Stress (Continuous and Discontinuous Yielding)
It was observed that the specimens held a few seconds at 450 C followed by air cool, as well as
those specimens quenched from 450 C after holding for 2-30 seconds, resulted in a continuous
yielding behavior and low yield strength. Increasing the holding time and/or decreasing the
cooling rate to room temperature after holding at 450 C changed the yielding behavior into
discontinuous, increased the yield strength and the yield point elongation with holding time as
well as with decreasing cooling rate, as shown in Figure 113 and Figure 114.
158
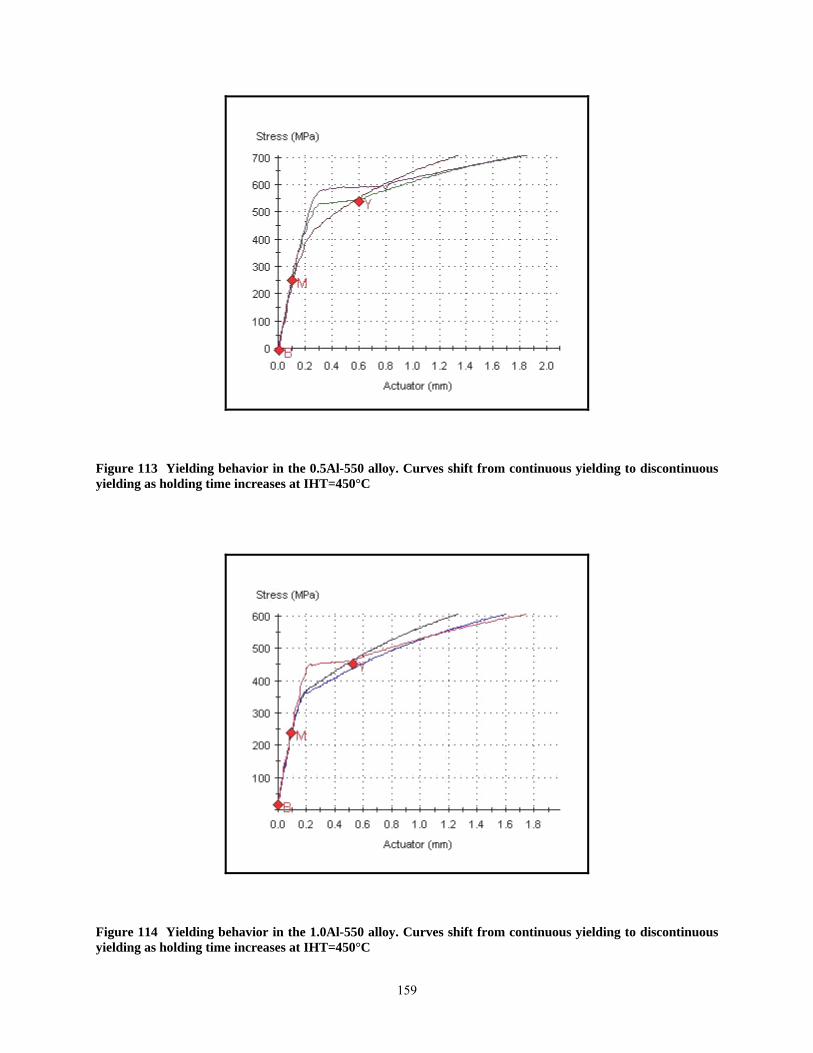
Figure 113 Yielding behavior in the 0.5Al-550 alloy. Curves shift from continuous yielding to discontinuous yielding as holding time increases at IHT=450°C
Figure 114 Yielding behavior in the 1.0Al-550 alloy. Curves shift from continuous yielding to discontinuous yielding as holding time increases at IHT=450°C
159
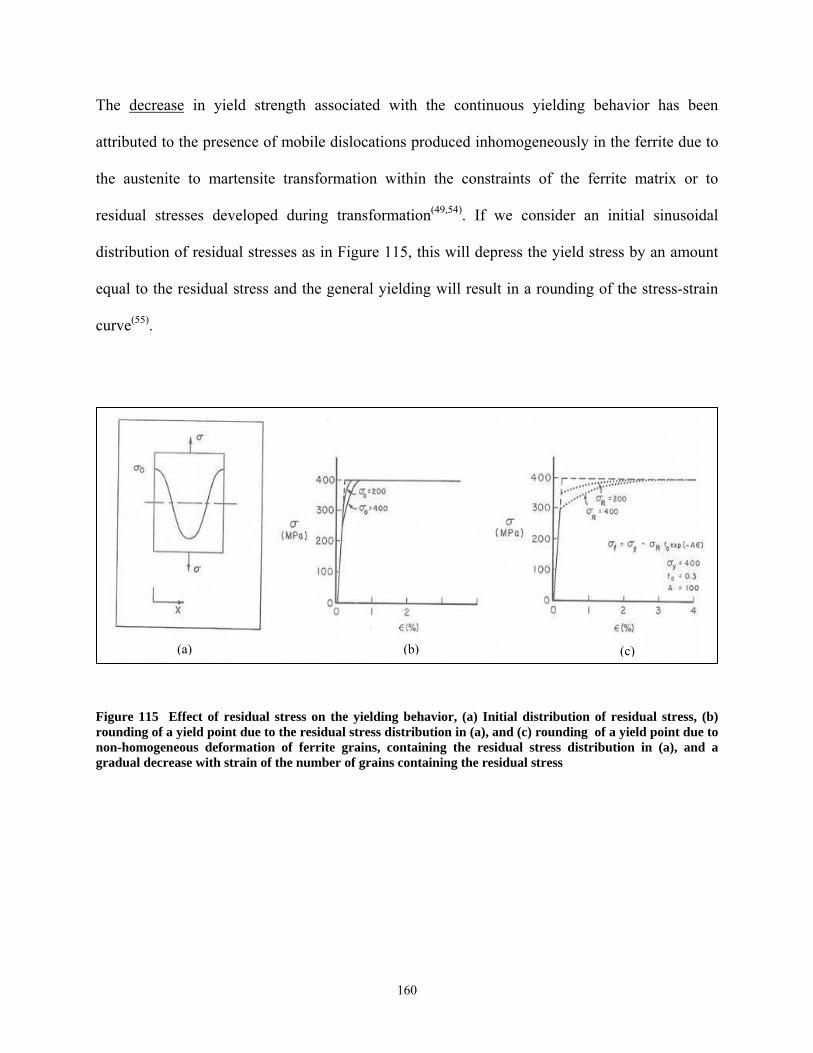
The decrease in yield strength associated with the continuous yielding behavior has been
attributed to the presence of mobile dislocations produced inhomogeneously in the ferrite due to
the austenite to martensite transformation within the constraints of the ferrite matrix or to
residual stresses developed during transformation(49,54). If we consider an initial sinusoidal
distribution of residual stresses as in Figure 115, this will depress the yield stress by an amount
equal to the residual stress and the general yielding will result in a rounding of the stress-strain
curve(55).
)
Figure 115 Erounding of anon-homogengradual decre
(a)
ffect of residual stress on the yielding yield point due to the residual stress dieous deformation of ferrite grains, coase with strain of the number of grains
(b
behavior, (a) Initial distribution of rstribution in (a), and (c) rounding of antaining the residual stress distribu
containing the residual stress
160
(c)
esidual stress, (b) yield point due to tion in (a), and a
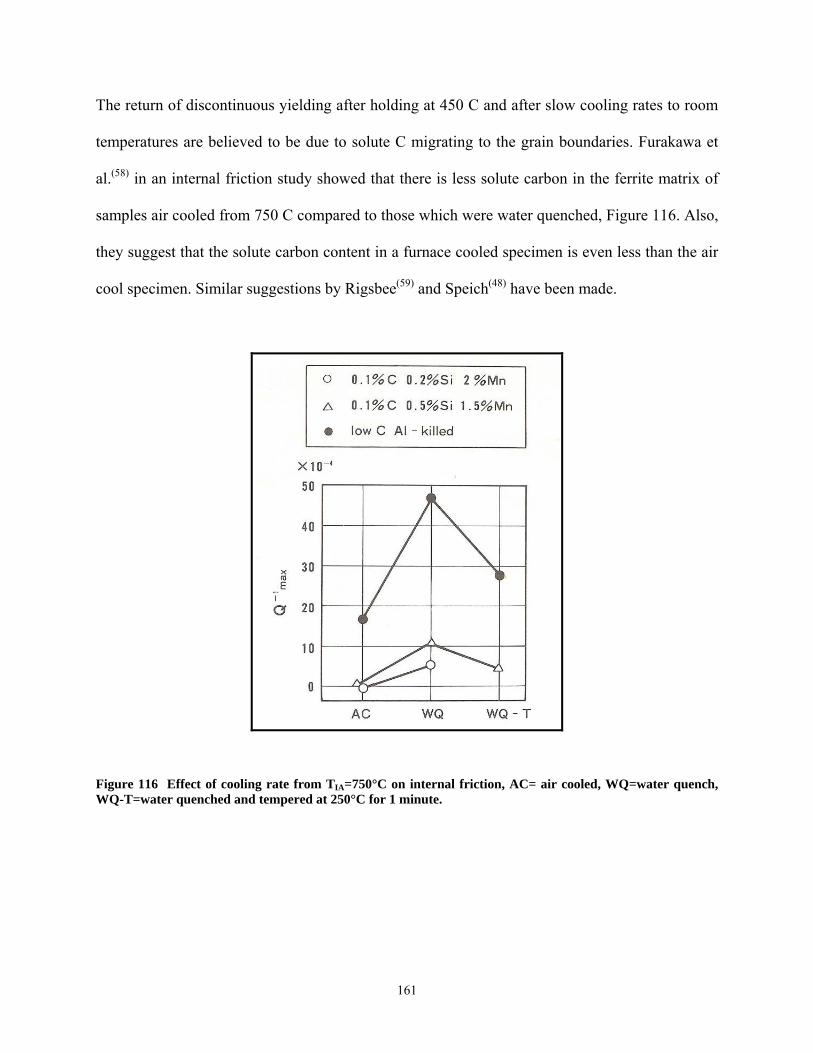
The return of discontinuous yielding after holding at 450 C and after slow cooling rates to room
temperatures are believed to be due to solute C migrating to the grain boundaries. Furakawa et
al.(58) in an internal friction study showed that there is less solute carbon in the ferrite matrix of
samples air cooled from 750 C compared to those which were water quenched, Figure 116. Also,
they suggest that the solute carbon content in a furnace cooled specimen is even less than the air
cool specimen. Similar suggestions by Rigsbee(59) and Speich(48) have been made.
Figure 116 Effect of cooling rate from TIA=750°C on internal friction, AC= air cooled, WQ=water quench, WQ-T=water quenched and tempered at 250°C for 1 minute.
161
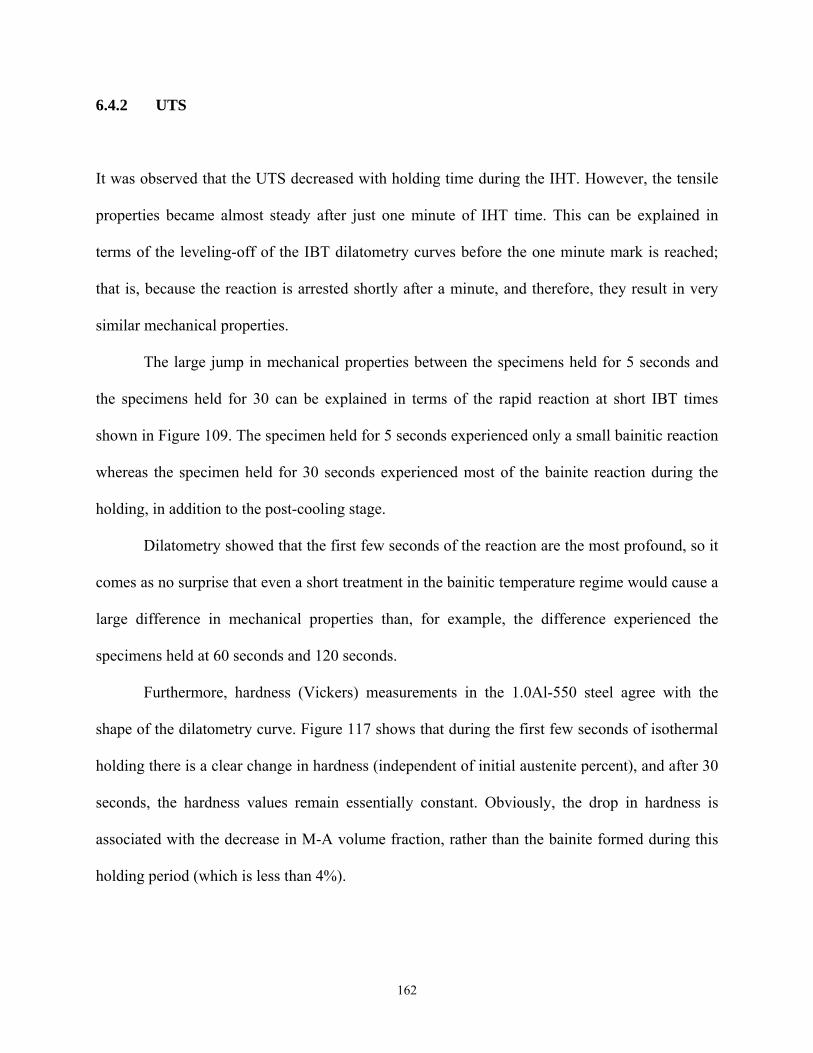
6.4.2 UTS
It was observed that the UTS decreased with holding time during the IHT. However, the tensile
properties became almost steady after just one minute of IHT time. This can be explained in
terms of the leveling-off of the IBT dilatometry curves before the one minute mark is reached;
that is, because the reaction is arrested shortly after a minute, and therefore, they result in very
similar mechanical properties.
The large jump in mechanical properties between the specimens held for 5 seconds and
the specimens held for 30 can be explained in terms of the rapid reaction at short IBT times
shown in Figure 109. The specimen held for 5 seconds experienced only a small bainitic reaction
whereas the specimen held for 30 seconds experienced most of the bainite reaction during the
holding, in addition to the post-cooling stage.
Dilatometry showed that the first few seconds of the reaction are the most profound, so it
comes as no surprise that even a short treatment in the bainitic temperature regime would cause a
large difference in mechanical properties than, for example, the difference experienced the
specimens held at 60 seconds and 120 seconds.
Furthermore, hardness (Vickers) measurements in the 1.0Al-550 steel agree with the
shape of the dilatometry curve. Figure 117 shows that during the first few seconds of isothermal
holding there is a clear change in hardness (independent of initial austenite percent), and after 30
seconds, the hardness values remain essentially constant. Obviously, the drop in hardness is
associated with the decrease in M-A volume fraction, rather than the bainite formed during this
holding period (which is less than 4%).
162
100
140
180
220
260
300
-10 10 30 50 70 90 110 130
Time (secs)
Har
dnes
s (V
HN
)
TIA=860 C
TIA=770 C
Figure 117 Effect of holding time at 450°C after cooling at 15 C/sec from TIA= 770°C and 860°C on the hardness (Vickers) of the 1.0Al-550 steel
Despite the fact that the hardness remains almost constant after holding for 30 seconds,
the tensile strength and elongation values are observed to change with holding time. Given the
relatively small magnitude of the bainite reaction in the 1.0Al alloy, equal to about 4% volume
fraction, it is surprising to observe such changes in tensile strength and total elongation. Almost
identical results were observed by Parish. As suggested in his research work(38), rather than
austenite enrichment, a homogenization of carbon is taking place. Using Brande’s(90) values of
carbon diffusion in austenite, and extrapolating to 416°C, a diffusion constant DC=5x10⁻⁴
µm2/sec is calculated. A diffusion distance calculation(91,92) indicates diffusion distances of
163
170nm for C in austenite after 1 minute at 416°C, and 390nm after 5 minutes. Because the
dimensions of retained austenite in these steels are on the order of 200-600 nm, this indicates that
simple homogenization is a possible mechanism of the stabilization between zero IHT and 2
minutes IHT. If, for example, an austenite island present at the start of the IHT had a steep
carbon gradient, in which the boundaries were enriched, it might be possible that the boundary
area would have an MS well below room temperature, while the center of the particle still had MS
> RT. Thus, upon cooling, the center of the particle would necessarily transform to martensite.
However, after carbon homogenization, the areas of high-carbon-content would have been
depleted in carbon while the lower carbon areas were enriched. If this pushed all regions of the
particle below MS, the particle would necessarily be retained upon cooling to room temperature.
Figure 118 shows schematically this hypothetical situation, both before (a) and after (b) the
homogenization during the holding period. Thus, although there is little dilatometrically
observable transformation, the IHT stage would still show a significant effect upon room-
temperature properties.
This mechanism of carbon homogenization appears to be valid, since TEM observations
in specimens held for 30 seconds at 450 C confirmed retained austenite and martensite coexisting
within the same particle, Figure 119 and Figure 120. Furthermore, XRD measurements showed
that the carbon content of the retained austenite decreased with holding time, suggesting that at
short holding times the austenite was highly enriched, and as homogenization occurred, carbon
diffused into the remaining particle, and in consequence, the average austenite particles resulted
in lower carbon content, Figure 121.
164
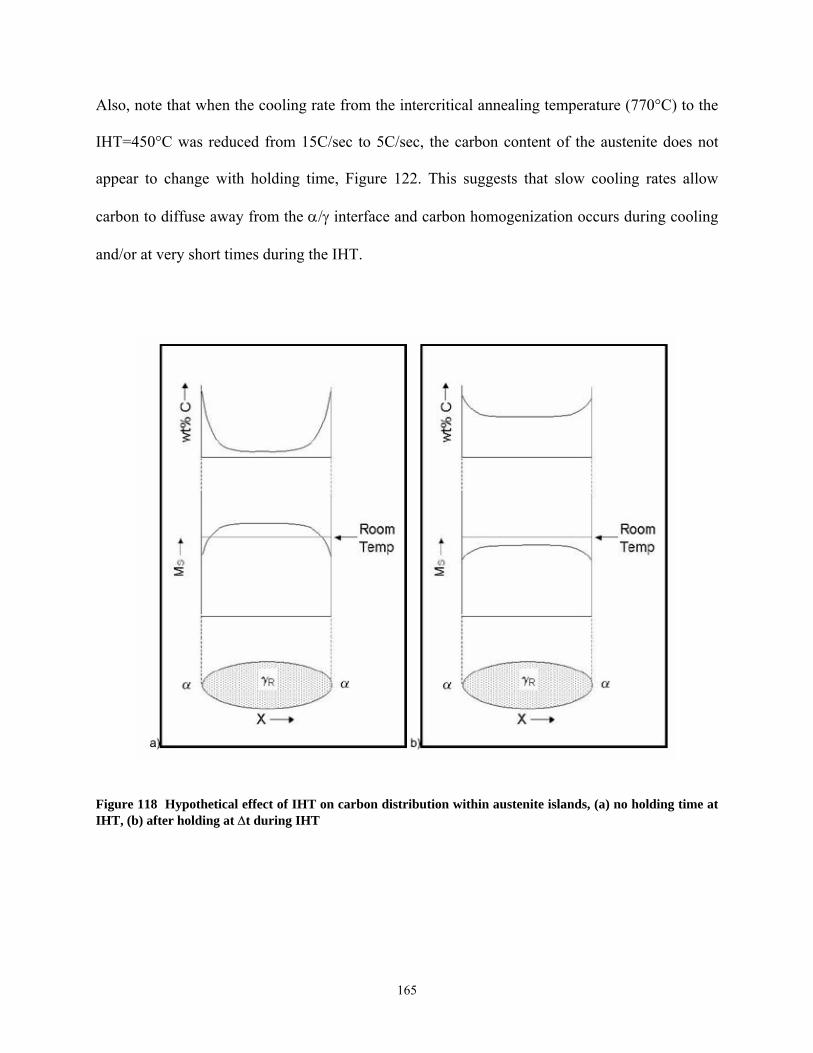
Also, note that when the cooling rate from the intercritical annealing temperature (770°C) to the
IHT=450°C was reduced from 15C/sec to 5C/sec, the carbon content of the austenite does not
appear to change with holding time, Figure 122. This suggests that slow cooling rates allow
carbon to diffuse away from the α/γ interface and carbon homogenization occurs during cooling
and/or at very short times during the IHT.
Figure 118 Hypothetical effect of IHT on carbon distribution within austenite islands, (a) no holding time at IHT, (b) after holding at ∆t during IHT
165
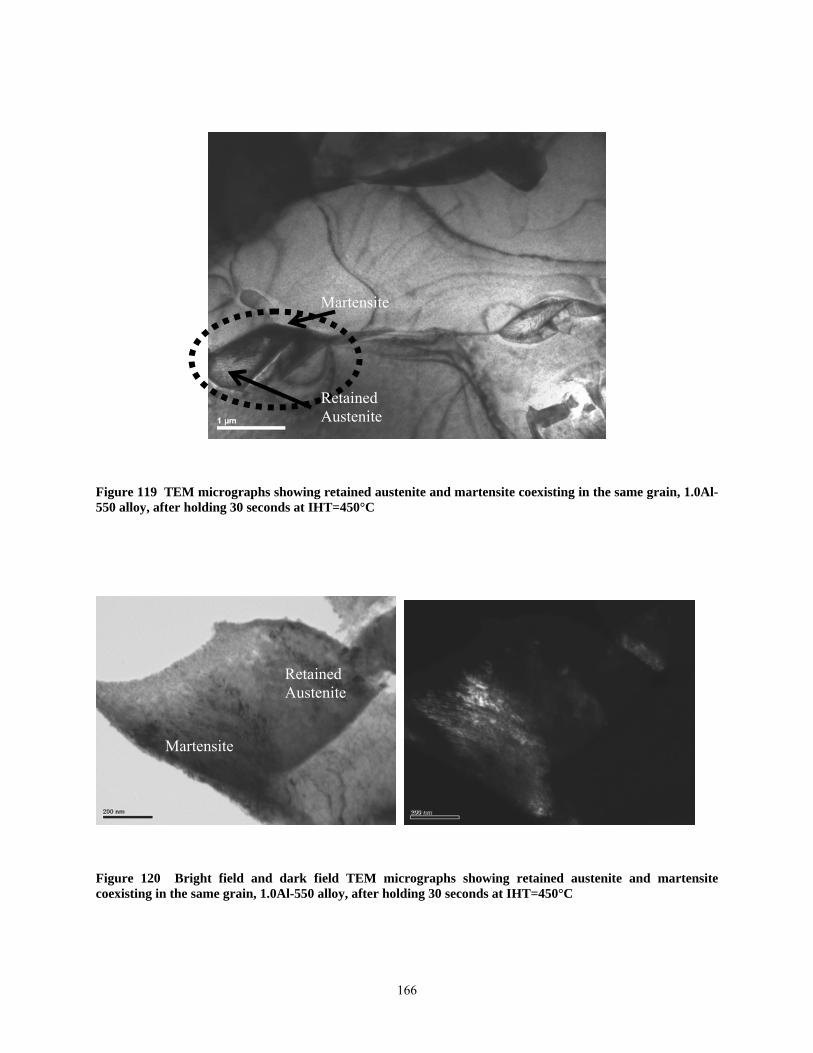
Martensite
Retained Austenite
Figure 119 TEM micrographs showing retained austenite and martensite coexisting in the same grain, 1.0Al-550 alloy, after holding 30 seconds at IHT=450°C
Retained Austenite
Martensite
Figure 120 Bright field and dark field TEM micrographs showing retained austenite and martensite coexisting in the same grain, 1.0Al-550 alloy, after holding 30 seconds at IHT=450°C
166
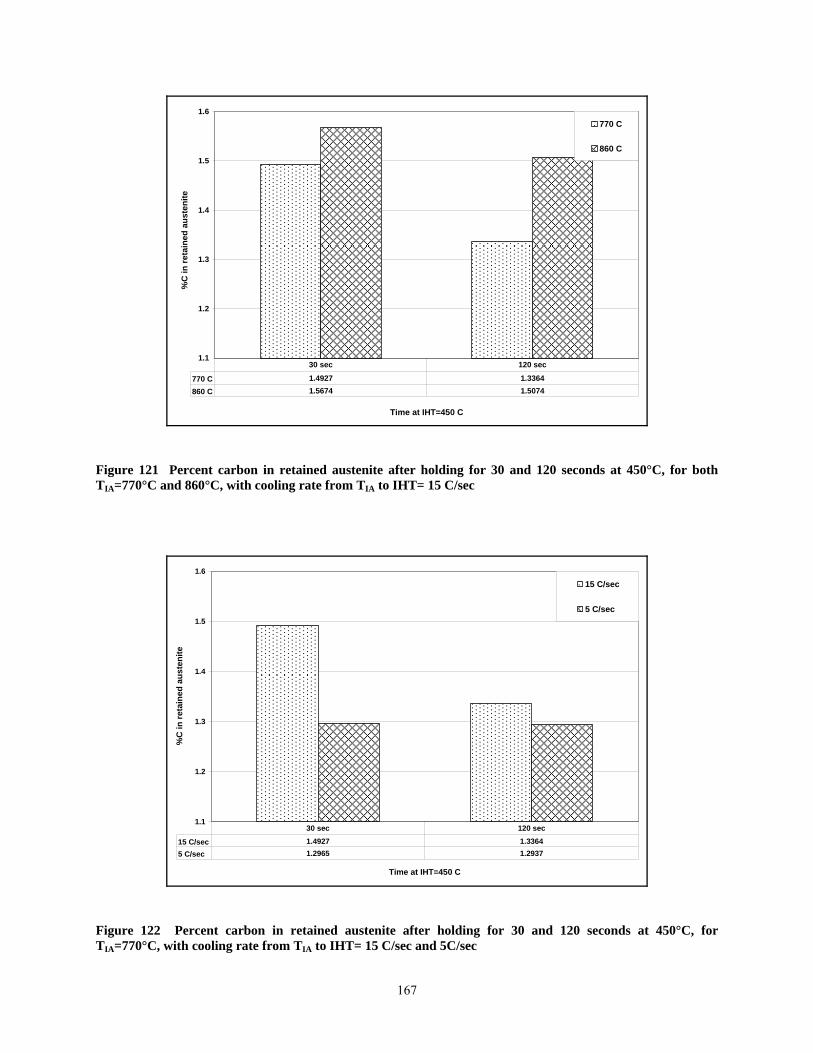
1.1
1.2
1.3
1.4
1.5
1.6
Time at IHT=450 C
%C
in re
tain
ed a
uste
nite
770 C
860 C
770 C 1.4927 1.3364860 C 1.5674 1.5074
30 sec 120 sec
Figure 121 Percent carbon in retained austenite after holding for 30 and 120 seconds at 450°C, for both TIA=770°C and 860°C, with cooling rate from TIA to IHT= 15 C/sec
1.1
1.2
1.3
1.4
1.5
1.6
Time at IHT=450 C
%C
in re
tain
ed a
uste
nite
15 C/sec
5 C/sec
15 C/sec 1.4927 1.33645 C/sec 1.2965 1.2937
30 sec 120 sec
Figure 122 Percent carbon in retained austenite after holding for 30 and 120 seconds at 450°C, for TIA=770°C, with cooling rate from TIA to IHT= 15 C/sec and 5C/sec
167
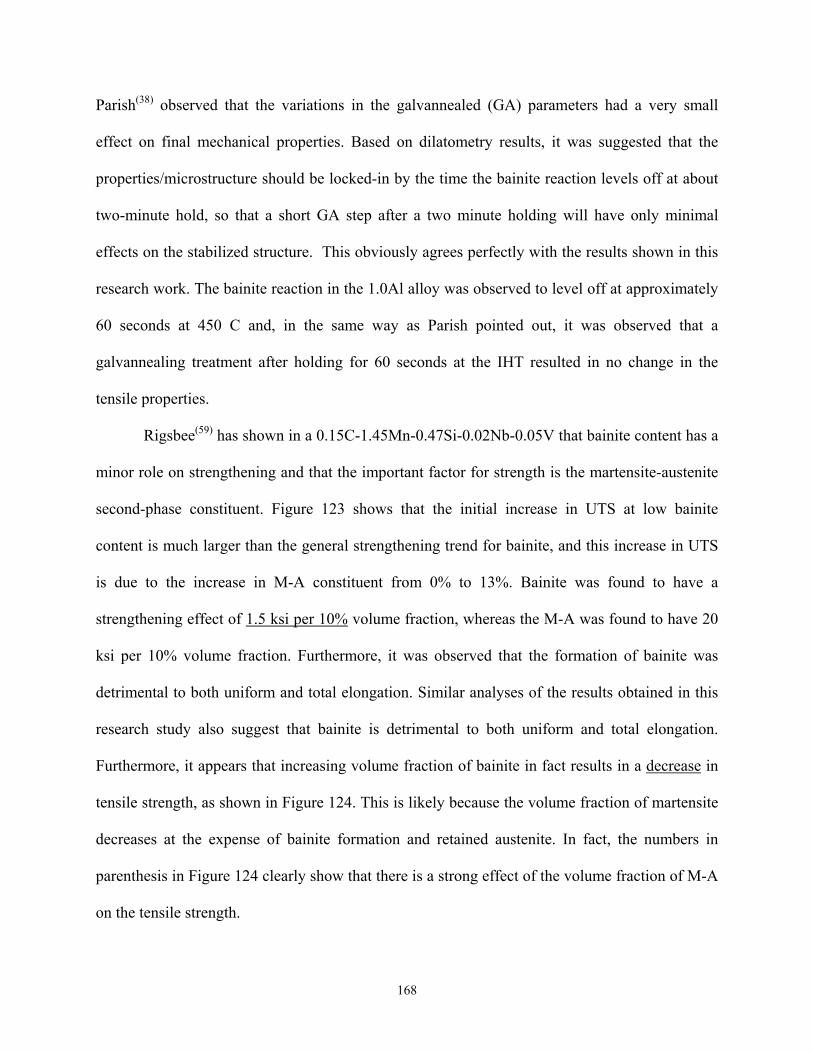
Parish(38) observed that the variations in the galvannealed (GA) parameters had a very small
effect on final mechanical properties. Based on dilatometry results, it was suggested that the
properties/microstructure should be locked-in by the time the bainite reaction levels off at about
two-minute hold, so that a short GA step after a two minute holding will have only minimal
effects on the stabilized structure. This obviously agrees perfectly with the results shown in this
research work. The bainite reaction in the 1.0Al alloy was observed to level off at approximately
60 seconds at 450 C and, in the same way as Parish pointed out, it was observed that a
galvannealing treatment after holding for 60 seconds at the IHT resulted in no change in the
tensile properties.
Rigsbee(59) has shown in a 0.15C-1.45Mn-0.47Si-0.02Nb-0.05V that bainite content has a
minor role on strengthening and that the important factor for strength is the martensite-austenite
second-phase constituent. Figure 123 shows that the initial increase in UTS at low bainite
content is much larger than the general strengthening trend for bainite, and this increase in UTS
is due to the increase in M-A constituent from 0% to 13%. Bainite was found to have a
strengthening effect of 1.5 ksi per 10% volume fraction, whereas the M-A was found to have 20
ksi per 10% volume fraction. Furthermore, it was observed that the formation of bainite was
detrimental to both uniform and total elongation. Similar analyses of the results obtained in this
research study also suggest that bainite is detrimental to both uniform and total elongation.
Furthermore, it appears that increasing volume fraction of bainite in fact results in a decrease in
tensile strength, as shown in Figure 124. This is likely because the volume fraction of martensite
decreases at the expense of bainite formation and retained austenite. In fact, the numbers in
parenthesis in Figure 124 clearly show that there is a strong effect of the volume fraction of M-A
on the tensile strength.
168
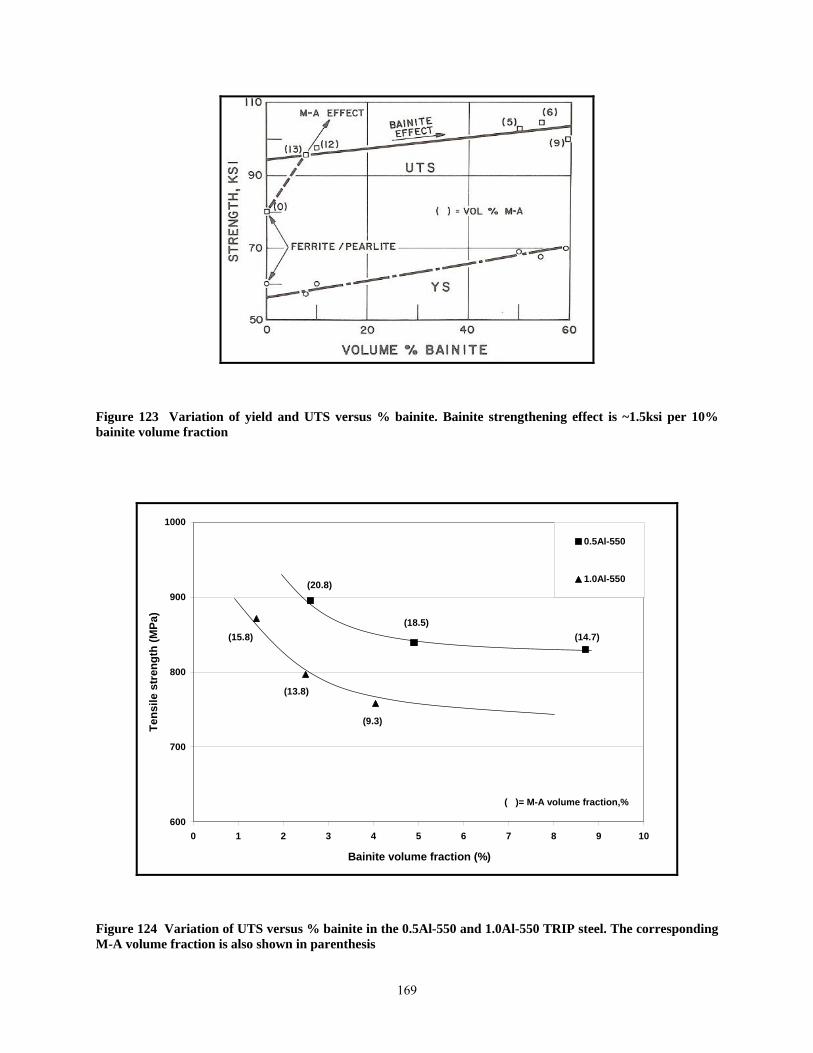
Figure 123 Variation of yield and UTS versus % bainite. Bainite strengthening effect is ~1.5ksi per 10% bainite volume fraction
600
700
800
900
1000
0 1 2 3 4 5 6 7 8 9 10
Bainite volume fraction (%)
Tens
ile s
tren
gth
(MPa
)
0.5Al-550
1.0Al-550
(9.3)
(13.8)
(15.8)(18.5)
(20.8)
( )= M-A volume fraction,%
(14.7)
Figure 124 Variation of UTS versus % bainite in the 0.5Al-550 and 1.0Al-550 TRIP steel. The corresponding M-A volume fraction is also shown in parenthesis
169
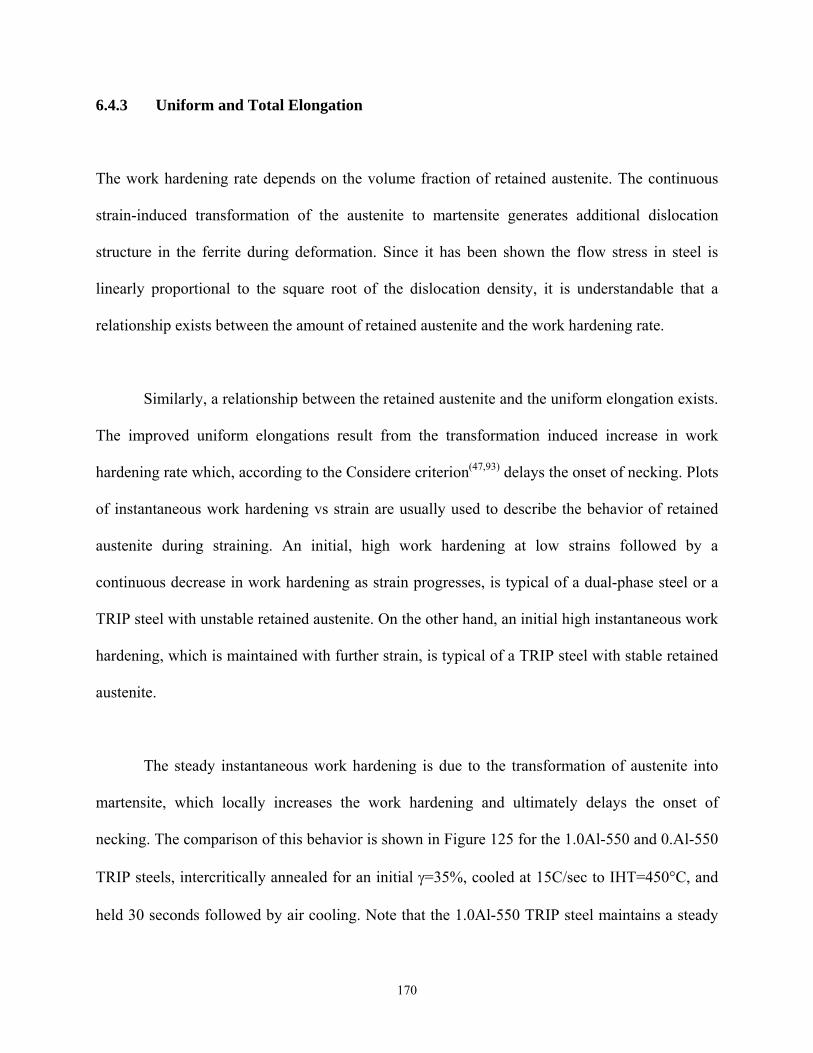
6.4.3 Uniform and Total Elongation
The work hardening rate depends on the volume fraction of retained austenite. The continuous
strain-induced transformation of the austenite to martensite generates additional dislocation
structure in the ferrite during deformation. Since it has been shown the flow stress in steel is
linearly proportional to the square root of the dislocation density, it is understandable that a
relationship exists between the amount of retained austenite and the work hardening rate.
Similarly, a relationship between the retained austenite and the uniform elongation exists.
The improved uniform elongations result from the transformation induced increase in work
hardening rate which, according to the Considere criterion(47,93) delays the onset of necking. Plots
of instantaneous work hardening vs strain are usually used to describe the behavior of retained
austenite during straining. An initial, high work hardening at low strains followed by a
continuous decrease in work hardening as strain progresses, is typical of a dual-phase steel or a
TRIP steel with unstable retained austenite. On the other hand, an initial high instantaneous work
hardening, which is maintained with further strain, is typical of a TRIP steel with stable retained
austenite.
The steady instantaneous work hardening is due to the transformation of austenite into
martensite, which locally increases the work hardening and ultimately delays the onset of
necking. The comparison of this behavior is shown in Figure 125 for the 1.0Al-550 and 0.Al-550
TRIP steels, intercritically annealed for an initial γ=35%, cooled at 15C/sec to IHT=450°C, and
held 30 seconds followed by air cooling. Note that the 1.0Al-550 TRIP steel maintains a steady
170
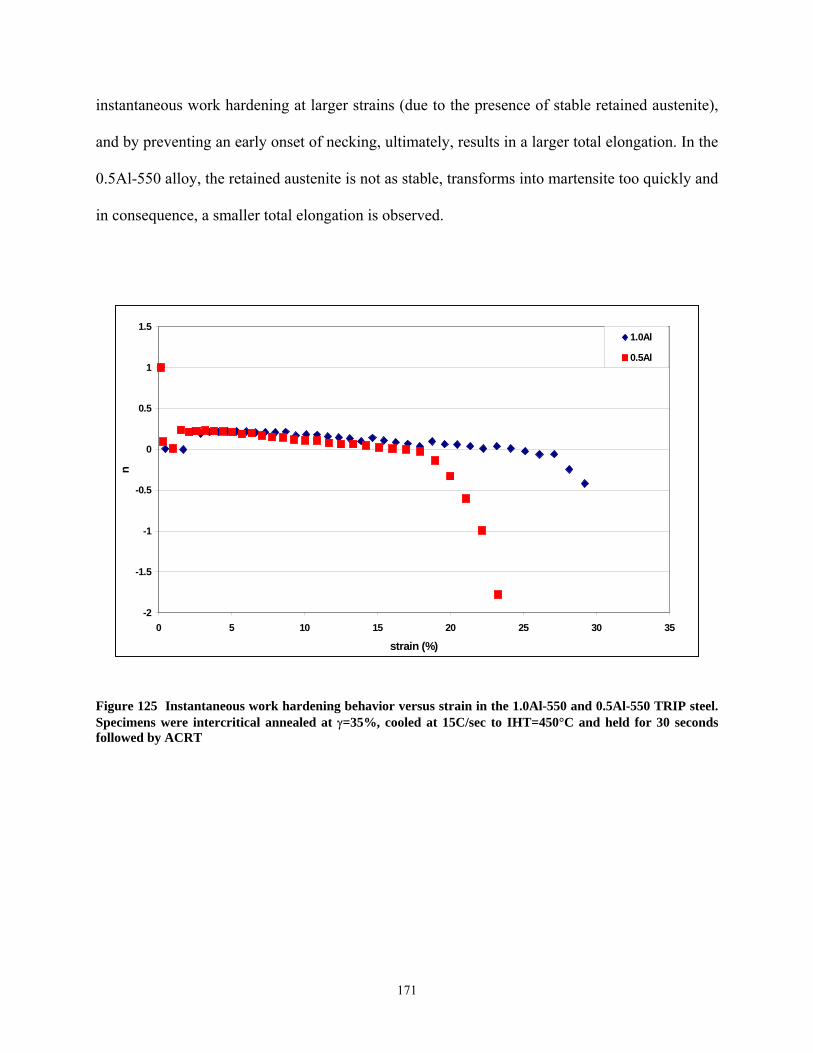
instantaneous work hardening at larger strains (due to the presence of stable retained austenite),
and by preventing an early onset of necking, ultimately, results in a larger total elongation. In the
0.5Al-550 alloy, the retained austenite is not as stable, transforms into martensite too quickly and
in consequence, a smaller total elongation is observed.
-2
-1.5
-1
-0.5
0
0.5
1
1.5
0 5 10 15 20 25 30 35
strain (%)
n
1.0Al
0.5Al
Figure 125 Instantaneous work hardening behavior versus strain in the 1.0Al-550 and 0.5Al-550 TRIP steel. Specimens were intercritical annealed at γ=35%, cooled at 15C/sec to IHT=450°C and held for 30 seconds followed by ACRT
171
7.0 CONCLUSIONS
It was established that it is possible to obtain TRIP steels with excellent mechanical properties
under conventional CGL processing parameters by using Al, Nb-Mo additions. It was observed
that the best TRIP steel was the 1.0Al-550 alloy, which achieved tensile strengths of 800MPa
and elongations larger than 25%.
The following important conclusions were observed:
a) STAGE I. Intercritical Annealing: It was observed that Al additions greatly affect the Fe-
C phase diagram, expanding the α+γ region, and increasing both the Ac1 and Ac3 temperature.
Additions of 1.0Al wt% increased the Ac3 temperature close to 1000 C. Also, it was observed
that the rate of ferrite recrystallization was substantially increased and fully recrystallized grains
in the 1.0Al alloy were observed at temperatures well below intercritical annealing temperatures
equal to 35%γ or higher. In addition, Al additions >0.5%wt eliminated the effect of prior coiling
conditions on the volume fraction of austenite during intercritical annealing and on the
recrystallization of ferrite.
b) STAGE II. Cooling from TIA to IHT: It was observed that the volume fraction of “new”
epitaxial ferrite is strongly influenced by both the Al additions and the intercritical annealing
temperature. More “new” epitaxial ferrite is formed with increasing Al additions and higher
172
intercritical annealing temperatures. Also, it was observed that increasing the Al content to
1.0%wt eliminated the bainite curve in the CCT diagrams, and retained austenite was observed
rather than martensite. No significant effect of prior coiling conditions on the volume fraction of
new epitaxial ferrite was observed.
c) STAGE III. Isothermal Holding Temperature: It was observed that the bainite reaction
does not occur extensively in Al added Nb-Mo TRIP steels. Only about 4% was present and only
after holding for 2 minutes in the IHT=450°C. Also, it was clearly observed that the stability of
the retained austenite is not associated with the bainite formation. Retained austenite particles
were observed along grain boundaries and inside ferrite grains. Furthermore, stable retained
austenite was obtained at short holding times, and therefore long isothermal holding times are
unnecessary. In addition, the cooling rate after IHT can have a significant effect on the amount
and stability of the retained austenite. It was observed that the optimum cooling rate is air
cooling. Faster cooling rates result in a larger amount of martensite, whereas slower cooling rates
result in carbon depletion towards the grain boundaries (as observed from the yield point
elongation in the tensile curves). Finally, essentially no retained austenite was observed when the
specimens where prior-coiled at 700 °C.
d) Mechanical Properties: A lower initial austenite percent during intercritical annealing results
in better tensile and elongation properties. Tensile strength decreased and elongation increased
with holding time during the IHT. The goal of UTS=800 MPa and %El=25-30% was achieved
with the 1.0Al-550 TRIP steel using heat cycles normally observed in a CGL, eliminating the
necessity of long IBT holding sections.
173
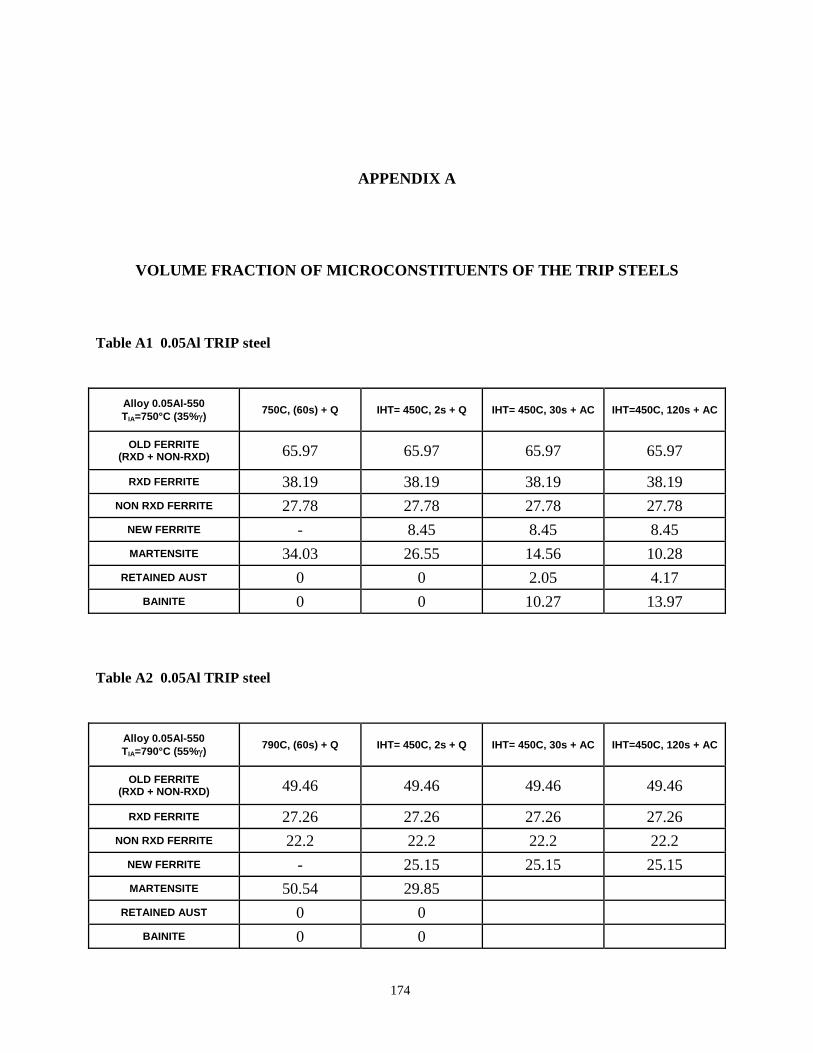
APPENDIX A
VOLUME FRACTION OF MICROCONSTITUENTS OF THE TRIP STEELS Table A1 0.05Al TRIP steel
Alloy 0.05Al-550 TIA=750°C (35%γ) 750C, (60s) + Q IHT= 450C, 2s + Q IHT= 450C, 30s + AC IHT=450C, 120s + AC
OLD FERRITE (RXD + NON-RXD) 65.97 65.97 65.97 65.97
RXD FERRITE 38.19 38.19 38.19 38.19 NON RXD FERRITE 27.78 27.78 27.78 27.78
NEW FERRITE - 8.45 8.45 8.45 MARTENSITE 34.03 26.55 14.56 10.28
RETAINED AUST 0 0 2.05 4.17 BAINITE 0 0 10.27 13.97
Table A2 0.05Al TRIP steel
Alloy 0.05Al-550 TIA=790°C (55%γ) 790C, (60s) + Q IHT= 450C, 2s + Q IHT= 450C, 30s + AC IHT=450C, 120s + AC
OLD FERRITE (RXD + NON-RXD) 49.46 49.46 49.46 49.46
RXD FERRITE 27.26 27.26 27.26 27.26 NON RXD FERRITE 22.2 22.2 22.2 22.2
NEW FERRITE - 25.15 25.15 25.15 MARTENSITE 50.54 29.85
RETAINED AUST 0 0 BAINITE 0 0
174
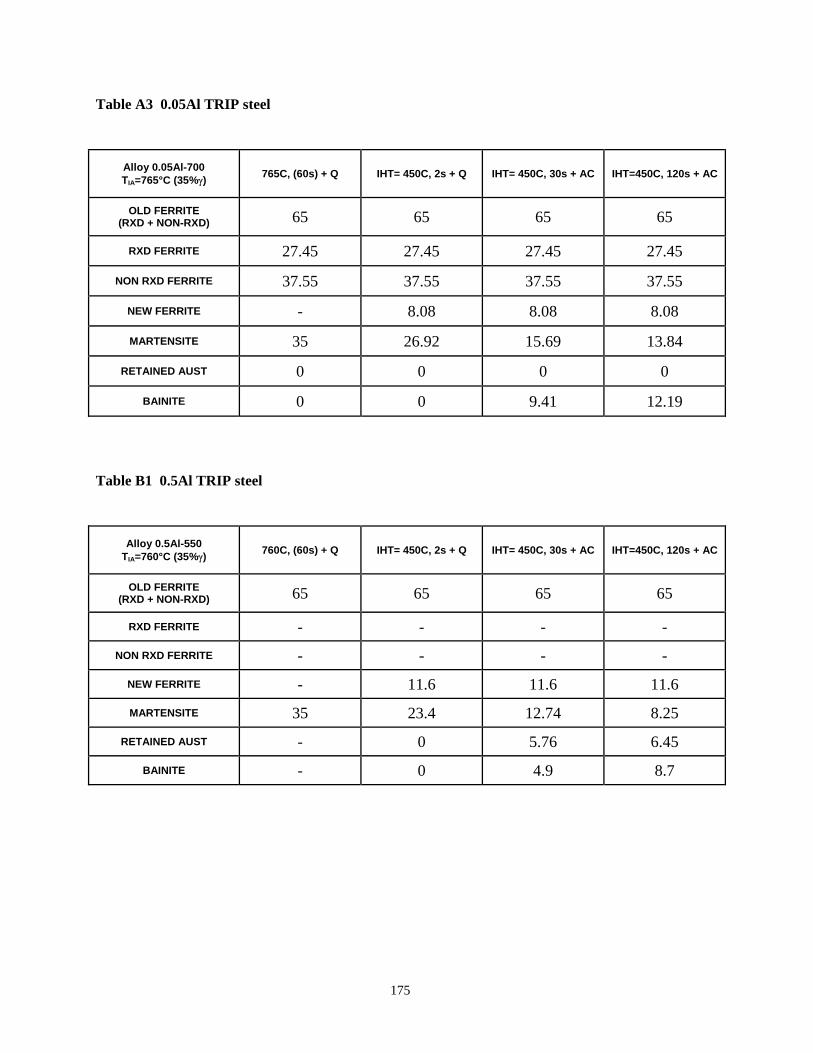
Table A3 0.05Al TRIP steel
Alloy 0.05Al-700 TIA=765°C (35%γ) 765C, (60s) + Q IHT= 450C, 2s + Q IHT= 450C, 30s + AC IHT=450C, 120s + AC
OLD FERRITE (RXD + NON-RXD) 65 65 65 65
RXD FERRITE 27.45 27.45 27.45 27.45
NON RXD FERRITE 37.55 37.55 37.55 37.55
NEW FERRITE - 8.08 8.08 8.08
MARTENSITE 35 26.92 15.69 13.84
RETAINED AUST 0 0 0 0
BAINITE 0 0 9.41 12.19 Table B1 0.5Al TRIP steel
Alloy 0.5Al-550 TIA=760°C (35%γ) 760C, (60s) + Q IHT= 450C, 2s + Q IHT= 450C, 30s + AC IHT=450C, 120s + AC
OLD FERRITE (RXD + NON-RXD) 65 65 65 65
RXD FERRITE - - - -
NON RXD FERRITE - - - -
NEW FERRITE - 11.6 11.6 11.6
MARTENSITE 35 23.4 12.74 8.25
RETAINED AUST - 0 5.76 6.45
BAINITE - 0 4.9 8.7
175
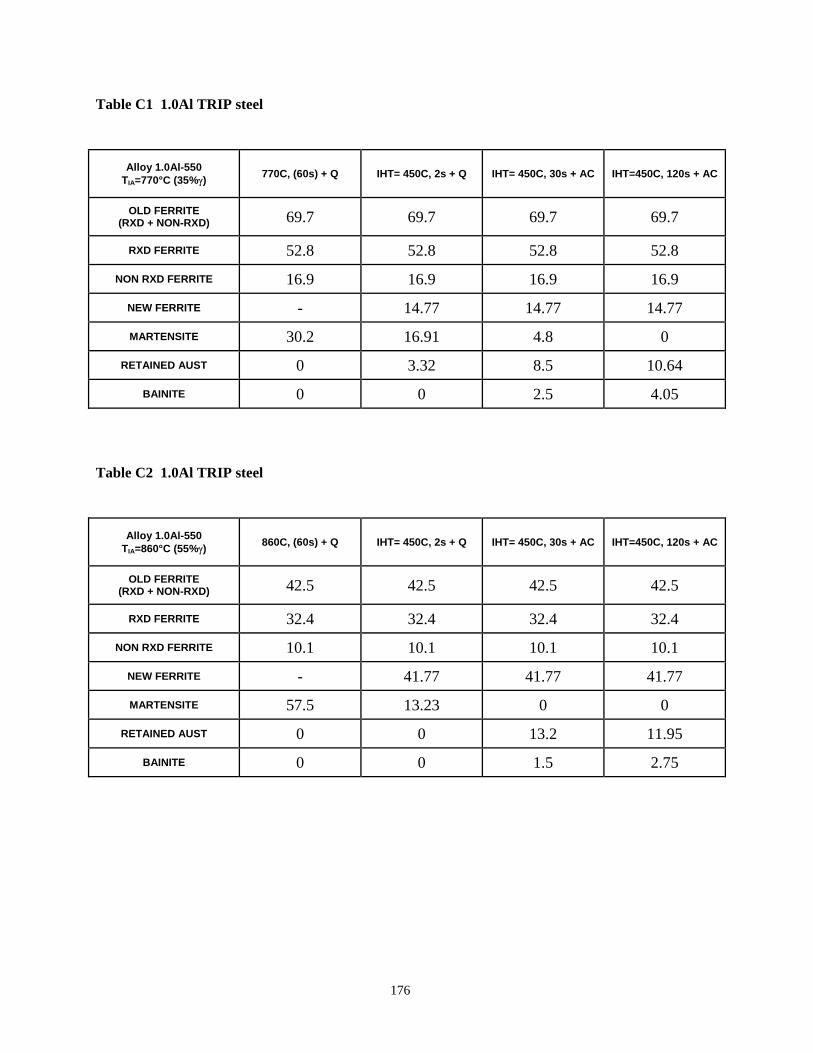
Table C1 1.0Al TRIP steel
Alloy 1.0Al-550 TIA=770°C (35%γ) 770C, (60s) + Q IHT= 450C, 2s + Q IHT= 450C, 30s + AC IHT=450C, 120s + AC
OLD FERRITE (RXD + NON-RXD) 69.7 69.7 69.7 69.7
RXD FERRITE 52.8 52.8 52.8 52.8
NON RXD FERRITE 16.9 16.9 16.9 16.9
NEW FERRITE - 14.77 14.77 14.77
MARTENSITE 30.2 16.91 4.8 0
RETAINED AUST 0 3.32 8.5 10.64
BAINITE 0 0 2.5 4.05 Table C2 1.0Al TRIP steel
Alloy 1.0Al-550 TIA=860°C (55%γ) 860C, (60s) + Q IHT= 450C, 2s + Q IHT= 450C, 30s + AC IHT=450C, 120s + AC
OLD FERRITE (RXD + NON-RXD) 42.5 42.5 42.5 42.5
RXD FERRITE 32.4 32.4 32.4 32.4
NON RXD FERRITE 10.1 10.1 10.1 10.1
NEW FERRITE - 41.77 41.77 41.77
MARTENSITE 57.5 13.23 0 0
RETAINED AUST 0 0 13.2 11.95
BAINITE 0 0 1.5 2.75
176
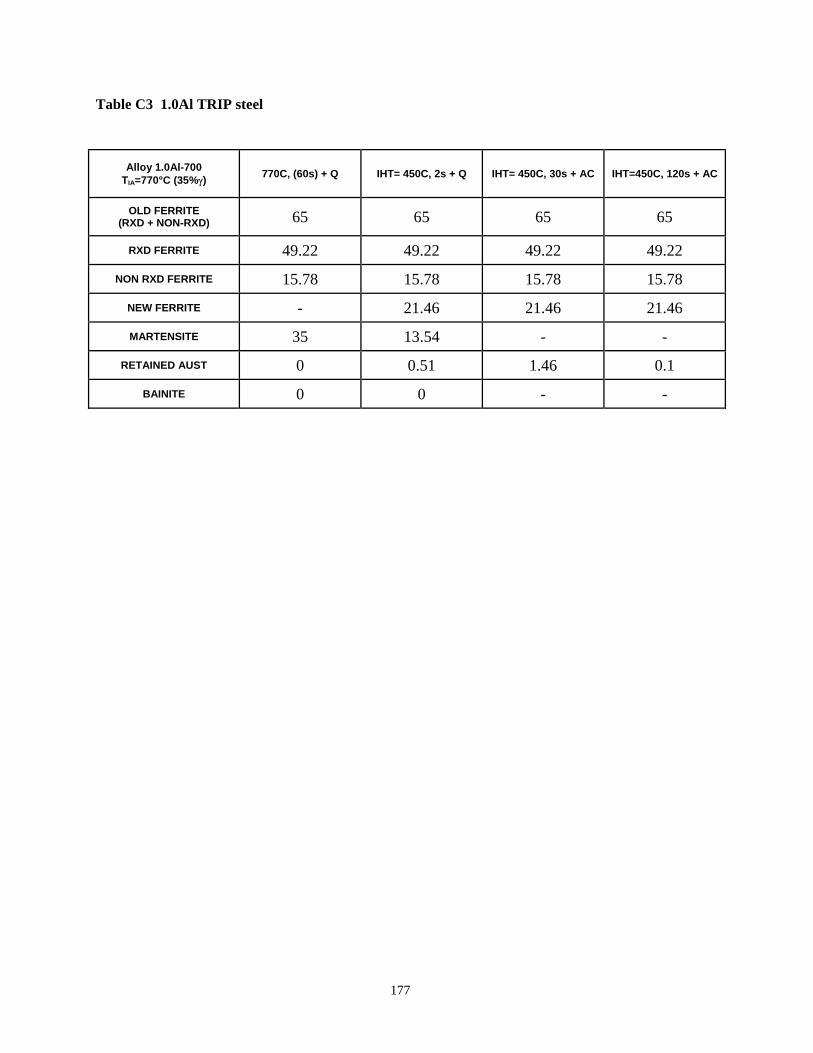
Table C3 1.0Al TRIP steel
Alloy 1.0Al-700 TIA=770°C (35%γ) 770C, (60s) + Q IHT= 450C, 2s + Q IHT= 450C, 30s + AC IHT=450C, 120s + AC
OLD FERRITE (RXD + NON-RXD) 65 65 65 65
RXD FERRITE 49.22 49.22 49.22 49.22
NON RXD FERRITE 15.78 15.78 15.78 15.78
NEW FERRITE - 21.46 21.46 21.46
MARTENSITE 35 13.54 - -
RETAINED AUST 0 0.51 1.46 0.1
BAINITE 0 0 - -
177
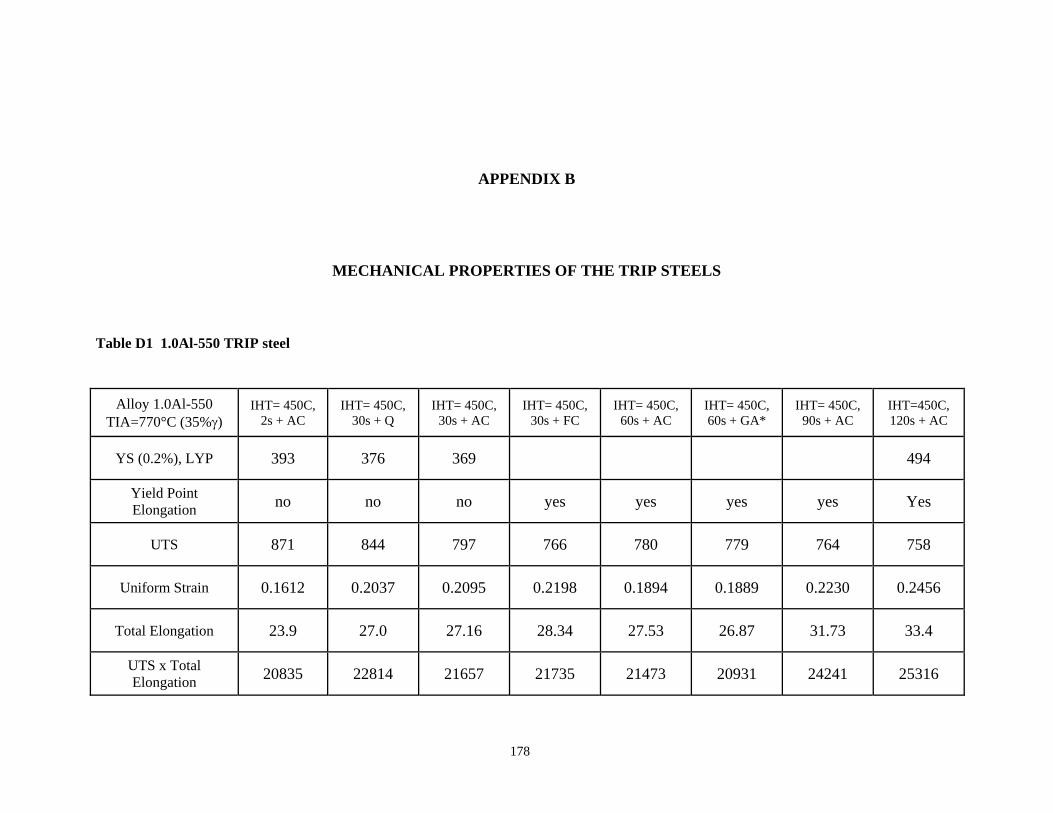
APPENDIX B
MECHANICAL PROPERTIES OF THE TRIP STEELS Table D1 1.0Al-550 TRIP steel
AlloyTIA=770°C γ)
IHT= 42s + AC
IHT= 430s + Q
IHT= 430s + AC
IHT= 430s + FC
IHT= 460s + AC
IHT= 460s + GA
IHT= 490s + AC
IHT=45120s + AC
1.0Al-550 (35%
50C, 50C, 50C,
50C,
50C,
50C, *
50C,
0C,
YS (0 393 376 369 494 .2%), LYP
YieElo yes yes yes yes ld Point
ngation no no no Yes
UTS 871 844 797 766 780 779 764 758
Uniform Strain 0.1612 0.2037 0.2095 0.2198 0.1894 0.1889 0.2230 0.2456
Total Elongation 23.9 27.0 27.16 28.34 27.53 26.87 31.73 33.4
UTElo
S x Total ngation 20835 22814 21657 21735 21473 20931 24241 25316
178
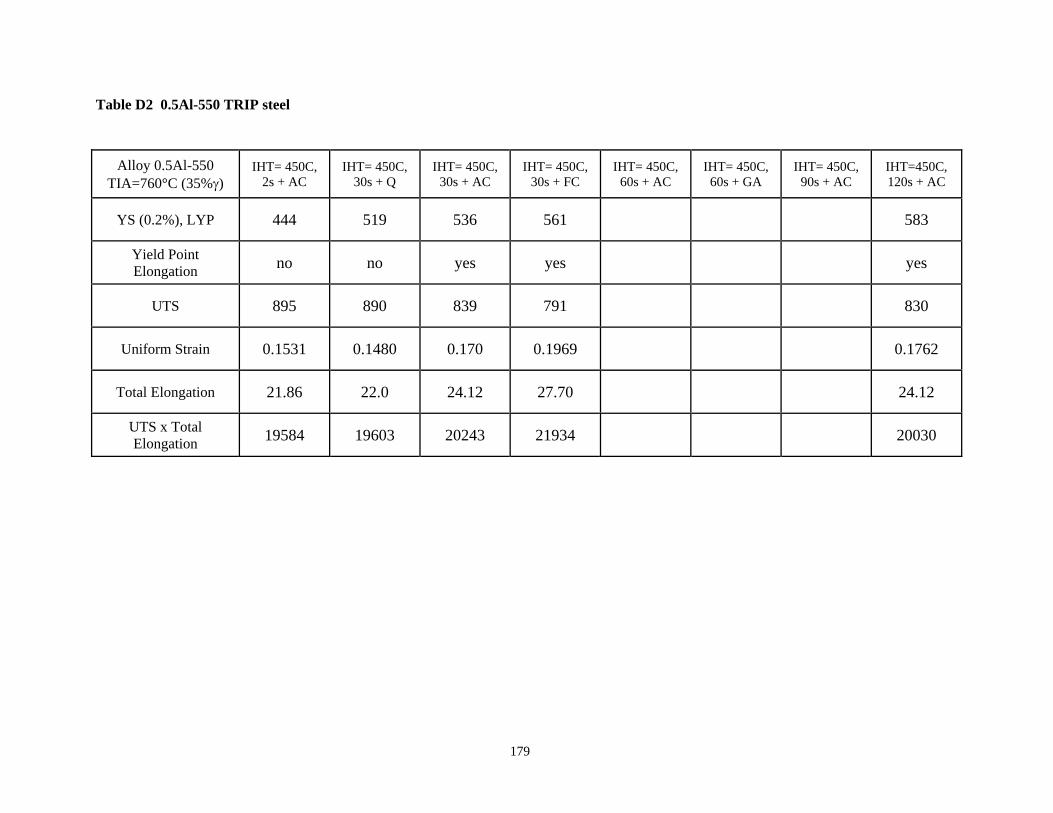
Table D2 0.5Al-550 TRIP steel
Alloy 0.5Al-TIA=760°C (35%
550 γ)
450C, + AC
I 0C, 3 Q
IHT , 30s
IHT= 30s + F
IHT= 460s + AC
IHT= 4560s + GA
IHT= 4590s + AC
IHT=45120s + AC
IHT=2s
HT= 450s +
= 450C+ AC
450C, C
50C,
0C, 0C, 0C,
YS (0.2%), LYP 44 56 4 519 536 1 583
Yield PoElongat
int ion yes yes no no yes
UTS 95 79 8 890 839 1 830
Uniform Strain 31 0 0. 0.17620.15 0.148 0.170 1969
Total Elongation 86 21. 22.0 24.12 27.70 24.12
UTS xElong
Total ation 84 21 20030195 19603 20243 934
179

Table D3 1.0Al-550 and 1.0Al -700TRIP steel
Alloy 1.0Al-550 1.0Al-700
Processing
Tensile Properties TIA=770°C (35%γ)
IHT= 450C, 30s + AC TIA=860°C (55%γ)
IHT= 450C, 30s + AC TIA=770°C (35%γ)
IHT= 450C, 30s + AC YS (0.2%), LYP 369 399
Yield Point Elongation no yes Yes UTS 797 723 736
Uniform Strain 0.209 0.2419 0.212 Total Elongation 27.16 31.61 28.65
UTS x Total Elongation 21657 22854 21100
180
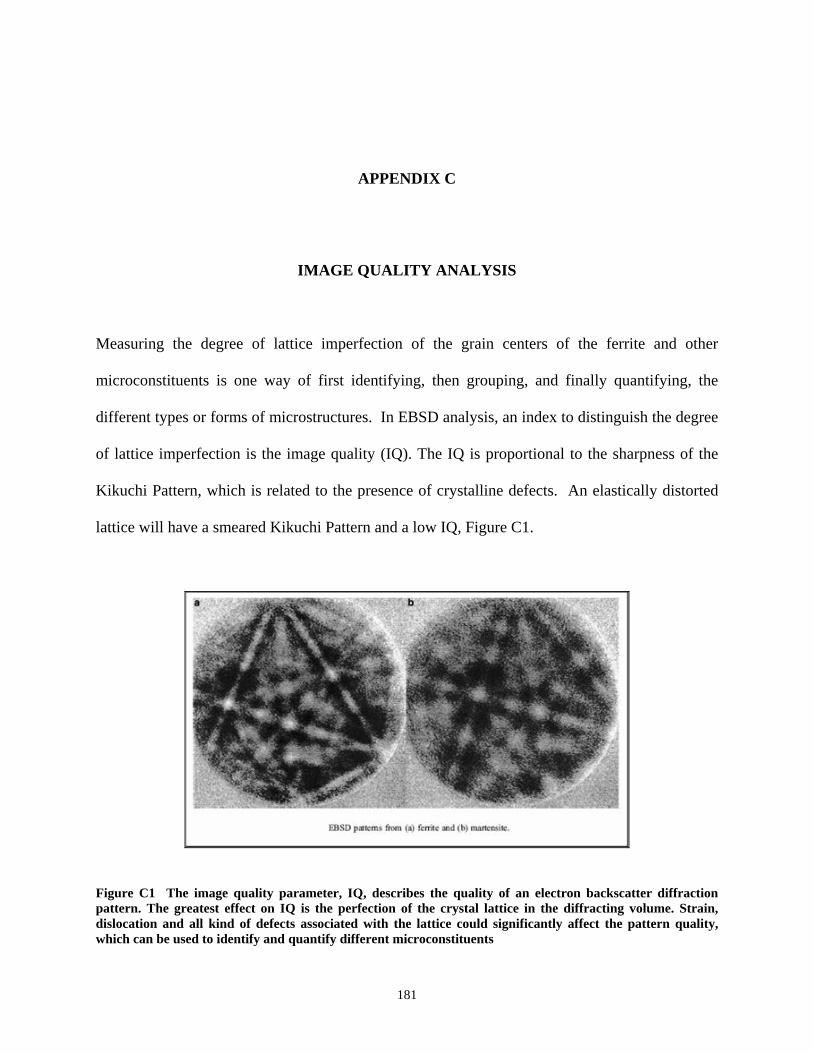
APPENDIX C
IMAGE QUALITY ANALYSIS
Measuring the degree of lattice imperfection of the grain centers of the ferrite and other
microconstituents is one way of first identifying, then grouping, and finally quantifying, the
different types or forms of microstructures. In EBSD analysis, an index to distinguish the degree
of lattice imperfection is the image quality (IQ). The IQ is proportional to the sharpness of the
Kikuchi Pattern, which is related to the presence of crystalline defects. An elastically distorted
lattice will have a smeared Kikuchi Pattern and a low IQ, Figure C1.
Figure C1 The image quality parameter, IQ, describes the quality of an electron backscatter diffraction pattern. The greatest effect on IQ is the perfection of the crystal lattice in the diffracting volume. Strain, dislocation and all kind of defects associated with the lattice could significantly affect the pattern quality, which can be used to identify and quantify different microconstituents
181

The new approach of using IQ to characterize microstructures eliminates the contribution from
grain boundaries to the total IQ distribution(62,78). Depending upon the transformation behavior
during cooling, it is not uncommon for different microconstituents to co-exist in one specimen.
These different types of microconstituents are often readily discernable in optical microscopy
and SEM. However, measuring their volume fractions is not easily accomplished using
conventional quantitative metallographic techniques. Since the types of microcosntituents and
the IQ level of the individual grains vary with their defect structure, such as dislocation density,
the measurement of the spectrum of IQ values in a given samples is necessary.
To take full advantage of the new IQ approach, the effects of image processing on the IQ values
is minimized through a normalization procedure. Also, a program is used to eliminate the effects
of grain boundaries on the IQ distribution curve and a multi-peak model for analyzing multi-
component microstructures is also employed (62,78).
182
BIBLIOGRAPHY 1. Senuma T., “Physical Metallurgy of Modern High Stregth Steel Sheets”, ISIJ
International, Vol 41, 2001. No.6 pp 520-532 2. Jacques P., Ladriere J., “On the influence of interactions between phases on the
mechanical stability of retained austenite in transformation-induced plasticity multiphase steels”, Metallurgical and Materials Transactions A, vol 32A, November 2001, pp2759-2768
3. Jacques P., Girault E., “The development of cold-rolled TRIP assisted multiphase
steels. Low Si TRIP assisted multiphase steels”, ISIJ International, vol 41, No.9, 2001, pp1061-1067
4. Hanzaki A., Hodgson P., “The influence of bainite on retained austenite characteristics
in Si-Mn TRIP steels”, ISIJ International, vol. 35, No.1, 1995, pp79-85 5. Samajdar I., Girault E., “Transformations during intercritical annealing of a TRUP-
assisted steel”, ISIJ International, vol 38, No.9, 1998, pp998-1006 6. Garcia C.I., DeArdo A.J., “Formation of austenite in low alloy steels”, Proceedings of
an International Conference on Solid-Solid Phase Transformations, AIME, 1982, pp 855-860
7. Park, Y.J., Eldis G.T., “A dilatometric study of the transformation behavior of
intercritically annealed molybdenum and vanadium containing dual phase steels” Proceedings of a symposium on Metallurgy of Continuous Annealed Sheet Steel, AIME, 1982, pp 321-331
8. Lee C.G., Kim S.J., “Effects of heat treatment and Si addition on the mechanical
properties of 0.1wt%C TRIP aided cold rolled steels”, ISIJ International, Vol.42, No.10, 2002, pg 1162-1168
9. Tsukatani I., Hashimoto S., “Effects of silicon and manganese addition on mechanical
properties of high-strength hot rolled sheet steel containing retained austenite” ISIJ International, vol 31, No.9, 1991, pp992-1000
183
10. Jacques P., Girault E., “The development of cold-rolled TRIP assisted multiphase steels. Al alloyed TRIP assisted multiphase steels”, ISIJ International, vol 41, No.9, 2001, pp1068-1074
11. DeMeyer M., Vanderschueren D., “The influence of Al on the properties of cold rolled
C-Mn-Si-TRIP steels”, Iron and Steel Making, February 2000, pp55-63 12. Ohmori Y., “Bainitic Transformations in extremely low carbon steels”, ISIJ
International, vol 35, No.8, 1995, pp962-968 13. Vetters H., “Transformation of austenite into bainitic ferrite and martensite”, Steel
Research, vol 67, No.10, 1996, pp408-411 14. Eberle K., Harlet Ph., “New thermomechanical strategies for the realization of
multiphase steels showing a transformation induced plasticity effect”, Iron and Steel Making, February 1999, pp 23-27.
15. Matsumara O., Sakuma Y., Scripta Materialia, vol 21, 1987, pp1301 16. Grange R., Stewart H., “The temperature range of martensite formation”, Transactions
of the AIME, vol 167, 1946, pp467-490 17. Speich G., Demarest., Metallurgical Transactions, vol 12A, 1981, 1419 18. Bhadeshia H., Edmonds D., “The mechanism of bainite formation in steels”, Acta
Metallurgica, vol 28, 1980, pp1265-1273 19. Bhadeshia H.K., Waugh A., “Bainite: an atom probe study of the incomplete reaction
phenomenon” Acta Metallurgica, vol 30, 1982, pp778-784 20. Itami A., Takahashi M., “Plastic stability of retained austenite in the cold-rolled
0.14%C-1.9%Si-1.7%Mn sheet steel”, ISIJ International, vol 35, No.9, 1995, pp1121-1127
21. Sugimoto K., Usui N., “Effects of volume fraction and stability of retained austenite on
ductility of TRIP-aided dual phase steels”, ISIJ International, vol 32, No.12, 1992, pp1311-1318
22. Skrotzki B., Wiech U., “Influence of austenite strength on martensite start temperature
Ms”, Steel Research, vol 64, No. 10, 1993, pp509-512 23. Haidemenopoulos G., Vasilakos A., “Modelling of austenite stability in low-alloy triple
phase steels”, Steel Research, vol 67, No.11, 1996, pp513-519 24. Haidemenopoulos G., Papadimitriou K., “Retained austenite and mechanical properties
in bainite transformed low alloy steels”, Steel Research, vol 66, No.10, 1995, pp 433-438.
184
25. Sugimoto K., Misu M., “Effects of second phase morphology on retained austenite
morphology and tensile properties in a TRIP-aided dual phase steel sheet”, ISIJ International, vol 33, No.7, 1993, pp775-782
26. Radcliffe S., Schatz M., Acta Metallurgica, vol 10, 1962, pp201 27. Vasilakos A., Papamantellos K., “Experimental determination of the stability of
retained austenite in low alloy TRIP steels”, Steel Research, vol 67, No.11, 1996 28. Zarei-Hanzaki A., Yue S., “Ferrite formation characteristics in Si-Mn TRIP steels”, ISIJ
International, vol 37, No.6, 1997, pp583-589 29. Jiao S., Hassani F., “The effect of processing history on a cold rolled and annealed Mo-
Nb microalloyed TRIP steel”, ISIJ International, vol 42, No.3, 2002, pp299-303 30. Leslie WC, The Physical Metallurgy of Steels, Techbooks, 1981, P295-296 31. Matsumura O., Sakuma Y., “Retained austenite in 0.4C-Si-1.2Mn steel sheet
intercritically heated and austempered”, ISIJ International, vol 23, No.9, 1992, pp1014-1020
32. Reference 18 in: Sugimoto K., Usui N., “Effects of volume fraction and stability of
retained austenite on ductility of TRIP-aided dual phase steels”, ISIJ International, vol 32, No.12, 1992, pp1311-1318
33. Baik S., Kim S., “Effects of alloying elements on mechanical properties and phase
transformations of cold rolled TRIP steel sheets”, ISIJ International, vol 41, No.3, 2001, pp290-297
34. Tsukatani I., Hashimoto S., “Effects of silicon and manganese addition on mechanical
properties of high-strength hot rolled sheet steel containing retained austenite” ISIJ International, vol 31, No.9, 1991, pp992-1000
35. DeMeyer M., Vanderschueren D., “The influence of the substitution of Si by Al on the
properties of cold rolled C-Mn-Si- TRIP steels”, ISIJ International, vol 39, No.8, 1999, pp813-822
36. DeMeyer M., Vanderschueren D., “The influence of Al on the properties of cold rolled
C-Mn-Si-TRIP steels”, Iron and Steel Making, February 2000, pp55-63 37. Evans P., Crawford L., Ironmaking and Steelmaking, vol 24, No.5, 1997, pp361 38. Parish Chad, “Fundamental study of phase transformations in Si-Al TRIP steels” M.Sc.
Thesis, University of Pittsburgh, 2003
185
39. Jacques P., Girault E., “The development of cold-rolled TRIP assisted multiphase steels. Al alloyed TRIP assisted multiphase steels”, ISIJ International, vol 41, No.9, 2001, pp1068-1074
40. Mahieu J, Maki J, De Cooman BD, "Hot-Dip Galvanizing of Al Alloyed TRIP Steels,"
43rd MWSP Conf Proc, ISS, 2001, P397 41. Mahieu J, Maki J, De Cooman BD, " Hot-Dip Galvanizing of Al Alloyed TRIP Steels,"
Iron & Steelmaker, V29, June 2002, P29 42. Cullity BD, Elements of X-Ray Diffraction, 2nd. ed., Addison-Wesley, 1978, pp 411-417 43. Zarei-Hanzaki A., Hodgson P. and Yue S., "Retained Austenite characteristics in
Thermomechanically Processed Si-Mn Transformation-Induced Plasticity Steels," Met Trans A, V28A, 1997, P2405
44. Garcia-Gonzalez Jose E, M.Sc. Thesis, University of Pittsburgh, 2002 45. Garcia-Gonzalez J.E., Wu J., “Reducing the variability in HSLA steels”, 44th MWSP
Conference, ISS, Orlando, Fl, 2002 46. Leslie WC, The Physical Metallurgy of Steels, Techbooks, 1981, P130 47. Speich G.R., Miller R.L., “Tempering of Ferrite-Martensite steels” Fundamentals of
Dual Phase Steels, ed by R.A. Kot and B.L Bramfitt, AIME, 1981, pg 300 48. Speich G.R., Miller R.L., “Tempering of Ferrite-Martensite steels” Fundamentals of
Dual Phase Steels, ed by R.A. Kot and B.L Bramfitt, AIME, 1981, pg 285 49. Speich G.R., “Physical Metallurgy of Dual-Phase Steels” Fundamentals of Dual Phase
Steels, ed by R.A. Kot and B.L Bramfitt, AIME, 1981, pg 3-39 50. Lawson R.D., Matlock D.K., Krauss G, “The effect of microstructure on the
deformation behavior and mechanical properties of a Dual-Phase steel” Fundamentals of Dual Phase Steels, ed by R.A. Kot and B.L Bramfitt, AIME, 1981, pg 355
51. Garcia C.I., DeArdo A.J., “The formation of austenite in low alloy steels” Structure and
Properties of Dual-Phase steels, ed by R.A. Kot and J.W.Morris, AIME, 1979, pg 40 52. Matlock D.K., Krauss G., “A correlation of processing variables with deformation
behavior of dual-phase steels”, Structure and Properties of Dual-Phase steels, ed by R.A. Kot and J.W.Morris, AIME, 1979, pg 62
53. Gerbase J., Embury J.D., “The mechanical behavior of some dual-phase steels with
emphasis on the initial work hardening rate”, Structure and Properties of Dual-Phase steels, ed by R.A. Kot and J.W.Morris, AIME, 1979, pg 118
186
54. Speich G.R., Miller R.L., “Mechanical Properties of ferrite-martensite steels”, Structure
and Properties of Dual-Phase steels, ed by R.A. Kot and J.W.Morris, AIME, 1979, pg 145
55. Thomas G., Koo J-Y., “Developments in strong, ductile duplex ferritic-martensitic
steels”, Structure and Properties of Dual-Phase steels, ed by R.A. Kot and J.W.Morris, AIME, 1979, pg 183
56. Eldis George T., “The influence of microstructure and testing procedure on the measured
mechanical properties of heat treated dual-phase steels”, Structure and Properties of Dual-Phase steels, ed by R.A. Kot and J.W.Morris, AIME, 1979, pg 202
57. Tanaka T., Nishida M., “Formation and properties of ferrite plus martensite dual-phase
structures”, Structure and Properties of Dual-Phase steels, ed by R.A. Kot and J.W.Morris, AIME, 1979, pg 221
58. Furukawa T, Morikawa H., “Process factors for highly ductile dual-phase sheet steels”
Structure and Properties of Dual-Phase steels, ed by R.A. Kot and J.W.Morris, AIME, 1979, pg 281
59. Rigsbee J.M., Abraham J.K., “Structure-processing and structure-property relationships
in commercially processed dual-phase steels”, Structure and Properties of Dual-Phase steels, ed by R.A. Kot and J.W.Morris, AIME, 1979, pg 304
60. Sun S., Pugh M., “Manganese partitioning in dual-phase steel during intercritical
annealing” Materials Science and Engineering A276, 2000, pg 167 61. Sun S., Pugh M., “Properties of thermomechanically processed dual-phase steels
containing fibrous martensite”, Materials Science and Engineering A335, 2002, pg 298 62. Wu J., DeArdo A.J., “Diffraction Pattern Quality: A new application of EBSD to
characterize microstructures” 63. Hillert M., “Solute drag, solute trapping and diffusional dissipation of Gibbs energy”,
Acta Materialia, Vol 47, No. 18, 1999, pg 4481 64. Ros-Yanez T., Houbaert Y., “Characterization of TRIP-assisted multiphase steel surface
topography by atomic force microscopy” Materials Characterization, Vol 47, 2001, pg 93 65. Traint Sandra, Pichler Andreas, “The influence of Nb on the phase transformations
and mechanical properties in Al and Si alloyed TRIP steels” Austenite Formation and Decomposition, Ed. By E.B. Damm and M.J. Merwin, The Iron and Steel Society and TMS, 2003, pg 577
187
66. Fletcher H.A., Aaronson H.I., “A STEM method for investigating alloying element accumulation at austenite-ferrite boundaries in a Fe-C-Mo alloy” Scripta Materialia 45, 2001, pg 561
67. Aaronson H.I., Purdy G.R., “Tests of the Zener theory of the incomplete transformation
phenomena in Fe-C-Mo and related alloys” Scripta Materialia 44, 2001, pg 2425 68. Yakubovsky O., Fonstein N., “Effect of alloying elements on mechanical properties and
coatability of multi-phase steels with ferrite-bainite and ferrite-bainite plus retained austenite microstructure” Galvatech ’04 Conference Proceedings, 2004, pg 547
69. Zaefferer S., Ohlert J., “A study of microstructure, transformation mechanisms and
correlation between microstructure and mechanical properties of a low alloyed TRIP steel”, Acta Materialia 52, 2004, pg 2765
70. Garcia C.I., Parish C., “Thermomechanical processing challenges in the cold mill”,
TMP’04, Liege, Belgium, 2004, pg 442 71. Godet S., Jacques P., “Thermomechanical processing of TRIP-assisted multiphase
steels” TMP’04, Liege, Belgium, 2004, pg 341 72. Erdogan M., “Effect of austenite dispersion on phase transformation in dual phase
steel”, Scripta Materialia 48, 2003, pg 501 73. Berbenni S., Favier V., “Micromechanical modeling of the elastic-viscoplastic behavior
of polycrystalline steels having different microstructures”, Materials Science and Engineering A372, 2004, pg 128
74. Al-Abbasi F.M., Nemes J.A., “Micromechanical modeling of the effect of particle size
difference in dual phase steels”, International Journal of Solids and Structures 40, 2003, pg 3379
75. El-Sesy, I.A., El-Baradie Z.M., “Influence of carbon and/or iron carbide on the structure
and properties of dual-phase steels”, Materials Letters 57, 2002, pg 580 76. Militzer M., Poole W., “A critical comparison of microstructure evolution in hot rolled
and cold rolled dual phase steels”, AHSSS Proceedings, 2004, pg 219 77. Sherif M., “Strain induced transformation of very strong metal” Master of Philosophy
Dissertation Thesis, Dept. of Materials Science and Metallurgy, University of Cambridge, 2003
78. Wu Jinghui, PhD Thesis Dissertation, Materials Science and Engineering, University of
Pittsburgh, 2004 79. Garcia C.I., Personal Communication, 2003
188
80. DeMeyer M., Vanderschueren D., "The Characterization of Retained Austenite in TRIP
Steels by X-Ray Diffraction", 41st MWSP Conf. Proc, ISS, 1999, pp 483-491 81. Zhao L, Van Dijk NH, "Magnetic and X-ray Diffraction Measurements for the
Determination of Retained Austenite in TRIP Steels," Mat Sci Eng A, VA313, 2001, pp 145-152
82. Wirthl E., Pichler A., "Determination of the Volume Fraction of Retained Austenite in
Small Specimens by Magnetic Measurements," Int. Conf. on TRIP-Aided High Strength Ferrous Alloys, ed BC DeCooman, GRIPS, Ghent, 2002, pp 61-64
83. Brandt ML, Ph.D. Thesis, Northwestern University, 1997 84. Speich G.R. and Miller R.L., "Hardenability of Austenite After Intercritical Annealing,"
Proc. Int. Conf. on Solid-Solid Phase Transformations, ed. HI Aaronson, DE Laughlin,RF Selerka and CM Wayman, TMS-AIME, 1981, P843
85. Militzer M, Pandi R and Hawbolt EB, "Austenite to Ferrite Transformation Kinetics
During Continuous Cooling", Proc. Int. Conf. on Solid-Solid Phase Transformations, ed. WC Johnson, JM Howe, DE Laughlin and WA Soffa, TMS, 1994, P177
86. Bradley JR, Shiflet GJ and Aaronson HI, "A Current View of Alloying Element
Effects on Growth Kinetics of Proeuctectiod Ferrite in Fe-C-X Alloys," Proc. Int. Conf. on Solid-Solid Phase Transformations, eds. HI Aaronson, DE Laughlin, RF Selerka and CM Wayman, TMS-AIME, 1981, P824-848
87. Speer JG and Matlock DK, "Recent Developments in Low-Carbon Sheet Steels," JOM,
V54, 2002, P19-24 88. Porter and Easterling, Phase Transformations in Metals and Alloys, 2nd ed., Chapman
and Hall, London, Chapter 5 89. Wilson E., “The γ→α transformation in low carbon irons”, ISIJ International, vol 34,
No.8, 1994, pp615 90. Brandes E.A., Smithells' Metals References Book, 6th ed., Butterworths, London, 1983,
Ch. 13 91. Porter and Easterling, Phase Transformations in Metals and Alloys, 2nd ed., Chapman
and Hall, London, Chapter 2 92. Shewmon P, Diffusion in Solids¸2nd ed., TMS, Warrendale, PA, 1989, Chapter 1 93. Dieter, Mechanical Metallurgy, McGraw-Hill, 3rd edition, 1986
189
94. Krauss G., Thompson S., “Ferritic Microstructures in continuously cooled low and ultralow carbon steels”, ISIJ International, vol 35, No.8, 1995, pg 937
95. Andrews K., “Empirical formula for the calculation of some transformations
temperatures”, Journal of the Iron and Steel Institute, July 1965, pg 721 96. Traint S., Pichler A., Stiaszny P., “Silicon and Aluminum in Low Alloyed TRIP
Steels,” 44th MWSP Conf. Proc., ISS, 2002, pg 139 97. LePera F.S., “Improved Etching Technique to Emphasize Martensite and Bainite in
High-Strength Dual-Phase Steel,” JOM, V32, March 1980, pg 38 98. Marder A.R. and Benscoter A.O., “Quantitative analysis of Dual-Phase steels,”
Metallography, V15, 1982, pg 73 99. Marder A.R., "Factor affecting the ductility of Dual-Phase alloys”, Formable HSLA and
Dual-Phase Steels, ed. AT Davenport, TMS/AIME, 1979, pg 87-98 100. Colleluori D., “Improved etching methods for quantitative analysis of HSLA multi-
phase steels”, Praktische Metallographie/Practical Metallography, V20, 1983, pg 546 101. Girault E., Jacques P., Harlet, “Metallographic methods for revealing the multiphase
microstructure of TRIP-Assisted Steels”, Materials Characterization, V40, 1998, pg 111
190