Embed Size (px)
Citation preview
Future of the Norwegian Defense Industry
– Market Attractiveness, Competitive
Landscape and Forecasts to 2019
Future of the Norwegian Defense Industry – Market Attractiveness, Competitive Landscape and Forecasts to 2019
2
TABLE OF CONTENTS
1. Introduction ......................................................................................................................... 11
1.1. What is this Report About? ..........................................................................................................11
1.2. Definitions .....................................................................................................................................11
1.3. Summary Methodology .................................................................................................................14
1.4. SDI Terrorism Index ......................................................................................................................15
1.5. About Strategic Defence Intelligence ..........................................................................................15
2. Executive Summary ............................................................................................................ 16
3. Market Attractiveness and Emerging Opportunities ........................................................ 18
3.1. Defense Market Size Historical and Forecast..............................................................................19
3.1.1. The Norwegian defense budget registered a CAGR of XX% during 2010-2014 ..................................... 19
3.1.2. Participation in international peacekeeping operations, modernization of the armed forces and
interest in arctic region are the major drivers of the Norwegian defense industry ................................................ 23
3.1.3. Defense expenditure as a percentage of GDP is expected to average XX% during the forecast period 25
3.2. Analysis of Defense Budget Allocation .......................................................................................27
3.2.1. Capital expenditure allocation is expected to increase over the forecast period ..................................... 27
3.2.2. Expenditure on procurement of material, buildings, and construction is expected to be the largest
during forecast period ........................................................................................................................................... 30
3.2.3. Air force expenditure to grow at a CAGR of XX% over the forecast period and to reach US$XX billion
in 2019 .................................................................................................................................................................. 33
3.2.4. Army expenditure to grow at a CAGR of XX% over the forecast period to reach US$XX billion in
2019 .................................................................................................................................................................. 38
3.2.5. Naval expenditure is expected to reach US$XX billion by 2019 .............................................................. 43
3.2.6. Procurement of material, buildings, and construction work expenditure expected to be the largest
segment of the defense budget during the forecast period .................................................................................. 47
3.2.7. Other expenditure is expected to increase marginally over the forecast period ...................................... 51
3.3. Homeland Security Market Size and Forecast ............................................................................55
3.3.1. The Norwegian homeland security expenditure is expected to grow at a CAGR of XX% over the
forecast period ...................................................................................................................................................... 55
3.3.2. Counter-terrorism and enhanced cyber security are expected to drive homeland security expenditure . 60
3.3.3. Norway is at a “low risk” of terrorism ........................................................................................................ 61
3.3.4. Norway has a terrorism index score of “zero”........................................................................................... 62
3.4. Benchmarking with Key Global Markets .....................................................................................63
3.4.1. Norwegian defense budget expenditure expected to increase over the forecast period, unlike other
European countries ............................................................................................................................................... 63
3.4.2. Norway has the one of the fastest growing defense industries in Europe ............................................... 65
3.4.3. Norwegian defense budget as a percentage of GDP is expected to grow over the forecast period........ 66
3.4.4. Norway has a terrorism index score of zero ............................................................................................. 67
Future of the Norwegian Defense Industry – Market Attractiveness, Competitive Landscape and Forecasts to 2019
3
3.5. Market Opportunities: Key Trends and Growth Stimulators ......................................................69
3.5.1. Fighters and Multi-role aircraft .................................................................................................................. 69
3.5.2. Diesel Electric Submarine......................................................................................................................... 70
3.5.3. Homeland Security Infrastructure ............................................................................................................. 71
3.5.4. Multi mission and Rescue Helicopters ...................................................................................................... 72
4. Defense Procurement Market Dynamics ........................................................................... 73
4.1. Import Market Dynamics ...............................................................................................................74
4.1.1. Norwegian defense imports are expected to increase over the forecast period ...................................... 74
4.1.2. Spain and the US are expected to remain the largest arms suppliers to Norway .................................... 75
4.1.3. Ships accounted for the largest percentage share of overall defense imports ........................................ 76
4.2. Export Market Dynamics ..............................................................................................................77
4.2.1. Norway ranked fifteenth among the countries with the highest volume of defense exports .................... 77
4.2.2. Exports to European countries are expected to increase over the forecast period ................................. 78
4.2.3. Other category accounted for the majority of Norway‟s defense exports during 2008-2012 ................... 79
5. Industry Dynamics .............................................................................................................. 80
5.1. Five Forces Analysis.....................................................................................................................80
5.1.1. Bargaining power of Supplier: Low ........................................................................................................... 81
5.1.2. Bargaining power of Buyer: High .............................................................................................................. 81
5.1.3. Barrier to entry: Medium ........................................................................................................................... 81
5.1.4. Intensity of rivalry: High ............................................................................................................................ 81
5.1.5. Threat of Substitution: High ...................................................................................................................... 81
6. Market Entry Strategy ......................................................................................................... 82
6.1. Market Regulation .........................................................................................................................82
6.1.1. The Norwegian defense industry is largely driven by government regulation and offset policy ............... 82
6.1.2. The Norwegian government supports FDI ................................................................................................ 83
6.2. Market Entry Route .......................................................................................................................84
6.2.1. Entry through joint development programs ............................................................................................... 84
6.2.2. Foreign Military Sales (FMS) to Norway ................................................................................................... 85
6.2.3. Collaborations provide market entry opportunities ................................................................................... 86
6.3. Key Challenges .............................................................................................................................87
6.3.1. The Norwegian government prefers Scandinavian and European countries for defense trade .............. 87
6.3.2. The Norwegian export policy poses a challenge for domestic defense companies ................................. 87
7. Competitive Landscape and Strategic Insights ................................................................ 88
7.1. Competitive Landscape Overview ...............................................................................................88
7.2. Key Public Sector Companies ......................................................................................................88
7.2.1. Kongsberg Defense Systems: Overview .................................................................................................. 88
Future of the Norwegian Defense Industry – Market Attractiveness, Competitive Landscape and Forecasts to 2019
4
7.2.2. Kongsberg Defense Systems: Major Products and Services ................................................................... 88
7.2.3. Kongsberg Defense Systems: Recent Announcements and Strategic Initiatives .................................... 90
7.2.4. Kongsberg Defense Systems: alliances ................................................................................................... 91
7.2.5. Kongsberg Defense Systems: recent contract wins ................................................................................. 92
7.2.6. Kongsberg Defense Systems: financial analysis ...................................................................................... 94
7.2.7. Forsvarets Forsknings Institutt: overview ................................................................................................. 96
7.2.8. Forsvarets ForskningsInstitutt: defense products ..................................................................................... 96
7.2.9. Forsvarets ForskningsInstitutt: recent announcements and strategic initiatives ...................................... 96
7.2.10. Forsvarets ForskningsInstitutt: alliances .................................................................................................. 96
7.2.11. Forsvarets ForskningsInstitutt: recent contract wins ................................................................................ 97
7.2.12. NAMMO AS: overview .............................................................................................................................. 98
7.2.13. NAMMO AS: products and services ......................................................................................................... 98
7.2.14. NAMMO AS: recent announcements and strategic initiatives .................................................................. 99
7.2.15. NAMMO AS: alliances ............................................................................................................................ 100
7.2.16. NAMMO AS: recent contract wins .......................................................................................................... 101
7.2.17. NAMMO AS: financial analysis ............................................................................................................... 102
7.2.18. Kitron: overview ...................................................................................................................................... 104
7.2.19. Kitron: products and services ................................................................................................................. 104
7.2.20. Kitron: recent announcements and strategic initiatives .......................................................................... 104
7.2.21. Kitron: alliances ...................................................................................................................................... 105
7.2.22. Kitron: recent contract wins .................................................................................................................... 105
7.2.23. Kitron: financial analysis ......................................................................................................................... 106
7.3. Key Private Sector Companies .................................................................................................. 108
7.3.1. Natech NSV AS: overview ...................................................................................................................... 108
7.3.2. Natech NSV AS: products and services ................................................................................................. 108
7.3.3. Natech NSV AS: recent announcements and strategic initiatives .......................................................... 108
7.3.4. Natech NSV AS: alliances ...................................................................................................................... 109
7.3.5. Natech NSV AS: recent contract wins .................................................................................................... 109
7.3.6. Jotne EPM Technology AS: overview .................................................................................................... 110
7.3.7. Jotne EPM Technology AS: products and services ............................................................................... 110
7.3.8. Jotne EPM Technology AS: recent announcements and strategic initiatives ........................................ 110
7.3.9. Jotne EPM Technology AS: alliances ..................................................................................................... 111
7.3.10. Jotne EPM Technology AS: recent contract wins .................................................................................. 111
7.3.11. Thales Norway AS: overview .................................................................................................................. 112
7.3.12. Thales Norway AS: products and services ............................................................................................. 112
7.3.13. Thales Norway AS: recent announcements and strategic initiatives ..................................................... 113
7.3.14. Thales Norway AS: alliances .................................................................................................................. 113
7.3.15. Thales Norway AS: recent contract wins ................................................................................................ 113

Future of the Norwegian Defense Industry – Market Attractiveness, Competitive Landscape and Forecasts to 2019
5
7.3.16. Sea-Hawk Navigation AS: overview ....................................................................................................... 115
7.3.17. Sea-Hawk Navigation AS: products ....................................................................................................... 115
7.3.18. Sea-Hawk Navigation AS: recent announcements and strategic initiatives ........................................... 115
7.3.19. UmoeMandal: overview .......................................................................................................................... 116
7.3.20. UmoeMandal: products and services ..................................................................................................... 116
7.3.21. Umoe Mandal: recent announcements and strategic initiatives ............................................................. 117
7.3.22. Umoe Mandal: alliances ......................................................................................................................... 117
7.3.23. Eidsvoll Electronics AS: overview ........................................................................................................... 118
7.3.24. Eidsvoll Electronics AS: products and services ...................................................................................... 118
7.3.25. Eidsvoll Electronics AS: recent announcements and strategic initiatives .............................................. 118
7.3.26. Eidsvoll Electronics AS: alliances ........................................................................................................... 118
7.3.27. Eidsvoll Electronics AS: recent contract wins ......................................................................................... 119
8. Business Environment and Country Risk ....................................................................... 120
8.1. Demographics ............................................................................................................................. 120
8.1.1. Total Rural population ............................................................................................................................. 120
8.1.2. Total urban population ............................................................................................................................ 121
8.1.3. Number of households............................................................................................................................ 122
8.2. Economic Performance .............................................................................................................. 123
8.2.1. GDP per capita at constant prices .......................................................................................................... 123
8.2.2. GDP at current prices (US$) ................................................................................................................... 124
8.2.3. Exports of goods and services (current US$ bn) .................................................................................... 125
8.2.4. Imports of goods and services (current US$ bn) .................................................................................... 126
8.2.5. Gross national disposable income (US$ billion) ..................................................................................... 127
8.2.6. Manufacturing output (US$ bn) .............................................................................................................. 128
8.2.7. Consumer price index ............................................................................................................................. 129
8.2.8. Wholesale price index ............................................................................................................................. 130
8.2.9. LCU per US$ (period average) ............................................................................................................... 131
8.2.10. Deposit rate (%) ...................................................................................................................................... 132
8.2.11. Market capitalization of listed companies (US$ bn) ............................................................................... 133
8.2.12. Market capitalization of listed companies (% of GDP) ........................................................................... 134
8.2.13. Total Government cash surplus/deficit (LCU billion) .............................................................................. 135
8.2.14. Government cash surplus/deficit as a percentage of GDP (LCU) .......................................................... 136
8.2.15. Central government debt (LCU billion) ................................................................................................... 137
8.2.16. Central government debt as a percentage of GDP (LCU) ...................................................................... 138
8.2.17. Goods exports as a percentage of GDP................................................................................................. 139
8.2.18. Goods imports as a percentage of GDP................................................................................................. 140
8.2.19. Goods balance as a percentage of GDP ................................................................................................ 141
8.2.20. Services imports as a percentage of GDP ............................................................................................. 142
Future of the Norwegian Defense Industry – Market Attractiveness, Competitive Landscape and Forecasts to 2019
6
8.2.21. Service exports as a percentage of GDP ............................................................................................... 143
8.2.22. Services balance as a percentage of GDP............................................................................................. 144
8.2.23. Foreign direct investment, net (BoP, current US$ billions) ..................................................................... 145
8.2.24. Net foreign direct investment as a percentage of GDP .......................................................................... 146
8.2.25. International reserves, including gold (US$ billion) ................................................................................ 147
8.3. Energy and utilities ..................................................................................................................... 148
8.3.1. Total Conventional Thermal Electricity Net Generation (Billion kWh) .................................................... 148
8.3.2. Hydroelectricity Net Generation (Billion kWh) ........................................................................................ 149
8.3.3. Nuclear Electricity Net Generation (Billion kWh) .................................................................................... 150
8.3.4. Total Conventional Thermal Electricity Installed Capacity (Million kW) ................................................. 151
8.3.5. Proved Reserves of Natural Gas (Trillion Cubic Feet) ........................................................................... 152
8.3.6. Total Petroleum Consumption (Thousand Barrels Per Day) .................................................................. 153
8.3.7. Crude Oil Proved Reserves (Billion Barrels) .......................................................................................... 154
8.3.8. Total Non-Hydro Renewable Electricity Net Generation (Billion kW) ..................................................... 155
8.4. Infrastructure Quality and Availability ....................................................................................... 156
8.4.1. Air transport, freight (million ton-km) ...................................................................................................... 156
8.5. Mineral ......................................................................................................................................... 157
8.5.1. Mining, Manufacturing, Utilities Output (US$ billion) .............................................................................. 157
8.6. Technology .................................................................................................................................. 158
8.6.1. Research and Development expenditure (LCU Thousands).................................................................. 158
8.7. Telecommunication .................................................................................................................... 159
8.7.1. Telephone lines (in mn) .......................................................................................................................... 159
8.7.2. Telephone lines Penetration Rate (per 100 people) ............................................................................... 160
9. Appendix ............................................................................................................................ 161
9.1. About SDI ..................................................................................................................................... 161
9.2. Disclaimer .................................................................................................................................... 161
Future of the Norwegian Defense Industry – Market Attractiveness, Competitive Landscape and Forecasts to 2019
7
LIST OF FIGURES
Figure 1: Norwegian Defense Expenditure (US$ Billion), 2010-2014 .................................................................................................................. 19 Figure 2: Norwegian Defense Expenditure (US$ Billion),2015-2019 ................................................................................................................... 20 Figure 3: Norwegian Defense Expenditure (NOK Billion), 2010-2014 ................................................................................................................. 21 Figure 4: Norwegian Defense Expenditure (NOK Billion),2015-2019 .................................................................................................................. 22 Figure 5: Norwegian GDP Growth vs. Defense Expenditure Growth vs. Defense Expenditure as Percentage of GDP, 2010-2014 ..................... 25 Figure 6: Norwegian GDP Growth vs. Defense Expenditure Growth and Defense Expenditure as Percentage of GDP, 2015-2019 .................. 26 Figure 7:Norwegian Defense Budget Split Between Capital and Revenue Expenditure (%), 2010-2014 ............................................................. 28 Figure 8: Norwegian Defense Budget Split Between Capital and Revenue Expenditure (%), 2015-2019 ............................................................ 29 Figure 9: Norwegian Defense Capital Expenditure Breakdown (%), 2010-2014 .................................................................................................. 31 Figure 10: Norwegian Defense Capital Expenditure Breakdown (%), 2015-2019 ................................................................................................ 32 Figure 11: Norwegian Defense Expenditure for Air Force (US$ billion), 2010-2014 ............................................................................................ 34 Figure 12: Norwegian Defense Expenditure for Air Force (US$ billion), 2015-2019 ............................................................................................ 35 Figure 13: Norwegian Defense Expenditure for Air Force (NOK billion), 2010-2014 ............................................................................................ 36 Figure 14: Norwegian Defense Expenditure for Air Force (NOK billion), 2015-2019 ............................................................................................ 37 Figure 15: Norwegian Defense Expenditure for Army (US$ billion), 2010-2014 .................................................................................................. 39 Figure 16: Norwegian Defense Expenditure for Army (US$ billion), 2015-2019 .................................................................................................. 40 Figure 17: Norwegian Defense Expenditure for Army (NOK billion), 2010-2014 .................................................................................................. 41 Figure 18: Norwegian Defense Expenditure for Army (NOK billion), 2015-2019 .................................................................................................. 42 Figure 19: Norwegian Defense Expenditure for Navy (US$ billion), 2010-2014................................................................................................... 43 Figure 20: Norwegian Defense Expenditure for Navy (US$ billion), 2015-2019................................................................................................... 44 Figure 21: Norwegian Defense Expenditure for Navy (NOK billion), 2010-2014 .................................................................................................. 45 Figure 22: Norwegian Defense Expenditure for Navy (NOK billion), 2015-2019 .................................................................................................. 46 Figure 23: Norwegian Defense Expenditure for Procurement of Material, Buildings, and Construction Work (US$ billion), 2010-2014 ............... 47 Figure 24: Norwegian Defense Expenditure for Procurement of Material, Buildings, and Construction Work (US$ billion),2015-2019 ................ 48 Figure 25: Norwegian Defense Expenditure for Procurement of Material, Buildings, and Construction Work (NOK billion), 2010-2014............... 49 Figure 26: Norwegian Defense Expenditure for Procurement of Material, Buildings, and Construction Work (NOK billion),2015-2019................ 50 Figure 27: Norwegian Defense Expenditure for Other Categories (US$ billion), 2010-2014 ................................................................................ 51 Figure 28: Norwegian Defense Expenditure for Other Categories (US$ billion), 2015-2019 ................................................................................ 52 Figure 29: Norwegian Defense Expenditure for Other Categories (NOK billion), 2010-2014 ............................................................................... 53 Figure 30: Norwegian Defense Expenditure for Other Categories (NOK billion), 2015-2019 ............................................................................... 54 Figure 31: Norwegian Homeland Security Expenditure (US$ billion),2010-2014 ................................................................................................. 56 Figure 32: Norwegian Homeland Security Expenditure (US$ billion), 2015-2019 ................................................................................................ 57 Figure 33: Norwegian Homeland Security Expenditure (NOK billion), 2010-2014 ............................................................................................... 58 Figure 34: Norwegian Homeland Security Expenditure (NOK billion), 2015-2019 ............................................................................................... 59 Figure 35: SDI Terrorism Heat Map, 2014 .......................................................................................................................................................... 61 Figure 36: SDI Terrorism Index, 2014 ................................................................................................................................................................. 62 Figure 37: Benchmarking with Key Markets – 2010–2014 vs. 2015–2019 .......................................................................................................... 64 Figure 38: Benchmarking with World‟s Largest Defense Spenders (US$ Billion), 2014 and 2019 ....................................................................... 65 Figure 39: Defense Expenditure as a Percentage of GDP of Largest Military Spenders (%), 2014 ..................................................................... 66 Figure 40: Fighters & Multi-Role Aircraft (US$ Million), 2014-2024 ..................................................................................................................... 69 Figure 41: Diesel Electric Submarine (US$ Million), 2014-2024 ......................................................................................................................... 70 Figure 42: Homeland Security Infrastructure (US$ Million), 2014-2024 ............................................................................................................... 71 Figure 43: Multi mission and Rescue Helicopters (US$ Million), 2014-2024 ....................................................................................................... 72 Figure 44: Norwegian Defense Import Trend, 2008–2012 (TIV values*) ............................................................................................................. 74 Figure 45: Norwegian Defense Import by Country, 2008–2012(TIV values) ........................................................................................................ 75 Figure 46: Norwegian Defense Imports by Category (%),2008–2012 .................................................................................................................. 76 Figure 47: Norwegian Defense Exports by Value (%),2008–2012 ....................................................................................................................... 77 Figure 48: Norwegian Defense exports by Country (%), 2008–2012 ................................................................................................................... 78 Figure 49: Norwegian Defense Exports by Category (%), 2008–2012 ................................................................................................................ 79 Figure 50: Industry Dynamics – Porter‟s Five Forces Analysis ............................................................................................................................ 80 Figure 51: Kongsberg Defense Systems – Revenue Trend Analysis (NOK Million), 2008–2012 ......................................................................... 94 Figure 52: Kongsberg Defense Systems – EBITA Trend Analysis (NOK Million), 2008–2012 ............................................................................. 95 Figure 53: Kongsberg Defense Systems – Net profit Trend Analysis (NOK Million), 2008–2012 ......................................................................... 95 Figure 54: NAMMO AS – Revenue Trend Analysis (NOK Million), 2007–2011 ..................................................................................................102 Figure 55: NAMMO AS – Operating Profit Trend Analysis (NOK Million), 2007–2011 ........................................................................................103 Figure 56: NAMMO AS – Net Profit Trend Analysis (NOK Million), 2007–2011 ..................................................................................................103
Future of the Norwegian Defense Industry – Market Attractiveness, Competitive Landscape and Forecasts to 2019
8
Figure 57: Kitron – Revenue Trend Analysis (NOK Million), 2008–2012 ............................................................................................................106 Figure 58: Kitron – Operating Profit Trend Analysis (NOK Million), 2008–2012 ..................................................................................................107 Figure 59: Kitron – Net Profit Trend Analysis (NOK Million), 2008–2012 ............................................................................................................107 Figure 60: Norway Rural population (In million), 2010–2019 ..............................................................................................................................120 Figure 61: Norway Urban population (In million), 2010–2019 .............................................................................................................................121 Figure 62: Norway- Number of Households (Million), 2008–2017 ......................................................................................................................122 Figure 63: Norwegian GDP Per Capita at Constant Prices (US$), 2008–2017 ...................................................................................................123 Figure 64: Norway GDP at Current Prices (US$ Billion), 2009–2018 .................................................................................................................124 Figure 65: Norwegian Exports of goods and services (US$), 2003–2012...........................................................................................................125 Figure 66: Norwegian Imports of goods and services (US$), 2003–2012 ...........................................................................................................126 Figure 67: Norwegian Gross national disposable income (US$ billion), 2003-2012 ............................................................................................127 Figure 68: Norwegian Manufacturing output (US$ Billion), 2003–2012 ..............................................................................................................128 Figure 69: Norwegian Consumer price index, 2009–2018 ..................................................................................................................................129 Figure 70: Norwegian Wholesale price index, 2003–2012 .................................................................................................................................130 Figure 71: Norway LCU per US$, 2009–2018 ...................................................................................................................................................131 Figure 72: Norwegian Deposit rate (%), 2000-2009 ...........................................................................................................................................132 Figure 73: Norwegian market capitalization of listed companies (US$ billion), 2003–2012 .................................................................................133 Figure 74: Norwegian market capitalization of listed companies (% of GDP), 2002–2011 ..................................................................................134 Figure 75: Norwegian Total Government cash surplus/deficit (LCU billion), 2002–2011.....................................................................................135 Figure 76: Norwegian Government cash surplus/deficit as % of GDP (LCU), 2002–2011 ..................................................................................136 Figure 77: Norwegian- Central government debt (LCU billion), 2002–2011 ........................................................................................................137 Figure 78: Norwegian Central government debt as % of GDP (LCU), 2002–2011 .............................................................................................138 Figure 79: Norway- Goods exports as a % of GDP (%), 2001–2010 ..................................................................................................................139 Figure 80: Norway- Goods imports as a % of GDP (%), 2001–2010 ..................................................................................................................140 Figure 81: Norwegian Goods balance as a % of GDP (%), 2001–2010 .............................................................................................................141 Figure 82: Norwegian Services imports as a % of GDP (%), 2001–2010 ...........................................................................................................142 Figure 83: Norwegian Service exports as a % of GDP (%), 2001–2010 .............................................................................................................143 Figure 84: Norway- Services balance as a % of GDP (%), 2001–2010 ..............................................................................................................144 Figure 85: Norway- Foreign direct investment, net (BoP, current US$ billion), 2001–2010 .................................................................................145 Figure 86: Norwegian Net foreign direct investment as % of GDP, 2001-2009...................................................................................................146 Figure 87: Norwegian International reserves, including gold (US$ billion), 2002-2011 .......................................................................................147 Figure 88: Norway- Total Conventional Thermal Electricity Net Generation (Billion Kilowatt hours), 2001–2010 ................................................148 Figure 89: Norwegian Hydroelectricity Net Generation (Billion Kilowatt hours), 2003–2012 ...............................................................................149 Figure 90: Norwegian Nuclear Electricity Net Generation (Billion Kilowatt hours), 2001–2010 ...........................................................................150 Figure 91: Norwegian Total Conventional Thermal Electricity Installed Capacity (Million Kilowatts), 2001–2010 ................................................151 Figure 92: Norwegian Proved Reserves of Natural Gas (Trillion Cubic Feet), 2004–2013 ..................................................................................152 Figure 93: Norwegian Total Petroleum Consumption (Thousand Barrels Per Day), 2002–2011 .........................................................................153 Figure 94: Crude Oil Proved Reserves (Billion Barrels), 2002–2011 ..................................................................................................................154 Figure 95: Total Non-Hydro Renewable Electricity Net Generation (Billion Kilowatts), 2003–2012 .....................................................................155 Figure 96: Norwegian Air transport, freight (million ton-km), 2007–2016 ............................................................................................................156 Figure 97: Norwegian Mining, Manufacturing, Utilities Output (US$ billion), 2001–2010 ....................................................................................157 Figure 98: Norwegian Research and development expenditure (LCU thousands), 2001–2009 ..........................................................................158 Figure 99: Norwegian Telephone lines, 2003–2012 ...........................................................................................................................................159 Figure 100: Norwegian Telephone lines Penetration Rate (per 100 people), 2003–2012 ...................................................................................160
Future of the Norwegian Defense Industry – Market Attractiveness, Competitive Landscape and Forecasts to 2019
9
LIST OF TABLES
Table 1: Norwegian Defense Expenditure (US$ Billion), 2010-2014 ................................................................................................................... 19 Table 2: Norwegian Defense Expenditure (US$ Billion),2015-2019 .................................................................................................................... 20 Table 3: Norwegian Defense Expenditure (NOK Billion), 2010-2014 ................................................................................................................... 21 Table 4: Norwegian Defense Expenditure (NOK Billion),2015-2019 .................................................................................................................... 22 Table 5: Norwegian GDP Growth vs. Defense Expenditure Growth vs. Defense Expenditure as Percentage of GDP, 2010-2014 ...................... 25 Table 6: Norwegian GDP Growth vs. Defense Expenditure Growth and Defense Expenditure as Percentage of GDP, 2015-2019 ..................... 26 Table 7: Norwegian Defense Budget Split Between Capital and Revenue Expenditure (%), 2010-2014 ............................................................. 28 Table 8: Norwegian Defense Budget Split Between Capital and Revenue Expenditure (%), 2015-2019 ............................................................. 29 Table 9: Norwegian Defense Capital Expenditure Breakdown (%), 2010-2014 ................................................................................................... 31 Table 10: Norwegian Defense Capital Expenditure Breakdown (%), 2015-2019 ................................................................................................. 32 Table 11: Norwegian Defense Expenditure for Air Force(US$ billion), 2010-2014............................................................................................... 34 Table 12: Norwegian Defense Expenditure for Air Force(US$ billion), 2015-2019............................................................................................... 35 Table 13: Norwegian Defense Expenditure for Air Force (NOK billion), 2010-2014 ............................................................................................. 36 Table 14: Norwegian Defense Expenditure for Air Force (NOK billion), 2015-2019 ............................................................................................. 37 Table 15: Norwegian Defense Expenditure for Army (US$ billion), 2010-2014 .................................................................................................... 39 Table 16: Norwegian Defense Expenditure for Army (US$ billion), 2015-2019 .................................................................................................... 40 Table 17: Norwegian Defense Expenditure for Army (NOK billion), 2010-2014 ................................................................................................... 41 Table 18: Norwegian Defense Expenditure for Army (NOK billion), 2015-2019 ................................................................................................... 42 Table 19: Norwegian Defense Expenditure for Navy (US$ billion), 2010-2014 .................................................................................................... 43 Table 20: Norwegian Defense Expenditure for Navy (US$ billion),2015-2019 ..................................................................................................... 44 Table 21: Norwegian Defense Expenditure for Navy (NOK billion), 2010-2014 ................................................................................................... 45 Table 22: Norwegian Defense Expenditure for Navy (NOK billion),2015-2019 .................................................................................................... 46 Table 23: Norwegian Defense Expenditure for Procurement of Material, Buildings, and Construction Work (US$ billion), 2010-2014................. 47 Table 24: Norwegian Defense Capital Expenditure for Procurement of Material, Buildings, and Construction Work (US$ billion), 2015-2019 ..... 48 Table 25: Norwegian Defense Expenditure for Procurement of Material, Buildings, and Construction Work (NOK billion), 2010-2014 ................ 49 Table 26: Norwegian Defense Capital Expenditure for Procurement of Material, Buildings, and Construction Work (NOK billion), 2015-2019 .... 50 Table 27: Norwegian Defense Expenditure for Other Categories (US$ billion), 2010-2014 ................................................................................. 51 Table 28: Norwegian Defense Expenditure for Other Categories (US$ billion), 2015-2019 ................................................................................. 52 Table 29: Norwegian Defense Expenditure for Other Categories (NOK billion), 2010-2014 ................................................................................ 53 Table 30: Norwegian Defense Expenditure for Other Categories (NOK billion), 2015-2019 ................................................................................ 54 Table 31: Norwegian Homeland Security Expenditure (US$ billion), 2010-2014 ................................................................................................. 56 Table 32: Norwegian Homeland Security Expenditure (US$ billion), 2015-2019 ................................................................................................. 57 Table 33: Norwegian Homeland Security Expenditure (NOK billion), 2010-2014 ................................................................................................ 58 Table 34: Norwegian Homeland Security Expenditure (US$ billion), 2015-2019 ................................................................................................. 59 Table 35: Benchmarking with Key Markets – 2010–2014 vs. 2015–2019............................................................................................................ 63 Table36: SDI Terrorism Index ............................................................................................................................................................................. 67 Table 37: Offset Multiplier Categories ................................................................................................................................................................. 82 Table 38: Market Entry Strategies by Key Foreign Companies ........................................................................................................................... 84 Table 39: FMS deals to Norway .......................................................................................................................................................................... 85 Table 40: Kongsberg Defense Systems – Major Products & Services ................................................................................................................ 88 Table 41: Kongsberg Defense Systems – Alliances ............................................................................................................................................ 91 Table 42: Kongsberg Defense Systems – Recent Contract Wins ........................................................................................................................ 92 Table 43: Forsvarets ForskningsInstitutt – Product Focus ................................................................................................................................... 96 Table 44: ForsvaretsForskningsInstitutt – Alliances ............................................................................................................................................ 96 Table 45: Forsvarets ForskningsInstitutt – Recent Contract Wins ....................................................................................................................... 97 Table 46: NAMMO AS – Product Focus ............................................................................................................................................................. 98 Table 47: NAMMO AS – Alliances .....................................................................................................................................................................100 Table 48: NAMMO AS – Recent Contract Wins ................................................................................................................................................101 Table 49: Kitron – Product Focus ......................................................................................................................................................................104 Table 50: Kitron – Alliances ...............................................................................................................................................................................105 Table 51: Kitron - Recent Contract Wins ............................................................................................................................................................105 Table 52: Natech NSV AS – product focus ........................................................................................................................................................108 Table 53: Natech NSV AS - Recent Contract Wins ............................................................................................................................................108 Table 54: Natech NSV AS - Alliances ................................................................................................................................................................109 Table 55: Natech NSV AS – Recent Contract Wins ...........................................................................................................................................109 Table 56: Jotne EPM Technology AS – product focus .......................................................................................................................................110
Future of the Norwegian Defense Industry – Market Attractiveness, Competitive Landscape and Forecasts to 2019
10
Table 57: Jotne EPM Technology AS: Alliances ................................................................................................................................................111 Table 58: Jotne EPM Technology AS – Recent Contract Wins ..........................................................................................................................111 Table 59: Thales Norway AS – product focus ....................................................................................................................................................112 Table 60: Thales Norway AS – Alliances ...........................................................................................................................................................113 Table 61: Thales Norway AS – Recent Contract Wins .......................................................................................................................................113 Table 62: Thales Norway AS – Product Focus ...................................................................................................................................................115 Table 63: Umoe Mandal – Product Focus ..........................................................................................................................................................116 Table 64: Umoe Mandal – Alliances ..................................................................................................................................................................117 Table 65: Eidsvoll Electronics AS – Product Focus ............................................................................................................................................118 Table 66: Eidsvoll Electronics - Alliances ...........................................................................................................................................................118 Table 67: Eidsvoll - Recent Contract Wins .........................................................................................................................................................119
Future of the Norwegian Defense Industry – Market Attractiveness, Competitive Landscape and Forecasts to 2019
11
1. Executive Summary
Norwegian defense expenditure is expected to reach US$XX billion in 2019, at an estimated CAGR
of XX% during the forecast period
Amidst the global financial crisis and defense cuts, where major economies are struggling to sustain strong
defense spending, the Nordic partners (Norway, Finland and Sweden), are establishing a stronger footprint
with defense cooperation, in an endeavor to combat the challenges of the austerity measures. Norway is a
part of NORDEFCO (Nordic Defence Cooperation), which was established in 2009 with the aim to
strengthen defense capabilities through cost-effective collaborations. Norway has expressed a need to
modernize its armed forces after the fall of the Soviet Union and shares similar military needs with its
neighboring countries which include Finland and Sweden. Moreover, Norway is the world‟s eighth-largest
oil exporter and this has warranted the need for an increase in defense spending. The Norwegian annual
defense budget stands at US$XX billion in 2014 and is expected to grow at an estimated CAGR of XX%
over the forecast period, to reach US$XX billion in 2019.This increase can be attributed to international
peacekeeping missions, modernization initiatives, and international interest in the Arctic region.
Norwegian Air Force expected to exhibit the fastest growth during the forecast period
The Norwegian defense budget is inclusive of expenditure on the army, navy, air force, and the
procurement of material, building and construction work, and the „others‟ category (include Norwegian
Forces Abroad, Common Institutions, and expenses under the Headquarters Command, Common
Management, and Command Structure). The procurement of material, building, and construction work
accounted for the highest budget allocation during the review period, with an average of XX%, followed by
“others” at XX%.The Norwegian Army received an average allocation of XX%, followed by the Navy at
XX%, and the Air Force at XX%. Air Force expenditure, which stands at US$XX billion in 2014, is expected
to exhibit the fastest growth during the forecast period, increasing at an estimated CAGR of XX% to reach
US$XX billion in 2019.This high rate of growth is expected to be fuelled by the continued procurement of F-
35 JSF and training aircraft over the forecast period.
Future of the Norwegian Defense Industry – Market Attractiveness, Competitive Landscape and Forecasts to 2019
12
2. Market Attractiveness and Emerging Opportunities Norway‟s total defense expenditure stands at US$XX billion in 2014 and is expected to grow at a CAGR
of XX% over the forecast period, to reach US$XX billion in 2019; this increase in defense expenditure
can be attributed to the modernization and training programs that are expected to be executed during
the forecast period. Norwegian defense expenditure is further driven by participation in peacekeeping
initiatives, the procurement of military aircraft such as the F-35 fighter aircraft, the Norwegian All
Weather Search and Rescue Helicopter (NAWSARH) program, Advanced Medium Range Air-to-Air
Missiles (AMRAAM), upgrade and support for C-130J aircraft, the soldier modernization program, cyber
security, and the procurement of advanced technology equipment. The country‟s defense budget stands
at XX% of GDP in 2014 and is expected to increase marginally to XX% of GDP by 2019. During 2010–
2014, the average capital expenditure allocation stood at XX% of the total defense budget, and this is
expected to remain same during the forecast period.
Future of the Norwegian Defense Industry – Market Attractiveness, Competitive Landscape and Forecasts to 2019
13
2.1. Defense Market Size Historical and Forecast
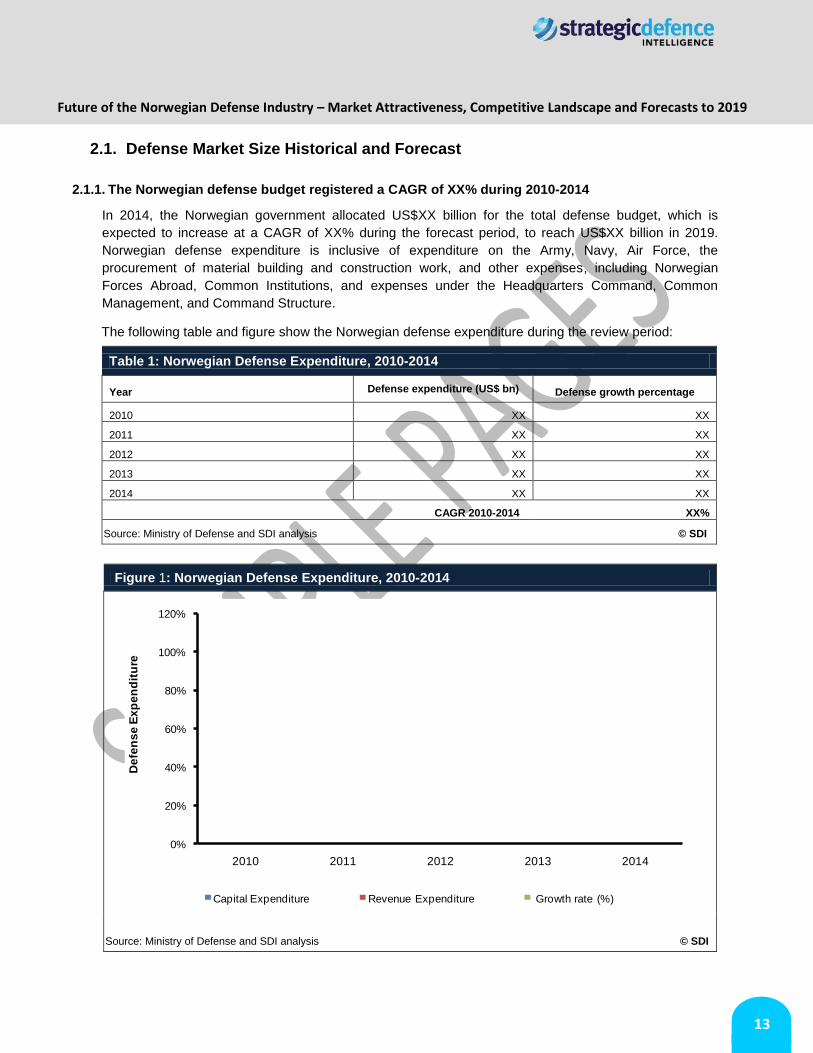
2.1.1. The Norwegian defense budget registered a CAGR of XX% during 2010-2014
In 2014, the Norwegian government allocated US$XX billion for the total defense budget, which is
expected to increase at a CAGR of XX% during the forecast period, to reach US$XX billion in 2019.
Norwegian defense expenditure is inclusive of expenditure on the Army, Navy, Air Force, the
procurement of material building and construction work, and other expenses, including Norwegian
Forces Abroad, Common Institutions, and expenses under the Headquarters Command, Common
Management, and Command Structure.
The following table and figure show the Norwegian defense expenditure during the review period:
Table 1: Norwegian Defense Expenditure, 2010-2014
Year Defense expenditure (US$ bn)
Defense growth percentage
2010 XX XX
2011 XX XX
2012 XX XX
2013 XX XX
2014 XX XX
CAGR 2010-2014 XX%
Source: Ministry of Defense and SDI analysis © SDI
Figure 1: Norwegian Defense Expenditure, 2010-2014
Source: Ministry of Defense and SDI analysis © SDI
0%
20%
40%
60%
80%
100%
120%
2010 2011 2012 2013 2014
De
fen
se
Ex
pe
nd
itu
re
Capital Expenditure Revenue Expenditure Growth rate (%)
Future of the Norwegian Defense Industry – Market Attractiveness, Competitive Landscape and Forecasts to 2019
14
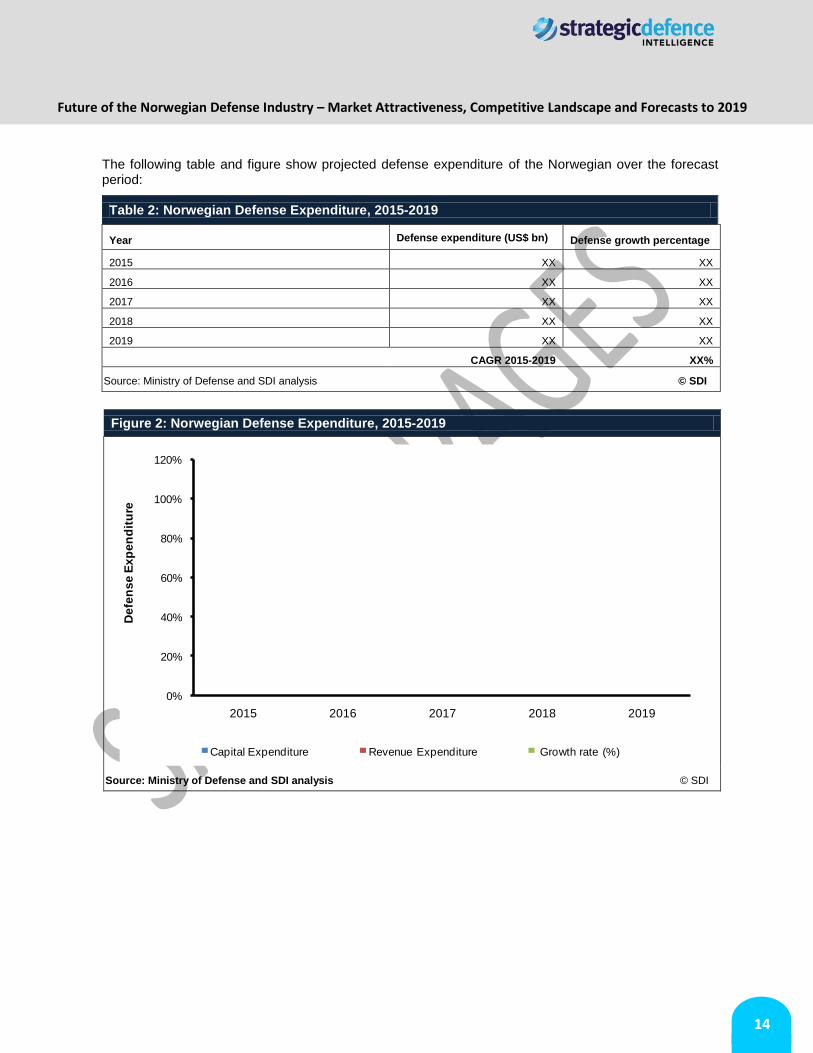
The following table and figure show projected defense expenditure of the Norwegian over the forecast period:
Table 2: Norwegian Defense Expenditure, 2015-2019
Year Defense expenditure (US$ bn)
Defense growth percentage
2015 XX XX
2016 XX XX
2017 XX XX
2018 XX XX
2019 XX XX
CAGR 2015-2019 XX%
Source: Ministry of Defense and SDI analysis © SDI
Figure 2: Norwegian Defense Expenditure, 2015-2019
Source: Ministry of Defense and SDI analysis © SDI
0%
20%
40%
60%
80%
100%
120%
2015 2016 2017 2018 2019
De
fen
se
Ex
pe
nd
itu
re
Capital Expenditure Revenue Expenditure Growth rate (%)

Future of the Norwegian Defense Industry – Market Attractiveness, Competitive Landscape and Forecasts to 2019
15
2.2. Analysis of Defense Budget Allocation
2.2.1. Capital expenditure allocation expected to increase during the forecast period
The Norwegian MoD allocated an average of XX% of capital expenditure between 2010 and 2014, which
is expected to continue to grow at the same rate during the forecast period. The capital expenditure is
driven by the number of procurements and modernization programs formulated by the Norwegian armed
forces, and increasing material and R&D expenses. Its military modernization programs include
acquisition of F-35 aircraft, AW101 helicopters; CV90 armored fighting vehicles (AFVs), Leopard 2A6
tanks, cyber security, a joint strike missile (JSM) system for the F-35 JSF and submarine replacement
program. Norwegian revenue expenditure is expected to record stronger growth compared to capital
expenditure due to an increase in training expenditure, increase in the number of army personnel,
continued contribution to international peace and stability, and the improvement in home guard training
and coast guard capabilities.
The following table and chart display the Norwegian defense budget share of capital and revenue
expenditure during the review period:
Table 3: Norwegian Defense Budget Split Between Capital and Revenue Expenditure (%), 2010-2014
Year Capital Expenditure Share Revenue Expenditure Share
2010 XX XX
2011 XX XX
2012 XX XX
2013 XX XX
2014 XX XX
Source: Ministry of Defense and SDI analysis © SDI
Figure 3: Norwegian Defense Budget Split Between Capital and Revenue Expenditure (%), 2010-2014
Source: Ministry of Defense and SDI analysis © SDI
0%
20%
40%
60%
80%
100%
120%
2010 2011 2012 2013 2014
% o
f D
efe
ns
e E
xp
en
dit
ure
Capital expenditure share (%) Revenue expenditure share (%)
Future of the Norwegian Defense Industry – Market Attractiveness, Competitive Landscape and Forecasts to 2019
16
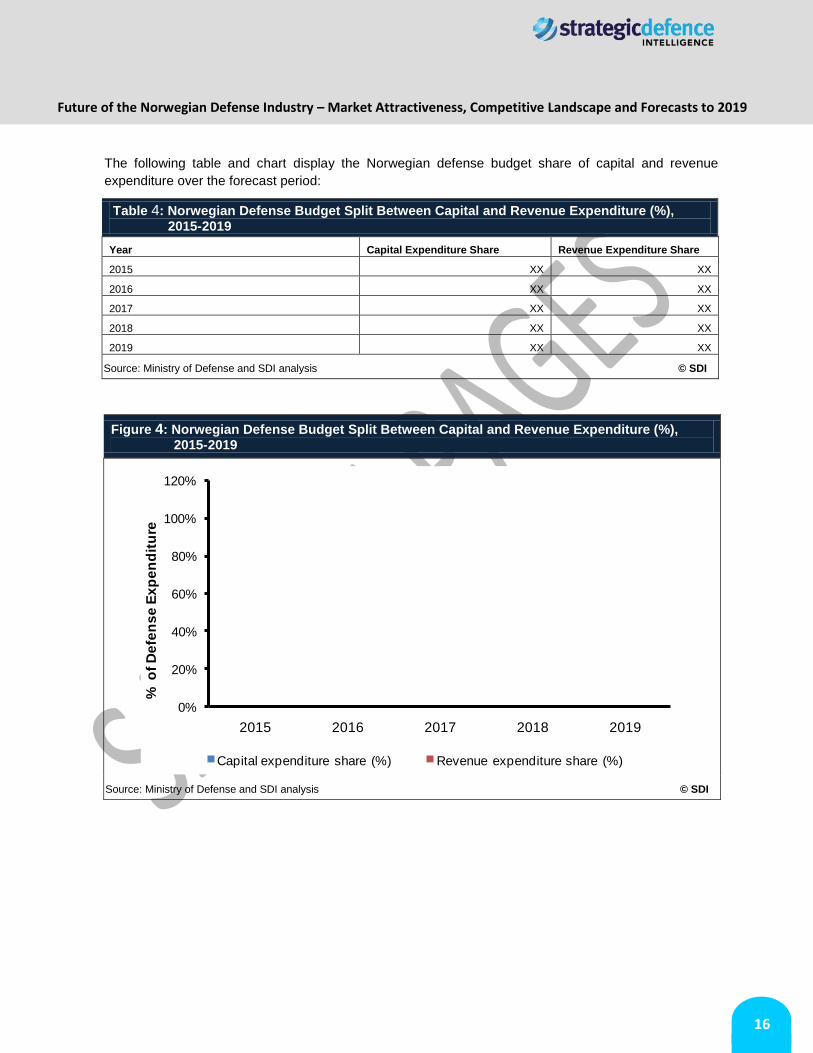
The following table and chart display the Norwegian defense budget share of capital and revenue
expenditure over the forecast period:
Table 4: Norwegian Defense Budget Split Between Capital and Revenue Expenditure (%), 2015-2019
Year Capital Expenditure Share Revenue Expenditure Share
2015 XX XX
2016 XX XX
2017 XX XX
2018 XX XX
2019 XX XX
Source: Ministry of Defense and SDI analysis © SDI
Figure 4: Norwegian Defense Budget Split Between Capital and Revenue Expenditure (%), 2015-2019
Source: Ministry of Defense and SDI analysis © SDI
0%
20%
40%
60%
80%
100%
120%
2015 2016 2017 2018 2019
% o
f D
efe
ns
e E
xp
en
dit
ure
Capital expenditure share (%) Revenue expenditure share (%)
Future of the Norwegian Defense Industry – Market Attractiveness, Competitive Landscape and Forecasts to 2019
17
2.3. Homeland Security Market Size and Forecast
2.3.1. The Norwegian Homeland security expenditure is expected to grow at a CAGR of XX% during the
forecast period
Norway‟s homeland security expenditure is expected to grow at a CAGR of XX% during the forecast
period and reach US$XX billion in 2019; this growth can be attributed to the revised training and
development plans of the Norwegian home guard, as formulated in the Long-Term defense plan 2012.
The Royal Norwegian Ministry of Justice and Public Security is responsible for internal security and the
maintenance of law and order in the country. Moreover, the department has undertaken the Norwegian
All-Weather Search and Rescue Helicopter (NAWSARH) program to replace the existing fleet of Sea
King helicopters. Under the program the ministry has a contract for 16 AW101 helicopters for US$XX
billion scheduled to be delivered during 2017-2020. Furthermore, the increase in homeland security
expenditure is due to the growing threat from radical and terrorist organizations, such as Al-Qaeda, as a
result of Norway‟s ongoing operations in Afghanistan and Iraq.
The following table and figure show the Norwegian HLS budget during the review period:
Table 5: Norwegian HLS Budget (US$ Billion), 2010-2014
Year HLS budget (US$ bn)
2010 XX
2011 XX
2012 XX
2013 XX
2014 XX
Source: Ministry of Defense and SDI analysis © SDI
Figure 5: Norwegian HLS Budget (US$ Billion), 2010-2014
Source: Ministry of Defense and SDI analysis © SDI
XX
XX
XX
XX
XX
XX
XX
2010 2011 2012 2013 2014
Ho
me
lan
d S
ec
uri
ty E
xp
en
dit
ure
Future of the Norwegian Defense Industry – Market Attractiveness, Competitive Landscape and Forecasts to 2019
18
The following table and figure show the Norwegian HLS budget over the forecast period:
Table 6: Norwegian HLS Budget (US$ Billion), 2015-2019
Year HLS budget (US$ bn)
2015 XX
2016 XX
2017 XX
2018 XX
2019 XX
Source: Ministry of Defense and SDI analysis © SDI
Figure 6: Norwegian HLS Budget (US$ Billion), 2015-2019
Source: Ministry of Defense and SDI analysis © SDI