Embed Size (px)
Citation preview
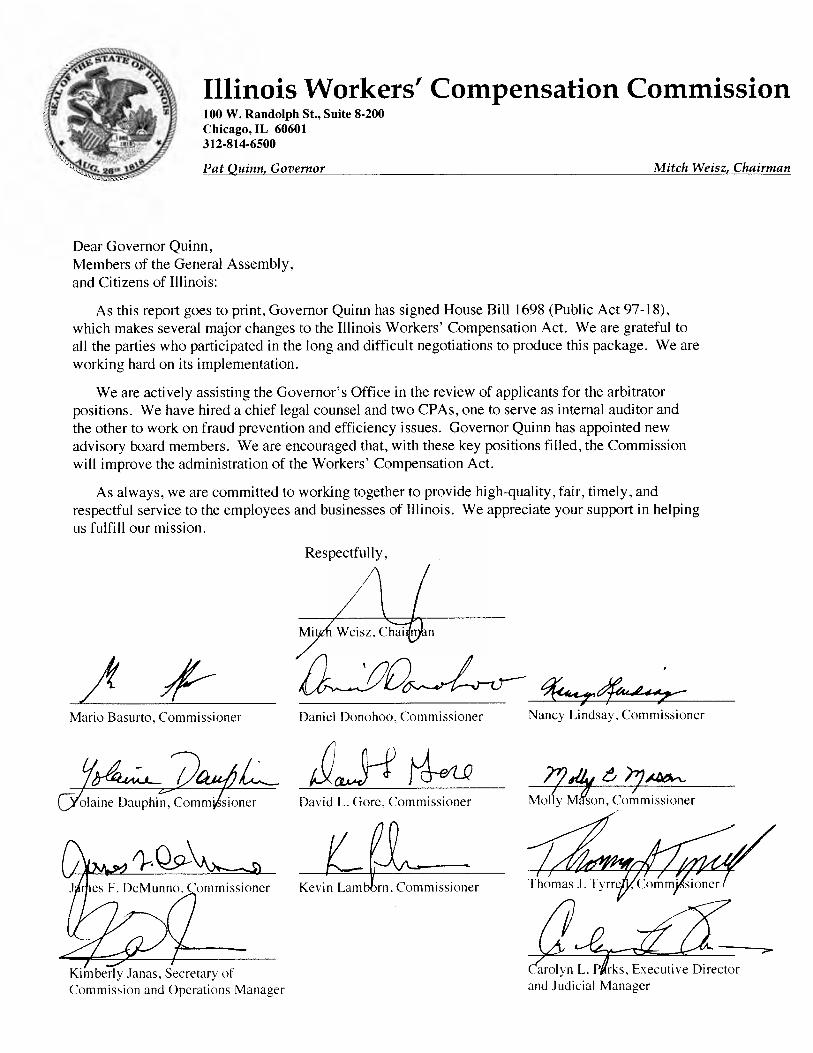
Illinois Workers’ Compensation Commission
Mitch WeiszChairman
Pat QuinnGovernor
FY 2010
Annual Report
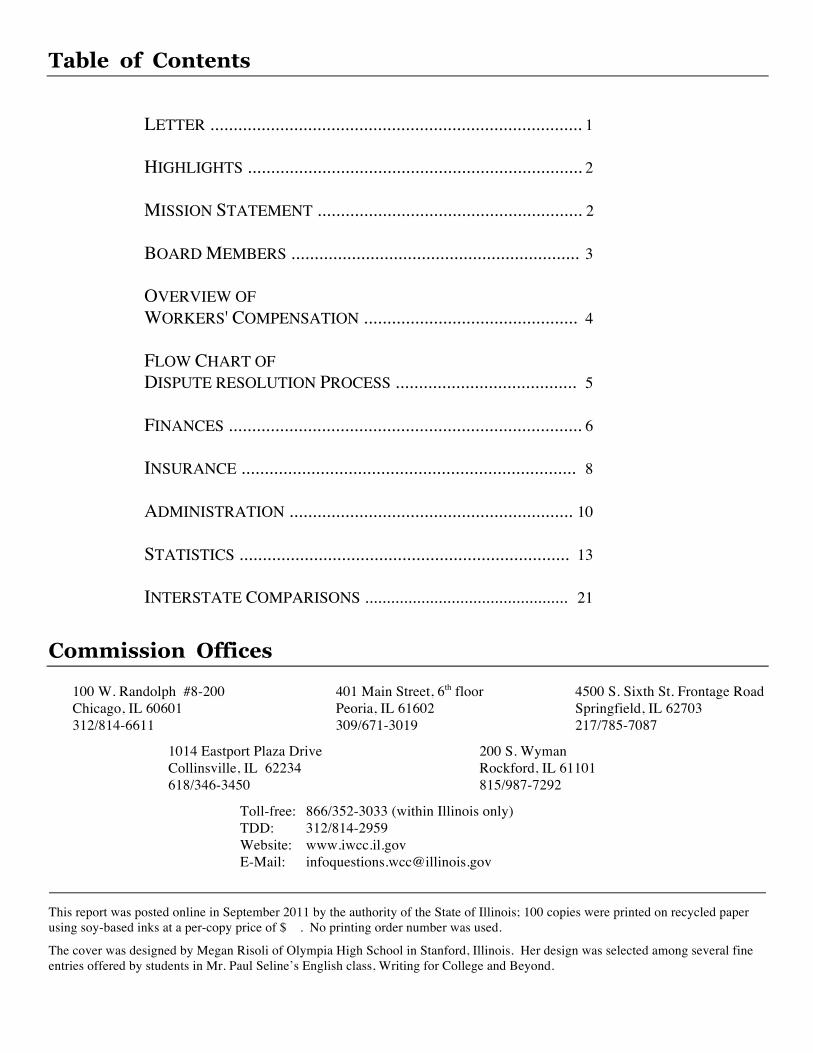
Table of Contents
LETTER ................................................................................ 1 HIGHLIGHTS ........................................................................ 2 MISSION STATEMENT ......................................................... 2 BOARD MEMBERS .............................................................. 3 OVERVIEW OF WORKERS' COMPENSATION .............................................. 4 FLOW CHART OF DISPUTE RESOLUTION PROCESS ....................................... 5 FINANCES ............................................................................ 6 INSURANCE ........................................................................ 8 ADMINISTRATION ............................................................. 10 STATISTICS ....................................................................... 13 INTERSTATE COMPARISONS ............................................... 21
Commission Offices
100 W. Randolph #8-200 401 Main Street, 6th floor 4500 S. Sixth St. Frontage Road Chicago, IL 60601 Peoria, IL 61602 Springfield, IL 62703 312/814-6611 309/671-3019 217/785-7087
1014 Eastport Plaza Drive 200 S. Wyman Collinsville, IL 62234 Rockford, IL 61101 618/346-3450 815/987-7292
Toll-free: 866/352-3033 (within Illinois only) TDD: 312/814-2959 Website: www.iwcc.il.gov E-Mail: [email protected]
This report was posted online in September 2011 by the authority of the State of Illinois; 100 copies were printed on recycled paper using soy-based inks at a per-copy price of $ . No printing order number was used.
The cover was designed by Megan Risoli of Olympia High School in Stanford, Illinois. Her design was selected among several fine entries offered by students in Mr. Paul Seline’s English class, Writing for College and Beyond.
2
Highlights • Illinois has become one of the most expensive states in the country in workers’ compensation premium
costs. We ranked 23rd in 2004, but in 2010 we became the 3rd most expensive state. The good news is that the 2011 legislation produced future savings and a mid-year 9% advisory insurance rate decrease.
• Our workers’ compensation insurance industry is healthy and highly competitive. More insurance companies sell w.c. policies in Illinois than in 48 other states. The residual market is much smaller than average, meaning employers are able to purchase insurance with relative ease.
• Filings have dropped from the peak of roughly 72,000 cases in FY95 to 51,000 cases in FY10. • Illinois' 2008 total injury rate was 60% lower than in 1990. Everyone wins when injuries are avoided.
• In FY10, we collected over $800,000 in fines from 135 uninsured employers with 2,200 workers that were found to be operating without w.c. insurance. The fines were used to pay $1.7 million in benefits to 35 injured workers whose cases were closed in FY10 and whose uninsured employers failed to pay. Without this program, these workers and their medical providers, might have received nothing.
• The Commission is more transparent and accessible than ever before. We hold regular open house programs, where interested individuals hear an overview of the judicial process, observe hearings, and interact with us. The chairman, commissioners, and arbitrators speak often at conferences. The Commission meets regularly in public meetings at which new procedures, forms, and rules are discussed. With three active advisory boards, the Commission has never been so open and participative. All meeting notices and minutes are posted on the IWCC website. In FY10, our website received 8 million hits, representing an 80% increase since FY07. Information is now shared more widely and with more depth than could have even been imagined years ago.
• Commissioners, arbitrators, and staff attorneys attended several days of judicial training, covering new case law, ethics, code of conduct, utilization review, etc. These programs earned Continuing Legal Education (CLE) credit. In addition, the IWCC cooperates with the Workers’ Compensation Lawyers Association, which conducts monthly lunchtime CLE programs on various workers’ compensation issues in the Chicago office building.
Mission Statement
The Illinois Workers’ Compensation Commission resolves disputes that occur between injured workers and their employers regarding workers' compensation. The Commission strives to assure financial protection to injured workers and their dependents at a reasonable cost to employers.
The Commission performs four main functions:
1) Resolves disputes. The Commission strives to provide a fair, timely process by which disputed claims may be resolved.
2) Ensures compliance with the law. The Commission protects the rights of employees and employers under the Illinois Workers' Compensation and Occupational Diseases Acts.
3) Administers self-insurance. The Commission evaluates and approves eligible employers that wish to insure themselves for their workers' compensation liabilities.
4) Collects statistics. The Commission compiles information on work-related injuries and diseases in order to encourage sound risk management and work safety programs.
The Commission strives to accomplish these goals while looking constantly for ways to improve the quality of service and treating the public and co-workers with respect. The success of this organization depends on the commitment and full participation of every member.
3
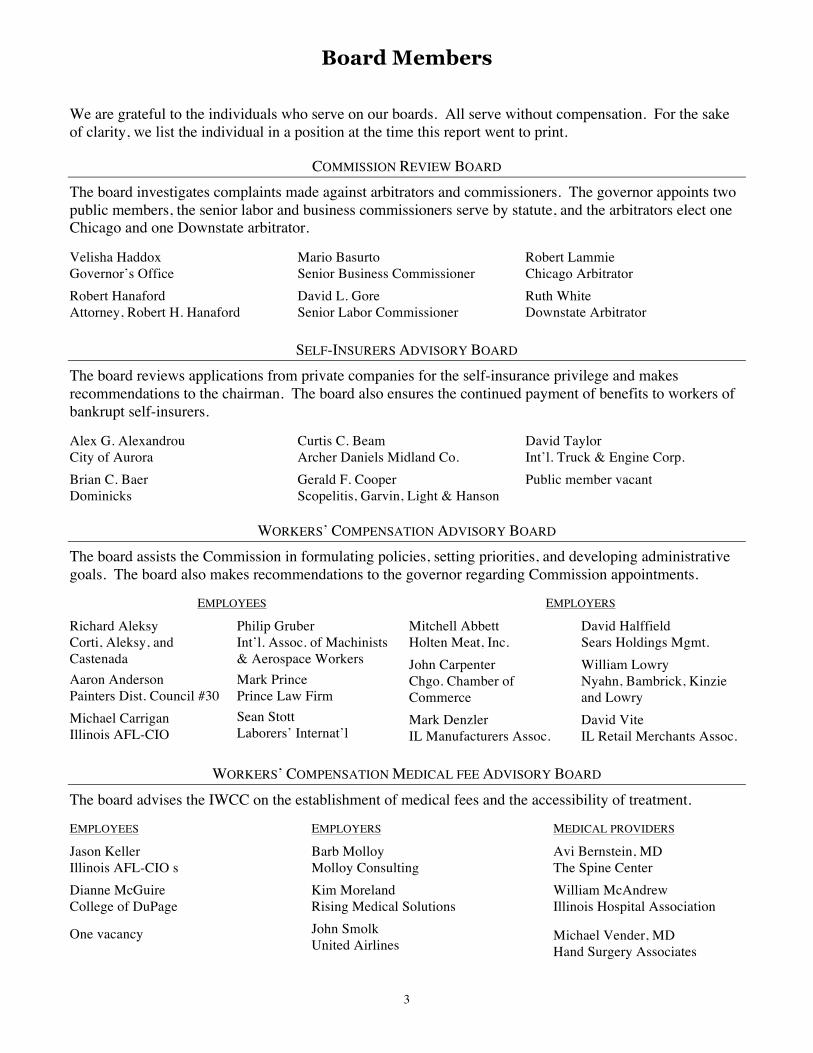
Board Members We are grateful to the individuals who serve on our boards. All serve without compensation. For the sake of clarity, we list the individual in a position at the time this report went to print.
COMMISSION REVIEW BOARD
The board investigates complaints made against arbitrators and commissioners. The governor appoints two public members, the senior labor and business commissioners serve by statute, and the arbitrators elect one Chicago and one Downstate arbitrator. Velisha Haddox Governor’s Office
Robert Hanaford Attorney, Robert H. Hanaford
Mario Basurto Senior Business Commissioner
David L. Gore Senior Labor Commissioner
Robert Lammie Chicago Arbitrator
Ruth White Downstate Arbitrator
SELF-INSURERS ADVISORY BOARD
The board reviews applications from private companies for the self-insurance privilege and makes recommendations to the chairman. The board also ensures the continued payment of benefits to workers of bankrupt self-insurers. Alex G. Alexandrou City of Aurora
Brian C. Baer Dominicks
Curtis C. Beam Archer Daniels Midland Co.
Gerald F. Cooper Scopelitis, Garvin, Light & Hanson
David Taylor Int’l. Truck & Engine Corp.
Public member vacant
WORKERS’ COMPENSATION ADVISORY BOARD
The board assists the Commission in formulating policies, setting priorities, and developing administrative goals. The board also makes recommendations to the governor regarding Commission appointments. EMPLOYEES EMPLOYERS
Richard Aleksy Corti, Aleksy, and Castenada
Aaron Anderson Painters Dist. Council #30
Michael Carrigan Illinois AFL-CIO
Philip Gruber Int’l. Assoc. of Machinists & Aerospace Workers
Mark Prince Prince Law Firm
Sean Stott Laborers’ Internat’l
Mitchell Abbett Holten Meat, Inc.
John Carpenter Chgo. Chamber of Commerce
Mark Denzler IL Manufacturers Assoc.
David Halffield Sears Holdings Mgmt.
William Lowry
Nyahn, Bambrick, Kinzie and Lowry
David Vite IL Retail Merchants Assoc.
WORKERS’ COMPENSATION MEDICAL FEE ADVISORY BOARD
The board advises the IWCC on the establishment of medical fees and the accessibility of treatment. EMPLOYEES
Jason Keller Illinois AFL-CIO s
Dianne McGuire College of DuPage One vacancy
EMPLOYERS
Barb Molloy Molloy Consulting
Kim Moreland Rising Medical Solutions
John Smolk United Airlines
MEDICAL PROVIDERS
Avi Bernstein, MD The Spine Center
William McAndrew Illinois Hospital Association
Michael Vender, MD Hand Surgery Associates
4
Overview of Workers' Compensation Workers' compensation laws were the first acts of social legislation passed in the United States, and they have always been controversial. At the beginning of the 20th century, employers feared the assumption of liability for work-related injuries would destroy their businesses, while workers feared financial ruin from disabling injuries.
Before the laws took effect, an injured worker seeking compensation had to file a lawsuit against his or her employer in court. At the time, the common law held that the employer had a duty to provide a safe place to work and safe tools; to give warnings of dangers; and to provide a sufficient number of appropriate fellow servants to perform the tasks.
In court, the employee had to prove negligence. The employer could present a defense that blamed the injured worker's contributory negligence, or attributed the injury to the negligence of a fellow servant, or argued that the employee assumed certain risks in accepting the job. The process was prolonged and uncertain, with large risks to both employee and employer. The employer’s liability was unlimited.
The high injury and death rates throughout the Industrial Revolution and growing dissatisfaction with the common law gradually led to the enactment of employer liability acts. Employers were held more responsible for negligence, but employees still had to file lawsuits for damages.
The first workers' compensation laws originated in Germany in 1884 with a compulsory system of accident insurance covering all employees in manufacturing, mining, and transportation. Similar laws passed in other European countries.
In the U.S., laws were passed on a state-by-state basis. Most of the early laws covered only hazardous occupations and were frequently challenged as unconstitutional. Maryland passed the first act in 1902, which was restricted to fatal cases. The first law of general application that withstood legal challenges was Wisconsin's act of 1911. Illinois passed its law in 1911, effective May 1, 1912. It took until 1948 for all states to establish a workers' compensation law.
Workers' compensation laws contain two tradeoffs:
1. Employees gave up their right to sue and potentially win large awards in court in exchange for more modest but prompt compensation without the need to prove negligence;
2. Employers gave up their common law defenses in exchange for limits on their liabilities.
Workers' compensation was established as a no-fault system. The theory behind the law is that the cost of work-related injuries or illnesses should be part of the cost of the product or service.
Originally, the courts administered the Illinois act. The volume overwhelmed the courts, however, and on July 1, 1913, a three-member Industrial Board was created. In 1917, a five-member Industrial Commission was created within the Illinois Department of Labor. In 1957, the Commission separated from the Department of Labor and became a self-standing agency. On January 1, 2005, the agency officially became the Illinois Workers’ Compensation Commission.
Almost every employee who is hired, injured, or whose employment is localized in Illinois is covered by workers' compensation. For the most part, benefits are paid for accidental injuries that are caused, in whole or in part, by the employee's work. This includes the aggravation of a pre-existing condition and injuries brought on by the repetitive use of a part of the body.
Illinois employers pay for workers' compensation benefits through insurance policies or by self-insurance. Benefits are based on the worker's earnings, subject to certain limits. Cases are first heard by arbitrators, whose decisions may be appealed to commissioners. Cases may proceed on to the circuit court, Illinois Appellate Court, and the Illinois Supreme Court. Most cases, however, are settled between the parties.
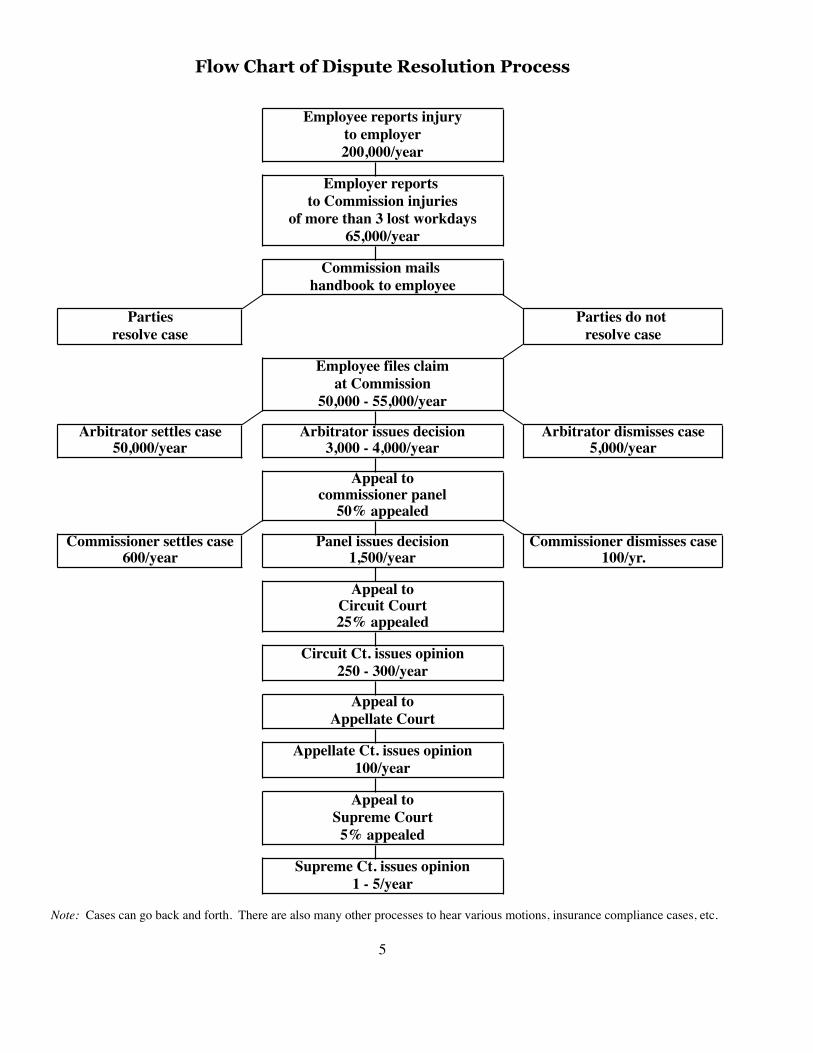
Flow Chart of Dispute Resolution Process
Employee reports injuryto employer200,000/year
Employer reports to Commission injuries
of more than 3 lost workdays65,000/year
Commission mails handbook to employee
Parties Parties do not resolve case resolve case
Employee files claimat Commission
50,000 - 55,000/year
Arbitrator settles case Arbitrator issues decision Arbitrator dismisses case50,000/year 3,000 - 4,000/year 5,000/year
Appeal tocommissioner panel
50% appealed
Commissioner settles case Panel issues decision Commissioner dismisses case600/year 1,500/year 100/yr.
Appeal toCircuit Court25% appealed
Circuit Ct. issues opinion250 - 300/year
Appeal toAppellate Court
Appellate Ct. issues opinion100/year
Appeal toSupreme Court5% appealed
Supreme Ct. issues opinion1 - 5/year
Note: Cases can go back and forth. There are also many other processes to hear various motions, insurance compliance cases, etc.
5
6
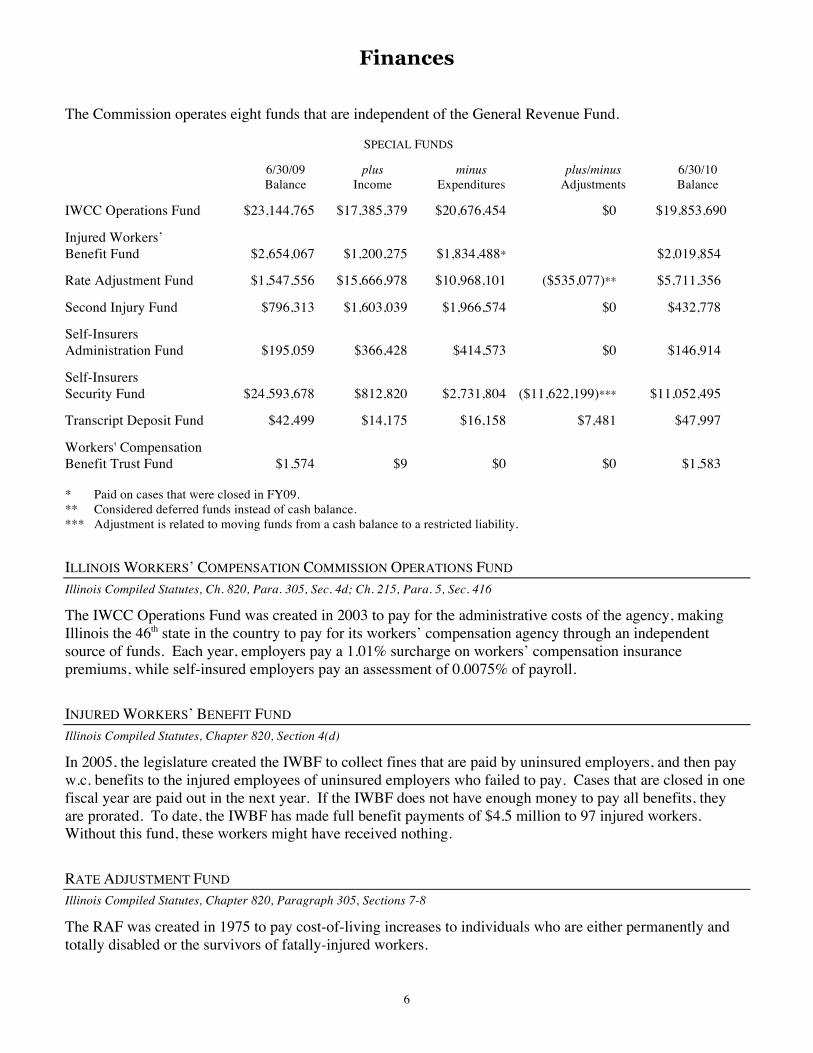
Finances The Commission operates eight funds that are independent of the General Revenue Fund.
SPECIAL FUNDS 6/30/09 plus minus plus/minus 6/30/10 Balance Income Expenditures Adjustments Balance IWCC Operations Fund $23,144,765 $17,385,379 $20,676,454 $0 $19,853,690 Injured Workers’ Benefit Fund $2,654,067 $1,200,275 $1,834,488* $2,019,854 Rate Adjustment Fund $1,547,556 $15,666,978 $10,968,101 ($535,077)** $5,711,356 Second Injury Fund $796,313 $1,603,039 $1,966,574 $0 $432,778 Self-Insurers Administration Fund $195,059 $366,428 $414,573 $0 $146,914 Self-Insurers Security Fund $24,593,678 $812,820 $2,731,804 ($11,622,199)*** $11,052,495 Transcript Deposit Fund $42,499 $14,175 $16,158 $7,481 $47,997 Workers' Compensation Benefit Trust Fund $1,574 $9 $0 $0 $1,583 * Paid on cases that were closed in FY09. ** Considered deferred funds instead of cash balance. *** Adjustment is related to moving funds from a cash balance to a restricted liability. ILLINOIS WORKERS’ COMPENSATION COMMISSION OPERATIONS FUND
Illinois Compiled Statutes, Ch. 820, Para. 305, Sec. 4d; Ch. 215, Para. 5, Sec. 416
The IWCC Operations Fund was created in 2003 to pay for the administrative costs of the agency, making Illinois the 46th state in the country to pay for its workers’ compensation agency through an independent source of funds. Each year, employers pay a 1.01% surcharge on workers’ compensation insurance premiums, while self-insured employers pay an assessment of 0.0075% of payroll. INJURED WORKERS’ BENEFIT FUND
Illinois Compiled Statutes, Chapter 820, Section 4(d)
In 2005, the legislature created the IWBF to collect fines that are paid by uninsured employers, and then pay w.c. benefits to the injured employees of uninsured employers who failed to pay. Cases that are closed in one fiscal year are paid out in the next year. If the IWBF does not have enough money to pay all benefits, they are prorated. To date, the IWBF has made full benefit payments of $4.5 million to 97 injured workers. Without this fund, these workers might have received nothing. RATE ADJUSTMENT FUND
Illinois Compiled Statutes, Chapter 820, Paragraph 305, Sections 7-8
The RAF was created in 1975 to pay cost-of-living increases to individuals who are either permanently and totally disabled or the survivors of fatally-injured workers.
7
Payments are made each month, beginning on July 15 of the second year after the award is final. Recipients are given an amount equal to the percentage increase in the statewide average weekly wage, as calculated by the Department of Employment Security. If there is a decrease in the statewide average weekly wage, there is no change in the compensation rate.
Every six months, self-insured employers and insurance companies pay an assessment of 1.25% of all indemnity benefits paid in the preceding six-month period.
The RAF had run a deficit for years. Thanks to the increased assessments enacted in 2005, the fund now has a positive balance. The “adjustments” column shows funds that are considered deferred.
After taking a number of steps to improve controls over the RAF program in previous years, the Commission is now seeking legislation to clarify the application process and resolve payment issues. SECOND INJURY FUND
Illinois Compiled Statutes, Chapter 820, Paragraph 305, Sections 7-8
The SIF provides an incentive to employers to hire disabled workers. Illinois' SIF is more narrowly constructed than most other states. If a worker who had previously incurred the complete loss of a member or the use of a member (one hand, arm, foot, leg, or eye) is injured on the job and suffers the complete loss of another member so that he or she is permanently and totally disabled (PTD), the employer is liable only for the injury due to the second accident. The fund pays the amount necessary to provide the worker with a PTD indemnity benefit.
Approximately 100 individuals receive SIF benefits. In January and July each year, insurers and self-insured employers pay assessments up to 1/8 of 1% of compensation payments made during the previous six months. SELF-INSURERS ADMINISTRATION FUND
Illinois Compiled Statutes, Chapter 820, Paragraph 305, Section 4a-6.1
The SIAF was created in 1988 to pay the administrative costs of the Commission's self-insurance program. Private self-insured employers pay a fee of $500 per entity when applying for or renewing the self-insurance privilege. SELF-INSURERS SECURITY FUND
Illinois Compiled Statutes, Chapter 820, Paragraph 305, Sections 4a-5, 7
The SISF was created in 1986 to pay benefits to employees of private self-insurers that became insolvent after 1986. Self-insured employers pay assessments based on their indemnity payments, up to a maximum of 1.2% of indemnity benefits paid during the preceding year. The “income received” column also reflects the collection of bonds and escrows from self-insured employers during the year. The “adjustments” column reflects changes in the unpaid liability of the fund. This fund has always paid the benefits in full. TRANSCRIPT DEPOSIT FUND
Illinois Compiled Statutes, Chapter 30, Paragraph 105
When a case is appealed to the circuit court, the appealing party pays a $35 fee for the preparation of the file.
WORKERS’ COMPENSATION BENEFIT TRUST FUND
Illinois Compiled Statutes, Chapter 30, Paragraph 105
The WCBTF pays benefits to employees of private self-insurers that became insolvent before 1986. Benefits are paid from securities posted by the self-insurers; any unused funds are then returned to the insolvent estate.
8
Insurance Employers are responsible for the payment of benefits to injured workers; they must either purchase insurance or obtain permission to self-insure. INSURANCE
The workers' compensation insurance business in Illinois is profitable and highly competitive. More insurance companies sell workers' compensation policies in Illinois than in 49 other states.1
The National Council on Compensation Insurance, a private organization, issues advisory insurance rates. Illinois carriers use the advisory rate in their calculations but are free to set their own premium rates. A premium of $100 in 1990 would cost $120 in 2011; during the same time period, the Consumer Price Index increased roughly 76%, and the statewide average weekly wage doubled.2
Employers are able to obtain workers' compensation insurance in Illinois with relative ease. Less than 4% of Illinois employers were unable to buy insurance in the open market, causing them to buy in the residual market; the national average is over 6%. These policies tend to be small, so that the residual market premium represents less than 3% of the total market in Illinois.3
Additional information on workers’ compensation insurance costs is available in the chapter on Interstate Comparisons. INSURANCE COMPLIANCE PROGRAM
Illinois law requires employers to insure themselves for their workers' compensation liabilities, but some employers fail to comply. These employers enjoy an unfair competitive advantage over law-abiding companies, while leaving their employees vulnerable if accidents should occur.
Under legislation that passed during the 2011 session, Commission investigators can issue citations of $500 - $2,500 to an uninsured employer. The employer must pay the fine and provide proof of insurance within 10 days of the citation. Failure to comply would be a basis for initiating a noncompliance action where the minimum fine is $10,000.
All employee leasing companies (ELCs) will be required to provide to the Commission with the names of all clients named under their workers’ compensation policies and provide copies of the certificates of insurance naming these clients.
If the Commission does find that an employer knowingly and willfully failed to obtain insurance, it may be fined up to $500 for every day of noncompliance, with a minimum fine of $10,000. Corporate officers may be held personally liable if the company fails to pay the fine. An employer may also face criminal charges and/or a work-stop order for failing to obtain workers' compensation insurance.
In FY10, the unit collected over $800,000 in fines from 135 uninsured employers with 2,200 workers that were found to be operating without workers’ compensation insurance. Since FY06, the first full year with tougher laws, we have collected $6 million from 500 uninsured employers.
These fines are deposited into the Injured Workers’ Benefit Fund. The IWBF paid $1.7 million to 35 injured workers whose cases were closed in FY10 and whose uninsured employers failed to pay them. (Payments were actually made in FY11.) To date, the IWBF has paid $4.5 million in benefits to 97 injured workers. Without this program, these people might have received nothing.
9
INSURANCE FRAUD
The Illinois Department of Insurance investigates workers’ compensation fraud. The IWCC funds the unit, but the IDOI administers it. IDOI Fraud Unit annual reports are available at http://www.insurance.illinois.gov/wcfu/report-data.asp .
It is illegal for anyone—a worker, employer, insurance carrier, medical provider, etc.—to intentionally make a false statement in order to obtain or deny w.c. benefits, obtain w.c. insurance at less than the proper rate, obtain approval to self-insure, etc. A “statement” includes any writing, notice, proof of injury, or any medical bill, record, report, or test result.
Anyone found guilty of any of these actions is guilty of a crime, ranging from a misdemeanor to a Class 1 felony. The guilty party shall be required to pay complete restitution, may be sent to jail, and may be found civilly liable for up to three times the value of benefits or coverage that was wrongfully attained.
Since the fraud unit was created in 2006, 22 convictions have been attained: 16 employees, 3 employers, and 3 insurers. Details are available at http://www.insurance.illinois.gov/wcfu/condata.asp . SELF-INSURANCE
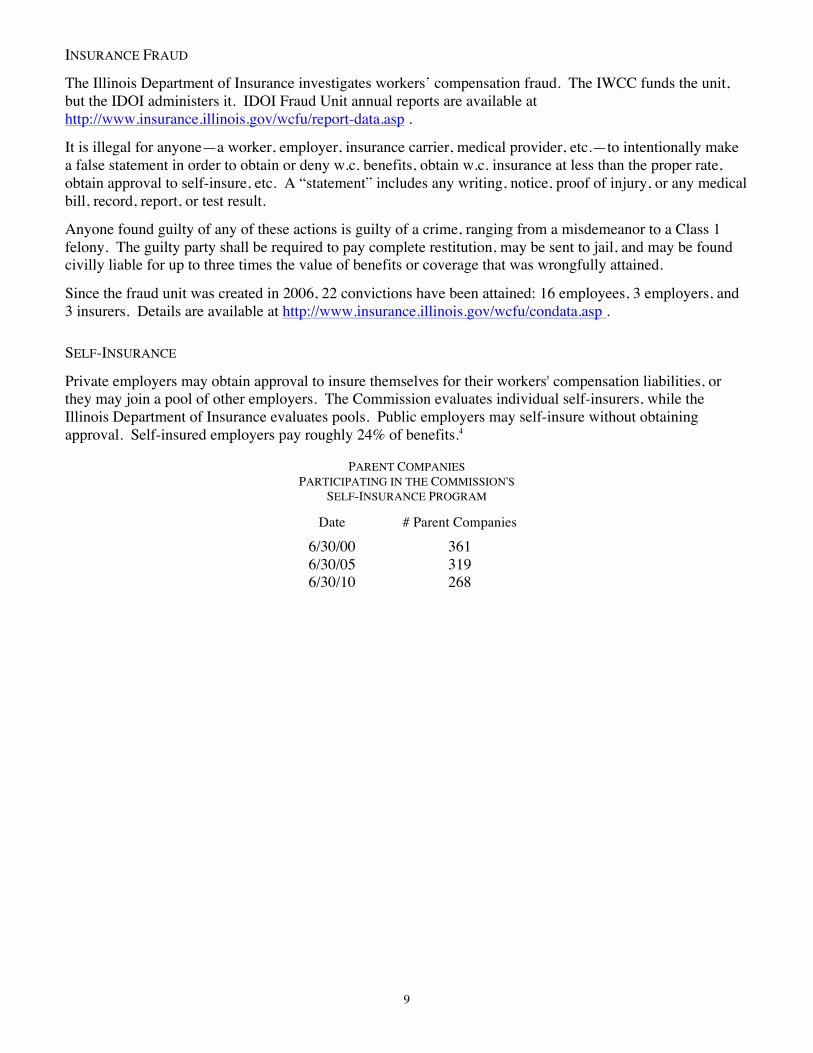
Private employers may obtain approval to insure themselves for their workers' compensation liabilities, or they may join a pool of other employers. The Commission evaluates individual self-insurers, while the Illinois Department of Insurance evaluates pools. Public employers may self-insure without obtaining approval. Self-insured employers pay roughly 24% of benefits.4
PARENT COMPANIES PARTICIPATING IN THE COMMISSION'S
SELF-INSURANCE PROGRAM Date # Parent Companies
6/30/00 361 6/30/05 319 6/30/10 268
10
Administration ORGANIZATIONAL STRUCTURE
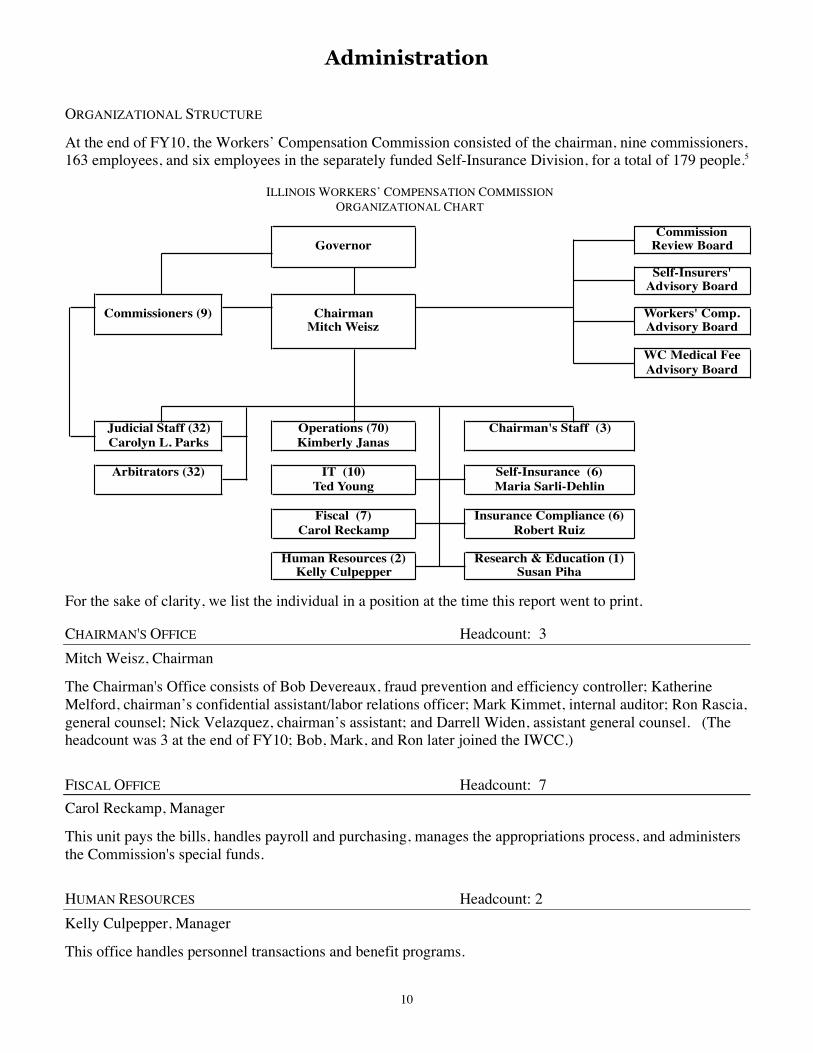
At the end of FY10, the Workers’ Compensation Commission consisted of the chairman, nine commissioners, 163 employees, and six employees in the separately funded Self-Insurance Division, for a total of 179 people.5
ILLINOIS WORKERS’ COMPENSATION COMMISSION ORGANIZATIONAL CHART
Commission
Governor Review Board
Self-Insurers'Advisory Board
Commissioners (9) Chairman Workers' Comp.Mitch Weisz Advisory Board
WC Medical FeeAdvisory Board
Judicial Staff (32) Operations (70) Chairman's Staff (3)Carolyn L. Parks Kimberly Janas
Arbitrators (32) IT (10) Self-Insurance (6)Ted Young Maria Sarli-Dehlin
Fiscal (7) Insurance Compliance (6)Carol Reckamp Robert Ruiz
Human Resources (2) Research & Education (1)Kelly Culpepper Susan Piha
For the sake of clarity, we list the individual in a position at the time this report went to print. CHAIRMAN'S OFFICE Headcount: 3
Mitch Weisz, Chairman
The Chairman's Office consists of Bob Devereaux, fraud prevention and efficiency controller; Katherine Melford, chairman’s confidential assistant/labor relations officer; Mark Kimmet, internal auditor; Ron Rascia, general counsel; Nick Velazquez, chairman’s assistant; and Darrell Widen, assistant general counsel. (The headcount was 3 at the end of FY10; Bob, Mark, and Ron later joined the IWCC.) FISCAL OFFICE Headcount: 7
Carol Reckamp, Manager
This unit pays the bills, handles payroll and purchasing, manages the appropriations process, and administers the Commission's special funds. HUMAN RESOURCES Headcount: 2
Kelly Culpepper, Manager
This office handles personnel transactions and benefit programs.
11
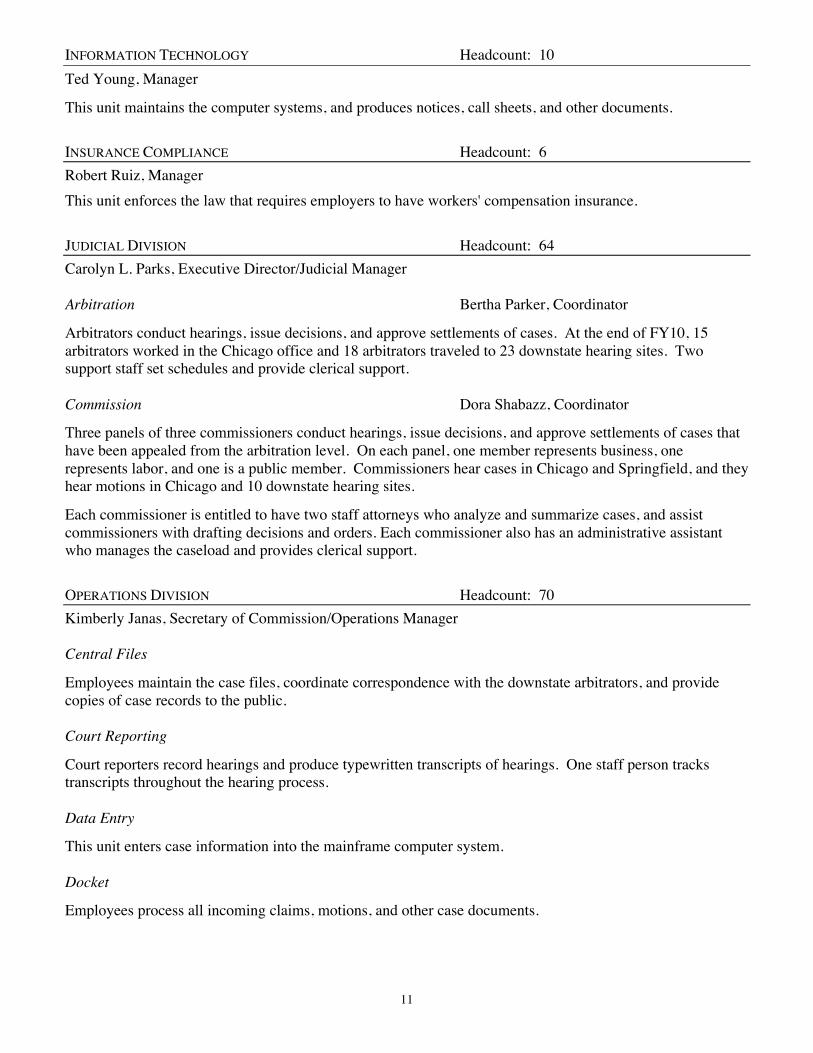
INFORMATION TECHNOLOGY Headcount: 10
Ted Young, Manager
This unit maintains the computer systems, and produces notices, call sheets, and other documents. INSURANCE COMPLIANCE Headcount: 6
Robert Ruiz, Manager
This unit enforces the law that requires employers to have workers' compensation insurance. JUDICIAL DIVISION Headcount: 64
Carolyn L. Parks, Executive Director/Judicial Manager Arbitration Bertha Parker, Coordinator
Arbitrators conduct hearings, issue decisions, and approve settlements of cases. At the end of FY10, 15 arbitrators worked in the Chicago office and 18 arbitrators traveled to 23 downstate hearing sites. Two support staff set schedules and provide clerical support. Commission Dora Shabazz, Coordinator
Three panels of three commissioners conduct hearings, issue decisions, and approve settlements of cases that have been appealed from the arbitration level. On each panel, one member represents business, one represents labor, and one is a public member. Commissioners hear cases in Chicago and Springfield, and they hear motions in Chicago and 10 downstate hearing sites.
Each commissioner is entitled to have two staff attorneys who analyze and summarize cases, and assist commissioners with drafting decisions and orders. Each commissioner also has an administrative assistant who manages the caseload and provides clerical support. OPERATIONS DIVISION Headcount: 70
Kimberly Janas, Secretary of Commission/Operations Manager Central Files
Employees maintain the case files, coordinate correspondence with the downstate arbitrators, and provide copies of case records to the public. Court Reporting
Court reporters record hearings and produce typewritten transcripts of hearings. One staff person tracks transcripts throughout the hearing process. Data Entry
This unit enters case information into the mainframe computer system. Docket
Employees process all incoming claims, motions, and other case documents.
12
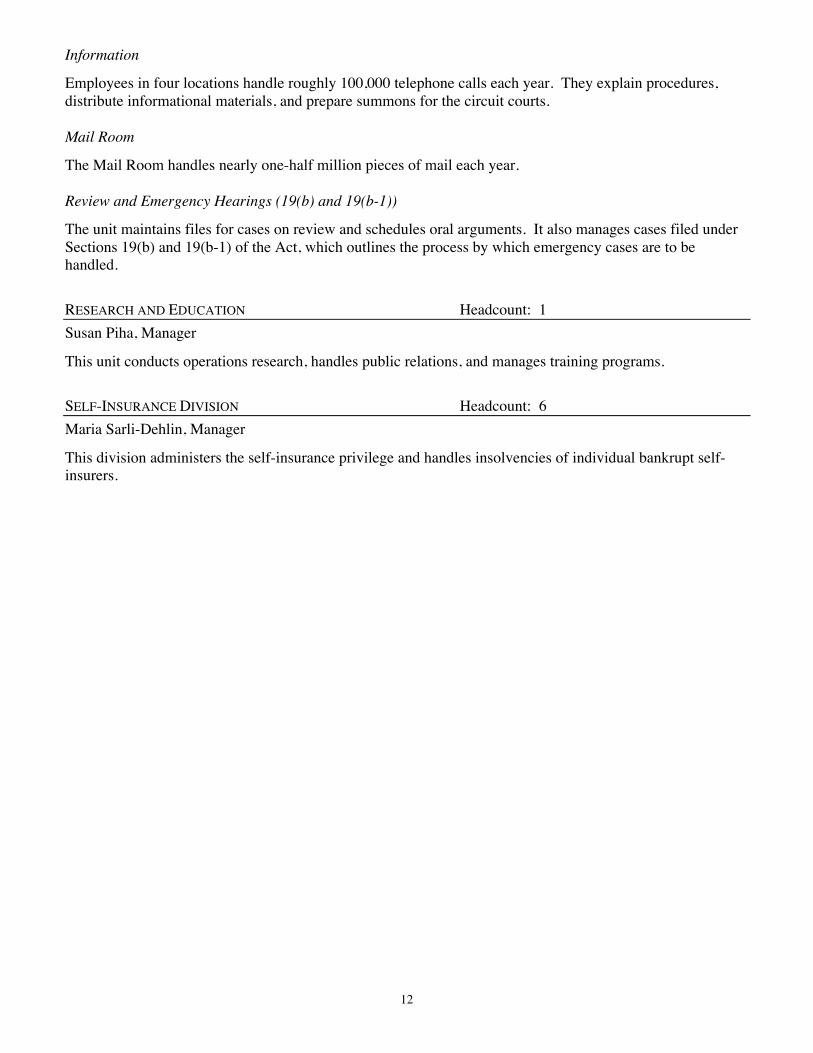
Information
Employees in four locations handle roughly 100,000 telephone calls each year. They explain procedures, distribute informational materials, and prepare summons for the circuit courts. Mail Room
The Mail Room handles nearly one-half million pieces of mail each year. Review and Emergency Hearings (19(b) and 19(b-1))
The unit maintains files for cases on review and schedules oral arguments. It also manages cases filed under Sections 19(b) and 19(b-1) of the Act, which outlines the process by which emergency cases are to be handled. RESEARCH AND EDUCATION Headcount: 1
Susan Piha, Manager
This unit conducts operations research, handles public relations, and manages training programs. SELF-INSURANCE DIVISION Headcount: 6
Maria Sarli-Dehlin, Manager
This division administers the self-insurance privilege and handles insolvencies of individual bankrupt self-insurers.
13
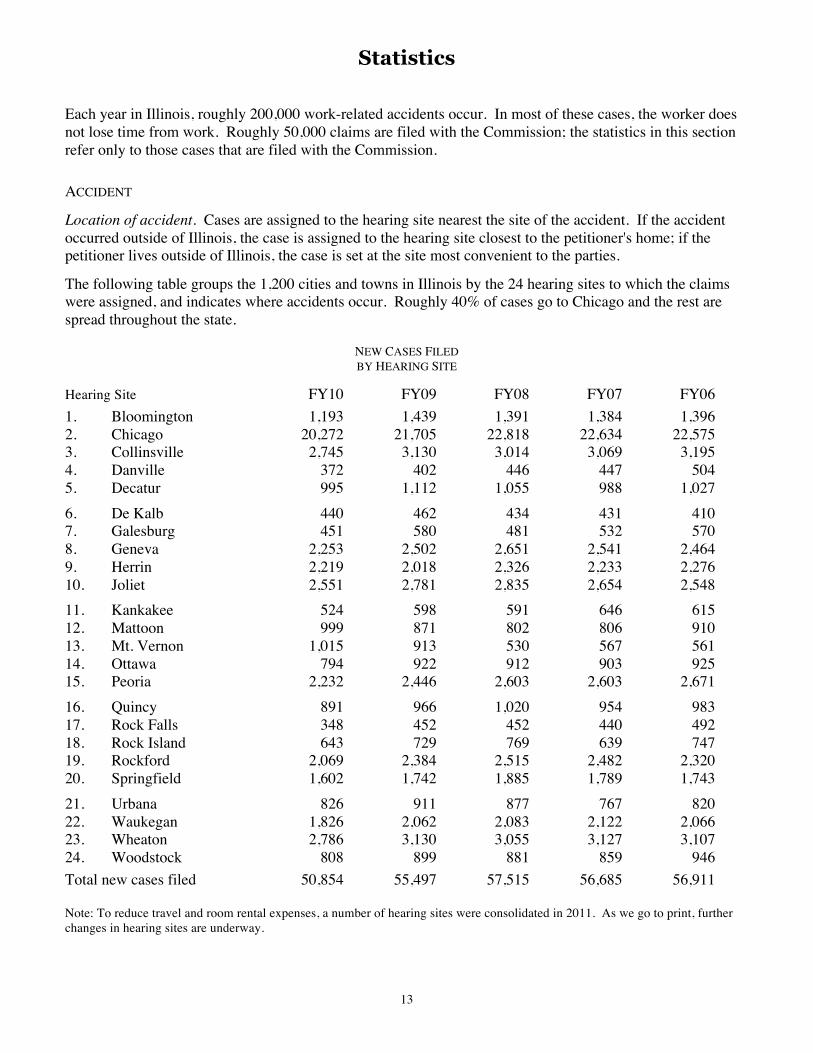
Statistics Each year in Illinois, roughly 200,000 work-related accidents occur. In most of these cases, the worker does not lose time from work. Roughly 50,000 claims are filed with the Commission; the statistics in this section refer only to those cases that are filed with the Commission. ACCIDENT
Location of accident. Cases are assigned to the hearing site nearest the site of the accident. If the accident occurred outside of Illinois, the case is assigned to the hearing site closest to the petitioner's home; if the petitioner lives outside of Illinois, the case is set at the site most convenient to the parties.
The following table groups the 1,200 cities and towns in Illinois by the 24 hearing sites to which the claims were assigned, and indicates where accidents occur. Roughly 40% of cases go to Chicago and the rest are spread throughout the state.
NEW CASES FILED BY HEARING SITE
Hearing Site FY10 FY09 FY08 FY07 FY06
1. Bloomington 1,193 1,439 1,391 1,384 1,396 2. Chicago 20,272 21,705 22,818 22,634 22,575 3. Collinsville 2,745 3,130 3,014 3,069 3,195 4. Danville 372 402 446 447 504 5. Decatur 995 1,112 1,055 988 1,027
6. De Kalb 440 462 434 431 410 7. Galesburg 451 580 481 532 570 8. Geneva 2,253 2,502 2,651 2,541 2,464 9. Herrin 2,219 2,018 2,326 2,233 2,276 10. Joliet 2,551 2,781 2,835 2,654 2,548
11. Kankakee 524 598 591 646 615 12. Mattoon 999 871 802 806 910 13. Mt. Vernon 1,015 913 530 567 561 14. Ottawa 794 922 912 903 925 15. Peoria 2,232 2,446 2,603 2,603 2,671
16. Quincy 891 966 1,020 954 983 17. Rock Falls 348 452 452 440 492 18. Rock Island 643 729 769 639 747 19. Rockford 2,069 2,384 2,515 2,482 2,320 20. Springfield 1,602 1,742 1,885 1,789 1,743
21. Urbana 826 911 877 767 820 22. Waukegan 1,826 2,062 2,083 2,122 2,066 23. Wheaton 2,786 3,130 3,055 3,127 3,107 24. Woodstock 808 899 881 859 946
Total new cases filed 50,854 55,497 57,515 56,685 56,911 Note: To reduce travel and room rental expenses, a number of hearing sites were consolidated in 2011. As we go to print, further changes in hearing sites are underway.
14
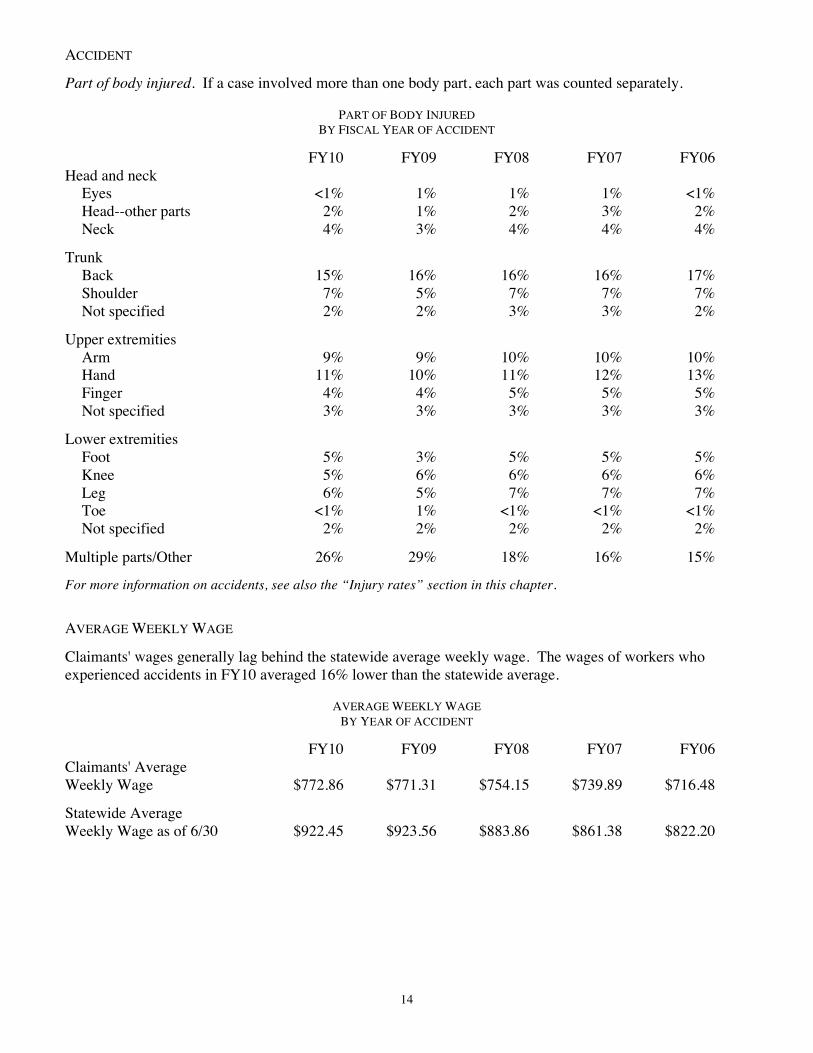
ACCIDENT
Part of body injured. If a case involved more than one body part, each part was counted separately.
PART OF BODY INJURED BY FISCAL YEAR OF ACCIDENT
FY10 FY09 FY08 FY07 FY06 Head and neck Eyes <1% 1% 1% 1% <1% Head--other parts 2% 1% 2% 3% 2% Neck 4% 3% 4% 4% 4%
Trunk Back 15% 16% 16% 16% 17% Shoulder 7% 5% 7% 7% 7% Not specified 2% 2% 3% 3% 2%
Upper extremities Arm 9% 9% 10% 10% 10% Hand 11% 10% 11% 12% 13% Finger 4% 4% 5% 5% 5% Not specified 3% 3% 3% 3% 3%
Lower extremities Foot 5% 3% 5% 5% 5% Knee 5% 6% 6% 6% 6% Leg 6% 5% 7% 7% 7% Toe <1% 1% <1% <1% <1% Not specified 2% 2% 2% 2% 2%
Multiple parts/Other 26% 29% 18% 16% 15% For more information on accidents, see also the “Injury rates” section in this chapter.
AVERAGE WEEKLY WAGE
Claimants' wages generally lag behind the statewide average weekly wage. The wages of workers who experienced accidents in FY10 averaged 16% lower than the statewide average.
AVERAGE WEEKLY WAGE BY YEAR OF ACCIDENT
FY10 FY09 FY08 FY07 FY06 Claimants' Average Weekly Wage $772.86 $771.31 $754.15 $739.89 $716.48
Statewide Average Weekly Wage as of 6/30 $922.45 $923.56 $883.86 $861.38 $822.20
15
CASES CLOSED
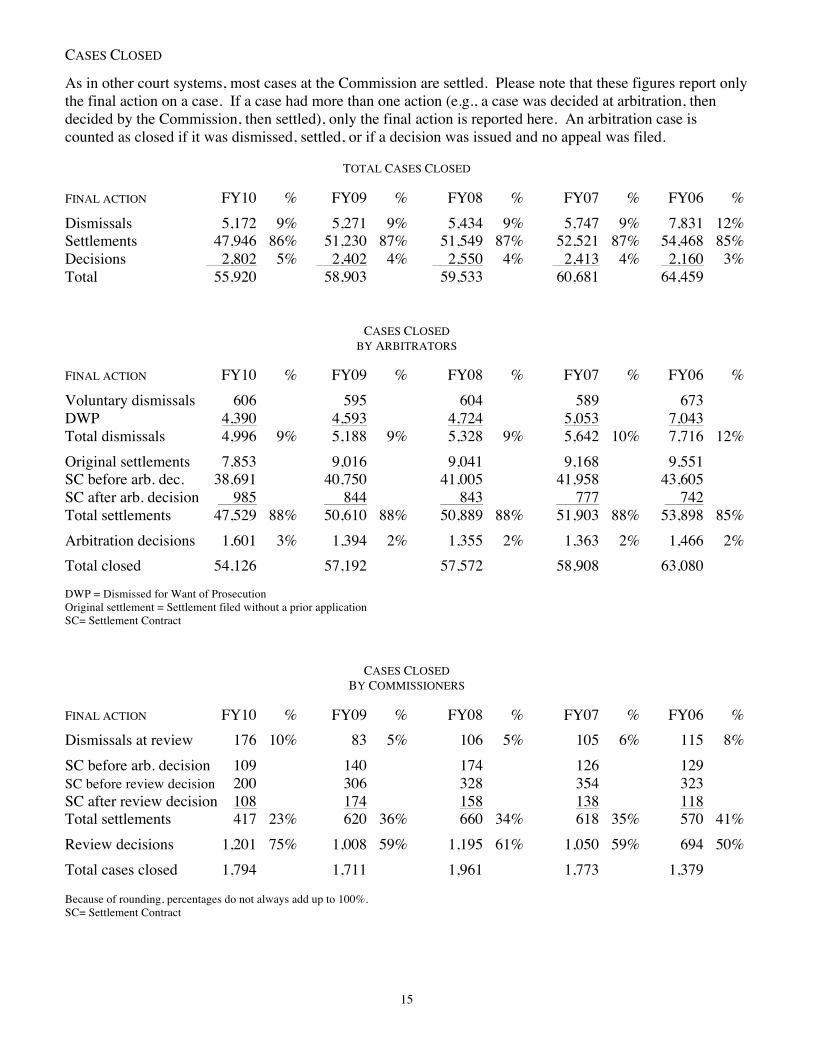
As in other court systems, most cases at the Commission are settled. Please note that these figures report only the final action on a case. If a case had more than one action (e.g., a case was decided at arbitration, then decided by the Commission, then settled), only the final action is reported here. An arbitration case is counted as closed if it was dismissed, settled, or if a decision was issued and no appeal was filed.
TOTAL CASES CLOSED FINAL ACTION FY10 % FY09 % FY08 % FY07 % FY06 %
Dismissals 5,172 9% 5,271 9% 5,434 9% 5,747 9% 7,831 12% Settlements 47,946 86% 51,230 87% 51,549 87% 52,521 87% 54,468 85% Decisions 2,802 5% 2,402 4% 2,550 4% 2,413 4% 2,160 3% Total 55,920 58,903 59,533 60,681 64,459
CASES CLOSED BY ARBITRATORS
FINAL ACTION FY10 % FY09 % FY08 % FY07 % FY06 %
Voluntary dismissals 606 595 604 589 673 DWP 4,390 4,593 4,724 5,053 7,043 Total dismissals 4,996 9% 5,188 9% 5,328 9% 5,642 10% 7,716 12%
Original settlements 7,853 9,016 9,041 9,168 9,551 SC before arb. dec. 38,691 40,750 41,005 41,958 43,605 SC after arb. decision 985 844 843 777 742 Total settlements 47,529 88% 50,610 88% 50,889 88% 51,903 88% 53,898 85%
Arbitration decisions 1,601 3% 1,394 2% 1,355 2% 1,363 2% 1,466 2%
Total closed 54,126 57,192 57,572 58,908 63,080 DWP = Dismissed for Want of Prosecution Original settlement = Settlement filed without a prior application SC= Settlement Contract
CASES CLOSED BY COMMISSIONERS
FINAL ACTION FY10 % FY09 % FY08 % FY07 % FY06 %
Dismissals at review 176 10% 83 5% 106 5% 105 6% 115 8%
SC before arb. decision 109 140 174 126 129 SC before review decision 200 306 328 354 323 SC after review decision 108 174 158 138 118 Total settlements 417 23% 620 36% 660 34% 618 35% 570 41%
Review decisions 1,201 75% 1,008 59% 1,195 61% 1,050 59% 694 50%
Total cases closed 1,794 1,711 1,961 1,773 1,379
Because of rounding, percentages do not always add up to 100%. SC= Settlement Contract
16
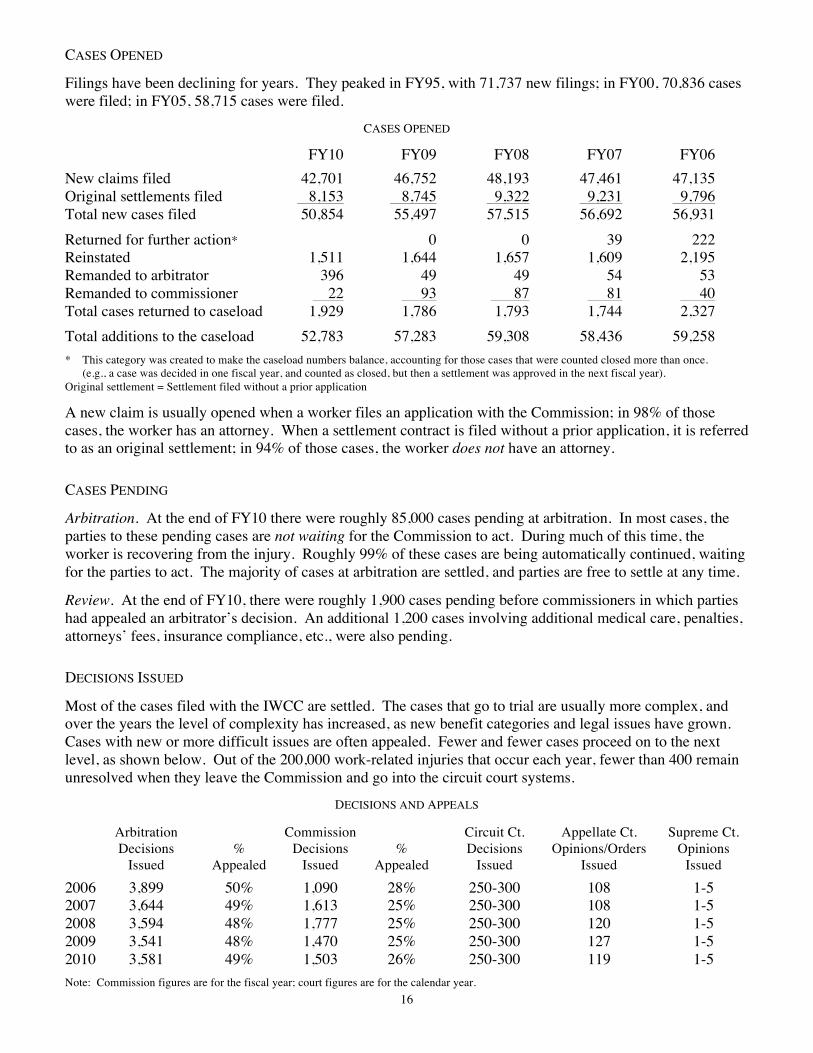
CASES OPENED
Filings have been declining for years. They peaked in FY95, with 71,737 new filings; in FY00, 70,836 cases were filed; in FY05, 58,715 cases were filed.
CASES OPENED
FY10 FY09 FY08 FY07 FY06
New claims filed 42,701 46,752 48,193 47,461 47,135 Original settlements filed 8,153 8,745 9,322 9,231 9,796 Total new cases filed 50,854 55,497 57,515 56,692 56,931
Returned for further action* 0 0 39 222 Reinstated 1,511 1,644 1,657 1,609 2,195 Remanded to arbitrator 396 49 49 54 53 Remanded to commissioner 22 93 87 81 40 Total cases returned to caseload 1,929 1,786 1,793 1,744 2,327
Total additions to the caseload 52,783 57,283 59,308 58,436 59,258
* This category was created to make the caseload numbers balance, accounting for those cases that were counted closed more than once. (e.g., a case was decided in one fiscal year, and counted as closed, but then a settlement was approved in the next fiscal year). Original settlement = Settlement filed without a prior application
A new claim is usually opened when a worker files an application with the Commission; in 98% of those cases, the worker has an attorney. When a settlement contract is filed without a prior application, it is referred to as an original settlement; in 94% of those cases, the worker does not have an attorney. CASES PENDING
Arbitration. At the end of FY10 there were roughly 85,000 cases pending at arbitration. In most cases, the parties to these pending cases are not waiting for the Commission to act. During much of this time, the worker is recovering from the injury. Roughly 99% of these cases are being automatically continued, waiting for the parties to act. The majority of cases at arbitration are settled, and parties are free to settle at any time.
Review. At the end of FY10, there were roughly 1,900 cases pending before commissioners in which parties had appealed an arbitrator’s decision. An additional 1,200 cases involving additional medical care, penalties, attorneys’ fees, insurance compliance, etc., were also pending. DECISIONS ISSUED
Most of the cases filed with the IWCC are settled. The cases that go to trial are usually more complex, and over the years the level of complexity has increased, as new benefit categories and legal issues have grown. Cases with new or more difficult issues are often appealed. Fewer and fewer cases proceed on to the next level, as shown below. Out of the 200,000 work-related injuries that occur each year, fewer than 400 remain unresolved when they leave the Commission and go into the circuit court systems.
DECISIONS AND APPEALS
Arbitration Commission Circuit Ct. Appellate Ct. Supreme Ct. Decisions % Decisions % Decisions Opinions/Orders Opinions Issued Appealed Issued Appealed Issued Issued Issued
2006 3,899 50% 1,090 28% 250-300 108 1-5 2007 3,644 49% 1,613 25% 250-300 108 1-5 2008 3,594 48% 1,777 25% 250-300 120 1-5 2009 3,541 48% 1,470 25% 250-300 127 1-5 2010 3,581 49% 1,503 26% 250-300 119 1-5
Note: Commission figures are for the fiscal year; court figures are for the calendar year.
17
Outcome of appeals. Parties have the right to appeal arbitrators’ decisions, but they may wish to consider the fact that, most of the time, the commissioners do agree with the arbitrators. Cases appealed by petitioners do not result in higher benefits 83% of the time, while cases appealed by respondents do not result in lower benefits 74% of the time. Trends. Under Section 19(b-1), an injured worker who is not receiving temporary total disability or medical benefits may petition for an emergency hearing. Alternately, the worker may choose to file under 19(b) if he or she is not receiving TTD or medical benefits.
Over the years, there has been a clear shift from 19(b-1) petitions, which involve statutorily set deadlines, to 19(b) petitions. Each year, arbitrators issue fewer than a dozen 19(b-1) decisions and roughly 1,000 19(b) decisions. GENDER
Women constitute 47% of the Illinois workforce,6 but they file a smaller share of claims. The most dangerous industries—construction, agriculture, transportation—are still male-dominated. Over the years, the proportion of female claimants has increased, however, from 22% of claimants in FY85 to 35% in FY10. INJURY RATES
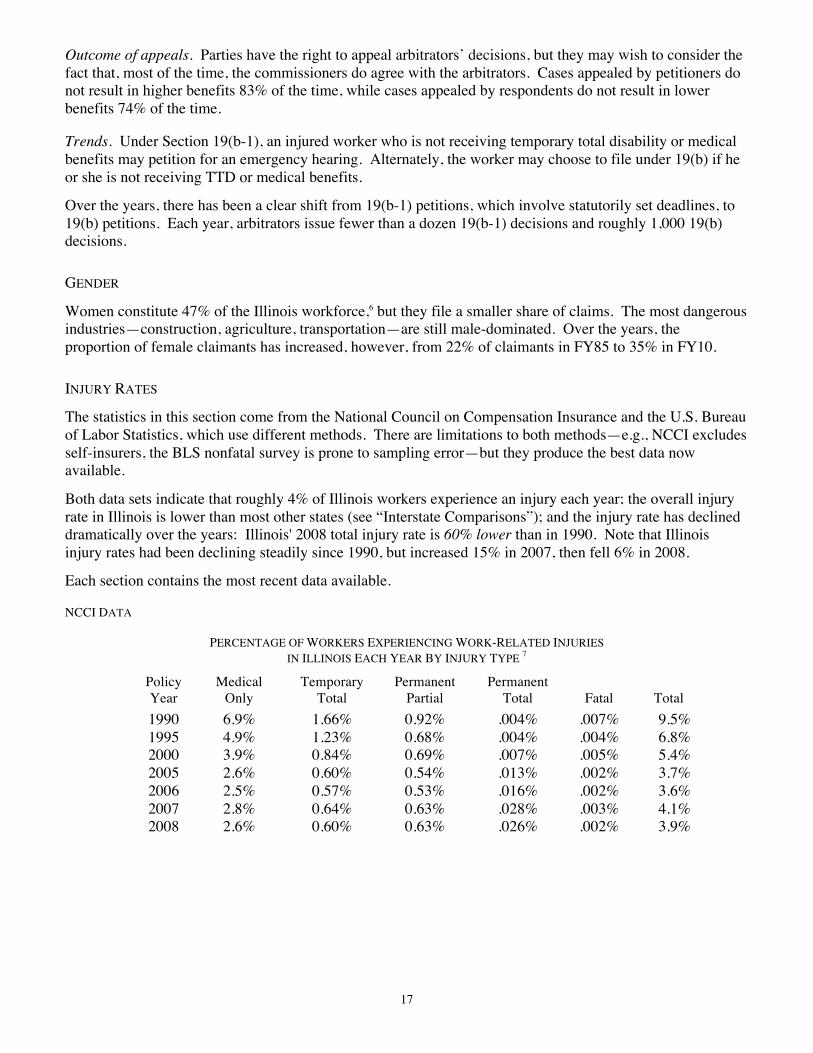
The statistics in this section come from the National Council on Compensation Insurance and the U.S. Bureau of Labor Statistics, which use different methods. There are limitations to both methods—e.g., NCCI excludes self-insurers, the BLS nonfatal survey is prone to sampling error—but they produce the best data now available.
Both data sets indicate that roughly 4% of Illinois workers experience an injury each year; the overall injury rate in Illinois is lower than most other states (see “Interstate Comparisons”); and the injury rate has declined dramatically over the years: Illinois' 2008 total injury rate is 60% lower than in 1990. Note that Illinois injury rates had been declining steadily since 1990, but increased 15% in 2007, then fell 6% in 2008.
Each section contains the most recent data available. NCCI DATA
PERCENTAGE OF WORKERS EXPERIENCING WORK-RELATED INJURIES IN ILLINOIS EACH YEAR BY INJURY TYPE 7
Policy Medical Temporary Permanent Permanent Year Only Total Partial Total Fatal Total
1990 6.9% 1.66% 0.92% .004% .007% 9.5% 1995 4.9% 1.23% 0.68% .004% .004% 6.8% 2000 3.9% 0.84% 0.69% .007% .005% 5.4% 2005 2.6% 0.60% 0.54% .013% .002% 3.7% 2006 2.5% 0.57% 0.53% .016% .002% 3.6% 2007 2.8% 0.64% 0.63% .028% .003% 4.1% 2008 2.6% 0.60% 0.63% .026% .002% 3.9%
18
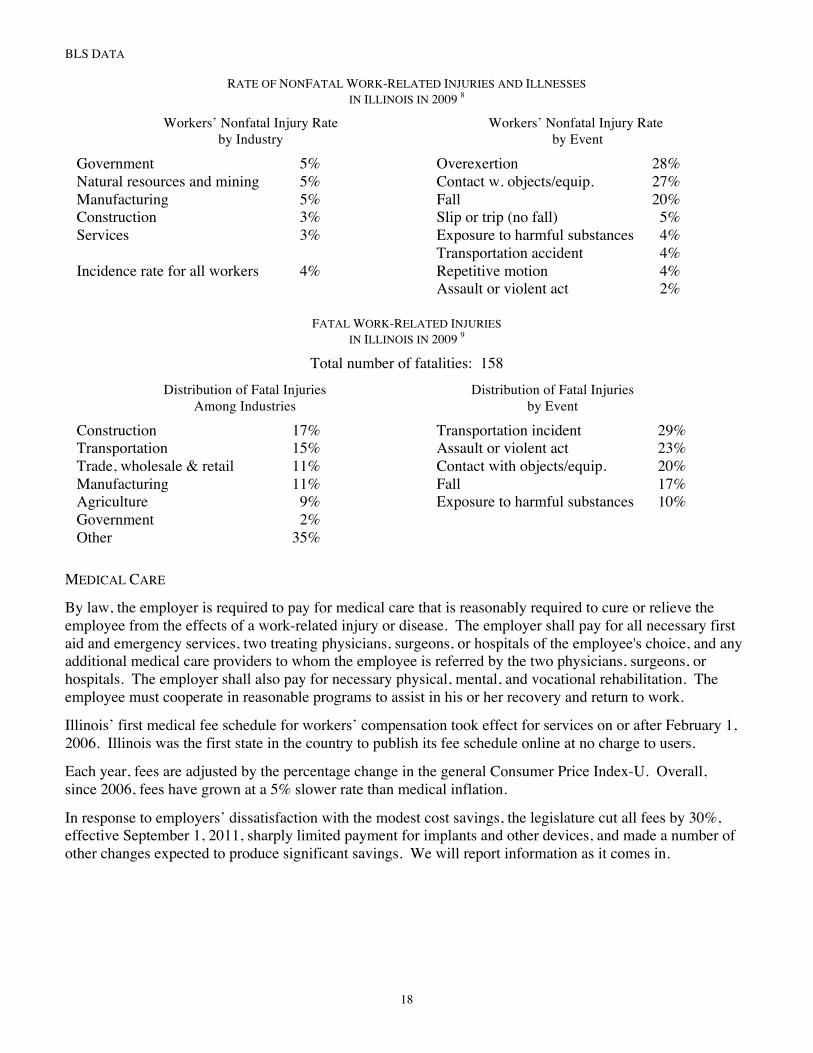
BLS DATA
RATE OF NONFATAL WORK-RELATED INJURIES AND ILLNESSES IN ILLINOIS IN 2009 8
Workers’ Nonfatal Injury Rate Workers’ Nonfatal Injury Rate by Industry by Event
Government 5% Overexertion 28% Natural resources and mining 5% Contact w. objects/equip. 27% Manufacturing 5% Fall 20% Construction 3% Slip or trip (no fall) 5% Services 3% Exposure to harmful substances 4% Transportation accident 4% Incidence rate for all workers 4% Repetitive motion 4% Assault or violent act 2%
FATAL WORK-RELATED INJURIES
IN ILLINOIS IN 2009 9
Total number of fatalities: 158
Distribution of Fatal Injuries Distribution of Fatal Injuries Among Industries by Event
Construction 17% Transportation incident 29% Transportation 15% Assault or violent act 23% Trade, wholesale & retail 11% Contact with objects/equip. 20% Manufacturing 11% Fall 17% Agriculture 9% Exposure to harmful substances 10% Government 2% Other 35%
MEDICAL CARE
By law, the employer is required to pay for medical care that is reasonably required to cure or relieve the employee from the effects of a work-related injury or disease. The employer shall pay for all necessary first aid and emergency services, two treating physicians, surgeons, or hospitals of the employee's choice, and any additional medical care providers to whom the employee is referred by the two physicians, surgeons, or hospitals. The employer shall also pay for necessary physical, mental, and vocational rehabilitation. The employee must cooperate in reasonable programs to assist in his or her recovery and return to work.
Illinois’ first medical fee schedule for workers’ compensation took effect for services on or after February 1, 2006. Illinois was the first state in the country to publish its fee schedule online at no charge to users.
Each year, fees are adjusted by the percentage change in the general Consumer Price Index-U. Overall, since 2006, fees have grown at a 5% slower rate than medical inflation.
In response to employers’ dissatisfaction with the modest cost savings, the legislature cut all fees by 30%, effective September 1, 2011, sharply limited payment for implants and other devices, and made a number of other changes expected to produce significant savings. We will report information as it comes in.
19
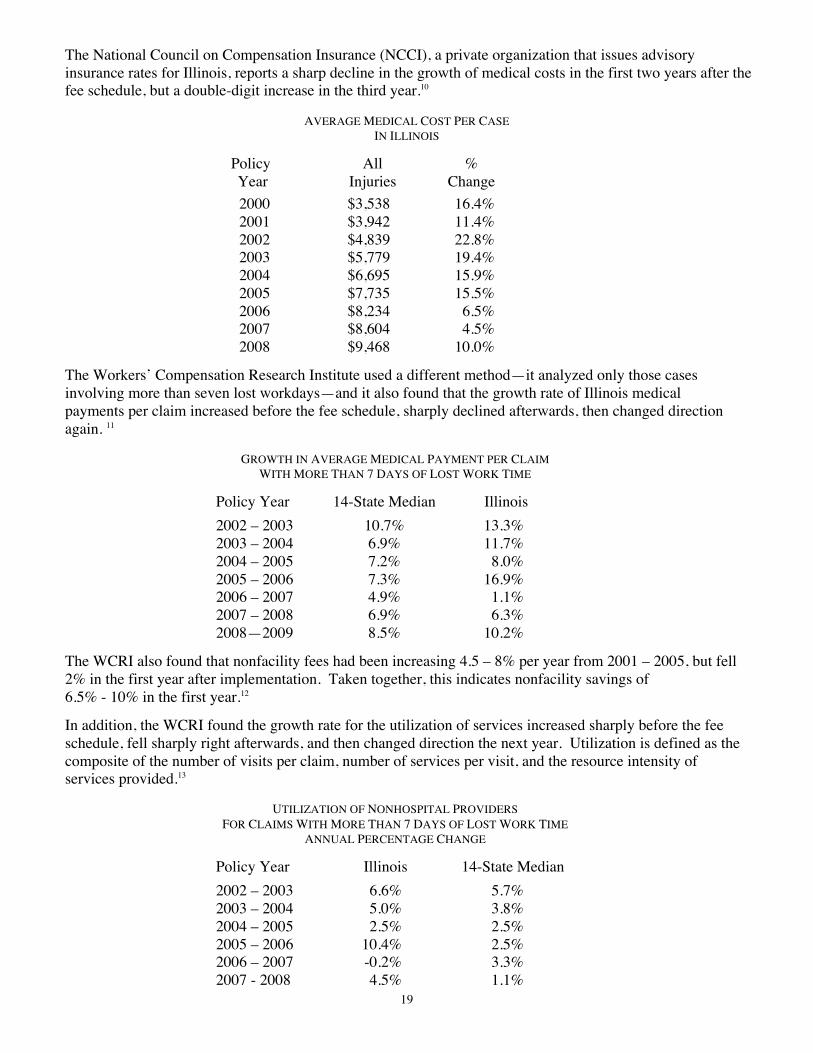
The National Council on Compensation Insurance (NCCI), a private organization that issues advisory insurance rates for Illinois, reports a sharp decline in the growth of medical costs in the first two years after the fee schedule, but a double-digit increase in the third year.10
AVERAGE MEDICAL COST PER CASE IN ILLINOIS
Policy All % Year Injuries Change
2000 $3,538 16.4% 2001 $3,942 11.4% 2002 $4,839 22.8% 2003 $5,779 19.4% 2004 $6,695 15.9% 2005 $7,735 15.5% 2006 $8,234 6.5% 2007 $8,604 4.5% 2008 $9,468 10.0%
The Workers’ Compensation Research Institute used a different method—it analyzed only those cases involving more than seven lost workdays—and it also found that the growth rate of Illinois medical payments per claim increased before the fee schedule, sharply declined afterwards, then changed direction again. 11
GROWTH IN AVERAGE MEDICAL PAYMENT PER CLAIM WITH MORE THAN 7 DAYS OF LOST WORK TIME
Policy Year 14-State Median Illinois
2002 – 2003 10.7% 13.3% 2003 – 2004 6.9% 11.7% 2004 – 2005 7.2% 8.0% 2005 – 2006 7.3% 16.9% 2006 – 2007 4.9% 1.1% 2007 – 2008 6.9% 6.3% 2008—2009 8.5% 10.2%
The WCRI also found that nonfacility fees had been increasing 4.5 – 8% per year from 2001 – 2005, but fell 2% in the first year after implementation. Taken together, this indicates nonfacility savings of 6.5% - 10% in the first year.12
In addition, the WCRI found the growth rate for the utilization of services increased sharply before the fee schedule, fell sharply right afterwards, and then changed direction the next year. Utilization is defined as the composite of the number of visits per claim, number of services per visit, and the resource intensity of services provided.13
UTILIZATION OF NONHOSPITAL PROVIDERS FOR CLAIMS WITH MORE THAN 7 DAYS OF LOST WORK TIME
ANNUAL PERCENTAGE CHANGE
Policy Year Illinois 14-State Median
2002 – 2003 6.6% 5.7% 2003 – 2004 5.0% 3.8% 2004 – 2005 2.5% 2.5% 2005 – 2006 10.4% 2.5% 2006 – 2007 -0.2% 3.3% 2007 - 2008 4.5% 1.1%
20
PENALTIES
Under Section 19(k), the Commission may award the petitioner additional compensation equal to 50% of the amount of compensation payable at the time of the award if there was an unreasonable or vexatious delay of payment, or an intentional underpayment of compensation. Based on case law, medical expenses are considered compensation under Section 19(k). When awarding 19(k) penalties, the Commission shall consider whether an arbitrator has determined that the claim is not compensable or whether the employer has made payments under a group health plan (§8(j)).
Under Section 19(l), the Commission may award the petitioner additional compensation of $30 per day for every day that a benefit has been withheld without good and just cause, up to $10,000.
Under Section 16 of the Act, the Commission may order the respondent to pay the petitioner's attorneys' fees if the respondent or its agent has unreasonably delayed benefits to an employee, intentionally underpaid an employee, engaged in frivolous defenses, or has otherwise treated an employee unfairly.
The law also provides that, if the employee has made written demand for payment of benefits under Sections 8(a) or 8(b), the employer shall have 14 days after receipt of the demand to provide a written reason for the delay. If the demand is for medical benefits, the time for the employer to respond does not begin until the expiration of the 60-day period allotted the employer to pay medical bills under Section 8.2.
Over the last several years, arbitrators award penalties in roughly 10% of expedited decisions and 2% of regular decisions. Commissioners award penalties in roughly 5% of expedited decisions and 2% of regular decisions. This represents less than 1% of all cases closed. POST-AWARD PETITIONS
Cases that were closed by decisions or some settlements may return to the Commission for additional hearings. Under Section 8(a) of the Act, an injured worker may petition the Commission to order payment for additional medical treatment. Under Section 19(h), either party may petition if the injured worker's physical condition changes significantly within 30-60 months of the decision or settlement. Each year, roughly 300 post-award petitions are filed. REHABILITATION
Section 8(a) of the Act requires an employer to pay for treatment, instruction, and training necessary for the physical, mental, and vocational rehabilitation of an injured worker, including maintenance and incidental expenses. Section 6(d) requires an employer to notify an injured worker of the right to rehabilitation services and the location of public rehabilitation centers. Finally, Section 7110.10 of the Commission’s rules requires an employer, in consultation with the injured employee, to prepare an assessment of an employee’s rehabilitation needs, both medical and vocational, when it can be reasonably determined that, as a result of the injury, the injured worker will be unable to resume his or her regular duties, or when the employee is off work for more than 120 days, whichever comes first.
The injured worker has the burden of proving entitlement to vocational rehabilitation benefits. In resolving these disputes, the Commission looks to the guidelines established by the Illinois Supreme Court in National Tea Company v. Industrial Commission, 97 Ill.2d 424 (1983).
21
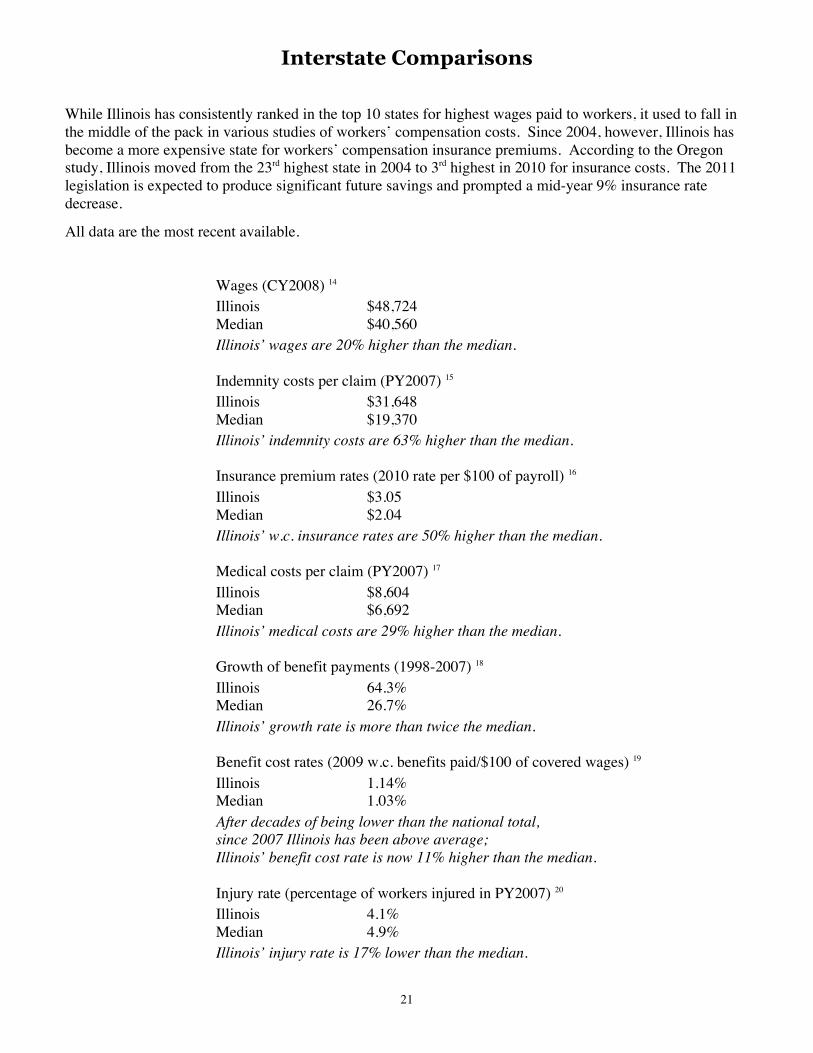
Interstate Comparisons While Illinois has consistently ranked in the top 10 states for highest wages paid to workers, it used to fall in the middle of the pack in various studies of workers’ compensation costs. Since 2004, however, Illinois has become a more expensive state for workers’ compensation insurance premiums. According to the Oregon study, Illinois moved from the 23rd highest state in 2004 to 3rd highest in 2010 for insurance costs. The 2011 legislation is expected to produce significant future savings and prompted a mid-year 9% insurance rate decrease.
All data are the most recent available. Wages (CY2008) 14
Illinois $48,724 Median $40,560
Illinois’ wages are 20% higher than the median. Indemnity costs per claim (PY2007) 15
Illinois $31,648 Median $19,370
Illinois’ indemnity costs are 63% higher than the median. Insurance premium rates (2010 rate per $100 of payroll) 16
Illinois $3.05 Median $2.04
Illinois’ w.c. insurance rates are 50% higher than the median. Medical costs per claim (PY2007) 17
Illinois $8,604 Median $6,692
Illinois’ medical costs are 29% higher than the median. Growth of benefit payments (1998-2007) 18
Illinois 64.3% Median 26.7%
Illinois’ growth rate is more than twice the median. Benefit cost rates (2009 w.c. benefits paid/$100 of covered wages) 19
Illinois 1.14% Median 1.03%
After decades of being lower than the national total, since 2007 Illinois has been above average; Illinois’ benefit cost rate is now 11% higher than the median. Injury rate (percentage of workers injured in PY2007) 20
Illinois 4.1% Median 4.9%
Illinois’ injury rate is 17% lower than the median.
.
22
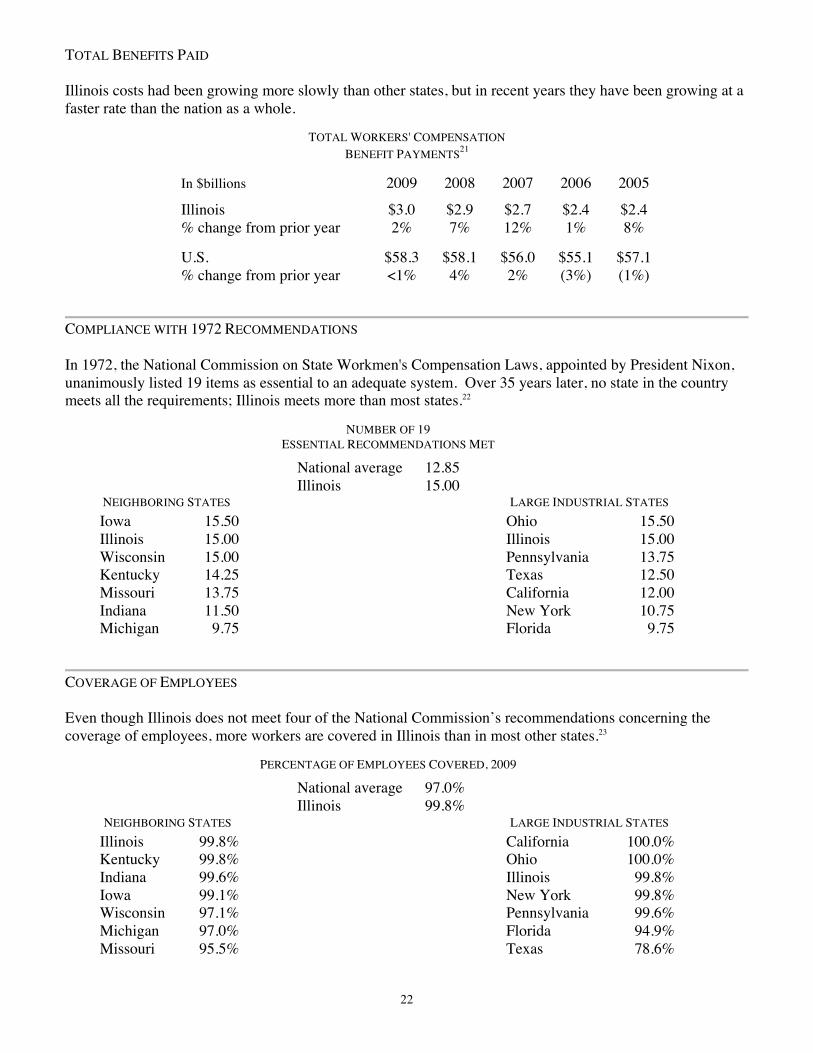
TOTAL BENEFITS PAID Illinois costs had been growing more slowly than other states, but in recent years they have been growing at a faster rate than the nation as a whole.
TOTAL WORKERS' COMPENSATION BENEFIT PAYMENTS21
In $billions 2009 2008 2007 2006 2005
Illinois $3.0 $2.9 $2.7 $2.4 $2.4 % change from prior year 2% 7% 12% 1% 8% U.S. $58.3 $58.1 $56.0 $55.1 $57.1 % change from prior year <1% 4% 2% (3%) (1%)
COMPLIANCE WITH 1972 RECOMMENDATIONS In 1972, the National Commission on State Workmen's Compensation Laws, appointed by President Nixon, unanimously listed 19 items as essential to an adequate system. Over 35 years later, no state in the country meets all the requirements; Illinois meets more than most states.22
NUMBER OF 19 ESSENTIAL RECOMMENDATIONS MET
National average 12.85
Illinois 15.00
NEIGHBORING STATES LARGE INDUSTRIAL STATES
Iowa 15.50 Ohio 15.50 Illinois 15.00 Illinois 15.00 Wisconsin 15.00 Pennsylvania 13.75 Kentucky 14.25 Texas 12.50 Missouri 13.75 California 12.00 Indiana 11.50 New York 10.75 Michigan 9.75 Florida 9.75
COVERAGE OF EMPLOYEES Even though Illinois does not meet four of the National Commission’s recommendations concerning the coverage of employees, more workers are covered in Illinois than in most other states.23
PERCENTAGE OF EMPLOYEES COVERED, 2009
National average 97.0%
Illinois 99.8% NEIGHBORING STATES LARGE INDUSTRIAL STATES
Illinois 99.8% California 100.0% Kentucky 99.8% Ohio 100.0% Indiana 99.6% Illinois 99.8% Iowa 99.1% New York 99.8% Wisconsin 97.1% Pennsylvania 99.6% Michigan 97.0% Florida 94.9% Missouri 95.5% Texas 78.6%
23
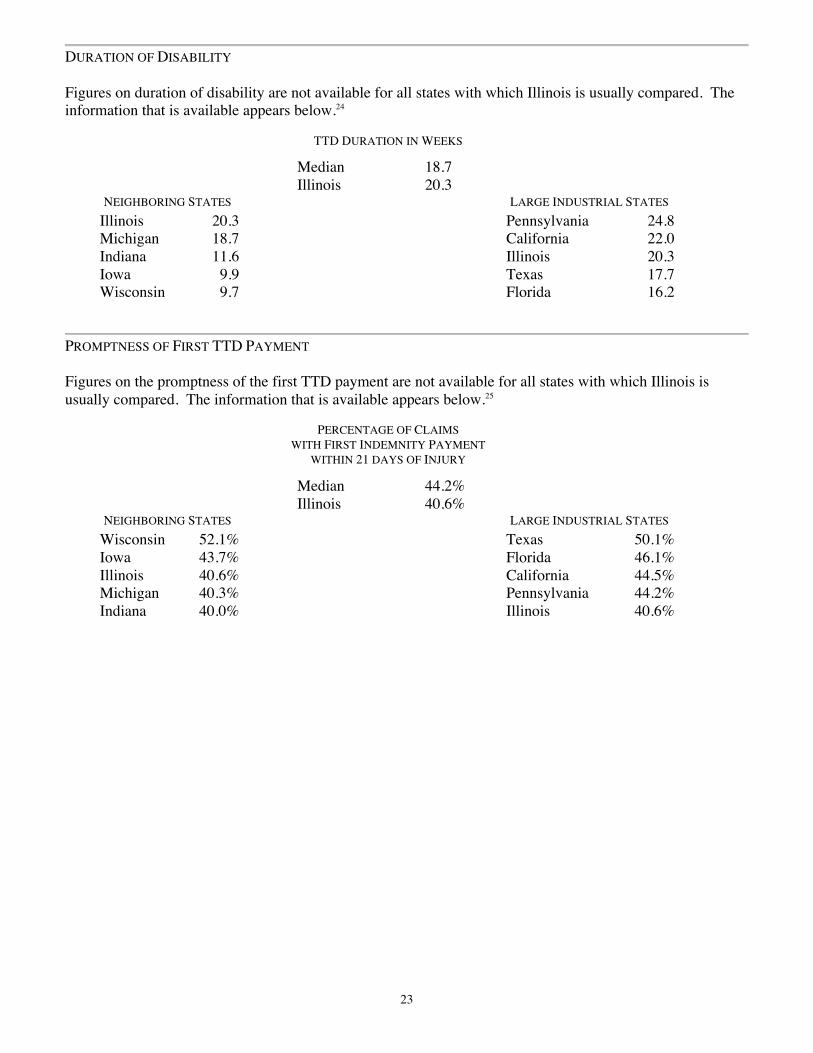
DURATION OF DISABILITY Figures on duration of disability are not available for all states with which Illinois is usually compared. The information that is available appears below.24
TTD DURATION IN WEEKS
Median 18.7 Illinois 20.3
NEIGHBORING STATES LARGE INDUSTRIAL STATES
Illinois 20.3 Pennsylvania 24.8
Michigan 18.7 California 22.0 Indiana 11.6 Illinois 20.3
Iowa 9.9 Texas 17.7 Wisconsin 9.7 Florida 16.2
PROMPTNESS OF FIRST TTD PAYMENT Figures on the promptness of the first TTD payment are not available for all states with which Illinois is usually compared. The information that is available appears below.25
PERCENTAGE OF CLAIMS WITH FIRST INDEMNITY PAYMENT
WITHIN 21 DAYS OF INJURY
Median 44.2%
Illinois 40.6%
NEIGHBORING STATES LARGE INDUSTRIAL STATES
Wisconsin 52.1% Texas 50.1% Iowa 43.7% Florida 46.1% Illinois 40.6% California 44.5% Michigan 40.3% Pennsylvania 44.2% Indiana 40.0% Illinois 40.6%
24
1 A.M. Best State/Line Database, “Best’s Market Share Reports—One Year Premiums and Loss, Workers’ Compensation, 2008.” For years, Illinois had more companies writing workers’ compensation insurance than any other state. A.M. Best now reports there are more insurers in Indiana than in Illinois.
2 National Council on Compensation Insurance rate filings with the Illinois Department of Insurance (217/524-8361). 3 National Council on Compensation Insurance, “Illinois State Advisory Forums ’09,” October 7, 2009, page 132. 4 National Academy of Social Insurance, Workers’ Compensation: Benefits, Coverage, and Costs, 2009, August 2011, Table 8, page 24. 5 Temporary workers, student workers, and people on leave are not included. We report the headcount at the end of the fiscal year, but we list the person in a position as of the time this report went to print.
6 U.S. Bureau of Labor Statistics, “Employment status of the civilian noninstitutional population by sex, race...2009 annual averages,” Illinois table, (http://www.bls.gov/lau , found under Tables & Maps Created by BLS/Annual Averages, ptable14full2009.pdf).
7 National Council on Compensation Insurance, Annual Statistical Bulletin, 1994 – 2011 editions, Exhibit XII, First Report data. The figures for fatalities and PTDs come from a small number of cases and should be viewed with caution. This information refers only to the experience of employers with insurance, not self-insurers. Information is not available for the states with exclusive state insurance funds: ND, OH, WA, WV, and WY. The NCCI updated figures from those published in earlier reports.
8 Illinois Department of Public Health, Survey of Nonfatal Workplace Injuries and Illnesses: Illinois, 2009, May 2011, Tables 3, 16. This is the most recent data available. Because of changes in methodology, data since 2002 are not comparable to prior years. Since 1998, IDPH has participated in the U.S. Bureau of Labor Statistics' federal/state Survey of Occupational Injuries and Illnesses. Each year, they survey a sample of employers in the private and nonfederal public sectors. Federal employees and farms with fewer than 11 employees are excluded from the survey. Reports are at http://www.idph.state.il.us/about/epi/cfoirpt.htm . For more information, contact the IDPH Division of Epidemiologic Studies at 217/785-1873.
9 Illinois Department of Public Health, Census of Fatal Occupational Injuries and Illnesses in Illinois, 2009, January 2011, Tables 3, 5. The IWCC provides information on fatal workers' compensation claims to IDPH, which has participated in the U.S. Bureau of Labor Statistics Census of Fatal Occupational Injuries since 1992. The CFOI methodology does not correspond exactly to workers' compensation criteria, but the program provides a standard measure of fatal occupational injuries for the country.
10 National Council on Compensation Insurance, Annual Statistical Bulletin, 1996-2011 editions, Exhibit XI, “First Report” data.
11 Policy years 2002-2003 through 2006-2007: Workers’ Compensation Research Institute, Monitoring the Impact of Illinois Regulatory Changes: CompScope Medical Benchmarks, 10th edition July 2010, Figure 31, page 83. Note the WCRI changed figures for prior years. Policy years 2007-2008 through 2008-2009: Monitoring the Impact of Illinois Regulatory Changes: CompScope Medical Benchmarks, 10th edition, July 2010, Figure 31, page 83.
12 Workers’ Compensation Research Institute, Monitoring the Impact of 2005 Reforms in Illinois: CompScope Medical Benchmarks, 9th edition, pages 3, 14.
13 Workers’ Compensation Research Institute, Monitoring the Impact of Illinois Regulatory Changes: CompScope Medical Benchmarks, 10th edition, July 2010, Table 35, page 88. Note that WCRI revised figures from prior years.
14 US Bureau of Labor Statistics, “Total coverage (UI and UCFE) by State, 2006 annual averages,” BLS website (ew06table5.pdf) (http://www.bls.gov/cew/cewbultn06.htm ).
15 National Council on Compensation Insurance, Annual Statistical Bulletin, Exhibit XI, Policy Year 2007, First Report. Most recent data available.
25
16 Oregon Department of Consumer and Business Services, “2010 Oregon Workers’ Compensation Premium Rate Ranking Summary,” October 2010, Table 2. Available at http://www4.cbs.state.or.us/ex/imd/external/reports/index.cfm?fuseaction=dir&ItemID=1998 . This report is produced every two years. Indices are based on rates in Policy Years 2009 or 2010; Illinois’ rates are as of 1/1/10. This report compares employers’ w.c. insurance costs in 50 different class codes.
A review of the results over the years is instructive. The estimated premiums are per $100 of payroll.
Workers’ Compensation Premium Rate Rankings
Report year 1994 1996 1998 2000 2002 2004 2006 2008 2010 IL est. premium $5.48 $3.77 $2.96 $2.74 $2.65 $2.65 $2.69 $2.79 $3.05 Median est. premium $4.35 $3.54 $2.69 $2.26 $2.42 $2.58 $2.48 $2.26 $2.04 IL as % over median 26% 7% 10% 21% 10% 3% 8% 23% 49% IL rank (50 states + DC) 9 19 18 15 20 23 20 11 3 1= most expensive
17 National Council on Compensation Insurance, Annual Statistical Bulletin, 2009-10 editions, Exhibit XI, Policy Year 2007, First Report. Most recent data available.
18 National Foundation for Unemployment Compensation and Workers' Compensation, "Fiscal Data for State Workers' Compensation Systems, 1998-2007," September 2009, Table 17.
19 National Academy of Social Insurance, Workers’ Compensation: Benefits, Coverage, and Costs, 2009, August 2011, Table 10, page 28.
20 National Council on Compensation Insurance, Annual Statistical Bulletin, Exhibit XII, Policy Year 2007, First Report data.
21 National Academy of Social Insurance, Workers’ Compensation: Benefits, Coverage, & Costs, 2005-2009, Table 7.
22 John F. Burton, Jr. (former chair of the National Commission), "State Workers’ Compensation Laws in Effect January 1, 2004 Compared with the 19 Essential Recommendations of the National Commission on State Workmen’s Compensation Laws,” www.workerscompresources.com , Table 1.
In 1972, the National Commission issued 84 recommendations concerning the coverage of employees and diseases, income protection, medical care, worker safety, and program administration, and identified 19 as essential to ensuring a minimum level of protection. As of January 1, 2004, compliance levels range from 7.25 in Mississippi to 17.00 in Nebraska. Illinois does not comply with recommendations 2.4 (Illinois exempts farm workers below a certain number of hours), 2.5 (Illinois exempts household workers and casual workers below a certain number of days), 2.6 (Illinois exempts some governmental employees (Chicago police and fire fighters)) and 2.7 (Illinois exempts certain classes of employees, such as those already noted). This is the most recent information available.
23 National Academy of Social Insurance, Workers’ Compensation: Benefits, Coverage and Costs, 2009, August 2011, Table A1. This is the most recent year for which figures are available. If two states received the same figure, they are listed in alphabetical order.
24 Workers’ Compensation Research Institute, Monitoring the Impact of the 2005 Reforms in Illinois: CompScope Benchmarks, 10th edition, December 2009, Figure 8.
25 Workers’ Compensation Research Institute, December 2009, Figure 14.