Embed Size (px)
Citation preview
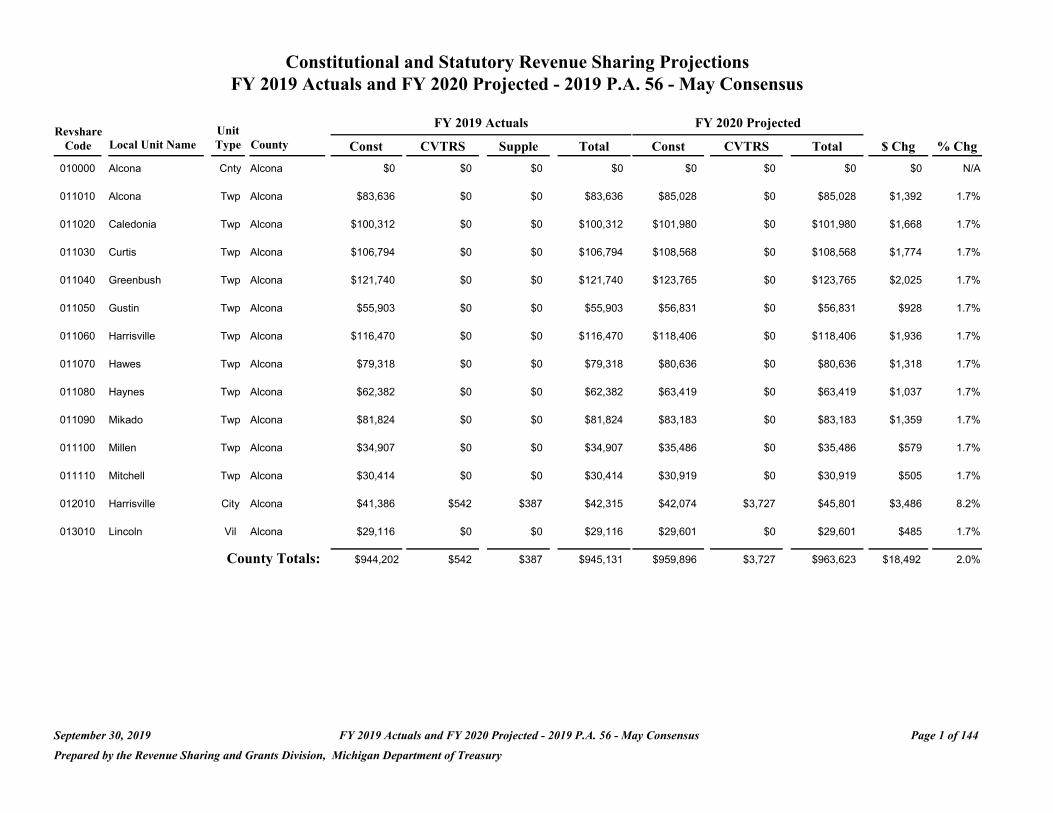
Constitutional and Statutory Revenue Sharing Projections FY 2019 Actuals and FY 2020 Projected - 2019 P.A. 56 - May Consensus
Revshare Unit FY 2019 Actuals FY 2020 Projected
Code Local Unit Name Type County Const CVTRS Supple Total Const CVTRS Total $ Chg % Chg
010000 Alcona Cnty Alcona $0 $0 $0 $0 $0 $0 $0 $0 N/A
011010 Alcona Twp Alcona $83,636 $0 $0 $83,636 $85,028 $0 $85,028 $1,392 1.7%
011020 Caledonia Twp Alcona $100,312 $0 $0 $100,312 $101,980 $0 $101,980 $1,668 1.7%
011030 Curtis Twp Alcona $106,794 $0 $0 $106,794 $108,568 $0 $108,568 $1,774 1.7%
011040 Greenbush Twp Alcona $121,740 $0 $0 $121,740 $123,765 $0 $123,765 $2,025 1.7%
011050 Gustin Twp Alcona $55,903 $0 $0 $55,903 $56,831 $0 $56,831 $928 1.7%
011060 Harrisville Twp Alcona $116,470 $0 $0 $116,470 $118,406 $0 $118,406 $1,936 1.7%
011070 Hawes Twp Alcona $79,318 $0 $0 $79,318 $80,636 $0 $80,636 $1,318 1.7%
011080 Haynes Twp Alcona $62,382 $0 $0 $62,382 $63,419 $0 $63,419 $1,037 1.7%
011090 Mikado Twp Alcona $81,824 $0 $0 $81,824 $83,183 $0 $83,183 $1,359 1.7%
011100 Millen Twp Alcona $34,907 $0 $0 $34,907 $35,486 $0 $35,486 $579 1.7%
011110 Mitchell Twp Alcona $30,414 $0 $0 $30,414 $30,919 $0 $30,919 $505 1.7%
012010 Harrisville City Alcona $41,386 $542 $387 $42,315 $42,074 $3,727 $45,801 $3,486 8.2%
013010 Lincoln Vil Alcona $29,116 $0 $0 $29,116 $29,601 $0 $29,601 $485 1.7%
County Totals: $944,202 $542 $387 $945,131 $959,896 $3,727 $963,623 $18,492 2.0%
September 30, 2019 FY 2019 Actuals and FY 2020 Projected - 2019 P.A. 56 - May Consensus Page 1 of 144
Prepared by the Revenue Sharing and Grants Division, Michigan Department of Treasury
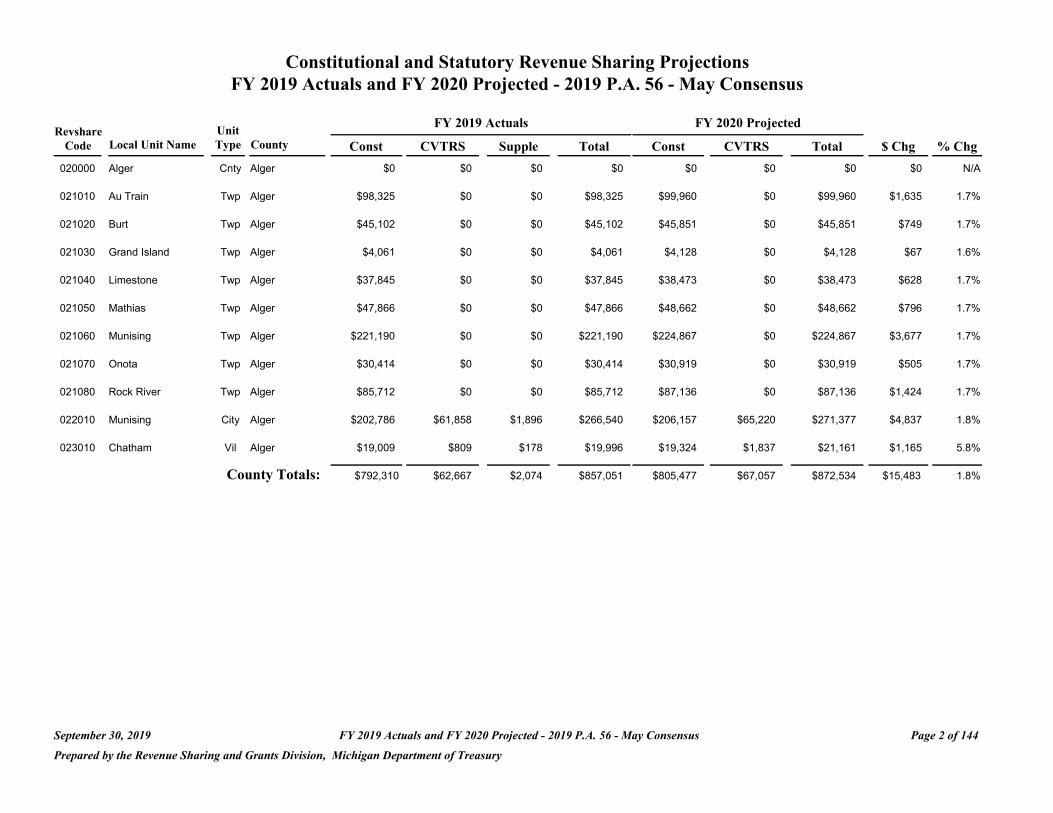
Constitutional and Statutory Revenue Sharing Projections FY 2019 Actuals and FY 2020 Projected - 2019 P.A. 56 - May Consensus
Revshare Unit FY 2019 Actuals FY 2020 Projected
Code Local Unit Name Type County Const CVTRS Supple Total Const CVTRS Total $ Chg % Chg
020000 Alger Cnty Alger $0 $0 $0 $0 $0 $0 $0 $0 N/A
021010 Au Train Twp Alger $98,325 $0 $0 $98,325 $99,960 $0 $99,960 $1,635 1.7%
021020 Burt Twp Alger $45,102 $0 $0 $45,102 $45,851 $0 $45,851 $749 1.7%
021030 Grand Island Twp Alger $4,061 $0 $0 $4,061 $4,128 $0 $4,128 $67 1.6%
021040 Limestone Twp Alger $37,845 $0 $0 $37,845 $38,473 $0 $38,473 $628 1.7%
021050 Mathias Twp Alger $47,866 $0 $0 $47,866 $48,662 $0 $48,662 $796 1.7%
021060 Munising Twp Alger $221,190 $0 $0 $221,190 $224,867 $0 $224,867 $3,677 1.7%
021070 Onota Twp Alger $30,414 $0 $0 $30,414 $30,919 $0 $30,919 $505 1.7%
021080 Rock River Twp Alger $85,712 $0 $0 $85,712 $87,136 $0 $87,136 $1,424 1.7%
022010 Munising City Alger $202,786 $61,858 $1,896 $266,540 $206,157 $65,220 $271,377 $4,837 1.8%
023010 Chatham Vil Alger $19,009 $809 $178 $19,996 $19,324 $1,837 $21,161 $1,165 5.8%
County Totals: $792,310 $62,667 $2,074 $857,051 $805,477 $67,057 $872,534 $15,483 1.8%
September 30, 2019 FY 2019 Actuals and FY 2020 Projected - 2019 P.A. 56 - May Consensus Page 2 of 144
Prepared by the Revenue Sharing and Grants Division, Michigan Department of Treasury
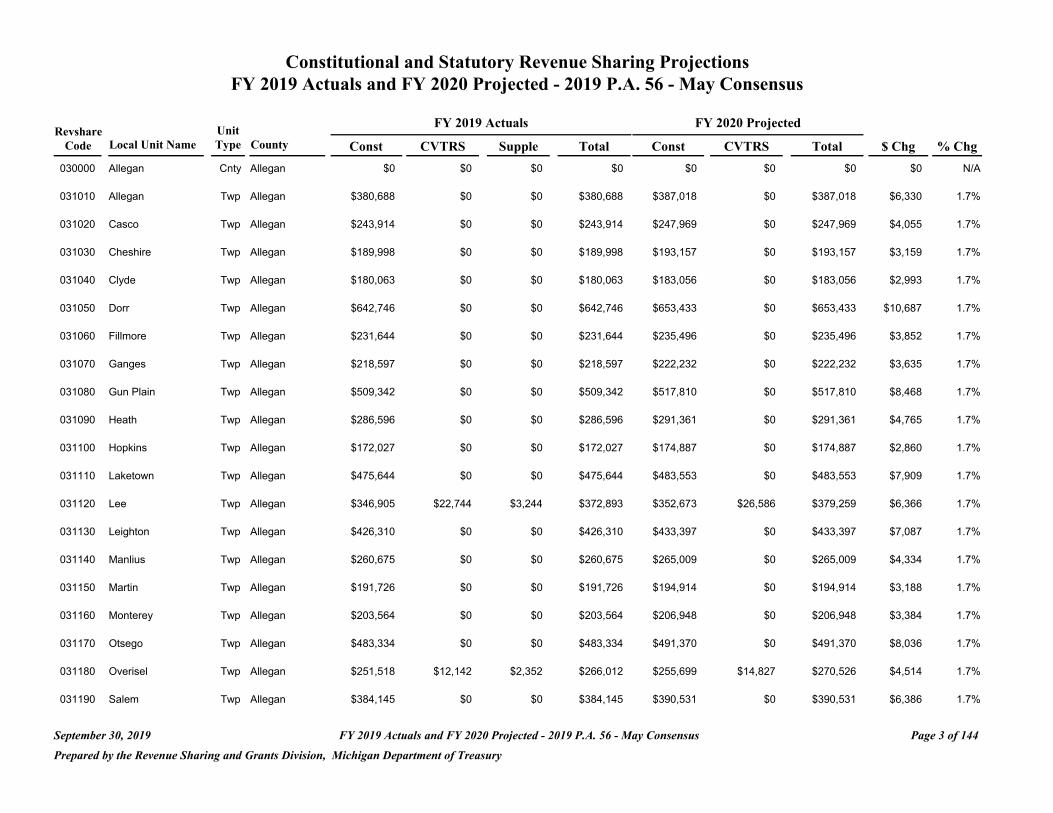
Constitutional and Statutory Revenue Sharing Projections FY 2019 Actuals and FY 2020 Projected - 2019 P.A. 56 - May Consensus
FY 2019 Actuals FY 2020 Projected Revshare Unit
Code Local Unit Name Type County Const CVTRS Supple Total Const CVTRS Total $ Chg % Chg
030000 Allegan Cnty Allegan $0 $0 $0 $0 $0 $0 $0 $0 N/A
031010 Allegan Twp Allegan $380,688 $0 $0 $380,688 $387,018 $0 $387,018 $6,330 1.7%
031020 Casco Twp Allegan $243,914 $0 $0 $243,914 $247,969 $0 $247,969 $4,055 1.7%
031030 Cheshire Twp Allegan $189,998 $0 $0 $189,998 $193,157 $0 $193,157 $3,159 1.7%
031040 Clyde Twp Allegan $180,063 $0 $0 $180,063 $183,056 $0 $183,056 $2,993 1.7%
031050 Dorr Twp Allegan $642,746 $0 $0 $642,746 $653,433 $0 $653,433 $10,687 1.7%
031060 Fillmore Twp Allegan $231,644 $0 $0 $231,644 $235,496 $0 $235,496 $3,852 1.7%
031070 Ganges Twp Allegan $218,597 $0 $0 $218,597 $222,232 $0 $222,232 $3,635 1.7%
031080 Gun Plain Twp Allegan $509,342 $0 $0 $509,342 $517,810 $0 $517,810 $8,468 1.7%
031090 Heath Twp Allegan $286,596 $0 $0 $286,596 $291,361 $0 $291,361 $4,765 1.7%
031100 Hopkins Twp Allegan $172,027 $0 $0 $172,027 $174,887 $0 $174,887 $2,860 1.7%
031110 Laketown Twp Allegan $475,644 $0 $0 $475,644 $483,553 $0 $483,553 $7,909 1.7%
031120 Lee Twp Allegan $346,905 $22,744 $3,244 $372,893 $352,673 $26,586 $379,259 $6,366 1.7%
031130 Leighton Twp Allegan $426,310 $0 $0 $426,310 $433,397 $0 $433,397 $7,087 1.7%
031140 Manlius Twp Allegan $260,675 $0 $0 $260,675 $265,009 $0 $265,009 $4,334 1.7%
031150 Martin Twp Allegan $191,726 $0 $0 $191,726 $194,914 $0 $194,914 $3,188 1.7%
031160 Monterey Twp Allegan $203,564 $0 $0 $203,564 $206,948 $0 $206,948 $3,384 1.7%
031170 Otsego Twp Allegan $483,334 $0 $0 $483,334 $491,370 $0 $491,370 $8,036 1.7%
031180 Overisel Twp Allegan $251,518 $12,142 $2,352 $266,012 $255,699 $14,827 $270,526 $4,514 1.7%
031190 Salem Twp Allegan $384,145 $0 $0 $384,145 $390,531 $0 $390,531 $6,386 1.7%
September 30, 2019 FY 2019 Actuals and FY 2020 Projected - 2019 P.A. 56 - May Consensus Page 3 of 144
Prepared by the Revenue Sharing and Grants Division, Michigan Department of Treasury
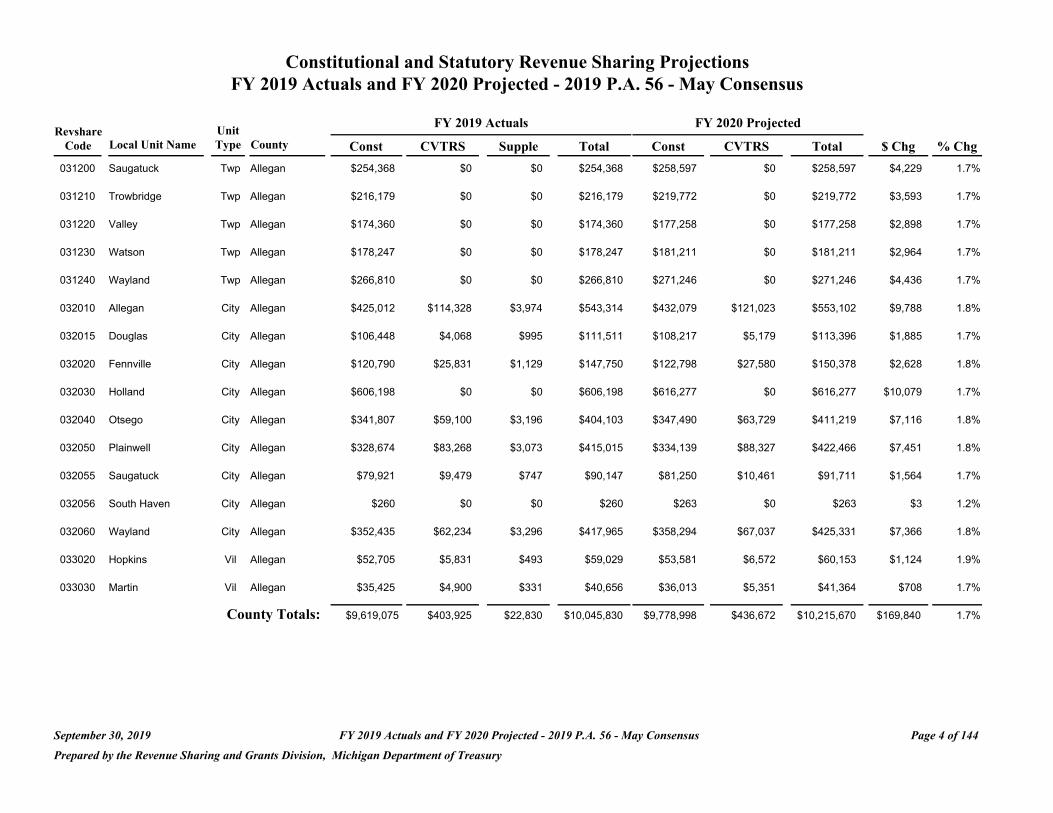
Constitutional and Statutory Revenue Sharing Projections FY 2019 Actuals and FY 2020 Projected - 2019 P.A. 56 - May Consensus
Revshare Unit FY 2019 Actuals FY 2020 Projected
Code Local Unit Name Type County Const CVTRS Supple Total Const CVTRS Total $ Chg % Chg
031200 Saugatuck Twp Allegan $254,368 $0 $0 $254,368 $258,597 $0 $258,597 $4,229 1.7%
031210 Trowbridge Twp Allegan $216,179 $0 $0 $216,179 $219,772 $0 $219,772 $3,593 1.7%
031220 Valley Twp Allegan $174,360 $0 $0 $174,360 $177,258 $0 $177,258 $2,898 1.7%
031230 Watson Twp Allegan $178,247 $0 $0 $178,247 $181,211 $0 $181,211 $2,964 1.7%
031240 Wayland Twp Allegan $266,810 $0 $0 $266,810 $271,246 $0 $271,246 $4,436 1.7%
032010 Allegan City Allegan $425,012 $114,328 $3,974 $543,314 $432,079 $121,023 $553,102 $9,788 1.8%
032015 Douglas City Allegan $106,448 $4,068 $995 $111,511 $108,217 $5,179 $113,396 $1,885 1.7%
032020 Fennville City Allegan $120,790 $25,831 $1,129 $147,750 $122,798 $27,580 $150,378 $2,628 1.8%
032030 Holland City Allegan $606,198 $0 $0 $606,198 $616,277 $0 $616,277 $10,079 1.7%
032040 Otsego City Allegan $341,807 $59,100 $3,196 $404,103 $347,490 $63,729 $411,219 $7,116 1.8%
032050 Plainwell City Allegan $328,674 $83,268 $3,073 $415,015 $334,139 $88,327 $422,466 $7,451 1.8%
032055 Saugatuck City Allegan $79,921 $9,479 $747 $90,147 $81,250 $10,461 $91,711 $1,564 1.7%
032056 South Haven City Allegan $260 $0 $0 $260 $263 $0 $263 $3 1.2%
032060 Wayland City Allegan $352,435 $62,234 $3,296 $417,965 $358,294 $67,037 $425,331 $7,366 1.8%
033020 Hopkins Vil Allegan $52,705 $5,831 $493 $59,029 $53,581 $6,572 $60,153 $1,124 1.9%
033030 Martin Vil Allegan $35,425 $4,900 $331 $40,656 $36,013 $5,351 $41,364 $708 1.7%
County Totals: $9,619,075 $403,925 $22,830 $10,045,830 $9,778,998 $436,672 $10,215,670 $169,840 1.7%
September 30, 2019 FY 2019 Actuals and FY 2020 Projected - 2019 P.A. 56 - May Consensus Page 4 of 144
Prepared by the Revenue Sharing and Grants Division, Michigan Department of Treasury
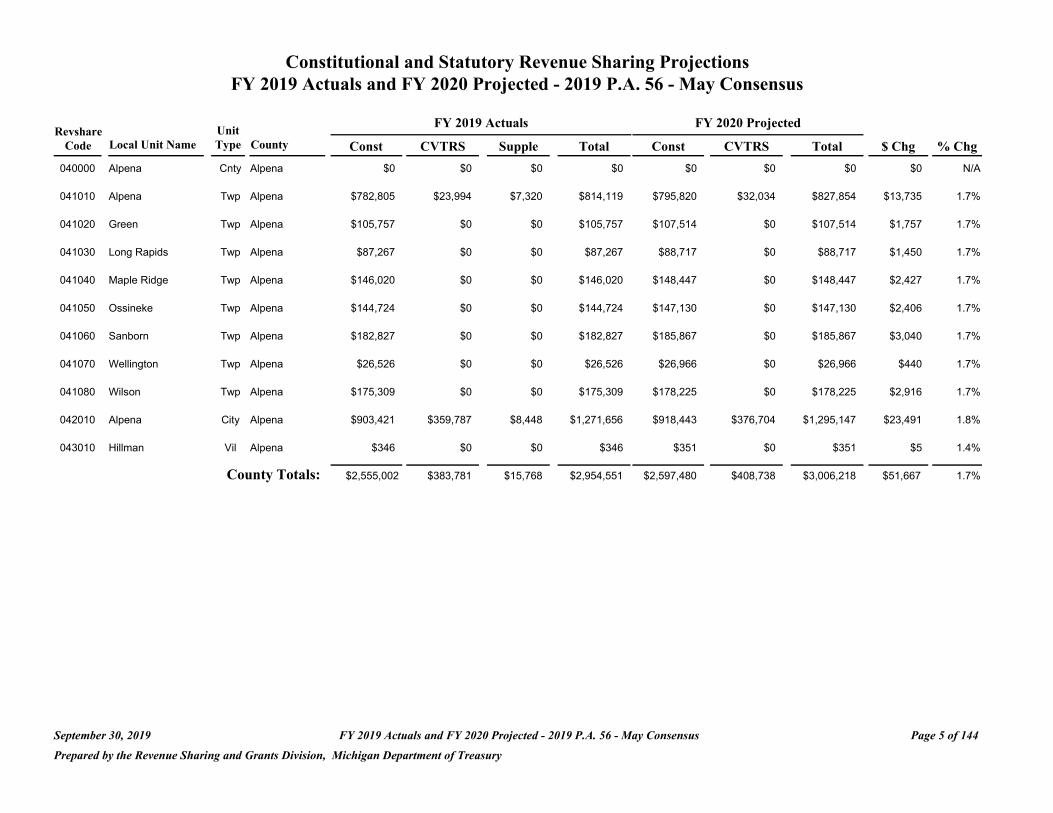
Constitutional and Statutory Revenue Sharing Projections FY 2019 Actuals and FY 2020 Projected - 2019 P.A. 56 - May Consensus
Revshare Unit FY 2019 Actuals FY 2020 Projected
Code Local Unit Name Type County Const CVTRS Supple Total Const CVTRS Total $ Chg % Chg
040000 Alpena Cnty Alpena $0 $0 $0 $0 $0 $0 $0 $0 N/A
041010 Alpena Twp Alpena $782,805 $23,994 $7,320 $814,119 $795,820 $32,034 $827,854 $13,735 1.7%
041020 Green Twp Alpena $105,757 $0 $0 $105,757 $107,514 $0 $107,514 $1,757 1.7%
041030 Long Rapids Twp Alpena $87,267 $0 $0 $87,267 $88,717 $0 $88,717 $1,450 1.7%
041040 Maple Ridge Twp Alpena $146,020 $0 $0 $146,020 $148,447 $0 $148,447 $2,427 1.7%
041050 Ossineke Twp Alpena $144,724 $0 $0 $144,724 $147,130 $0 $147,130 $2,406 1.7%
041060 Sanborn Twp Alpena $182,827 $0 $0 $182,827 $185,867 $0 $185,867 $3,040 1.7%
041070 Wellington Twp Alpena $26,526 $0 $0 $26,526 $26,966 $0 $26,966 $440 1.7%
041080 Wilson Twp Alpena $175,309 $0 $0 $175,309 $178,225 $0 $178,225 $2,916 1.7%
042010 Alpena City Alpena $903,421 $359,787 $8,448 $1,271,656 $918,443 $376,704 $1,295,147 $23,491 1.8%
043010 Hillman Vil Alpena $346 $0 $0 $346 $351 $0 $351 $5 1.4%
County Totals: $2,555,002 $383,781 $15,768 $2,954,551 $2,597,480 $408,738 $3,006,218 $51,667 1.7%
September 30, 2019 FY 2019 Actuals and FY 2020 Projected - 2019 P.A. 56 - May Consensus Page 5 of 144
Prepared by the Revenue Sharing and Grants Division, Michigan Department of Treasury
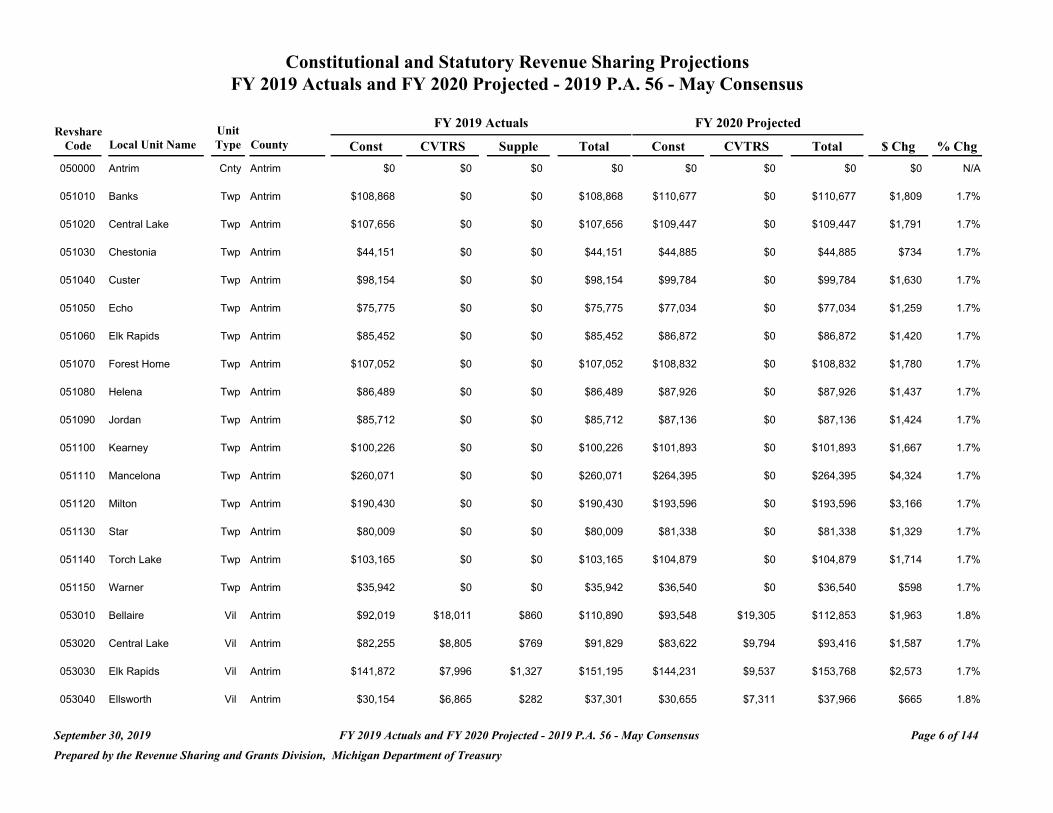
Constitutional and Statutory Revenue Sharing Projections FY 2019 Actuals and FY 2020 Projected - 2019 P.A. 56 - May Consensus
FY 2019 Actuals FY 2020 Projected Revshare Unit
Code Local Unit Name Type County Const CVTRS Supple Total Const CVTRS Total $ Chg % Chg
050000 Antrim Cnty Antrim $0 $0 $0 $0 $0 $0 $0 $0 N/A
051010 Banks Twp Antrim $108,868 $0 $0 $108,868 $110,677 $0 $110,677 $1,809 1.7%
051020 Central Lake Twp Antrim $107,656 $0 $0 $107,656 $109,447 $0 $109,447 $1,791 1.7%
051030 Chestonia Twp Antrim $44,151 $0 $0 $44,151 $44,885 $0 $44,885 $734 1.7%
051040 Custer Twp Antrim $98,154 $0 $0 $98,154 $99,784 $0 $99,784 $1,630 1.7%
051050 Echo Twp Antrim $75,775 $0 $0 $75,775 $77,034 $0 $77,034 $1,259 1.7%
051060 Elk Rapids Twp Antrim $85,452 $0 $0 $85,452 $86,872 $0 $86,872 $1,420 1.7%
051070 Forest Home Twp Antrim $107,052 $0 $0 $107,052 $108,832 $0 $108,832 $1,780 1.7%
051080 Helena Twp Antrim $86,489 $0 $0 $86,489 $87,926 $0 $87,926 $1,437 1.7%
051090 Jordan Twp Antrim $85,712 $0 $0 $85,712 $87,136 $0 $87,136 $1,424 1.7%
051100 Kearney Twp Antrim $100,226 $0 $0 $100,226 $101,893 $0 $101,893 $1,667 1.7%
051110 Mancelona Twp Antrim $260,071 $0 $0 $260,071 $264,395 $0 $264,395 $4,324 1.7%
051120 Milton Twp Antrim $190,430 $0 $0 $190,430 $193,596 $0 $193,596 $3,166 1.7%
051130 Star Twp Antrim $80,009 $0 $0 $80,009 $81,338 $0 $81,338 $1,329 1.7%
051140 Torch Lake Twp Antrim $103,165 $0 $0 $103,165 $104,879 $0 $104,879 $1,714 1.7%
051150 Warner Twp Antrim $35,942 $0 $0 $35,942 $36,540 $0 $36,540 $598 1.7%
053010 Bellaire Vil Antrim $92,019 $18,011 $860 $110,890 $93,548 $19,305 $112,853 $1,963 1.8%
053020 Central Lake Vil Antrim $82,255 $8,805 $769 $91,829 $83,622 $9,794 $93,416 $1,587 1.7%
053030 Elk Rapids Vil Antrim $141,872 $7,996 $1,327 $151,195 $144,231 $9,537 $153,768 $2,573 1.7%
053040 Ellsworth Vil Antrim $30,154 $6,865 $282 $37,301 $30,655 $7,311 $37,966 $665 1.8%
September 30, 2019 FY 2019 Actuals and FY 2020 Projected - 2019 P.A. 56 - May Consensus Page 6 of 144
Prepared by the Revenue Sharing and Grants Division, Michigan Department of Treasury
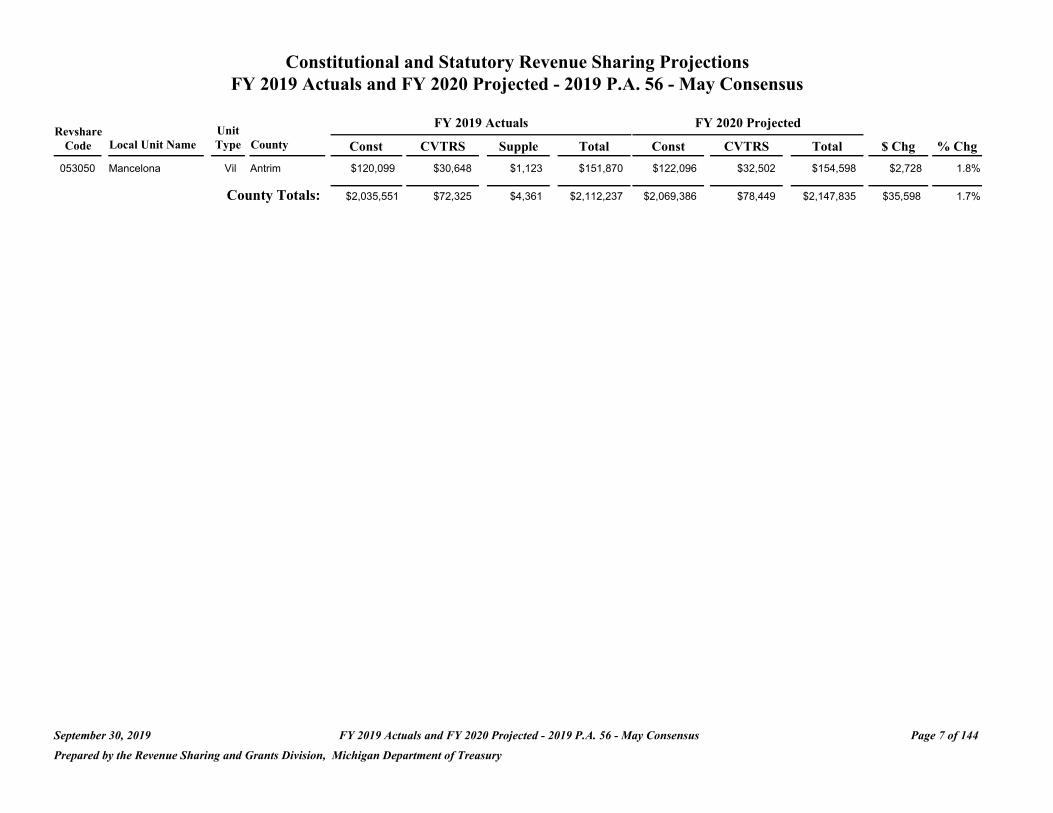
Constitutional and Statutory Revenue Sharing Projections FY 2019 Actuals and FY 2020 Projected - 2019 P.A. 56 - May Consensus
FY 2019 Actuals FY 2020 Projected Revshare Unit
Code Local Unit Name Type County Const CVTRS Supple Total Const CVTRS Total $ Chg % Chg
053050 Mancelona Vil Antrim $120,099 $30,648 $1,123 $151,870 $122,096 $32,502 $154,598 $2,728 1.8%
County Totals: $2,035,551 $72,325 $4,361 $2,112,237 $2,069,386 $78,449 $2,147,835 $35,598 1.7%
September 30, 2019 FY 2019 Actuals and FY 2020 Projected - 2019 P.A. 56 - May Consensus Page 7 of 144
Prepared by the Revenue Sharing and Grants Division, Michigan Department of Treasury
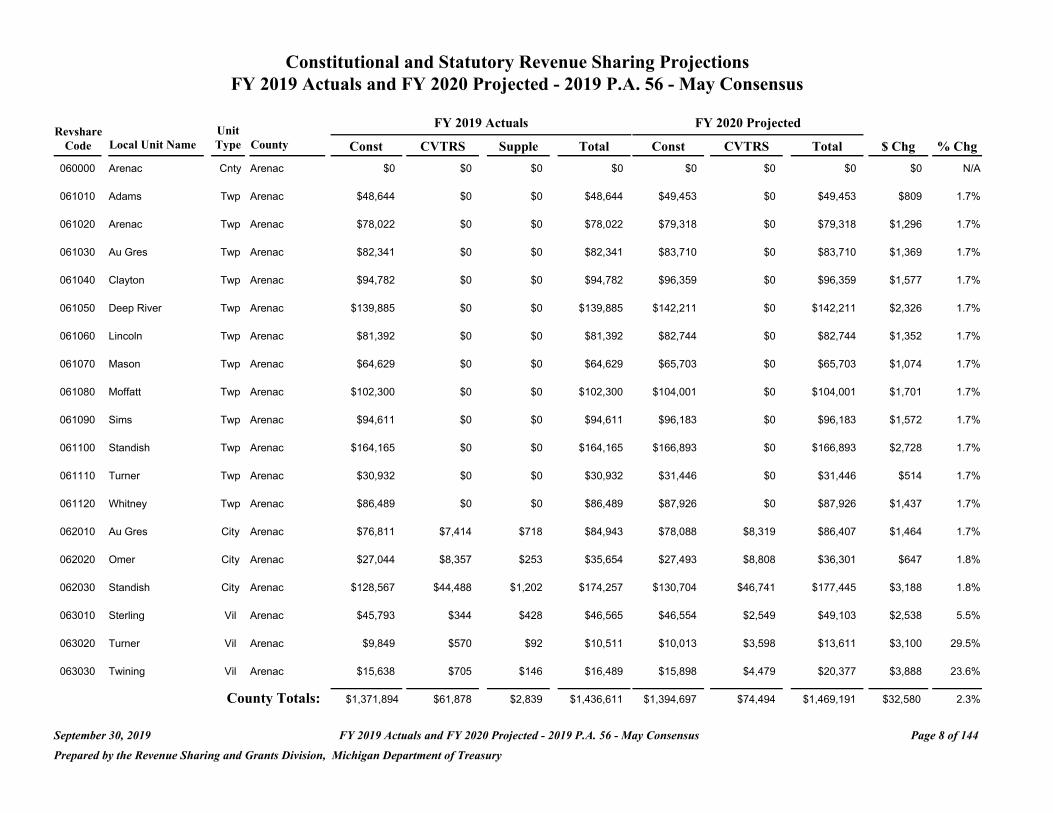
Constitutional and Statutory Revenue Sharing Projections FY 2019 Actuals and FY 2020 Projected - 2019 P.A. 56 - May Consensus
FY 2019 Actuals FY 2020 Projected Revshare Unit
Code Local Unit Name Type County Const CVTRS Supple Total Const CVTRS Total $ Chg % Chg
060000 Arenac Cnty Arenac $0 $0 $0 $0 $0 $0 $0 $0 N/A
061010 Adams Twp Arenac $48,644 $0 $0 $48,644 $49,453 $0 $49,453 $809 1.7%
061020 Arenac Twp Arenac $78,022 $0 $0 $78,022 $79,318 $0 $79,318 $1,296 1.7%
061030 Au Gres Twp Arenac $82,341 $0 $0 $82,341 $83,710 $0 $83,710 $1,369 1.7%
061040 Clayton Twp Arenac $94,782 $0 $0 $94,782 $96,359 $0 $96,359 $1,577 1.7%
061050 Deep River Twp Arenac $139,885 $0 $0 $139,885 $142,211 $0 $142,211 $2,326 1.7%
061060 Lincoln Twp Arenac $81,392 $0 $0 $81,392 $82,744 $0 $82,744 $1,352 1.7%
061070 Mason Twp Arenac $64,629 $0 $0 $64,629 $65,703 $0 $65,703 $1,074 1.7%
061080 Moffatt Twp Arenac $102,300 $0 $0 $102,300 $104,001 $0 $104,001 $1,701 1.7%
061090 Sims Twp Arenac $94,611 $0 $0 $94,611 $96,183 $0 $96,183 $1,572 1.7%
061100 Standish Twp Arenac $164,165 $0 $0 $164,165 $166,893 $0 $166,893 $2,728 1.7%
061110 Turner Twp Arenac $30,932 $0 $0 $30,932 $31,446 $0 $31,446 $514 1.7%
061120 Whitney Twp Arenac $86,489 $0 $0 $86,489 $87,926 $0 $87,926 $1,437 1.7%
062010 Au Gres City Arenac $76,811 $7,414 $718 $84,943 $78,088 $8,319 $86,407 $1,464 1.7%
062020 Omer City Arenac $27,044 $8,357 $253 $35,654 $27,493 $8,808 $36,301 $647 1.8%
062030 Standish City Arenac $128,567 $44,488 $1,202 $174,257 $130,704 $46,741 $177,445 $3,188 1.8%
063010 Sterling Vil Arenac $45,793 $344 $428 $46,565 $46,554 $2,549 $49,103 $2,538 5.5%
063020 Turner Vil Arenac $9,849 $570 $92 $10,511 $10,013 $3,598 $13,611 $3,100 29.5%
063030 Twining Vil Arenac $15,638 $705 $146 $16,489 $15,898 $4,479 $20,377 $3,888 23.6%
County Totals: $1,371,894 $61,878 $2,839 $1,436,611 $1,394,697 $74,494 $1,469,191 $32,580 2.3%
September 30, 2019 FY 2019 Actuals and FY 2020 Projected - 2019 P.A. 56 - May Consensus Page 8 of 144
Prepared by the Revenue Sharing and Grants Division, Michigan Department of Treasury
Constitutional and Statutory Revenue Sharing Projections FY 2019 Actuals and FY 2020 Projected - 2019 P.A. 56 - May Consensus
Revshare Unit FY 2019 Actuals FY 2020 Projected
Code Local Unit Name Type County Const CVTRS Supple Total Const CVTRS Total $ Chg % Chg
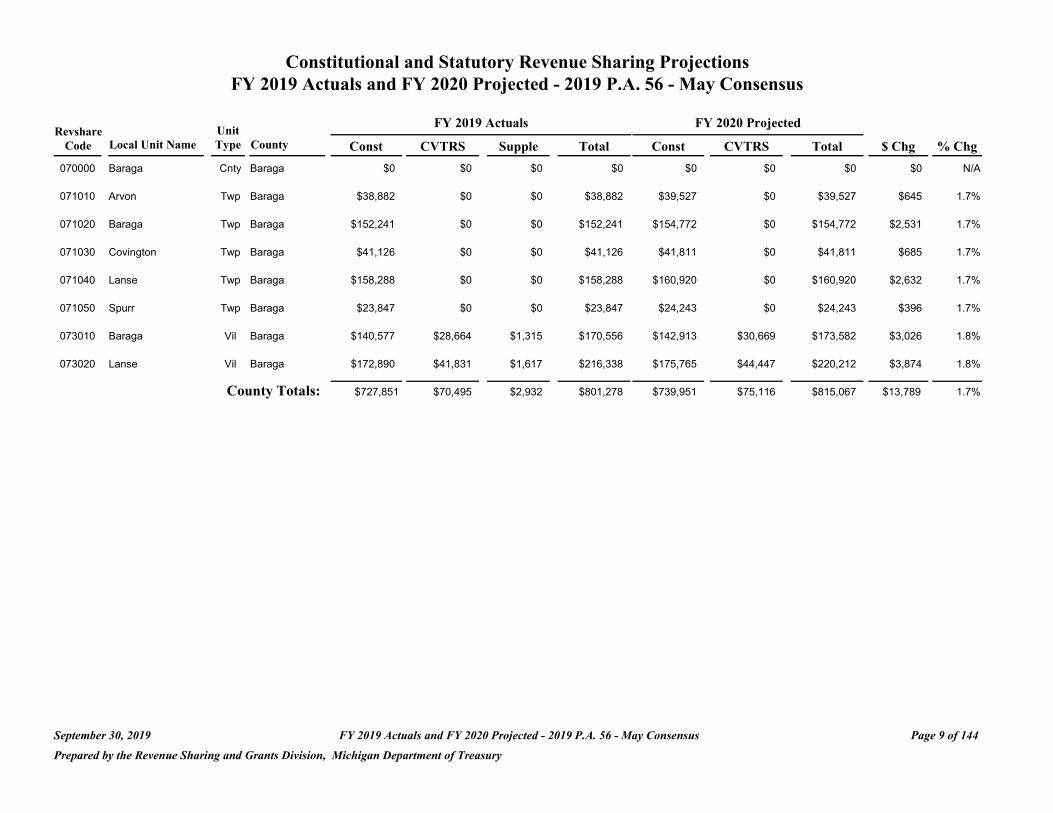
070000 Baraga Cnty Baraga $0 $0 $0 $0 $0 $0 $0 $0 N/A
071010 Arvon Twp Baraga $38,882 $0 $0 $38,882 $39,527 $0 $39,527 $645 1.7%
071020 Baraga Twp Baraga $152,241 $0 $0 $152,241 $154,772 $0 $154,772 $2,531 1.7%
071030 Covington Twp Baraga $41,126 $0 $0 $41,126 $41,811 $0 $41,811 $685 1.7%
071040 Lanse Twp Baraga $158,288 $0 $0 $158,288 $160,920 $0 $160,920 $2,632 1.7%
071050 Spurr Twp Baraga $23,847 $0 $0 $23,847 $24,243 $0 $24,243 $396 1.7%
073010 Baraga Vil Baraga $140,577 $28,664 $1,315 $170,556 $142,913 $30,669 $173,582 $3,026 1.8%
073020 Lanse Vil Baraga $172,890 $41,831 $1,617 $216,338 $175,765 $44,447 $220,212 $3,874 1.8%
County Totals: $727,851 $70,495 $2,932 $801,278 $739,951 $75,116 $815,067 $13,789 1.7%
September 30, 2019 FY 2019 Actuals and FY 2020 Projected - 2019 P.A. 56 - May Consensus Page 9 of 144
Prepared by the Revenue Sharing and Grants Division, Michigan Department of Treasury
Constitutional and Statutory Revenue Sharing Projections FY 2019 Actuals and FY 2020 Projected - 2019 P.A. 56 - May Consensus
FY 2019 Actuals FY 2020 Projected Revshare Unit
Code Local Unit Name Type County Const CVTRS Supple Total Const CVTRS Total $ Chg % Chg
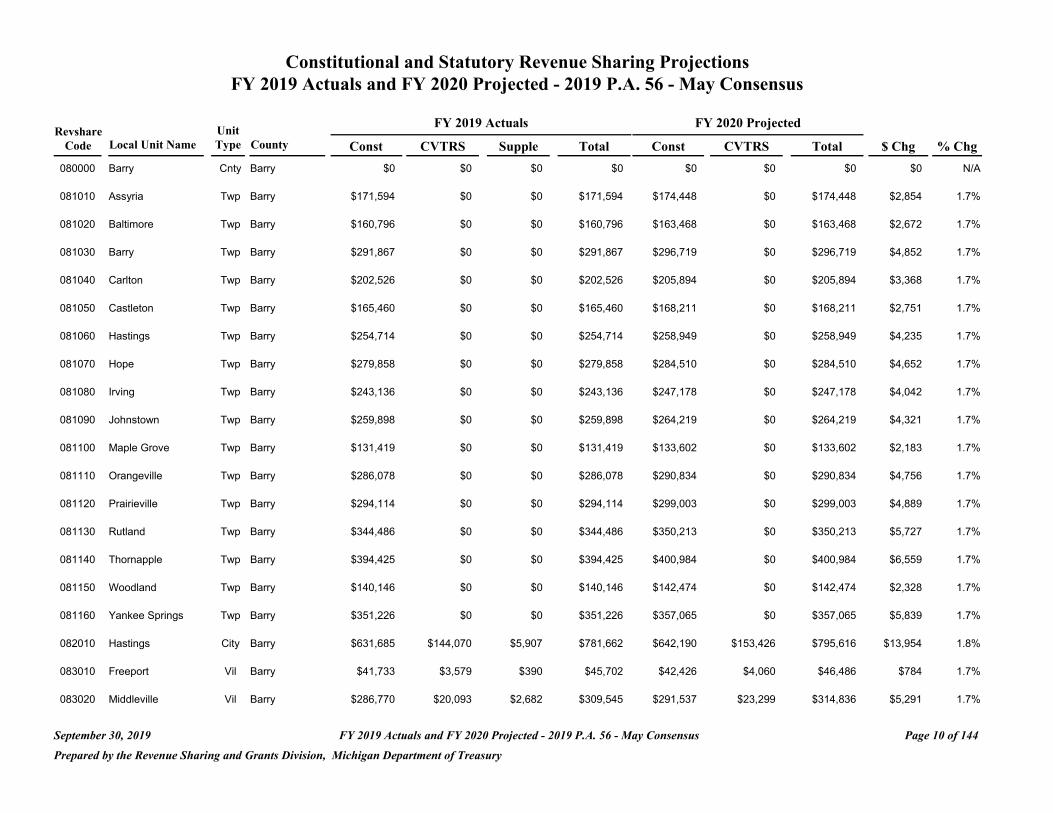
080000 Barry Cnty Barry $0 $0 $0 $0 $0 $0 $0 $0 N/A
081010 Assyria Twp Barry $171,594 $0 $0 $171,594 $174,448 $0 $174,448 $2,854 1.7%
081020 Baltimore Twp Barry $160,796 $0 $0 $160,796 $163,468 $0 $163,468 $2,672 1.7%
081030 Barry Twp Barry $291,867 $0 $0 $291,867 $296,719 $0 $296,719 $4,852 1.7%
081040 Carlton Twp Barry $202,526 $0 $0 $202,526 $205,894 $0 $205,894 $3,368 1.7%
081050 Castleton Twp Barry $165,460 $0 $0 $165,460 $168,211 $0 $168,211 $2,751 1.7%
081060 Hastings Twp Barry $254,714 $0 $0 $254,714 $258,949 $0 $258,949 $4,235 1.7%
081070 Hope Twp Barry $279,858 $0 $0 $279,858 $284,510 $0 $284,510 $4,652 1.7%
081080 Irving Twp Barry $243,136 $0 $0 $243,136 $247,178 $0 $247,178 $4,042 1.7%
081090 Johnstown Twp Barry $259,898 $0 $0 $259,898 $264,219 $0 $264,219 $4,321 1.7%
081100 Maple Grove Twp Barry $131,419 $0 $0 $131,419 $133,602 $0 $133,602 $2,183 1.7%
081110 Orangeville Twp Barry $286,078 $0 $0 $286,078 $290,834 $0 $290,834 $4,756 1.7%
081120 Prairieville Twp Barry $294,114 $0 $0 $294,114 $299,003 $0 $299,003 $4,889 1.7%
081130 Rutland Twp Barry $344,486 $0 $0 $344,486 $350,213 $0 $350,213 $5,727 1.7%
081140 Thornapple Twp Barry $394,425 $0 $0 $394,425 $400,984 $0 $400,984 $6,559 1.7%
081150 Woodland Twp Barry $140,146 $0 $0 $140,146 $142,474 $0 $142,474 $2,328 1.7%
081160 Yankee Springs Twp Barry $351,226 $0 $0 $351,226 $357,065 $0 $357,065 $5,839 1.7%
082010 Hastings City Barry $631,685 $144,070 $5,907 $781,662 $642,190 $153,426 $795,616 $13,954 1.8%
083010 Freeport Vil Barry $41,733 $3,579 $390 $45,702 $42,426 $4,060 $46,486 $784 1.7%
083020 Middleville Vil Barry $286,770 $20,093 $2,682 $309,545 $291,537 $23,299 $314,836 $5,291 1.7%
September 30, 2019 FY 2019 Actuals and FY 2020 Projected - 2019 P.A. 56 - May Consensus Page 10 of 144
Prepared by the Revenue Sharing and Grants Division, Michigan Department of Treasury

Constitutional and Statutory Revenue Sharing Projections FY 2019 Actuals and FY 2020 Projected - 2019 P.A. 56 - May Consensus
Revshare Code Local Unit Name
083030 Nashville
Unit Type County
Vil Barry
Const $140,664
FY 2019 Actuals
CVTRS Supple
$40,045 $1,315
Total $182,024
FY 2020 Projected
Const CVTRS
$143,001 $42,311
Total $185,312
$ Chg
$3,288
% Chg
1.8%
083040 Woodland Vil Barry $36,720 $8,221 $343 $45,284 $37,331 $8,761 $46,092 $808 1.8%
County Totals: $5,109,315 $216,008 $10,637 $5,335,960 $5,194,256 $231,857 $5,426,113 $90,153 1.7%
September 30, 2019 FY 2019 Actuals and FY 2020 Projected - 2019 P.A. 56 - May Consensus Page 11 of 144
Prepared by the Revenue Sharing and Grants Division, Michigan Department of Treasury
Constitutional and Statutory Revenue Sharing Projections FY 2019 Actuals and FY 2020 Projected - 2019 P.A. 56 - May Consensus
FY 2019 Actuals FY 2020 Projected Revshare Unit
Code Local Unit Name Type County Const CVTRS Supple Total Const CVTRS Total $ Chg % Chg
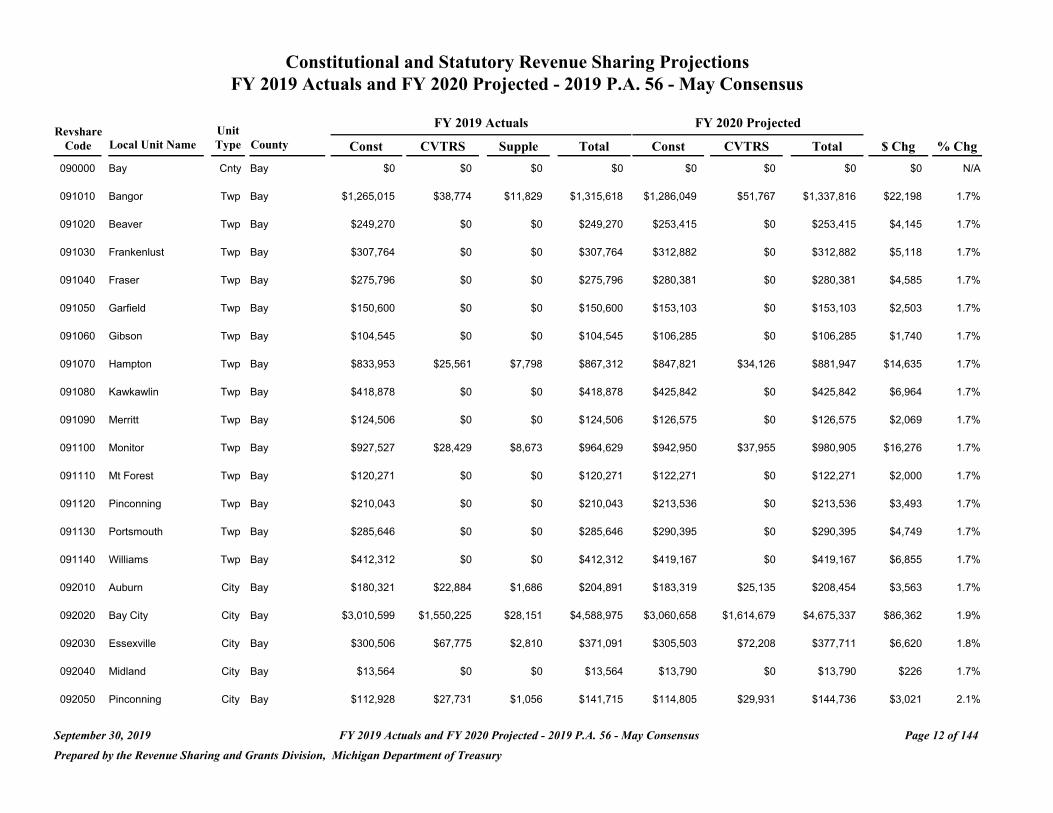
090000 Bay Cnty Bay $0 $0 $0 $0 $0 $0 $0 $0 N/A
091010 Bangor Twp Bay $1,265,015 $38,774 $11,829 $1,315,618 $1,286,049 $51,767 $1,337,816 $22,198 1.7%
091020 Beaver Twp Bay $249,270 $0 $0 $249,270 $253,415 $0 $253,415 $4,145 1.7%
091030 Frankenlust Twp Bay $307,764 $0 $0 $307,764 $312,882 $0 $312,882 $5,118 1.7%
091040 Fraser Twp Bay $275,796 $0 $0 $275,796 $280,381 $0 $280,381 $4,585 1.7%
091050 Garfield Twp Bay $150,600 $0 $0 $150,600 $153,103 $0 $153,103 $2,503 1.7%
091060 Gibson Twp Bay $104,545 $0 $0 $104,545 $106,285 $0 $106,285 $1,740 1.7%
091070 Hampton Twp Bay $833,953 $25,561 $7,798 $867,312 $847,821 $34,126 $881,947 $14,635 1.7%
091080 Kawkawlin Twp Bay $418,878 $0 $0 $418,878 $425,842 $0 $425,842 $6,964 1.7%
091090 Merritt Twp Bay $124,506 $0 $0 $124,506 $126,575 $0 $126,575 $2,069 1.7%
091100 Monitor Twp Bay $927,527 $28,429 $8,673 $964,629 $942,950 $37,955 $980,905 $16,276 1.7%
091110 Mt Forest Twp Bay $120,271 $0 $0 $120,271 $122,271 $0 $122,271 $2,000 1.7%
091120 Pinconning Twp Bay $210,043 $0 $0 $210,043 $213,536 $0 $213,536 $3,493 1.7%
091130 Portsmouth Twp Bay $285,646 $0 $0 $285,646 $290,395 $0 $290,395 $4,749 1.7%
091140 Williams Twp Bay $412,312 $0 $0 $412,312 $419,167 $0 $419,167 $6,855 1.7%
092010 Auburn City Bay $180,321 $22,884 $1,686 $204,891 $183,319 $25,135 $208,454 $3,563 1.7%
092020 Bay City City Bay $3,010,599 $1,550,225 $28,151 $4,588,975 $3,060,658 $1,614,679 $4,675,337 $86,362 1.9%
092030 Essexville City Bay $300,506 $67,775 $2,810 $371,091 $305,503 $72,208 $377,711 $6,620 1.8%
092040 Midland City Bay $13,564 $0 $0 $13,564 $13,790 $0 $13,790 $226 1.7%
092050 Pinconning City Bay $112,928 $27,731 $1,056 $141,715 $114,805 $29,931 $144,736 $3,021 2.1%
September 30, 2019 FY 2019 Actuals and FY 2020 Projected - 2019 P.A. 56 - May Consensus Page 12 of 144
Prepared by the Revenue Sharing and Grants Division, Michigan Department of Treasury
Constitutional and Statutory Revenue Sharing Projections FY 2019 Actuals and FY 2020 Projected - 2019 P.A. 56 - May Consensus
FY 2019 Actuals FY 2020 Projected Revshare Unit
Code Local Unit Name Type County Const CVTRS Supple Total Const CVTRS Total $ Chg % Chg
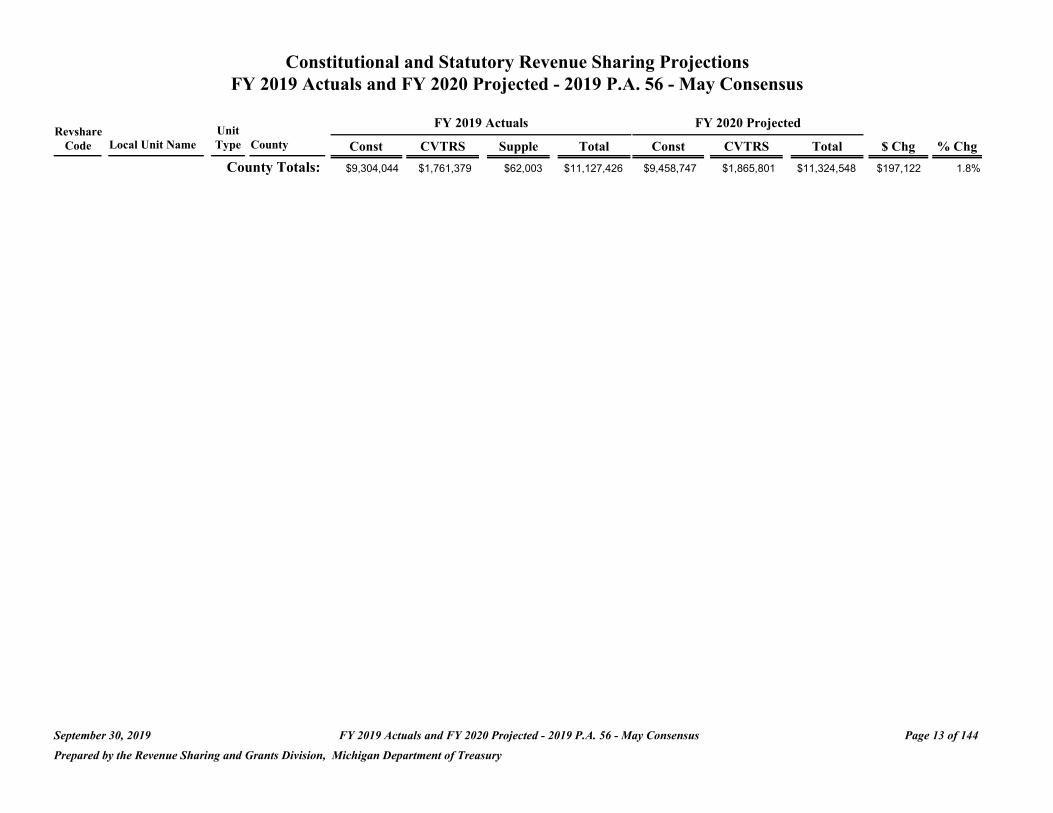
County Totals: $9,304,044 $1,761,379 $62,003 $11,127,426 $9,458,747 $1,865,801 $11,324,548 $197,122 1.8%
September 30, 2019 FY 2019 Actuals and FY 2020 Projected - 2019 P.A. 56 - May Consensus Page 13 of 144
Prepared by the Revenue Sharing and Grants Division, Michigan Department of Treasury
Constitutional and Statutory Revenue Sharing Projections FY 2019 Actuals and FY 2020 Projected - 2019 P.A. 56 - May Consensus
FY 2019 Actuals FY 2020 Projected Revshare Unit
Code Local Unit Name Type County Const CVTRS Supple Total Const CVTRS Total $ Chg % Chg
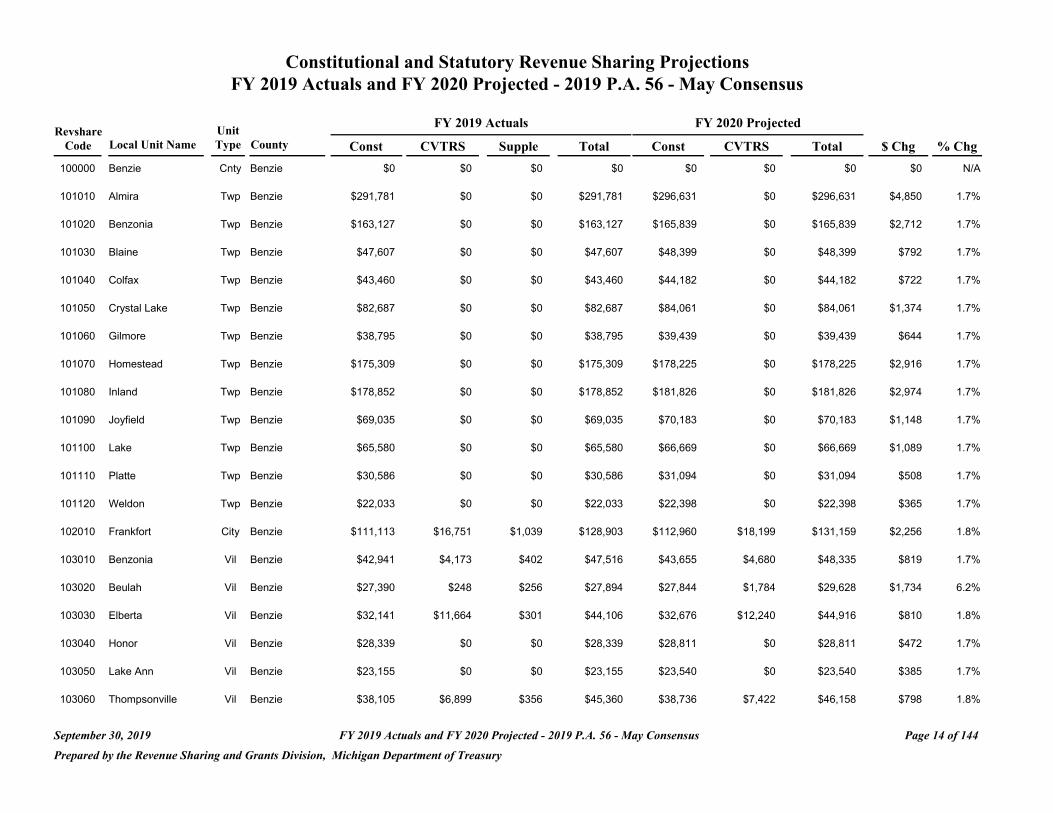
100000 Benzie Cnty Benzie $0 $0 $0 $0 $0 $0 $0 $0 N/A
101010 Almira Twp Benzie $291,781 $0 $0 $291,781 $296,631 $0 $296,631 $4,850 1.7%
101020 Benzonia Twp Benzie $163,127 $0 $0 $163,127 $165,839 $0 $165,839 $2,712 1.7%
101030 Blaine Twp Benzie $47,607 $0 $0 $47,607 $48,399 $0 $48,399 $792 1.7%
101040 Colfax Twp Benzie $43,460 $0 $0 $43,460 $44,182 $0 $44,182 $722 1.7%
101050 Crystal Lake Twp Benzie $82,687 $0 $0 $82,687 $84,061 $0 $84,061 $1,374 1.7%
101060 Gilmore Twp Benzie $38,795 $0 $0 $38,795 $39,439 $0 $39,439 $644 1.7%
101070 Homestead Twp Benzie $175,309 $0 $0 $175,309 $178,225 $0 $178,225 $2,916 1.7%
101080 Inland Twp Benzie $178,852 $0 $0 $178,852 $181,826 $0 $181,826 $2,974 1.7%
101090 Joyfield Twp Benzie $69,035 $0 $0 $69,035 $70,183 $0 $70,183 $1,148 1.7%
101100 Lake Twp Benzie $65,580 $0 $0 $65,580 $66,669 $0 $66,669 $1,089 1.7%
101110 Platte Twp Benzie $30,586 $0 $0 $30,586 $31,094 $0 $31,094 $508 1.7%
101120 Weldon Twp Benzie $22,033 $0 $0 $22,033 $22,398 $0 $22,398 $365 1.7%
102010 Frankfort City Benzie $111,113 $16,751 $1,039 $128,903 $112,960 $18,199 $131,159 $2,256 1.8%
103010 Benzonia Vil Benzie $42,941 $4,173 $402 $47,516 $43,655 $4,680 $48,335 $819 1.7%
103020 Beulah Vil Benzie $27,390 $248 $256 $27,894 $27,844 $1,784 $29,628 $1,734 6.2%
103030 Elberta Vil Benzie $32,141 $11,664 $301 $44,106 $32,676 $12,240 $44,916 $810 1.8%
103040 Honor Vil Benzie $28,339 $0 $0 $28,339 $28,811 $0 $28,811 $472 1.7%
103050 Lake Ann Vil Benzie $23,155 $0 $0 $23,155 $23,540 $0 $23,540 $385 1.7%
103060 Thompsonville Vil Benzie $38,105 $6,899 $356 $45,360 $38,736 $7,422 $46,158 $798 1.8%
September 30, 2019 FY 2019 Actuals and FY 2020 Projected - 2019 P.A. 56 - May Consensus Page 14 of 144
Prepared by the Revenue Sharing and Grants Division, Michigan Department of Treasury

Constitutional and Statutory Revenue Sharing Projections FY 2019 Actuals and FY 2020 Projected - 2019 P.A. 56 - May Consensus
FY 2019 Actuals FY 2020 Projected Revshare Unit
Code Local Unit Name Type County Const CVTRS Supple Total Const CVTRS Total $ Chg % Chg
County Totals: $1,512,036 $39,735 $2,354 $1,554,125 $1,537,168 $44,325 $1,581,493 $27,368 1.8%
September 30, 2019 FY 2019 Actuals and FY 2020 Projected - 2019 P.A. 56 - May Consensus Page 15 of 144
Prepared by the Revenue Sharing and Grants Division, Michigan Department of Treasury
Constitutional and Statutory Revenue Sharing Projections FY 2019 Actuals and FY 2020 Projected - 2019 P.A. 56 - May Consensus
FY 2019 Actuals FY 2020 Projected Revshare Unit
Code Local Unit Name Type County Const CVTRS Supple Total Const CVTRS Total $ Chg % Chg
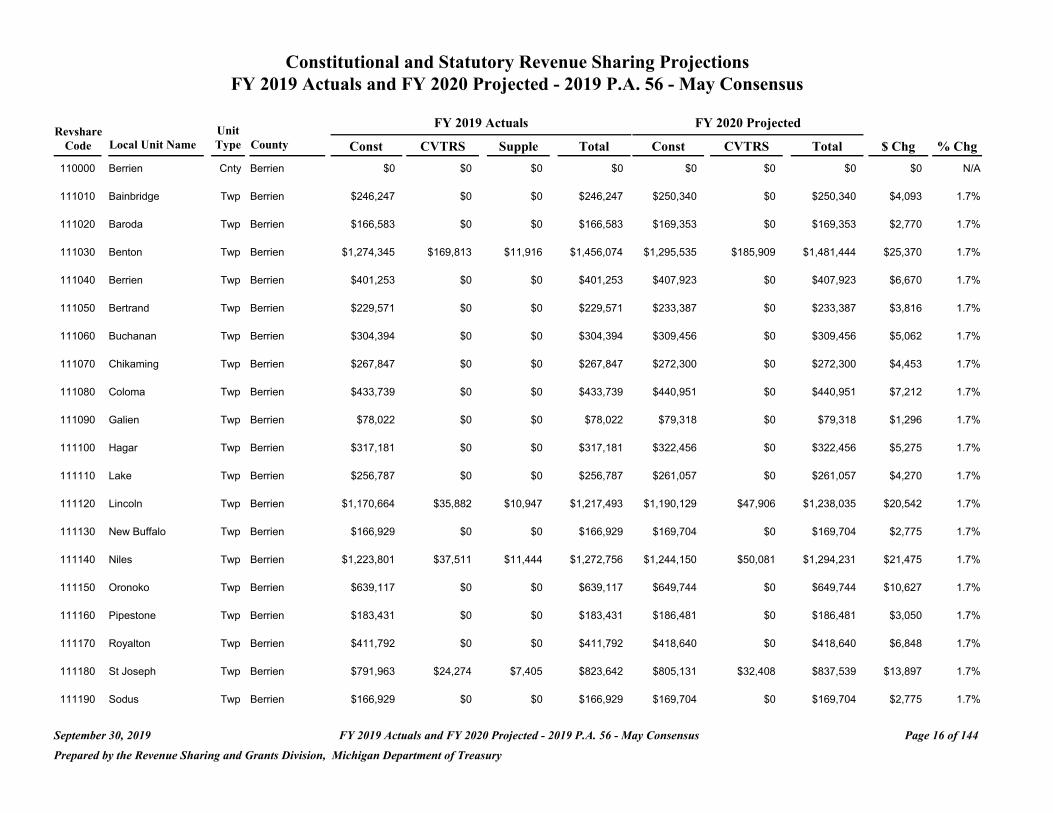
110000 Berrien Cnty Berrien $0 $0 $0 $0 $0 $0 $0 $0 N/A
111010 Bainbridge Twp Berrien $246,247 $0 $0 $246,247 $250,340 $0 $250,340 $4,093 1.7%
111020 Baroda Twp Berrien $166,583 $0 $0 $166,583 $169,353 $0 $169,353 $2,770 1.7%
111030 Benton Twp Berrien $1,274,345 $169,813 $11,916 $1,456,074 $1,295,535 $185,909 $1,481,444 $25,370 1.7%
111040 Berrien Twp Berrien $401,253 $0 $0 $401,253 $407,923 $0 $407,923 $6,670 1.7%
111050 Bertrand Twp Berrien $229,571 $0 $0 $229,571 $233,387 $0 $233,387 $3,816 1.7%
111060 Buchanan Twp Berrien $304,394 $0 $0 $304,394 $309,456 $0 $309,456 $5,062 1.7%
111070 Chikaming Twp Berrien $267,847 $0 $0 $267,847 $272,300 $0 $272,300 $4,453 1.7%
111080 Coloma Twp Berrien $433,739 $0 $0 $433,739 $440,951 $0 $440,951 $7,212 1.7%
111090 Galien Twp Berrien $78,022 $0 $0 $78,022 $79,318 $0 $79,318 $1,296 1.7%
111100 Hagar Twp Berrien $317,181 $0 $0 $317,181 $322,456 $0 $322,456 $5,275 1.7%
111110 Lake Twp Berrien $256,787 $0 $0 $256,787 $261,057 $0 $261,057 $4,270 1.7%
111120 Lincoln Twp Berrien $1,170,664 $35,882 $10,947 $1,217,493 $1,190,129 $47,906 $1,238,035 $20,542 1.7%
111130 New Buffalo Twp Berrien $166,929 $0 $0 $166,929 $169,704 $0 $169,704 $2,775 1.7%
111140 Niles Twp Berrien $1,223,801 $37,511 $11,444 $1,272,756 $1,244,150 $50,081 $1,294,231 $21,475 1.7%
111150 Oronoko Twp Berrien $639,117 $0 $0 $639,117 $649,744 $0 $649,744 $10,627 1.7%
111160 Pipestone Twp Berrien $183,431 $0 $0 $183,431 $186,481 $0 $186,481 $3,050 1.7%
111170 Royalton Twp Berrien $411,792 $0 $0 $411,792 $418,640 $0 $418,640 $6,848 1.7%
111180 St Joseph Twp Berrien $791,963 $24,274 $7,405 $823,642 $805,131 $32,408 $837,539 $13,897 1.7%
111190 Sodus Twp Berrien $166,929 $0 $0 $166,929 $169,704 $0 $169,704 $2,775 1.7%
September 30, 2019 FY 2019 Actuals and FY 2020 Projected - 2019 P.A. 56 - May Consensus Page 16 of 144
Prepared by the Revenue Sharing and Grants Division, Michigan Department of Treasury
Constitutional and Statutory Revenue Sharing Projections FY 2019 Actuals and FY 2020 Projected - 2019 P.A. 56 - May Consensus
FY 2019 Actuals FY 2020 Projected Revshare Unit
Code Local Unit Name Type County Const CVTRS Supple Total Const CVTRS Total $ Chg % Chg
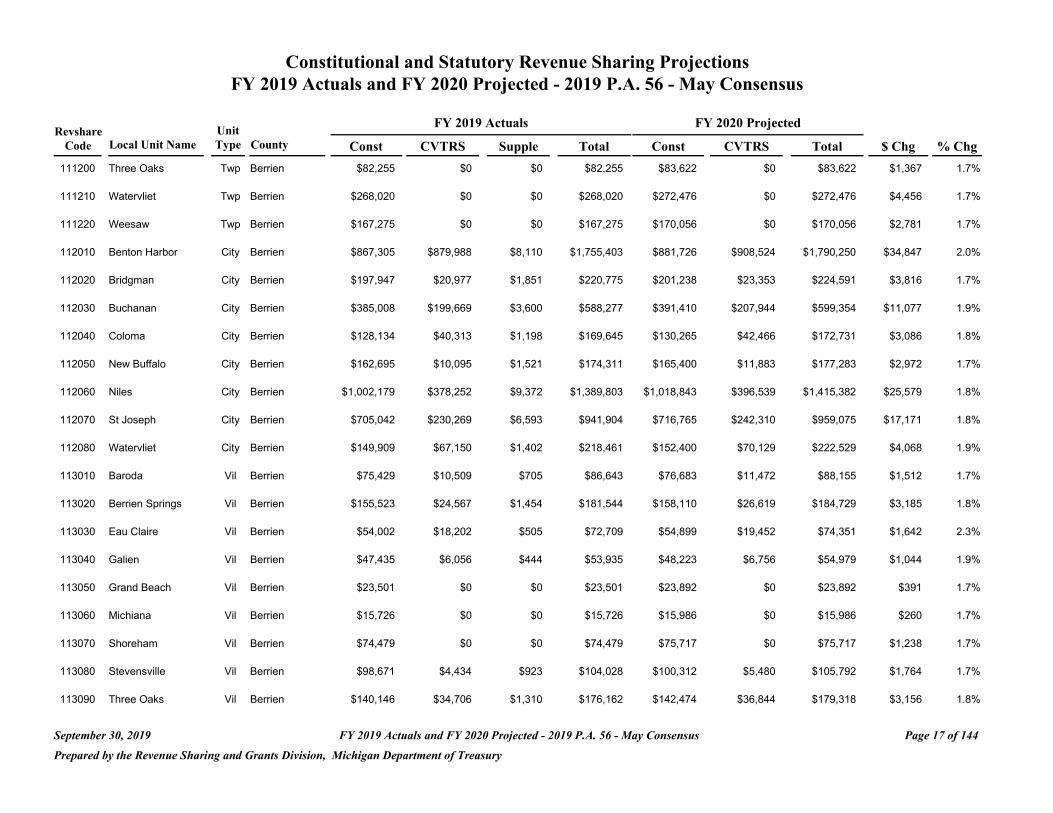
111200 Three Oaks Twp Berrien $82,255 $0 $0 $82,255 $83,622 $0 $83,622 $1,367 1.7%
111210 Watervliet Twp Berrien $268,020 $0 $0 $268,020 $272,476 $0 $272,476 $4,456 1.7%
111220 Weesaw Twp Berrien $167,275 $0 $0 $167,275 $170,056 $0 $170,056 $2,781 1.7%
112010 Benton Harbor City Berrien $867,305 $879,988 $8,110 $1,755,403 $881,726 $908,524 $1,790,250 $34,847 2.0%
112020 Bridgman City Berrien $197,947 $20,977 $1,851 $220,775 $201,238 $23,353 $224,591 $3,816 1.7%
112030 Buchanan City Berrien $385,008 $199,669 $3,600 $588,277 $391,410 $207,944 $599,354 $11,077 1.9%
112040 Coloma City Berrien $128,134 $40,313 $1,198 $169,645 $130,265 $42,466 $172,731 $3,086 1.8%
112050 New Buffalo City Berrien $162,695 $10,095 $1,521 $174,311 $165,400 $11,883 $177,283 $2,972 1.7%
112060 Niles City Berrien $1,002,179 $378,252 $9,372 $1,389,803 $1,018,843 $396,539 $1,415,382 $25,579 1.8%
112070 St Joseph City Berrien $705,042 $230,269 $6,593 $941,904 $716,765 $242,310 $959,075 $17,171 1.8%
112080 Watervliet City Berrien $149,909 $67,150 $1,402 $218,461 $152,400 $70,129 $222,529 $4,068 1.9%
113010 Baroda Vil Berrien $75,429 $10,509 $705 $86,643 $76,683 $11,472 $88,155 $1,512 1.7%
113020 Berrien Springs Vil Berrien $155,523 $24,567 $1,454 $181,544 $158,110 $26,619 $184,729 $3,185 1.8%
113030 Eau Claire Vil Berrien $54,002 $18,202 $505 $72,709 $54,899 $19,452 $74,351 $1,642 2.3%
113040 Galien Vil Berrien $47,435 $6,056 $444 $53,935 $48,223 $6,756 $54,979 $1,044 1.9%
113050 Grand Beach Vil Berrien $23,501 $0 $0 $23,501 $23,892 $0 $23,892 $391 1.7%
113060 Michiana Vil Berrien $15,726 $0 $0 $15,726 $15,986 $0 $15,986 $260 1.7%
113070 Shoreham Vil Berrien $74,479 $0 $0 $74,479 $75,717 $0 $75,717 $1,238 1.7%
113080 Stevensville Vil Berrien $98,671 $4,434 $923 $104,028 $100,312 $5,480 $105,792 $1,764 1.7%
113090 Three Oaks Vil Berrien $140,146 $34,706 $1,310 $176,162 $142,474 $36,844 $179,318 $3,156 1.8%
September 30, 2019 FY 2019 Actuals and FY 2020 Projected - 2019 P.A. 56 - May Consensus Page 17 of 144
Prepared by the Revenue Sharing and Grants Division, Michigan Department of Treasury

Constitutional and Statutory Revenue Sharing Projections FY 2019 Actuals and FY 2020 Projected - 2019 P.A. 56 - May Consensus
FY 2019 Actuals FY 2020 Projected Revshare Unit
Code Local Unit Name Type County Const CVTRS Supple Total Const CVTRS Total $ Chg % Chg
County Totals: $13,531,276 $2,192,667 $80,700 $15,804,643 $13,756,256 $2,326,075 $16,082,331 $277,688 1.8%
September 30, 2019 FY 2019 Actuals and FY 2020 Projected - 2019 P.A. 56 - May Consensus Page 18 of 144
Prepared by the Revenue Sharing and Grants Division, Michigan Department of Treasury
Constitutional and Statutory Revenue Sharing Projections FY 2019 Actuals and FY 2020 Projected - 2019 P.A. 56 - May Consensus
FY 2019 Actuals FY 2020 Projected Revshare Unit
Code Local Unit Name Type County Const CVTRS Supple Total Const CVTRS Total $ Chg % Chg
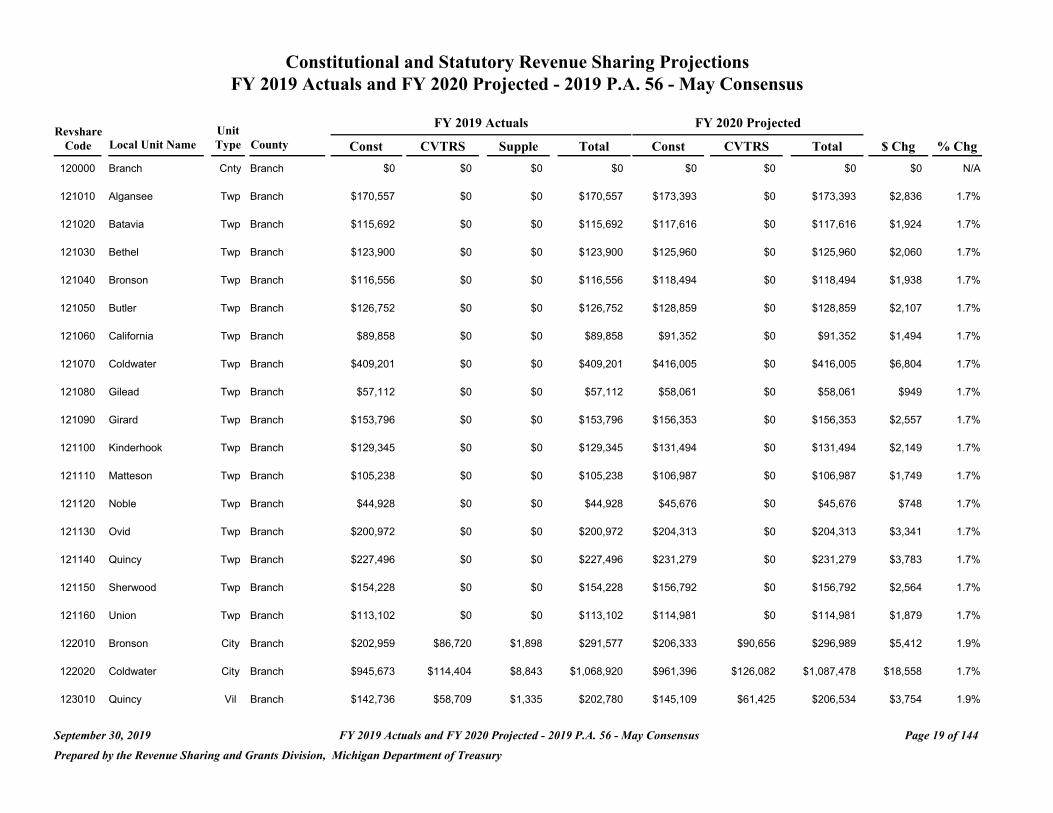
120000 Branch Cnty Branch $0 $0 $0 $0 $0 $0 $0 $0 N/A
121010 Algansee Twp Branch $170,557 $0 $0 $170,557 $173,393 $0 $173,393 $2,836 1.7%
121020 Batavia Twp Branch $115,692 $0 $0 $115,692 $117,616 $0 $117,616 $1,924 1.7%
121030 Bethel Twp Branch $123,900 $0 $0 $123,900 $125,960 $0 $125,960 $2,060 1.7%
121040 Bronson Twp Branch $116,556 $0 $0 $116,556 $118,494 $0 $118,494 $1,938 1.7%
121050 Butler Twp Branch $126,752 $0 $0 $126,752 $128,859 $0 $128,859 $2,107 1.7%
121060 California Twp Branch $89,858 $0 $0 $89,858 $91,352 $0 $91,352 $1,494 1.7%
121070 Coldwater Twp Branch $409,201 $0 $0 $409,201 $416,005 $0 $416,005 $6,804 1.7%
121080 Gilead Twp Branch $57,112 $0 $0 $57,112 $58,061 $0 $58,061 $949 1.7%
121090 Girard Twp Branch $153,796 $0 $0 $153,796 $156,353 $0 $156,353 $2,557 1.7%
121100 Kinderhook Twp Branch $129,345 $0 $0 $129,345 $131,494 $0 $131,494 $2,149 1.7%
121110 Matteson Twp Branch $105,238 $0 $0 $105,238 $106,987 $0 $106,987 $1,749 1.7%
121120 Noble Twp Branch $44,928 $0 $0 $44,928 $45,676 $0 $45,676 $748 1.7%
121130 Ovid Twp Branch $200,972 $0 $0 $200,972 $204,313 $0 $204,313 $3,341 1.7%
121140 Quincy Twp Branch $227,496 $0 $0 $227,496 $231,279 $0 $231,279 $3,783 1.7%
121150 Sherwood Twp Branch $154,228 $0 $0 $154,228 $156,792 $0 $156,792 $2,564 1.7%
121160 Union Twp Branch $113,102 $0 $0 $113,102 $114,981 $0 $114,981 $1,879 1.7%
122010 Bronson City Branch $202,959 $86,720 $1,898 $291,577 $206,333 $90,656 $296,989 $5,412 1.9%
122020 Coldwater City Branch $945,673 $114,404 $8,843 $1,068,920 $961,396 $126,082 $1,087,478 $18,558 1.7%
123010 Quincy Vil Branch $142,736 $58,709 $1,335 $202,780 $145,109 $61,425 $206,534 $3,754 1.9%
September 30, 2019 FY 2019 Actuals and FY 2020 Projected - 2019 P.A. 56 - May Consensus Page 19 of 144
Prepared by the Revenue Sharing and Grants Division, Michigan Department of Treasury
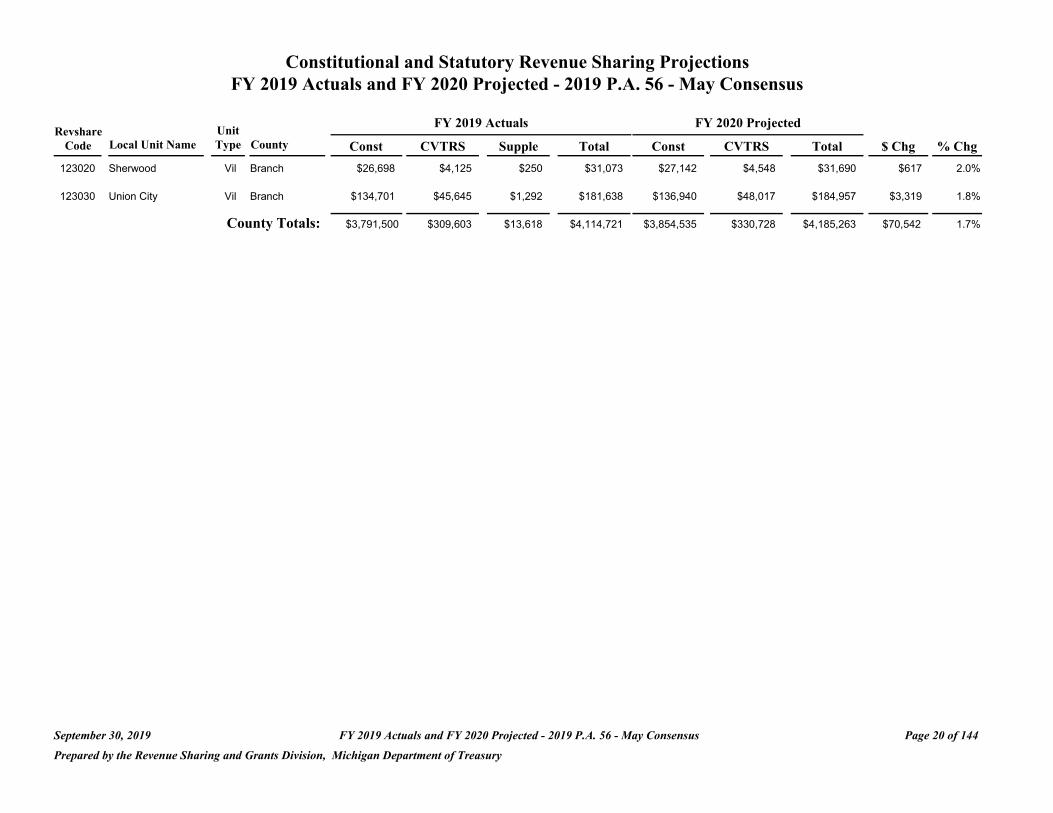
Constitutional and Statutory Revenue Sharing Projections FY 2019 Actuals and FY 2020 Projected - 2019 P.A. 56 - May Consensus
Revshare Code Local Unit Name
123020 Sherwood
Unit Type County
Vil Branch
Const $26,698
FY 2019 Actuals
CVTRS Supple
$4,125 $250
Total $31,073
FY 2020 Projected
Const CVTRS
$27,142 $4,548
Total $31,690
$ Chg
$617
% Chg
2.0%
123030 Union City Vil Branch $134,701 $45,645 $1,292 $181,638 $136,940 $48,017 $184,957 $3,319 1.8%
County Totals: $3,791,500 $309,603 $13,618 $4,114,721 $3,854,535 $330,728 $4,185,263 $70,542 1.7%
September 30, 2019 FY 2019 Actuals and FY 2020 Projected - 2019 P.A. 56 - May Consensus Page 20 of 144
Prepared by the Revenue Sharing and Grants Division, Michigan Department of Treasury
Constitutional and Statutory Revenue Sharing Projections FY 2019 Actuals and FY 2020 Projected - 2019 P.A. 56 - May Consensus
FY 2019 Actuals FY 2020 Projected Revshare Unit
Code Local Unit Name Type County Const CVTRS Supple Total Const CVTRS Total $ Chg % Chg
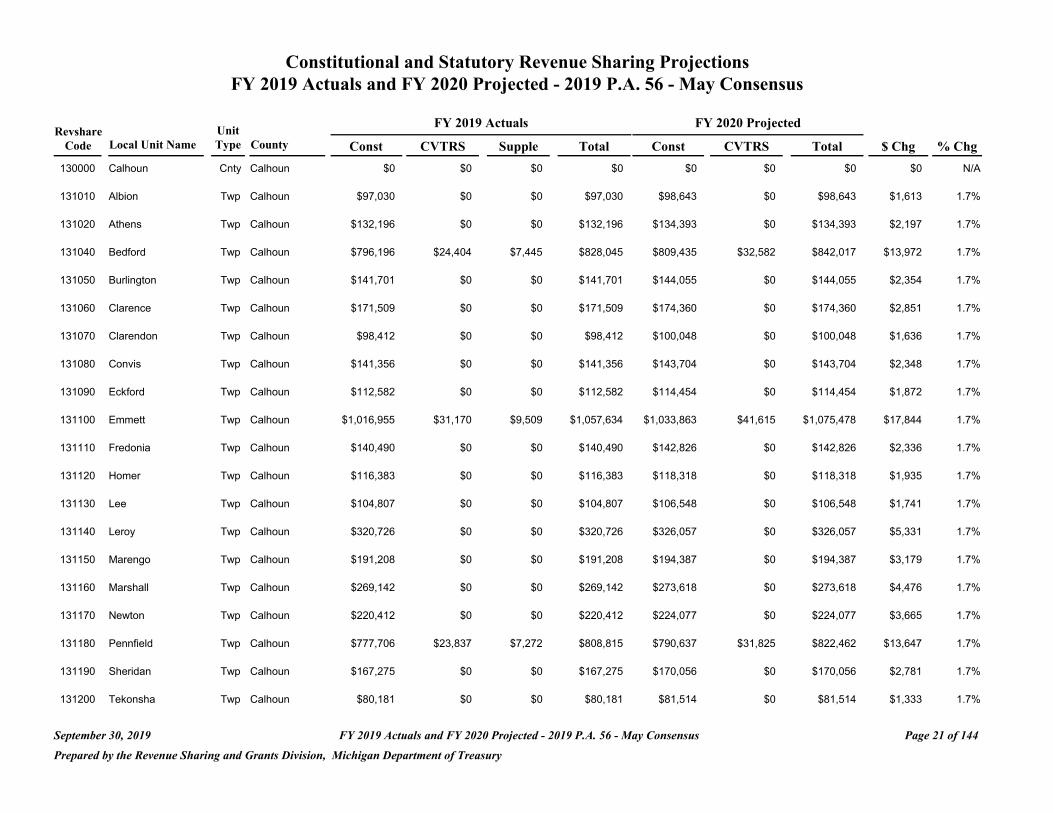
130000 Calhoun Cnty Calhoun $0 $0 $0 $0 $0 $0 $0 $0 N/A
131010 Albion Twp Calhoun $97,030 $0 $0 $97,030 $98,643 $0 $98,643 $1,613 1.7%
131020 Athens Twp Calhoun $132,196 $0 $0 $132,196 $134,393 $0 $134,393 $2,197 1.7%
131040 Bedford Twp Calhoun $796,196 $24,404 $7,445 $828,045 $809,435 $32,582 $842,017 $13,972 1.7%
131050 Burlington Twp Calhoun $141,701 $0 $0 $141,701 $144,055 $0 $144,055 $2,354 1.7%
131060 Clarence Twp Calhoun $171,509 $0 $0 $171,509 $174,360 $0 $174,360 $2,851 1.7%
131070 Clarendon Twp Calhoun $98,412 $0 $0 $98,412 $100,048 $0 $100,048 $1,636 1.7%
131080 Convis Twp Calhoun $141,356 $0 $0 $141,356 $143,704 $0 $143,704 $2,348 1.7%
131090 Eckford Twp Calhoun $112,582 $0 $0 $112,582 $114,454 $0 $114,454 $1,872 1.7%
131100 Emmett Twp Calhoun $1,016,955 $31,170 $9,509 $1,057,634 $1,033,863 $41,615 $1,075,478 $17,844 1.7%
131110 Fredonia Twp Calhoun $140,490 $0 $0 $140,490 $142,826 $0 $142,826 $2,336 1.7%
131120 Homer Twp Calhoun $116,383 $0 $0 $116,383 $118,318 $0 $118,318 $1,935 1.7%
131130 Lee Twp Calhoun $104,807 $0 $0 $104,807 $106,548 $0 $106,548 $1,741 1.7%
131140 Leroy Twp Calhoun $320,726 $0 $0 $320,726 $326,057 $0 $326,057 $5,331 1.7%
131150 Marengo Twp Calhoun $191,208 $0 $0 $191,208 $194,387 $0 $194,387 $3,179 1.7%
131160 Marshall Twp Calhoun $269,142 $0 $0 $269,142 $273,618 $0 $273,618 $4,476 1.7%
131170 Newton Twp Calhoun $220,412 $0 $0 $220,412 $224,077 $0 $224,077 $3,665 1.7%
131180 Pennfield Twp Calhoun $777,706 $23,837 $7,272 $808,815 $790,637 $31,825 $822,462 $13,647 1.7%
131190 Sheridan Twp Calhoun $167,275 $0 $0 $167,275 $170,056 $0 $170,056 $2,781 1.7%
131200 Tekonsha Twp Calhoun $80,181 $0 $0 $80,181 $81,514 $0 $81,514 $1,333 1.7%
September 30, 2019 FY 2019 Actuals and FY 2020 Projected - 2019 P.A. 56 - May Consensus Page 21 of 144
Prepared by the Revenue Sharing and Grants Division, Michigan Department of Treasury
Constitutional and Statutory Revenue Sharing Projections FY 2019 Actuals and FY 2020 Projected - 2019 P.A. 56 - May Consensus
Revshare Unit FY 2019 Actuals FY 2020 Projected
Code Local Unit Name Type County Const CVTRS Supple Total Const CVTRS Total $ Chg % Chg
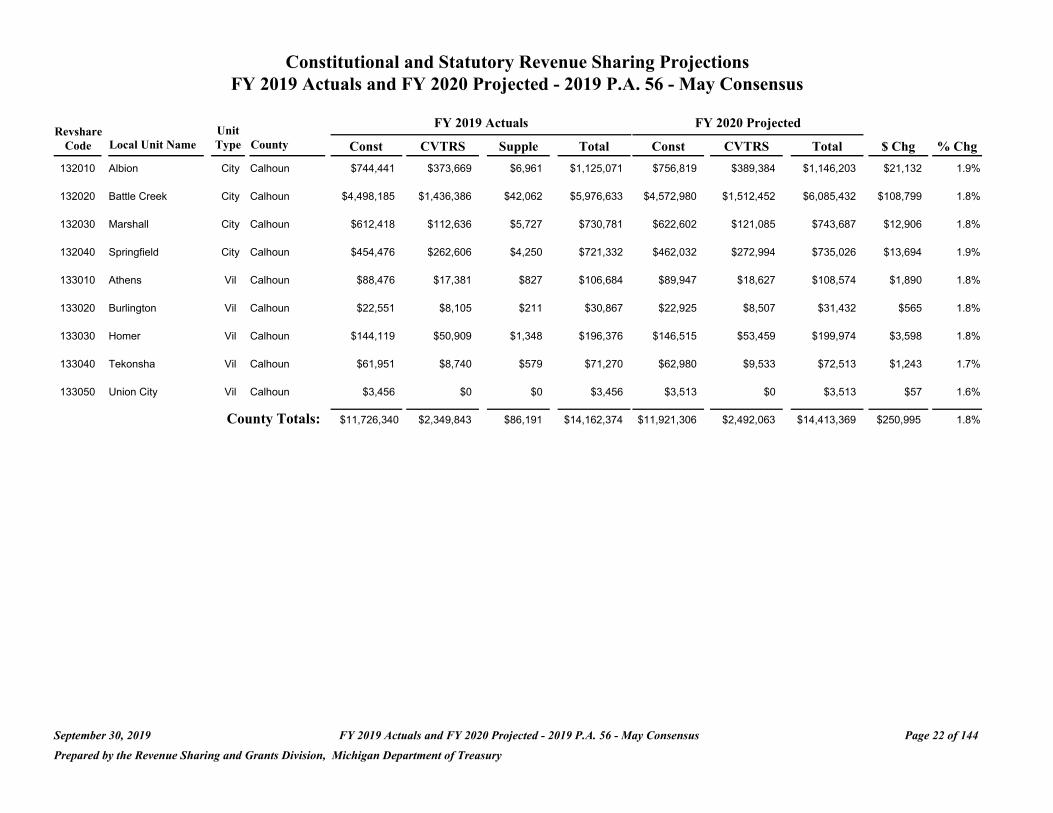
132010 Albion City Calhoun $744,441 $373,669 $6,961 $1,125,071 $756,819 $389,384 $1,146,203 $21,132 1.9%
132020 Battle Creek City Calhoun $4,498,185 $1,436,386 $42,062 $5,976,633 $4,572,980 $1,512,452 $6,085,432 $108,799 1.8%
132030 Marshall City Calhoun $612,418 $112,636 $5,727 $730,781 $622,602 $121,085 $743,687 $12,906 1.8%
132040 Springfield City Calhoun $454,476 $262,606 $4,250 $721,332 $462,032 $272,994 $735,026 $13,694 1.9%
133010 Athens Vil Calhoun $88,476 $17,381 $827 $106,684 $89,947 $18,627 $108,574 $1,890 1.8%
133020 Burlington Vil Calhoun $22,551 $8,105 $211 $30,867 $22,925 $8,507 $31,432 $565 1.8%
133030 Homer Vil Calhoun $144,119 $50,909 $1,348 $196,376 $146,515 $53,459 $199,974 $3,598 1.8%
133040 Tekonsha Vil Calhoun $61,951 $8,740 $579 $71,270 $62,980 $9,533 $72,513 $1,243 1.7%
133050 Union City Vil Calhoun $3,456 $0 $0 $3,456 $3,513 $0 $3,513 $57 1.6%
County Totals: $11,726,340 $2,349,843 $86,191 $14,162,374 $11,921,306 $2,492,063 $14,413,369 $250,995 1.8%
September 30, 2019 FY 2019 Actuals and FY 2020 Projected - 2019 P.A. 56 - May Consensus Page 22 of 144
Prepared by the Revenue Sharing and Grants Division, Michigan Department of Treasury

Constitutional and Statutory Revenue Sharing Projections FY 2019 Actuals and FY 2020 Projected - 2019 P.A. 56 - May Consensus
FY 2019 Actuals FY 2020 Projected Revshare Unit
Code Local Unit Name Type County Const CVTRS Supple Total Const CVTRS Total $ Chg % Chg
140000 Cass Cnty Cass $0 $0 $0 $0 $0 $0 $0 $0 N/A
141010 Calvin Twp Cass $176,002 $0 $0 $176,002 $178,927 $0 $178,927 $2,925 1.7%
141020 Howard Twp Cass $536,298 $0 $0 $536,298 $545,216 $0 $545,216 $8,918 1.7%
141030 Jefferson Twp Cass $219,548 $0 $0 $219,548 $223,198 $0 $223,198 $3,650 1.7%
141040 La Grange Twp Cass $149,131 $0 $0 $149,131 $151,609 $0 $151,609 $2,478 1.7%
141050 Marcellus Twp Cass $115,866 $0 $0 $115,866 $117,791 $0 $117,791 $1,925 1.7%
141060 Mason Twp Cass $254,454 $0 $0 $254,454 $258,685 $0 $258,685 $4,231 1.7%
141070 Milton Twp Cass $335,068 $0 $0 $335,068 $340,639 $0 $340,639 $5,571 1.7%
141080 Newberg Twp Cass $141,010 $0 $0 $141,010 $143,353 $0 $143,353 $2,343 1.7%
141090 Ontwa Twp Cass $457,067 $0 $0 $457,067 $464,667 $0 $464,667 $7,600 1.7%
141100 Penn Twp Cass $127,269 $0 $0 $127,269 $129,386 $0 $129,386 $2,117 1.7%
141110 Pokagon Twp Cass $175,309 $0 $0 $175,309 $178,225 $0 $178,225 $2,916 1.7%
141120 Porter Twp Cass $328,156 $0 $0 $328,156 $333,612 $0 $333,612 $5,456 1.7%
141130 Silver Creek Twp Cass $278,042 $0 $0 $278,042 $282,665 $0 $282,665 $4,623 1.7%
141140 Volinia Twp Cass $96,080 $0 $0 $96,080 $97,676 $0 $97,676 $1,596 1.7%
141150 Wayne Twp Cass $229,311 $0 $0 $229,311 $233,124 $0 $233,124 $3,813 1.7%
142010 Dowagiac City Cass $507,958 $206,507 $4,750 $719,215 $516,404 $216,116 $732,520 $13,305 1.8%
142060 Niles City Cass $85 $0 $0 $85 $87 $0 $87 $2 2.4%
143010 Cassopolis Vil Cass $148,353 $50,985 $1,387 $200,725 $150,819 $53,577 $204,396 $3,671 1.8%
143020 Edwardsburg Vil Cass $108,781 $18,064 $1,017 $127,862 $110,589 $19,520 $130,109 $2,247 1.8%
September 30, 2019 FY 2019 Actuals and FY 2020 Projected - 2019 P.A. 56 - May Consensus Page 23 of 144
Prepared by the Revenue Sharing and Grants Division, Michigan Department of Treasury

Constitutional and Statutory Revenue Sharing Projections FY 2019 Actuals and FY 2020 Projected - 2019 P.A. 56 - May Consensus
Revshare Code Local Unit Name
143030 Marcellus
Unit Type County
Vil Cass
Const $103,510
FY 2019 Actuals
CVTRS Supple
$33,953 $968
Total $138,431
FY 2020 Projected
Const CVTRS
$105,230 $35,724
Total $140,954
$ Chg
$2,523
% Chg
1.8%
143040 Vandalia Vil Cass $26,007 $11,672 $243 $37,922 $26,439 $12,189 $38,628 $706 1.9%
County Totals: $4,513,305 $321,181 $8,365 $4,842,851 $4,588,341 $337,126 $4,925,467 $82,616 1.7%
September 30, 2019 FY 2019 Actuals and FY 2020 Projected - 2019 P.A. 56 - May Consensus Page 24 of 144
Prepared by the Revenue Sharing and Grants Division, Michigan Department of Treasury
Constitutional and Statutory Revenue Sharing Projections FY 2019 Actuals and FY 2020 Projected - 2019 P.A. 56 - May Consensus
FY 2019 Actuals FY 2020 Projected Revshare Unit
Code Local Unit Name Type County Const CVTRS Supple Total Const CVTRS Total $ Chg % Chg
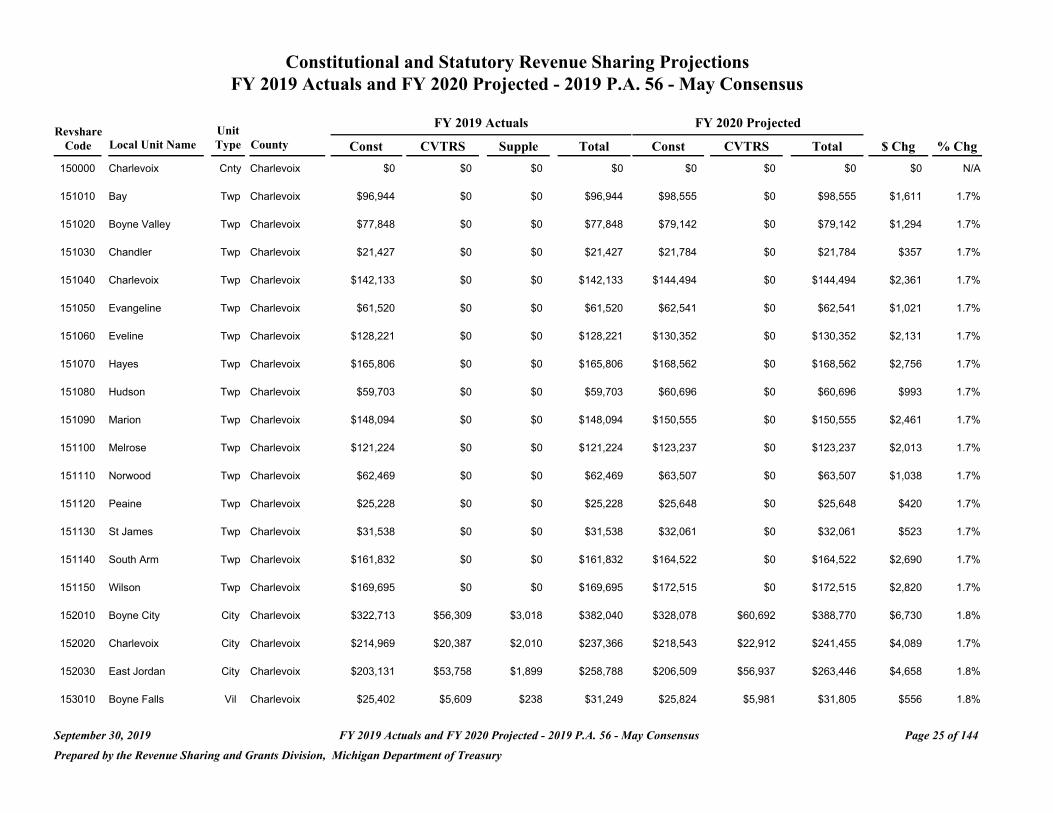
150000 Charlevoix Cnty Charlevoix $0 $0 $0 $0 $0 $0 $0 $0 N/A
151010 Bay Twp Charlevoix $96,944 $0 $0 $96,944 $98,555 $0 $98,555 $1,611 1.7%
151020 Boyne Valley Twp Charlevoix $77,848 $0 $0 $77,848 $79,142 $0 $79,142 $1,294 1.7%
151030 Chandler Twp Charlevoix $21,427 $0 $0 $21,427 $21,784 $0 $21,784 $357 1.7%
151040 Charlevoix Twp Charlevoix $142,133 $0 $0 $142,133 $144,494 $0 $144,494 $2,361 1.7%
151050 Evangeline Twp Charlevoix $61,520 $0 $0 $61,520 $62,541 $0 $62,541 $1,021 1.7%
151060 Eveline Twp Charlevoix $128,221 $0 $0 $128,221 $130,352 $0 $130,352 $2,131 1.7%
151070 Hayes Twp Charlevoix $165,806 $0 $0 $165,806 $168,562 $0 $168,562 $2,756 1.7%
151080 Hudson Twp Charlevoix $59,703 $0 $0 $59,703 $60,696 $0 $60,696 $993 1.7%
151090 Marion Twp Charlevoix $148,094 $0 $0 $148,094 $150,555 $0 $150,555 $2,461 1.7%
151100 Melrose Twp Charlevoix $121,224 $0 $0 $121,224 $123,237 $0 $123,237 $2,013 1.7%
151110 Norwood Twp Charlevoix $62,469 $0 $0 $62,469 $63,507 $0 $63,507 $1,038 1.7%
151120 Peaine Twp Charlevoix $25,228 $0 $0 $25,228 $25,648 $0 $25,648 $420 1.7%
151130 St James Twp Charlevoix $31,538 $0 $0 $31,538 $32,061 $0 $32,061 $523 1.7%
151140 South Arm Twp Charlevoix $161,832 $0 $0 $161,832 $164,522 $0 $164,522 $2,690 1.7%
151150 Wilson Twp Charlevoix $169,695 $0 $0 $169,695 $172,515 $0 $172,515 $2,820 1.7%
152010 Boyne City City Charlevoix $322,713 $56,309 $3,018 $382,040 $328,078 $60,692 $388,770 $6,730 1.8%
152020 Charlevoix City Charlevoix $214,969 $20,387 $2,010 $237,366 $218,543 $22,912 $241,455 $4,089 1.7%
152030 East Jordan City Charlevoix $203,131 $53,758 $1,899 $258,788 $206,509 $56,937 $263,446 $4,658 1.8%
153010 Boyne Falls Vil Charlevoix $25,402 $5,609 $238 $31,249 $25,824 $5,981 $31,805 $556 1.8%
September 30, 2019 FY 2019 Actuals and FY 2020 Projected - 2019 P.A. 56 - May Consensus Page 25 of 144
Prepared by the Revenue Sharing and Grants Division, Michigan Department of Treasury

Constitutional and Statutory Revenue Sharing Projections FY 2019 Actuals and FY 2020 Projected - 2019 P.A. 56 - May Consensus
FY 2019 Actuals FY 2020 Projected Revshare Unit
Code Local Unit Name Type County Const CVTRS Supple Total Const CVTRS Total $ Chg % Chg
County Totals: $2,239,897 $136,063 $7,165 $2,383,125 $2,277,125 $146,522 $2,423,647 $40,522 1.7%
September 30, 2019 FY 2019 Actuals and FY 2020 Projected - 2019 P.A. 56 - May Consensus Page 26 of 144
Prepared by the Revenue Sharing and Grants Division, Michigan Department of Treasury

Constitutional and Statutory Revenue Sharing Projections FY 2019 Actuals and FY 2020 Projected - 2019 P.A. 56 - May Consensus
FY 2019 Actuals FY 2020 Projected Revshare Unit
Code Local Unit Name Type County Const CVTRS Supple Total Const CVTRS Total $ Chg % Chg
160000 Cheboygan Cnty Cheboygan $0 $0 $0 $0 $0 $0 $0 $0 N/A
161010 Aloha Twp Cheboygan $81,995 $0 $0 $81,995 $83,359 $0 $83,359 $1,364 1.7%
161020 Beaugrand Twp Cheboygan $100,918 $0 $0 $100,918 $102,595 $0 $102,595 $1,677 1.7%
161030 Benton Twp Cheboygan $277,006 $0 $0 $277,006 $281,611 $0 $281,611 $4,605 1.7%
161040 Burt Twp Cheboygan $58,754 $0 $0 $58,754 $59,730 $0 $59,730 $976 1.7%
161050 Ellis Twp Cheboygan $51,496 $0 $0 $51,496 $52,351 $0 $52,351 $855 1.7%
161060 Forest Twp Cheboygan $90,291 $0 $0 $90,291 $91,791 $0 $91,791 $1,500 1.7%
161070 Grant Twp Cheboygan $73,097 $0 $0 $73,097 $74,311 $0 $74,311 $1,214 1.7%
161080 Hebron Twp Cheboygan $23,242 $0 $0 $23,242 $23,628 $0 $23,628 $386 1.7%
161090 Inverness Twp Cheboygan $195,356 $0 $0 $195,356 $198,603 $0 $198,603 $3,247 1.7%
161100 Koehler Twp Cheboygan $110,855 $0 $0 $110,855 $112,697 $0 $112,697 $1,842 1.7%
161110 Mackinaw Twp Cheboygan $20,650 $0 $0 $20,650 $20,993 $0 $20,993 $343 1.7%
161120 Mentor Twp Cheboygan $70,677 $0 $0 $70,677 $71,852 $0 $71,852 $1,175 1.7%
161130 Mullett Twp Cheboygan $113,360 $0 $0 $113,360 $115,244 $0 $115,244 $1,884 1.7%
161140 Munro Twp Cheboygan $49,337 $0 $0 $49,337 $50,156 $0 $50,156 $819 1.7%
161150 Nunda Twp Cheboygan $74,306 $0 $0 $74,306 $75,541 $0 $75,541 $1,235 1.7%
161160 Tuscarora Twp Cheboygan $262,490 $0 $0 $262,490 $266,854 $0 $266,854 $4,364 1.7%
161170 Walker Twp Cheboygan $28,254 $0 $0 $28,254 $28,723 $0 $28,723 $469 1.7%
161180 Waverly Twp Cheboygan $39,486 $0 $0 $39,486 $40,142 $0 $40,142 $656 1.7%
161190 Wilmot Twp Cheboygan $70,503 $0 $0 $70,503 $71,676 $0 $71,676 $1,173 1.7%
September 30, 2019 FY 2019 Actuals and FY 2020 Projected - 2019 P.A. 56 - May Consensus Page 27 of 144
Prepared by the Revenue Sharing and Grants Division, Michigan Department of Treasury
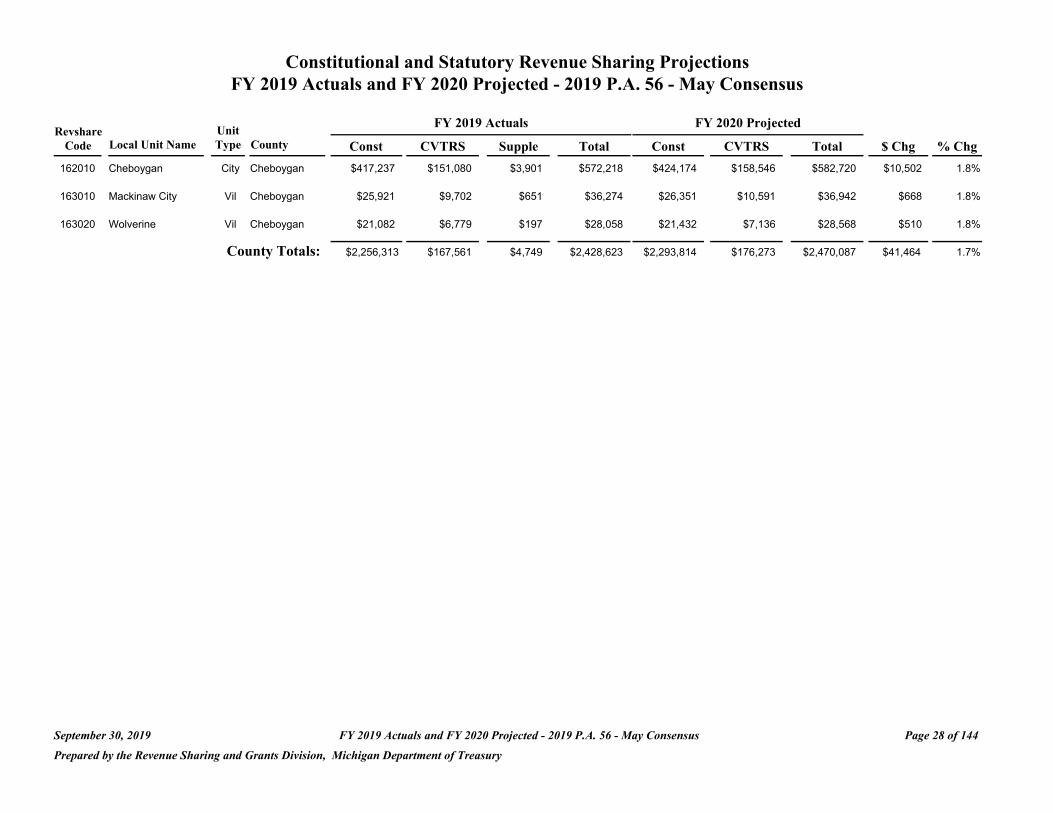
Constitutional and Statutory Revenue Sharing Projections FY 2019 Actuals and FY 2020 Projected - 2019 P.A. 56 - May Consensus
Revshare Code Local Unit Name
162010 Cheboygan
Unit Type County
City Cheboygan
Const $417,237
FY 2019 Actuals
CVTRS Supple
$151,080 $3,901
Total $572,218
FY 2020 Projected
Const CVTRS
$424,174 $158,546
Total $582,720
$ Chg
$10,502
% Chg
1.8%
163010 Mackinaw City Vil Cheboygan $25,921 $9,702 $651 $36,274 $26,351 $10,591 $36,942 $668 1.8%
163020 Wolverine Vil Cheboygan $21,082 $6,779 $197 $28,058 $21,432 $7,136 $28,568 $510 1.8%
County Totals: $2,256,313 $167,561 $4,749 $2,428,623 $2,293,814 $176,273 $2,470,087 $41,464 1.7%
September 30, 2019 FY 2019 Actuals and FY 2020 Projected - 2019 P.A. 56 - May Consensus Page 28 of 144
Prepared by the Revenue Sharing and Grants Division, Michigan Department of Treasury
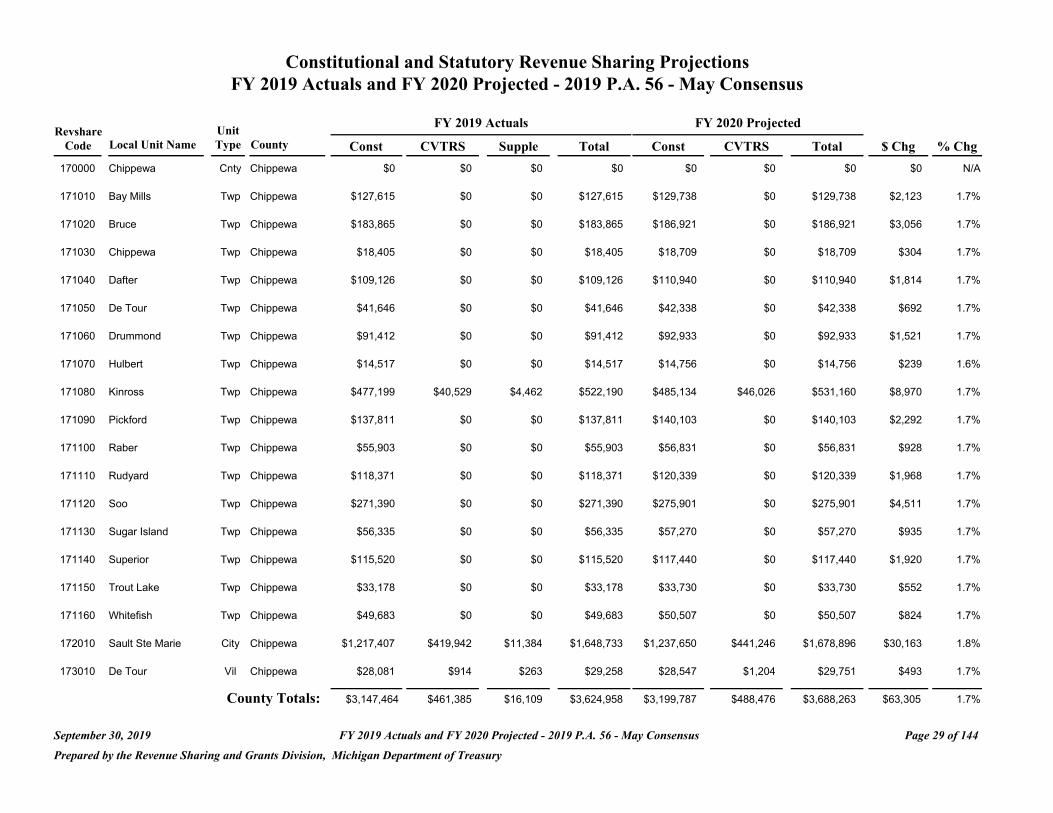
Constitutional and Statutory Revenue Sharing Projections FY 2019 Actuals and FY 2020 Projected - 2019 P.A. 56 - May Consensus
FY 2019 Actuals FY 2020 Projected Revshare Unit
Code Local Unit Name Type County Const CVTRS Supple Total Const CVTRS Total $ Chg % Chg
170000 Chippewa Cnty Chippewa $0 $0 $0 $0 $0 $0 $0 $0 N/A
171010 Bay Mills Twp Chippewa $127,615 $0 $0 $127,615 $129,738 $0 $129,738 $2,123 1.7%
171020 Bruce Twp Chippewa $183,865 $0 $0 $183,865 $186,921 $0 $186,921 $3,056 1.7%
171030 Chippewa Twp Chippewa $18,405 $0 $0 $18,405 $18,709 $0 $18,709 $304 1.7%
171040 Dafter Twp Chippewa $109,126 $0 $0 $109,126 $110,940 $0 $110,940 $1,814 1.7%
171050 De Tour Twp Chippewa $41,646 $0 $0 $41,646 $42,338 $0 $42,338 $692 1.7%
171060 Drummond Twp Chippewa $91,412 $0 $0 $91,412 $92,933 $0 $92,933 $1,521 1.7%
171070 Hulbert Twp Chippewa $14,517 $0 $0 $14,517 $14,756 $0 $14,756 $239 1.6%
171080 Kinross Twp Chippewa $477,199 $40,529 $4,462 $522,190 $485,134 $46,026 $531,160 $8,970 1.7%
171090 Pickford Twp Chippewa $137,811 $0 $0 $137,811 $140,103 $0 $140,103 $2,292 1.7%
171100 Raber Twp Chippewa $55,903 $0 $0 $55,903 $56,831 $0 $56,831 $928 1.7%
171110 Rudyard Twp Chippewa $118,371 $0 $0 $118,371 $120,339 $0 $120,339 $1,968 1.7%
171120 Soo Twp Chippewa $271,390 $0 $0 $271,390 $275,901 $0 $275,901 $4,511 1.7%
171130 Sugar Island Twp Chippewa $56,335 $0 $0 $56,335 $57,270 $0 $57,270 $935 1.7%
171140 Superior Twp Chippewa $115,520 $0 $0 $115,520 $117,440 $0 $117,440 $1,920 1.7%
171150 Trout Lake Twp Chippewa $33,178 $0 $0 $33,178 $33,730 $0 $33,730 $552 1.7%
171160 Whitefish Twp Chippewa $49,683 $0 $0 $49,683 $50,507 $0 $50,507 $824 1.7%
172010 Sault Ste Marie City Chippewa $1,217,407 $419,942 $11,384 $1,648,733 $1,237,650 $441,246 $1,678,896 $30,163 1.8%
173010 De Tour Vil Chippewa $28,081 $914 $263 $29,258 $28,547 $1,204 $29,751 $493 1.7%
County Totals: $3,147,464 $461,385 $16,109 $3,624,958 $3,199,787 $488,476 $3,688,263 $63,305 1.7%
September 30, 2019 FY 2019 Actuals and FY 2020 Projected - 2019 P.A. 56 - May Consensus Page 29 of 144
Prepared by the Revenue Sharing and Grants Division, Michigan Department of Treasury
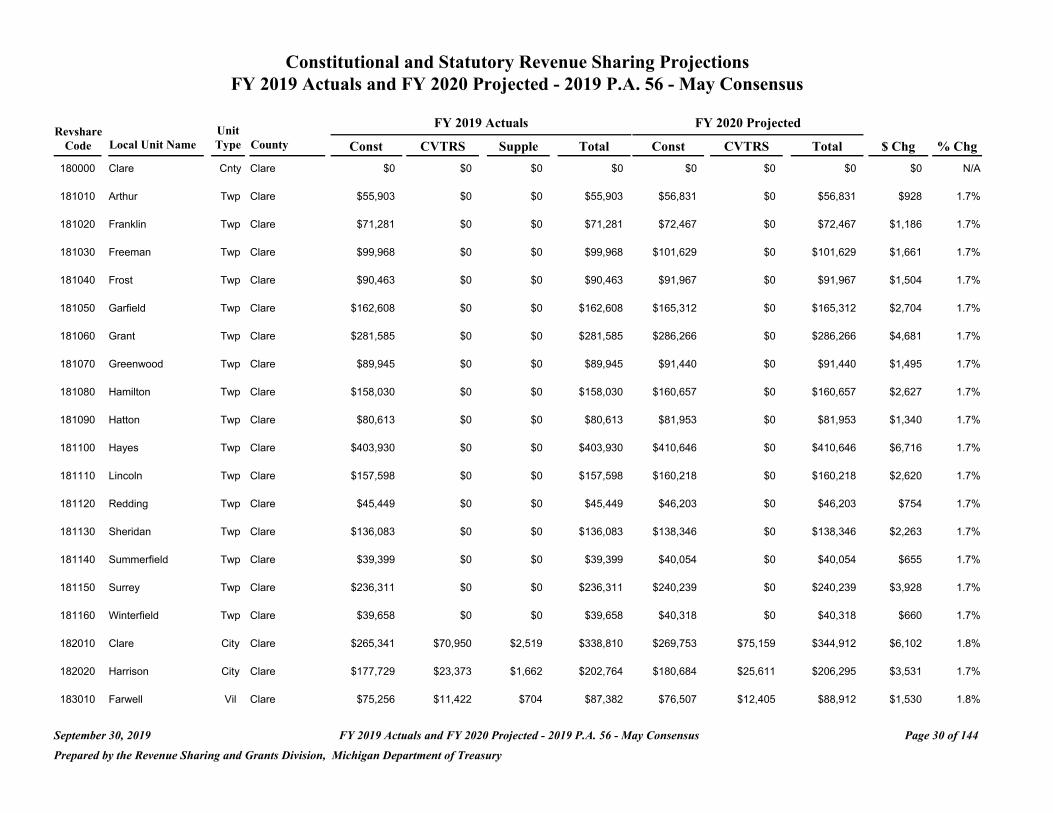
Constitutional and Statutory Revenue Sharing Projections FY 2019 Actuals and FY 2020 Projected - 2019 P.A. 56 - May Consensus
FY 2019 Actuals FY 2020 Projected Revshare Unit
Code Local Unit Name Type County Const CVTRS Supple Total Const CVTRS Total $ Chg % Chg
180000 Clare Cnty Clare $0 $0 $0 $0 $0 $0 $0 $0 N/A
181010 Arthur Twp Clare $55,903 $0 $0 $55,903 $56,831 $0 $56,831 $928 1.7%
181020 Franklin Twp Clare $71,281 $0 $0 $71,281 $72,467 $0 $72,467 $1,186 1.7%
181030 Freeman Twp Clare $99,968 $0 $0 $99,968 $101,629 $0 $101,629 $1,661 1.7%
181040 Frost Twp Clare $90,463 $0 $0 $90,463 $91,967 $0 $91,967 $1,504 1.7%
181050 Garfield Twp Clare $162,608 $0 $0 $162,608 $165,312 $0 $165,312 $2,704 1.7%
181060 Grant Twp Clare $281,585 $0 $0 $281,585 $286,266 $0 $286,266 $4,681 1.7%
181070 Greenwood Twp Clare $89,945 $0 $0 $89,945 $91,440 $0 $91,440 $1,495 1.7%
181080 Hamilton Twp Clare $158,030 $0 $0 $158,030 $160,657 $0 $160,657 $2,627 1.7%
181090 Hatton Twp Clare $80,613 $0 $0 $80,613 $81,953 $0 $81,953 $1,340 1.7%
181100 Hayes Twp Clare $403,930 $0 $0 $403,930 $410,646 $0 $410,646 $6,716 1.7%
181110 Lincoln Twp Clare $157,598 $0 $0 $157,598 $160,218 $0 $160,218 $2,620 1.7%
181120 Redding Twp Clare $45,449 $0 $0 $45,449 $46,203 $0 $46,203 $754 1.7%
181130 Sheridan Twp Clare $136,083 $0 $0 $136,083 $138,346 $0 $138,346 $2,263 1.7%
181140 Summerfield Twp Clare $39,399 $0 $0 $39,399 $40,054 $0 $40,054 $655 1.7%
181150 Surrey Twp Clare $236,311 $0 $0 $236,311 $240,239 $0 $240,239 $3,928 1.7%
181160 Winterfield Twp Clare $39,658 $0 $0 $39,658 $40,318 $0 $40,318 $660 1.7%
182010 Clare City Clare $265,341 $70,950 $2,519 $338,810 $269,753 $75,159 $344,912 $6,102 1.8%
182020 Harrison City Clare $177,729 $23,373 $1,662 $202,764 $180,684 $25,611 $206,295 $3,531 1.7%
183010 Farwell Vil Clare $75,256 $11,422 $704 $87,382 $76,507 $12,405 $88,912 $1,530 1.8%
September 30, 2019 FY 2019 Actuals and FY 2020 Projected - 2019 P.A. 56 - May Consensus Page 30 of 144
Prepared by the Revenue Sharing and Grants Division, Michigan Department of Treasury

Constitutional and Statutory Revenue Sharing Projections FY 2019 Actuals and FY 2020 Projected - 2019 P.A. 56 - May Consensus
FY 2019 Actuals FY 2020 Projected Revshare Unit
Code Local Unit Name Type County Const CVTRS Supple Total Const CVTRS Total $ Chg % Chg
County Totals: $2,667,150 $105,745 $4,885 $2,777,780 $2,711,490 $113,175 $2,824,665 $46,885 1.7%
September 30, 2019 FY 2019 Actuals and FY 2020 Projected - 2019 P.A. 56 - May Consensus Page 31 of 144
Prepared by the Revenue Sharing and Grants Division, Michigan Department of Treasury
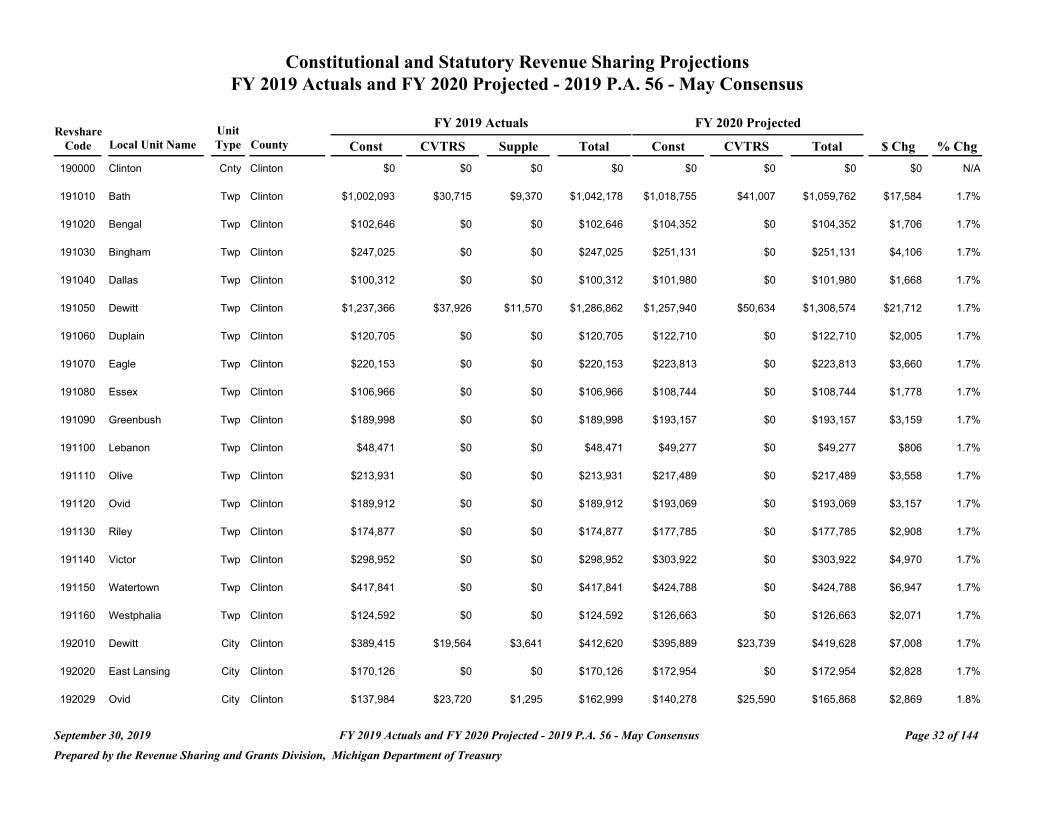
Constitutional and Statutory Revenue Sharing Projections FY 2019 Actuals and FY 2020 Projected - 2019 P.A. 56 - May Consensus
FY 2019 Actuals FY 2020 Projected Revshare Unit
Code Local Unit Name Type County Const CVTRS Supple Total Const CVTRS Total $ Chg % Chg
190000 Clinton Cnty Clinton $0 $0 $0 $0 $0 $0 $0 $0 N/A
191010 Bath Twp Clinton $1,002,093 $30,715 $9,370 $1,042,178 $1,018,755 $41,007 $1,059,762 $17,584 1.7%
191020 Bengal Twp Clinton $102,646 $0 $0 $102,646 $104,352 $0 $104,352 $1,706 1.7%
191030 Bingham Twp Clinton $247,025 $0 $0 $247,025 $251,131 $0 $251,131 $4,106 1.7%
191040 Dallas Twp Clinton $100,312 $0 $0 $100,312 $101,980 $0 $101,980 $1,668 1.7%
191050 Dewitt Twp Clinton $1,237,366 $37,926 $11,570 $1,286,862 $1,257,940 $50,634 $1,308,574 $21,712 1.7%
191060 Duplain Twp Clinton $120,705 $0 $0 $120,705 $122,710 $0 $122,710 $2,005 1.7%
191070 Eagle Twp Clinton $220,153 $0 $0 $220,153 $223,813 $0 $223,813 $3,660 1.7%
191080 Essex Twp Clinton $106,966 $0 $0 $106,966 $108,744 $0 $108,744 $1,778 1.7%
191090 Greenbush Twp Clinton $189,998 $0 $0 $189,998 $193,157 $0 $193,157 $3,159 1.7%
191100 Lebanon Twp Clinton $48,471 $0 $0 $48,471 $49,277 $0 $49,277 $806 1.7%
191110 Olive Twp Clinton $213,931 $0 $0 $213,931 $217,489 $0 $217,489 $3,558 1.7%
191120 Ovid Twp Clinton $189,912 $0 $0 $189,912 $193,069 $0 $193,069 $3,157 1.7%
191130 Riley Twp Clinton $174,877 $0 $0 $174,877 $177,785 $0 $177,785 $2,908 1.7%
191140 Victor Twp Clinton $298,952 $0 $0 $298,952 $303,922 $0 $303,922 $4,970 1.7%
191150 Watertown Twp Clinton $417,841 $0 $0 $417,841 $424,788 $0 $424,788 $6,947 1.7%
191160 Westphalia Twp Clinton $124,592 $0 $0 $124,592 $126,663 $0 $126,663 $2,071 1.7%
192010 Dewitt City Clinton $389,415 $19,564 $3,641 $412,620 $395,889 $23,739 $419,628 $7,008 1.7%
192020 East Lansing City Clinton $170,126 $0 $0 $170,126 $172,954 $0 $172,954 $2,828 1.7%
192029 Ovid City Clinton $137,984 $23,720 $1,295 $162,999 $140,278 $25,590 $165,868 $2,869 1.8%
September 30, 2019 FY 2019 Actuals and FY 2020 Projected - 2019 P.A. 56 - May Consensus Page 32 of 144
Prepared by the Revenue Sharing and Grants Division, Michigan Department of Treasury

Constitutional and Statutory Revenue Sharing Projections FY 2019 Actuals and FY 2020 Projected - 2019 P.A. 56 - May Consensus
Revshare Unit FY 2019 Actuals FY 2020 Projected
Code Local Unit Name Type County Const CVTRS Supple Total Const CVTRS Total $ Chg % Chg
192030 St Johns City Clinton $671,950 $102,905 $6,283 $781,138 $683,123 $111,699 $794,822 $13,684 1.8%
193010 Eagle Vil Clinton $10,627 $0 $0 $10,627 $10,804 $0 $10,804 $177 1.7%
193020 Elsie Vil Clinton $83,464 $21,541 $780 $105,785 $84,852 $23,208 $108,060 $2,275 2.2%
193030 Fowler Vil Clinton $104,373 $3,798 $976 $109,147 $106,109 $4,884 $110,993 $1,846 1.7%
193040 Hubbardston Vil Clinton $3,803 $0 $0 $3,803 $3,864 $0 $3,864 $61 1.6%
193050 Maple Rapids Vil Clinton $58,062 $12,055 $543 $70,660 $59,027 $12,888 $71,915 $1,255 1.8%
193070 Westphalia Vil Clinton $79,749 $1,295 $746 $81,790 $81,075 $2,111 $83,186 $1,396 1.7%
County Totals: $6,505,393 $253,519 $35,204 $6,794,116 $6,613,550 $295,760 $6,909,310 $115,194 1.7%
September 30, 2019 FY 2019 Actuals and FY 2020 Projected - 2019 P.A. 56 - May Consensus Page 33 of 144
Prepared by the Revenue Sharing and Grants Division, Michigan Department of Treasury
Constitutional and Statutory Revenue Sharing Projections FY 2019 Actuals and FY 2020 Projected - 2019 P.A. 56 - May Consensus
Revshare Unit FY 2019 Actuals FY 2020 Projected
Code Local Unit Name Type County Const CVTRS Supple Total Const CVTRS Total $ Chg % Chg
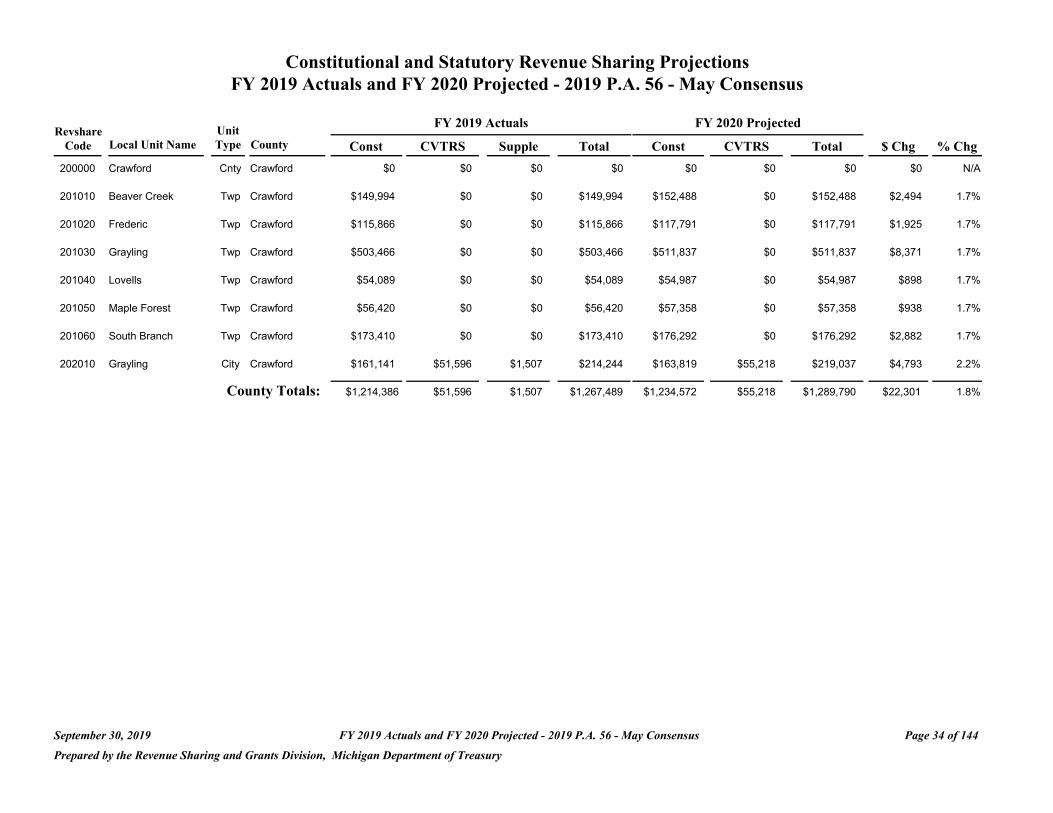
200000 Crawford Cnty Crawford $0 $0 $0 $0 $0 $0 $0 $0 N/A
201010 Beaver Creek Twp Crawford $149,994 $0 $0 $149,994 $152,488 $0 $152,488 $2,494 1.7%
201020 Frederic Twp Crawford $115,866 $0 $0 $115,866 $117,791 $0 $117,791 $1,925 1.7%
201030 Grayling Twp Crawford $503,466 $0 $0 $503,466 $511,837 $0 $511,837 $8,371 1.7%
201040 Lovells Twp Crawford $54,089 $0 $0 $54,089 $54,987 $0 $54,987 $898 1.7%
201050 Maple Forest Twp Crawford $56,420 $0 $0 $56,420 $57,358 $0 $57,358 $938 1.7%
201060 South Branch Twp Crawford $173,410 $0 $0 $173,410 $176,292 $0 $176,292 $2,882 1.7%
202010 Grayling City Crawford $161,141 $51,596 $1,507 $214,244 $163,819 $55,218 $219,037 $4,793 2.2%
County Totals: $1,214,386 $51,596 $1,507 $1,267,489 $1,234,572 $55,218 $1,289,790 $22,301 1.8%
September 30, 2019 FY 2019 Actuals and FY 2020 Projected - 2019 P.A. 56 - May Consensus Page 34 of 144
Prepared by the Revenue Sharing and Grants Division, Michigan Department of Treasury
Constitutional and Statutory Revenue Sharing Projections FY 2019 Actuals and FY 2020 Projected - 2019 P.A. 56 - May Consensus
Revshare Unit FY 2019 Actuals FY 2020 Projected
Code Local Unit Name Type County Const CVTRS Supple Total Const CVTRS Total $ Chg % Chg
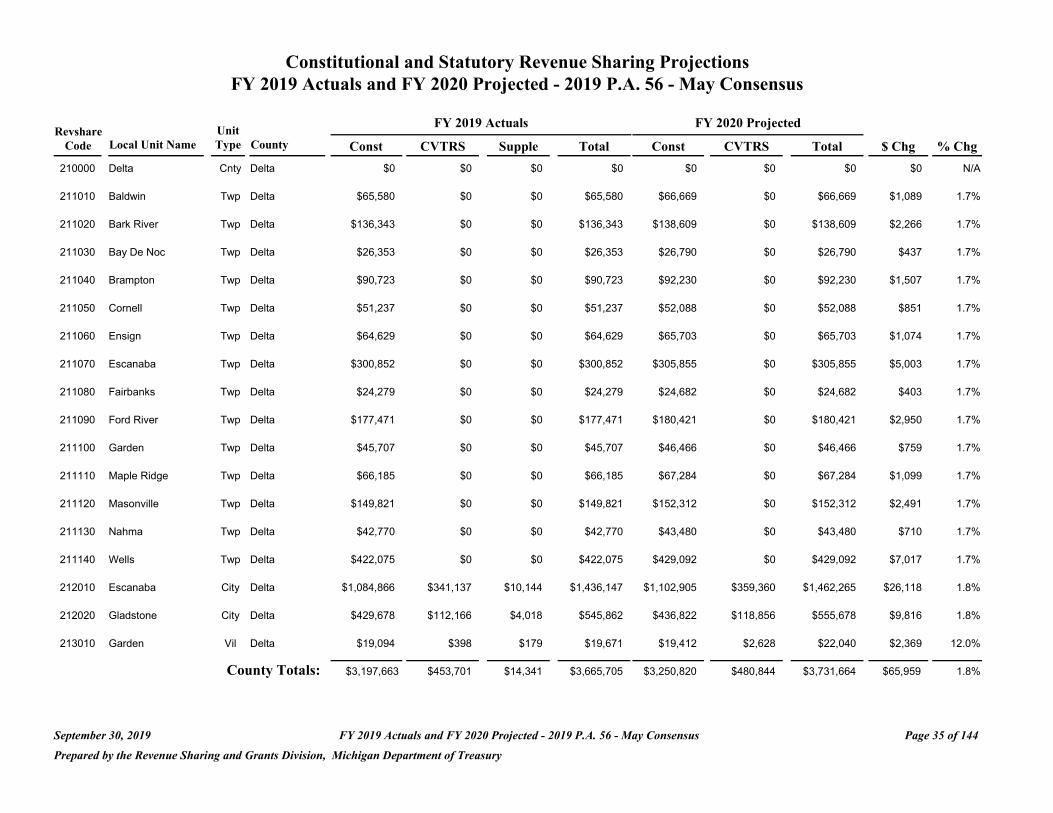
210000 Delta Cnty Delta $0 $0 $0 $0 $0 $0 $0 $0 N/A
211010 Baldwin Twp Delta $65,580 $0 $0 $65,580 $66,669 $0 $66,669 $1,089 1.7%
211020 Bark River Twp Delta $136,343 $0 $0 $136,343 $138,609 $0 $138,609 $2,266 1.7%
211030 Bay De Noc Twp Delta $26,353 $0 $0 $26,353 $26,790 $0 $26,790 $437 1.7%
211040 Brampton Twp Delta $90,723 $0 $0 $90,723 $92,230 $0 $92,230 $1,507 1.7%
211050 Cornell Twp Delta $51,237 $0 $0 $51,237 $52,088 $0 $52,088 $851 1.7%
211060 Ensign Twp Delta $64,629 $0 $0 $64,629 $65,703 $0 $65,703 $1,074 1.7%
211070 Escanaba Twp Delta $300,852 $0 $0 $300,852 $305,855 $0 $305,855 $5,003 1.7%
211080 Fairbanks Twp Delta $24,279 $0 $0 $24,279 $24,682 $0 $24,682 $403 1.7%
211090 Ford River Twp Delta $177,471 $0 $0 $177,471 $180,421 $0 $180,421 $2,950 1.7%
211100 Garden Twp Delta $45,707 $0 $0 $45,707 $46,466 $0 $46,466 $759 1.7%
211110 Maple Ridge Twp Delta $66,185 $0 $0 $66,185 $67,284 $0 $67,284 $1,099 1.7%
211120 Masonville Twp Delta $149,821 $0 $0 $149,821 $152,312 $0 $152,312 $2,491 1.7%
211130 Nahma Twp Delta $42,770 $0 $0 $42,770 $43,480 $0 $43,480 $710 1.7%
211140 Wells Twp Delta $422,075 $0 $0 $422,075 $429,092 $0 $429,092 $7,017 1.7%
212010 Escanaba City Delta $1,084,866 $341,137 $10,144 $1,436,147 $1,102,905 $359,360 $1,462,265 $26,118 1.8%
212020 Gladstone City Delta $429,678 $112,166 $4,018 $545,862 $436,822 $118,856 $555,678 $9,816 1.8%
213010 Garden Vil Delta $19,094 $398 $179 $19,671 $19,412 $2,628 $22,040 $2,369 12.0%
County Totals: $3,197,663 $453,701 $14,341 $3,665,705 $3,250,820 $480,844 $3,731,664 $65,959 1.8%
September 30, 2019 FY 2019 Actuals and FY 2020 Projected - 2019 P.A. 56 - May Consensus Page 35 of 144
Prepared by the Revenue Sharing and Grants Division, Michigan Department of Treasury
Constitutional and Statutory Revenue Sharing Projections FY 2019 Actuals and FY 2020 Projected - 2019 P.A. 56 - May Consensus
Revshare Unit FY 2019 Actuals FY 2020 Projected
Code Local Unit Name Type County Const CVTRS Supple Total Const CVTRS Total $ Chg % Chg
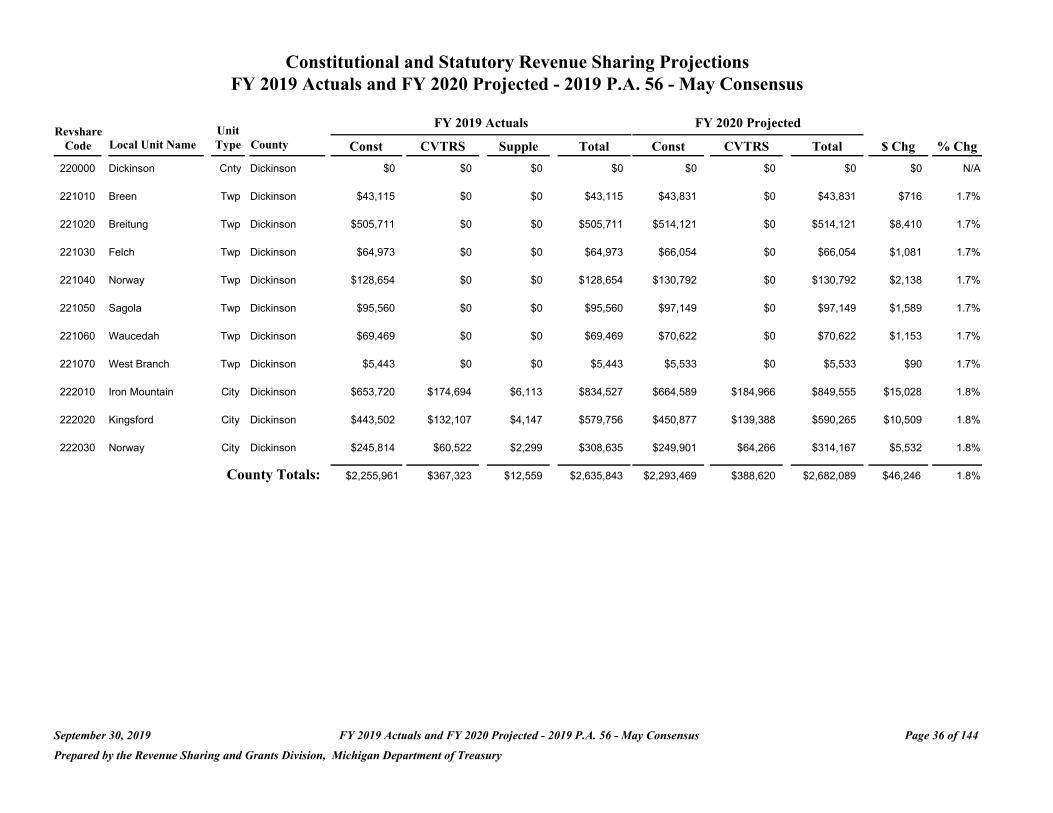
220000 Dickinson Cnty Dickinson $0 $0 $0 $0 $0 $0 $0 $0 N/A
221010 Breen Twp Dickinson $43,115 $0 $0 $43,115 $43,831 $0 $43,831 $716 1.7%
221020 Breitung Twp Dickinson $505,711 $0 $0 $505,711 $514,121 $0 $514,121 $8,410 1.7%
221030 Felch Twp Dickinson $64,973 $0 $0 $64,973 $66,054 $0 $66,054 $1,081 1.7%
221040 Norway Twp Dickinson $128,654 $0 $0 $128,654 $130,792 $0 $130,792 $2,138 1.7%
221050 Sagola Twp Dickinson $95,560 $0 $0 $95,560 $97,149 $0 $97,149 $1,589 1.7%
221060 Waucedah Twp Dickinson $69,469 $0 $0 $69,469 $70,622 $0 $70,622 $1,153 1.7%
221070 West Branch Twp Dickinson $5,443 $0 $0 $5,443 $5,533 $0 $5,533 $90 1.7%
222010 Iron Mountain City Dickinson $653,720 $174,694 $6,113 $834,527 $664,589 $184,966 $849,555 $15,028 1.8%
222020 Kingsford City Dickinson $443,502 $132,107 $4,147 $579,756 $450,877 $139,388 $590,265 $10,509 1.8%
222030 Norway City Dickinson $245,814 $60,522 $2,299 $308,635 $249,901 $64,266 $314,167 $5,532 1.8%
County Totals: $2,255,961 $367,323 $12,559 $2,635,843 $2,293,469 $388,620 $2,682,089 $46,246 1.8%
September 30, 2019 FY 2019 Actuals and FY 2020 Projected - 2019 P.A. 56 - May Consensus Page 36 of 144
Prepared by the Revenue Sharing and Grants Division, Michigan Department of Treasury

Constitutional and Statutory Revenue Sharing Projections FY 2019 Actuals and FY 2020 Projected - 2019 P.A. 56 - May Consensus
FY 2019 Actuals FY 2020 Projected Revshare Unit
Code Local Unit Name Type County Const CVTRS Supple Total Const CVTRS Total $ Chg % Chg
192025 Grand Ledge City Eaton $172 $0 $0 $172 $175 $0 $175 $3 1.7%
230000 Eaton Cnty Eaton $0 $0 $0 $0 $0 $0 $0 $0 N/A
231010 Bellevue Twp Eaton $161,398 $0 $0 $161,398 $164,083 $0 $164,083 $2,685 1.7%
231020 Benton Twp Eaton $241,581 $0 $0 $241,581 $245,597 $0 $245,597 $4,016 1.7%
231030 Brookfield Twp Eaton $132,801 $0 $0 $132,801 $135,008 $0 $135,008 $2,207 1.7%
231040 Carmel Twp Eaton $246,679 $0 $0 $246,679 $250,780 $0 $250,780 $4,101 1.7%
231050 Chester Twp Eaton $150,944 $0 $0 $150,944 $153,454 $0 $153,454 $2,510 1.7%
231060 Delta Twp Eaton $2,800,122 $85,826 $26,183 $2,912,131 $2,846,682 $114,585 $2,961,267 $49,136 1.7%
231070 Eaton Twp Eaton $351,915 $0 $0 $351,915 $357,767 $0 $357,767 $5,852 1.7%
231080 Eaton Rapids Twp Eaton $355,372 $0 $0 $355,372 $361,281 $0 $361,281 $5,909 1.7%
231090 Hamlin Twp Eaton $288,842 $0 $0 $288,842 $293,645 $0 $293,645 $4,803 1.7%
231100 Kalamo Twp Eaton $159,153 $0 $0 $159,153 $161,799 $0 $161,799 $2,646 1.7%
231110 Oneida Twp Eaton $333,945 $0 $0 $333,945 $339,497 $0 $339,497 $5,552 1.7%
231120 Roxand Twp Eaton $111,890 $0 $0 $111,890 $113,751 $0 $113,751 $1,861 1.7%
231130 Sunfield Twp Eaton $122,604 $0 $0 $122,604 $124,643 $0 $124,643 $2,039 1.7%
231140 Vermontville Twp Eaton $111,804 $0 $0 $111,804 $113,663 $0 $113,663 $1,859 1.7%
231150 Walton Twp Eaton $195,788 $0 $0 $195,788 $199,042 $0 $199,042 $3,254 1.7%
231160 Windsor Twp Eaton $484,197 $0 $0 $484,197 $492,249 $0 $492,249 $8,052 1.7%
232010 Charlotte City Eaton $775,113 $149,665 $7,248 $932,026 $788,002 $160,522 $948,524 $16,498 1.8%
232020 Eaton Rapids City Eaton $450,501 $42,743 $4,213 $497,457 $457,991 $48,036 $506,027 $8,570 1.7%
September 30, 2019 FY 2019 Actuals and FY 2020 Projected - 2019 P.A. 56 - May Consensus Page 37 of 144
Prepared by the Revenue Sharing and Grants Division, Michigan Department of Treasury

Constitutional and Statutory Revenue Sharing Projections FY 2019 Actuals and FY 2020 Projected - 2019 P.A. 56 - May Consensus
Revshare Unit FY 2019 Actuals FY 2020 Projected
Code Local Unit Name Type County Const CVTRS Supple Total Const CVTRS Total $ Chg % Chg
232030 Grand Ledge City Eaton $672,553 $97,928 $6,291 $776,772 $683,737 $106,616 $790,353 $13,581 1.7%
232040 Lansing City Eaton $409,028 $0 $0 $409,028 $415,829 $0 $415,829 $6,801 1.7%
232050 Olivet City Eaton $138,676 $44,586 $1,297 $184,559 $140,981 $46,938 $187,919 $3,360 1.8%
232060 Potterville City Eaton $226,115 $35,803 $2,114 $264,032 $229,874 $38,789 $268,663 $4,631 1.8%
233010 Bellevue Vil Eaton $110,768 $29,898 $1,036 $141,702 $112,609 $31,645 $144,254 $2,552 1.8%
233020 Dimondale Vil Eaton $106,620 $2,697 $997 $110,314 $108,393 $3,827 $112,220 $1,906 1.7%
233030 Mulliken Vil Eaton $47,780 $2,329 $447 $50,556 $48,574 $2,840 $51,414 $858 1.7%
233040 Sunfield Vil Eaton $49,940 $7,026 $467 $57,433 $50,770 $7,665 $58,435 $1,002 1.7%
233050 Vermontville Vil Eaton $65,580 $17,963 $613 $84,156 $66,669 $19,003 $85,672 $1,516 1.8%
County Totals: $9,301,881 $516,464 $50,906 $9,869,251 $9,456,545 $580,466 $10,037,011 $167,760 1.7%
September 30, 2019 FY 2019 Actuals and FY 2020 Projected - 2019 P.A. 56 - May Consensus Page 38 of 144
Prepared by the Revenue Sharing and Grants Division, Michigan Department of Treasury
Constitutional and Statutory Revenue Sharing Projections FY 2019 Actuals and FY 2020 Projected - 2019 P.A. 56 - May Consensus
FY 2019 Actuals FY 2020 Projected Revshare Unit
Code Local Unit Name Type County Const CVTRS Supple Total Const CVTRS Total $ Chg % Chg
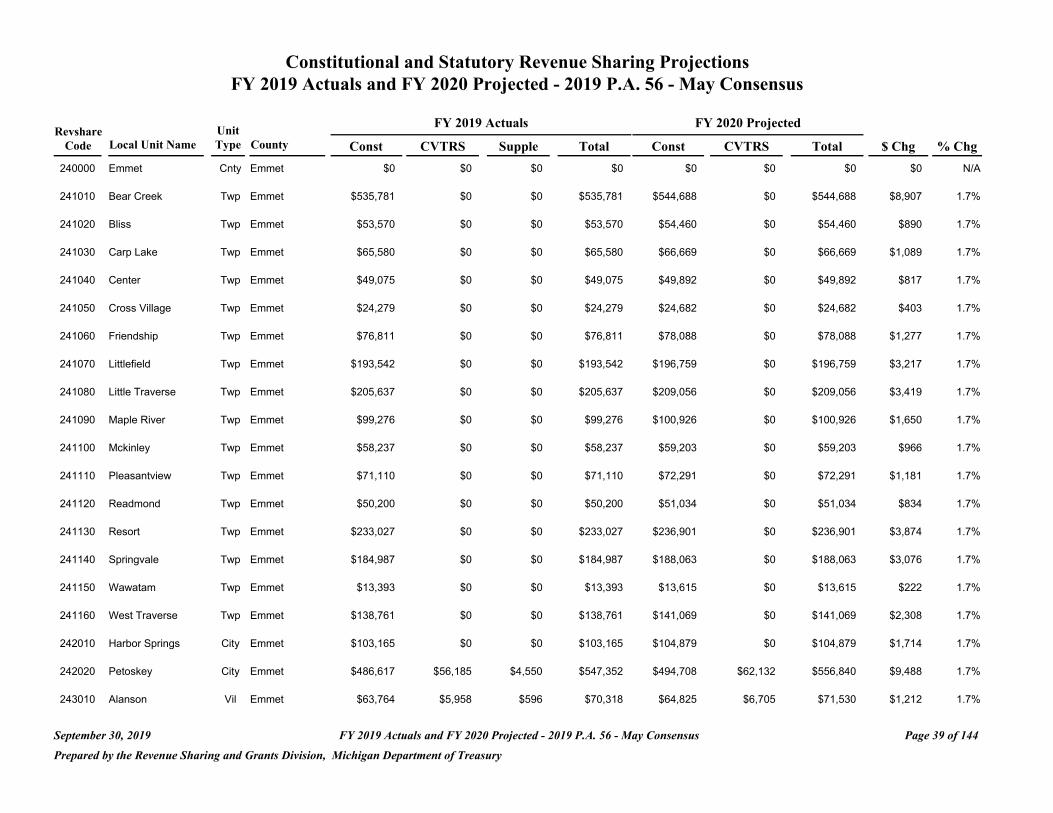
240000 Emmet Cnty Emmet $0 $0 $0 $0 $0 $0 $0 $0 N/A
241010 Bear Creek Twp Emmet $535,781 $0 $0 $535,781 $544,688 $0 $544,688 $8,907 1.7%
241020 Bliss Twp Emmet $53,570 $0 $0 $53,570 $54,460 $0 $54,460 $890 1.7%
241030 Carp Lake Twp Emmet $65,580 $0 $0 $65,580 $66,669 $0 $66,669 $1,089 1.7%
241040 Center Twp Emmet $49,075 $0 $0 $49,075 $49,892 $0 $49,892 $817 1.7%
241050 Cross Village Twp Emmet $24,279 $0 $0 $24,279 $24,682 $0 $24,682 $403 1.7%
241060 Friendship Twp Emmet $76,811 $0 $0 $76,811 $78,088 $0 $78,088 $1,277 1.7%
241070 Littlefield Twp Emmet $193,542 $0 $0 $193,542 $196,759 $0 $196,759 $3,217 1.7%
241080 Little Traverse Twp Emmet $205,637 $0 $0 $205,637 $209,056 $0 $209,056 $3,419 1.7%
241090 Maple River Twp Emmet $99,276 $0 $0 $99,276 $100,926 $0 $100,926 $1,650 1.7%
241100 Mckinley Twp Emmet $58,237 $0 $0 $58,237 $59,203 $0 $59,203 $966 1.7%
241110 Pleasantview Twp Emmet $71,110 $0 $0 $71,110 $72,291 $0 $72,291 $1,181 1.7%
241120 Readmond Twp Emmet $50,200 $0 $0 $50,200 $51,034 $0 $51,034 $834 1.7%
241130 Resort Twp Emmet $233,027 $0 $0 $233,027 $236,901 $0 $236,901 $3,874 1.7%
241140 Springvale Twp Emmet $184,987 $0 $0 $184,987 $188,063 $0 $188,063 $3,076 1.7%
241150 Wawatam Twp Emmet $13,393 $0 $0 $13,393 $13,615 $0 $13,615 $222 1.7%
241160 West Traverse Twp Emmet $138,761 $0 $0 $138,761 $141,069 $0 $141,069 $2,308 1.7%
242010 Harbor Springs City Emmet $103,165 $0 $0 $103,165 $104,879 $0 $104,879 $1,714 1.7%
242020 Petoskey City Emmet $486,617 $56,185 $4,550 $547,352 $494,708 $62,132 $556,840 $9,488 1.7%
243010 Alanson Vil Emmet $63,764 $5,958 $596 $70,318 $64,825 $6,705 $71,530 $1,212 1.7%
September 30, 2019 FY 2019 Actuals and FY 2020 Projected - 2019 P.A. 56 - May Consensus Page 39 of 144
Prepared by the Revenue Sharing and Grants Division, Michigan Department of Treasury

Constitutional and Statutory Revenue Sharing Projections FY 2019 Actuals and FY 2020 Projected - 2019 P.A. 56 - May Consensus
Revshare Code Local Unit Name
243020 Mackinaw City
Unit Type County
Vil Emmet
Const $43,719
FY 2019 Actuals
CVTRS Supple
$0 $0
Total $43,719
FY 2020 Projected
Const CVTRS
$44,446 $0
Total $44,446
$ Chg
$727
% Chg
1.7%
243030 Pellston Vil Emmet $71,023 $18,970 $664 $90,657 $72,203 $20,086 $92,289 $1,632 1.8%
County Totals: $2,821,554 $81,113 $5,810 $2,908,477 $2,868,457 $88,923 $2,957,380 $48,903 1.7%
September 30, 2019 FY 2019 Actuals and FY 2020 Projected - 2019 P.A. 56 - May Consensus Page 40 of 144
Prepared by the Revenue Sharing and Grants Division, Michigan Department of Treasury
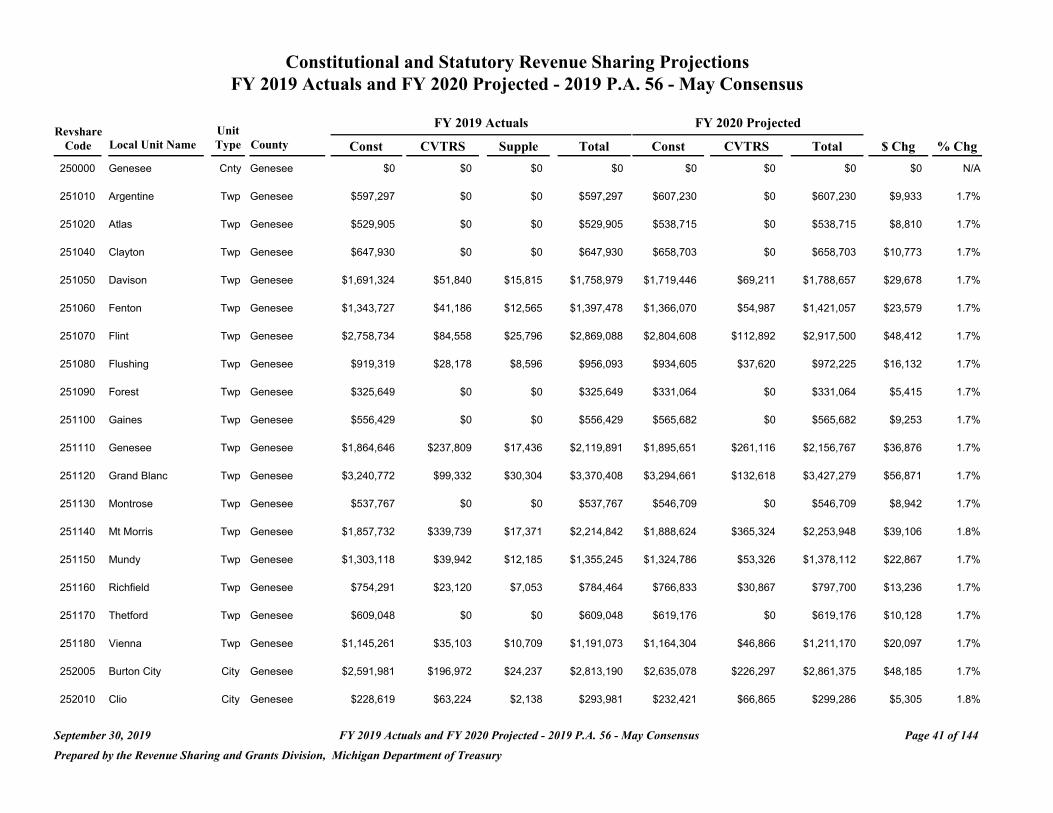
Constitutional and Statutory Revenue Sharing Projections FY 2019 Actuals and FY 2020 Projected - 2019 P.A. 56 - May Consensus
FY 2019 Actuals FY 2020 Projected Revshare Unit
Code Local Unit Name Type County Const CVTRS Supple Total Const CVTRS Total $ Chg % Chg
250000 Genesee Cnty Genesee $0 $0 $0 $0 $0 $0 $0 $0 N/A
251010 Argentine Twp Genesee $597,297 $0 $0 $597,297 $607,230 $0 $607,230 $9,933 1.7%
251020 Atlas Twp Genesee $529,905 $0 $0 $529,905 $538,715 $0 $538,715 $8,810 1.7%
251040 Clayton Twp Genesee $647,930 $0 $0 $647,930 $658,703 $0 $658,703 $10,773 1.7%
251050 Davison Twp Genesee $1,691,324 $51,840 $15,815 $1,758,979 $1,719,446 $69,211 $1,788,657 $29,678 1.7%
251060 Fenton Twp Genesee $1,343,727 $41,186 $12,565 $1,397,478 $1,366,070 $54,987 $1,421,057 $23,579 1.7%
251070 Flint Twp Genesee $2,758,734 $84,558 $25,796 $2,869,088 $2,804,608 $112,892 $2,917,500 $48,412 1.7%
251080 Flushing Twp Genesee $919,319 $28,178 $8,596 $956,093 $934,605 $37,620 $972,225 $16,132 1.7%
251090 Forest Twp Genesee $325,649 $0 $0 $325,649 $331,064 $0 $331,064 $5,415 1.7%
251100 Gaines Twp Genesee $556,429 $0 $0 $556,429 $565,682 $0 $565,682 $9,253 1.7%
251110 Genesee Twp Genesee $1,864,646 $237,809 $17,436 $2,119,891 $1,895,651 $261,116 $2,156,767 $36,876 1.7%
251120 Grand Blanc Twp Genesee $3,240,772 $99,332 $30,304 $3,370,408 $3,294,661 $132,618 $3,427,279 $56,871 1.7%
251130 Montrose Twp Genesee $537,767 $0 $0 $537,767 $546,709 $0 $546,709 $8,942 1.7%
251140 Mt Morris Twp Genesee $1,857,732 $339,739 $17,371 $2,214,842 $1,888,624 $365,324 $2,253,948 $39,106 1.8%
251150 Mundy Twp Genesee $1,303,118 $39,942 $12,185 $1,355,245 $1,324,786 $53,326 $1,378,112 $22,867 1.7%
251160 Richfield Twp Genesee $754,291 $23,120 $7,053 $784,464 $766,833 $30,867 $797,700 $13,236 1.7%
251170 Thetford Twp Genesee $609,048 $0 $0 $609,048 $619,176 $0 $619,176 $10,128 1.7%
251180 Vienna Twp Genesee $1,145,261 $35,103 $10,709 $1,191,073 $1,164,304 $46,866 $1,211,170 $20,097 1.7%
252005 Burton City City Genesee $2,591,981 $196,972 $24,237 $2,813,190 $2,635,078 $226,297 $2,861,375 $48,185 1.7%
252010 Clio City Genesee $228,619 $63,224 $2,138 $293,981 $232,421 $66,865 $299,286 $5,305 1.8%
September 30, 2019 FY 2019 Actuals and FY 2020 Projected - 2019 P.A. 56 - May Consensus Page 41 of 144
Prepared by the Revenue Sharing and Grants Division, Michigan Department of Treasury
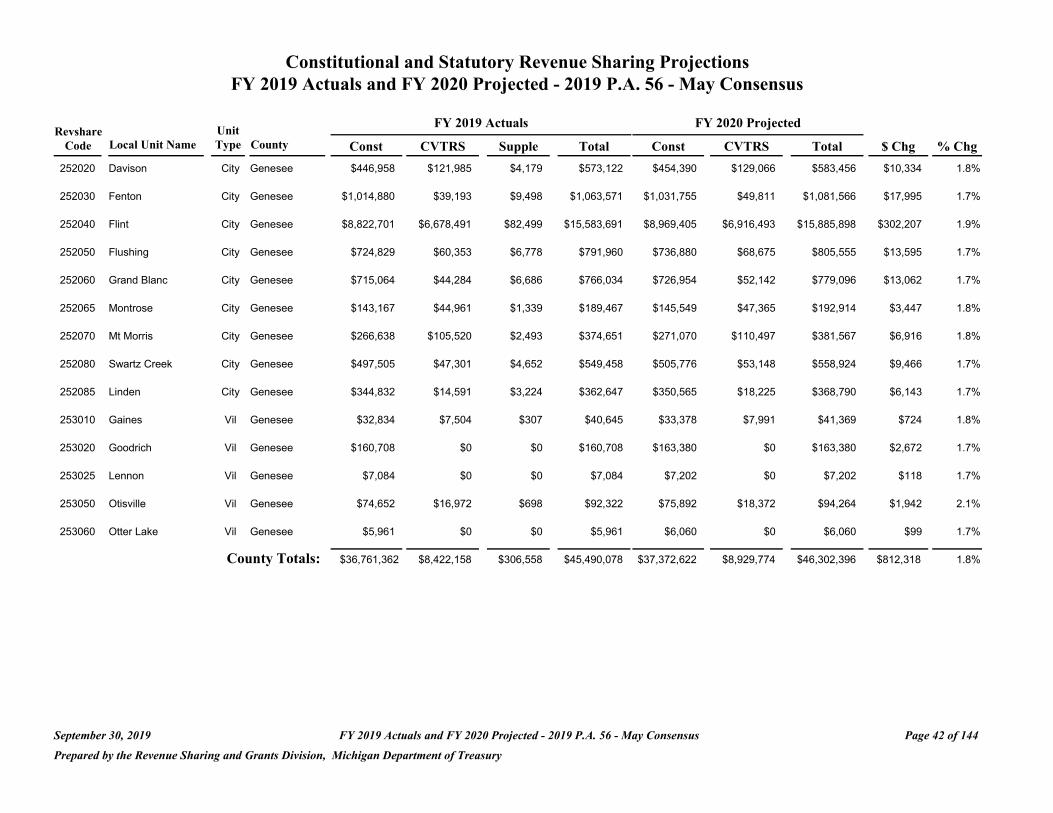
Constitutional and Statutory Revenue Sharing Projections FY 2019 Actuals and FY 2020 Projected - 2019 P.A. 56 - May Consensus
Revshare Unit FY 2019 Actuals FY 2020 Projected
Code Local Unit Name Type County Const CVTRS Supple Total Const CVTRS Total $ Chg % Chg
252020 Davison City Genesee $446,958 $121,985 $4,179 $573,122 $454,390 $129,066 $583,456 $10,334 1.8%
252030 Fenton City Genesee $1,014,880 $39,193 $9,498 $1,063,571 $1,031,755 $49,811 $1,081,566 $17,995 1.7%
252040 Flint City Genesee $8,822,701 $6,678,491 $82,499 $15,583,691 $8,969,405 $6,916,493 $15,885,898 $302,207 1.9%
252050 Flushing City Genesee $724,829 $60,353 $6,778 $791,960 $736,880 $68,675 $805,555 $13,595 1.7%
252060 Grand Blanc City Genesee $715,064 $44,284 $6,686 $766,034 $726,954 $52,142 $779,096 $13,062 1.7%
252065 Montrose City Genesee $143,167 $44,961 $1,339 $189,467 $145,549 $47,365 $192,914 $3,447 1.8%
252070 Mt Morris City Genesee $266,638 $105,520 $2,493 $374,651 $271,070 $110,497 $381,567 $6,916 1.8%
252080 Swartz Creek City Genesee $497,505 $47,301 $4,652 $549,458 $505,776 $53,148 $558,924 $9,466 1.7%
252085 Linden City Genesee $344,832 $14,591 $3,224 $362,647 $350,565 $18,225 $368,790 $6,143 1.7%
253010 Gaines Vil Genesee $32,834 $7,504 $307 $40,645 $33,378 $7,991 $41,369 $724 1.8%
253020 Goodrich Vil Genesee $160,708 $0 $0 $160,708 $163,380 $0 $163,380 $2,672 1.7%
253025 Lennon Vil Genesee $7,084 $0 $0 $7,084 $7,202 $0 $7,202 $118 1.7%
253050 Otisville Vil Genesee $74,652 $16,972 $698 $92,322 $75,892 $18,372 $94,264 $1,942 2.1%
253060 Otter Lake Vil Genesee $5,961 $0 $0 $5,961 $6,060 $0 $6,060 $99 1.7%
County Totals: $36,761,362 $8,422,158 $306,558 $45,490,078 $37,372,622 $8,929,774 $46,302,396 $812,318 1.8%
September 30, 2019 FY 2019 Actuals and FY 2020 Projected - 2019 P.A. 56 - May Consensus Page 42 of 144
Prepared by the Revenue Sharing and Grants Division, Michigan Department of Treasury
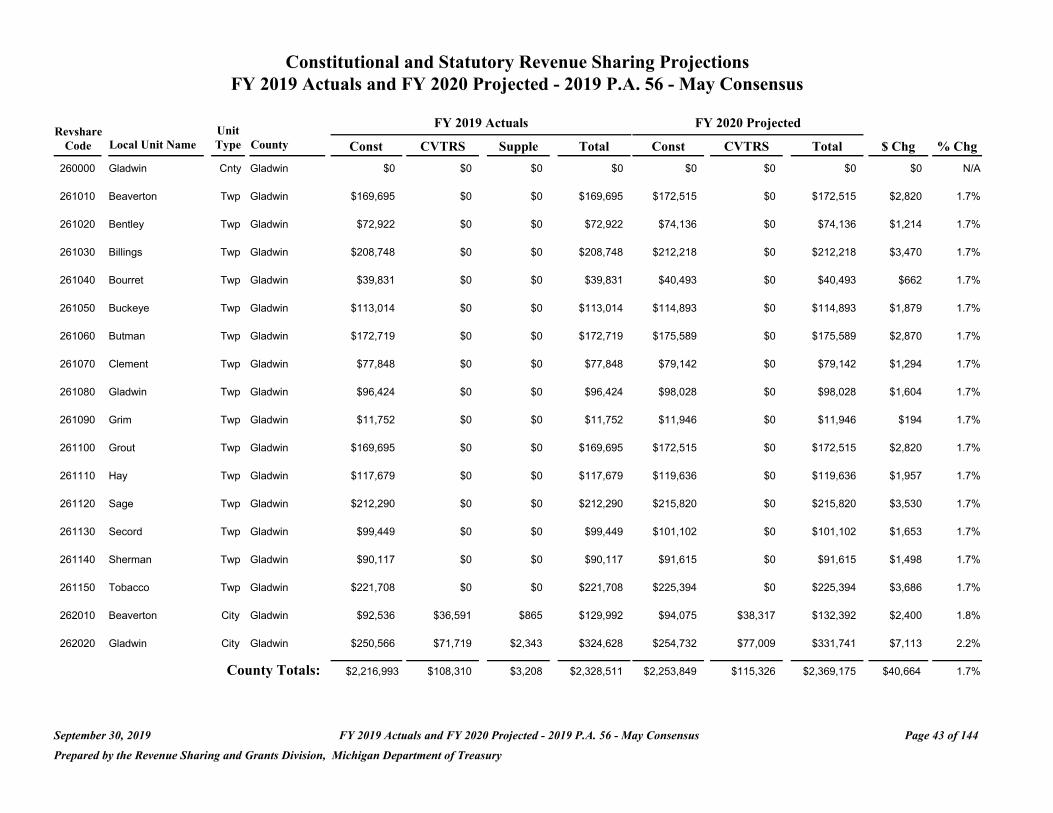
Constitutional and Statutory Revenue Sharing Projections FY 2019 Actuals and FY 2020 Projected - 2019 P.A. 56 - May Consensus
Revshare Unit FY 2019 Actuals FY 2020 Projected
Code Local Unit Name Type County Const CVTRS Supple Total Const CVTRS Total $ Chg % Chg
260000 Gladwin Cnty Gladwin $0 $0 $0 $0 $0 $0 $0 $0 N/A
261010 Beaverton Twp Gladwin $169,695 $0 $0 $169,695 $172,515 $0 $172,515 $2,820 1.7%
261020 Bentley Twp Gladwin $72,922 $0 $0 $72,922 $74,136 $0 $74,136 $1,214 1.7%
261030 Billings Twp Gladwin $208,748 $0 $0 $208,748 $212,218 $0 $212,218 $3,470 1.7%
261040 Bourret Twp Gladwin $39,831 $0 $0 $39,831 $40,493 $0 $40,493 $662 1.7%
261050 Buckeye Twp Gladwin $113,014 $0 $0 $113,014 $114,893 $0 $114,893 $1,879 1.7%
261060 Butman Twp Gladwin $172,719 $0 $0 $172,719 $175,589 $0 $175,589 $2,870 1.7%
261070 Clement Twp Gladwin $77,848 $0 $0 $77,848 $79,142 $0 $79,142 $1,294 1.7%
261080 Gladwin Twp Gladwin $96,424 $0 $0 $96,424 $98,028 $0 $98,028 $1,604 1.7%
261090 Grim Twp Gladwin $11,752 $0 $0 $11,752 $11,946 $0 $11,946 $194 1.7%
261100 Grout Twp Gladwin $169,695 $0 $0 $169,695 $172,515 $0 $172,515 $2,820 1.7%
261110 Hay Twp Gladwin $117,679 $0 $0 $117,679 $119,636 $0 $119,636 $1,957 1.7%
261120 Sage Twp Gladwin $212,290 $0 $0 $212,290 $215,820 $0 $215,820 $3,530 1.7%
261130 Secord Twp Gladwin $99,449 $0 $0 $99,449 $101,102 $0 $101,102 $1,653 1.7%
261140 Sherman Twp Gladwin $90,117 $0 $0 $90,117 $91,615 $0 $91,615 $1,498 1.7%
261150 Tobacco Twp Gladwin $221,708 $0 $0 $221,708 $225,394 $0 $225,394 $3,686 1.7%
262010 Beaverton City Gladwin $92,536 $36,591 $865 $129,992 $94,075 $38,317 $132,392 $2,400 1.8%
262020 Gladwin City Gladwin $250,566 $71,719 $2,343 $324,628 $254,732 $77,009 $331,741 $7,113 2.2%
County Totals: $2,216,993 $108,310 $3,208 $2,328,511 $2,253,849 $115,326 $2,369,175 $40,664 1.7%
September 30, 2019 FY 2019 Actuals and FY 2020 Projected - 2019 P.A. 56 - May Consensus Page 43 of 144
Prepared by the Revenue Sharing and Grants Division, Michigan Department of Treasury
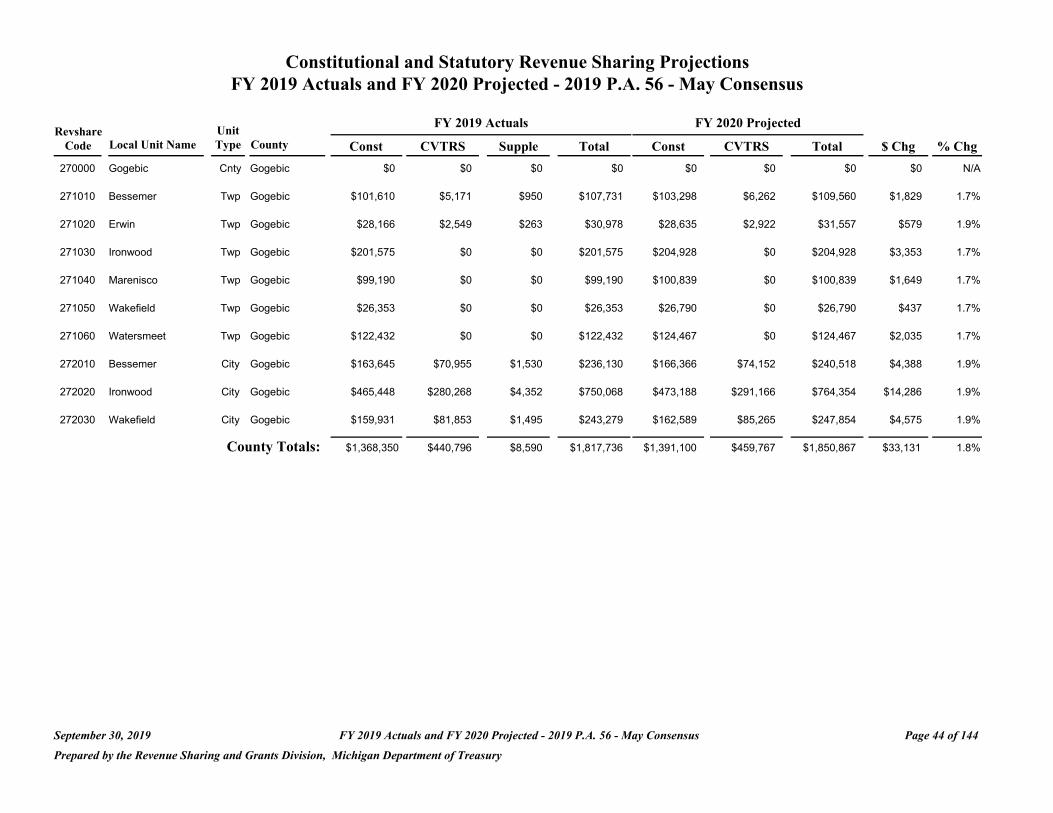
Constitutional and Statutory Revenue Sharing Projections FY 2019 Actuals and FY 2020 Projected - 2019 P.A. 56 - May Consensus
Revshare Unit FY 2019 Actuals FY 2020 Projected
Code Local Unit Name Type County Const CVTRS Supple Total Const CVTRS Total $ Chg % Chg
270000 Gogebic Cnty Gogebic $0 $0 $0 $0 $0 $0 $0 $0 N/A
271010 Bessemer Twp Gogebic $101,610 $5,171 $950 $107,731 $103,298 $6,262 $109,560 $1,829 1.7%
271020 Erwin Twp Gogebic $28,166 $2,549 $263 $30,978 $28,635 $2,922 $31,557 $579 1.9%
271030 Ironwood Twp Gogebic $201,575 $0 $0 $201,575 $204,928 $0 $204,928 $3,353 1.7%
271040 Marenisco Twp Gogebic $99,190 $0 $0 $99,190 $100,839 $0 $100,839 $1,649 1.7%
271050 Wakefield Twp Gogebic $26,353 $0 $0 $26,353 $26,790 $0 $26,790 $437 1.7%
271060 Watersmeet Twp Gogebic $122,432 $0 $0 $122,432 $124,467 $0 $124,467 $2,035 1.7%
272010 Bessemer City Gogebic $163,645 $70,955 $1,530 $236,130 $166,366 $74,152 $240,518 $4,388 1.9%
272020 Ironwood City Gogebic $465,448 $280,268 $4,352 $750,068 $473,188 $291,166 $764,354 $14,286 1.9%
272030 Wakefield City Gogebic $159,931 $81,853 $1,495 $243,279 $162,589 $85,265 $247,854 $4,575 1.9%
County Totals: $1,368,350 $440,796 $8,590 $1,817,736 $1,391,100 $459,767 $1,850,867 $33,131 1.8%
September 30, 2019 FY 2019 Actuals and FY 2020 Projected - 2019 P.A. 56 - May Consensus Page 44 of 144
Prepared by the Revenue Sharing and Grants Division, Michigan Department of Treasury
Constitutional and Statutory Revenue Sharing Projections FY 2019 Actuals and FY 2020 Projected - 2019 P.A. 56 - May Consensus
Revshare Unit FY 2019 Actuals FY 2020 Projected
Code Local Unit Name Type County Const CVTRS Supple Total Const CVTRS Total $ Chg % Chg
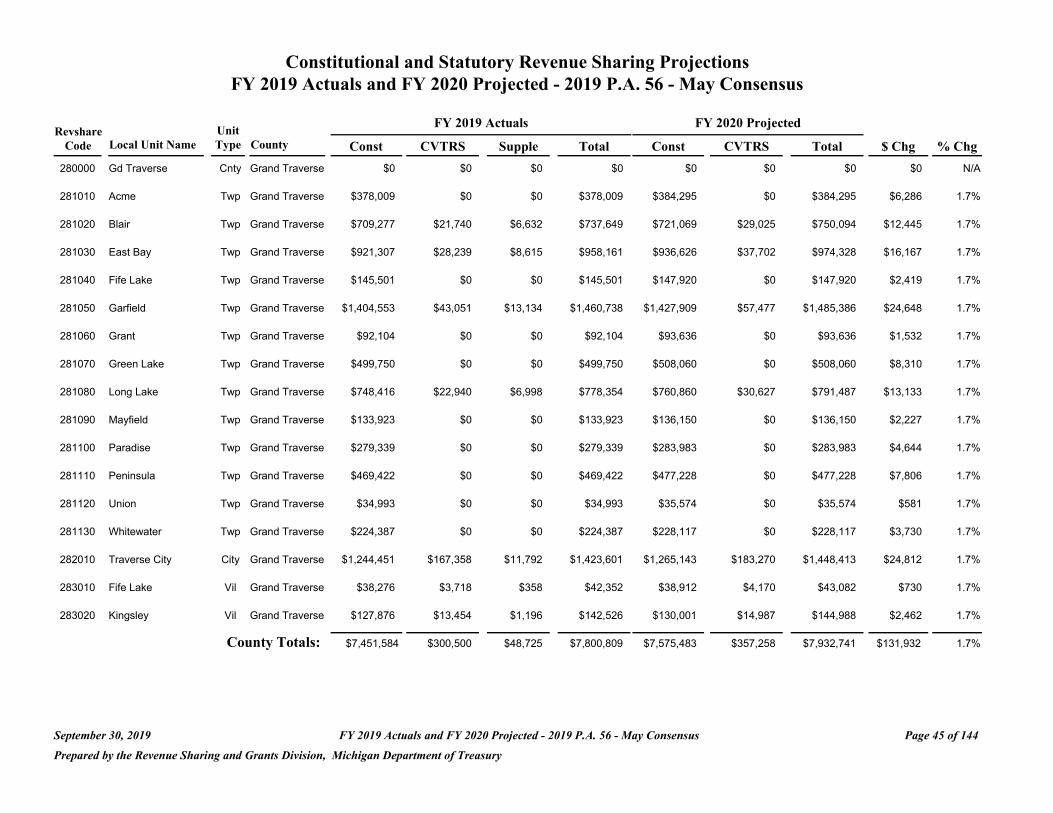
280000 Gd Traverse Cnty Grand Traverse $0 $0 $0 $0 $0 $0 $0 $0 N/A
281010 Acme Twp Grand Traverse $378,009 $0 $0 $378,009 $384,295 $0 $384,295 $6,286 1.7%
281020 Blair Twp Grand Traverse $709,277 $21,740 $6,632 $737,649 $721,069 $29,025 $750,094 $12,445 1.7%
281030 East Bay Twp Grand Traverse $921,307 $28,239 $8,615 $958,161 $936,626 $37,702 $974,328 $16,167 1.7%
281040 Fife Lake Twp Grand Traverse $145,501 $0 $0 $145,501 $147,920 $0 $147,920 $2,419 1.7%
281050 Garfield Twp Grand Traverse $1,404,553 $43,051 $13,134 $1,460,738 $1,427,909 $57,477 $1,485,386 $24,648 1.7%
281060 Grant Twp Grand Traverse $92,104 $0 $0 $92,104 $93,636 $0 $93,636 $1,532 1.7%
281070 Green Lake Twp Grand Traverse $499,750 $0 $0 $499,750 $508,060 $0 $508,060 $8,310 1.7%
281080 Long Lake Twp Grand Traverse $748,416 $22,940 $6,998 $778,354 $760,860 $30,627 $791,487 $13,133 1.7%
281090 Mayfield Twp Grand Traverse $133,923 $0 $0 $133,923 $136,150 $0 $136,150 $2,227 1.7%
281100 Paradise Twp Grand Traverse $279,339 $0 $0 $279,339 $283,983 $0 $283,983 $4,644 1.7%
281110 Peninsula Twp Grand Traverse $469,422 $0 $0 $469,422 $477,228 $0 $477,228 $7,806 1.7%
281120 Union Twp Grand Traverse $34,993 $0 $0 $34,993 $35,574 $0 $35,574 $581 1.7%
281130 Whitewater Twp Grand Traverse $224,387 $0 $0 $224,387 $228,117 $0 $228,117 $3,730 1.7%
282010 Traverse City City Grand Traverse $1,244,451 $167,358 $11,792 $1,423,601 $1,265,143 $183,270 $1,448,413 $24,812 1.7%
283010 Fife Lake Vil Grand Traverse $38,276 $3,718 $358 $42,352 $38,912 $4,170 $43,082 $730 1.7%
283020 Kingsley Vil Grand Traverse $127,876 $13,454 $1,196 $142,526 $130,001 $14,987 $144,988 $2,462 1.7%
County Totals: $7,451,584 $300,500 $48,725 $7,800,809 $7,575,483 $357,258 $7,932,741 $131,932 1.7%
September 30, 2019 FY 2019 Actuals and FY 2020 Projected - 2019 P.A. 56 - May Consensus Page 45 of 144
Prepared by the Revenue Sharing and Grants Division, Michigan Department of Treasury
Constitutional and Statutory Revenue Sharing Projections FY 2019 Actuals and FY 2020 Projected - 2019 P.A. 56 - May Consensus
FY 2019 Actuals FY 2020 Projected Revshare Unit
Code Local Unit Name Type County Const CVTRS Supple Total Const CVTRS Total $ Chg % Chg
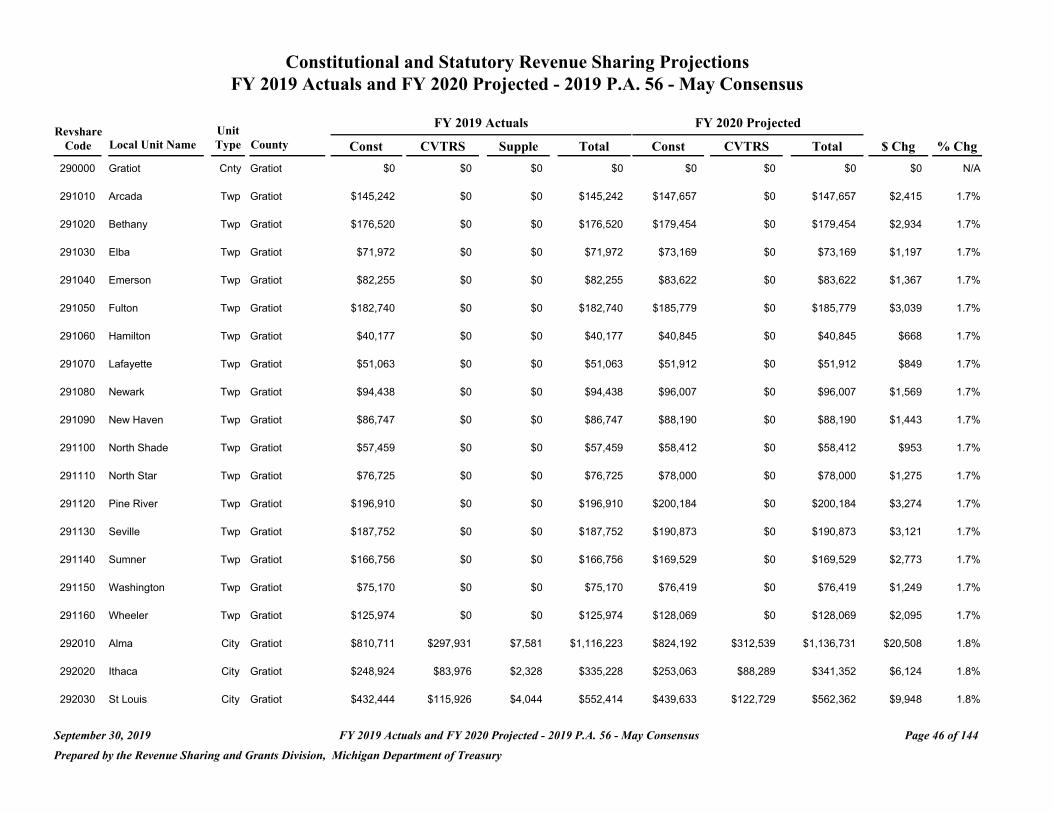
290000 Gratiot Cnty Gratiot $0 $0 $0 $0 $0 $0 $0 $0 N/A
291010 Arcada Twp Gratiot $145,242 $0 $0 $145,242 $147,657 $0 $147,657 $2,415 1.7%
291020 Bethany Twp Gratiot $176,520 $0 $0 $176,520 $179,454 $0 $179,454 $2,934 1.7%
291030 Elba Twp Gratiot $71,972 $0 $0 $71,972 $73,169 $0 $73,169 $1,197 1.7%
291040 Emerson Twp Gratiot $82,255 $0 $0 $82,255 $83,622 $0 $83,622 $1,367 1.7%
291050 Fulton Twp Gratiot $182,740 $0 $0 $182,740 $185,779 $0 $185,779 $3,039 1.7%
291060 Hamilton Twp Gratiot $40,177 $0 $0 $40,177 $40,845 $0 $40,845 $668 1.7%
291070 Lafayette Twp Gratiot $51,063 $0 $0 $51,063 $51,912 $0 $51,912 $849 1.7%
291080 Newark Twp Gratiot $94,438 $0 $0 $94,438 $96,007 $0 $96,007 $1,569 1.7%
291090 New Haven Twp Gratiot $86,747 $0 $0 $86,747 $88,190 $0 $88,190 $1,443 1.7%
291100 North Shade Twp Gratiot $57,459 $0 $0 $57,459 $58,412 $0 $58,412 $953 1.7%
291110 North Star Twp Gratiot $76,725 $0 $0 $76,725 $78,000 $0 $78,000 $1,275 1.7%
291120 Pine River Twp Gratiot $196,910 $0 $0 $196,910 $200,184 $0 $200,184 $3,274 1.7%
291130 Seville Twp Gratiot $187,752 $0 $0 $187,752 $190,873 $0 $190,873 $3,121 1.7%
291140 Sumner Twp Gratiot $166,756 $0 $0 $166,756 $169,529 $0 $169,529 $2,773 1.7%
291150 Washington Twp Gratiot $75,170 $0 $0 $75,170 $76,419 $0 $76,419 $1,249 1.7%
291160 Wheeler Twp Gratiot $125,974 $0 $0 $125,974 $128,069 $0 $128,069 $2,095 1.7%
292010 Alma City Gratiot $810,711 $297,931 $7,581 $1,116,223 $824,192 $312,539 $1,136,731 $20,508 1.8%
292020 Ithaca City Gratiot $248,924 $83,976 $2,328 $335,228 $253,063 $88,289 $341,352 $6,124 1.8%
292030 St Louis City Gratiot $432,444 $115,926 $4,044 $552,414 $439,633 $122,729 $562,362 $9,948 1.8%
September 30, 2019 FY 2019 Actuals and FY 2020 Projected - 2019 P.A. 56 - May Consensus Page 46 of 144
Prepared by the Revenue Sharing and Grants Division, Michigan Department of Treasury
Constitutional and Statutory Revenue Sharing Projections FY 2019 Actuals and FY 2020 Projected - 2019 P.A. 56 - May Consensus
Revshare Code Local Unit Name
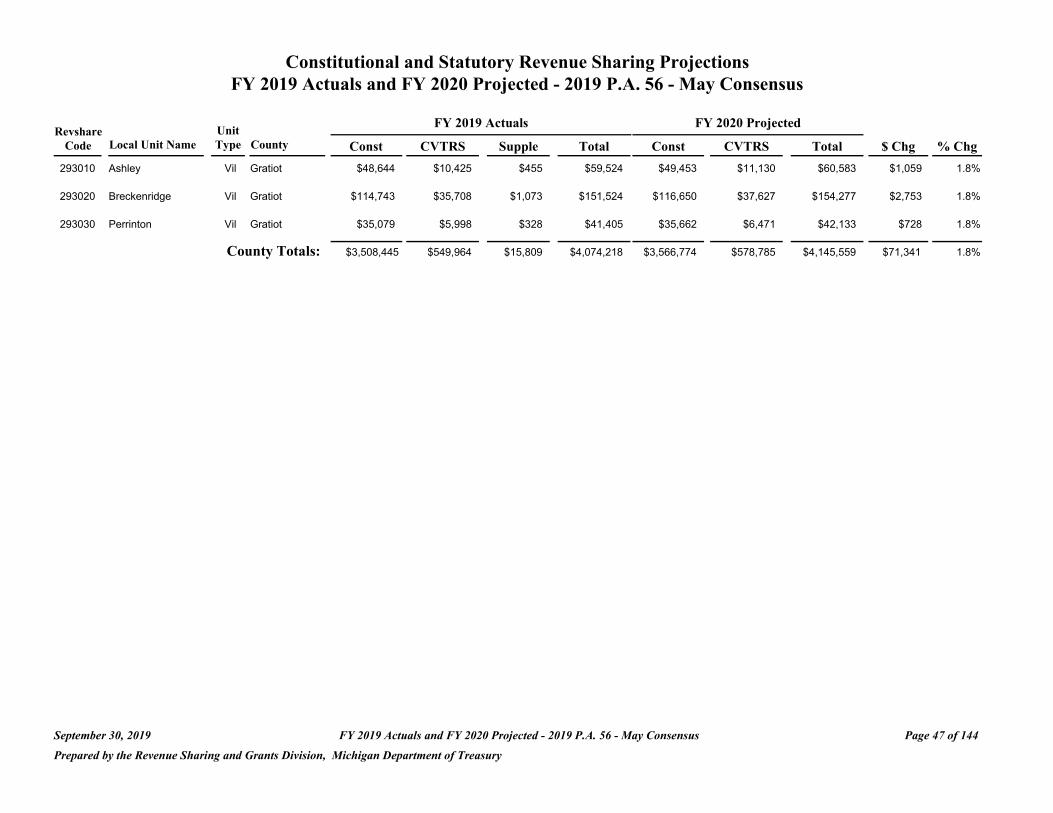
293010 Ashley
Unit Type County
Vil Gratiot
Const $48,644
FY 2019 Actuals
CVTRS Supple
$10,425 $455
Total $59,524
FY 2020 Projected
Const CVTRS
$49,453 $11,130
Total $60,583
$ Chg
$1,059
% Chg
1.8%
293020 Breckenridge Vil Gratiot $114,743 $35,708 $1,073 $151,524 $116,650 $37,627 $154,277 $2,753 1.8%
293030 Perrinton Vil Gratiot $35,079 $5,998 $328 $41,405 $35,662 $6,471 $42,133 $728 1.8%
County Totals: $3,508,445 $549,964 $15,809 $4,074,218 $3,566,774 $578,785 $4,145,559 $71,341 1.8%
September 30, 2019 FY 2019 Actuals and FY 2020 Projected - 2019 P.A. 56 - May Consensus Page 47 of 144
Prepared by the Revenue Sharing and Grants Division, Michigan Department of Treasury

Constitutional and Statutory Revenue Sharing Projections FY 2019 Actuals and FY 2020 Projected - 2019 P.A. 56 - May Consensus
FY 2019 Actuals FY 2020 Projected Revshare Unit
Code Local Unit Name Type County Const CVTRS Supple Total Const CVTRS Total $ Chg % Chg
300000 Hillsdale Cnty Hillsdale $0 $0 $0 $0 $0 $0 $0 $0 N/A
301010 Adams Twp Hillsdale $174,187 $0 $0 $174,187 $177,083 $0 $177,083 $2,896 1.7%
301020 Allen Twp Hillsdale $126,666 $0 $0 $126,666 $128,771 $0 $128,771 $2,105 1.7%
301030 Amboy Twp Hillsdale $101,349 $0 $0 $101,349 $103,035 $0 $103,035 $1,686 1.7%
301040 Cambria Twp Hillsdale $218,857 $0 $0 $218,857 $222,495 $0 $222,495 $3,638 1.7%
301050 Camden Twp Hillsdale $103,078 $0 $0 $103,078 $104,791 $0 $104,791 $1,713 1.7%
301060 Fayette Twp Hillsdale $92,277 $0 $0 $92,277 $93,811 $0 $93,811 $1,534 1.7%
301070 Hillsdale Twp Hillsdale $175,656 $0 $0 $175,656 $178,576 $0 $178,576 $2,920 1.7%
301080 Jefferson Twp Hillsdale $264,651 $0 $0 $264,651 $269,050 $0 $269,050 $4,399 1.7%
301090 Litchfield Twp Hillsdale $86,662 $0 $0 $86,662 $88,102 $0 $88,102 $1,440 1.7%
301100 Moscow Twp Hillsdale $127,012 $0 $0 $127,012 $129,123 $0 $129,123 $2,111 1.7%
301110 Pittsford Twp Hillsdale $138,502 $0 $0 $138,502 $140,805 $0 $140,805 $2,303 1.7%
301120 Ransom Twp Hillsdale $80,527 $0 $0 $80,527 $81,865 $0 $81,865 $1,338 1.7%
301130 Reading Twp Hillsdale $152,500 $0 $0 $152,500 $155,035 $0 $155,035 $2,535 1.7%
301140 Scipio Twp Hillsdale $162,782 $0 $0 $162,782 $165,488 $0 $165,488 $2,706 1.7%
301150 Somerset Twp Hillsdale $399,436 $0 $0 $399,436 $406,079 $0 $406,079 $6,643 1.7%
301160 Wheatland Twp Hillsdale $116,730 $0 $0 $116,730 $118,670 $0 $118,670 $1,940 1.7%
301170 Woodbridge Twp Hillsdale $114,482 $0 $0 $114,482 $116,386 $0 $116,386 $1,904 1.7%
301180 Wright Twp Hillsdale $96,512 $0 $0 $96,512 $98,116 $0 $98,116 $1,604 1.7%
302010 Hillsdale City Hillsdale $714,806 $205,513 $6,684 $927,003 $726,691 $217,078 $943,769 $16,766 1.8%
September 30, 2019 FY 2019 Actuals and FY 2020 Projected - 2019 P.A. 56 - May Consensus Page 48 of 144
Prepared by the Revenue Sharing and Grants Division, Michigan Department of Treasury
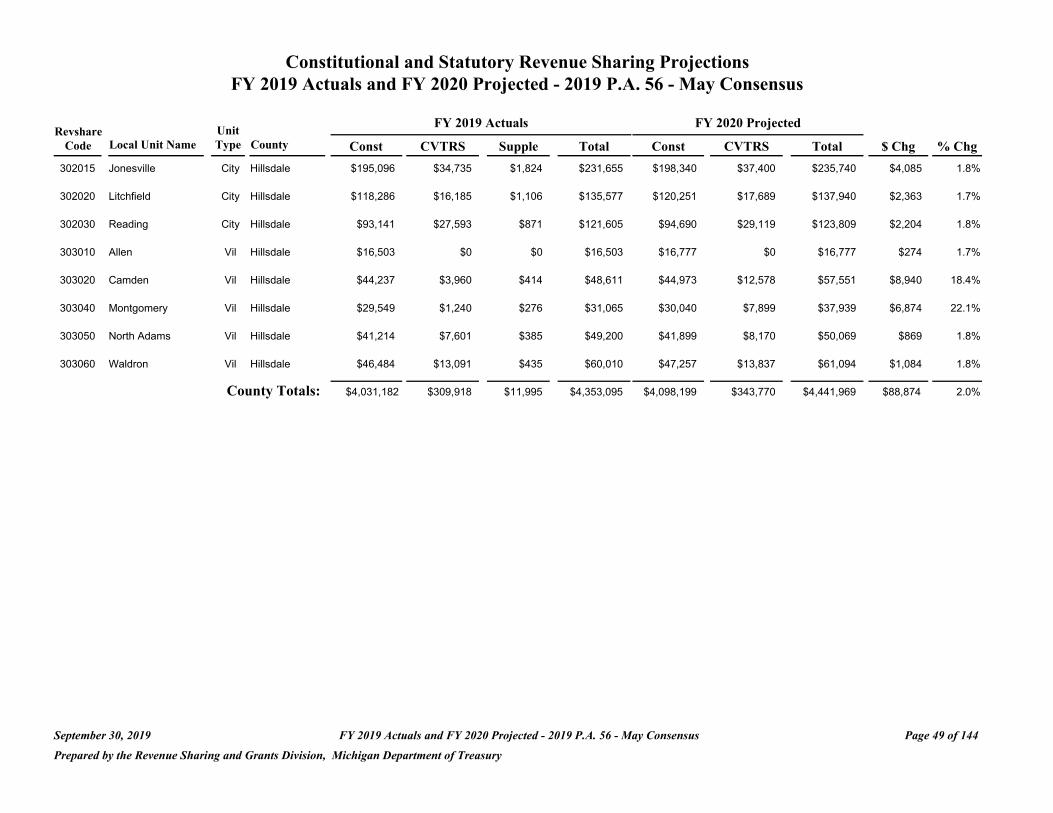
Constitutional and Statutory Revenue Sharing Projections FY 2019 Actuals and FY 2020 Projected - 2019 P.A. 56 - May Consensus
Revshare Unit FY 2019 Actuals FY 2020 Projected
Code Local Unit Name Type County Const CVTRS Supple Total Const CVTRS Total $ Chg % Chg
302015 Jonesville City Hillsdale $195,096 $34,735 $1,824 $231,655 $198,340 $37,400 $235,740 $4,085 1.8%
302020 Litchfield City Hillsdale $118,286 $16,185 $1,106 $135,577 $120,251 $17,689 $137,940 $2,363 1.7%
302030 Reading City Hillsdale $93,141 $27,593 $871 $121,605 $94,690 $29,119 $123,809 $2,204 1.8%
303010 Allen Vil Hillsdale $16,503 $0 $0 $16,503 $16,777 $0 $16,777 $274 1.7%
303020 Camden Vil Hillsdale $44,237 $3,960 $414 $48,611 $44,973 $12,578 $57,551 $8,940 18.4%
303040 Montgomery Vil Hillsdale $29,549 $1,240 $276 $31,065 $30,040 $7,899 $37,939 $6,874 22.1%
303050 North Adams Vil Hillsdale $41,214 $7,601 $385 $49,200 $41,899 $8,170 $50,069 $869 1.8%
303060 Waldron Vil Hillsdale $46,484 $13,091 $435 $60,010 $47,257 $13,837 $61,094 $1,084 1.8%
County Totals: $4,031,182 $309,918 $11,995 $4,353,095 $4,098,199 $343,770 $4,441,969 $88,874 2.0%
September 30, 2019 FY 2019 Actuals and FY 2020 Projected - 2019 P.A. 56 - May Consensus Page 49 of 144
Prepared by the Revenue Sharing and Grants Division, Michigan Department of Treasury
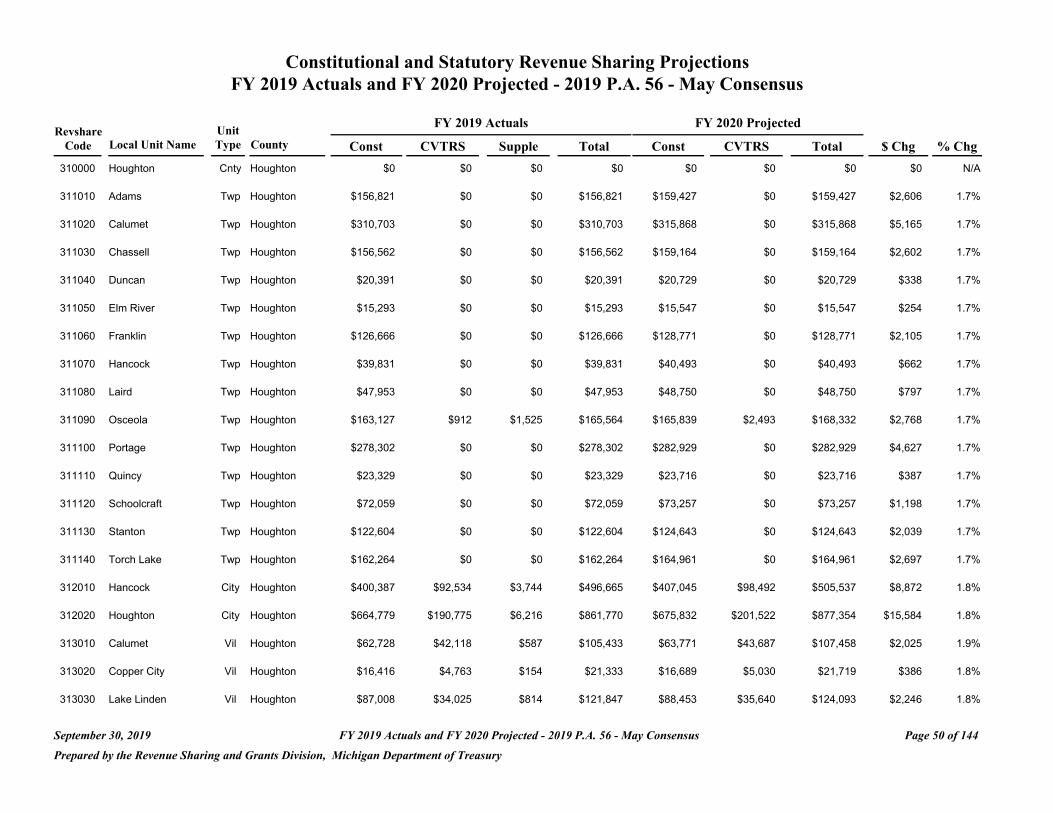
Constitutional and Statutory Revenue Sharing Projections FY 2019 Actuals and FY 2020 Projected - 2019 P.A. 56 - May Consensus
FY 2019 Actuals FY 2020 Projected Revshare Unit
Code Local Unit Name Type County Const CVTRS Supple Total Const CVTRS Total $ Chg % Chg
310000 Houghton Cnty Houghton $0 $0 $0 $0 $0 $0 $0 $0 N/A
311010 Adams Twp Houghton $156,821 $0 $0 $156,821 $159,427 $0 $159,427 $2,606 1.7%
311020 Calumet Twp Houghton $310,703 $0 $0 $310,703 $315,868 $0 $315,868 $5,165 1.7%
311030 Chassell Twp Houghton $156,562 $0 $0 $156,562 $159,164 $0 $159,164 $2,602 1.7%
311040 Duncan Twp Houghton $20,391 $0 $0 $20,391 $20,729 $0 $20,729 $338 1.7%
311050 Elm River Twp Houghton $15,293 $0 $0 $15,293 $15,547 $0 $15,547 $254 1.7%
311060 Franklin Twp Houghton $126,666 $0 $0 $126,666 $128,771 $0 $128,771 $2,105 1.7%
311070 Hancock Twp Houghton $39,831 $0 $0 $39,831 $40,493 $0 $40,493 $662 1.7%
311080 Laird Twp Houghton $47,953 $0 $0 $47,953 $48,750 $0 $48,750 $797 1.7%
311090 Osceola Twp Houghton $163,127 $912 $1,525 $165,564 $165,839 $2,493 $168,332 $2,768 1.7%
311100 Portage Twp Houghton $278,302 $0 $0 $278,302 $282,929 $0 $282,929 $4,627 1.7%
311110 Quincy Twp Houghton $23,329 $0 $0 $23,329 $23,716 $0 $23,716 $387 1.7%
311120 Schoolcraft Twp Houghton $72,059 $0 $0 $72,059 $73,257 $0 $73,257 $1,198 1.7%
311130 Stanton Twp Houghton $122,604 $0 $0 $122,604 $124,643 $0 $124,643 $2,039 1.7%
311140 Torch Lake Twp Houghton $162,264 $0 $0 $162,264 $164,961 $0 $164,961 $2,697 1.7%
312010 Hancock City Houghton $400,387 $92,534 $3,744 $496,665 $407,045 $98,492 $505,537 $8,872 1.8%
312020 Houghton City Houghton $664,779 $190,775 $6,216 $861,770 $675,832 $201,522 $877,354 $15,584 1.8%
313010 Calumet Vil Houghton $62,728 $42,118 $587 $105,433 $63,771 $43,687 $107,458 $2,025 1.9%
313020 Copper City Vil Houghton $16,416 $4,763 $154 $21,333 $16,689 $5,030 $21,719 $386 1.8%
313030 Lake Linden Vil Houghton $87,008 $34,025 $814 $121,847 $88,453 $35,640 $124,093 $2,246 1.8%
September 30, 2019 FY 2019 Actuals and FY 2020 Projected - 2019 P.A. 56 - May Consensus Page 50 of 144
Prepared by the Revenue Sharing and Grants Division, Michigan Department of Treasury
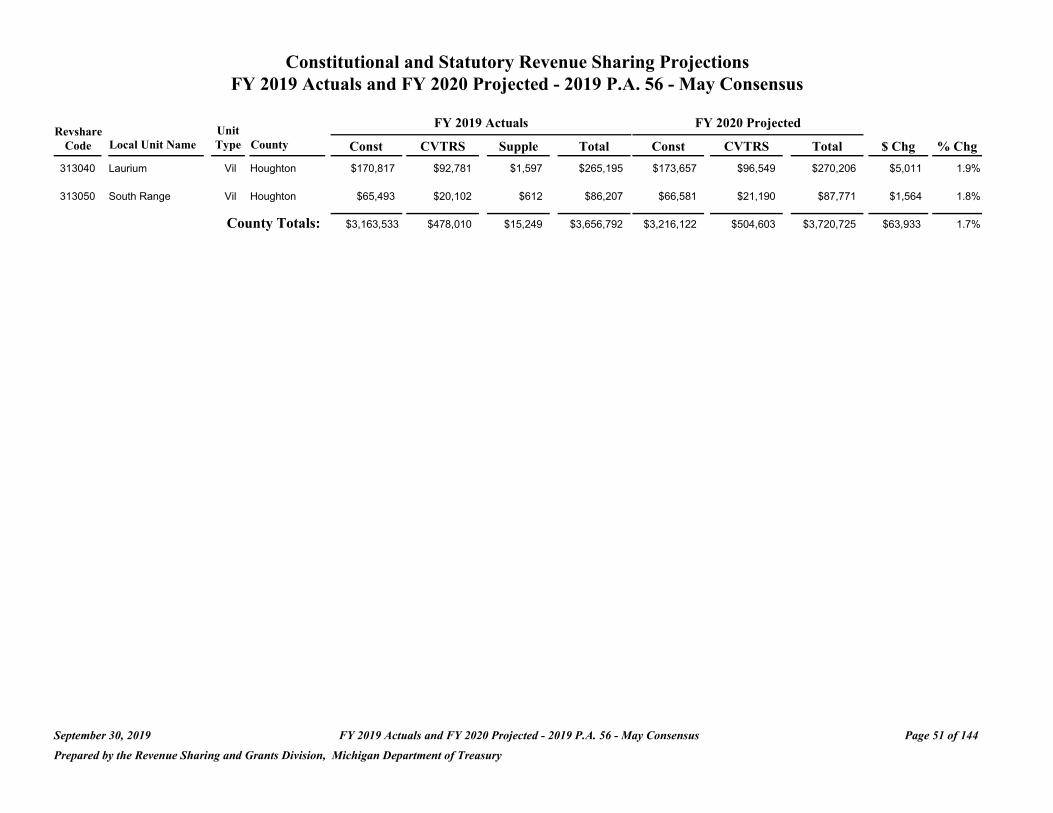
Constitutional and Statutory Revenue Sharing Projections FY 2019 Actuals and FY 2020 Projected - 2019 P.A. 56 - May Consensus
Revshare Code Local Unit Name
313040 Laurium
Unit Type County
Vil Houghton
Const $170,817
FY 2019 Actuals
CVTRS Supple
$92,781 $1,597
Total $265,195
FY 2020 Projected
Const CVTRS
$173,657 $96,549
Total $270,206
$ Chg
$5,011
% Chg
1.9%
313050 South Range Vil Houghton $65,493 $20,102 $612 $86,207 $66,581 $21,190 $87,771 $1,564 1.8%
County Totals: $3,163,533 $478,010 $15,249 $3,656,792 $3,216,122 $504,603 $3,720,725 $63,933 1.7%
September 30, 2019 FY 2019 Actuals and FY 2020 Projected - 2019 P.A. 56 - May Consensus Page 51 of 144
Prepared by the Revenue Sharing and Grants Division, Michigan Department of Treasury
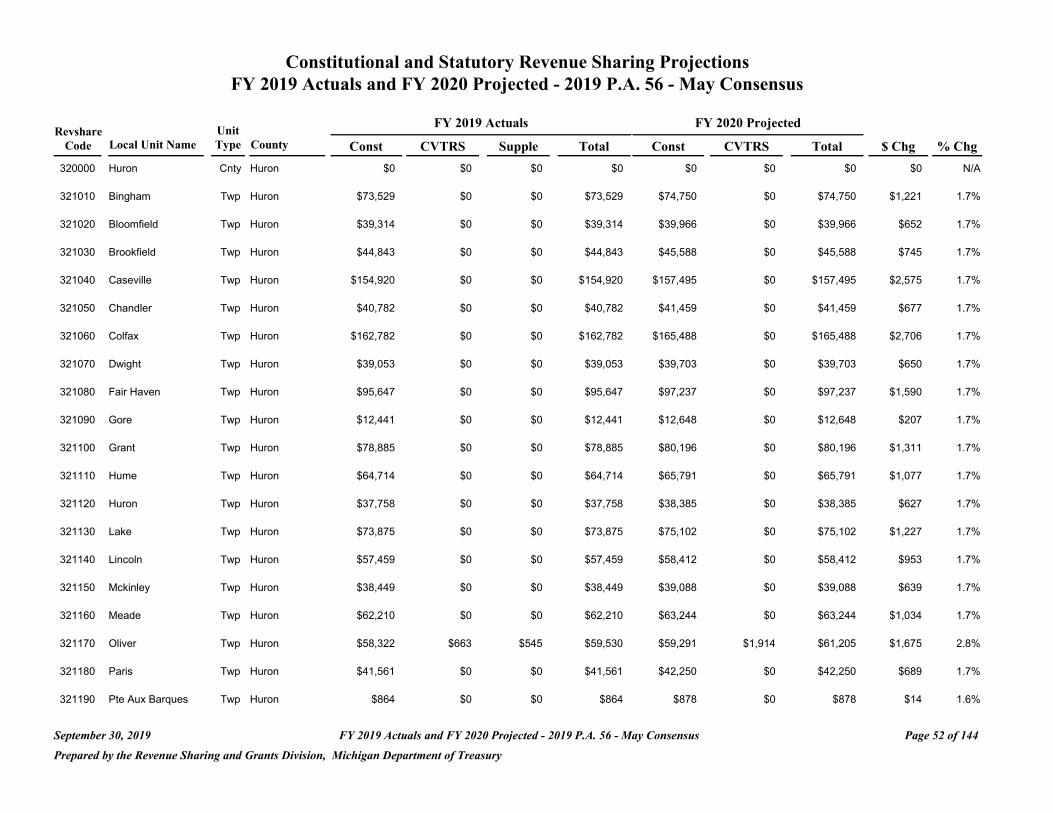
Constitutional and Statutory Revenue Sharing Projections FY 2019 Actuals and FY 2020 Projected - 2019 P.A. 56 - May Consensus
FY 2019 Actuals FY 2020 Projected Revshare Unit
Code Local Unit Name Type County Const CVTRS Supple Total Const CVTRS Total $ Chg % Chg
320000 Huron Cnty Huron $0 $0 $0 $0 $0 $0 $0 $0 N/A
321010 Bingham Twp Huron $73,529 $0 $0 $73,529 $74,750 $0 $74,750 $1,221 1.7%
321020 Bloomfield Twp Huron $39,314 $0 $0 $39,314 $39,966 $0 $39,966 $652 1.7%
321030 Brookfield Twp Huron $44,843 $0 $0 $44,843 $45,588 $0 $45,588 $745 1.7%
321040 Caseville Twp Huron $154,920 $0 $0 $154,920 $157,495 $0 $157,495 $2,575 1.7%
321050 Chandler Twp Huron $40,782 $0 $0 $40,782 $41,459 $0 $41,459 $677 1.7%
321060 Colfax Twp Huron $162,782 $0 $0 $162,782 $165,488 $0 $165,488 $2,706 1.7%
321070 Dwight Twp Huron $39,053 $0 $0 $39,053 $39,703 $0 $39,703 $650 1.7%
321080 Fair Haven Twp Huron $95,647 $0 $0 $95,647 $97,237 $0 $97,237 $1,590 1.7%
321090 Gore Twp Huron $12,441 $0 $0 $12,441 $12,648 $0 $12,648 $207 1.7%
321100 Grant Twp Huron $78,885 $0 $0 $78,885 $80,196 $0 $80,196 $1,311 1.7%
321110 Hume Twp Huron $64,714 $0 $0 $64,714 $65,791 $0 $65,791 $1,077 1.7%
321120 Huron Twp Huron $37,758 $0 $0 $37,758 $38,385 $0 $38,385 $627 1.7%
321130 Lake Twp Huron $73,875 $0 $0 $73,875 $75,102 $0 $75,102 $1,227 1.7%
321140 Lincoln Twp Huron $57,459 $0 $0 $57,459 $58,412 $0 $58,412 $953 1.7%
321150 Mckinley Twp Huron $38,449 $0 $0 $38,449 $39,088 $0 $39,088 $639 1.7%
321160 Meade Twp Huron $62,210 $0 $0 $62,210 $63,244 $0 $63,244 $1,034 1.7%
321170 Oliver Twp Huron $58,322 $663 $545 $59,530 $59,291 $1,914 $61,205 $1,675 2.8%
321180 Paris Twp Huron $41,561 $0 $0 $41,561 $42,250 $0 $42,250 $689 1.7%
321190 Pte Aux Barques Twp Huron $864 $0 $0 $864 $878 $0 $878 $14 1.6%
September 30, 2019 FY 2019 Actuals and FY 2020 Projected - 2019 P.A. 56 - May Consensus Page 52 of 144
Prepared by the Revenue Sharing and Grants Division, Michigan Department of Treasury
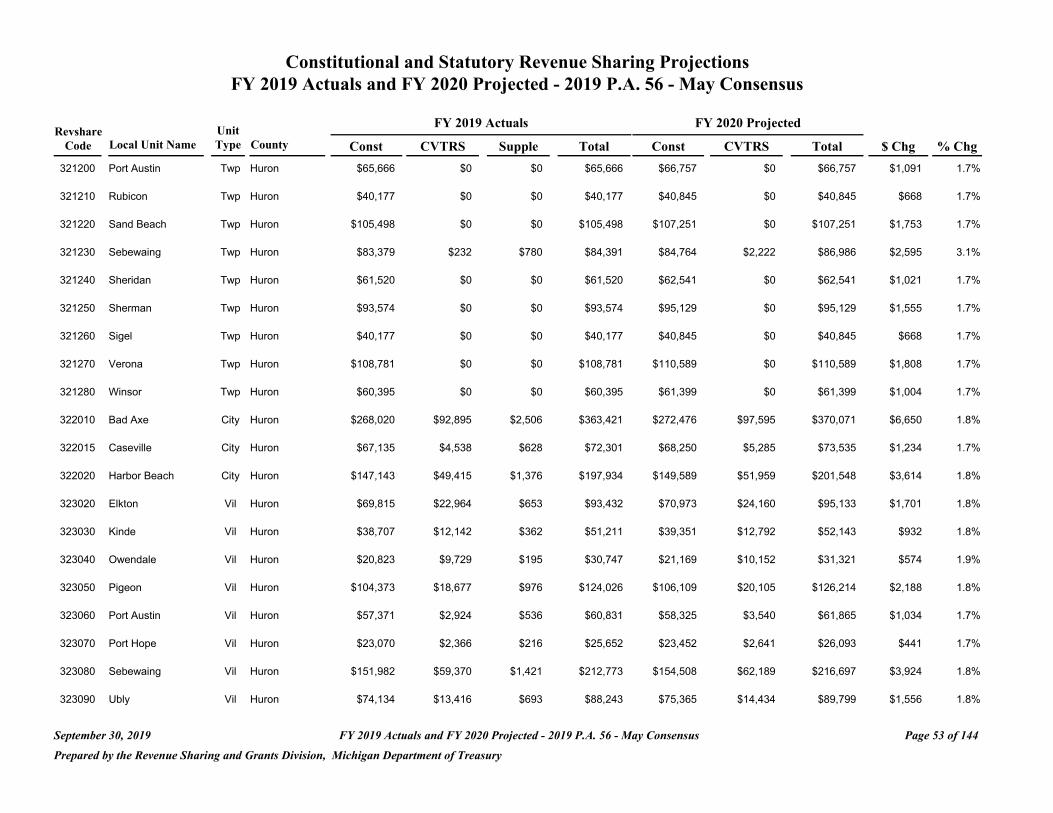
Constitutional and Statutory Revenue Sharing Projections FY 2019 Actuals and FY 2020 Projected - 2019 P.A. 56 - May Consensus
FY 2019 Actuals FY 2020 Projected Revshare Unit
Code Local Unit Name Type County Const CVTRS Supple Total Const CVTRS Total $ Chg % Chg
321200 Port Austin Twp Huron $65,666 $0 $0 $65,666 $66,757 $0 $66,757 $1,091 1.7%
321210 Rubicon Twp Huron $40,177 $0 $0 $40,177 $40,845 $0 $40,845 $668 1.7%
321220 Sand Beach Twp Huron $105,498 $0 $0 $105,498 $107,251 $0 $107,251 $1,753 1.7%
321230 Sebewaing Twp Huron $83,379 $232 $780 $84,391 $84,764 $2,222 $86,986 $2,595 3.1%
321240 Sheridan Twp Huron $61,520 $0 $0 $61,520 $62,541 $0 $62,541 $1,021 1.7%
321250 Sherman Twp Huron $93,574 $0 $0 $93,574 $95,129 $0 $95,129 $1,555 1.7%
321260 Sigel Twp Huron $40,177 $0 $0 $40,177 $40,845 $0 $40,845 $668 1.7%
321270 Verona Twp Huron $108,781 $0 $0 $108,781 $110,589 $0 $110,589 $1,808 1.7%
321280 Winsor Twp Huron $60,395 $0 $0 $60,395 $61,399 $0 $61,399 $1,004 1.7%
322010 Bad Axe City Huron $268,020 $92,895 $2,506 $363,421 $272,476 $97,595 $370,071 $6,650 1.8%
322015 Caseville City Huron $67,135 $4,538 $628 $72,301 $68,250 $5,285 $73,535 $1,234 1.7%
322020 Harbor Beach City Huron $147,143 $49,415 $1,376 $197,934 $149,589 $51,959 $201,548 $3,614 1.8%
323020 Elkton Vil Huron $69,815 $22,964 $653 $93,432 $70,973 $24,160 $95,133 $1,701 1.8%
323030 Kinde Vil Huron $38,707 $12,142 $362 $51,211 $39,351 $12,792 $52,143 $932 1.8%
323040 Owendale Vil Huron $20,823 $9,729 $195 $30,747 $21,169 $10,152 $31,321 $574 1.9%
323050 Pigeon Vil Huron $104,373 $18,677 $976 $124,026 $106,109 $20,105 $126,214 $2,188 1.8%
323060 Port Austin Vil Huron $57,371 $2,924 $536 $60,831 $58,325 $3,540 $61,865 $1,034 1.7%
323070 Port Hope Vil Huron $23,070 $2,366 $216 $25,652 $23,452 $2,641 $26,093 $441 1.7%
323080 Sebewaing Vil Huron $151,982 $59,370 $1,421 $212,773 $154,508 $62,189 $216,697 $3,924 1.8%
323090 Ubly Vil Huron $74,134 $13,416 $693 $88,243 $75,365 $14,434 $89,799 $1,556 1.8%
September 30, 2019 FY 2019 Actuals and FY 2020 Projected - 2019 P.A. 56 - May Consensus Page 53 of 144
Prepared by the Revenue Sharing and Grants Division, Michigan Department of Treasury

Constitutional and Statutory Revenue Sharing Projections FY 2019 Actuals and FY 2020 Projected - 2019 P.A. 56 - May Consensus
FY 2019 Actuals FY 2020 Projected Revshare Unit
Code Local Unit Name Type County Const CVTRS Supple Total Const CVTRS Total $ Chg % Chg
County Totals: $2,859,148 $289,331 $10,887 $3,159,366 $2,906,658 $308,988 $3,215,646 $56,280 1.8%
September 30, 2019 FY 2019 Actuals and FY 2020 Projected - 2019 P.A. 56 - May Consensus Page 54 of 144
Prepared by the Revenue Sharing and Grants Division, Michigan Department of Treasury
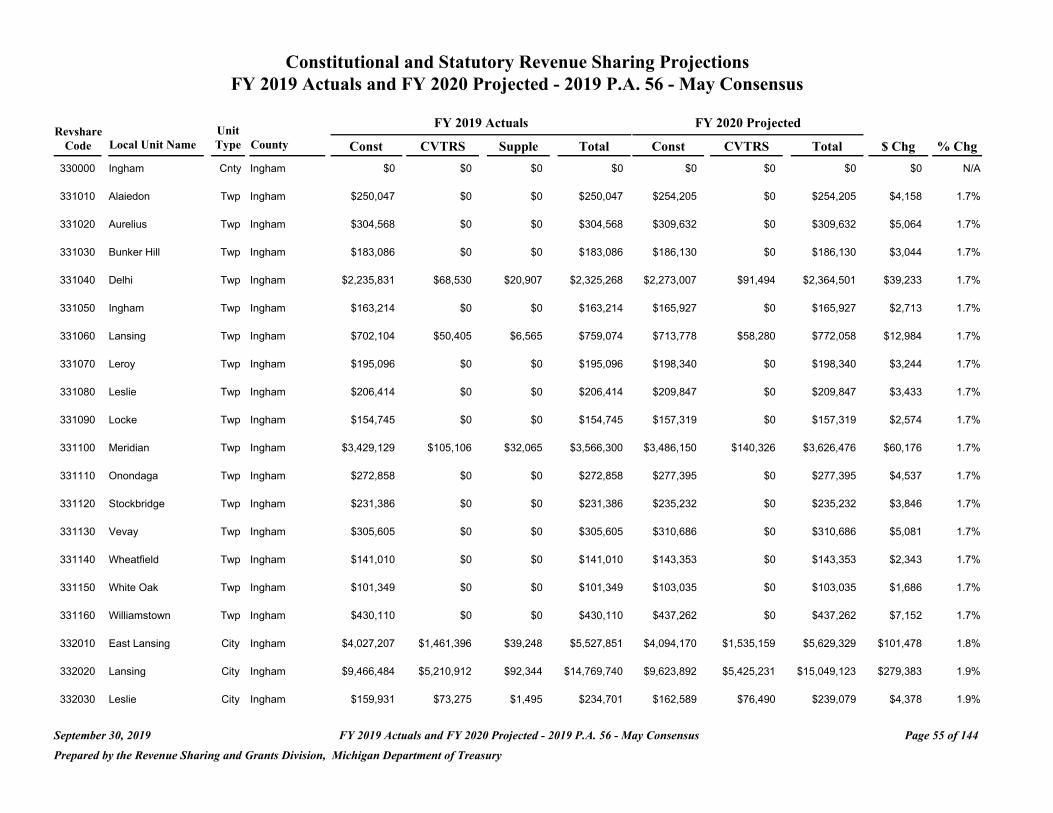
Constitutional and Statutory Revenue Sharing Projections FY 2019 Actuals and FY 2020 Projected - 2019 P.A. 56 - May Consensus
FY 2019 Actuals FY 2020 Projected Revshare Unit
Code Local Unit Name Type County Const CVTRS Supple Total Const CVTRS Total $ Chg % Chg
330000 Ingham Cnty Ingham $0 $0 $0 $0 $0 $0 $0 $0 N/A
331010 Alaiedon Twp Ingham $250,047 $0 $0 $250,047 $254,205 $0 $254,205 $4,158 1.7%
331020 Aurelius Twp Ingham $304,568 $0 $0 $304,568 $309,632 $0 $309,632 $5,064 1.7%
331030 Bunker Hill Twp Ingham $183,086 $0 $0 $183,086 $186,130 $0 $186,130 $3,044 1.7%
331040 Delhi Twp Ingham $2,235,831 $68,530 $20,907 $2,325,268 $2,273,007 $91,494 $2,364,501 $39,233 1.7%
331050 Ingham Twp Ingham $163,214 $0 $0 $163,214 $165,927 $0 $165,927 $2,713 1.7%
331060 Lansing Twp Ingham $702,104 $50,405 $6,565 $759,074 $713,778 $58,280 $772,058 $12,984 1.7%
331070 Leroy Twp Ingham $195,096 $0 $0 $195,096 $198,340 $0 $198,340 $3,244 1.7%
331080 Leslie Twp Ingham $206,414 $0 $0 $206,414 $209,847 $0 $209,847 $3,433 1.7%
331090 Locke Twp Ingham $154,745 $0 $0 $154,745 $157,319 $0 $157,319 $2,574 1.7%
331100 Meridian Twp Ingham $3,429,129 $105,106 $32,065 $3,566,300 $3,486,150 $140,326 $3,626,476 $60,176 1.7%
331110 Onondaga Twp Ingham $272,858 $0 $0 $272,858 $277,395 $0 $277,395 $4,537 1.7%
331120 Stockbridge Twp Ingham $231,386 $0 $0 $231,386 $235,232 $0 $235,232 $3,846 1.7%
331130 Vevay Twp Ingham $305,605 $0 $0 $305,605 $310,686 $0 $310,686 $5,081 1.7%
331140 Wheatfield Twp Ingham $141,010 $0 $0 $141,010 $143,353 $0 $143,353 $2,343 1.7%
331150 White Oak Twp Ingham $101,349 $0 $0 $101,349 $103,035 $0 $103,035 $1,686 1.7%
331160 Williamstown Twp Ingham $430,110 $0 $0 $430,110 $437,262 $0 $437,262 $7,152 1.7%
332010 East Lansing City Ingham $4,027,207 $1,461,396 $39,248 $5,527,851 $4,094,170 $1,535,159 $5,629,329 $101,478 1.8%
332020 Lansing City Ingham $9,466,484 $5,210,912 $92,344 $14,769,740 $9,623,892 $5,425,231 $15,049,123 $279,383 1.9%
332030 Leslie City Ingham $159,931 $73,275 $1,495 $234,701 $162,589 $76,490 $239,079 $4,378 1.9%
September 30, 2019 FY 2019 Actuals and FY 2020 Projected - 2019 P.A. 56 - May Consensus Page 55 of 144
Prepared by the Revenue Sharing and Grants Division, Michigan Department of Treasury
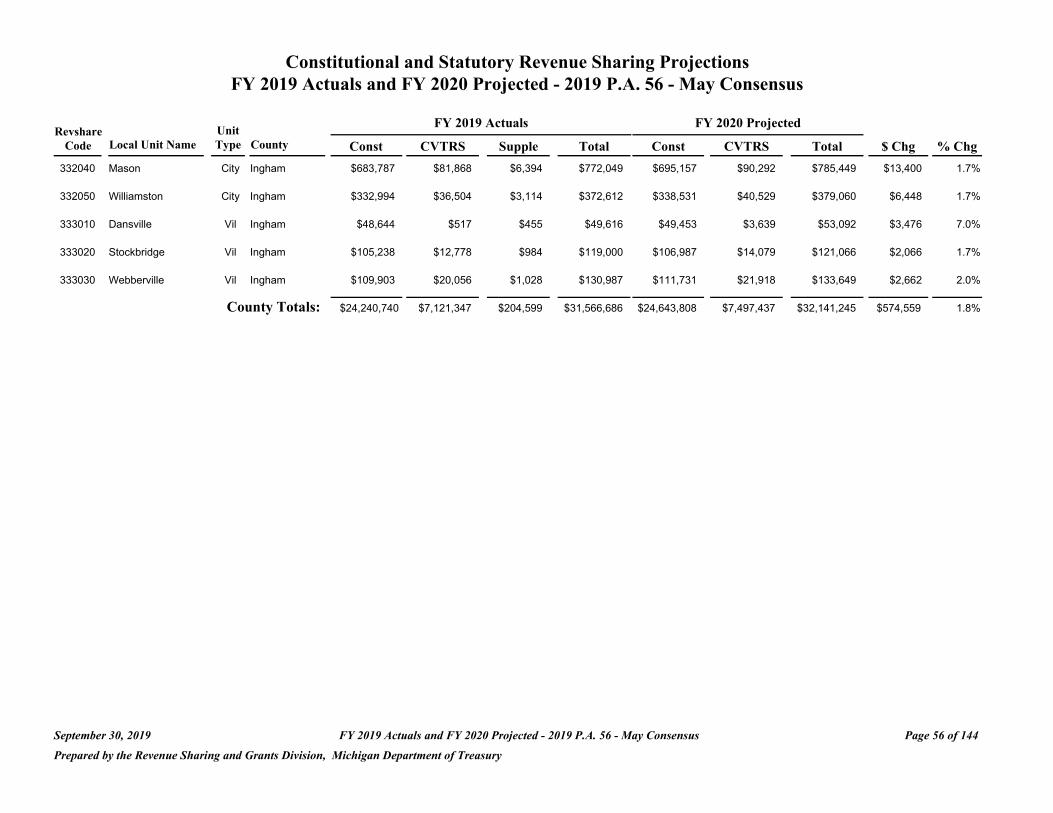
Constitutional and Statutory Revenue Sharing Projections FY 2019 Actuals and FY 2020 Projected - 2019 P.A. 56 - May Consensus
Revshare Unit FY 2019 Actuals FY 2020 Projected
Code Local Unit Name Type County Const CVTRS Supple Total Const CVTRS Total $ Chg % Chg
332040 Mason City Ingham $683,787 $81,868 $6,394 $772,049 $695,157 $90,292 $785,449 $13,400 1.7%
332050 Williamston City Ingham $332,994 $36,504 $3,114 $372,612 $338,531 $40,529 $379,060 $6,448 1.7%
333010 Dansville Vil Ingham $48,644 $517 $455 $49,616 $49,453 $3,639 $53,092 $3,476 7.0%
333020 Stockbridge Vil Ingham $105,238 $12,778 $984 $119,000 $106,987 $14,079 $121,066 $2,066 1.7%
333030 Webberville Vil Ingham $109,903 $20,056 $1,028 $130,987 $111,731 $21,918 $133,649 $2,662 2.0%
County Totals: $24,240,740 $7,121,347 $204,599 $31,566,686 $24,643,808 $7,497,437 $32,141,245 $574,559 1.8%
September 30, 2019 FY 2019 Actuals and FY 2020 Projected - 2019 P.A. 56 - May Consensus Page 56 of 144
Prepared by the Revenue Sharing and Grants Division, Michigan Department of Treasury

Constitutional and Statutory Revenue Sharing Projections FY 2019 Actuals and FY 2020 Projected - 2019 P.A. 56 - May Consensus
FY 2019 Actuals FY 2020 Projected Revshare Unit
Code Local Unit Name Type County Const CVTRS Supple Total Const CVTRS Total $ Chg % Chg
340000 Ionia Cnty Ionia $0 $0 $0 $0 $0 $0 $0 $0 N/A
341010 Berlin Twp Ionia $182,827 $0 $0 $182,827 $185,867 $0 $185,867 $3,040 1.7%
341020 Boston Twp Ionia $378,788 $0 $0 $378,788 $385,085 $0 $385,085 $6,297 1.7%
341030 Campbell Twp Ionia $172,286 $0 $0 $172,286 $175,150 $0 $175,150 $2,864 1.7%
341040 Danby Twp Ionia $258,170 $0 $0 $258,170 $262,462 $0 $262,462 $4,292 1.7%
341050 Easton Twp Ionia $266,291 $0 $0 $266,291 $270,719 $0 $270,719 $4,428 1.7%
341060 Ionia Twp Ionia $321,935 $0 $0 $321,935 $327,287 $0 $327,287 $5,352 1.7%
341070 Keene Twp Ionia $158,203 $0 $0 $158,203 $160,833 $0 $160,833 $2,630 1.7%
341080 Lyons Twp Ionia $143,082 $0 $0 $143,082 $145,461 $0 $145,461 $2,379 1.7%
341090 North Plains Twp Ionia $80,181 $0 $0 $80,181 $81,514 $0 $81,514 $1,333 1.7%
341100 Odessa Twp Ionia $152,068 $0 $0 $152,068 $154,596 $0 $154,596 $2,528 1.7%
341110 Orange Twp Ionia $85,280 $0 $0 $85,280 $86,696 $0 $86,696 $1,416 1.7%
341120 Orleans Twp Ionia $237,001 $0 $0 $237,001 $240,942 $0 $240,942 $3,941 1.7%
341130 Otisco Twp Ionia $197,169 $0 $0 $197,169 $200,448 $0 $200,448 $3,279 1.7%
341140 Portland Twp Ionia $294,114 $0 $0 $294,114 $299,003 $0 $299,003 $4,889 1.7%
341150 Ronald Twp Ionia $161,486 $0 $0 $161,486 $164,170 $0 $164,170 $2,684 1.7%
341160 Sebewa Twp Ionia $101,178 $0 $0 $101,178 $102,859 $0 $102,859 $1,681 1.7%
342010 Belding City Ionia $497,418 $183,702 $4,651 $685,771 $505,688 $195,871 $701,559 $15,788 2.3%
342020 Ionia City Ionia $762,241 $277,344 $7,128 $1,046,713 $774,914 $291,015 $1,065,929 $19,216 1.8%
342030 Portland City Ionia $335,500 $106,266 $3,137 $444,903 $341,078 $111,919 $452,997 $8,094 1.8%
September 30, 2019 FY 2019 Actuals and FY 2020 Projected - 2019 P.A. 56 - May Consensus Page 57 of 144
Prepared by the Revenue Sharing and Grants Division, Michigan Department of Treasury
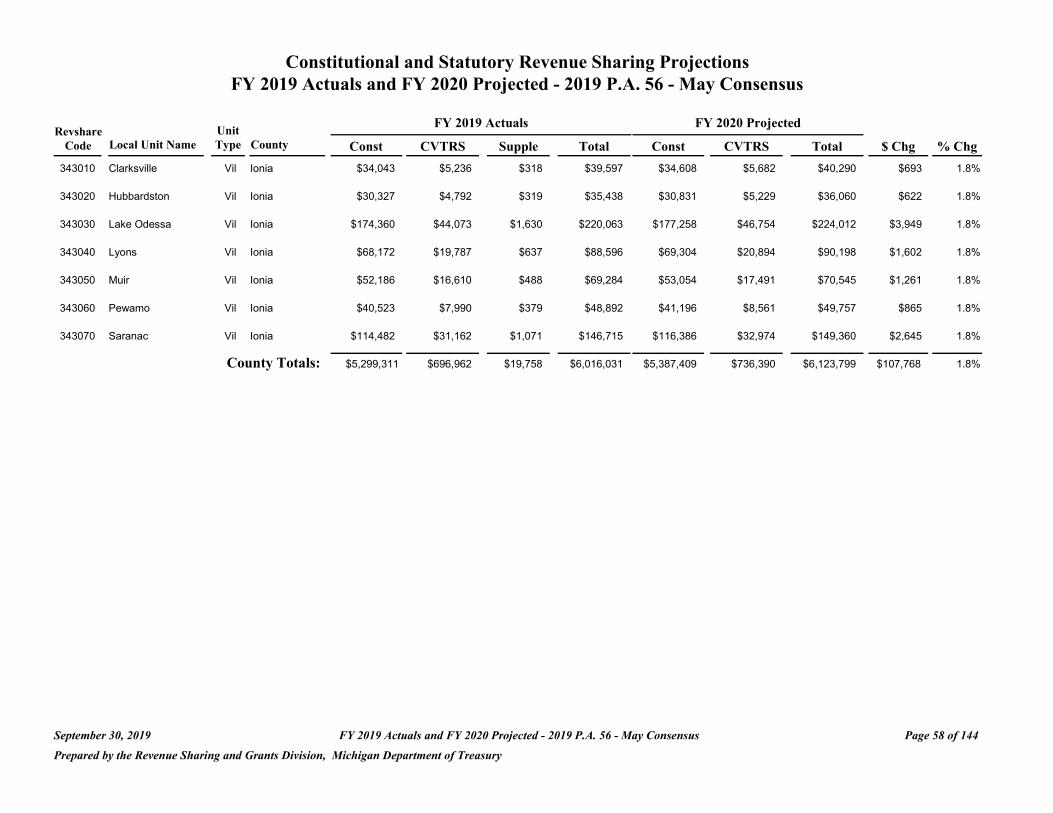
Constitutional and Statutory Revenue Sharing Projections FY 2019 Actuals and FY 2020 Projected - 2019 P.A. 56 - May Consensus
Revshare Unit FY 2019 Actuals FY 2020 Projected
Code Local Unit Name Type County Const CVTRS Supple Total Const CVTRS Total $ Chg % Chg
343010 Clarksville Vil Ionia $34,043 $5,236 $318 $39,597 $34,608 $5,682 $40,290 $693 1.8%
343020 Hubbardston Vil Ionia $30,327 $4,792 $319 $35,438 $30,831 $5,229 $36,060 $622 1.8%
343030 Lake Odessa Vil Ionia $174,360 $44,073 $1,630 $220,063 $177,258 $46,754 $224,012 $3,949 1.8%
343040 Lyons Vil Ionia $68,172 $19,787 $637 $88,596 $69,304 $20,894 $90,198 $1,602 1.8%
343050 Muir Vil Ionia $52,186 $16,610 $488 $69,284 $53,054 $17,491 $70,545 $1,261 1.8%
343060 Pewamo Vil Ionia $40,523 $7,990 $379 $48,892 $41,196 $8,561 $49,757 $865 1.8%
343070 Saranac Vil Ionia $114,482 $31,162 $1,071 $146,715 $116,386 $32,974 $149,360 $2,645 1.8%
County Totals: $5,299,311 $696,962 $19,758 $6,016,031 $5,387,409 $736,390 $6,123,799 $107,768 1.8%
September 30, 2019 FY 2019 Actuals and FY 2020 Projected - 2019 P.A. 56 - May Consensus Page 58 of 144
Prepared by the Revenue Sharing and Grants Division, Michigan Department of Treasury
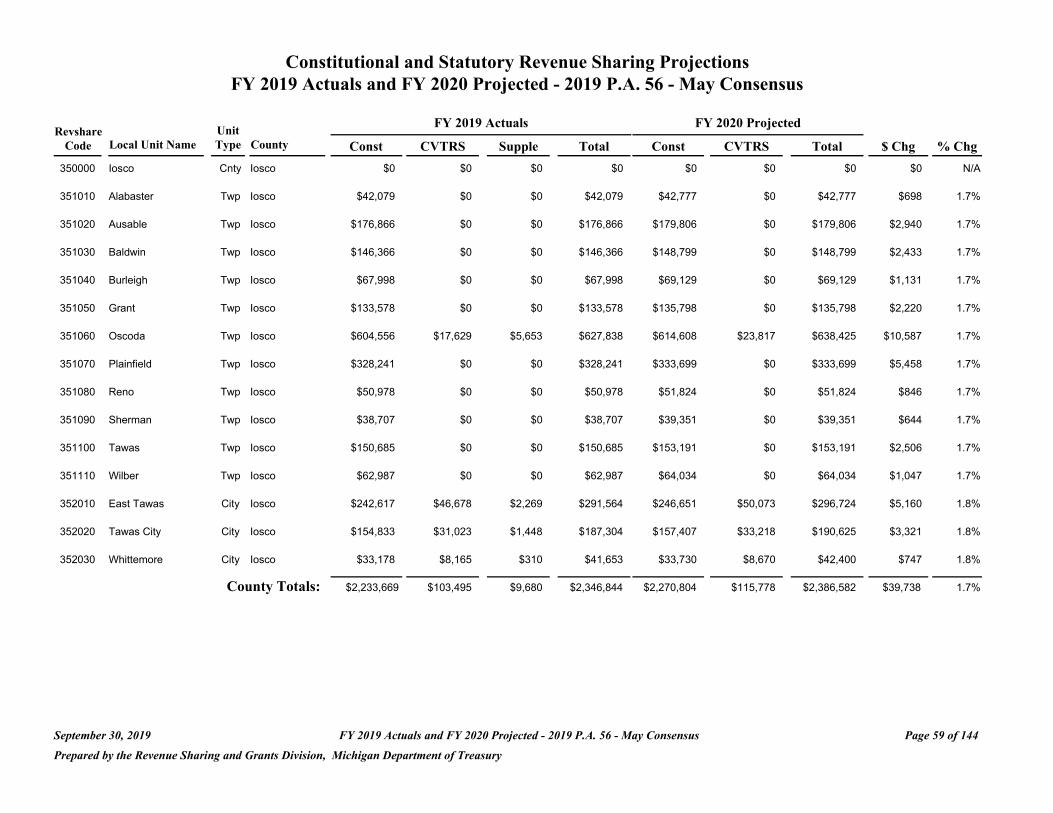
Constitutional and Statutory Revenue Sharing Projections FY 2019 Actuals and FY 2020 Projected - 2019 P.A. 56 - May Consensus
Revshare Unit FY 2019 Actuals FY 2020 Projected
Code Local Unit Name Type County Const CVTRS Supple Total Const CVTRS Total $ Chg % Chg
350000 Iosco Cnty Iosco $0 $0 $0 $0 $0 $0 $0 $0 N/A
351010 Alabaster Twp Iosco $42,079 $0 $0 $42,079 $42,777 $0 $42,777 $698 1.7%
351020 Ausable Twp Iosco $176,866 $0 $0 $176,866 $179,806 $0 $179,806 $2,940 1.7%
351030 Baldwin Twp Iosco $146,366 $0 $0 $146,366 $148,799 $0 $148,799 $2,433 1.7%
351040 Burleigh Twp Iosco $67,998 $0 $0 $67,998 $69,129 $0 $69,129 $1,131 1.7%
351050 Grant Twp Iosco $133,578 $0 $0 $133,578 $135,798 $0 $135,798 $2,220 1.7%
351060 Oscoda Twp Iosco $604,556 $17,629 $5,653 $627,838 $614,608 $23,817 $638,425 $10,587 1.7%
351070 Plainfield Twp Iosco $328,241 $0 $0 $328,241 $333,699 $0 $333,699 $5,458 1.7%
351080 Reno Twp Iosco $50,978 $0 $0 $50,978 $51,824 $0 $51,824 $846 1.7%
351090 Sherman Twp Iosco $38,707 $0 $0 $38,707 $39,351 $0 $39,351 $644 1.7%
351100 Tawas Twp Iosco $150,685 $0 $0 $150,685 $153,191 $0 $153,191 $2,506 1.7%
351110 Wilber Twp Iosco $62,987 $0 $0 $62,987 $64,034 $0 $64,034 $1,047 1.7%
352010 East Tawas City Iosco $242,617 $46,678 $2,269 $291,564 $246,651 $50,073 $296,724 $5,160 1.8%
352020 Tawas City City Iosco $154,833 $31,023 $1,448 $187,304 $157,407 $33,218 $190,625 $3,321 1.8%
352030 Whittemore City Iosco $33,178 $8,165 $310 $41,653 $33,730 $8,670 $42,400 $747 1.8%
County Totals: $2,233,669 $103,495 $9,680 $2,346,844 $2,270,804 $115,778 $2,386,582 $39,738 1.7%
September 30, 2019 FY 2019 Actuals and FY 2020 Projected - 2019 P.A. 56 - May Consensus Page 59 of 144
Prepared by the Revenue Sharing and Grants Division, Michigan Department of Treasury
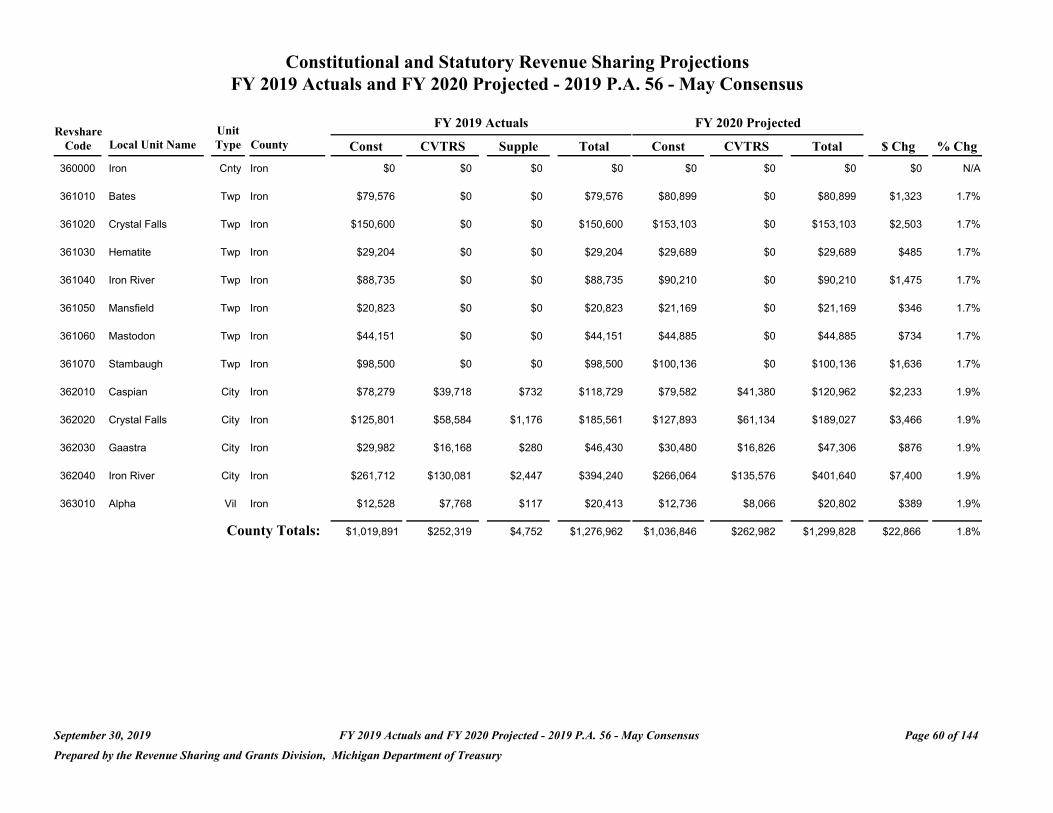
Constitutional and Statutory Revenue Sharing Projections FY 2019 Actuals and FY 2020 Projected - 2019 P.A. 56 - May Consensus
Revshare Unit FY 2019 Actuals FY 2020 Projected
Code Local Unit Name Type County Const CVTRS Supple Total Const CVTRS Total $ Chg % Chg
360000 Iron Cnty Iron $0 $0 $0 $0 $0 $0 $0 $0 N/A
361010 Bates Twp Iron $79,576 $0 $0 $79,576 $80,899 $0 $80,899 $1,323 1.7%
361020 Crystal Falls Twp Iron $150,600 $0 $0 $150,600 $153,103 $0 $153,103 $2,503 1.7%
361030 Hematite Twp Iron $29,204 $0 $0 $29,204 $29,689 $0 $29,689 $485 1.7%
361040 Iron River Twp Iron $88,735 $0 $0 $88,735 $90,210 $0 $90,210 $1,475 1.7%
361050 Mansfield Twp Iron $20,823 $0 $0 $20,823 $21,169 $0 $21,169 $346 1.7%
361060 Mastodon Twp Iron $44,151 $0 $0 $44,151 $44,885 $0 $44,885 $734 1.7%
361070 Stambaugh Twp Iron $98,500 $0 $0 $98,500 $100,136 $0 $100,136 $1,636 1.7%
362010 Caspian City Iron $78,279 $39,718 $732 $118,729 $79,582 $41,380 $120,962 $2,233 1.9%
362020 Crystal Falls City Iron $125,801 $58,584 $1,176 $185,561 $127,893 $61,134 $189,027 $3,466 1.9%
362030 Gaastra City Iron $29,982 $16,168 $280 $46,430 $30,480 $16,826 $47,306 $876 1.9%
362040 Iron River City Iron $261,712 $130,081 $2,447 $394,240 $266,064 $135,576 $401,640 $7,400 1.9%
363010 Alpha Vil Iron $12,528 $7,768 $117 $20,413 $12,736 $8,066 $20,802 $389 1.9%
County Totals: $1,019,891 $252,319 $4,752 $1,276,962 $1,036,846 $262,982 $1,299,828 $22,866 1.8%
September 30, 2019 FY 2019 Actuals and FY 2020 Projected - 2019 P.A. 56 - May Consensus Page 60 of 144
Prepared by the Revenue Sharing and Grants Division, Michigan Department of Treasury
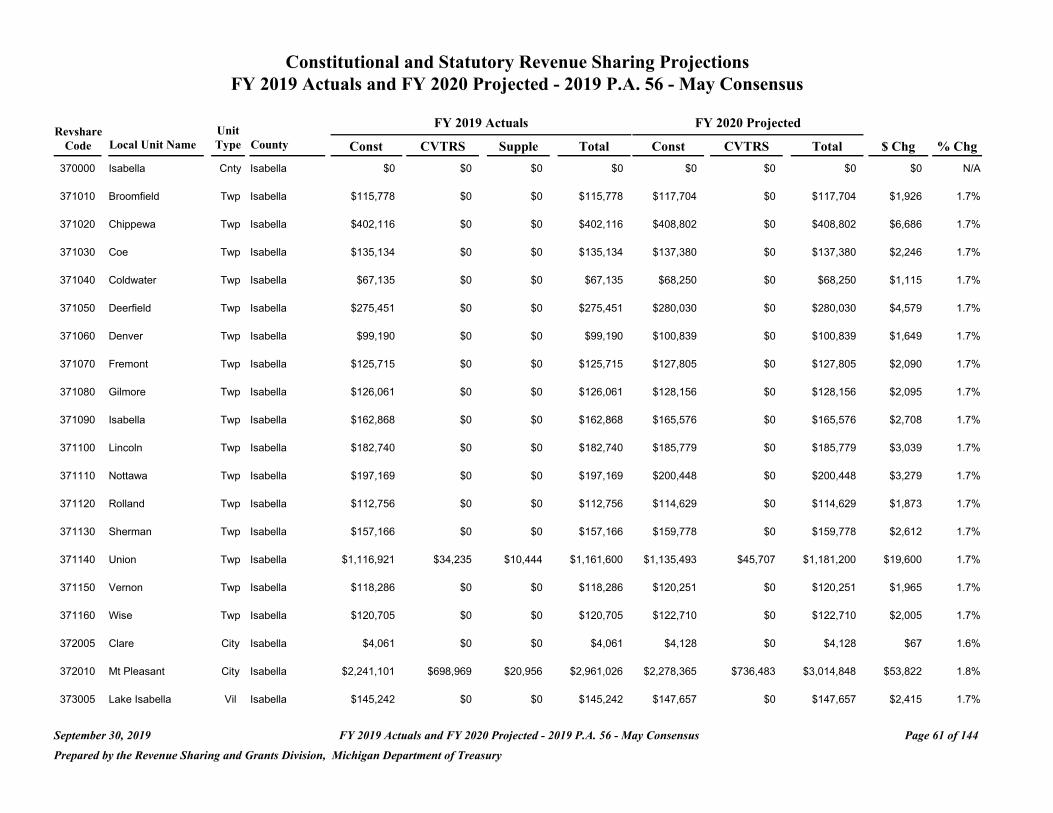
Constitutional and Statutory Revenue Sharing Projections FY 2019 Actuals and FY 2020 Projected - 2019 P.A. 56 - May Consensus
FY 2019 Actuals FY 2020 Projected Revshare Unit
Code Local Unit Name Type County Const CVTRS Supple Total Const CVTRS Total $ Chg % Chg
370000 Isabella Cnty Isabella $0 $0 $0 $0 $0 $0 $0 $0 N/A
371010 Broomfield Twp Isabella $115,778 $0 $0 $115,778 $117,704 $0 $117,704 $1,926 1.7%
371020 Chippewa Twp Isabella $402,116 $0 $0 $402,116 $408,802 $0 $408,802 $6,686 1.7%
371030 Coe Twp Isabella $135,134 $0 $0 $135,134 $137,380 $0 $137,380 $2,246 1.7%
371040 Coldwater Twp Isabella $67,135 $0 $0 $67,135 $68,250 $0 $68,250 $1,115 1.7%
371050 Deerfield Twp Isabella $275,451 $0 $0 $275,451 $280,030 $0 $280,030 $4,579 1.7%
371060 Denver Twp Isabella $99,190 $0 $0 $99,190 $100,839 $0 $100,839 $1,649 1.7%
371070 Fremont Twp Isabella $125,715 $0 $0 $125,715 $127,805 $0 $127,805 $2,090 1.7%
371080 Gilmore Twp Isabella $126,061 $0 $0 $126,061 $128,156 $0 $128,156 $2,095 1.7%
371090 Isabella Twp Isabella $162,868 $0 $0 $162,868 $165,576 $0 $165,576 $2,708 1.7%
371100 Lincoln Twp Isabella $182,740 $0 $0 $182,740 $185,779 $0 $185,779 $3,039 1.7%
371110 Nottawa Twp Isabella $197,169 $0 $0 $197,169 $200,448 $0 $200,448 $3,279 1.7%
371120 Rolland Twp Isabella $112,756 $0 $0 $112,756 $114,629 $0 $114,629 $1,873 1.7%
371130 Sherman Twp Isabella $157,166 $0 $0 $157,166 $159,778 $0 $159,778 $2,612 1.7%
371140 Union Twp Isabella $1,116,921 $34,235 $10,444 $1,161,600 $1,135,493 $45,707 $1,181,200 $19,600 1.7%
371150 Vernon Twp Isabella $118,286 $0 $0 $118,286 $120,251 $0 $120,251 $1,965 1.7%
371160 Wise Twp Isabella $120,705 $0 $0 $120,705 $122,710 $0 $122,710 $2,005 1.7%
372005 Clare City Isabella $4,061 $0 $0 $4,061 $4,128 $0 $4,128 $67 1.6%
372010 Mt Pleasant City Isabella $2,241,101 $698,969 $20,956 $2,961,026 $2,278,365 $736,483 $3,014,848 $53,822 1.8%
373005 Lake Isabella Vil Isabella $145,242 $0 $0 $145,242 $147,657 $0 $147,657 $2,415 1.7%
September 30, 2019 FY 2019 Actuals and FY 2020 Projected - 2019 P.A. 56 - May Consensus Page 61 of 144
Prepared by the Revenue Sharing and Grants Division, Michigan Department of Treasury

Constitutional and Statutory Revenue Sharing Projections FY 2019 Actuals and FY 2020 Projected - 2019 P.A. 56 - May Consensus
Revshare Code Local Unit Name
373010 Rosebush
Unit Type County
Vil Isabella
Const $31,795
FY 2019 Actuals
CVTRS Supple
$0 $0
Total $31,795
FY 2020 Projected
Const CVTRS
$32,324 $0
Total $32,324
$ Chg
$529
% Chg
1.7%
373020 Shepherd Vil Isabella $130,899 $25,327 $1,224 $157,450 $133,075 $27,162 $160,237 $2,787 1.8%
County Totals: $6,068,289 $758,531 $32,624 $6,859,444 $6,169,179 $809,352 $6,978,531 $119,087 1.7%
September 30, 2019 FY 2019 Actuals and FY 2020 Projected - 2019 P.A. 56 - May Consensus Page 62 of 144
Prepared by the Revenue Sharing and Grants Division, Michigan Department of Treasury
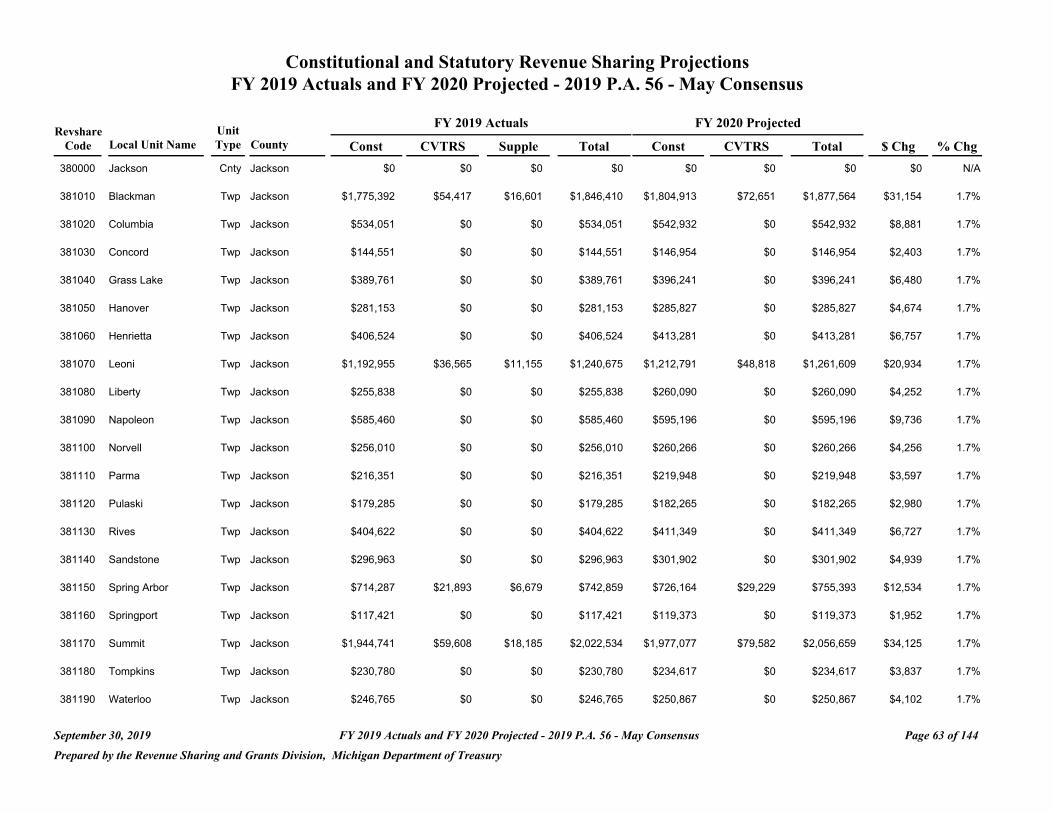
Constitutional and Statutory Revenue Sharing Projections FY 2019 Actuals and FY 2020 Projected - 2019 P.A. 56 - May Consensus
FY 2019 Actuals FY 2020 Projected Revshare Unit
Code Local Unit Name Type County Const CVTRS Supple Total Const CVTRS Total $ Chg % Chg
380000 Jackson Cnty Jackson $0 $0 $0 $0 $0 $0 $0 $0 N/A
381010 Blackman Twp Jackson $1,775,392 $54,417 $16,601 $1,846,410 $1,804,913 $72,651 $1,877,564 $31,154 1.7%
381020 Columbia Twp Jackson $534,051 $0 $0 $534,051 $542,932 $0 $542,932 $8,881 1.7%
381030 Concord Twp Jackson $144,551 $0 $0 $144,551 $146,954 $0 $146,954 $2,403 1.7%
381040 Grass Lake Twp Jackson $389,761 $0 $0 $389,761 $396,241 $0 $396,241 $6,480 1.7%
381050 Hanover Twp Jackson $281,153 $0 $0 $281,153 $285,827 $0 $285,827 $4,674 1.7%
381060 Henrietta Twp Jackson $406,524 $0 $0 $406,524 $413,281 $0 $413,281 $6,757 1.7%
381070 Leoni Twp Jackson $1,192,955 $36,565 $11,155 $1,240,675 $1,212,791 $48,818 $1,261,609 $20,934 1.7%
381080 Liberty Twp Jackson $255,838 $0 $0 $255,838 $260,090 $0 $260,090 $4,252 1.7%
381090 Napoleon Twp Jackson $585,460 $0 $0 $585,460 $595,196 $0 $595,196 $9,736 1.7%
381100 Norvell Twp Jackson $256,010 $0 $0 $256,010 $260,266 $0 $260,266 $4,256 1.7%
381110 Parma Twp Jackson $216,351 $0 $0 $216,351 $219,948 $0 $219,948 $3,597 1.7%
381120 Pulaski Twp Jackson $179,285 $0 $0 $179,285 $182,265 $0 $182,265 $2,980 1.7%
381130 Rives Twp Jackson $404,622 $0 $0 $404,622 $411,349 $0 $411,349 $6,727 1.7%
381140 Sandstone Twp Jackson $296,963 $0 $0 $296,963 $301,902 $0 $301,902 $4,939 1.7%
381150 Spring Arbor Twp Jackson $714,287 $21,893 $6,679 $742,859 $726,164 $29,229 $755,393 $12,534 1.7%
381160 Springport Twp Jackson $117,421 $0 $0 $117,421 $119,373 $0 $119,373 $1,952 1.7%
381170 Summit Twp Jackson $1,944,741 $59,608 $18,185 $2,022,534 $1,977,077 $79,582 $2,056,659 $34,125 1.7%
381180 Tompkins Twp Jackson $230,780 $0 $0 $230,780 $234,617 $0 $234,617 $3,837 1.7%
381190 Waterloo Twp Jackson $246,765 $0 $0 $246,765 $250,867 $0 $250,867 $4,102 1.7%
September 30, 2019 FY 2019 Actuals and FY 2020 Projected - 2019 P.A. 56 - May Consensus Page 63 of 144
Prepared by the Revenue Sharing and Grants Division, Michigan Department of Treasury
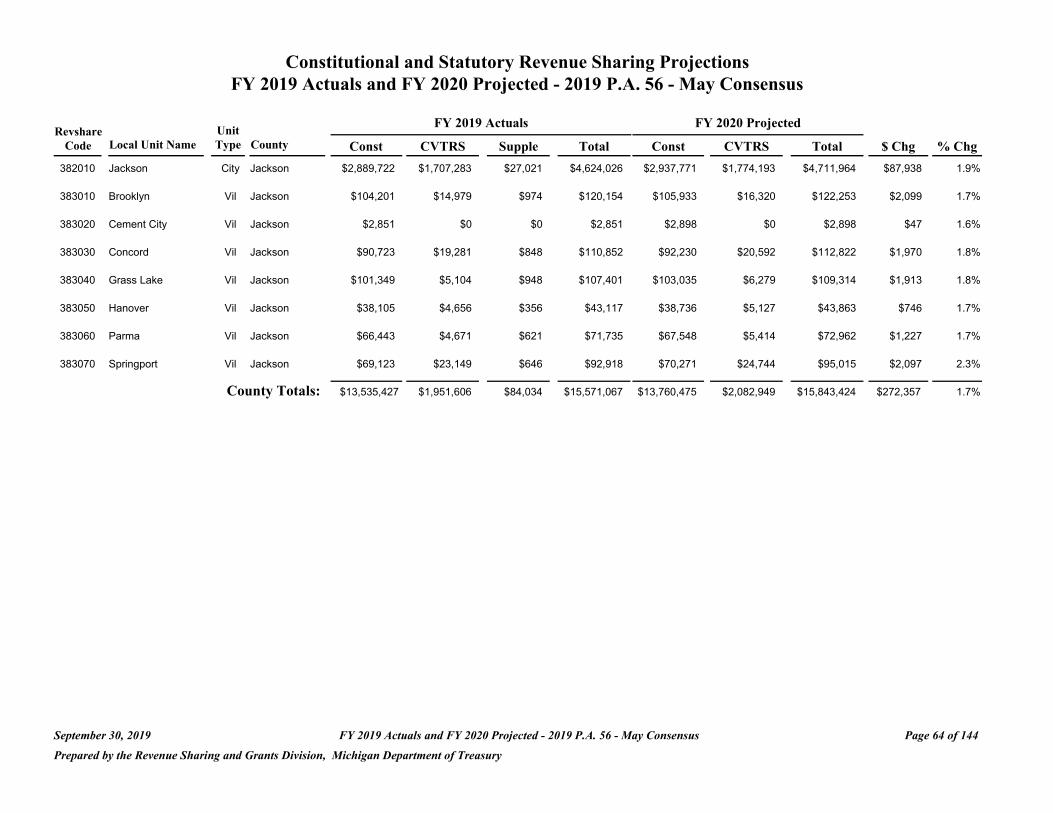
Constitutional and Statutory Revenue Sharing Projections FY 2019 Actuals and FY 2020 Projected - 2019 P.A. 56 - May Consensus
Revshare Unit FY 2019 Actuals FY 2020 Projected
Code Local Unit Name Type County Const CVTRS Supple Total Const CVTRS Total $ Chg % Chg
382010 Jackson City Jackson $2,889,722 $1,707,283 $27,021 $4,624,026 $2,937,771 $1,774,193 $4,711,964 $87,938 1.9%
383010 Brooklyn Vil Jackson $104,201 $14,979 $974 $120,154 $105,933 $16,320 $122,253 $2,099 1.7%
383020 Cement City Vil Jackson $2,851 $0 $0 $2,851 $2,898 $0 $2,898 $47 1.6%
383030 Concord Vil Jackson $90,723 $19,281 $848 $110,852 $92,230 $20,592 $112,822 $1,970 1.8%
383040 Grass Lake Vil Jackson $101,349 $5,104 $948 $107,401 $103,035 $6,279 $109,314 $1,913 1.8%
383050 Hanover Vil Jackson $38,105 $4,656 $356 $43,117 $38,736 $5,127 $43,863 $746 1.7%
383060 Parma Vil Jackson $66,443 $4,671 $621 $71,735 $67,548 $5,414 $72,962 $1,227 1.7%
383070 Springport Vil Jackson $69,123 $23,149 $646 $92,918 $70,271 $24,744 $95,015 $2,097 2.3%
County Totals: $13,535,427 $1,951,606 $84,034 $15,571,067 $13,760,475 $2,082,949 $15,843,424 $272,357 1.7%
September 30, 2019 FY 2019 Actuals and FY 2020 Projected - 2019 P.A. 56 - May Consensus Page 64 of 144
Prepared by the Revenue Sharing and Grants Division, Michigan Department of Treasury
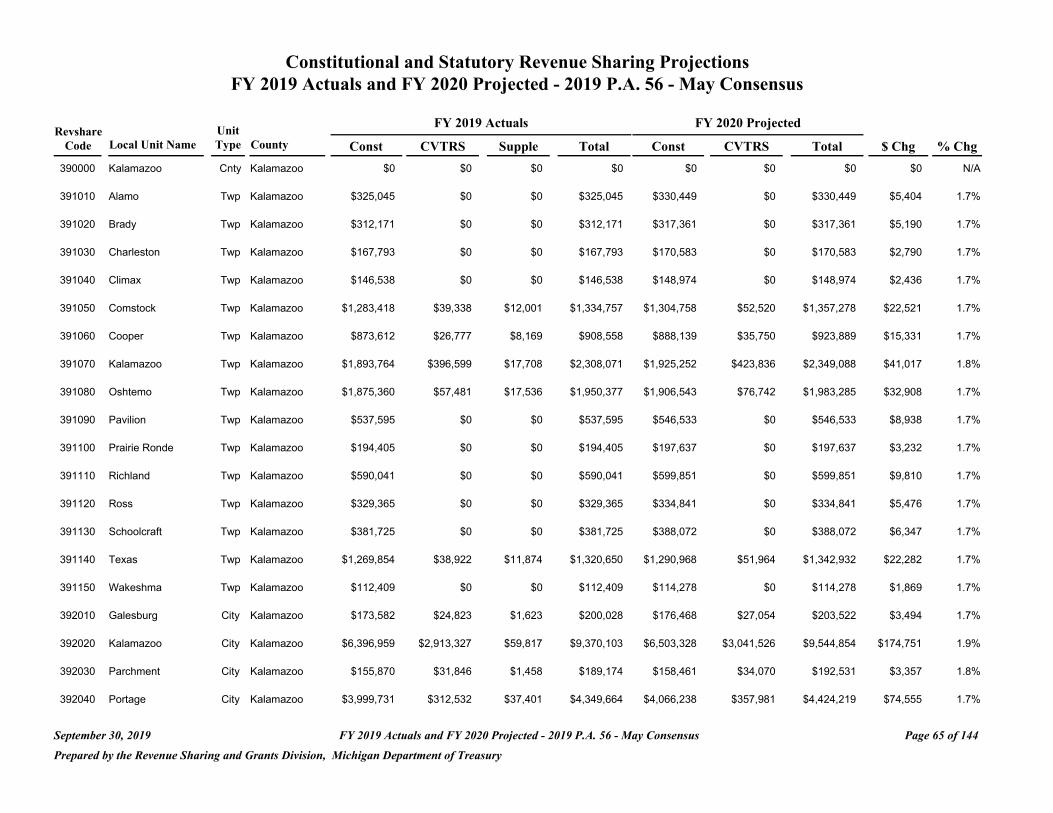
Constitutional and Statutory Revenue Sharing Projections FY 2019 Actuals and FY 2020 Projected - 2019 P.A. 56 - May Consensus
FY 2019 Actuals FY 2020 Projected Revshare Unit
Code Local Unit Name Type County Const CVTRS Supple Total Const CVTRS Total $ Chg % Chg
390000 Kalamazoo Cnty Kalamazoo $0 $0 $0 $0 $0 $0 $0 $0 N/A
391010 Alamo Twp Kalamazoo $325,045 $0 $0 $325,045 $330,449 $0 $330,449 $5,404 1.7%
391020 Brady Twp Kalamazoo $312,171 $0 $0 $312,171 $317,361 $0 $317,361 $5,190 1.7%
391030 Charleston Twp Kalamazoo $167,793 $0 $0 $167,793 $170,583 $0 $170,583 $2,790 1.7%
391040 Climax Twp Kalamazoo $146,538 $0 $0 $146,538 $148,974 $0 $148,974 $2,436 1.7%
391050 Comstock Twp Kalamazoo $1,283,418 $39,338 $12,001 $1,334,757 $1,304,758 $52,520 $1,357,278 $22,521 1.7%
391060 Cooper Twp Kalamazoo $873,612 $26,777 $8,169 $908,558 $888,139 $35,750 $923,889 $15,331 1.7%
391070 Kalamazoo Twp Kalamazoo $1,893,764 $396,599 $17,708 $2,308,071 $1,925,252 $423,836 $2,349,088 $41,017 1.8%
391080 Oshtemo Twp Kalamazoo $1,875,360 $57,481 $17,536 $1,950,377 $1,906,543 $76,742 $1,983,285 $32,908 1.7%
391090 Pavilion Twp Kalamazoo $537,595 $0 $0 $537,595 $546,533 $0 $546,533 $8,938 1.7%
391100 Prairie Ronde Twp Kalamazoo $194,405 $0 $0 $194,405 $197,637 $0 $197,637 $3,232 1.7%
391110 Richland Twp Kalamazoo $590,041 $0 $0 $590,041 $599,851 $0 $599,851 $9,810 1.7%
391120 Ross Twp Kalamazoo $329,365 $0 $0 $329,365 $334,841 $0 $334,841 $5,476 1.7%
391130 Schoolcraft Twp Kalamazoo $381,725 $0 $0 $381,725 $388,072 $0 $388,072 $6,347 1.7%
391140 Texas Twp Kalamazoo $1,269,854 $38,922 $11,874 $1,320,650 $1,290,968 $51,964 $1,342,932 $22,282 1.7%
391150 Wakeshma Twp Kalamazoo $112,409 $0 $0 $112,409 $114,278 $0 $114,278 $1,869 1.7%
392010 Galesburg City Kalamazoo $173,582 $24,823 $1,623 $200,028 $176,468 $27,054 $203,522 $3,494 1.7%
392020 Kalamazoo City Kalamazoo $6,396,959 $2,913,327 $59,817 $9,370,103 $6,503,328 $3,041,526 $9,544,854 $174,751 1.9%
392030 Parchment City Kalamazoo $155,870 $31,846 $1,458 $189,174 $158,461 $34,070 $192,531 $3,357 1.8%
392040 Portage City Kalamazoo $3,999,731 $312,532 $37,401 $4,349,664 $4,066,238 $357,981 $4,424,219 $74,555 1.7%
September 30, 2019 FY 2019 Actuals and FY 2020 Projected - 2019 P.A. 56 - May Consensus Page 65 of 144
Prepared by the Revenue Sharing and Grants Division, Michigan Department of Treasury
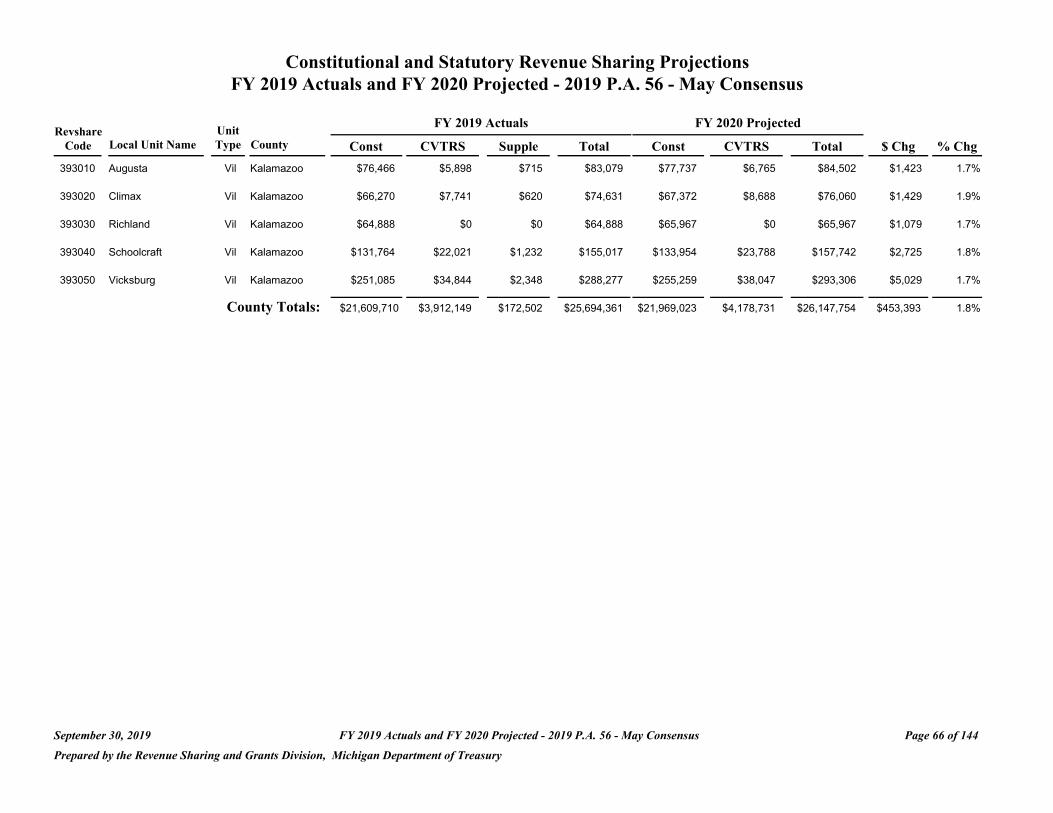
Constitutional and Statutory Revenue Sharing Projections FY 2019 Actuals and FY 2020 Projected - 2019 P.A. 56 - May Consensus
Revshare Unit FY 2019 Actuals FY 2020 Projected
Code Local Unit Name Type County Const CVTRS Supple Total Const CVTRS Total $ Chg % Chg
393010 Augusta Vil Kalamazoo $76,466 $5,898 $715 $83,079 $77,737 $6,765 $84,502 $1,423 1.7%
393020 Climax Vil Kalamazoo $66,270 $7,741 $620 $74,631 $67,372 $8,688 $76,060 $1,429 1.9%
393030 Richland Vil Kalamazoo $64,888 $0 $0 $64,888 $65,967 $0 $65,967 $1,079 1.7%
393040 Schoolcraft Vil Kalamazoo $131,764 $22,021 $1,232 $155,017 $133,954 $23,788 $157,742 $2,725 1.8%
393050 Vicksburg Vil Kalamazoo $251,085 $34,844 $2,348 $288,277 $255,259 $38,047 $293,306 $5,029 1.7%
County Totals: $21,609,710 $3,912,149 $172,502 $25,694,361 $21,969,023 $4,178,731 $26,147,754 $453,393 1.8%
September 30, 2019 FY 2019 Actuals and FY 2020 Projected - 2019 P.A. 56 - May Consensus Page 66 of 144
Prepared by the Revenue Sharing and Grants Division, Michigan Department of Treasury
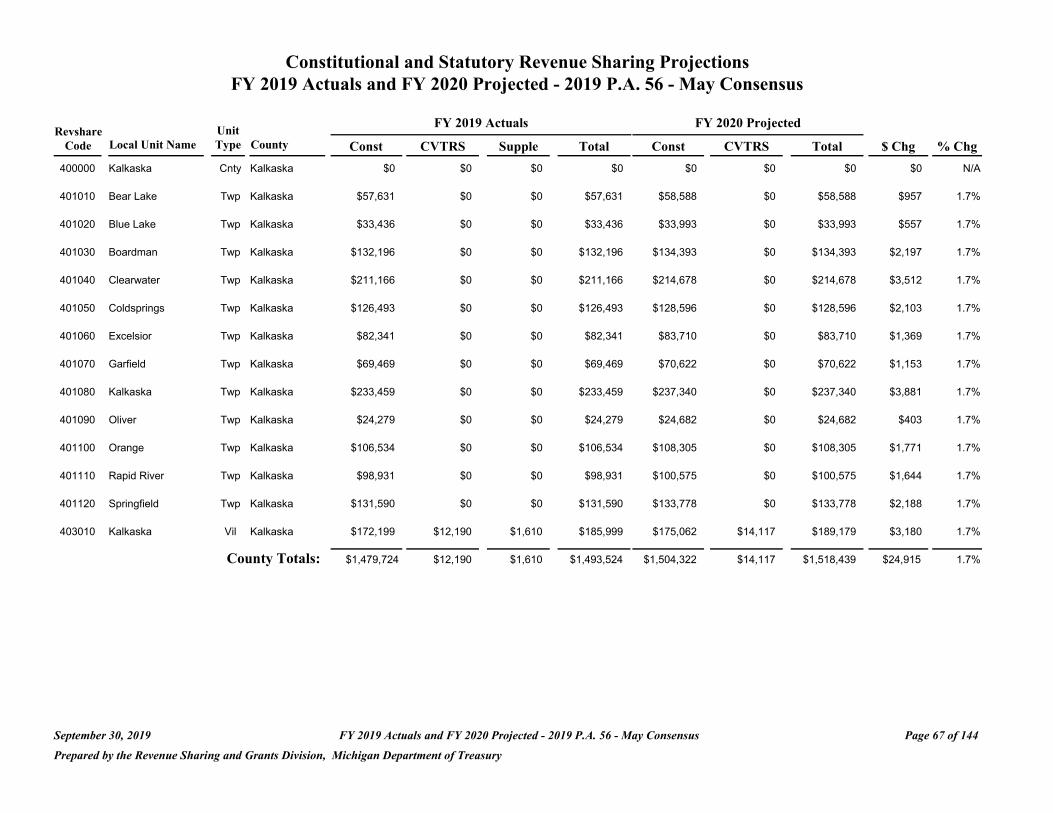
Constitutional and Statutory Revenue Sharing Projections FY 2019 Actuals and FY 2020 Projected - 2019 P.A. 56 - May Consensus
Revshare Unit FY 2019 Actuals FY 2020 Projected
Code Local Unit Name Type County Const CVTRS Supple Total Const CVTRS Total $ Chg % Chg
400000 Kalkaska Cnty Kalkaska $0 $0 $0 $0 $0 $0 $0 $0 N/A
401010 Bear Lake Twp Kalkaska $57,631 $0 $0 $57,631 $58,588 $0 $58,588 $957 1.7%
401020 Blue Lake Twp Kalkaska $33,436 $0 $0 $33,436 $33,993 $0 $33,993 $557 1.7%
401030 Boardman Twp Kalkaska $132,196 $0 $0 $132,196 $134,393 $0 $134,393 $2,197 1.7%
401040 Clearwater Twp Kalkaska $211,166 $0 $0 $211,166 $214,678 $0 $214,678 $3,512 1.7%
401050 Coldsprings Twp Kalkaska $126,493 $0 $0 $126,493 $128,596 $0 $128,596 $2,103 1.7%
401060 Excelsior Twp Kalkaska $82,341 $0 $0 $82,341 $83,710 $0 $83,710 $1,369 1.7%
401070 Garfield Twp Kalkaska $69,469 $0 $0 $69,469 $70,622 $0 $70,622 $1,153 1.7%
401080 Kalkaska Twp Kalkaska $233,459 $0 $0 $233,459 $237,340 $0 $237,340 $3,881 1.7%
401090 Oliver Twp Kalkaska $24,279 $0 $0 $24,279 $24,682 $0 $24,682 $403 1.7%
401100 Orange Twp Kalkaska $106,534 $0 $0 $106,534 $108,305 $0 $108,305 $1,771 1.7%
401110 Rapid River Twp Kalkaska $98,931 $0 $0 $98,931 $100,575 $0 $100,575 $1,644 1.7%
401120 Springfield Twp Kalkaska $131,590 $0 $0 $131,590 $133,778 $0 $133,778 $2,188 1.7%
403010 Kalkaska Vil Kalkaska $172,199 $12,190 $1,610 $185,999 $175,062 $14,117 $189,179 $3,180 1.7%
County Totals: $1,479,724 $12,190 $1,610 $1,493,524 $1,504,322 $14,117 $1,518,439 $24,915 1.7%
September 30, 2019 FY 2019 Actuals and FY 2020 Projected - 2019 P.A. 56 - May Consensus Page 67 of 144
Prepared by the Revenue Sharing and Grants Division, Michigan Department of Treasury
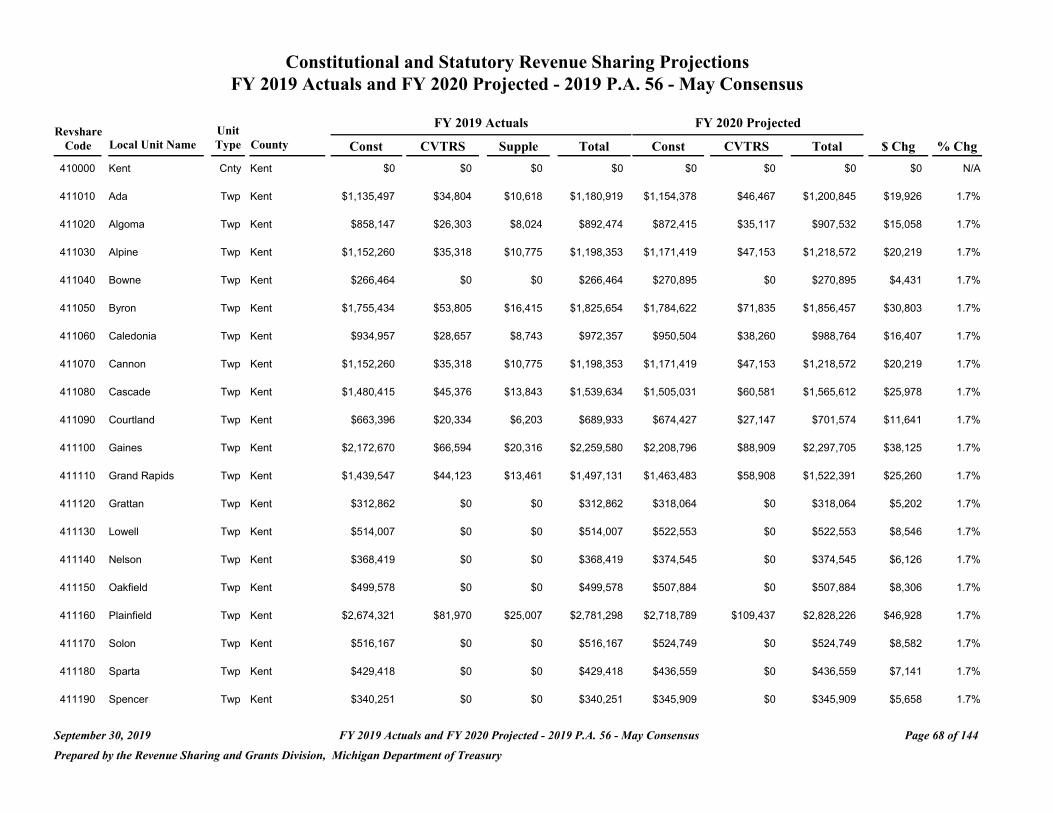
Constitutional and Statutory Revenue Sharing Projections FY 2019 Actuals and FY 2020 Projected - 2019 P.A. 56 - May Consensus
FY 2019 Actuals FY 2020 Projected Revshare Unit
Code Local Unit Name Type County Const CVTRS Supple Total Const CVTRS Total $ Chg % Chg
410000 Kent Cnty Kent $0 $0 $0 $0 $0 $0 $0 $0 N/A
411010 Ada Twp Kent $1,135,497 $34,804 $10,618 $1,180,919 $1,154,378 $46,467 $1,200,845 $19,926 1.7%
411020 Algoma Twp Kent $858,147 $26,303 $8,024 $892,474 $872,415 $35,117 $907,532 $15,058 1.7%
411030 Alpine Twp Kent $1,152,260 $35,318 $10,775 $1,198,353 $1,171,419 $47,153 $1,218,572 $20,219 1.7%
411040 Bowne Twp Kent $266,464 $0 $0 $266,464 $270,895 $0 $270,895 $4,431 1.7%
411050 Byron Twp Kent $1,755,434 $53,805 $16,415 $1,825,654 $1,784,622 $71,835 $1,856,457 $30,803 1.7%
411060 Caledonia Twp Kent $934,957 $28,657 $8,743 $972,357 $950,504 $38,260 $988,764 $16,407 1.7%
411070 Cannon Twp Kent $1,152,260 $35,318 $10,775 $1,198,353 $1,171,419 $47,153 $1,218,572 $20,219 1.7%
411080 Cascade Twp Kent $1,480,415 $45,376 $13,843 $1,539,634 $1,505,031 $60,581 $1,565,612 $25,978 1.7%
411090 Courtland Twp Kent $663,396 $20,334 $6,203 $689,933 $674,427 $27,147 $701,574 $11,641 1.7%
411100 Gaines Twp Kent $2,172,670 $66,594 $20,316 $2,259,580 $2,208,796 $88,909 $2,297,705 $38,125 1.7%
411110 Grand Rapids Twp Kent $1,439,547 $44,123 $13,461 $1,497,131 $1,463,483 $58,908 $1,522,391 $25,260 1.7%
411120 Grattan Twp Kent $312,862 $0 $0 $312,862 $318,064 $0 $318,064 $5,202 1.7%
411130 Lowell Twp Kent $514,007 $0 $0 $514,007 $522,553 $0 $522,553 $8,546 1.7%
411140 Nelson Twp Kent $368,419 $0 $0 $368,419 $374,545 $0 $374,545 $6,126 1.7%
411150 Oakfield Twp Kent $499,578 $0 $0 $499,578 $507,884 $0 $507,884 $8,306 1.7%
411160 Plainfield Twp Kent $2,674,321 $81,970 $25,007 $2,781,298 $2,718,789 $109,437 $2,828,226 $46,928 1.7%
411170 Solon Twp Kent $516,167 $0 $0 $516,167 $524,749 $0 $524,749 $8,582 1.7%
411180 Sparta Twp Kent $429,418 $0 $0 $429,418 $436,559 $0 $436,559 $7,141 1.7%
411190 Spencer Twp Kent $340,251 $0 $0 $340,251 $345,909 $0 $345,909 $5,658 1.7%
September 30, 2019 FY 2019 Actuals and FY 2020 Projected - 2019 P.A. 56 - May Consensus Page 68 of 144
Prepared by the Revenue Sharing and Grants Division, Michigan Department of Treasury
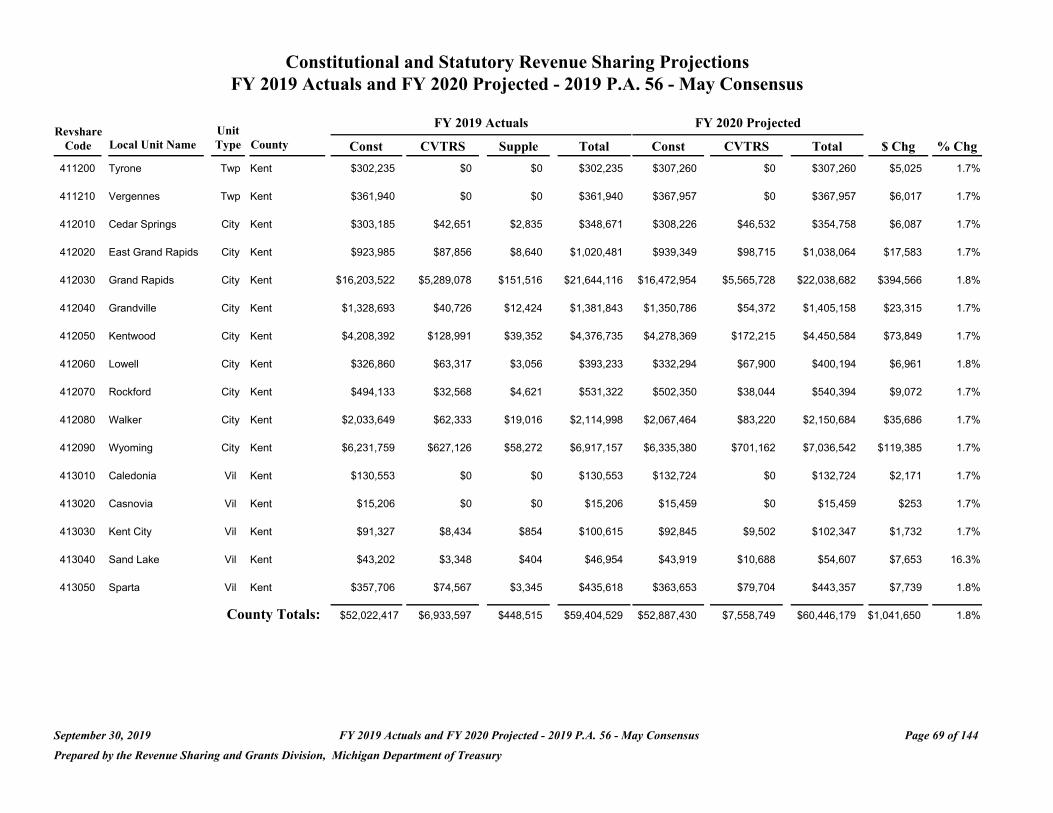
Constitutional and Statutory Revenue Sharing Projections FY 2019 Actuals and FY 2020 Projected - 2019 P.A. 56 - May Consensus
Revshare Unit FY 2019 Actuals FY 2020 Projected
Code Local Unit Name Type County Const CVTRS Supple Total Const CVTRS Total $ Chg % Chg
411200 Tyrone Twp Kent $302,235 $0 $0 $302,235 $307,260 $0 $307,260 $5,025 1.7%
411210 Vergennes Twp Kent $361,940 $0 $0 $361,940 $367,957 $0 $367,957 $6,017 1.7%
412010 Cedar Springs City Kent $303,185 $42,651 $2,835 $348,671 $308,226 $46,532 $354,758 $6,087 1.7%
412020 East Grand Rapids City Kent $923,985 $87,856 $8,640 $1,020,481 $939,349 $98,715 $1,038,064 $17,583 1.7%
412030 Grand Rapids City Kent $16,203,522 $5,289,078 $151,516 $21,644,116 $16,472,954 $5,565,728 $22,038,682 $394,566 1.8%
412040 Grandville City Kent $1,328,693 $40,726 $12,424 $1,381,843 $1,350,786 $54,372 $1,405,158 $23,315 1.7%
412050 Kentwood City Kent $4,208,392 $128,991 $39,352 $4,376,735 $4,278,369 $172,215 $4,450,584 $73,849 1.7%
412060 Lowell City Kent $326,860 $63,317 $3,056 $393,233 $332,294 $67,900 $400,194 $6,961 1.8%
412070 Rockford City Kent $494,133 $32,568 $4,621 $531,322 $502,350 $38,044 $540,394 $9,072 1.7%
412080 Walker City Kent $2,033,649 $62,333 $19,016 $2,114,998 $2,067,464 $83,220 $2,150,684 $35,686 1.7%
412090 Wyoming City Kent $6,231,759 $627,126 $58,272 $6,917,157 $6,335,380 $701,162 $7,036,542 $119,385 1.7%
413010 Caledonia Vil Kent $130,553 $0 $0 $130,553 $132,724 $0 $132,724 $2,171 1.7%
413020 Casnovia Vil Kent $15,206 $0 $0 $15,206 $15,459 $0 $15,459 $253 1.7%
413030 Kent City Vil Kent $91,327 $8,434 $854 $100,615 $92,845 $9,502 $102,347 $1,732 1.7%
413040 Sand Lake Vil Kent $43,202 $3,348 $404 $46,954 $43,919 $10,688 $54,607 $7,653 16.3%
413050 Sparta Vil Kent $357,706 $74,567 $3,345 $435,618 $363,653 $79,704 $443,357 $7,739 1.8%
County Totals: $52,022,417 $6,933,597 $448,515 $59,404,529 $52,887,430 $7,558,749 $60,446,179 $1,041,650 1.8%
September 30, 2019 FY 2019 Actuals and FY 2020 Projected - 2019 P.A. 56 - May Consensus Page 69 of 144
Prepared by the Revenue Sharing and Grants Division, Michigan Department of Treasury
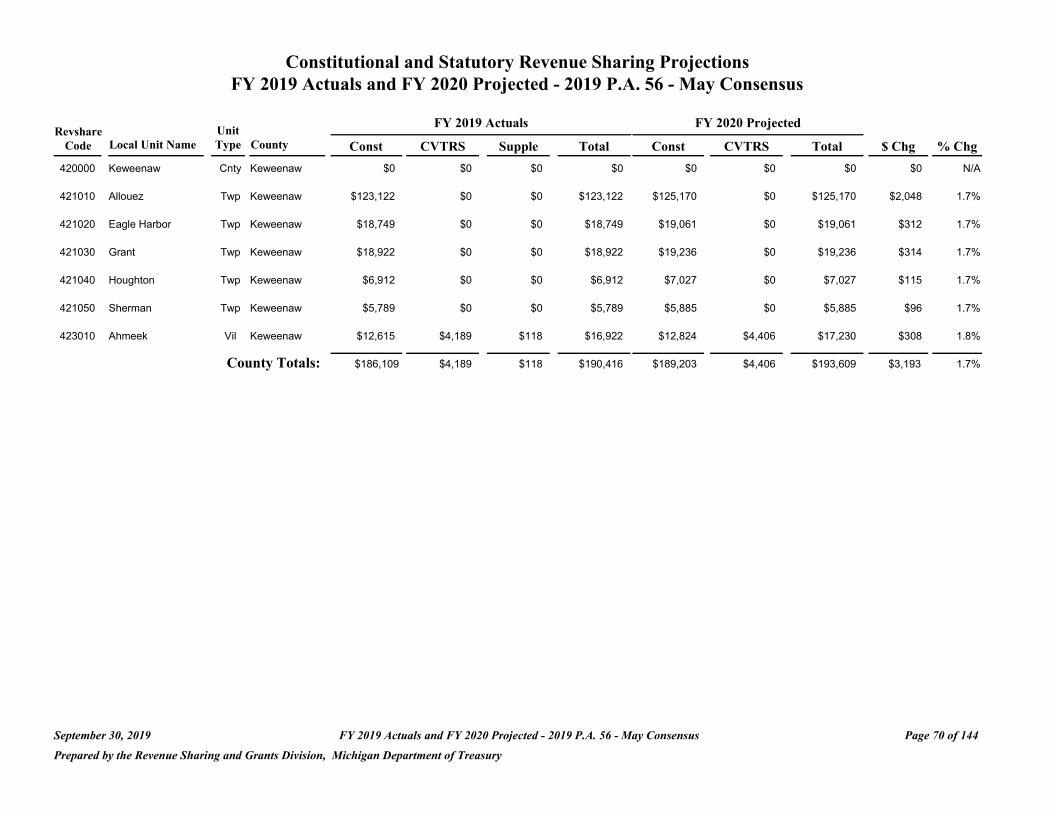
Constitutional and Statutory Revenue Sharing Projections FY 2019 Actuals and FY 2020 Projected - 2019 P.A. 56 - May Consensus
Revshare Unit FY 2019 Actuals FY 2020 Projected
Code Local Unit Name Type County Const CVTRS Supple Total Const CVTRS Total $ Chg % Chg
420000 Keweenaw Cnty Keweenaw $0 $0 $0 $0 $0 $0 $0 $0 N/A
421010 Allouez Twp Keweenaw $123,122 $0 $0 $123,122 $125,170 $0 $125,170 $2,048 1.7%
421020 Eagle Harbor Twp Keweenaw $18,749 $0 $0 $18,749 $19,061 $0 $19,061 $312 1.7%
421030 Grant Twp Keweenaw $18,922 $0 $0 $18,922 $19,236 $0 $19,236 $314 1.7%
421040 Houghton Twp Keweenaw $6,912 $0 $0 $6,912 $7,027 $0 $7,027 $115 1.7%
421050 Sherman Twp Keweenaw $5,789 $0 $0 $5,789 $5,885 $0 $5,885 $96 1.7%
423010 Ahmeek Vil Keweenaw $12,615 $4,189 $118 $16,922 $12,824 $4,406 $17,230 $308 1.8%
County Totals: $186,109 $4,189 $118 $190,416 $189,203 $4,406 $193,609 $3,193 1.7%
September 30, 2019 FY 2019 Actuals and FY 2020 Projected - 2019 P.A. 56 - May Consensus Page 70 of 144
Prepared by the Revenue Sharing and Grants Division, Michigan Department of Treasury

Constitutional and Statutory Revenue Sharing Projections FY 2019 Actuals and FY 2020 Projected - 2019 P.A. 56 - May Consensus
Revshare Unit FY 2019 Actuals FY 2020 Projected
Code Local Unit Name Type County Const CVTRS Supple Total Const CVTRS Total $ Chg % Chg
430000 Lake Cnty Lake $0 $0 $0 $0 $0 $0 $0 $0 N/A
431010 Chase Twp Lake $98,239 $0 $0 $98,239 $99,872 $0 $99,872 $1,633 1.7%
431020 Cherry Valley Twp Lake $34,216 $0 $0 $34,216 $34,784 $0 $34,784 $568 1.7%
431030 Dover Twp Lake $34,129 $0 $0 $34,129 $34,696 $0 $34,696 $567 1.7%
431040 Eden Twp Lake $42,079 $0 $0 $42,079 $42,777 $0 $42,777 $698 1.7%
431050 Elk Twp Lake $85,106 $0 $0 $85,106 $86,521 $0 $86,521 $1,415 1.7%
431060 Ellsworth Twp Lake $60,223 $0 $0 $60,223 $61,223 $0 $61,223 $1,000 1.7%
431070 Lake Twp Lake $74,479 $0 $0 $74,479 $75,717 $0 $75,717 $1,238 1.7%
431080 Newkirk Twp Lake $37,499 $0 $0 $37,499 $38,122 $0 $38,122 $623 1.7%
431090 Peacock Twp Lake $42,510 $0 $0 $42,510 $43,216 $0 $43,216 $706 1.7%
431100 Pinora Twp Lake $61,951 $0 $0 $61,951 $62,980 $0 $62,980 $1,029 1.7%
431110 Pleasant Plains Twp Lake $88,217 $0 $0 $88,217 $89,683 $0 $89,683 $1,466 1.7%
431120 Sauble Twp Lake $28,771 $0 $0 $28,771 $29,250 $0 $29,250 $479 1.7%
431130 Sweetwater Twp Lake $21,167 $0 $0 $21,167 $21,520 $0 $21,520 $353 1.7%
431140 Webber Twp Lake $90,808 $0 $0 $90,808 $92,318 $0 $92,318 $1,510 1.7%
431150 Yates Twp Lake $65,752 $0 $0 $65,752 $66,845 $0 $66,845 $1,093 1.7%
433010 Baldwin Vil Lake $91,846 $20,275 $859 $112,980 $93,372 $21,620 $114,992 $2,012 1.8%
433020 Luther Vil Lake $27,476 $6,008 $257 $33,741 $27,932 $6,409 $34,341 $600 1.8%
County Totals: $984,468 $26,283 $1,116 $1,011,867 $1,000,828 $28,029 $1,028,857 $16,990 1.7%
September 30, 2019 FY 2019 Actuals and FY 2020 Projected - 2019 P.A. 56 - May Consensus Page 71 of 144
Prepared by the Revenue Sharing and Grants Division, Michigan Department of Treasury
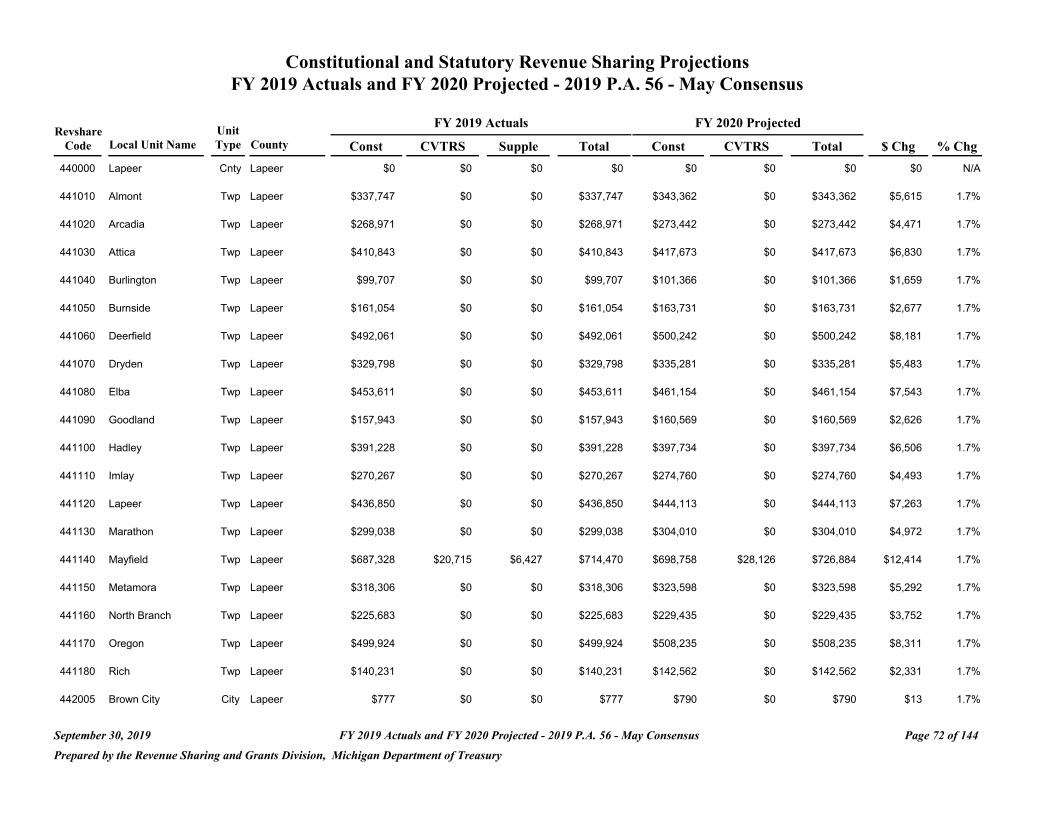
Constitutional and Statutory Revenue Sharing Projections FY 2019 Actuals and FY 2020 Projected - 2019 P.A. 56 - May Consensus
FY 2019 Actuals FY 2020 Projected Revshare Unit
Code Local Unit Name Type County Const CVTRS Supple Total Const CVTRS Total $ Chg % Chg
440000 Lapeer Cnty Lapeer $0 $0 $0 $0 $0 $0 $0 $0 N/A
441010 Almont Twp Lapeer $337,747 $0 $0 $337,747 $343,362 $0 $343,362 $5,615 1.7%
441020 Arcadia Twp Lapeer $268,971 $0 $0 $268,971 $273,442 $0 $273,442 $4,471 1.7%
441030 Attica Twp Lapeer $410,843 $0 $0 $410,843 $417,673 $0 $417,673 $6,830 1.7%
441040 Burlington Twp Lapeer $99,707 $0 $0 $99,707 $101,366 $0 $101,366 $1,659 1.7%
441050 Burnside Twp Lapeer $161,054 $0 $0 $161,054 $163,731 $0 $163,731 $2,677 1.7%
441060 Deerfield Twp Lapeer $492,061 $0 $0 $492,061 $500,242 $0 $500,242 $8,181 1.7%
441070 Dryden Twp Lapeer $329,798 $0 $0 $329,798 $335,281 $0 $335,281 $5,483 1.7%
441080 Elba Twp Lapeer $453,611 $0 $0 $453,611 $461,154 $0 $461,154 $7,543 1.7%
441090 Goodland Twp Lapeer $157,943 $0 $0 $157,943 $160,569 $0 $160,569 $2,626 1.7%
441100 Hadley Twp Lapeer $391,228 $0 $0 $391,228 $397,734 $0 $397,734 $6,506 1.7%
441110 Imlay Twp Lapeer $270,267 $0 $0 $270,267 $274,760 $0 $274,760 $4,493 1.7%
441120 Lapeer Twp Lapeer $436,850 $0 $0 $436,850 $444,113 $0 $444,113 $7,263 1.7%
441130 Marathon Twp Lapeer $299,038 $0 $0 $299,038 $304,010 $0 $304,010 $4,972 1.7%
441140 Mayfield Twp Lapeer $687,328 $20,715 $6,427 $714,470 $698,758 $28,126 $726,884 $12,414 1.7%
441150 Metamora Twp Lapeer $318,306 $0 $0 $318,306 $323,598 $0 $323,598 $5,292 1.7%
441160 North Branch Twp Lapeer $225,683 $0 $0 $225,683 $229,435 $0 $229,435 $3,752 1.7%
441170 Oregon Twp Lapeer $499,924 $0 $0 $499,924 $508,235 $0 $508,235 $8,311 1.7%
441180 Rich Twp Lapeer $140,231 $0 $0 $140,231 $142,562 $0 $142,562 $2,331 1.7%
442005 Brown City City Lapeer $777 $0 $0 $777 $790 $0 $790 $13 1.7%
September 30, 2019 FY 2019 Actuals and FY 2020 Projected - 2019 P.A. 56 - May Consensus Page 72 of 144
Prepared by the Revenue Sharing and Grants Division, Michigan Department of Treasury
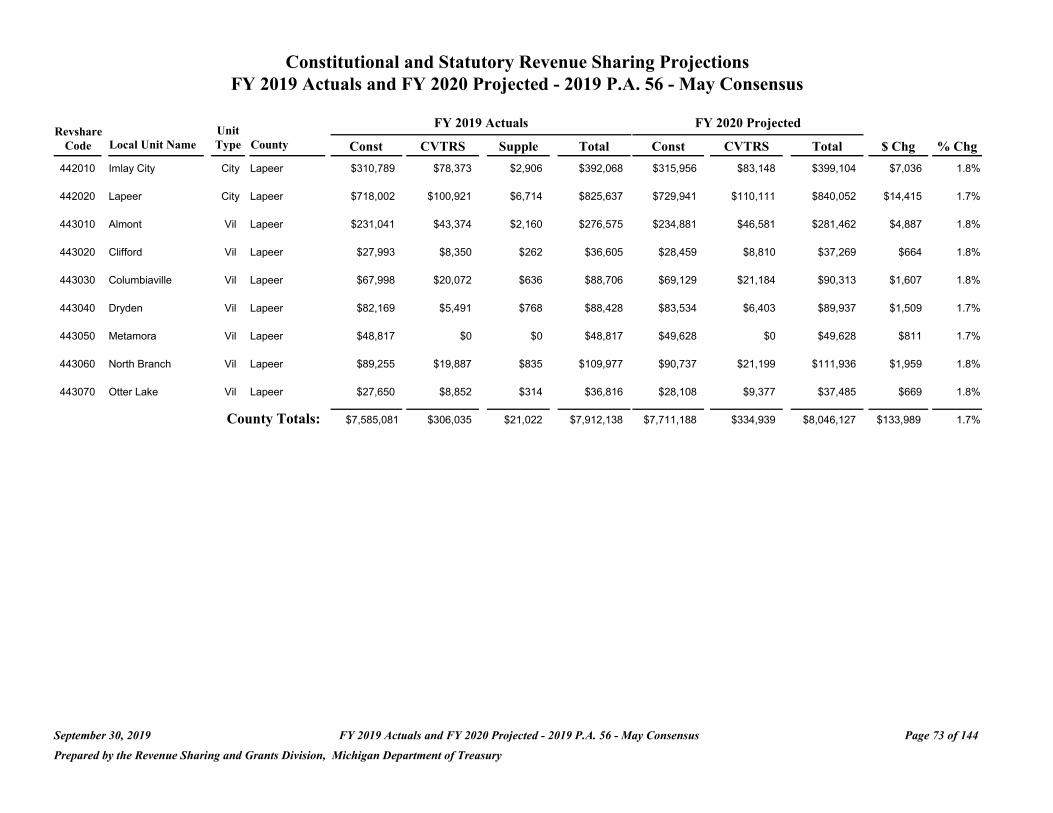
Constitutional and Statutory Revenue Sharing Projections FY 2019 Actuals and FY 2020 Projected - 2019 P.A. 56 - May Consensus
Revshare Unit FY 2019 Actuals FY 2020 Projected
Code Local Unit Name Type County Const CVTRS Supple Total Const CVTRS Total $ Chg % Chg
442010 Imlay City City Lapeer $310,789 $78,373 $2,906 $392,068 $315,956 $83,148 $399,104 $7,036 1.8%
442020 Lapeer City Lapeer $718,002 $100,921 $6,714 $825,637 $729,941 $110,111 $840,052 $14,415 1.7%
443010 Almont Vil Lapeer $231,041 $43,374 $2,160 $276,575 $234,881 $46,581 $281,462 $4,887 1.8%
443020 Clifford Vil Lapeer $27,993 $8,350 $262 $36,605 $28,459 $8,810 $37,269 $664 1.8%
443030 Columbiaville Vil Lapeer $67,998 $20,072 $636 $88,706 $69,129 $21,184 $90,313 $1,607 1.8%
443040 Dryden Vil Lapeer $82,169 $5,491 $768 $88,428 $83,534 $6,403 $89,937 $1,509 1.7%
443050 Metamora Vil Lapeer $48,817 $0 $0 $48,817 $49,628 $0 $49,628 $811 1.7%
443060 North Branch Vil Lapeer $89,255 $19,887 $835 $109,977 $90,737 $21,199 $111,936 $1,959 1.8%
443070 Otter Lake Vil Lapeer $27,650 $8,852 $314 $36,816 $28,108 $9,377 $37,485 $669 1.8%
County Totals: $7,585,081 $306,035 $21,022 $7,912,138 $7,711,188 $334,939 $8,046,127 $133,989 1.7%
September 30, 2019 FY 2019 Actuals and FY 2020 Projected - 2019 P.A. 56 - May Consensus Page 73 of 144
Prepared by the Revenue Sharing and Grants Division, Michigan Department of Treasury
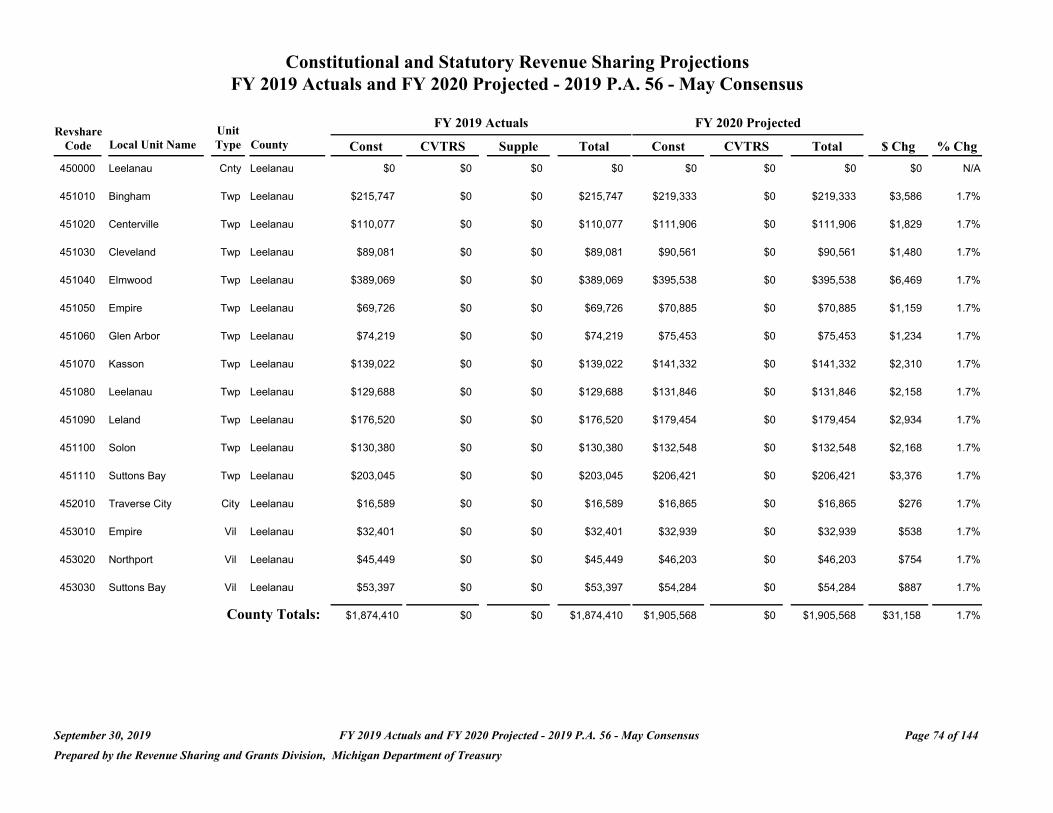
Constitutional and Statutory Revenue Sharing Projections FY 2019 Actuals and FY 2020 Projected - 2019 P.A. 56 - May Consensus
Revshare Unit FY 2019 Actuals FY 2020 Projected
Code Local Unit Name Type County Const CVTRS Supple Total Const CVTRS Total $ Chg % Chg
450000 Leelanau Cnty Leelanau $0 $0 $0 $0 $0 $0 $0 $0 N/A
451010 Bingham Twp Leelanau $215,747 $0 $0 $215,747 $219,333 $0 $219,333 $3,586 1.7%
451020 Centerville Twp Leelanau $110,077 $0 $0 $110,077 $111,906 $0 $111,906 $1,829 1.7%
451030 Cleveland Twp Leelanau $89,081 $0 $0 $89,081 $90,561 $0 $90,561 $1,480 1.7%
451040 Elmwood Twp Leelanau $389,069 $0 $0 $389,069 $395,538 $0 $395,538 $6,469 1.7%
451050 Empire Twp Leelanau $69,726 $0 $0 $69,726 $70,885 $0 $70,885 $1,159 1.7%
451060 Glen Arbor Twp Leelanau $74,219 $0 $0 $74,219 $75,453 $0 $75,453 $1,234 1.7%
451070 Kasson Twp Leelanau $139,022 $0 $0 $139,022 $141,332 $0 $141,332 $2,310 1.7%
451080 Leelanau Twp Leelanau $129,688 $0 $0 $129,688 $131,846 $0 $131,846 $2,158 1.7%
451090 Leland Twp Leelanau $176,520 $0 $0 $176,520 $179,454 $0 $179,454 $2,934 1.7%
451100 Solon Twp Leelanau $130,380 $0 $0 $130,380 $132,548 $0 $132,548 $2,168 1.7%
451110 Suttons Bay Twp Leelanau $203,045 $0 $0 $203,045 $206,421 $0 $206,421 $3,376 1.7%
452010 Traverse City City Leelanau $16,589 $0 $0 $16,589 $16,865 $0 $16,865 $276 1.7%
453010 Empire Vil Leelanau $32,401 $0 $0 $32,401 $32,939 $0 $32,939 $538 1.7%
453020 Northport Vil Leelanau $45,449 $0 $0 $45,449 $46,203 $0 $46,203 $754 1.7%
453030 Suttons Bay Vil Leelanau $53,397 $0 $0 $53,397 $54,284 $0 $54,284 $887 1.7%
County Totals: $1,874,410 $0 $0 $1,874,410 $1,905,568 $0 $1,905,568 $31,158 1.7%
September 30, 2019 FY 2019 Actuals and FY 2020 Projected - 2019 P.A. 56 - May Consensus Page 74 of 144
Prepared by the Revenue Sharing and Grants Division, Michigan Department of Treasury
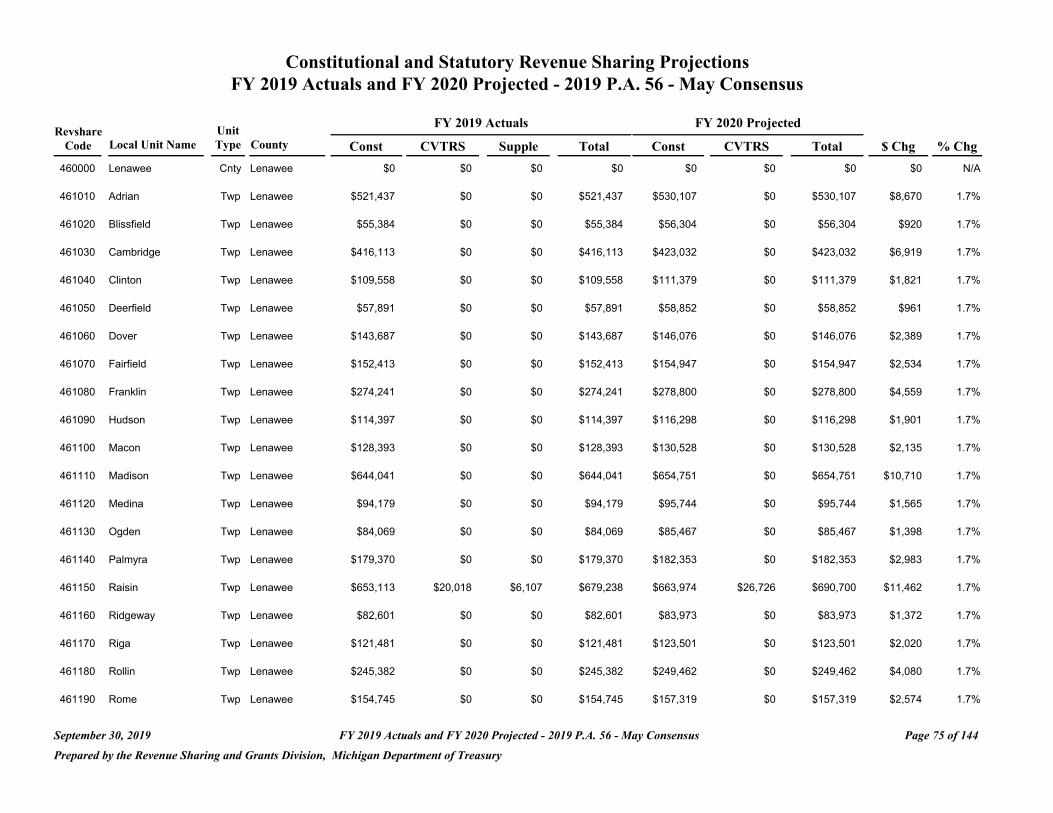
Constitutional and Statutory Revenue Sharing Projections FY 2019 Actuals and FY 2020 Projected - 2019 P.A. 56 - May Consensus
FY 2019 Actuals FY 2020 Projected Revshare Unit
Code Local Unit Name Type County Const CVTRS Supple Total Const CVTRS Total $ Chg % Chg
460000 Lenawee Cnty Lenawee $0 $0 $0 $0 $0 $0 $0 $0 N/A
461010 Adrian Twp Lenawee $521,437 $0 $0 $521,437 $530,107 $0 $530,107 $8,670 1.7%
461020 Blissfield Twp Lenawee $55,384 $0 $0 $55,384 $56,304 $0 $56,304 $920 1.7%
461030 Cambridge Twp Lenawee $416,113 $0 $0 $416,113 $423,032 $0 $423,032 $6,919 1.7%
461040 Clinton Twp Lenawee $109,558 $0 $0 $109,558 $111,379 $0 $111,379 $1,821 1.7%
461050 Deerfield Twp Lenawee $57,891 $0 $0 $57,891 $58,852 $0 $58,852 $961 1.7%
461060 Dover Twp Lenawee $143,687 $0 $0 $143,687 $146,076 $0 $146,076 $2,389 1.7%
461070 Fairfield Twp Lenawee $152,413 $0 $0 $152,413 $154,947 $0 $154,947 $2,534 1.7%
461080 Franklin Twp Lenawee $274,241 $0 $0 $274,241 $278,800 $0 $278,800 $4,559 1.7%
461090 Hudson Twp Lenawee $114,397 $0 $0 $114,397 $116,298 $0 $116,298 $1,901 1.7%
461100 Macon Twp Lenawee $128,393 $0 $0 $128,393 $130,528 $0 $130,528 $2,135 1.7%
461110 Madison Twp Lenawee $644,041 $0 $0 $644,041 $654,751 $0 $654,751 $10,710 1.7%
461120 Medina Twp Lenawee $94,179 $0 $0 $94,179 $95,744 $0 $95,744 $1,565 1.7%
461130 Ogden Twp Lenawee $84,069 $0 $0 $84,069 $85,467 $0 $85,467 $1,398 1.7%
461140 Palmyra Twp Lenawee $179,370 $0 $0 $179,370 $182,353 $0 $182,353 $2,983 1.7%
461150 Raisin Twp Lenawee $653,113 $20,018 $6,107 $679,238 $663,974 $26,726 $690,700 $11,462 1.7%
461160 Ridgeway Twp Lenawee $82,601 $0 $0 $82,601 $83,973 $0 $83,973 $1,372 1.7%
461170 Riga Twp Lenawee $121,481 $0 $0 $121,481 $123,501 $0 $123,501 $2,020 1.7%
461180 Rollin Twp Lenawee $245,382 $0 $0 $245,382 $249,462 $0 $249,462 $4,080 1.7%
461190 Rome Twp Lenawee $154,745 $0 $0 $154,745 $157,319 $0 $157,319 $2,574 1.7%
September 30, 2019 FY 2019 Actuals and FY 2020 Projected - 2019 P.A. 56 - May Consensus Page 75 of 144
Prepared by the Revenue Sharing and Grants Division, Michigan Department of Treasury
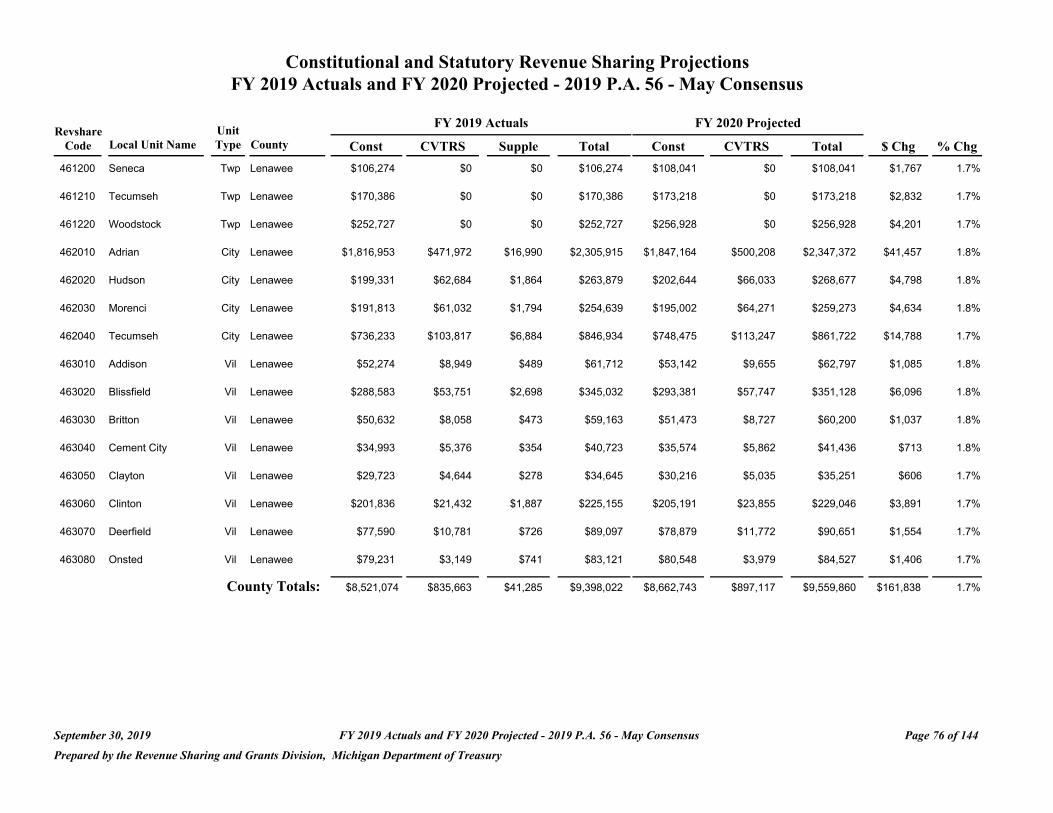
Constitutional and Statutory Revenue Sharing Projections FY 2019 Actuals and FY 2020 Projected - 2019 P.A. 56 - May Consensus
Revshare Unit FY 2019 Actuals FY 2020 Projected
Code Local Unit Name Type County Const CVTRS Supple Total Const CVTRS Total $ Chg % Chg
461200 Seneca Twp Lenawee $106,274 $0 $0 $106,274 $108,041 $0 $108,041 $1,767 1.7%
461210 Tecumseh Twp Lenawee $170,386 $0 $0 $170,386 $173,218 $0 $173,218 $2,832 1.7%
461220 Woodstock Twp Lenawee $252,727 $0 $0 $252,727 $256,928 $0 $256,928 $4,201 1.7%
462010 Adrian City Lenawee $1,816,953 $471,972 $16,990 $2,305,915 $1,847,164 $500,208 $2,347,372 $41,457 1.8%
462020 Hudson City Lenawee $199,331 $62,684 $1,864 $263,879 $202,644 $66,033 $268,677 $4,798 1.8%
462030 Morenci City Lenawee $191,813 $61,032 $1,794 $254,639 $195,002 $64,271 $259,273 $4,634 1.8%
462040 Tecumseh City Lenawee $736,233 $103,817 $6,884 $846,934 $748,475 $113,247 $861,722 $14,788 1.7%
463010 Addison Vil Lenawee $52,274 $8,949 $489 $61,712 $53,142 $9,655 $62,797 $1,085 1.8%
463020 Blissfield Vil Lenawee $288,583 $53,751 $2,698 $345,032 $293,381 $57,747 $351,128 $6,096 1.8%
463030 Britton Vil Lenawee $50,632 $8,058 $473 $59,163 $51,473 $8,727 $60,200 $1,037 1.8%
463040 Cement City Vil Lenawee $34,993 $5,376 $354 $40,723 $35,574 $5,862 $41,436 $713 1.8%
463050 Clayton Vil Lenawee $29,723 $4,644 $278 $34,645 $30,216 $5,035 $35,251 $606 1.7%
463060 Clinton Vil Lenawee $201,836 $21,432 $1,887 $225,155 $205,191 $23,855 $229,046 $3,891 1.7%
463070 Deerfield Vil Lenawee $77,590 $10,781 $726 $89,097 $78,879 $11,772 $90,651 $1,554 1.7%
463080 Onsted Vil Lenawee $79,231 $3,149 $741 $83,121 $80,548 $3,979 $84,527 $1,406 1.7%
County Totals: $8,521,074 $835,663 $41,285 $9,398,022 $8,662,743 $897,117 $9,559,860 $161,838 1.7%
September 30, 2019 FY 2019 Actuals and FY 2020 Projected - 2019 P.A. 56 - May Consensus Page 76 of 144
Prepared by the Revenue Sharing and Grants Division, Michigan Department of Treasury
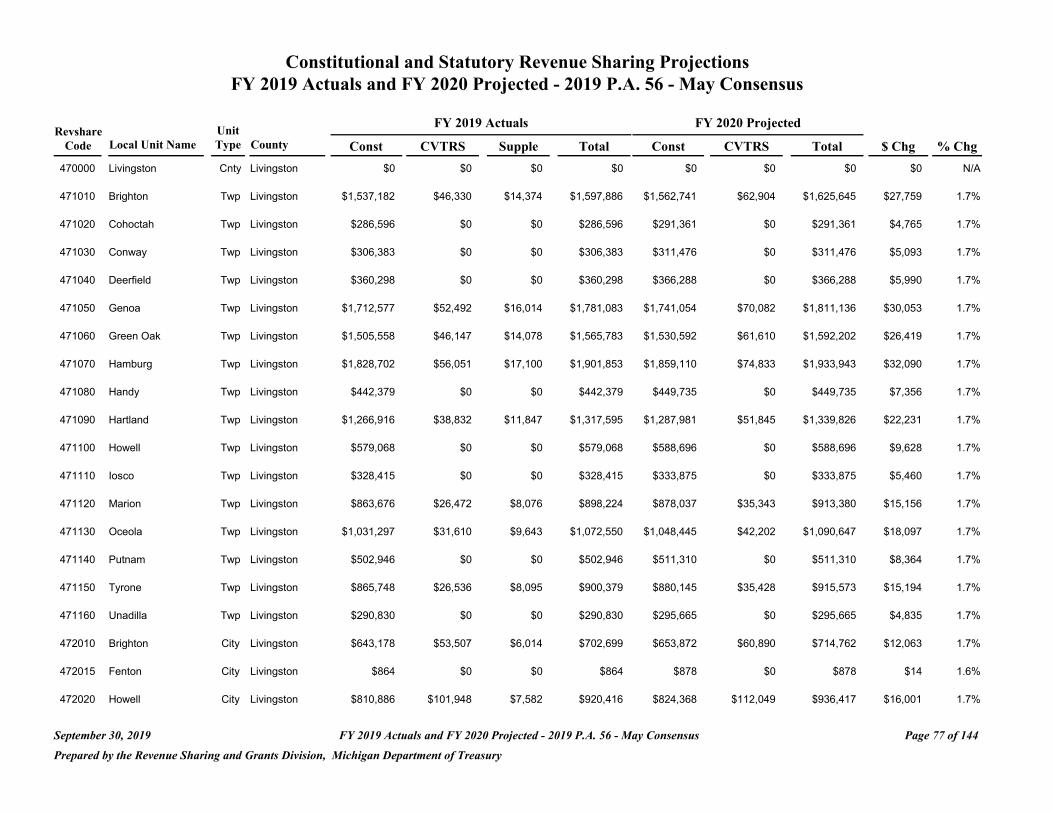
Constitutional and Statutory Revenue Sharing Projections FY 2019 Actuals and FY 2020 Projected - 2019 P.A. 56 - May Consensus
FY 2019 Actuals FY 2020 Projected Revshare Unit
Code Local Unit Name Type County Const CVTRS Supple Total Const CVTRS Total $ Chg % Chg
470000 Livingston Cnty Livingston $0 $0 $0 $0 $0 $0 $0 $0 N/A
471010 Brighton Twp Livingston $1,537,182 $46,330 $14,374 $1,597,886 $1,562,741 $62,904 $1,625,645 $27,759 1.7%
471020 Cohoctah Twp Livingston $286,596 $0 $0 $286,596 $291,361 $0 $291,361 $4,765 1.7%
471030 Conway Twp Livingston $306,383 $0 $0 $306,383 $311,476 $0 $311,476 $5,093 1.7%
471040 Deerfield Twp Livingston $360,298 $0 $0 $360,298 $366,288 $0 $366,288 $5,990 1.7%
471050 Genoa Twp Livingston $1,712,577 $52,492 $16,014 $1,781,083 $1,741,054 $70,082 $1,811,136 $30,053 1.7%
471060 Green Oak Twp Livingston $1,505,558 $46,147 $14,078 $1,565,783 $1,530,592 $61,610 $1,592,202 $26,419 1.7%
471070 Hamburg Twp Livingston $1,828,702 $56,051 $17,100 $1,901,853 $1,859,110 $74,833 $1,933,943 $32,090 1.7%
471080 Handy Twp Livingston $442,379 $0 $0 $442,379 $449,735 $0 $449,735 $7,356 1.7%
471090 Hartland Twp Livingston $1,266,916 $38,832 $11,847 $1,317,595 $1,287,981 $51,845 $1,339,826 $22,231 1.7%
471100 Howell Twp Livingston $579,068 $0 $0 $579,068 $588,696 $0 $588,696 $9,628 1.7%
471110 Iosco Twp Livingston $328,415 $0 $0 $328,415 $333,875 $0 $333,875 $5,460 1.7%
471120 Marion Twp Livingston $863,676 $26,472 $8,076 $898,224 $878,037 $35,343 $913,380 $15,156 1.7%
471130 Oceola Twp Livingston $1,031,297 $31,610 $9,643 $1,072,550 $1,048,445 $42,202 $1,090,647 $18,097 1.7%
471140 Putnam Twp Livingston $502,946 $0 $0 $502,946 $511,310 $0 $511,310 $8,364 1.7%
471150 Tyrone Twp Livingston $865,748 $26,536 $8,095 $900,379 $880,145 $35,428 $915,573 $15,194 1.7%
471160 Unadilla Twp Livingston $290,830 $0 $0 $290,830 $295,665 $0 $295,665 $4,835 1.7%
472010 Brighton City Livingston $643,178 $53,507 $6,014 $702,699 $653,872 $60,890 $714,762 $12,063 1.7%
472015 Fenton City Livingston $864 $0 $0 $864 $878 $0 $878 $14 1.6%
472020 Howell City Livingston $810,886 $101,948 $7,582 $920,416 $824,368 $112,049 $936,417 $16,001 1.7%
September 30, 2019 FY 2019 Actuals and FY 2020 Projected - 2019 P.A. 56 - May Consensus Page 77 of 144
Prepared by the Revenue Sharing and Grants Division, Michigan Department of Treasury

Constitutional and Statutory Revenue Sharing Projections FY 2019 Actuals and FY 2020 Projected - 2019 P.A. 56 - May Consensus
Revshare Code
473010
Local Unit Name
Fowlerville
Unit Type County
Vil Livingston
Const $249,356
FY 2019 Actuals
CVTRS Supple
$44,599 $2,332
Total $296,287
FY 2020 Projected
Const CVTRS
$253,503 $48,010
Total $301,513
$ Chg
$5,226
% Chg
1.8%
473020 Pinckney Vil Livingston $209,698 $0 $0 $209,698 $213,184 $0 $213,184 $3,486 1.7%
County Totals: $15,622,553 $524,524 $115,155 $16,262,232 $15,882,316 $655,196 $16,537,512 $275,280 1.7%
September 30, 2019 FY 2019 Actuals and FY 2020 Projected - 2019 P.A. 56 - May Consensus Page 78 of 144
Prepared by the Revenue Sharing and Grants Division, Michigan Department of Treasury
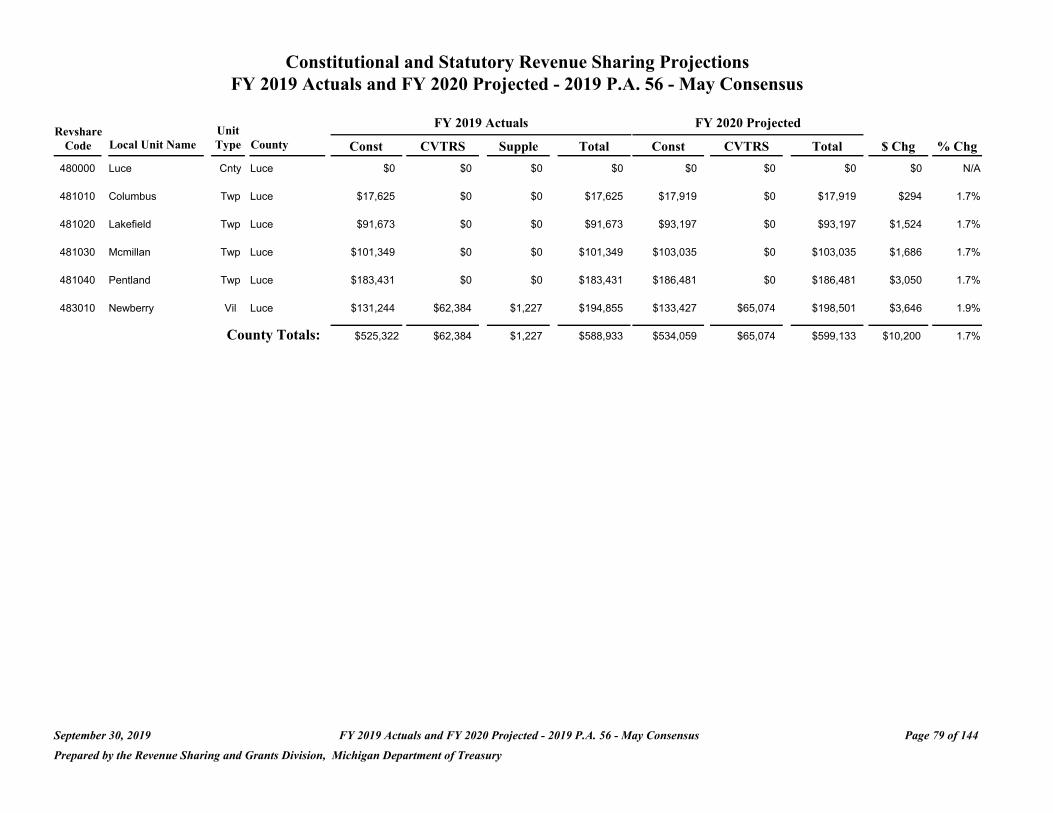
Constitutional and Statutory Revenue Sharing Projections FY 2019 Actuals and FY 2020 Projected - 2019 P.A. 56 - May Consensus
Revshare Code Local Unit Name
480000 Luce
Unit Type County
Cnty Luce
Const $0
FY 2019 Actuals
CVTRS Supple
$0 $0
Total $0
FY 2020 Projected
Const CVTRS
$0 $0
Total $0
$ Chg
$0
% Chg
N/A
481010 Columbus Twp Luce $17,625 $0 $0 $17,625 $17,919 $0 $17,919 $294 1.7%
481020 Lakefield Twp Luce $91,673 $0 $0 $91,673 $93,197 $0 $93,197 $1,524 1.7%
481030 Mcmillan Twp Luce $101,349 $0 $0 $101,349 $103,035 $0 $103,035 $1,686 1.7%
481040 Pentland Twp Luce $183,431 $0 $0 $183,431 $186,481 $0 $186,481 $3,050 1.7%
483010 Newberry Vil Luce $131,244 $62,384 $1,227 $194,855 $133,427 $65,074 $198,501 $3,646 1.9%
County Totals: $525,322 $62,384 $1,227 $588,933 $534,059 $65,074 $599,133 $10,200 1.7%
September 30, 2019 FY 2019 Actuals and FY 2020 Projected - 2019 P.A. 56 - May Consensus Page 79 of 144
Prepared by the Revenue Sharing and Grants Division, Michigan Department of Treasury
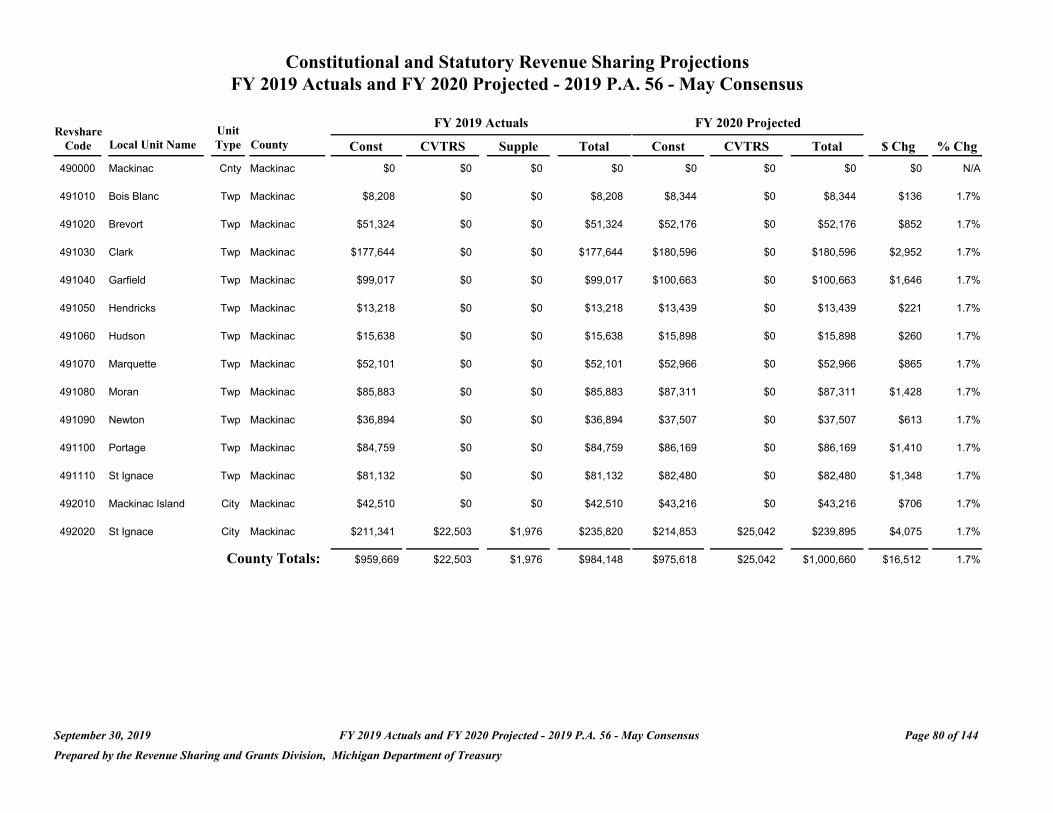
Constitutional and Statutory Revenue Sharing Projections FY 2019 Actuals and FY 2020 Projected - 2019 P.A. 56 - May Consensus
Revshare Unit FY 2019 Actuals FY 2020 Projected
Code Local Unit Name Type County Const CVTRS Supple Total Const CVTRS Total $ Chg % Chg
490000 Mackinac Cnty Mackinac $0 $0 $0 $0 $0 $0 $0 $0 N/A
491010 Bois Blanc Twp Mackinac $8,208 $0 $0 $8,208 $8,344 $0 $8,344 $136 1.7%
491020 Brevort Twp Mackinac $51,324 $0 $0 $51,324 $52,176 $0 $52,176 $852 1.7%
491030 Clark Twp Mackinac $177,644 $0 $0 $177,644 $180,596 $0 $180,596 $2,952 1.7%
491040 Garfield Twp Mackinac $99,017 $0 $0 $99,017 $100,663 $0 $100,663 $1,646 1.7%
491050 Hendricks Twp Mackinac $13,218 $0 $0 $13,218 $13,439 $0 $13,439 $221 1.7%
491060 Hudson Twp Mackinac $15,638 $0 $0 $15,638 $15,898 $0 $15,898 $260 1.7%
491070 Marquette Twp Mackinac $52,101 $0 $0 $52,101 $52,966 $0 $52,966 $865 1.7%
491080 Moran Twp Mackinac $85,883 $0 $0 $85,883 $87,311 $0 $87,311 $1,428 1.7%
491090 Newton Twp Mackinac $36,894 $0 $0 $36,894 $37,507 $0 $37,507 $613 1.7%
491100 Portage Twp Mackinac $84,759 $0 $0 $84,759 $86,169 $0 $86,169 $1,410 1.7%
491110 St Ignace Twp Mackinac $81,132 $0 $0 $81,132 $82,480 $0 $82,480 $1,348 1.7%
492010 Mackinac Island City Mackinac $42,510 $0 $0 $42,510 $43,216 $0 $43,216 $706 1.7%
492020 St Ignace City Mackinac $211,341 $22,503 $1,976 $235,820 $214,853 $25,042 $239,895 $4,075 1.7%
County Totals: $959,669 $22,503 $1,976 $984,148 $975,618 $25,042 $1,000,660 $16,512 1.7%
September 30, 2019 FY 2019 Actuals and FY 2020 Projected - 2019 P.A. 56 - May Consensus Page 80 of 144
Prepared by the Revenue Sharing and Grants Division, Michigan Department of Treasury
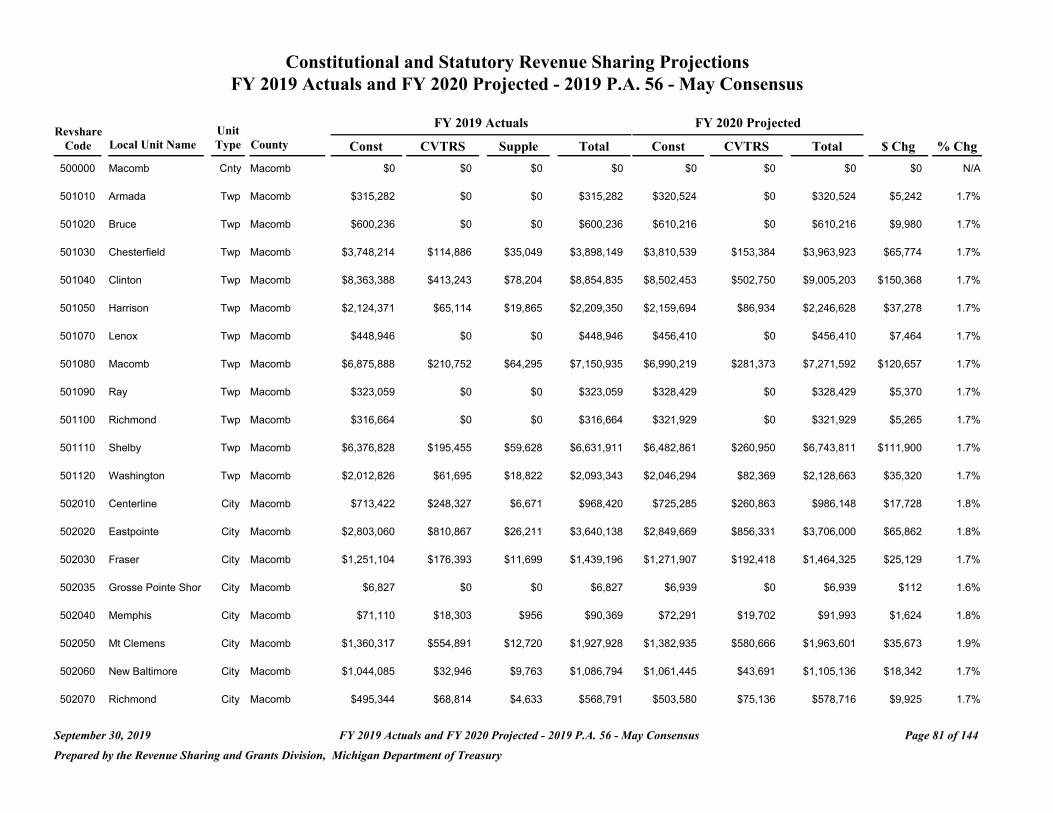
Constitutional and Statutory Revenue Sharing Projections FY 2019 Actuals and FY 2020 Projected - 2019 P.A. 56 - May Consensus
FY 2019 Actuals FY 2020 Projected Revshare Unit
Code Local Unit Name Type County Const CVTRS Supple Total Const CVTRS Total $ Chg % Chg
500000 Macomb Cnty Macomb $0 $0 $0 $0 $0 $0 $0 $0 N/A
501010 Armada Twp Macomb $315,282 $0 $0 $315,282 $320,524 $0 $320,524 $5,242 1.7%
501020 Bruce Twp Macomb $600,236 $0 $0 $600,236 $610,216 $0 $610,216 $9,980 1.7%
501030 Chesterfield Twp Macomb $3,748,214 $114,886 $35,049 $3,898,149 $3,810,539 $153,384 $3,963,923 $65,774 1.7%
501040 Clinton Twp Macomb $8,363,388 $413,243 $78,204 $8,854,835 $8,502,453 $502,750 $9,005,203 $150,368 1.7%
501050 Harrison Twp Macomb $2,124,371 $65,114 $19,865 $2,209,350 $2,159,694 $86,934 $2,246,628 $37,278 1.7%
501070 Lenox Twp Macomb $448,946 $0 $0 $448,946 $456,410 $0 $456,410 $7,464 1.7%
501080 Macomb Twp Macomb $6,875,888 $210,752 $64,295 $7,150,935 $6,990,219 $281,373 $7,271,592 $120,657 1.7%
501090 Ray Twp Macomb $323,059 $0 $0 $323,059 $328,429 $0 $328,429 $5,370 1.7%
501100 Richmond Twp Macomb $316,664 $0 $0 $316,664 $321,929 $0 $321,929 $5,265 1.7%
501110 Shelby Twp Macomb $6,376,828 $195,455 $59,628 $6,631,911 $6,482,861 $260,950 $6,743,811 $111,900 1.7%
501120 Washington Twp Macomb $2,012,826 $61,695 $18,822 $2,093,343 $2,046,294 $82,369 $2,128,663 $35,320 1.7%
502010 Centerline City Macomb $713,422 $248,327 $6,671 $968,420 $725,285 $260,863 $986,148 $17,728 1.8%
502020 Eastpointe City Macomb $2,803,060 $810,867 $26,211 $3,640,138 $2,849,669 $856,331 $3,706,000 $65,862 1.8%
502030 Fraser City Macomb $1,251,104 $176,393 $11,699 $1,439,196 $1,271,907 $192,418 $1,464,325 $25,129 1.7%
502035 Grosse Pointe Shor City Macomb $6,827 $0 $0 $6,827 $6,939 $0 $6,939 $112 1.6%
502040 Memphis City Macomb $71,110 $18,303 $956 $90,369 $72,291 $19,702 $91,993 $1,624 1.8%
502050 Mt Clemens City Macomb $1,360,317 $554,891 $12,720 $1,927,928 $1,382,935 $580,666 $1,963,601 $35,673 1.9%
502060 New Baltimore City Macomb $1,044,085 $32,946 $9,763 $1,086,794 $1,061,445 $43,691 $1,105,136 $18,342 1.7%
502070 Richmond City Macomb $495,344 $68,814 $4,633 $568,791 $503,580 $75,136 $578,716 $9,925 1.7%
September 30, 2019 FY 2019 Actuals and FY 2020 Projected - 2019 P.A. 56 - May Consensus Page 81 of 144
Prepared by the Revenue Sharing and Grants Division, Michigan Department of Treasury
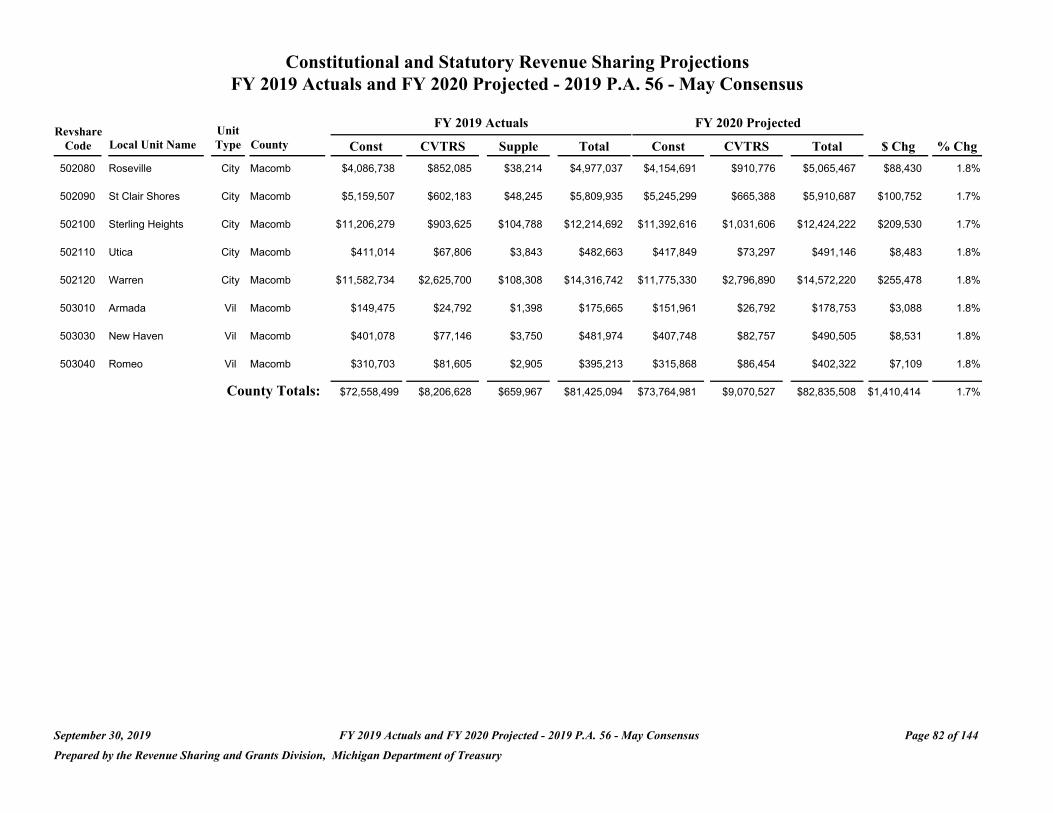
Constitutional and Statutory Revenue Sharing Projections FY 2019 Actuals and FY 2020 Projected - 2019 P.A. 56 - May Consensus
Revshare Unit FY 2019 Actuals FY 2020 Projected
Code Local Unit Name Type County Const CVTRS Supple Total Const CVTRS Total $ Chg % Chg
502080 Roseville City Macomb $4,086,738 $852,085 $38,214 $4,977,037 $4,154,691 $910,776 $5,065,467 $88,430 1.8%
502090 St Clair Shores City Macomb $5,159,507 $602,183 $48,245 $5,809,935 $5,245,299 $665,388 $5,910,687 $100,752 1.7%
502100 Sterling Heights City Macomb $11,206,279 $903,625 $104,788 $12,214,692 $11,392,616 $1,031,606 $12,424,222 $209,530 1.7%
502110 Utica City Macomb $411,014 $67,806 $3,843 $482,663 $417,849 $73,297 $491,146 $8,483 1.8%
502120 Warren City Macomb $11,582,734 $2,625,700 $108,308 $14,316,742 $11,775,330 $2,796,890 $14,572,220 $255,478 1.8%
503010 Armada Vil Macomb $149,475 $24,792 $1,398 $175,665 $151,961 $26,792 $178,753 $3,088 1.8%
503030 New Haven Vil Macomb $401,078 $77,146 $3,750 $481,974 $407,748 $82,757 $490,505 $8,531 1.8%
503040 Romeo Vil Macomb $310,703 $81,605 $2,905 $395,213 $315,868 $86,454 $402,322 $7,109 1.8%
County Totals: $72,558,499 $8,206,628 $659,967 $81,425,094 $73,764,981 $9,070,527 $82,835,508 $1,410,414 1.7%
September 30, 2019 FY 2019 Actuals and FY 2020 Projected - 2019 P.A. 56 - May Consensus Page 82 of 144
Prepared by the Revenue Sharing and Grants Division, Michigan Department of Treasury
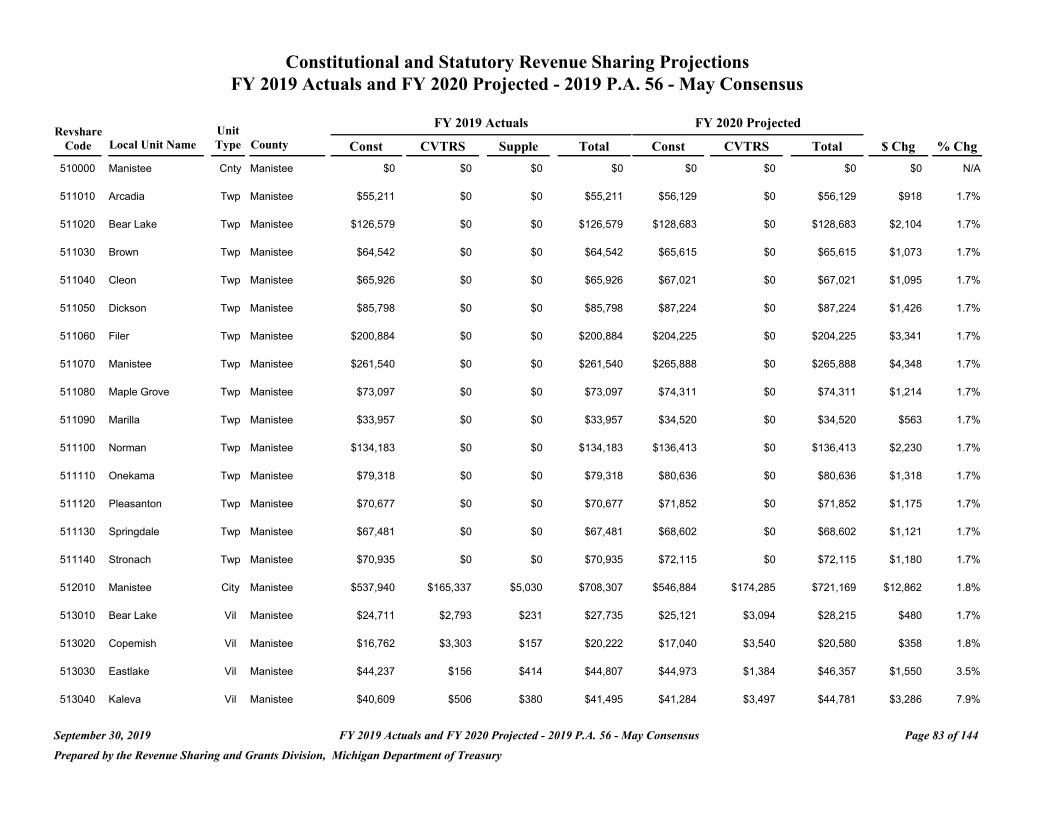
Constitutional and Statutory Revenue Sharing Projections FY 2019 Actuals and FY 2020 Projected - 2019 P.A. 56 - May Consensus
FY 2019 Actuals FY 2020 Projected Revshare Unit
Code Local Unit Name Type County Const CVTRS Supple Total Const CVTRS Total $ Chg % Chg
510000 Manistee Cnty Manistee $0 $0 $0 $0 $0 $0 $0 $0 N/A
511010 Arcadia Twp Manistee $55,211 $0 $0 $55,211 $56,129 $0 $56,129 $918 1.7%
511020 Bear Lake Twp Manistee $126,579 $0 $0 $126,579 $128,683 $0 $128,683 $2,104 1.7%
511030 Brown Twp Manistee $64,542 $0 $0 $64,542 $65,615 $0 $65,615 $1,073 1.7%
511040 Cleon Twp Manistee $65,926 $0 $0 $65,926 $67,021 $0 $67,021 $1,095 1.7%
511050 Dickson Twp Manistee $85,798 $0 $0 $85,798 $87,224 $0 $87,224 $1,426 1.7%
511060 Filer Twp Manistee $200,884 $0 $0 $200,884 $204,225 $0 $204,225 $3,341 1.7%
511070 Manistee Twp Manistee $261,540 $0 $0 $261,540 $265,888 $0 $265,888 $4,348 1.7%
511080 Maple Grove Twp Manistee $73,097 $0 $0 $73,097 $74,311 $0 $74,311 $1,214 1.7%
511090 Marilla Twp Manistee $33,957 $0 $0 $33,957 $34,520 $0 $34,520 $563 1.7%
511100 Norman Twp Manistee $134,183 $0 $0 $134,183 $136,413 $0 $136,413 $2,230 1.7%
511110 Onekama Twp Manistee $79,318 $0 $0 $79,318 $80,636 $0 $80,636 $1,318 1.7%
511120 Pleasanton Twp Manistee $70,677 $0 $0 $70,677 $71,852 $0 $71,852 $1,175 1.7%
511130 Springdale Twp Manistee $67,481 $0 $0 $67,481 $68,602 $0 $68,602 $1,121 1.7%
511140 Stronach Twp Manistee $70,935 $0 $0 $70,935 $72,115 $0 $72,115 $1,180 1.7%
512010 Manistee City Manistee $537,940 $165,337 $5,030 $708,307 $546,884 $174,285 $721,169 $12,862 1.8%
513010 Bear Lake Vil Manistee $24,711 $2,793 $231 $27,735 $25,121 $3,094 $28,215 $480 1.7%
513020 Copemish Vil Manistee $16,762 $3,303 $157 $20,222 $17,040 $3,540 $20,580 $358 1.8%
513030 Eastlake Vil Manistee $44,237 $156 $414 $44,807 $44,973 $1,384 $46,357 $1,550 3.5%
513040 Kaleva Vil Manistee $40,609 $506 $380 $41,495 $41,284 $3,497 $44,781 $3,286 7.9%
September 30, 2019 FY 2019 Actuals and FY 2020 Projected - 2019 P.A. 56 - May Consensus Page 83 of 144
Prepared by the Revenue Sharing and Grants Division, Michigan Department of Treasury
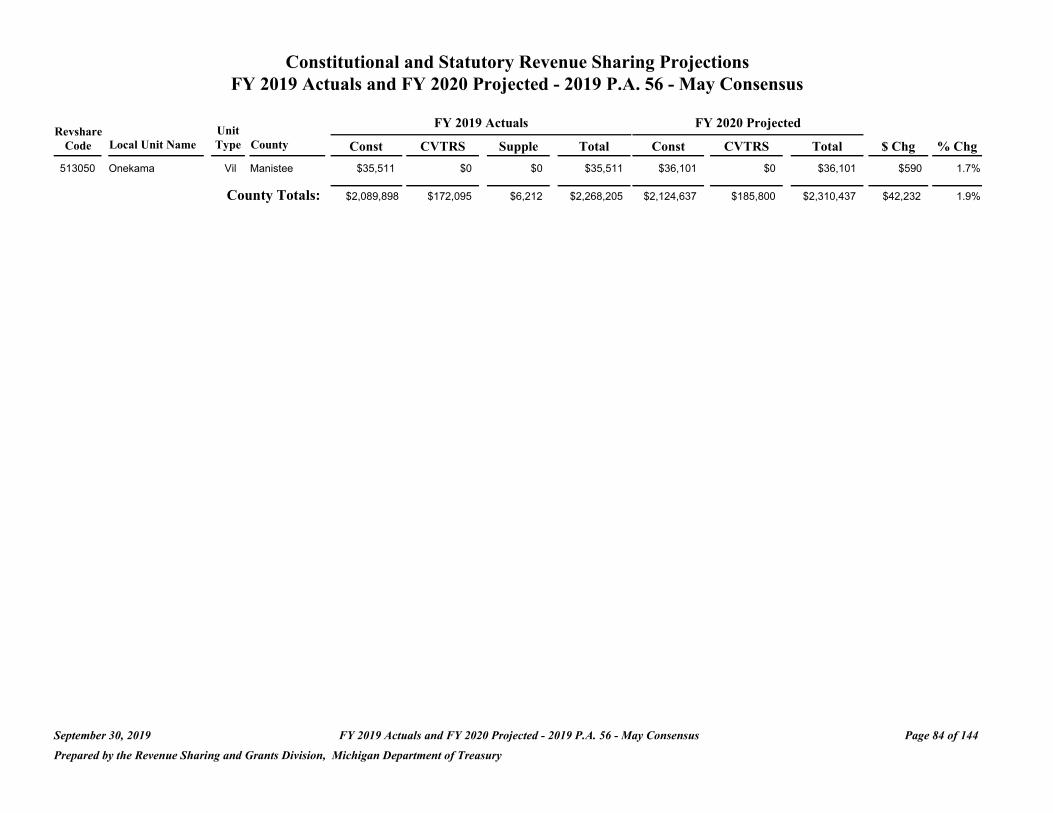
Constitutional and Statutory Revenue Sharing Projections FY 2019 Actuals and FY 2020 Projected - 2019 P.A. 56 - May Consensus
FY 2019 Actuals FY 2020 Projected Revshare Unit
Code Local Unit Name Type County Const CVTRS Supple Total Const CVTRS Total $ Chg % Chg
513050 Onekama Vil Manistee $35,511 $0 $0 $35,511 $36,101 $0 $36,101 $590 1.7%
County Totals: $2,089,898 $172,095 $6,212 $2,268,205 $2,124,637 $185,800 $2,310,437 $42,232 1.9%
September 30, 2019 FY 2019 Actuals and FY 2020 Projected - 2019 P.A. 56 - May Consensus Page 84 of 144
Prepared by the Revenue Sharing and Grants Division, Michigan Department of Treasury
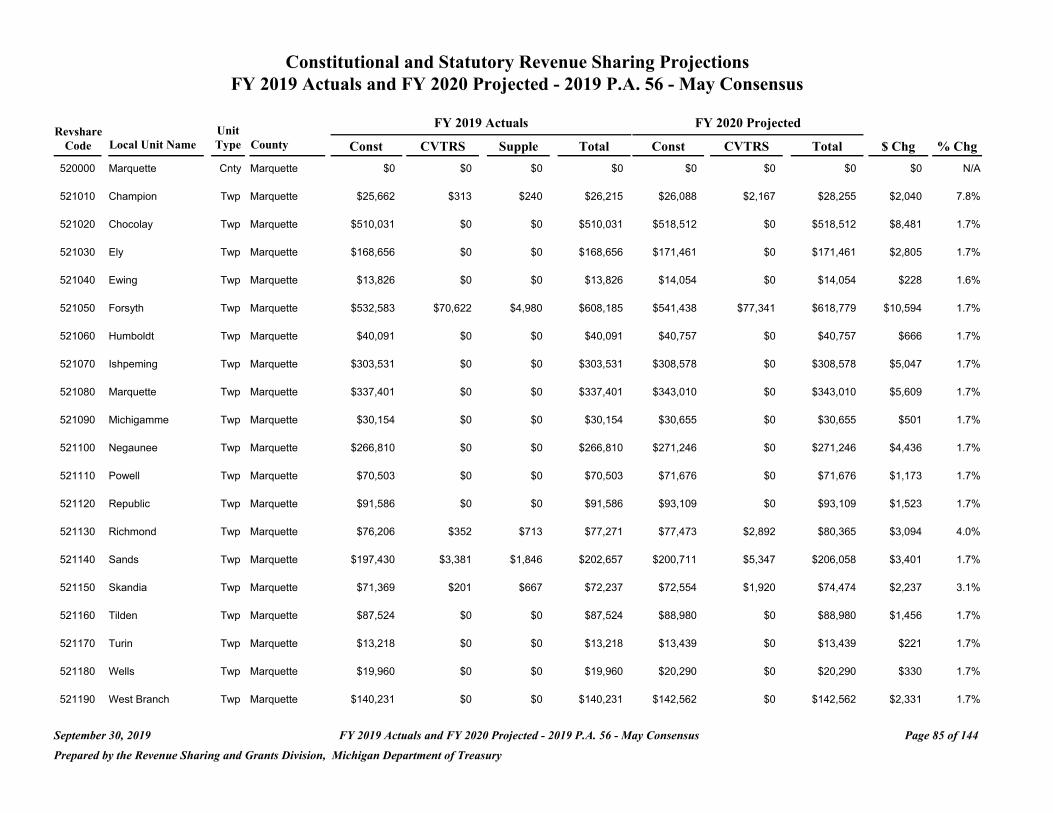
Constitutional and Statutory Revenue Sharing Projections FY 2019 Actuals and FY 2020 Projected - 2019 P.A. 56 - May Consensus
FY 2019 Actuals FY 2020 Projected Revshare Unit
Code Local Unit Name Type County Const CVTRS Supple Total Const CVTRS Total $ Chg % Chg
520000 Marquette Cnty Marquette $0 $0 $0 $0 $0 $0 $0 $0 N/A
521010 Champion Twp Marquette $25,662 $313 $240 $26,215 $26,088 $2,167 $28,255 $2,040 7.8%
521020 Chocolay Twp Marquette $510,031 $0 $0 $510,031 $518,512 $0 $518,512 $8,481 1.7%
521030 Ely Twp Marquette $168,656 $0 $0 $168,656 $171,461 $0 $171,461 $2,805 1.7%
521040 Ewing Twp Marquette $13,826 $0 $0 $13,826 $14,054 $0 $14,054 $228 1.6%
521050 Forsyth Twp Marquette $532,583 $70,622 $4,980 $608,185 $541,438 $77,341 $618,779 $10,594 1.7%
521060 Humboldt Twp Marquette $40,091 $0 $0 $40,091 $40,757 $0 $40,757 $666 1.7%
521070 Ishpeming Twp Marquette $303,531 $0 $0 $303,531 $308,578 $0 $308,578 $5,047 1.7%
521080 Marquette Twp Marquette $337,401 $0 $0 $337,401 $343,010 $0 $343,010 $5,609 1.7%
521090 Michigamme Twp Marquette $30,154 $0 $0 $30,154 $30,655 $0 $30,655 $501 1.7%
521100 Negaunee Twp Marquette $266,810 $0 $0 $266,810 $271,246 $0 $271,246 $4,436 1.7%
521110 Powell Twp Marquette $70,503 $0 $0 $70,503 $71,676 $0 $71,676 $1,173 1.7%
521120 Republic Twp Marquette $91,586 $0 $0 $91,586 $93,109 $0 $93,109 $1,523 1.7%
521130 Richmond Twp Marquette $76,206 $352 $713 $77,271 $77,473 $2,892 $80,365 $3,094 4.0%
521140 Sands Twp Marquette $197,430 $3,381 $1,846 $202,657 $200,711 $5,347 $206,058 $3,401 1.7%
521150 Skandia Twp Marquette $71,369 $201 $667 $72,237 $72,554 $1,920 $74,474 $2,237 3.1%
521160 Tilden Twp Marquette $87,524 $0 $0 $87,524 $88,980 $0 $88,980 $1,456 1.7%
521170 Turin Twp Marquette $13,218 $0 $0 $13,218 $13,439 $0 $13,439 $221 1.7%
521180 Wells Twp Marquette $19,960 $0 $0 $19,960 $20,290 $0 $20,290 $330 1.7%
521190 West Branch Twp Marquette $140,231 $0 $0 $140,231 $142,562 $0 $142,562 $2,331 1.7%
September 30, 2019 FY 2019 Actuals and FY 2020 Projected - 2019 P.A. 56 - May Consensus Page 85 of 144
Prepared by the Revenue Sharing and Grants Division, Michigan Department of Treasury
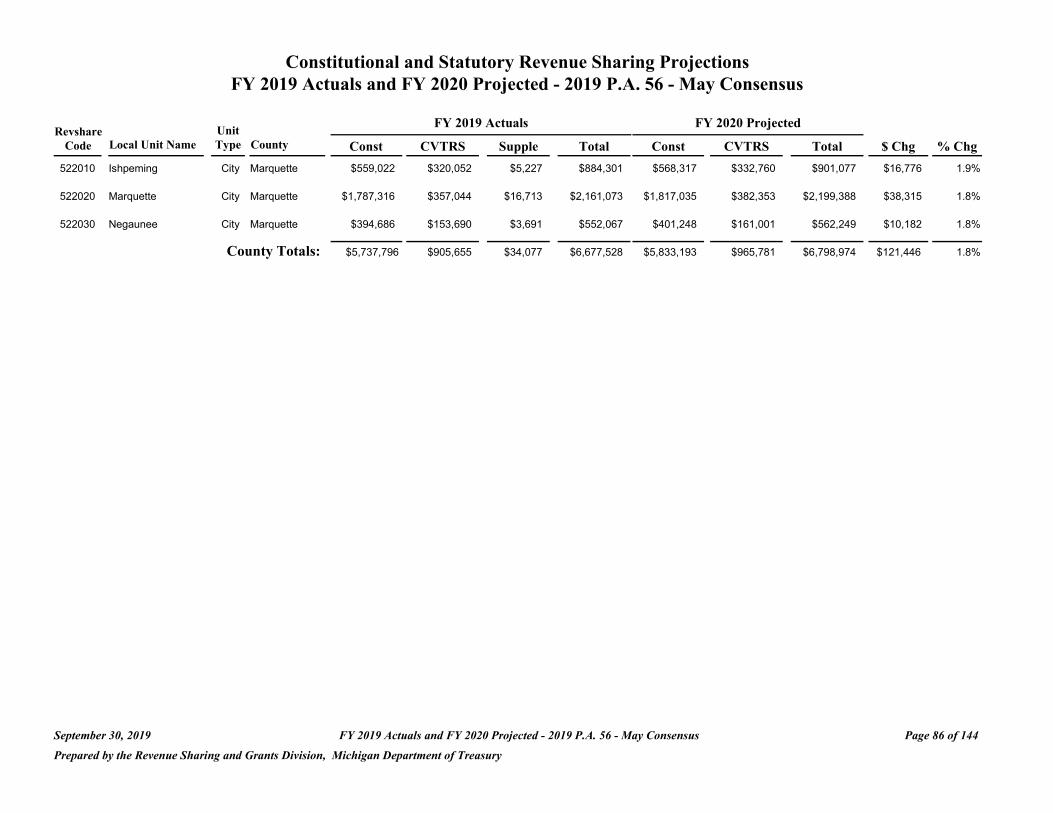
Constitutional and Statutory Revenue Sharing Projections FY 2019 Actuals and FY 2020 Projected - 2019 P.A. 56 - May Consensus
Revshare Code Local Unit Name
522010 Ishpeming
Unit Type County
City Marquette
Const $559,022
FY 2019 Actuals
CVTRS Supple
$320,052 $5,227
Total $884,301
FY 2020 Projected
Const CVTRS
$568,317 $332,760
Total $901,077
$ Chg
$16,776
% Chg
1.9%
522020 Marquette City Marquette $1,787,316 $357,044 $16,713 $2,161,073 $1,817,035 $382,353 $2,199,388 $38,315 1.8%
522030 Negaunee City Marquette $394,686 $153,690 $3,691 $552,067 $401,248 $161,001 $562,249 $10,182 1.8%
County Totals: $5,737,796 $905,655 $34,077 $6,677,528 $5,833,193 $965,781 $6,798,974 $121,446 1.8%
September 30, 2019 FY 2019 Actuals and FY 2020 Projected - 2019 P.A. 56 - May Consensus Page 86 of 144
Prepared by the Revenue Sharing and Grants Division, Michigan Department of Treasury
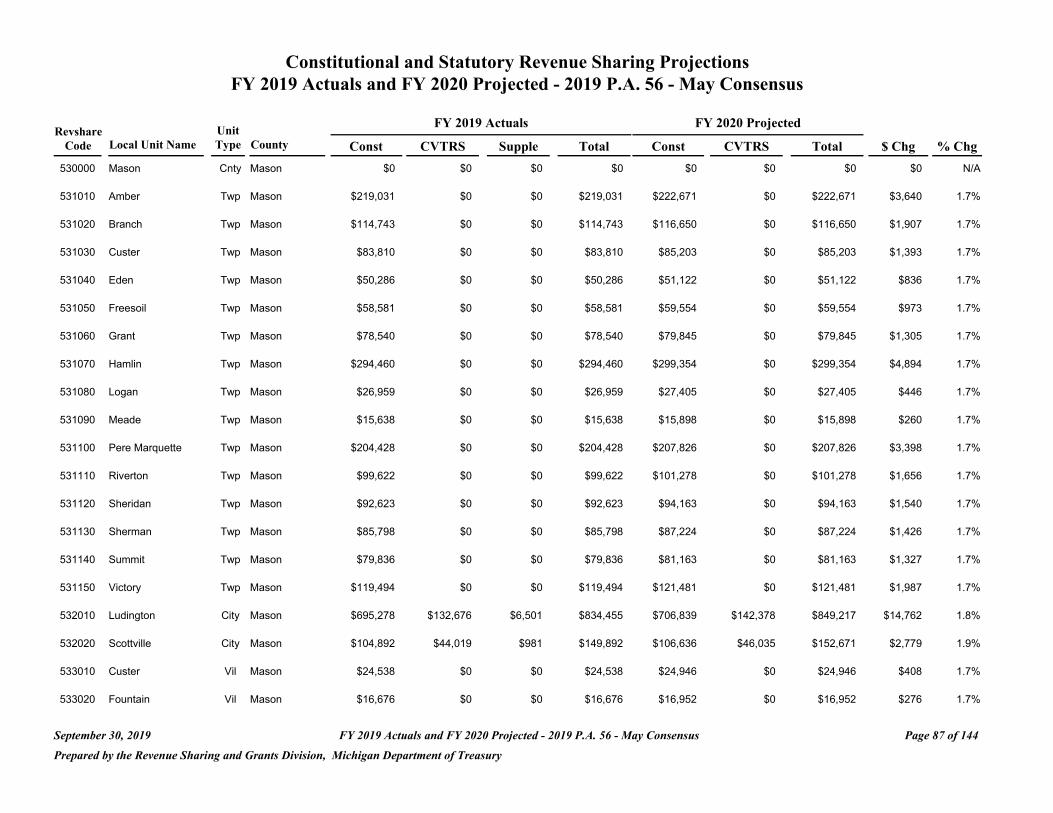
Constitutional and Statutory Revenue Sharing Projections FY 2019 Actuals and FY 2020 Projected - 2019 P.A. 56 - May Consensus
FY 2019 Actuals FY 2020 Projected Revshare Unit
Code Local Unit Name Type County Const CVTRS Supple Total Const CVTRS Total $ Chg % Chg
530000 Mason Cnty Mason $0 $0 $0 $0 $0 $0 $0 $0 N/A
531010 Amber Twp Mason $219,031 $0 $0 $219,031 $222,671 $0 $222,671 $3,640 1.7%
531020 Branch Twp Mason $114,743 $0 $0 $114,743 $116,650 $0 $116,650 $1,907 1.7%
531030 Custer Twp Mason $83,810 $0 $0 $83,810 $85,203 $0 $85,203 $1,393 1.7%
531040 Eden Twp Mason $50,286 $0 $0 $50,286 $51,122 $0 $51,122 $836 1.7%
531050 Freesoil Twp Mason $58,581 $0 $0 $58,581 $59,554 $0 $59,554 $973 1.7%
531060 Grant Twp Mason $78,540 $0 $0 $78,540 $79,845 $0 $79,845 $1,305 1.7%
531070 Hamlin Twp Mason $294,460 $0 $0 $294,460 $299,354 $0 $299,354 $4,894 1.7%
531080 Logan Twp Mason $26,959 $0 $0 $26,959 $27,405 $0 $27,405 $446 1.7%
531090 Meade Twp Mason $15,638 $0 $0 $15,638 $15,898 $0 $15,898 $260 1.7%
531100 Pere Marquette Twp Mason $204,428 $0 $0 $204,428 $207,826 $0 $207,826 $3,398 1.7%
531110 Riverton Twp Mason $99,622 $0 $0 $99,622 $101,278 $0 $101,278 $1,656 1.7%
531120 Sheridan Twp Mason $92,623 $0 $0 $92,623 $94,163 $0 $94,163 $1,540 1.7%
531130 Sherman Twp Mason $85,798 $0 $0 $85,798 $87,224 $0 $87,224 $1,426 1.7%
531140 Summit Twp Mason $79,836 $0 $0 $79,836 $81,163 $0 $81,163 $1,327 1.7%
531150 Victory Twp Mason $119,494 $0 $0 $119,494 $121,481 $0 $121,481 $1,987 1.7%
532010 Ludington City Mason $695,278 $132,676 $6,501 $834,455 $706,839 $142,378 $849,217 $14,762 1.8%
532020 Scottville City Mason $104,892 $44,019 $981 $149,892 $106,636 $46,035 $152,671 $2,779 1.9%
533010 Custer Vil Mason $24,538 $0 $0 $24,538 $24,946 $0 $24,946 $408 1.7%
533020 Fountain Vil Mason $16,676 $0 $0 $16,676 $16,952 $0 $16,952 $276 1.7%
September 30, 2019 FY 2019 Actuals and FY 2020 Projected - 2019 P.A. 56 - May Consensus Page 87 of 144
Prepared by the Revenue Sharing and Grants Division, Michigan Department of Treasury

Constitutional and Statutory Revenue Sharing Projections FY 2019 Actuals and FY 2020 Projected - 2019 P.A. 56 - May Consensus
FY 2019 Actuals FY 2020 Projected Revshare Unit
Code Local Unit Name Type County Const CVTRS Supple Total Const CVTRS Total $ Chg % Chg
533030 Freesoil Vil Mason $12,441 $0 $0 $12,441 $12,648 $0 $12,648 $207 1.7%
County Totals: $2,477,674 $176,695 $7,482 $2,661,851 $2,518,858 $188,413 $2,707,271 $45,420 1.7%
September 30, 2019 FY 2019 Actuals and FY 2020 Projected - 2019 P.A. 56 - May Consensus Page 88 of 144
Prepared by the Revenue Sharing and Grants Division, Michigan Department of Treasury
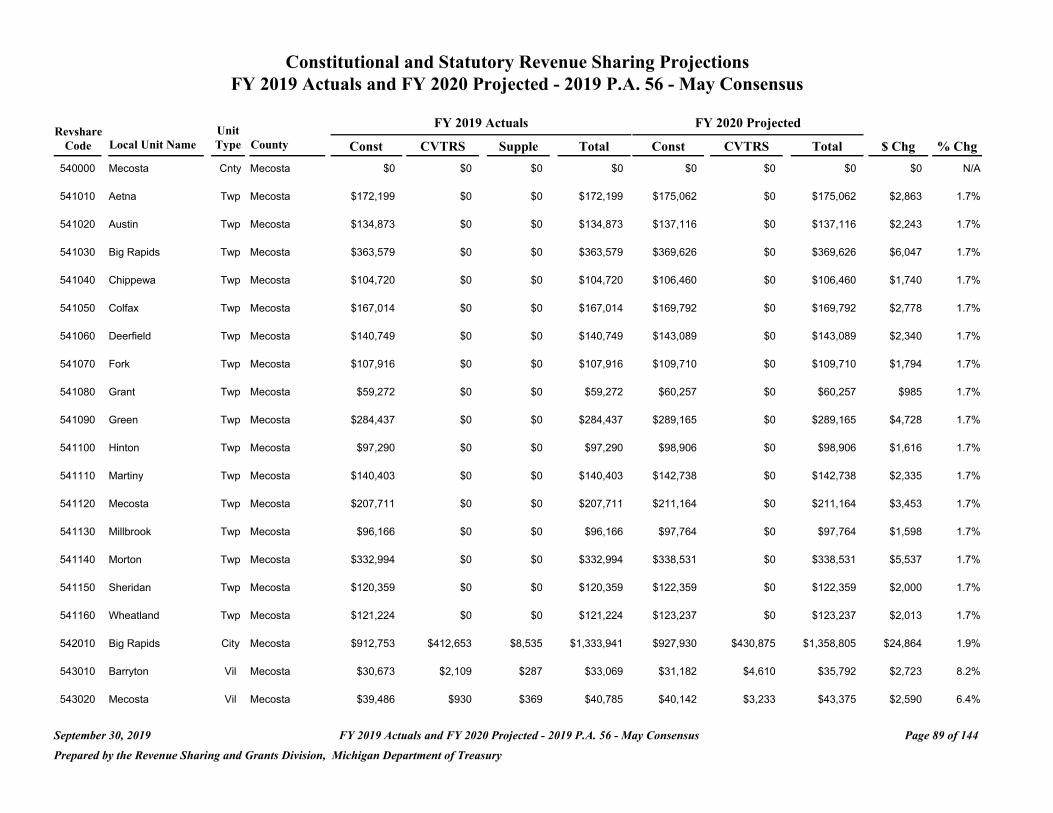
Constitutional and Statutory Revenue Sharing Projections FY 2019 Actuals and FY 2020 Projected - 2019 P.A. 56 - May Consensus
FY 2019 Actuals FY 2020 Projected Revshare Unit
Code Local Unit Name Type County Const CVTRS Supple Total Const CVTRS Total $ Chg % Chg
540000 Mecosta Cnty Mecosta $0 $0 $0 $0 $0 $0 $0 $0 N/A
541010 Aetna Twp Mecosta $172,199 $0 $0 $172,199 $175,062 $0 $175,062 $2,863 1.7%
541020 Austin Twp Mecosta $134,873 $0 $0 $134,873 $137,116 $0 $137,116 $2,243 1.7%
541030 Big Rapids Twp Mecosta $363,579 $0 $0 $363,579 $369,626 $0 $369,626 $6,047 1.7%
541040 Chippewa Twp Mecosta $104,720 $0 $0 $104,720 $106,460 $0 $106,460 $1,740 1.7%
541050 Colfax Twp Mecosta $167,014 $0 $0 $167,014 $169,792 $0 $169,792 $2,778 1.7%
541060 Deerfield Twp Mecosta $140,749 $0 $0 $140,749 $143,089 $0 $143,089 $2,340 1.7%
541070 Fork Twp Mecosta $107,916 $0 $0 $107,916 $109,710 $0 $109,710 $1,794 1.7%
541080 Grant Twp Mecosta $59,272 $0 $0 $59,272 $60,257 $0 $60,257 $985 1.7%
541090 Green Twp Mecosta $284,437 $0 $0 $284,437 $289,165 $0 $289,165 $4,728 1.7%
541100 Hinton Twp Mecosta $97,290 $0 $0 $97,290 $98,906 $0 $98,906 $1,616 1.7%
541110 Martiny Twp Mecosta $140,403 $0 $0 $140,403 $142,738 $0 $142,738 $2,335 1.7%
541120 Mecosta Twp Mecosta $207,711 $0 $0 $207,711 $211,164 $0 $211,164 $3,453 1.7%
541130 Millbrook Twp Mecosta $96,166 $0 $0 $96,166 $97,764 $0 $97,764 $1,598 1.7%
541140 Morton Twp Mecosta $332,994 $0 $0 $332,994 $338,531 $0 $338,531 $5,537 1.7%
541150 Sheridan Twp Mecosta $120,359 $0 $0 $120,359 $122,359 $0 $122,359 $2,000 1.7%
541160 Wheatland Twp Mecosta $121,224 $0 $0 $121,224 $123,237 $0 $123,237 $2,013 1.7%
542010 Big Rapids City Mecosta $912,753 $412,653 $8,535 $1,333,941 $927,930 $430,875 $1,358,805 $24,864 1.9%
543010 Barryton Vil Mecosta $30,673 $2,109 $287 $33,069 $31,182 $4,610 $35,792 $2,723 8.2%
543020 Mecosta Vil Mecosta $39,486 $930 $369 $40,785 $40,142 $3,233 $43,375 $2,590 6.4%
September 30, 2019 FY 2019 Actuals and FY 2020 Projected - 2019 P.A. 56 - May Consensus Page 89 of 144
Prepared by the Revenue Sharing and Grants Division, Michigan Department of Treasury

Constitutional and Statutory Revenue Sharing Projections FY 2019 Actuals and FY 2020 Projected - 2019 P.A. 56 - May Consensus
Revshare Code Local Unit Name
543030 Morley
Unit Type County
Vil Mecosta
Const $42,596
FY 2019 Actuals
CVTRS Supple
$6,913 $398
Total $49,907
FY 2020 Projected
Const CVTRS
$43,304 $7,479
Total $50,783
$ Chg
$876
% Chg
1.8%
543040 Stanwood Vil Mecosta $18,231 $3,107 $170 $21,508 $18,534 $3,352 $21,886 $378 1.8%
County Totals: $3,694,645 $425,712 $9,759 $4,130,116 $3,756,068 $449,549 $4,205,617 $75,501 1.8%
September 30, 2019 FY 2019 Actuals and FY 2020 Projected - 2019 P.A. 56 - May Consensus Page 90 of 144
Prepared by the Revenue Sharing and Grants Division, Michigan Department of Treasury
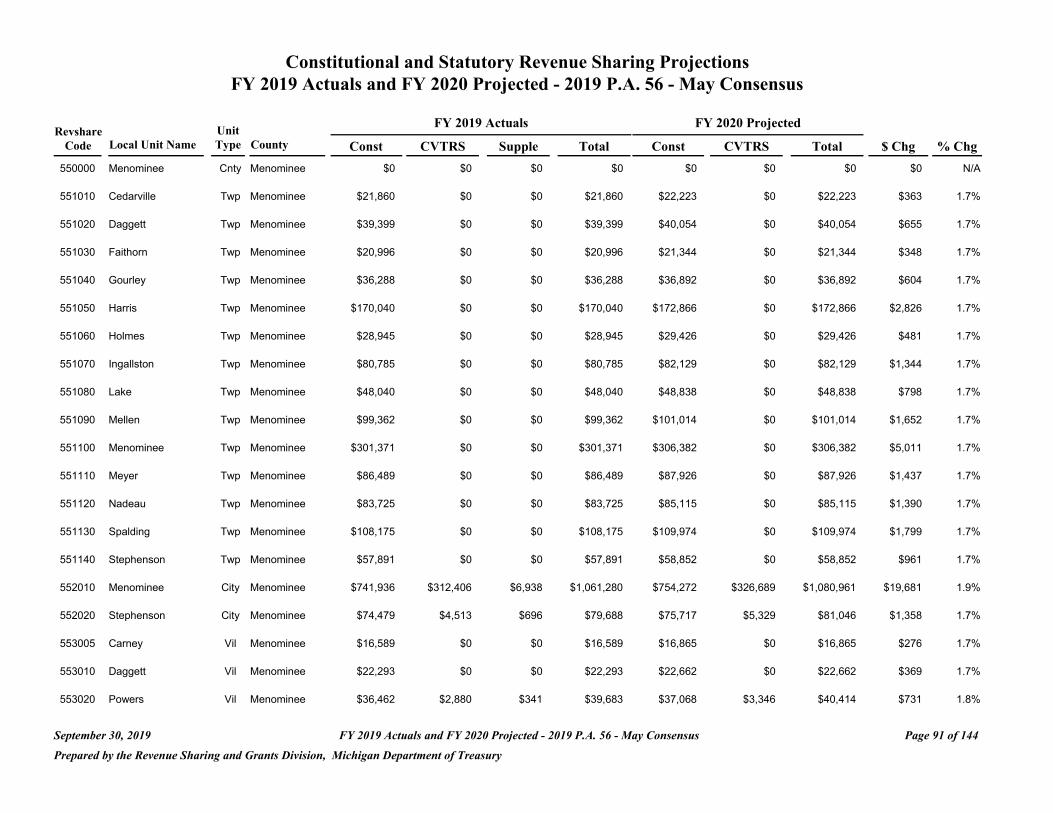
Constitutional and Statutory Revenue Sharing Projections FY 2019 Actuals and FY 2020 Projected - 2019 P.A. 56 - May Consensus
FY 2019 Actuals FY 2020 Projected Revshare Unit
Code Local Unit Name Type County Const CVTRS Supple Total Const CVTRS Total $ Chg % Chg
550000 Menominee Cnty Menominee $0 $0 $0 $0 $0 $0 $0 $0 N/A
551010 Cedarville Twp Menominee $21,860 $0 $0 $21,860 $22,223 $0 $22,223 $363 1.7%
551020 Daggett Twp Menominee $39,399 $0 $0 $39,399 $40,054 $0 $40,054 $655 1.7%
551030 Faithorn Twp Menominee $20,996 $0 $0 $20,996 $21,344 $0 $21,344 $348 1.7%
551040 Gourley Twp Menominee $36,288 $0 $0 $36,288 $36,892 $0 $36,892 $604 1.7%
551050 Harris Twp Menominee $170,040 $0 $0 $170,040 $172,866 $0 $172,866 $2,826 1.7%
551060 Holmes Twp Menominee $28,945 $0 $0 $28,945 $29,426 $0 $29,426 $481 1.7%
551070 Ingallston Twp Menominee $80,785 $0 $0 $80,785 $82,129 $0 $82,129 $1,344 1.7%
551080 Lake Twp Menominee $48,040 $0 $0 $48,040 $48,838 $0 $48,838 $798 1.7%
551090 Mellen Twp Menominee $99,362 $0 $0 $99,362 $101,014 $0 $101,014 $1,652 1.7%
551100 Menominee Twp Menominee $301,371 $0 $0 $301,371 $306,382 $0 $306,382 $5,011 1.7%
551110 Meyer Twp Menominee $86,489 $0 $0 $86,489 $87,926 $0 $87,926 $1,437 1.7%
551120 Nadeau Twp Menominee $83,725 $0 $0 $83,725 $85,115 $0 $85,115 $1,390 1.7%
551130 Spalding Twp Menominee $108,175 $0 $0 $108,175 $109,974 $0 $109,974 $1,799 1.7%
551140 Stephenson Twp Menominee $57,891 $0 $0 $57,891 $58,852 $0 $58,852 $961 1.7%
552010 Menominee City Menominee $741,936 $312,406 $6,938 $1,061,280 $754,272 $326,689 $1,080,961 $19,681 1.9%
552020 Stephenson City Menominee $74,479 $4,513 $696 $79,688 $75,717 $5,329 $81,046 $1,358 1.7%
553005 Carney Vil Menominee $16,589 $0 $0 $16,589 $16,865 $0 $16,865 $276 1.7%
553010 Daggett Vil Menominee $22,293 $0 $0 $22,293 $22,662 $0 $22,662 $369 1.7%
553020 Powers Vil Menominee $36,462 $2,880 $341 $39,683 $37,068 $3,346 $40,414 $731 1.8%
September 30, 2019 FY 2019 Actuals and FY 2020 Projected - 2019 P.A. 56 - May Consensus Page 91 of 144
Prepared by the Revenue Sharing and Grants Division, Michigan Department of Treasury

Constitutional and Statutory Revenue Sharing Projections FY 2019 Actuals and FY 2020 Projected - 2019 P.A. 56 - May Consensus
FY 2019 Actuals FY 2020 Projected Revshare Unit
Code Local Unit Name Type County Const CVTRS Supple Total Const CVTRS Total $ Chg % Chg
County Totals: $2,075,125 $319,799 $7,975 $2,402,899 $2,109,619 $335,364 $2,444,983 $42,084 1.8%
September 30, 2019 FY 2019 Actuals and FY 2020 Projected - 2019 P.A. 56 - May Consensus Page 92 of 144
Prepared by the Revenue Sharing and Grants Division, Michigan Department of Treasury

Constitutional and Statutory Revenue Sharing Projections FY 2019 Actuals and FY 2020 Projected - 2019 P.A. 56 - May Consensus
FY 2019 Actuals FY 2020 Projected Revshare Unit
Code Local Unit Name Type County Const CVTRS Supple Total Const CVTRS Total $ Chg % Chg
560000 Midland Cnty Midland $0 $0 $0 $0 $0 $0 $0 $0 N/A
561010 Edenville Twp Midland $220,412 $0 $0 $220,412 $224,077 $0 $224,077 $3,665 1.7%
561020 Geneva Twp Midland $91,241 $0 $0 $91,241 $92,757 $0 $92,757 $1,516 1.7%
561030 Greendale Twp Midland $151,290 $0 $0 $151,290 $153,805 $0 $153,805 $2,515 1.7%
561040 Homer Twp Midland $346,386 $0 $0 $346,386 $352,146 $0 $352,146 $5,760 1.7%
561050 Hope Twp Midland $117,594 $0 $0 $117,594 $119,548 $0 $119,548 $1,954 1.7%
561060 Ingersoll Twp Midland $237,693 $0 $0 $237,693 $241,644 $0 $241,644 $3,951 1.7%
561070 Jasper Twp Midland $101,955 $0 $0 $101,955 $103,649 $0 $103,649 $1,694 1.7%
561080 Jerome Twp Midland $340,165 $0 $0 $340,165 $345,821 $0 $345,821 $5,656 1.7%
561090 Larkin Twp Midland $443,762 $0 $0 $443,762 $451,140 $0 $451,140 $7,378 1.7%
561100 Lee Twp Midland $372,825 $0 $0 $372,825 $379,024 $0 $379,024 $6,199 1.7%
561110 Lincoln Twp Midland $213,759 $0 $0 $213,759 $217,313 $0 $217,313 $3,554 1.7%
561120 Midland Twp Midland $197,601 $0 $0 $197,601 $200,887 $0 $200,887 $3,286 1.7%
561130 Mills Twp Midland $167,533 $0 $0 $167,533 $170,319 $0 $170,319 $2,786 1.7%
561140 Mt Haley Twp Midland $144,984 $0 $0 $144,984 $147,393 $0 $147,393 $2,409 1.7%
561150 Porter Twp Midland $110,336 $0 $0 $110,336 $112,170 $0 $112,170 $1,834 1.7%
561160 Warren Twp Midland $183,086 $0 $0 $183,086 $186,130 $0 $186,130 $3,044 1.7%
562010 Coleman City Midland $107,398 $45,288 $1,004 $153,690 $109,183 $47,357 $156,540 $2,850 1.9%
562020 Midland City Midland $3,598,478 $214,308 $33,775 $3,846,561 $3,658,314 $253,789 $3,912,103 $65,542 1.7%
563010 Sanford Vil Midland $74,219 $0 $0 $74,219 $75,453 $0 $75,453 $1,234 1.7%
September 30, 2019 FY 2019 Actuals and FY 2020 Projected - 2019 P.A. 56 - May Consensus Page 93 of 144
Prepared by the Revenue Sharing and Grants Division, Michigan Department of Treasury
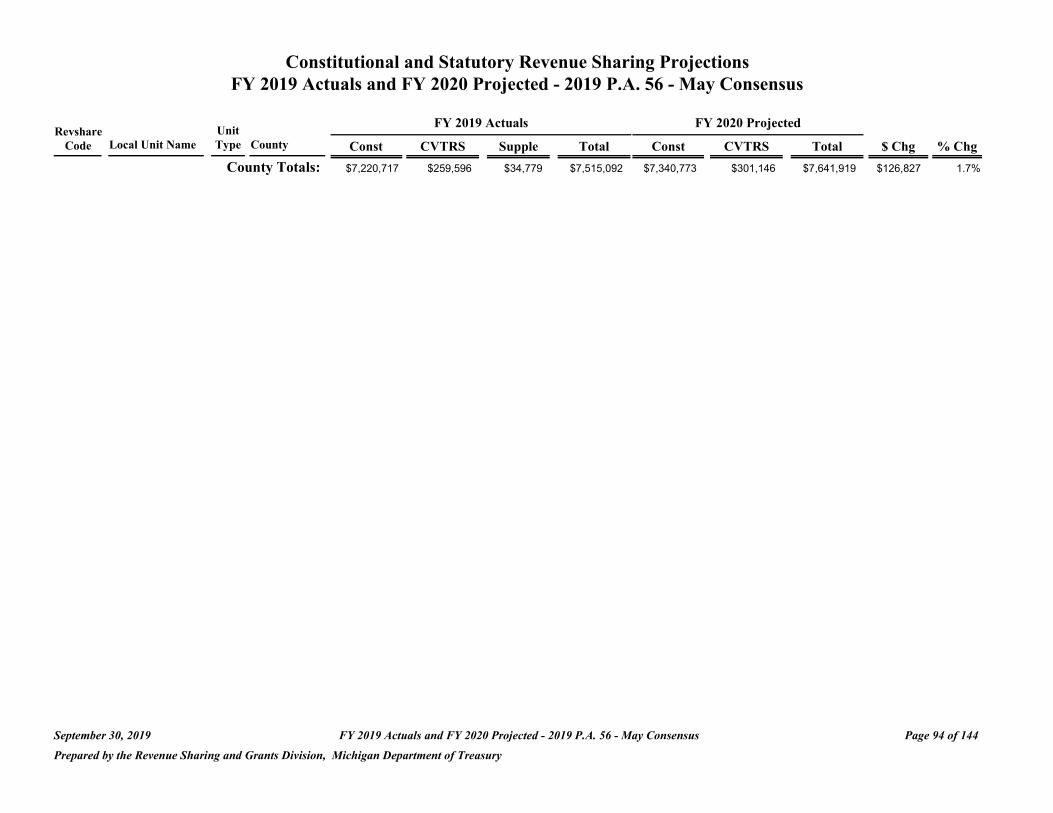
Constitutional and Statutory Revenue Sharing Projections FY 2019 Actuals and FY 2020 Projected - 2019 P.A. 56 - May Consensus
FY 2019 Actuals FY 2020 Projected Revshare Unit
Code Local Unit Name Type County Const CVTRS Supple Total Const CVTRS Total $ Chg % Chg
County Totals: $7,220,717 $259,596 $34,779 $7,515,092 $7,340,773 $301,146 $7,641,919 $126,827 1.7%
September 30, 2019 FY 2019 Actuals and FY 2020 Projected - 2019 P.A. 56 - May Consensus Page 94 of 144
Prepared by the Revenue Sharing and Grants Division, Michigan Department of Treasury
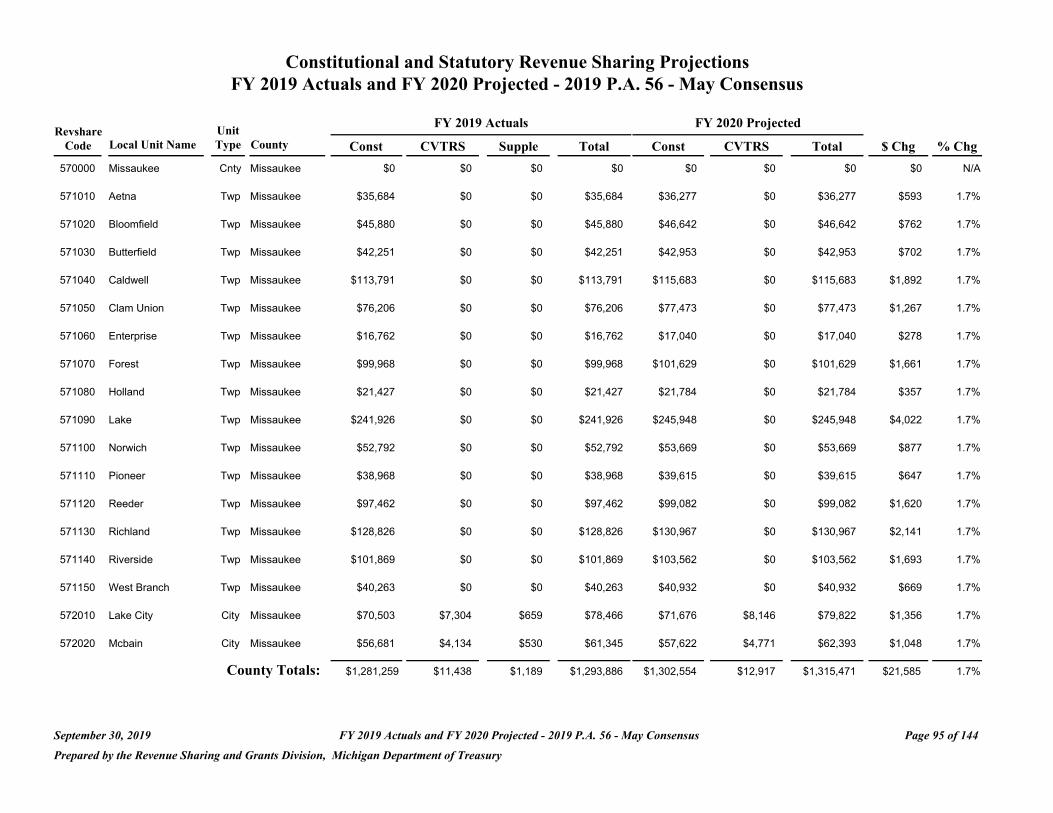
Constitutional and Statutory Revenue Sharing Projections FY 2019 Actuals and FY 2020 Projected - 2019 P.A. 56 - May Consensus
Revshare Unit FY 2019 Actuals FY 2020 Projected
Code Local Unit Name Type County Const CVTRS Supple Total Const CVTRS Total $ Chg % Chg
570000 Missaukee Cnty Missaukee $0 $0 $0 $0 $0 $0 $0 $0 N/A
571010 Aetna Twp Missaukee $35,684 $0 $0 $35,684 $36,277 $0 $36,277 $593 1.7%
571020 Bloomfield Twp Missaukee $45,880 $0 $0 $45,880 $46,642 $0 $46,642 $762 1.7%
571030 Butterfield Twp Missaukee $42,251 $0 $0 $42,251 $42,953 $0 $42,953 $702 1.7%
571040 Caldwell Twp Missaukee $113,791 $0 $0 $113,791 $115,683 $0 $115,683 $1,892 1.7%
571050 Clam Union Twp Missaukee $76,206 $0 $0 $76,206 $77,473 $0 $77,473 $1,267 1.7%
571060 Enterprise Twp Missaukee $16,762 $0 $0 $16,762 $17,040 $0 $17,040 $278 1.7%
571070 Forest Twp Missaukee $99,968 $0 $0 $99,968 $101,629 $0 $101,629 $1,661 1.7%
571080 Holland Twp Missaukee $21,427 $0 $0 $21,427 $21,784 $0 $21,784 $357 1.7%
571090 Lake Twp Missaukee $241,926 $0 $0 $241,926 $245,948 $0 $245,948 $4,022 1.7%
571100 Norwich Twp Missaukee $52,792 $0 $0 $52,792 $53,669 $0 $53,669 $877 1.7%
571110 Pioneer Twp Missaukee $38,968 $0 $0 $38,968 $39,615 $0 $39,615 $647 1.7%
571120 Reeder Twp Missaukee $97,462 $0 $0 $97,462 $99,082 $0 $99,082 $1,620 1.7%
571130 Richland Twp Missaukee $128,826 $0 $0 $128,826 $130,967 $0 $130,967 $2,141 1.7%
571140 Riverside Twp Missaukee $101,869 $0 $0 $101,869 $103,562 $0 $103,562 $1,693 1.7%
571150 West Branch Twp Missaukee $40,263 $0 $0 $40,263 $40,932 $0 $40,932 $669 1.7%
572010 Lake City City Missaukee $70,503 $7,304 $659 $78,466 $71,676 $8,146 $79,822 $1,356 1.7%
572020 Mcbain City Missaukee $56,681 $4,134 $530 $61,345 $57,622 $4,771 $62,393 $1,048 1.7%
County Totals: $1,281,259 $11,438 $1,189 $1,293,886 $1,302,554 $12,917 $1,315,471 $21,585 1.7%
September 30, 2019 FY 2019 Actuals and FY 2020 Projected - 2019 P.A. 56 - May Consensus Page 95 of 144
Prepared by the Revenue Sharing and Grants Division, Michigan Department of Treasury

Constitutional and Statutory Revenue Sharing Projections FY 2019 Actuals and FY 2020 Projected - 2019 P.A. 56 - May Consensus
FY 2019 Actuals FY 2020 Projected Revshare Unit
Code Local Unit Name Type County Const CVTRS Supple Total Const CVTRS Total $ Chg % Chg
580000 Monroe Cnty Monroe $0 $0 $0 $0 $0 $0 $0 $0 N/A
581010 Ash Twp Monroe $469,855 $0 $0 $469,855 $477,667 $0 $477,667 $7,812 1.7%
581020 Bedford Twp Monroe $2,685,812 $82,322 $25,114 $2,793,248 $2,730,472 $109,907 $2,840,379 $47,131 1.7%
581030 Berlin Twp Monroe $622,615 $0 $0 $622,615 $632,967 $0 $632,967 $10,352 1.7%
581040 Dundee Twp Monroe $242,098 $0 $0 $242,098 $246,124 $0 $246,124 $4,026 1.7%
581050 Erie Twp Monroe $390,279 $0 $0 $390,279 $396,768 $0 $396,768 $6,489 1.7%
581060 Exeter Twp Monroe $294,286 $0 $0 $294,286 $299,179 $0 $299,179 $4,893 1.7%
581070 Frenchtown Twp Monroe $1,765,024 $54,099 $16,504 $1,835,627 $1,794,372 $72,227 $1,866,599 $30,972 1.7%
581080 Ida Twp Monroe $428,901 $0 $0 $428,901 $436,032 $0 $436,032 $7,131 1.7%
581090 Lasalle Twp Monroe $422,852 $0 $0 $422,852 $429,883 $0 $429,883 $7,031 1.7%
581100 London Twp Monroe $263,354 $0 $0 $263,354 $267,732 $0 $267,732 $4,378 1.7%
581110 Milan Twp Monroe $138,329 $0 $0 $138,329 $140,630 $0 $140,630 $2,301 1.7%
581120 Monroe Twp Monroe $1,252,141 $38,379 $11,709 $1,302,229 $1,272,961 $51,240 $1,324,201 $21,972 1.7%
581130 Raisinville Twp Monroe $502,515 $0 $0 $502,515 $510,871 $0 $510,871 $8,356 1.7%
581140 Summerfield Twp Monroe $285,818 $0 $0 $285,818 $290,571 $0 $290,571 $4,753 1.7%
581150 Whiteford Twp Monroe $397,624 $0 $0 $397,624 $404,234 $0 $404,234 $6,610 1.7%
582010 Luna Pier City Monroe $124,073 $9,325 $1,160 $134,558 $126,136 $10,726 $136,862 $2,304 1.7%
582020 Milan City Monroe $178,506 $0 $0 $178,506 $181,475 $0 $181,475 $2,969 1.7%
582030 Monroe City Monroe $1,791,377 $294,177 $16,751 $2,102,305 $1,821,163 $318,079 $2,139,242 $36,937 1.8%
582040 Petersburg City Monroe $99,017 $40,484 $926 $140,427 $100,663 $42,362 $143,025 $2,598 1.9%
September 30, 2019 FY 2019 Actuals and FY 2020 Projected - 2019 P.A. 56 - May Consensus Page 96 of 144
Prepared by the Revenue Sharing and Grants Division, Michigan Department of Treasury
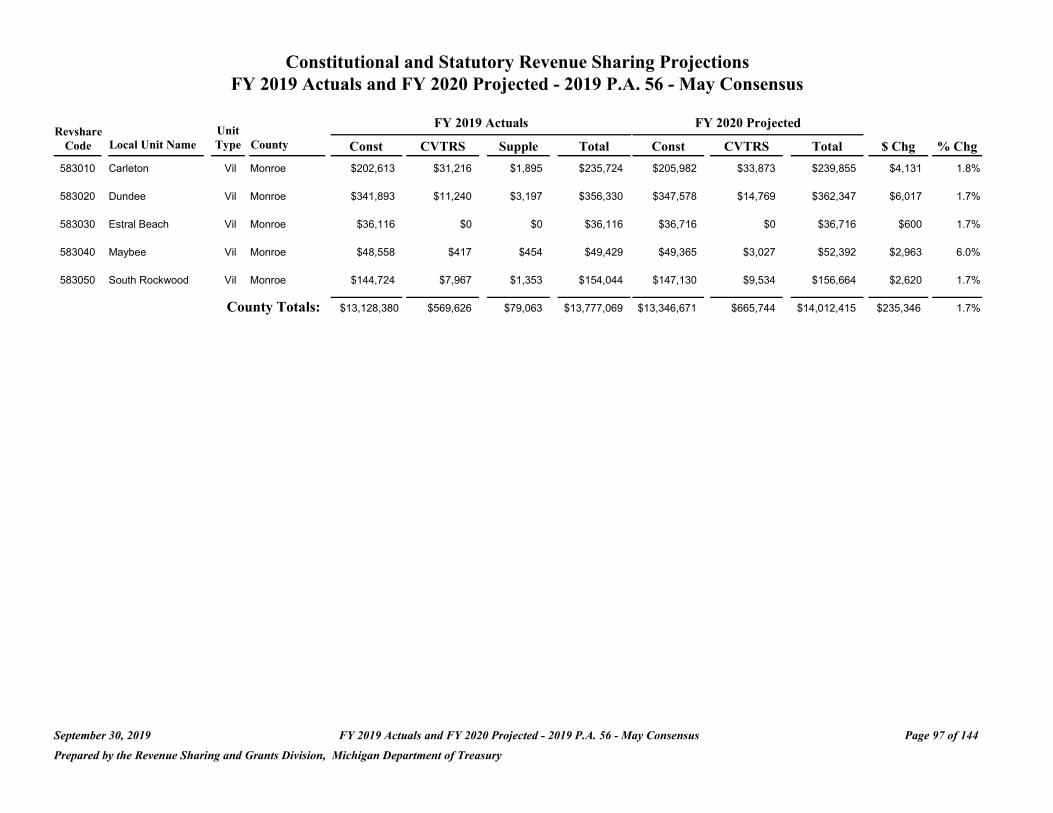
Constitutional and Statutory Revenue Sharing Projections FY 2019 Actuals and FY 2020 Projected - 2019 P.A. 56 - May Consensus
Revshare Unit FY 2019 Actuals FY 2020 Projected
Code Local Unit Name Type County Const CVTRS Supple Total Const CVTRS Total $ Chg % Chg
583010 Carleton Vil Monroe $202,613 $31,216 $1,895 $235,724 $205,982 $33,873 $239,855 $4,131 1.8%
583020 Dundee Vil Monroe $341,893 $11,240 $3,197 $356,330 $347,578 $14,769 $362,347 $6,017 1.7%
583030 Estral Beach Vil Monroe $36,116 $0 $0 $36,116 $36,716 $0 $36,716 $600 1.7%
583040 Maybee Vil Monroe $48,558 $417 $454 $49,429 $49,365 $3,027 $52,392 $2,963 6.0%
583050 South Rockwood Vil Monroe $144,724 $7,967 $1,353 $154,044 $147,130 $9,534 $156,664 $2,620 1.7%
County Totals: $13,128,380 $569,626 $79,063 $13,777,069 $13,346,671 $665,744 $14,012,415 $235,346 1.7%
September 30, 2019 FY 2019 Actuals and FY 2020 Projected - 2019 P.A. 56 - May Consensus Page 97 of 144
Prepared by the Revenue Sharing and Grants Division, Michigan Department of Treasury
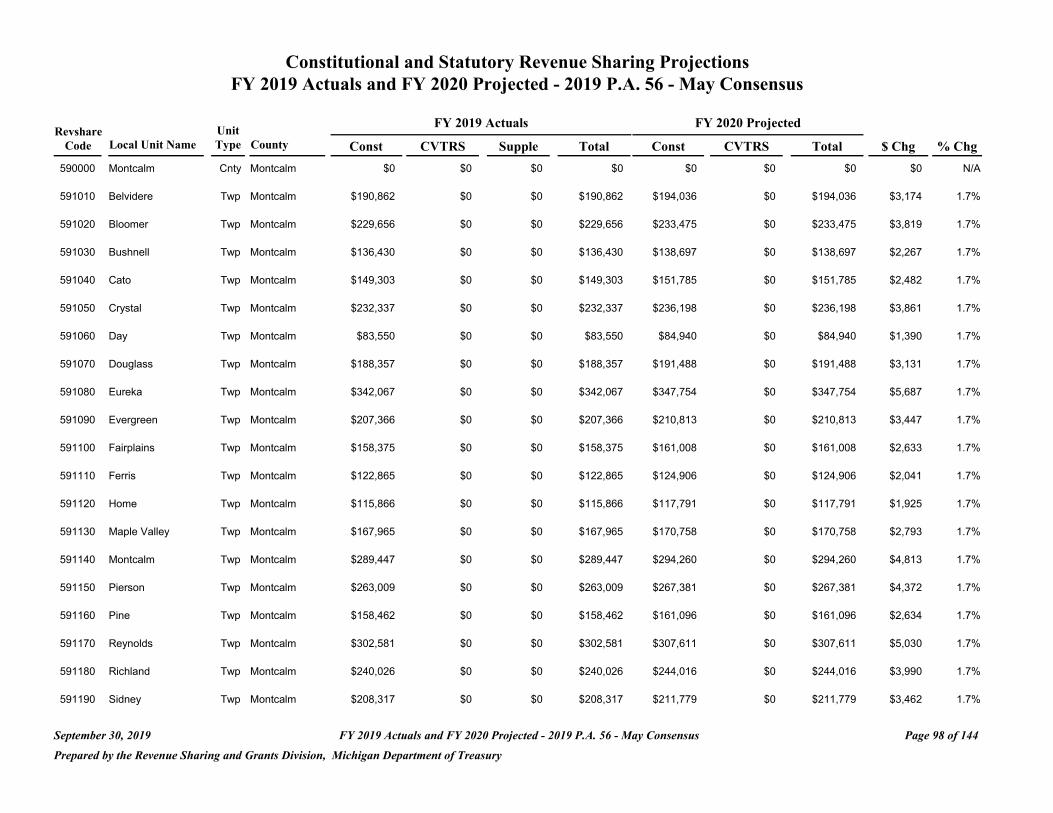
Constitutional and Statutory Revenue Sharing Projections FY 2019 Actuals and FY 2020 Projected - 2019 P.A. 56 - May Consensus
FY 2019 Actuals FY 2020 Projected Revshare Unit
Code Local Unit Name Type County Const CVTRS Supple Total Const CVTRS Total $ Chg % Chg
590000 Montcalm Cnty Montcalm $0 $0 $0 $0 $0 $0 $0 $0 N/A
591010 Belvidere Twp Montcalm $190,862 $0 $0 $190,862 $194,036 $0 $194,036 $3,174 1.7%
591020 Bloomer Twp Montcalm $229,656 $0 $0 $229,656 $233,475 $0 $233,475 $3,819 1.7%
591030 Bushnell Twp Montcalm $136,430 $0 $0 $136,430 $138,697 $0 $138,697 $2,267 1.7%
591040 Cato Twp Montcalm $149,303 $0 $0 $149,303 $151,785 $0 $151,785 $2,482 1.7%
591050 Crystal Twp Montcalm $232,337 $0 $0 $232,337 $236,198 $0 $236,198 $3,861 1.7%
591060 Day Twp Montcalm $83,550 $0 $0 $83,550 $84,940 $0 $84,940 $1,390 1.7%
591070 Douglass Twp Montcalm $188,357 $0 $0 $188,357 $191,488 $0 $191,488 $3,131 1.7%
591080 Eureka Twp Montcalm $342,067 $0 $0 $342,067 $347,754 $0 $347,754 $5,687 1.7%
591090 Evergreen Twp Montcalm $207,366 $0 $0 $207,366 $210,813 $0 $210,813 $3,447 1.7%
591100 Fairplains Twp Montcalm $158,375 $0 $0 $158,375 $161,008 $0 $161,008 $2,633 1.7%
591110 Ferris Twp Montcalm $122,865 $0 $0 $122,865 $124,906 $0 $124,906 $2,041 1.7%
591120 Home Twp Montcalm $115,866 $0 $0 $115,866 $117,791 $0 $117,791 $1,925 1.7%
591130 Maple Valley Twp Montcalm $167,965 $0 $0 $167,965 $170,758 $0 $170,758 $2,793 1.7%
591140 Montcalm Twp Montcalm $289,447 $0 $0 $289,447 $294,260 $0 $294,260 $4,813 1.7%
591150 Pierson Twp Montcalm $263,009 $0 $0 $263,009 $267,381 $0 $267,381 $4,372 1.7%
591160 Pine Twp Montcalm $158,462 $0 $0 $158,462 $161,096 $0 $161,096 $2,634 1.7%
591170 Reynolds Twp Montcalm $302,581 $0 $0 $302,581 $307,611 $0 $307,611 $5,030 1.7%
591180 Richland Twp Montcalm $240,026 $0 $0 $240,026 $244,016 $0 $244,016 $3,990 1.7%
591190 Sidney Twp Montcalm $208,317 $0 $0 $208,317 $211,779 $0 $211,779 $3,462 1.7%
September 30, 2019 FY 2019 Actuals and FY 2020 Projected - 2019 P.A. 56 - May Consensus Page 98 of 144
Prepared by the Revenue Sharing and Grants Division, Michigan Department of Treasury
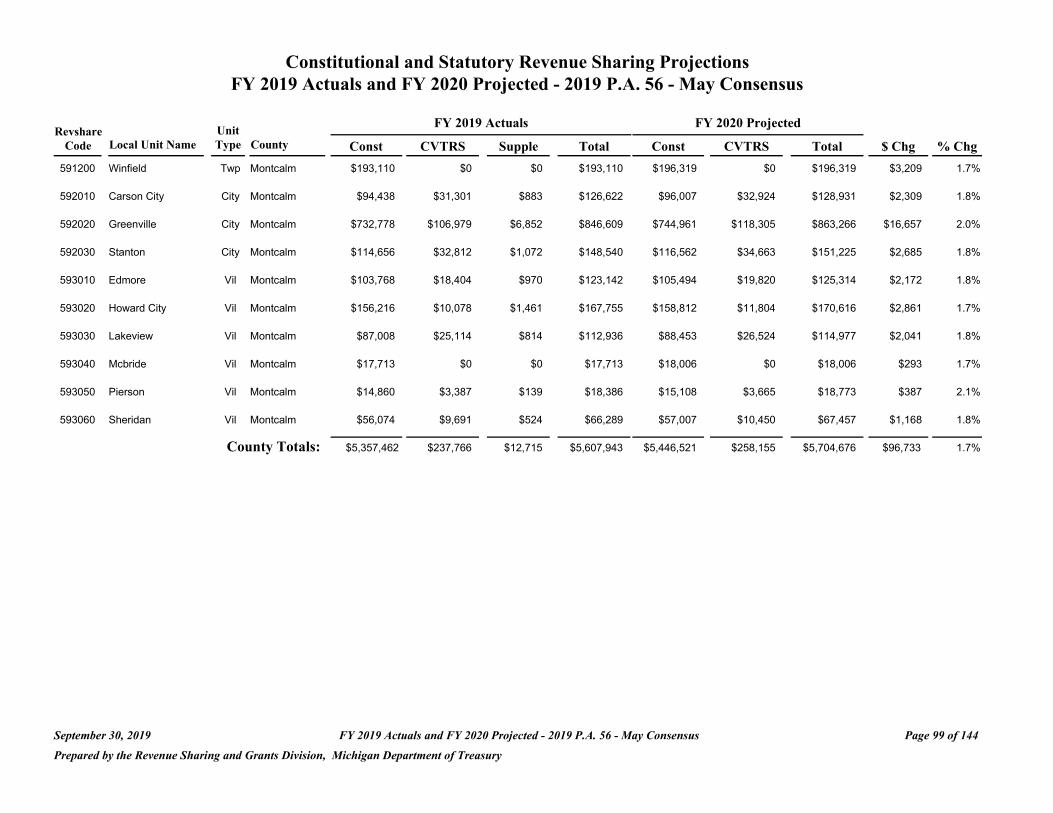
Constitutional and Statutory Revenue Sharing Projections FY 2019 Actuals and FY 2020 Projected - 2019 P.A. 56 - May Consensus
Revshare Unit FY 2019 Actuals FY 2020 Projected
Code Local Unit Name Type County Const CVTRS Supple Total Const CVTRS Total $ Chg % Chg
591200 Winfield Twp Montcalm $193,110 $0 $0 $193,110 $196,319 $0 $196,319 $3,209 1.7%
592010 Carson City City Montcalm $94,438 $31,301 $883 $126,622 $96,007 $32,924 $128,931 $2,309 1.8%
592020 Greenville City Montcalm $732,778 $106,979 $6,852 $846,609 $744,961 $118,305 $863,266 $16,657 2.0%
592030 Stanton City Montcalm $114,656 $32,812 $1,072 $148,540 $116,562 $34,663 $151,225 $2,685 1.8%
593010 Edmore Vil Montcalm $103,768 $18,404 $970 $123,142 $105,494 $19,820 $125,314 $2,172 1.8%
593020 Howard City Vil Montcalm $156,216 $10,078 $1,461 $167,755 $158,812 $11,804 $170,616 $2,861 1.7%
593030 Lakeview Vil Montcalm $87,008 $25,114 $814 $112,936 $88,453 $26,524 $114,977 $2,041 1.8%
593040 Mcbride Vil Montcalm $17,713 $0 $0 $17,713 $18,006 $0 $18,006 $293 1.7%
593050 Pierson Vil Montcalm $14,860 $3,387 $139 $18,386 $15,108 $3,665 $18,773 $387 2.1%
593060 Sheridan Vil Montcalm $56,074 $9,691 $524 $66,289 $57,007 $10,450 $67,457 $1,168 1.8%
County Totals: $5,357,462 $237,766 $12,715 $5,607,943 $5,446,521 $258,155 $5,704,676 $96,733 1.7%
September 30, 2019 FY 2019 Actuals and FY 2020 Projected - 2019 P.A. 56 - May Consensus Page 99 of 144
Prepared by the Revenue Sharing and Grants Division, Michigan Department of Treasury
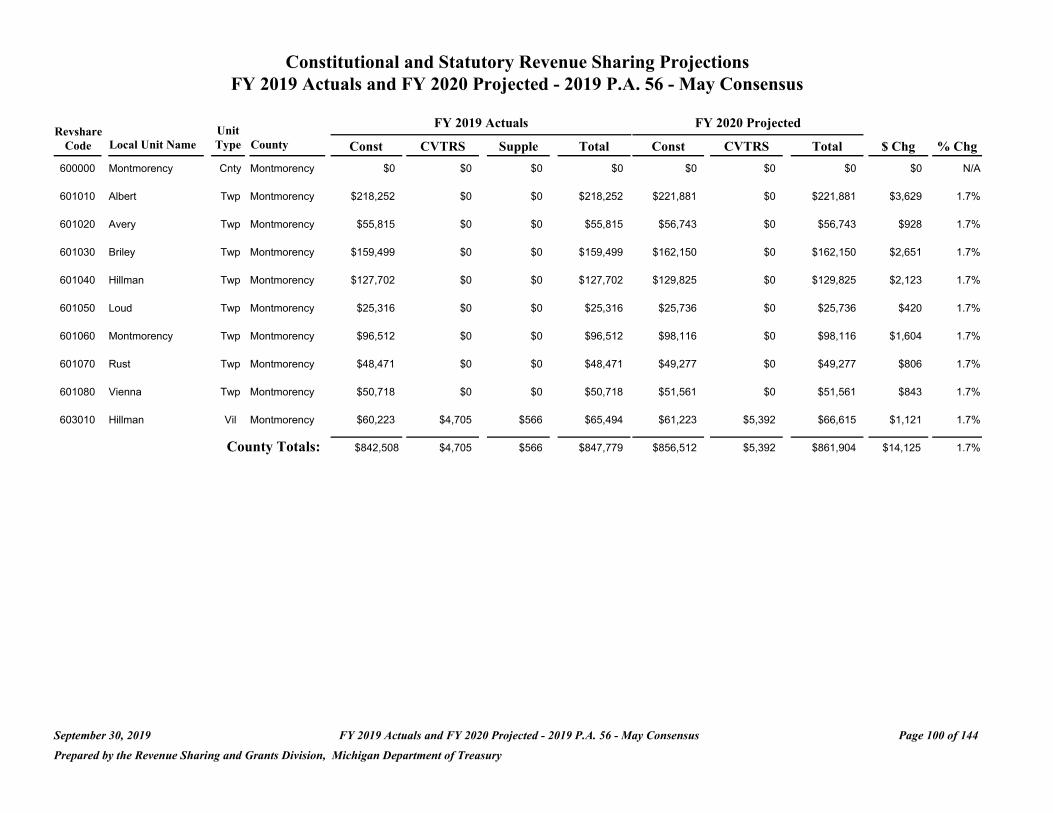
Constitutional and Statutory Revenue Sharing Projections FY 2019 Actuals and FY 2020 Projected - 2019 P.A. 56 - May Consensus
Revshare Unit FY 2019 Actuals FY 2020 Projected
Code Local Unit Name Type County Const CVTRS Supple Total Const CVTRS Total $ Chg % Chg
600000 Montmorency Cnty Montmorency $0 $0 $0 $0 $0 $0 $0 $0 N/A
601010 Albert Twp Montmorency $218,252 $0 $0 $218,252 $221,881 $0 $221,881 $3,629 1.7%
601020 Avery Twp Montmorency $55,815 $0 $0 $55,815 $56,743 $0 $56,743 $928 1.7%
601030 Briley Twp Montmorency $159,499 $0 $0 $159,499 $162,150 $0 $162,150 $2,651 1.7%
601040 Hillman Twp Montmorency $127,702 $0 $0 $127,702 $129,825 $0 $129,825 $2,123 1.7%
601050 Loud Twp Montmorency $25,316 $0 $0 $25,316 $25,736 $0 $25,736 $420 1.7%
601060 Montmorency Twp Montmorency $96,512 $0 $0 $96,512 $98,116 $0 $98,116 $1,604 1.7%
601070 Rust Twp Montmorency $48,471 $0 $0 $48,471 $49,277 $0 $49,277 $806 1.7%
601080 Vienna Twp Montmorency $50,718 $0 $0 $50,718 $51,561 $0 $51,561 $843 1.7%
603010 Hillman Vil Montmorency $60,223 $4,705 $566 $65,494 $61,223 $5,392 $66,615 $1,121 1.7%
County Totals: $842,508 $4,705 $566 $847,779 $856,512 $5,392 $861,904 $14,125 1.7%
September 30, 2019 FY 2019 Actuals and FY 2020 Projected - 2019 P.A. 56 - May Consensus Page 100 of 144
Prepared by the Revenue Sharing and Grants Division, Michigan Department of Treasury
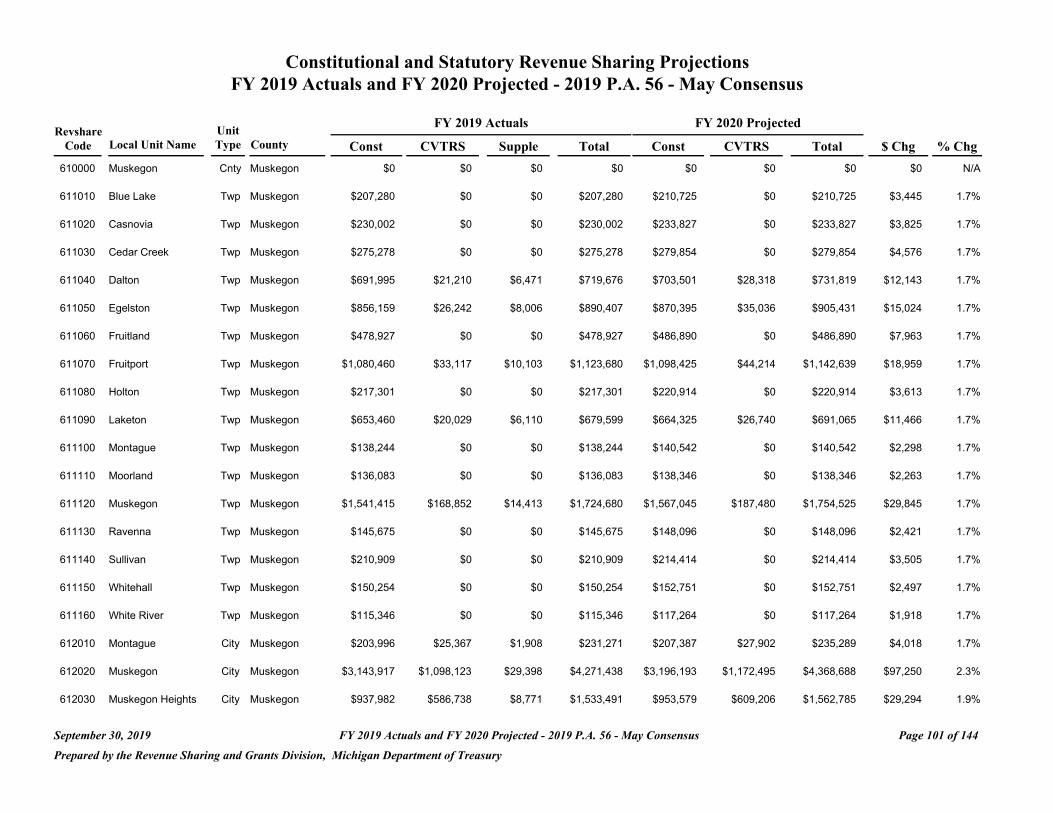
Constitutional and Statutory Revenue Sharing Projections FY 2019 Actuals and FY 2020 Projected - 2019 P.A. 56 - May Consensus
FY 2019 Actuals FY 2020 Projected Revshare Unit
Code Local Unit Name Type County Const CVTRS Supple Total Const CVTRS Total $ Chg % Chg
610000 Muskegon Cnty Muskegon $0 $0 $0 $0 $0 $0 $0 $0 N/A
611010 Blue Lake Twp Muskegon $207,280 $0 $0 $207,280 $210,725 $0 $210,725 $3,445 1.7%
611020 Casnovia Twp Muskegon $230,002 $0 $0 $230,002 $233,827 $0 $233,827 $3,825 1.7%
611030 Cedar Creek Twp Muskegon $275,278 $0 $0 $275,278 $279,854 $0 $279,854 $4,576 1.7%
611040 Dalton Twp Muskegon $691,995 $21,210 $6,471 $719,676 $703,501 $28,318 $731,819 $12,143 1.7%
611050 Egelston Twp Muskegon $856,159 $26,242 $8,006 $890,407 $870,395 $35,036 $905,431 $15,024 1.7%
611060 Fruitland Twp Muskegon $478,927 $0 $0 $478,927 $486,890 $0 $486,890 $7,963 1.7%
611070 Fruitport Twp Muskegon $1,080,460 $33,117 $10,103 $1,123,680 $1,098,425 $44,214 $1,142,639 $18,959 1.7%
611080 Holton Twp Muskegon $217,301 $0 $0 $217,301 $220,914 $0 $220,914 $3,613 1.7%
611090 Laketon Twp Muskegon $653,460 $20,029 $6,110 $679,599 $664,325 $26,740 $691,065 $11,466 1.7%
611100 Montague Twp Muskegon $138,244 $0 $0 $138,244 $140,542 $0 $140,542 $2,298 1.7%
611110 Moorland Twp Muskegon $136,083 $0 $0 $136,083 $138,346 $0 $138,346 $2,263 1.7%
611120 Muskegon Twp Muskegon $1,541,415 $168,852 $14,413 $1,724,680 $1,567,045 $187,480 $1,754,525 $29,845 1.7%
611130 Ravenna Twp Muskegon $145,675 $0 $0 $145,675 $148,096 $0 $148,096 $2,421 1.7%
611140 Sullivan Twp Muskegon $210,909 $0 $0 $210,909 $214,414 $0 $214,414 $3,505 1.7%
611150 Whitehall Twp Muskegon $150,254 $0 $0 $150,254 $152,751 $0 $152,751 $2,497 1.7%
611160 White River Twp Muskegon $115,346 $0 $0 $115,346 $117,264 $0 $117,264 $1,918 1.7%
612010 Montague City Muskegon $203,996 $25,367 $1,908 $231,271 $207,387 $27,902 $235,289 $4,018 1.7%
612020 Muskegon City Muskegon $3,143,917 $1,098,123 $29,398 $4,271,438 $3,196,193 $1,172,495 $4,368,688 $97,250 2.3%
612030 Muskegon Heights City Muskegon $937,982 $586,738 $8,771 $1,533,491 $953,579 $609,206 $1,562,785 $29,294 1.9%
September 30, 2019 FY 2019 Actuals and FY 2020 Projected - 2019 P.A. 56 - May Consensus Page 101 of 144
Prepared by the Revenue Sharing and Grants Division, Michigan Department of Treasury
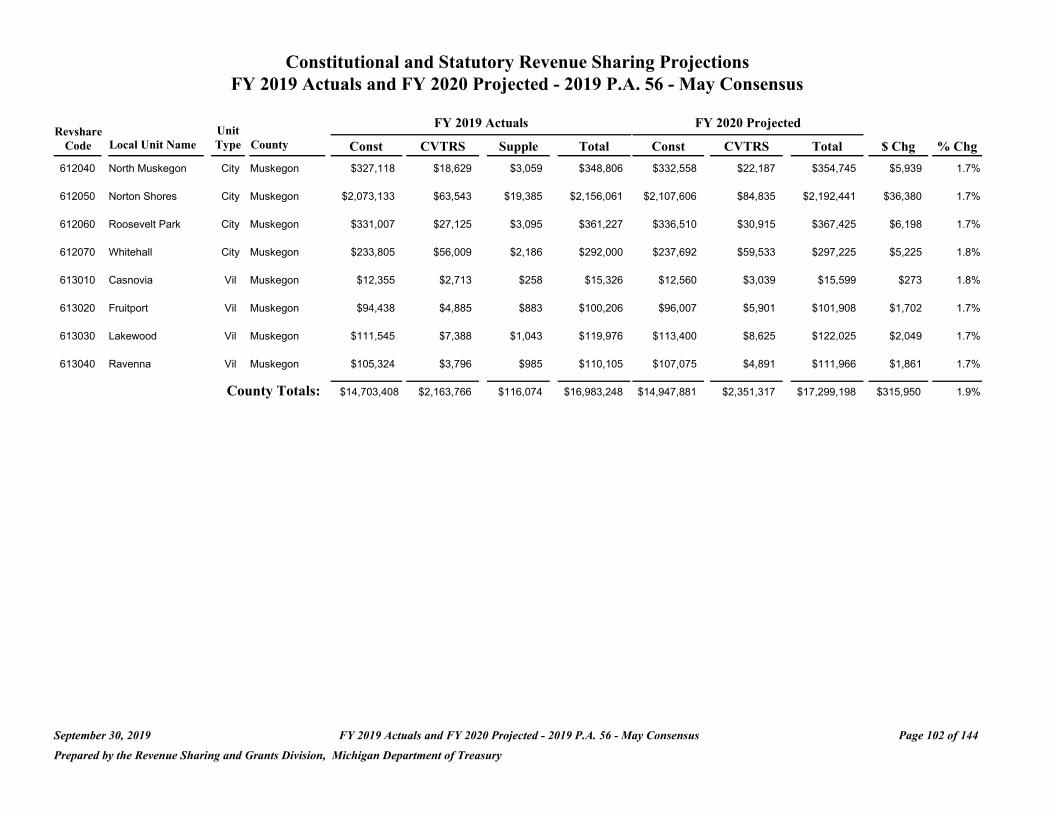
Constitutional and Statutory Revenue Sharing Projections FY 2019 Actuals and FY 2020 Projected - 2019 P.A. 56 - May Consensus
Revshare Unit FY 2019 Actuals FY 2020 Projected
Code Local Unit Name Type County Const CVTRS Supple Total Const CVTRS Total $ Chg % Chg
612040 North Muskegon City Muskegon $327,118 $18,629 $3,059 $348,806 $332,558 $22,187 $354,745 $5,939 1.7%
612050 Norton Shores City Muskegon $2,073,133 $63,543 $19,385 $2,156,061 $2,107,606 $84,835 $2,192,441 $36,380 1.7%
612060 Roosevelt Park City Muskegon $331,007 $27,125 $3,095 $361,227 $336,510 $30,915 $367,425 $6,198 1.7%
612070 Whitehall City Muskegon $233,805 $56,009 $2,186 $292,000 $237,692 $59,533 $297,225 $5,225 1.8%
613010 Casnovia Vil Muskegon $12,355 $2,713 $258 $15,326 $12,560 $3,039 $15,599 $273 1.8%
613020 Fruitport Vil Muskegon $94,438 $4,885 $883 $100,206 $96,007 $5,901 $101,908 $1,702 1.7%
613030 Lakewood Vil Muskegon $111,545 $7,388 $1,043 $119,976 $113,400 $8,625 $122,025 $2,049 1.7%
613040 Ravenna Vil Muskegon $105,324 $3,796 $985 $110,105 $107,075 $4,891 $111,966 $1,861 1.7%
County Totals: $14,703,408 $2,163,766 $116,074 $16,983,248 $14,947,881 $2,351,317 $17,299,198 $315,950 1.9%
September 30, 2019 FY 2019 Actuals and FY 2020 Projected - 2019 P.A. 56 - May Consensus Page 102 of 144
Prepared by the Revenue Sharing and Grants Division, Michigan Department of Treasury
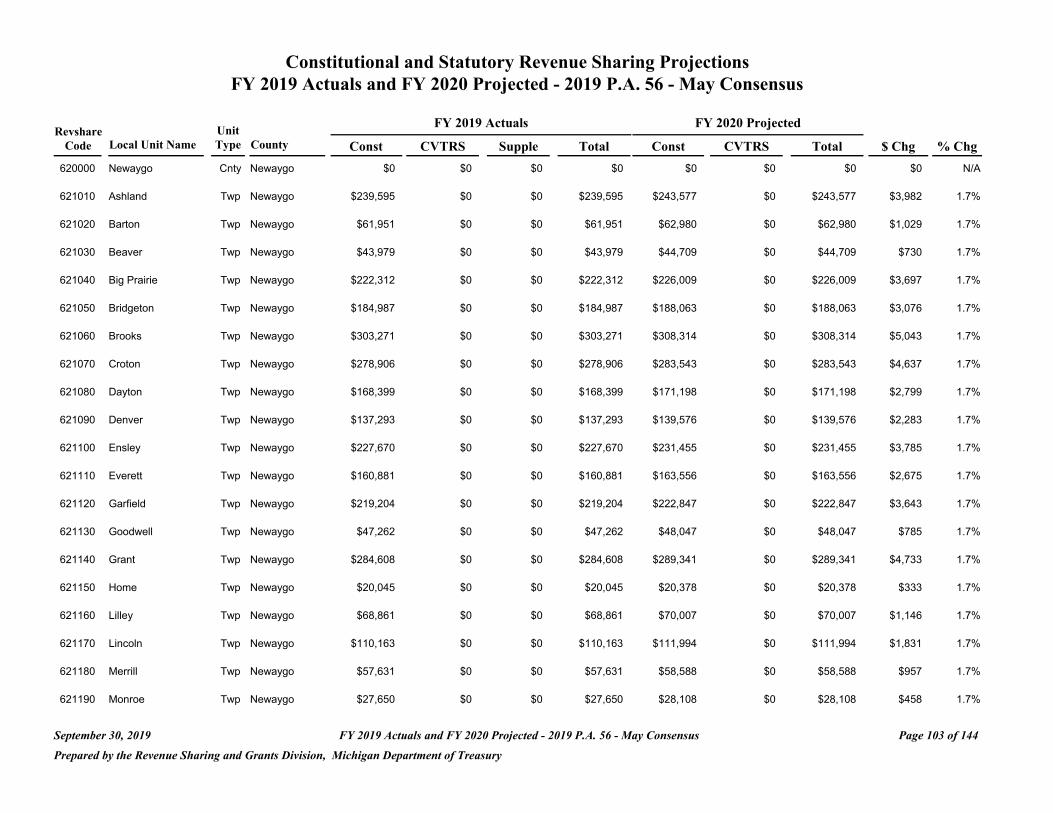
Constitutional and Statutory Revenue Sharing Projections FY 2019 Actuals and FY 2020 Projected - 2019 P.A. 56 - May Consensus
FY 2019 Actuals FY 2020 Projected Revshare Unit
Code Local Unit Name Type County Const CVTRS Supple Total Const CVTRS Total $ Chg % Chg
620000 Newaygo Cnty Newaygo $0 $0 $0 $0 $0 $0 $0 $0 N/A
621010 Ashland Twp Newaygo $239,595 $0 $0 $239,595 $243,577 $0 $243,577 $3,982 1.7%
621020 Barton Twp Newaygo $61,951 $0 $0 $61,951 $62,980 $0 $62,980 $1,029 1.7%
621030 Beaver Twp Newaygo $43,979 $0 $0 $43,979 $44,709 $0 $44,709 $730 1.7%
621040 Big Prairie Twp Newaygo $222,312 $0 $0 $222,312 $226,009 $0 $226,009 $3,697 1.7%
621050 Bridgeton Twp Newaygo $184,987 $0 $0 $184,987 $188,063 $0 $188,063 $3,076 1.7%
621060 Brooks Twp Newaygo $303,271 $0 $0 $303,271 $308,314 $0 $308,314 $5,043 1.7%
621070 Croton Twp Newaygo $278,906 $0 $0 $278,906 $283,543 $0 $283,543 $4,637 1.7%
621080 Dayton Twp Newaygo $168,399 $0 $0 $168,399 $171,198 $0 $171,198 $2,799 1.7%
621090 Denver Twp Newaygo $137,293 $0 $0 $137,293 $139,576 $0 $139,576 $2,283 1.7%
621100 Ensley Twp Newaygo $227,670 $0 $0 $227,670 $231,455 $0 $231,455 $3,785 1.7%
621110 Everett Twp Newaygo $160,881 $0 $0 $160,881 $163,556 $0 $163,556 $2,675 1.7%
621120 Garfield Twp Newaygo $219,204 $0 $0 $219,204 $222,847 $0 $222,847 $3,643 1.7%
621130 Goodwell Twp Newaygo $47,262 $0 $0 $47,262 $48,047 $0 $48,047 $785 1.7%
621140 Grant Twp Newaygo $284,608 $0 $0 $284,608 $289,341 $0 $289,341 $4,733 1.7%
621150 Home Twp Newaygo $20,045 $0 $0 $20,045 $20,378 $0 $20,378 $333 1.7%
621160 Lilley Twp Newaygo $68,861 $0 $0 $68,861 $70,007 $0 $70,007 $1,146 1.7%
621170 Lincoln Twp Newaygo $110,163 $0 $0 $110,163 $111,994 $0 $111,994 $1,831 1.7%
621180 Merrill Twp Newaygo $57,631 $0 $0 $57,631 $58,588 $0 $58,588 $957 1.7%
621190 Monroe Twp Newaygo $27,650 $0 $0 $27,650 $28,108 $0 $28,108 $458 1.7%
September 30, 2019 FY 2019 Actuals and FY 2020 Projected - 2019 P.A. 56 - May Consensus Page 103 of 144
Prepared by the Revenue Sharing and Grants Division, Michigan Department of Treasury
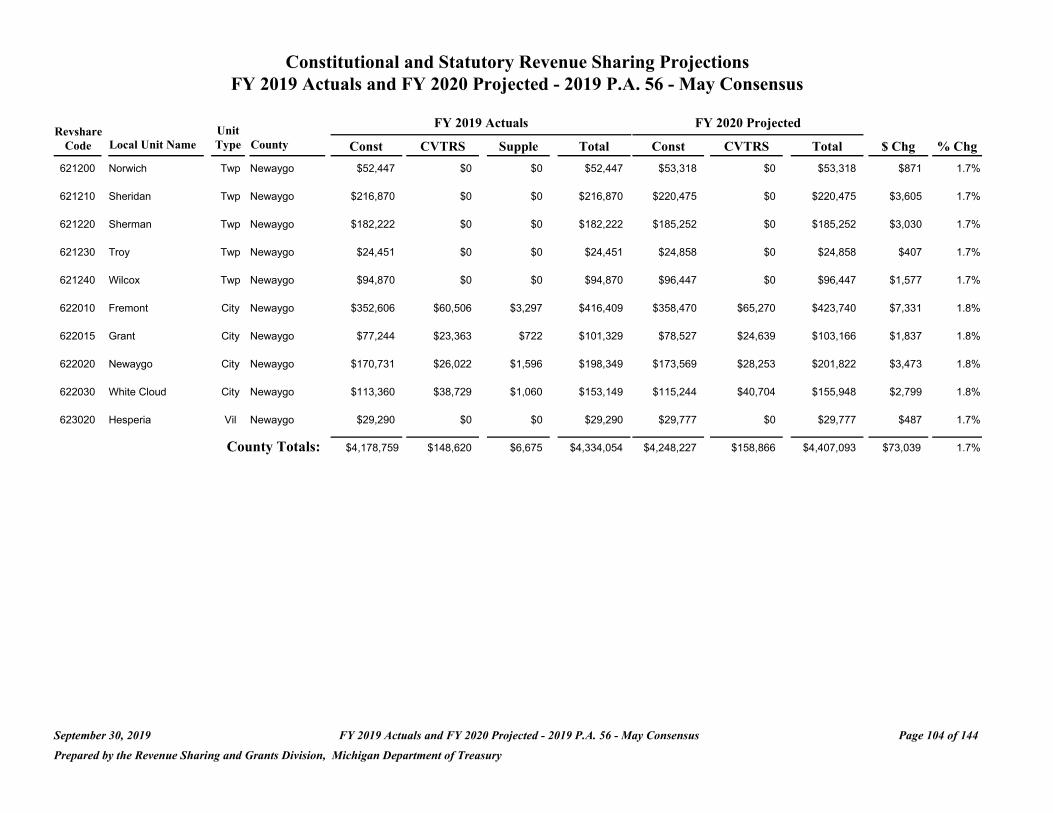
Constitutional and Statutory Revenue Sharing Projections FY 2019 Actuals and FY 2020 Projected - 2019 P.A. 56 - May Consensus
Revshare Unit FY 2019 Actuals FY 2020 Projected
Code Local Unit Name Type County Const CVTRS Supple Total Const CVTRS Total $ Chg % Chg
621200 Norwich Twp Newaygo $52,447 $0 $0 $52,447 $53,318 $0 $53,318 $871 1.7%
621210 Sheridan Twp Newaygo $216,870 $0 $0 $216,870 $220,475 $0 $220,475 $3,605 1.7%
621220 Sherman Twp Newaygo $182,222 $0 $0 $182,222 $185,252 $0 $185,252 $3,030 1.7%
621230 Troy Twp Newaygo $24,451 $0 $0 $24,451 $24,858 $0 $24,858 $407 1.7%
621240 Wilcox Twp Newaygo $94,870 $0 $0 $94,870 $96,447 $0 $96,447 $1,577 1.7%
622010 Fremont City Newaygo $352,606 $60,506 $3,297 $416,409 $358,470 $65,270 $423,740 $7,331 1.8%
622015 Grant City Newaygo $77,244 $23,363 $722 $101,329 $78,527 $24,639 $103,166 $1,837 1.8%
622020 Newaygo City Newaygo $170,731 $26,022 $1,596 $198,349 $173,569 $28,253 $201,822 $3,473 1.8%
622030 White Cloud City Newaygo $113,360 $38,729 $1,060 $153,149 $115,244 $40,704 $155,948 $2,799 1.8%
623020 Hesperia Vil Newaygo $29,290 $0 $0 $29,290 $29,777 $0 $29,777 $487 1.7%
County Totals: $4,178,759 $148,620 $6,675 $4,334,054 $4,248,227 $158,866 $4,407,093 $73,039 1.7%
September 30, 2019 FY 2019 Actuals and FY 2020 Projected - 2019 P.A. 56 - May Consensus Page 104 of 144
Prepared by the Revenue Sharing and Grants Division, Michigan Department of Treasury
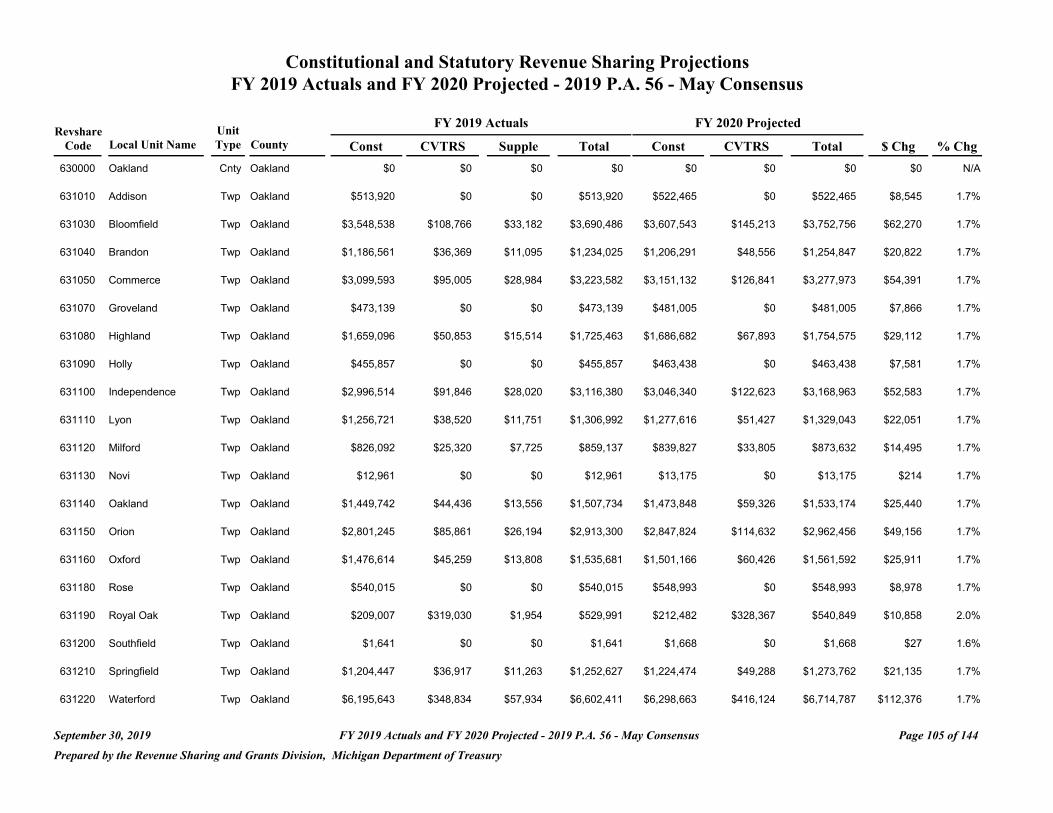
Constitutional and Statutory Revenue Sharing Projections FY 2019 Actuals and FY 2020 Projected - 2019 P.A. 56 - May Consensus
FY 2019 Actuals FY 2020 Projected Revshare Unit
Code Local Unit Name Type County Const CVTRS Supple Total Const CVTRS Total $ Chg % Chg
630000 Oakland Cnty Oakland $0 $0 $0 $0 $0 $0 $0 $0 N/A
631010 Addison Twp Oakland $513,920 $0 $0 $513,920 $522,465 $0 $522,465 $8,545 1.7%
631030 Bloomfield Twp Oakland $3,548,538 $108,766 $33,182 $3,690,486 $3,607,543 $145,213 $3,752,756 $62,270 1.7%
631040 Brandon Twp Oakland $1,186,561 $36,369 $11,095 $1,234,025 $1,206,291 $48,556 $1,254,847 $20,822 1.7%
631050 Commerce Twp Oakland $3,099,593 $95,005 $28,984 $3,223,582 $3,151,132 $126,841 $3,277,973 $54,391 1.7%
631070 Groveland Twp Oakland $473,139 $0 $0 $473,139 $481,005 $0 $481,005 $7,866 1.7%
631080 Highland Twp Oakland $1,659,096 $50,853 $15,514 $1,725,463 $1,686,682 $67,893 $1,754,575 $29,112 1.7%
631090 Holly Twp Oakland $455,857 $0 $0 $455,857 $463,438 $0 $463,438 $7,581 1.7%
631100 Independence Twp Oakland $2,996,514 $91,846 $28,020 $3,116,380 $3,046,340 $122,623 $3,168,963 $52,583 1.7%
631110 Lyon Twp Oakland $1,256,721 $38,520 $11,751 $1,306,992 $1,277,616 $51,427 $1,329,043 $22,051 1.7%
631120 Milford Twp Oakland $826,092 $25,320 $7,725 $859,137 $839,827 $33,805 $873,632 $14,495 1.7%
631130 Novi Twp Oakland $12,961 $0 $0 $12,961 $13,175 $0 $13,175 $214 1.7%
631140 Oakland Twp Oakland $1,449,742 $44,436 $13,556 $1,507,734 $1,473,848 $59,326 $1,533,174 $25,440 1.7%
631150 Orion Twp Oakland $2,801,245 $85,861 $26,194 $2,913,300 $2,847,824 $114,632 $2,962,456 $49,156 1.7%
631160 Oxford Twp Oakland $1,476,614 $45,259 $13,808 $1,535,681 $1,501,166 $60,426 $1,561,592 $25,911 1.7%
631180 Rose Twp Oakland $540,015 $0 $0 $540,015 $548,993 $0 $548,993 $8,978 1.7%
631190 Royal Oak Twp Oakland $209,007 $319,030 $1,954 $529,991 $212,482 $328,367 $540,849 $10,858 2.0%
631200 Southfield Twp Oakland $1,641 $0 $0 $1,641 $1,668 $0 $1,668 $27 1.6%
631210 Springfield Twp Oakland $1,204,447 $36,917 $11,263 $1,252,627 $1,224,474 $49,288 $1,273,762 $21,135 1.7%
631220 Waterford Twp Oakland $6,195,643 $348,834 $57,934 $6,602,411 $6,298,663 $416,124 $6,714,787 $112,376 1.7%
September 30, 2019 FY 2019 Actuals and FY 2020 Projected - 2019 P.A. 56 - May Consensus Page 105 of 144
Prepared by the Revenue Sharing and Grants Division, Michigan Department of Treasury
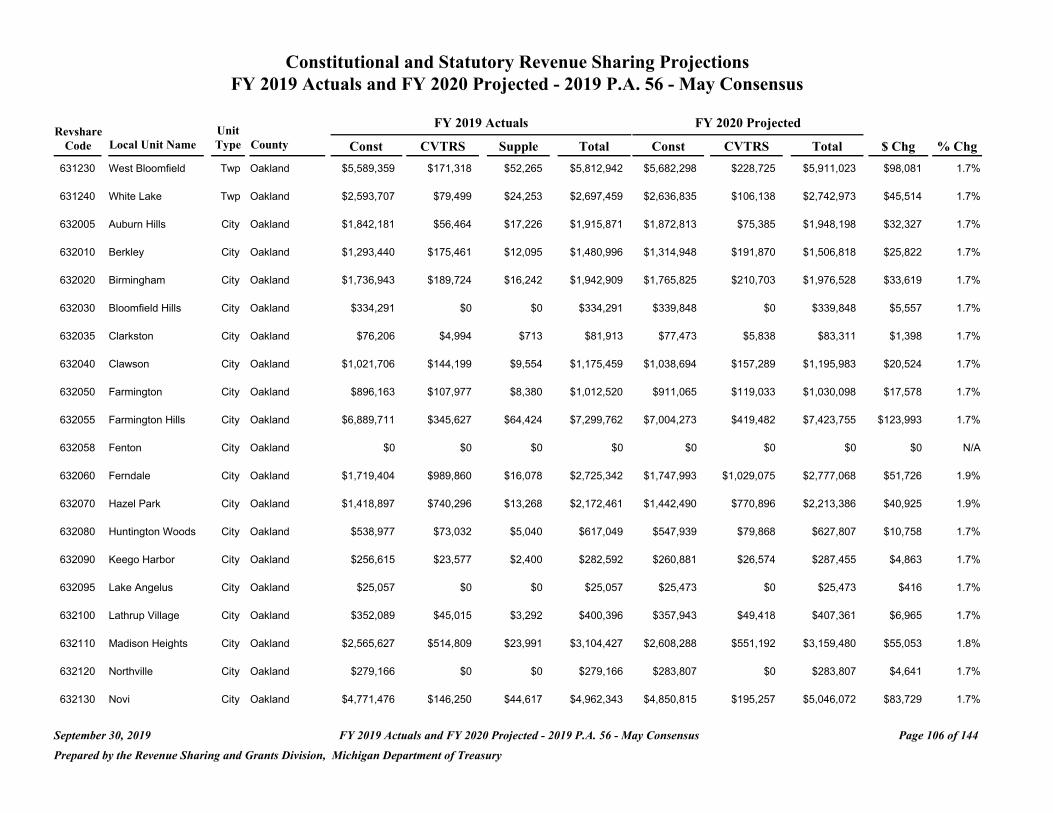
Constitutional and Statutory Revenue Sharing Projections FY 2019 Actuals and FY 2020 Projected - 2019 P.A. 56 - May Consensus
FY 2019 Actuals FY 2020 Projected Revshare Unit
Code Local Unit Name Type County Const CVTRS Supple Total Const CVTRS Total $ Chg % Chg
631230 West Bloomfield Twp Oakland $5,589,359 $171,318 $52,265 $5,812,942 $5,682,298 $228,725 $5,911,023 $98,081 1.7%
631240 White Lake Twp Oakland $2,593,707 $79,499 $24,253 $2,697,459 $2,636,835 $106,138 $2,742,973 $45,514 1.7%
632005 Auburn Hills City Oakland $1,842,181 $56,464 $17,226 $1,915,871 $1,872,813 $75,385 $1,948,198 $32,327 1.7%
632010 Berkley City Oakland $1,293,440 $175,461 $12,095 $1,480,996 $1,314,948 $191,870 $1,506,818 $25,822 1.7%
632020 Birmingham City Oakland $1,736,943 $189,724 $16,242 $1,942,909 $1,765,825 $210,703 $1,976,528 $33,619 1.7%
632030 Bloomfield Hills City Oakland $334,291 $0 $0 $334,291 $339,848 $0 $339,848 $5,557 1.7%
632035 Clarkston City Oakland $76,206 $4,994 $713 $81,913 $77,473 $5,838 $83,311 $1,398 1.7%
632040 Clawson City Oakland $1,021,706 $144,199 $9,554 $1,175,459 $1,038,694 $157,289 $1,195,983 $20,524 1.7%
632050 Farmington City Oakland $896,163 $107,977 $8,380 $1,012,520 $911,065 $119,033 $1,030,098 $17,578 1.7%
632055 Farmington Hills City Oakland $6,889,711 $345,627 $64,424 $7,299,762 $7,004,273 $419,482 $7,423,755 $123,993 1.7%
632058 Fenton City Oakland $0 $0 $0 $0 $0 $0 $0 $0 N/A
632060 Ferndale City Oakland $1,719,404 $989,860 $16,078 $2,725,342 $1,747,993 $1,029,075 $2,777,068 $51,726 1.9%
632070 Hazel Park City Oakland $1,418,897 $740,296 $13,268 $2,172,461 $1,442,490 $770,896 $2,213,386 $40,925 1.9%
632080 Huntington Woods City Oakland $538,977 $73,032 $5,040 $617,049 $547,939 $79,868 $627,807 $10,758 1.7%
632090 Keego Harbor City Oakland $256,615 $23,577 $2,400 $282,592 $260,881 $26,574 $287,455 $4,863 1.7%
632095 Lake Angelus City Oakland $25,057 $0 $0 $25,057 $25,473 $0 $25,473 $416 1.7%
632100 Lathrup Village City Oakland $352,089 $45,015 $3,292 $400,396 $357,943 $49,418 $407,361 $6,965 1.7%
632110 Madison Heights City Oakland $2,565,627 $514,809 $23,991 $3,104,427 $2,608,288 $551,192 $3,159,480 $55,053 1.8%
632120 Northville City Oakland $279,166 $0 $0 $279,166 $283,807 $0 $283,807 $4,641 1.7%
632130 Novi City Oakland $4,771,476 $146,250 $44,617 $4,962,343 $4,850,815 $195,257 $5,046,072 $83,729 1.7%
September 30, 2019 FY 2019 Actuals and FY 2020 Projected - 2019 P.A. 56 - May Consensus Page 106 of 144
Prepared by the Revenue Sharing and Grants Division, Michigan Department of Treasury
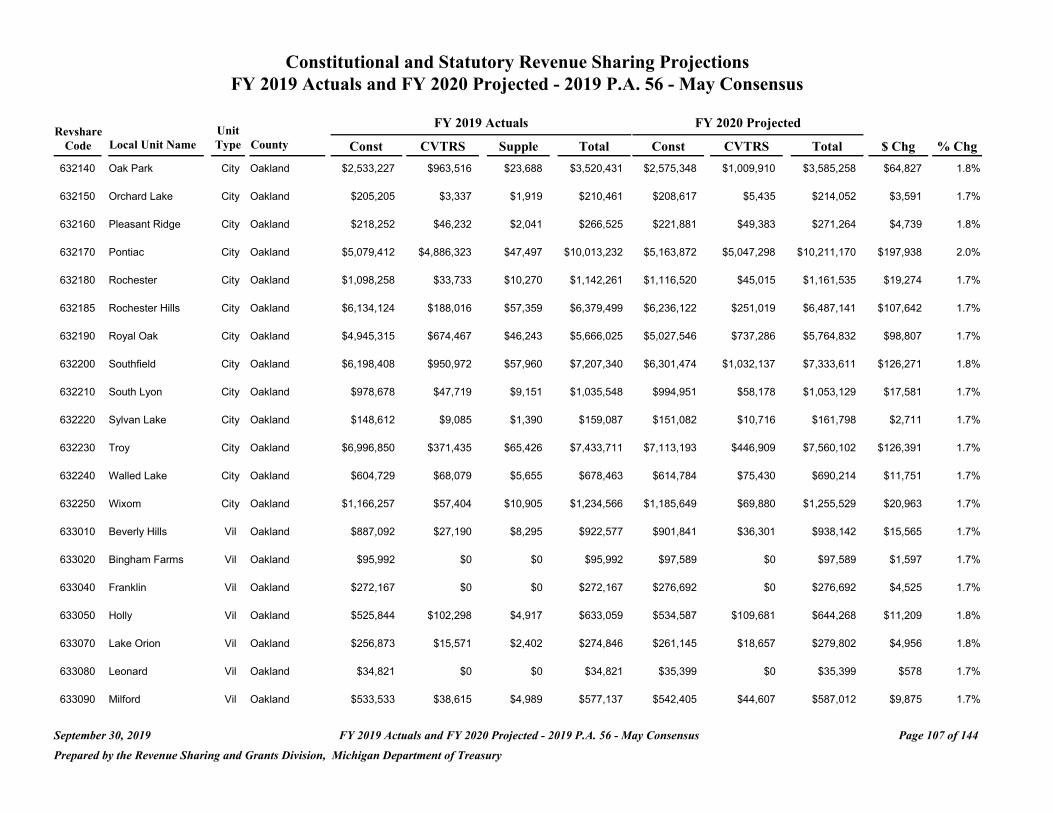
Constitutional and Statutory Revenue Sharing Projections FY 2019 Actuals and FY 2020 Projected - 2019 P.A. 56 - May Consensus
FY 2019 Actuals FY 2020 Projected Revshare Unit
Code Local Unit Name Type County Const CVTRS Supple Total Const CVTRS Total $ Chg % Chg
632140 Oak Park City Oakland $2,533,227 $963,516 $23,688 $3,520,431 $2,575,348 $1,009,910 $3,585,258 $64,827 1.8%
632150 Orchard Lake City Oakland $205,205 $3,337 $1,919 $210,461 $208,617 $5,435 $214,052 $3,591 1.7%
632160 Pleasant Ridge City Oakland $218,252 $46,232 $2,041 $266,525 $221,881 $49,383 $271,264 $4,739 1.8%
632170 Pontiac City Oakland $5,079,412 $4,886,323 $47,497 $10,013,232 $5,163,872 $5,047,298 $10,211,170 $197,938 2.0%
632180 Rochester City Oakland $1,098,258 $33,733 $10,270 $1,142,261 $1,116,520 $45,015 $1,161,535 $19,274 1.7%
632185 Rochester Hills City Oakland $6,134,124 $188,016 $57,359 $6,379,499 $6,236,122 $251,019 $6,487,141 $107,642 1.7%
632190 Royal Oak City Oakland $4,945,315 $674,467 $46,243 $5,666,025 $5,027,546 $737,286 $5,764,832 $98,807 1.7%
632200 Southfield City Oakland $6,198,408 $950,972 $57,960 $7,207,340 $6,301,474 $1,032,137 $7,333,611 $126,271 1.8%
632210 South Lyon City Oakland $978,678 $47,719 $9,151 $1,035,548 $994,951 $58,178 $1,053,129 $17,581 1.7%
632220 Sylvan Lake City Oakland $148,612 $9,085 $1,390 $159,087 $151,082 $10,716 $161,798 $2,711 1.7%
632230 Troy City Oakland $6,996,850 $371,435 $65,426 $7,433,711 $7,113,193 $446,909 $7,560,102 $126,391 1.7%
632240 Walled Lake City Oakland $604,729 $68,079 $5,655 $678,463 $614,784 $75,430 $690,214 $11,751 1.7%
632250 Wixom City Oakland $1,166,257 $57,404 $10,905 $1,234,566 $1,185,649 $69,880 $1,255,529 $20,963 1.7%
633010 Beverly Hills Vil Oakland $887,092 $27,190 $8,295 $922,577 $901,841 $36,301 $938,142 $15,565 1.7%
633020 Bingham Farms Vil Oakland $95,992 $0 $0 $95,992 $97,589 $0 $97,589 $1,597 1.7%
633040 Franklin Vil Oakland $272,167 $0 $0 $272,167 $276,692 $0 $276,692 $4,525 1.7%
633050 Holly Vil Oakland $525,844 $102,298 $4,917 $633,059 $534,587 $109,681 $644,268 $11,209 1.8%
633070 Lake Orion Vil Oakland $256,873 $15,571 $2,402 $274,846 $261,145 $18,657 $279,802 $4,956 1.8%
633080 Leonard Vil Oakland $34,821 $0 $0 $34,821 $35,399 $0 $35,399 $578 1.7%
633090 Milford Vil Oakland $533,533 $38,615 $4,989 $577,137 $542,405 $44,607 $587,012 $9,875 1.7%
September 30, 2019 FY 2019 Actuals and FY 2020 Projected - 2019 P.A. 56 - May Consensus Page 107 of 144
Prepared by the Revenue Sharing and Grants Division, Michigan Department of Treasury
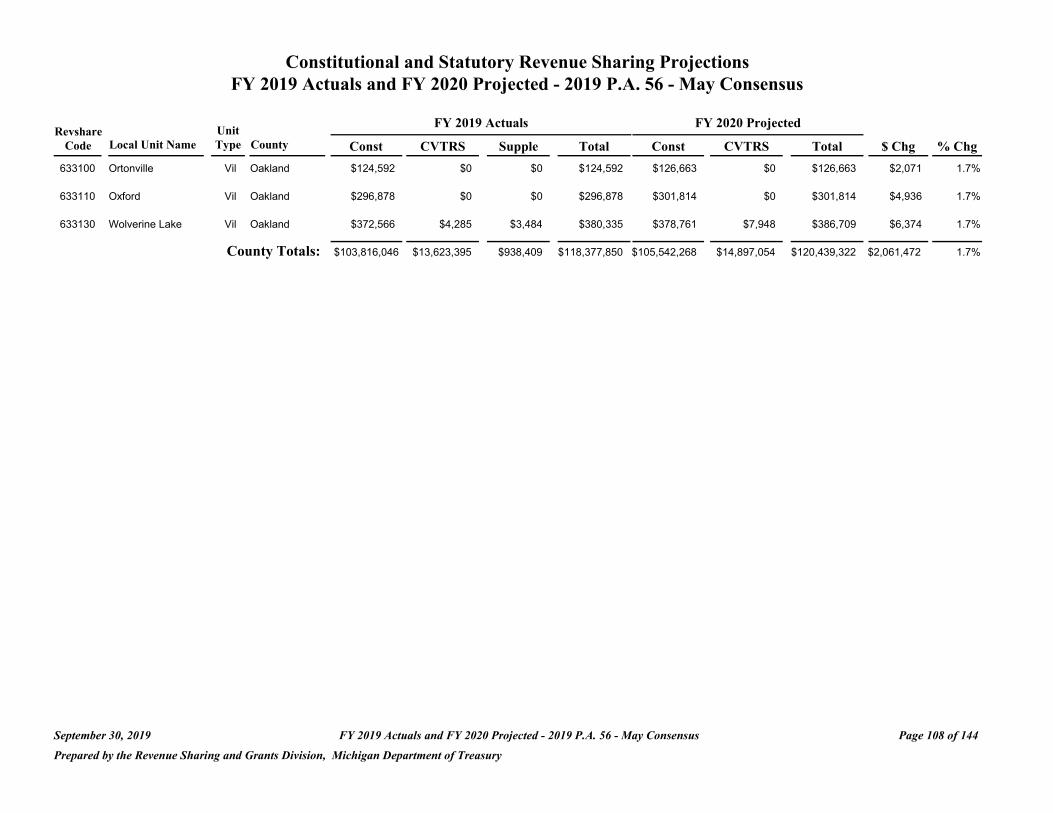
Constitutional and Statutory Revenue Sharing Projections FY 2019 Actuals and FY 2020 Projected - 2019 P.A. 56 - May Consensus
Revshare Code
633100
Local Unit Name
Ortonville
Unit Type County
Vil Oakland
Const $124,592
FY 2019 Actuals
CVTRS Supple
$0 $0
Total $124,592
FY 2020 Projected
Const CVTRS
$126,663 $0
Total $126,663
$ Chg
$2,071
% Chg
1.7%
633110 Oxford Vil Oakland $296,878 $0 $0 $296,878 $301,814 $0 $301,814 $4,936 1.7%
633130 Wolverine Lake Vil Oakland $372,566 $4,285 $3,484 $380,335 $378,761 $7,948 $386,709 $6,374 1.7%
County Totals: $103,816,046 $13,623,395 $938,409 $118,377,850 $105,542,268 $14,897,054 $120,439,322 $2,061,472 1.7%
September 30, 2019 FY 2019 Actuals and FY 2020 Projected - 2019 P.A. 56 - May Consensus Page 108 of 144
Prepared by the Revenue Sharing and Grants Division, Michigan Department of Treasury
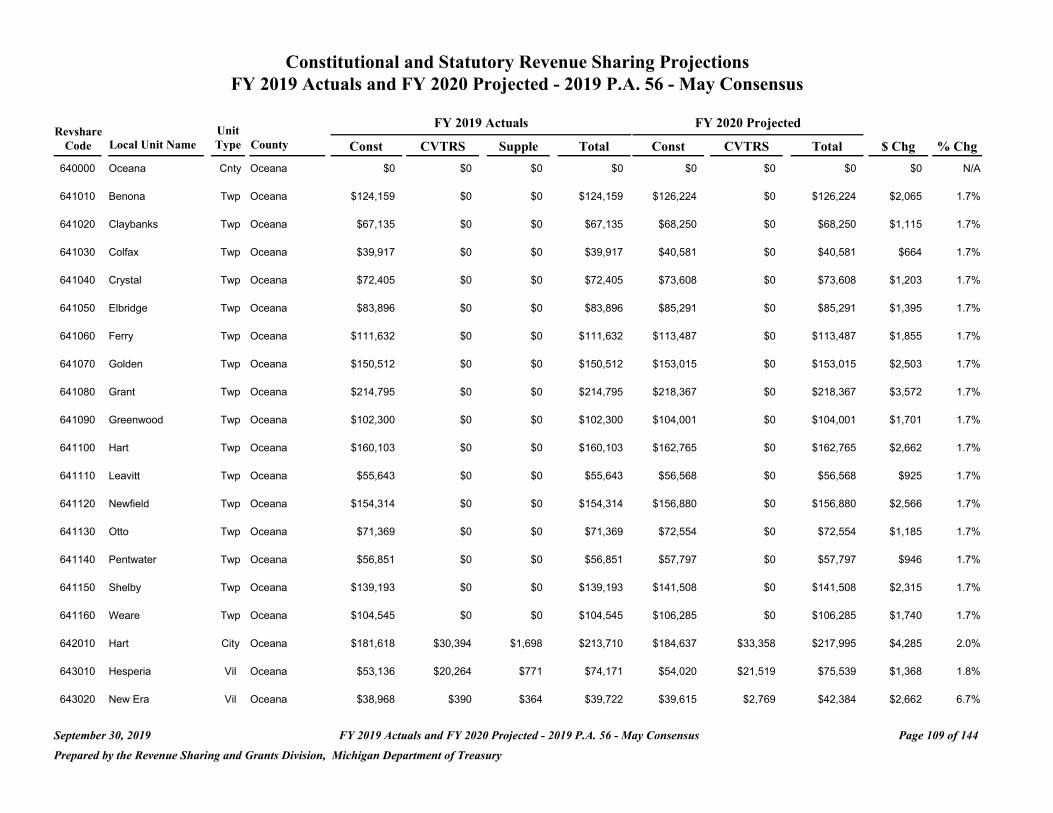
Constitutional and Statutory Revenue Sharing Projections FY 2019 Actuals and FY 2020 Projected - 2019 P.A. 56 - May Consensus
FY 2019 Actuals FY 2020 Projected Revshare Unit
Code Local Unit Name Type County Const CVTRS Supple Total Const CVTRS Total $ Chg % Chg
640000 Oceana Cnty Oceana $0 $0 $0 $0 $0 $0 $0 $0 N/A
641010 Benona Twp Oceana $124,159 $0 $0 $124,159 $126,224 $0 $126,224 $2,065 1.7%
641020 Claybanks Twp Oceana $67,135 $0 $0 $67,135 $68,250 $0 $68,250 $1,115 1.7%
641030 Colfax Twp Oceana $39,917 $0 $0 $39,917 $40,581 $0 $40,581 $664 1.7%
641040 Crystal Twp Oceana $72,405 $0 $0 $72,405 $73,608 $0 $73,608 $1,203 1.7%
641050 Elbridge Twp Oceana $83,896 $0 $0 $83,896 $85,291 $0 $85,291 $1,395 1.7%
641060 Ferry Twp Oceana $111,632 $0 $0 $111,632 $113,487 $0 $113,487 $1,855 1.7%
641070 Golden Twp Oceana $150,512 $0 $0 $150,512 $153,015 $0 $153,015 $2,503 1.7%
641080 Grant Twp Oceana $214,795 $0 $0 $214,795 $218,367 $0 $218,367 $3,572 1.7%
641090 Greenwood Twp Oceana $102,300 $0 $0 $102,300 $104,001 $0 $104,001 $1,701 1.7%
641100 Hart Twp Oceana $160,103 $0 $0 $160,103 $162,765 $0 $162,765 $2,662 1.7%
641110 Leavitt Twp Oceana $55,643 $0 $0 $55,643 $56,568 $0 $56,568 $925 1.7%
641120 Newfield Twp Oceana $154,314 $0 $0 $154,314 $156,880 $0 $156,880 $2,566 1.7%
641130 Otto Twp Oceana $71,369 $0 $0 $71,369 $72,554 $0 $72,554 $1,185 1.7%
641140 Pentwater Twp Oceana $56,851 $0 $0 $56,851 $57,797 $0 $57,797 $946 1.7%
641150 Shelby Twp Oceana $139,193 $0 $0 $139,193 $141,508 $0 $141,508 $2,315 1.7%
641160 Weare Twp Oceana $104,545 $0 $0 $104,545 $106,285 $0 $106,285 $1,740 1.7%
642010 Hart City Oceana $181,618 $30,394 $1,698 $213,710 $184,637 $33,358 $217,995 $4,285 2.0%
643010 Hesperia Vil Oceana $53,136 $20,264 $771 $74,171 $54,020 $21,519 $75,539 $1,368 1.8%
643020 New Era Vil Oceana $38,968 $390 $364 $39,722 $39,615 $2,769 $42,384 $2,662 6.7%
September 30, 2019 FY 2019 Actuals and FY 2020 Projected - 2019 P.A. 56 - May Consensus Page 109 of 144
Prepared by the Revenue Sharing and Grants Division, Michigan Department of Treasury
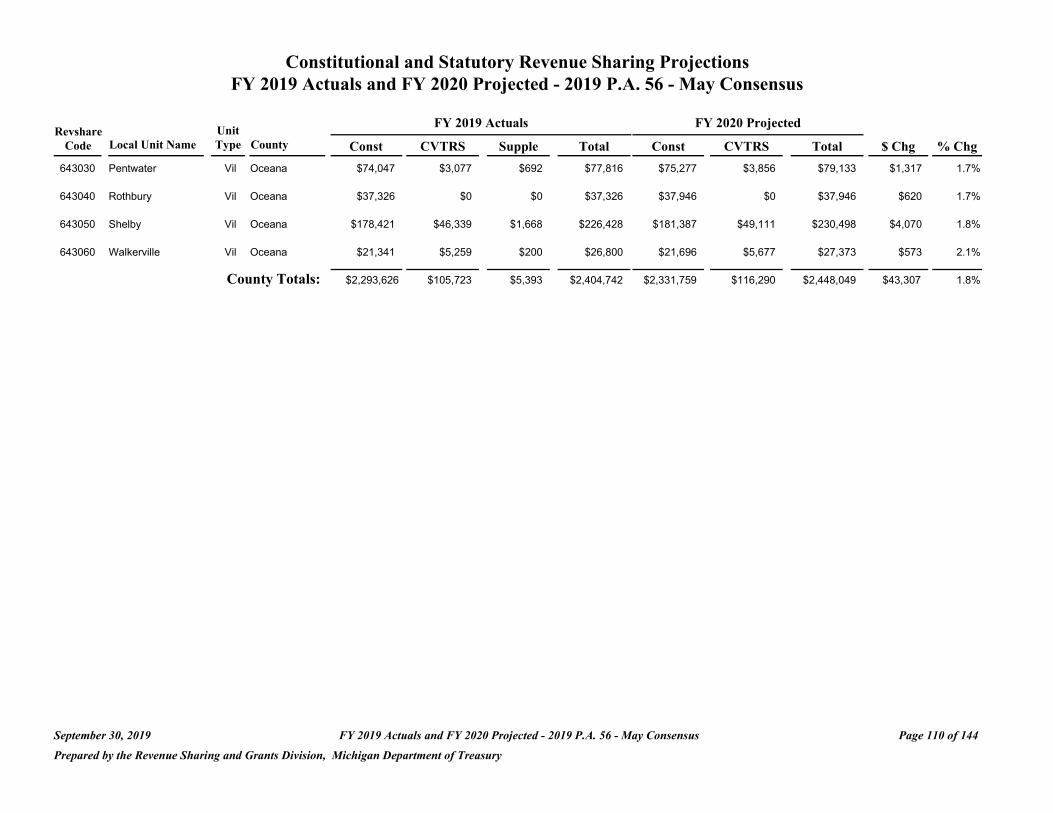
Constitutional and Statutory Revenue Sharing Projections FY 2019 Actuals and FY 2020 Projected - 2019 P.A. 56 - May Consensus
Revshare Code Local Unit Name
643030 Pentwater
Unit Type County
Vil Oceana
Const $74,047
FY 2019 Actuals
CVTRS Supple
$3,077 $692
Total $77,816
FY 2020 Projected
Const CVTRS
$75,277 $3,856
Total $79,133
$ Chg
$1,317
% Chg
1.7%
643040 Rothbury Vil Oceana $37,326 $0 $0 $37,326 $37,946 $0 $37,946 $620 1.7%
643050 Shelby Vil Oceana $178,421 $46,339 $1,668 $226,428 $181,387 $49,111 $230,498 $4,070 1.8%
643060 Walkerville Vil Oceana $21,341 $5,259 $200 $26,800 $21,696 $5,677 $27,373 $573 2.1%
County Totals: $2,293,626 $105,723 $5,393 $2,404,742 $2,331,759 $116,290 $2,448,049 $43,307 1.8%
September 30, 2019 FY 2019 Actuals and FY 2020 Projected - 2019 P.A. 56 - May Consensus Page 110 of 144
Prepared by the Revenue Sharing and Grants Division, Michigan Department of Treasury

Constitutional and Statutory Revenue Sharing Projections FY 2019 Actuals and FY 2020 Projected - 2019 P.A. 56 - May Consensus
Revshare Unit FY 2019 Actuals FY 2020 Projected
Code Local Unit Name Type County Const CVTRS Supple Total Const CVTRS Total $ Chg % Chg
650000 Ogemaw Cnty Ogemaw $0 $0 $0 $0 $0 $0 $0 $0 N/A
651010 Churchill Twp Ogemaw $148,007 $0 $0 $148,007 $150,468 $0 $150,468 $2,461 1.7%
651020 Cumming Twp Ogemaw $60,309 $0 $0 $60,309 $61,311 $0 $61,311 $1,002 1.7%
651030 Edwards Twp Ogemaw $122,086 $0 $0 $122,086 $124,116 $0 $124,116 $2,030 1.7%
651040 Foster Twp Ogemaw $72,836 $0 $0 $72,836 $74,048 $0 $74,048 $1,212 1.7%
651050 Goodar Twp Ogemaw $34,389 $0 $0 $34,389 $34,959 $0 $34,959 $570 1.7%
651060 Hill Twp Ogemaw $117,594 $0 $0 $117,594 $119,548 $0 $119,548 $1,954 1.7%
651070 Horton Twp Ogemaw $80,095 $0 $0 $80,095 $81,426 $0 $81,426 $1,331 1.7%
651080 Klacking Twp Ogemaw $53,050 $0 $0 $53,050 $53,933 $0 $53,933 $883 1.7%
651090 Logan Twp Ogemaw $47,607 $0 $0 $47,607 $48,399 $0 $48,399 $792 1.7%
651100 Mills Twp Ogemaw $370,752 $0 $0 $370,752 $376,916 $0 $376,916 $6,164 1.7%
651110 Ogemaw Twp Ogemaw $105,670 $0 $0 $105,670 $107,426 $0 $107,426 $1,756 1.7%
651120 Richland Twp Ogemaw $55,989 $0 $0 $55,989 $56,919 $0 $56,919 $930 1.7%
651130 Rose Twp Ogemaw $118,197 $0 $0 $118,197 $120,163 $0 $120,163 $1,966 1.7%
651140 West Branch Twp Ogemaw $224,042 $0 $0 $224,042 $227,766 $0 $227,766 $3,724 1.7%
652010 Rose City City Ogemaw $56,420 $21,106 $528 $78,054 $57,358 $22,132 $79,490 $1,436 1.8%
652020 West Branch City Ogemaw $183,431 $26,544 $1,715 $211,690 $186,481 $28,909 $215,390 $3,700 1.7%
653010 Prescott Village Vil Ogemaw $22,983 $275 $215 $23,473 $23,365 $1,909 $25,274 $1,801 7.7%
County Totals: $1,873,457 $47,925 $2,458 $1,923,840 $1,904,602 $52,950 $1,957,552 $33,712 1.8%
September 30, 2019 FY 2019 Actuals and FY 2020 Projected - 2019 P.A. 56 - May Consensus Page 111 of 144
Prepared by the Revenue Sharing and Grants Division, Michigan Department of Treasury
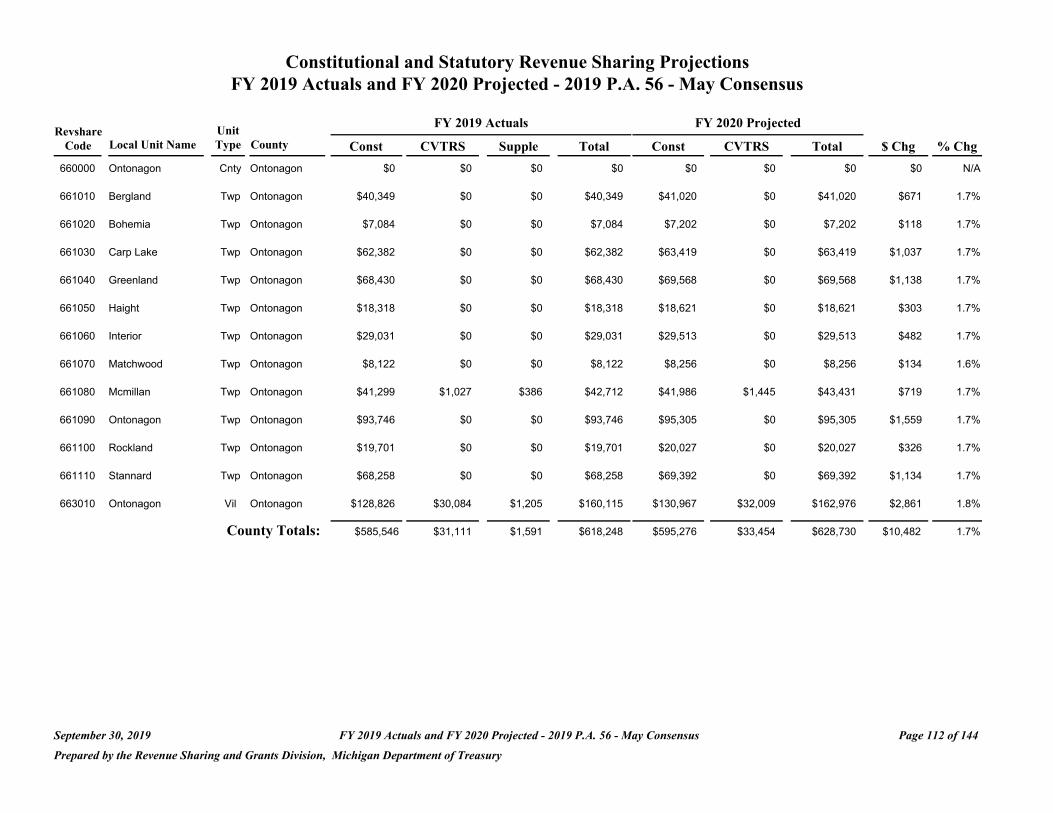
Constitutional and Statutory Revenue Sharing Projections FY 2019 Actuals and FY 2020 Projected - 2019 P.A. 56 - May Consensus
Revshare Unit FY 2019 Actuals FY 2020 Projected
Code Local Unit Name Type County Const CVTRS Supple Total Const CVTRS Total $ Chg % Chg
660000 Ontonagon Cnty Ontonagon $0 $0 $0 $0 $0 $0 $0 $0 N/A
661010 Bergland Twp Ontonagon $40,349 $0 $0 $40,349 $41,020 $0 $41,020 $671 1.7%
661020 Bohemia Twp Ontonagon $7,084 $0 $0 $7,084 $7,202 $0 $7,202 $118 1.7%
661030 Carp Lake Twp Ontonagon $62,382 $0 $0 $62,382 $63,419 $0 $63,419 $1,037 1.7%
661040 Greenland Twp Ontonagon $68,430 $0 $0 $68,430 $69,568 $0 $69,568 $1,138 1.7%
661050 Haight Twp Ontonagon $18,318 $0 $0 $18,318 $18,621 $0 $18,621 $303 1.7%
661060 Interior Twp Ontonagon $29,031 $0 $0 $29,031 $29,513 $0 $29,513 $482 1.7%
661070 Matchwood Twp Ontonagon $8,122 $0 $0 $8,122 $8,256 $0 $8,256 $134 1.6%
661080 Mcmillan Twp Ontonagon $41,299 $1,027 $386 $42,712 $41,986 $1,445 $43,431 $719 1.7%
661090 Ontonagon Twp Ontonagon $93,746 $0 $0 $93,746 $95,305 $0 $95,305 $1,559 1.7%
661100 Rockland Twp Ontonagon $19,701 $0 $0 $19,701 $20,027 $0 $20,027 $326 1.7%
661110 Stannard Twp Ontonagon $68,258 $0 $0 $68,258 $69,392 $0 $69,392 $1,134 1.7%
663010 Ontonagon Vil Ontonagon $128,826 $30,084 $1,205 $160,115 $130,967 $32,009 $162,976 $2,861 1.8%
County Totals: $585,546 $31,111 $1,591 $618,248 $595,276 $33,454 $628,730 $10,482 1.7%
September 30, 2019 FY 2019 Actuals and FY 2020 Projected - 2019 P.A. 56 - May Consensus Page 112 of 144
Prepared by the Revenue Sharing and Grants Division, Michigan Department of Treasury
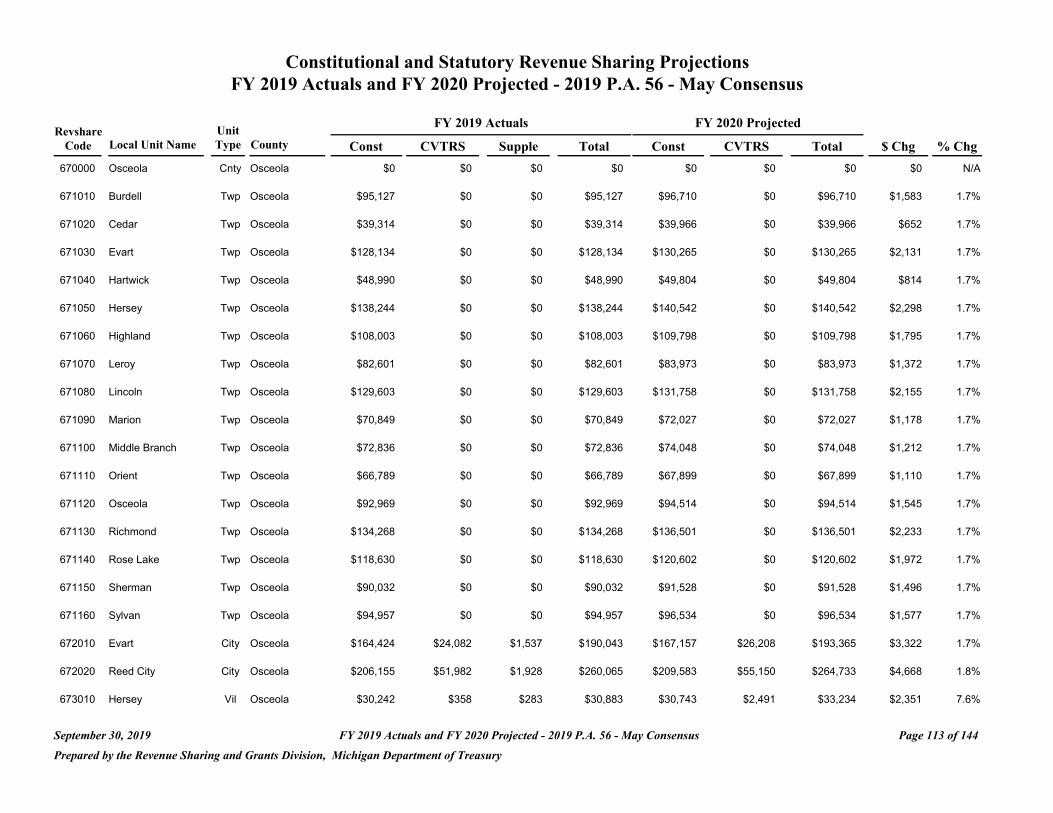
Constitutional and Statutory Revenue Sharing Projections FY 2019 Actuals and FY 2020 Projected - 2019 P.A. 56 - May Consensus
FY 2019 Actuals FY 2020 Projected Revshare Unit
Code Local Unit Name Type County Const CVTRS Supple Total Const CVTRS Total $ Chg % Chg
670000 Osceola Cnty Osceola $0 $0 $0 $0 $0 $0 $0 $0 N/A
671010 Burdell Twp Osceola $95,127 $0 $0 $95,127 $96,710 $0 $96,710 $1,583 1.7%
671020 Cedar Twp Osceola $39,314 $0 $0 $39,314 $39,966 $0 $39,966 $652 1.7%
671030 Evart Twp Osceola $128,134 $0 $0 $128,134 $130,265 $0 $130,265 $2,131 1.7%
671040 Hartwick Twp Osceola $48,990 $0 $0 $48,990 $49,804 $0 $49,804 $814 1.7%
671050 Hersey Twp Osceola $138,244 $0 $0 $138,244 $140,542 $0 $140,542 $2,298 1.7%
671060 Highland Twp Osceola $108,003 $0 $0 $108,003 $109,798 $0 $109,798 $1,795 1.7%
671070 Leroy Twp Osceola $82,601 $0 $0 $82,601 $83,973 $0 $83,973 $1,372 1.7%
671080 Lincoln Twp Osceola $129,603 $0 $0 $129,603 $131,758 $0 $131,758 $2,155 1.7%
671090 Marion Twp Osceola $70,849 $0 $0 $70,849 $72,027 $0 $72,027 $1,178 1.7%
671100 Middle Branch Twp Osceola $72,836 $0 $0 $72,836 $74,048 $0 $74,048 $1,212 1.7%
671110 Orient Twp Osceola $66,789 $0 $0 $66,789 $67,899 $0 $67,899 $1,110 1.7%
671120 Osceola Twp Osceola $92,969 $0 $0 $92,969 $94,514 $0 $94,514 $1,545 1.7%
671130 Richmond Twp Osceola $134,268 $0 $0 $134,268 $136,501 $0 $136,501 $2,233 1.7%
671140 Rose Lake Twp Osceola $118,630 $0 $0 $118,630 $120,602 $0 $120,602 $1,972 1.7%
671150 Sherman Twp Osceola $90,032 $0 $0 $90,032 $91,528 $0 $91,528 $1,496 1.7%
671160 Sylvan Twp Osceola $94,957 $0 $0 $94,957 $96,534 $0 $96,534 $1,577 1.7%
672010 Evart City Osceola $164,424 $24,082 $1,537 $190,043 $167,157 $26,208 $193,365 $3,322 1.7%
672020 Reed City City Osceola $206,155 $51,982 $1,928 $260,065 $209,583 $55,150 $264,733 $4,668 1.8%
673010 Hersey Vil Osceola $30,242 $358 $283 $30,883 $30,743 $2,491 $33,234 $2,351 7.6%
September 30, 2019 FY 2019 Actuals and FY 2020 Projected - 2019 P.A. 56 - May Consensus Page 113 of 144
Prepared by the Revenue Sharing and Grants Division, Michigan Department of Treasury
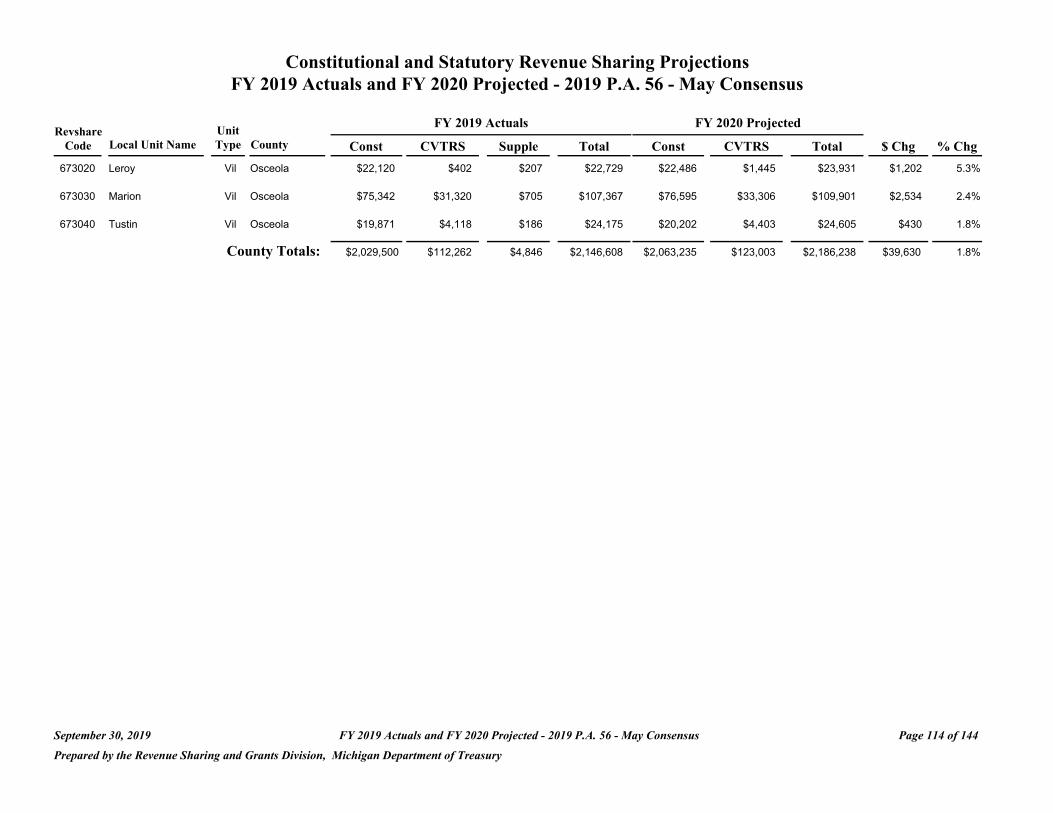
Constitutional and Statutory Revenue Sharing Projections FY 2019 Actuals and FY 2020 Projected - 2019 P.A. 56 - May Consensus
Revshare Code Local Unit Name
673020 Leroy
Unit Type County
Vil Osceola
Const $22,120
FY 2019 Actuals
CVTRS Supple
$402 $207
Total $22,729
FY 2020 Projected
Const CVTRS
$22,486 $1,445
Total $23,931
$ Chg
$1,202
% Chg
5.3%
673030 Marion Vil Osceola $75,342 $31,320 $705 $107,367 $76,595 $33,306 $109,901 $2,534 2.4%
673040 Tustin Vil Osceola $19,871 $4,118 $186 $24,175 $20,202 $4,403 $24,605 $430 1.8%
County Totals: $2,029,500 $112,262 $4,846 $2,146,608 $2,063,235 $123,003 $2,186,238 $39,630 1.8%
September 30, 2019 FY 2019 Actuals and FY 2020 Projected - 2019 P.A. 56 - May Consensus Page 114 of 144
Prepared by the Revenue Sharing and Grants Division, Michigan Department of Treasury
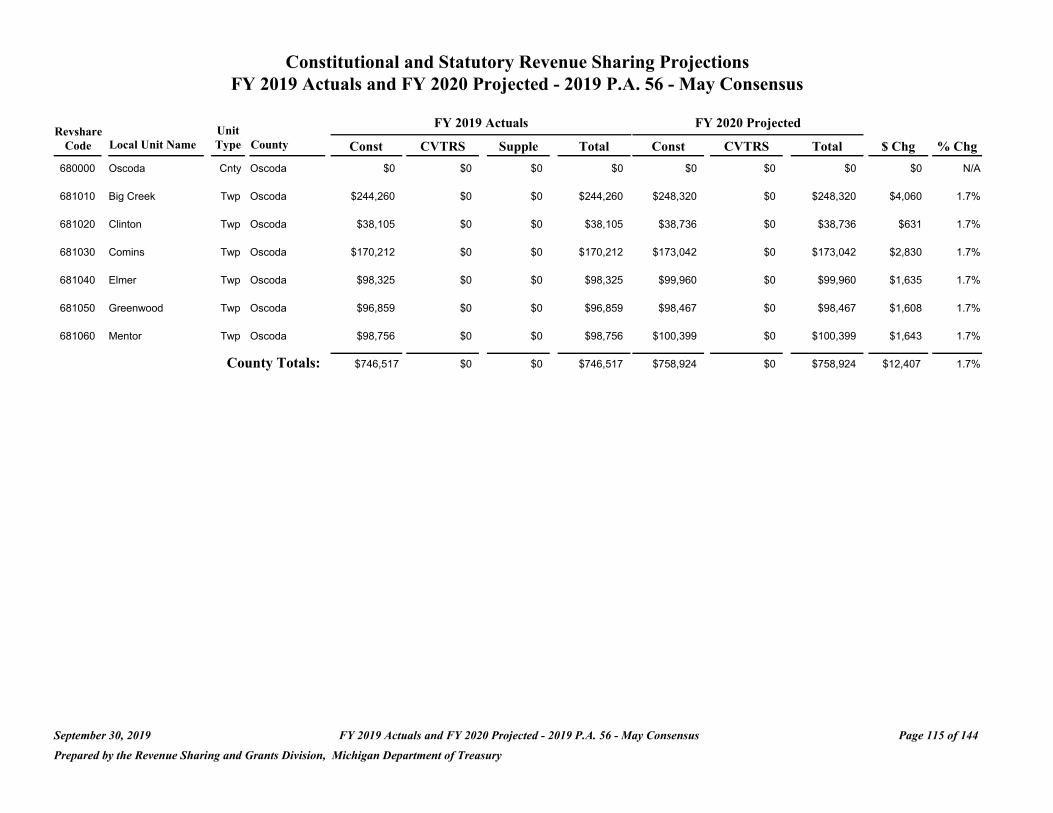
Constitutional and Statutory Revenue Sharing Projections FY 2019 Actuals and FY 2020 Projected - 2019 P.A. 56 - May Consensus
Revshare Code Local Unit Name
680000 Oscoda
Unit Type County
Cnty Oscoda
Const $0
FY 2019 Actuals
CVTRS Supple
$0 $0
Total $0
FY 2020 Projected
Const CVTRS
$0 $0
Total $0
$ Chg
$0
% Chg
N/A
681010 Big Creek Twp Oscoda $244,260 $0 $0 $244,260 $248,320 $0 $248,320 $4,060 1.7%
681020 Clinton Twp Oscoda $38,105 $0 $0 $38,105 $38,736 $0 $38,736 $631 1.7%
681030 Comins Twp Oscoda $170,212 $0 $0 $170,212 $173,042 $0 $173,042 $2,830 1.7%
681040 Elmer Twp Oscoda $98,325 $0 $0 $98,325 $99,960 $0 $99,960 $1,635 1.7%
681050 Greenwood Twp Oscoda $96,859 $0 $0 $96,859 $98,467 $0 $98,467 $1,608 1.7%
681060 Mentor Twp Oscoda
County Totals:
$98,756
$746,517
$0
$0
$0
$0
$98,756
$746,517
$100,399
$758,924
$0
$0
$100,399
$758,924
$1,643
$12,407
1.7%
1.7%
September 30, 2019 FY 2019 Actuals and FY 2020 Projected - 2019 P.A. 56 - May Consensus Page 115 of 144
Prepared by the Revenue Sharing and Grants Division, Michigan Department of Treasury
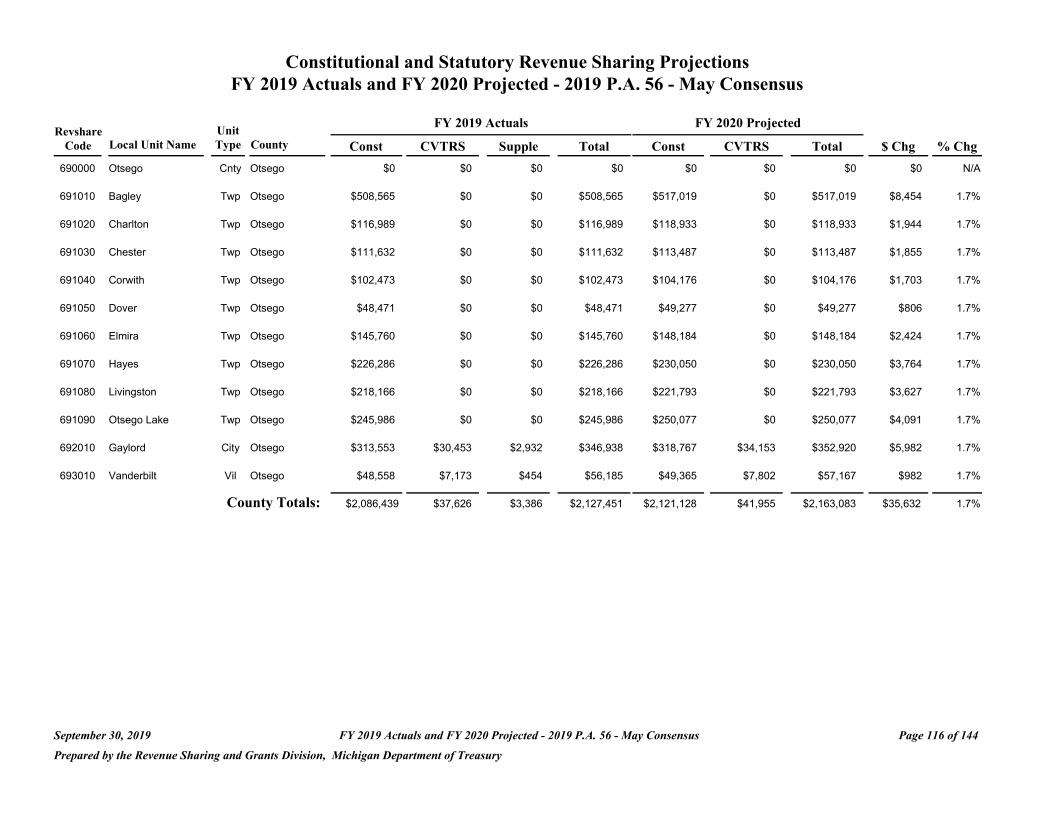
Constitutional and Statutory Revenue Sharing Projections FY 2019 Actuals and FY 2020 Projected - 2019 P.A. 56 - May Consensus
Revshare Unit FY 2019 Actuals FY 2020 Projected
Code Local Unit Name Type County Const CVTRS Supple Total Const CVTRS Total $ Chg % Chg
690000 Otsego Cnty Otsego $0 $0 $0 $0 $0 $0 $0 $0 N/A
691010 Bagley Twp Otsego $508,565 $0 $0 $508,565 $517,019 $0 $517,019 $8,454 1.7%
691020 Charlton Twp Otsego $116,989 $0 $0 $116,989 $118,933 $0 $118,933 $1,944 1.7%
691030 Chester Twp Otsego $111,632 $0 $0 $111,632 $113,487 $0 $113,487 $1,855 1.7%
691040 Corwith Twp Otsego $102,473 $0 $0 $102,473 $104,176 $0 $104,176 $1,703 1.7%
691050 Dover Twp Otsego $48,471 $0 $0 $48,471 $49,277 $0 $49,277 $806 1.7%
691060 Elmira Twp Otsego $145,760 $0 $0 $145,760 $148,184 $0 $148,184 $2,424 1.7%
691070 Hayes Twp Otsego $226,286 $0 $0 $226,286 $230,050 $0 $230,050 $3,764 1.7%
691080 Livingston Twp Otsego $218,166 $0 $0 $218,166 $221,793 $0 $221,793 $3,627 1.7%
691090 Otsego Lake Twp Otsego $245,986 $0 $0 $245,986 $250,077 $0 $250,077 $4,091 1.7%
692010 Gaylord City Otsego $313,553 $30,453 $2,932 $346,938 $318,767 $34,153 $352,920 $5,982 1.7%
693010 Vanderbilt Vil Otsego $48,558 $7,173 $454 $56,185 $49,365 $7,802 $57,167 $982 1.7%
County Totals: $2,086,439 $37,626 $3,386 $2,127,451 $2,121,128 $41,955 $2,163,083 $35,632 1.7%
September 30, 2019 FY 2019 Actuals and FY 2020 Projected - 2019 P.A. 56 - May Consensus Page 116 of 144
Prepared by the Revenue Sharing and Grants Division, Michigan Department of Treasury
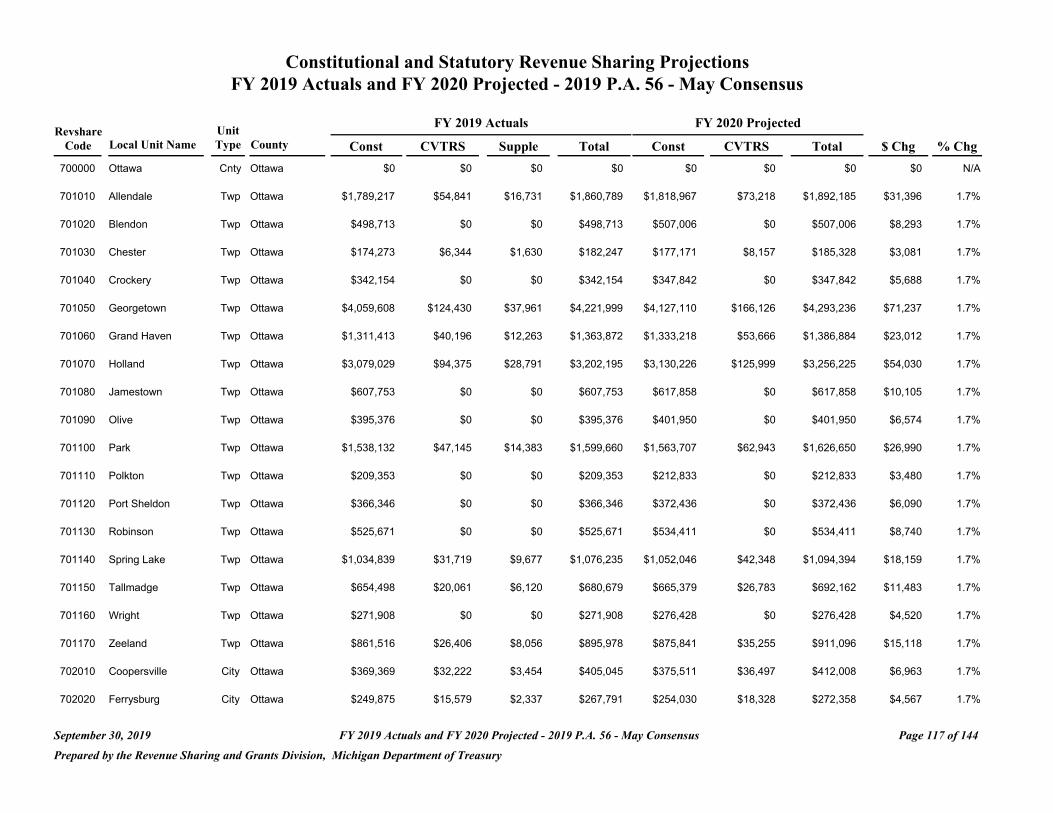
Constitutional and Statutory Revenue Sharing Projections FY 2019 Actuals and FY 2020 Projected - 2019 P.A. 56 - May Consensus
FY 2019 Actuals FY 2020 Projected Revshare Unit
Code Local Unit Name Type County Const CVTRS Supple Total Const CVTRS Total $ Chg % Chg
700000 Ottawa Cnty Ottawa $0 $0 $0 $0 $0 $0 $0 $0 N/A
701010 Allendale Twp Ottawa $1,789,217 $54,841 $16,731 $1,860,789 $1,818,967 $73,218 $1,892,185 $31,396 1.7%
701020 Blendon Twp Ottawa $498,713 $0 $0 $498,713 $507,006 $0 $507,006 $8,293 1.7%
701030 Chester Twp Ottawa $174,273 $6,344 $1,630 $182,247 $177,171 $8,157 $185,328 $3,081 1.7%
701040 Crockery Twp Ottawa $342,154 $0 $0 $342,154 $347,842 $0 $347,842 $5,688 1.7%
701050 Georgetown Twp Ottawa $4,059,608 $124,430 $37,961 $4,221,999 $4,127,110 $166,126 $4,293,236 $71,237 1.7%
701060 Grand Haven Twp Ottawa $1,311,413 $40,196 $12,263 $1,363,872 $1,333,218 $53,666 $1,386,884 $23,012 1.7%
701070 Holland Twp Ottawa $3,079,029 $94,375 $28,791 $3,202,195 $3,130,226 $125,999 $3,256,225 $54,030 1.7%
701080 Jamestown Twp Ottawa $607,753 $0 $0 $607,753 $617,858 $0 $617,858 $10,105 1.7%
701090 Olive Twp Ottawa $395,376 $0 $0 $395,376 $401,950 $0 $401,950 $6,574 1.7%
701100 Park Twp Ottawa $1,538,132 $47,145 $14,383 $1,599,660 $1,563,707 $62,943 $1,626,650 $26,990 1.7%
701110 Polkton Twp Ottawa $209,353 $0 $0 $209,353 $212,833 $0 $212,833 $3,480 1.7%
701120 Port Sheldon Twp Ottawa $366,346 $0 $0 $366,346 $372,436 $0 $372,436 $6,090 1.7%
701130 Robinson Twp Ottawa $525,671 $0 $0 $525,671 $534,411 $0 $534,411 $8,740 1.7%
701140 Spring Lake Twp Ottawa $1,034,839 $31,719 $9,677 $1,076,235 $1,052,046 $42,348 $1,094,394 $18,159 1.7%
701150 Tallmadge Twp Ottawa $654,498 $20,061 $6,120 $680,679 $665,379 $26,783 $692,162 $11,483 1.7%
701160 Wright Twp Ottawa $271,908 $0 $0 $271,908 $276,428 $0 $276,428 $4,520 1.7%
701170 Zeeland Twp Ottawa $861,516 $26,406 $8,056 $895,978 $875,841 $35,255 $911,096 $15,118 1.7%
702010 Coopersville City Ottawa $369,369 $32,222 $3,454 $405,045 $375,511 $36,497 $412,008 $6,963 1.7%
702020 Ferrysburg City Ottawa $249,875 $15,579 $2,337 $267,791 $254,030 $18,328 $272,358 $4,567 1.7%
September 30, 2019 FY 2019 Actuals and FY 2020 Projected - 2019 P.A. 56 - May Consensus Page 117 of 144
Prepared by the Revenue Sharing and Grants Division, Michigan Department of Treasury

Constitutional and Statutory Revenue Sharing Projections FY 2019 Actuals and FY 2020 Projected - 2019 P.A. 56 - May Consensus
Revshare Unit FY 2019 Actuals FY 2020 Projected
Code Local Unit Name Type County Const CVTRS Supple Total Const CVTRS Total $ Chg % Chg
702030 Grand Haven City Ottawa $899,621 $133,783 $8,412 $1,041,816 $914,578 $145,465 $1,060,043 $18,227 1.7%
702040 Holland City Ottawa $2,249,481 $354,167 $26,703 $2,630,351 $2,286,885 $389,630 $2,676,515 $46,164 1.8%
702050 Hudsonville City Ottawa $614,837 $32,037 $5,749 $652,623 $625,061 $38,655 $663,716 $11,093 1.7%
702060 Zeeland City Ottawa $475,558 $76,157 $4,447 $556,162 $483,465 $82,458 $565,923 $9,761 1.8%
703010 Spring Lake Vil Ottawa $200,713 $8,967 $1,877 $211,557 $204,049 $11,093 $215,142 $3,585 1.7%
County Totals: $22,779,253 $1,098,429 $188,591 $24,066,273 $23,158,008 $1,316,621 $24,474,629 $408,356 1.7%
September 30, 2019 FY 2019 Actuals and FY 2020 Projected - 2019 P.A. 56 - May Consensus Page 118 of 144
Prepared by the Revenue Sharing and Grants Division, Michigan Department of Treasury
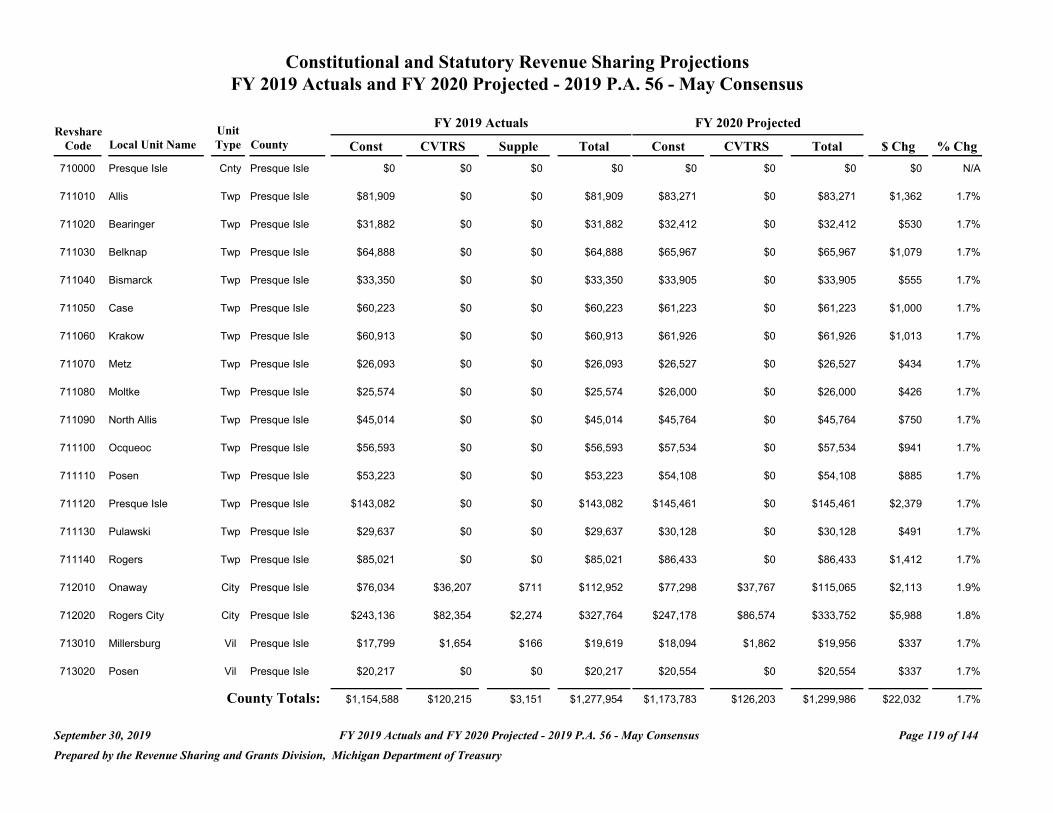
Constitutional and Statutory Revenue Sharing Projections FY 2019 Actuals and FY 2020 Projected - 2019 P.A. 56 - May Consensus
FY 2019 Actuals FY 2020 Projected Revshare Unit
Code Local Unit Name Type County Const CVTRS Supple Total Const CVTRS Total $ Chg % Chg
710000 Presque Isle Cnty Presque Isle $0 $0 $0 $0 $0 $0 $0 $0 N/A
711010 Allis Twp Presque Isle $81,909 $0 $0 $81,909 $83,271 $0 $83,271 $1,362 1.7%
711020 Bearinger Twp Presque Isle $31,882 $0 $0 $31,882 $32,412 $0 $32,412 $530 1.7%
711030 Belknap Twp Presque Isle $64,888 $0 $0 $64,888 $65,967 $0 $65,967 $1,079 1.7%
711040 Bismarck Twp Presque Isle $33,350 $0 $0 $33,350 $33,905 $0 $33,905 $555 1.7%
711050 Case Twp Presque Isle $60,223 $0 $0 $60,223 $61,223 $0 $61,223 $1,000 1.7%
711060 Krakow Twp Presque Isle $60,913 $0 $0 $60,913 $61,926 $0 $61,926 $1,013 1.7%
711070 Metz Twp Presque Isle $26,093 $0 $0 $26,093 $26,527 $0 $26,527 $434 1.7%
711080 Moltke Twp Presque Isle $25,574 $0 $0 $25,574 $26,000 $0 $26,000 $426 1.7%
711090 North Allis Twp Presque Isle $45,014 $0 $0 $45,014 $45,764 $0 $45,764 $750 1.7%
711100 Ocqueoc Twp Presque Isle $56,593 $0 $0 $56,593 $57,534 $0 $57,534 $941 1.7%
711110 Posen Twp Presque Isle $53,223 $0 $0 $53,223 $54,108 $0 $54,108 $885 1.7%
711120 Presque Isle Twp Presque Isle $143,082 $0 $0 $143,082 $145,461 $0 $145,461 $2,379 1.7%
711130 Pulawski Twp Presque Isle $29,637 $0 $0 $29,637 $30,128 $0 $30,128 $491 1.7%
711140 Rogers Twp Presque Isle $85,021 $0 $0 $85,021 $86,433 $0 $86,433 $1,412 1.7%
712010 Onaway City Presque Isle $76,034 $36,207 $711 $112,952 $77,298 $37,767 $115,065 $2,113 1.9%
712020 Rogers City City Presque Isle $243,136 $82,354 $2,274 $327,764 $247,178 $86,574 $333,752 $5,988 1.8%
713010 Millersburg Vil Presque Isle $17,799 $1,654 $166 $19,619 $18,094 $1,862 $19,956 $337 1.7%
713020 Posen Vil Presque Isle $20,217 $0 $0 $20,217 $20,554 $0 $20,554 $337 1.7%
County Totals: $1,154,588 $120,215 $3,151 $1,277,954 $1,173,783 $126,203 $1,299,986 $22,032 1.7%
September 30, 2019 FY 2019 Actuals and FY 2020 Projected - 2019 P.A. 56 - May Consensus Page 119 of 144
Prepared by the Revenue Sharing and Grants Division, Michigan Department of Treasury
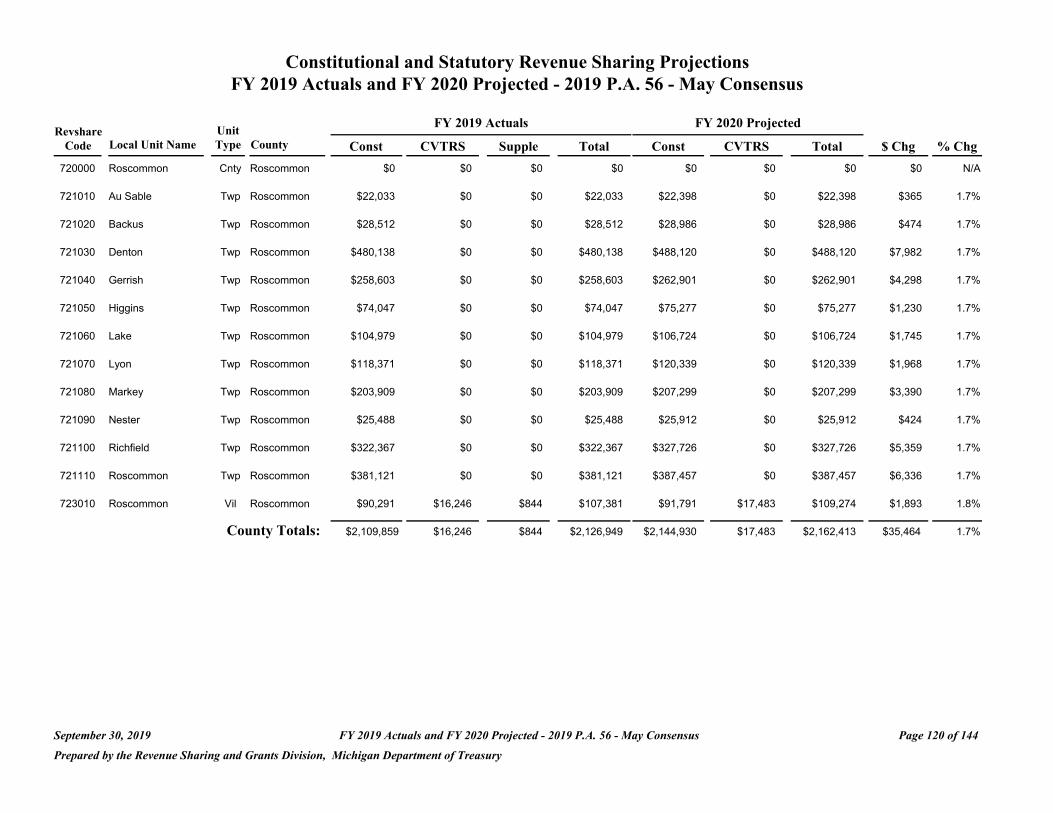
Constitutional and Statutory Revenue Sharing Projections FY 2019 Actuals and FY 2020 Projected - 2019 P.A. 56 - May Consensus
Revshare Unit FY 2019 Actuals FY 2020 Projected
Code Local Unit Name Type County Const CVTRS Supple Total Const CVTRS Total $ Chg % Chg
720000 Roscommon Cnty Roscommon $0 $0 $0 $0 $0 $0 $0 $0 N/A
721010 Au Sable Twp Roscommon $22,033 $0 $0 $22,033 $22,398 $0 $22,398 $365 1.7%
721020 Backus Twp Roscommon $28,512 $0 $0 $28,512 $28,986 $0 $28,986 $474 1.7%
721030 Denton Twp Roscommon $480,138 $0 $0 $480,138 $488,120 $0 $488,120 $7,982 1.7%
721040 Gerrish Twp Roscommon $258,603 $0 $0 $258,603 $262,901 $0 $262,901 $4,298 1.7%
721050 Higgins Twp Roscommon $74,047 $0 $0 $74,047 $75,277 $0 $75,277 $1,230 1.7%
721060 Lake Twp Roscommon $104,979 $0 $0 $104,979 $106,724 $0 $106,724 $1,745 1.7%
721070 Lyon Twp Roscommon $118,371 $0 $0 $118,371 $120,339 $0 $120,339 $1,968 1.7%
721080 Markey Twp Roscommon $203,909 $0 $0 $203,909 $207,299 $0 $207,299 $3,390 1.7%
721090 Nester Twp Roscommon $25,488 $0 $0 $25,488 $25,912 $0 $25,912 $424 1.7%
721100 Richfield Twp Roscommon $322,367 $0 $0 $322,367 $327,726 $0 $327,726 $5,359 1.7%
721110 Roscommon Twp Roscommon $381,121 $0 $0 $381,121 $387,457 $0 $387,457 $6,336 1.7%
723010 Roscommon Vil Roscommon $90,291 $16,246 $844 $107,381 $91,791 $17,483 $109,274 $1,893 1.8%
County Totals: $2,109,859 $16,246 $844 $2,126,949 $2,144,930 $17,483 $2,162,413 $35,464 1.7%
September 30, 2019 FY 2019 Actuals and FY 2020 Projected - 2019 P.A. 56 - May Consensus Page 120 of 144
Prepared by the Revenue Sharing and Grants Division, Michigan Department of Treasury
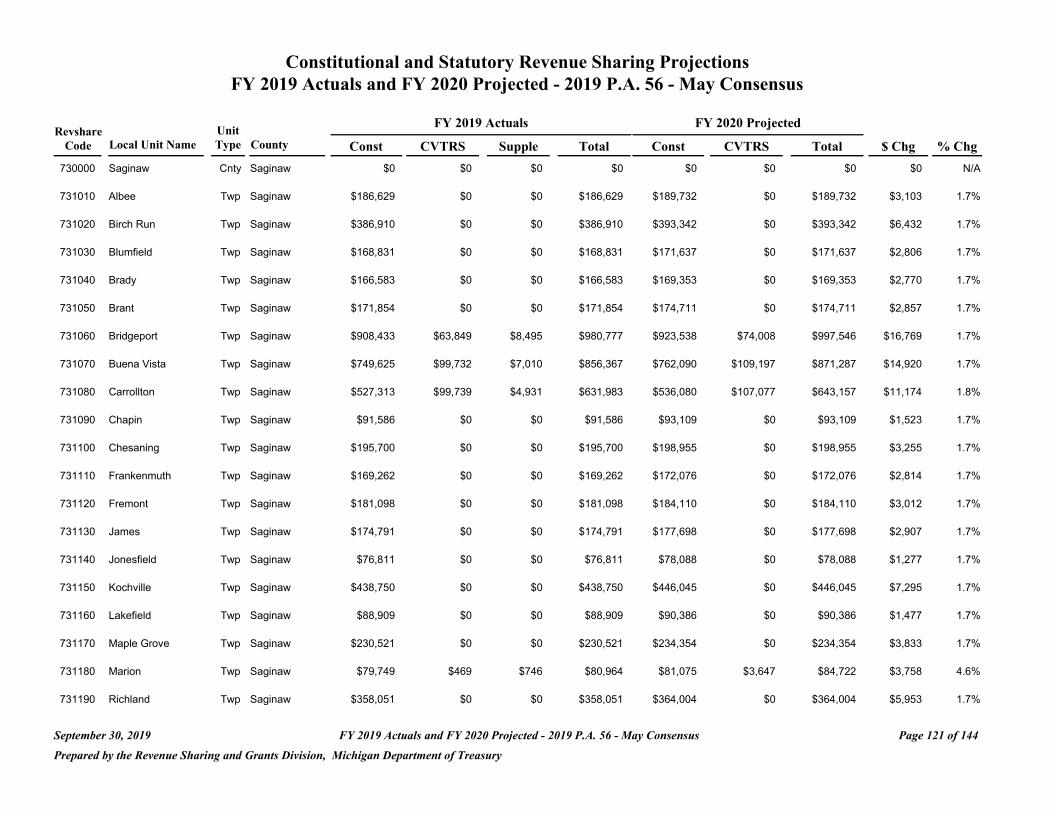
Constitutional and Statutory Revenue Sharing Projections FY 2019 Actuals and FY 2020 Projected - 2019 P.A. 56 - May Consensus
FY 2019 Actuals FY 2020 Projected Revshare Unit
Code Local Unit Name Type County Const CVTRS Supple Total Const CVTRS Total $ Chg % Chg
730000 Saginaw Cnty Saginaw $0 $0 $0 $0 $0 $0 $0 $0 N/A
731010 Albee Twp Saginaw $186,629 $0 $0 $186,629 $189,732 $0 $189,732 $3,103 1.7%
731020 Birch Run Twp Saginaw $386,910 $0 $0 $386,910 $393,342 $0 $393,342 $6,432 1.7%
731030 Blumfield Twp Saginaw $168,831 $0 $0 $168,831 $171,637 $0 $171,637 $2,806 1.7%
731040 Brady Twp Saginaw $166,583 $0 $0 $166,583 $169,353 $0 $169,353 $2,770 1.7%
731050 Brant Twp Saginaw $171,854 $0 $0 $171,854 $174,711 $0 $174,711 $2,857 1.7%
731060 Bridgeport Twp Saginaw $908,433 $63,849 $8,495 $980,777 $923,538 $74,008 $997,546 $16,769 1.7%
731070 Buena Vista Twp Saginaw $749,625 $99,732 $7,010 $856,367 $762,090 $109,197 $871,287 $14,920 1.7%
731080 Carrollton Twp Saginaw $527,313 $99,739 $4,931 $631,983 $536,080 $107,077 $643,157 $11,174 1.8%
731090 Chapin Twp Saginaw $91,586 $0 $0 $91,586 $93,109 $0 $93,109 $1,523 1.7%
731100 Chesaning Twp Saginaw $195,700 $0 $0 $195,700 $198,955 $0 $198,955 $3,255 1.7%
731110 Frankenmuth Twp Saginaw $169,262 $0 $0 $169,262 $172,076 $0 $172,076 $2,814 1.7%
731120 Fremont Twp Saginaw $181,098 $0 $0 $181,098 $184,110 $0 $184,110 $3,012 1.7%
731130 James Twp Saginaw $174,791 $0 $0 $174,791 $177,698 $0 $177,698 $2,907 1.7%
731140 Jonesfield Twp Saginaw $76,811 $0 $0 $76,811 $78,088 $0 $78,088 $1,277 1.7%
731150 Kochville Twp Saginaw $438,750 $0 $0 $438,750 $446,045 $0 $446,045 $7,295 1.7%
731160 Lakefield Twp Saginaw $88,909 $0 $0 $88,909 $90,386 $0 $90,386 $1,477 1.7%
731170 Maple Grove Twp Saginaw $230,521 $0 $0 $230,521 $234,354 $0 $234,354 $3,833 1.7%
731180 Marion Twp Saginaw $79,749 $469 $746 $80,964 $81,075 $3,647 $84,722 $3,758 4.6%
731190 Richland Twp Saginaw $358,051 $0 $0 $358,051 $364,004 $0 $364,004 $5,953 1.7%
September 30, 2019 FY 2019 Actuals and FY 2020 Projected - 2019 P.A. 56 - May Consensus Page 121 of 144
Prepared by the Revenue Sharing and Grants Division, Michigan Department of Treasury
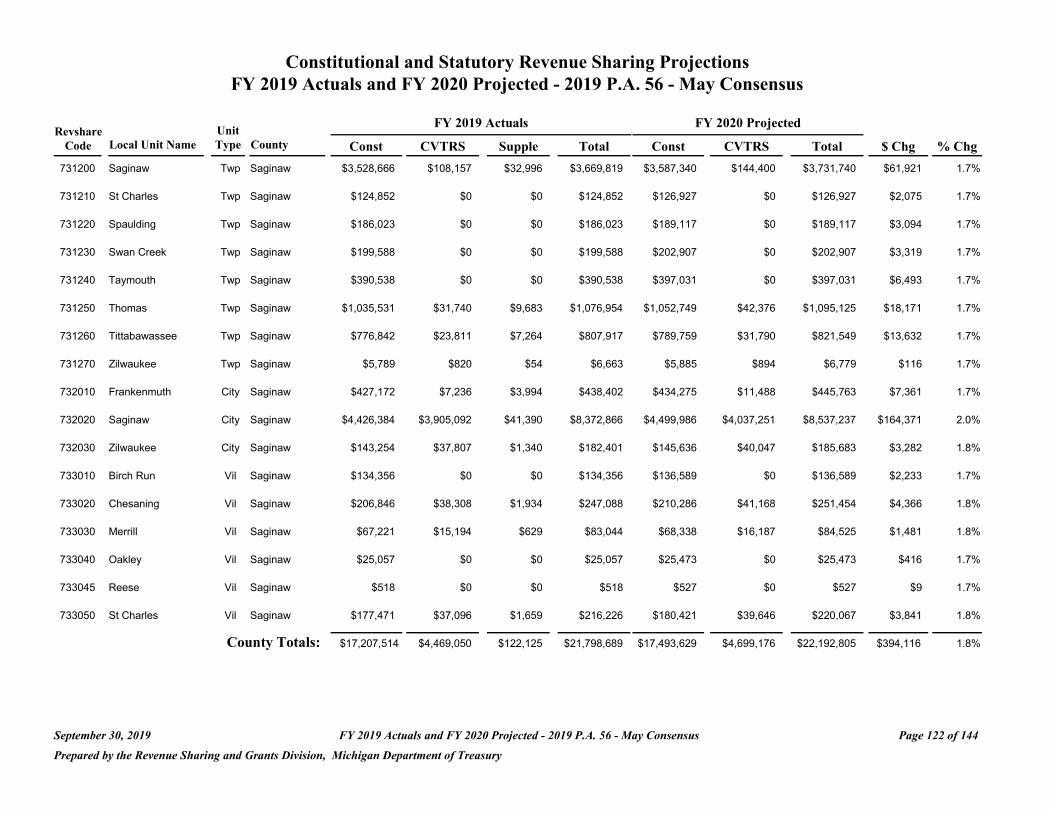
Constitutional and Statutory Revenue Sharing Projections FY 2019 Actuals and FY 2020 Projected - 2019 P.A. 56 - May Consensus
Revshare Unit FY 2019 Actuals FY 2020 Projected
Code Local Unit Name Type County Const CVTRS Supple Total Const CVTRS Total $ Chg % Chg
731200 Saginaw Twp Saginaw $3,528,666 $108,157 $32,996 $3,669,819 $3,587,340 $144,400 $3,731,740 $61,921 1.7%
731210 St Charles Twp Saginaw $124,852 $0 $0 $124,852 $126,927 $0 $126,927 $2,075 1.7%
731220 Spaulding Twp Saginaw $186,023 $0 $0 $186,023 $189,117 $0 $189,117 $3,094 1.7%
731230 Swan Creek Twp Saginaw $199,588 $0 $0 $199,588 $202,907 $0 $202,907 $3,319 1.7%
731240 Taymouth Twp Saginaw $390,538 $0 $0 $390,538 $397,031 $0 $397,031 $6,493 1.7%
731250 Thomas Twp Saginaw $1,035,531 $31,740 $9,683 $1,076,954 $1,052,749 $42,376 $1,095,125 $18,171 1.7%
731260 Tittabawassee Twp Saginaw $776,842 $23,811 $7,264 $807,917 $789,759 $31,790 $821,549 $13,632 1.7%
731270 Zilwaukee Twp Saginaw $5,789 $820 $54 $6,663 $5,885 $894 $6,779 $116 1.7%
732010 Frankenmuth City Saginaw $427,172 $7,236 $3,994 $438,402 $434,275 $11,488 $445,763 $7,361 1.7%
732020 Saginaw City Saginaw $4,426,384 $3,905,092 $41,390 $8,372,866 $4,499,986 $4,037,251 $8,537,237 $164,371 2.0%
732030 Zilwaukee City Saginaw $143,254 $37,807 $1,340 $182,401 $145,636 $40,047 $185,683 $3,282 1.8%
733010 Birch Run Vil Saginaw $134,356 $0 $0 $134,356 $136,589 $0 $136,589 $2,233 1.7%
733020 Chesaning Vil Saginaw $206,846 $38,308 $1,934 $247,088 $210,286 $41,168 $251,454 $4,366 1.8%
733030 Merrill Vil Saginaw $67,221 $15,194 $629 $83,044 $68,338 $16,187 $84,525 $1,481 1.8%
733040 Oakley Vil Saginaw $25,057 $0 $0 $25,057 $25,473 $0 $25,473 $416 1.7%
733045 Reese Vil Saginaw $518 $0 $0 $518 $527 $0 $527 $9 1.7%
733050 St Charles Vil Saginaw $177,471 $37,096 $1,659 $216,226 $180,421 $39,646 $220,067 $3,841 1.8%
County Totals: $17,207,514 $4,469,050 $122,125 $21,798,689 $17,493,629 $4,699,176 $22,192,805 $394,116 1.8%
September 30, 2019 FY 2019 Actuals and FY 2020 Projected - 2019 P.A. 56 - May Consensus Page 122 of 144
Prepared by the Revenue Sharing and Grants Division, Michigan Department of Treasury

Constitutional and Statutory Revenue Sharing Projections FY 2019 Actuals and FY 2020 Projected - 2019 P.A. 56 - May Consensus
FY 2019 Actuals FY 2020 Projected Revshare Unit
Code Local Unit Name Type County Const CVTRS Supple Total Const CVTRS Total $ Chg % Chg
740000 St Clair Cnty Saint Clair $0 $0 $0 $0 $0 $0 $0 $0 N/A
741010 Berlin Twp Saint Clair $283,831 $0 $0 $283,831 $288,550 $0 $288,550 $4,719 1.7%
741020 Brockway Twp Saint Clair $174,706 $0 $0 $174,706 $177,610 $0 $177,610 $2,904 1.7%
741030 Burtchville Twp Saint Clair $346,300 $0 $0 $346,300 $352,058 $0 $352,058 $5,758 1.7%
741040 Casco Twp Saint Clair $354,680 $0 $0 $354,680 $360,578 $0 $360,578 $5,898 1.7%
741050 China Twp Saint Clair $306,814 $0 $0 $306,814 $311,915 $0 $311,915 $5,101 1.7%
741060 Clay Twp Saint Clair $783,323 $24,009 $7,325 $814,657 $796,347 $32,055 $828,402 $13,745 1.7%
741070 Clyde Twp Saint Clair $482,038 $0 $0 $482,038 $490,053 $0 $490,053 $8,015 1.7%
741080 Columbus Twp Saint Clair $351,657 $0 $0 $351,657 $357,504 $0 $357,504 $5,847 1.7%
741090 Cottrellville Twp Saint Clair $307,505 $0 $0 $307,505 $312,618 $0 $312,618 $5,113 1.7%
741100 East China Twp Saint Clair $327,292 $0 $0 $327,292 $332,733 $0 $332,733 $5,441 1.7%
741110 Emmett Twp Saint Clair $206,069 $0 $0 $206,069 $209,495 $0 $209,495 $3,426 1.7%
741120 Fort Gratiot Twp Saint Clair $959,756 $29,417 $8,974 $998,147 $975,714 $39,274 $1,014,988 $16,841 1.7%
741130 Grant Twp Saint Clair $163,386 $0 $0 $163,386 $166,103 $0 $166,103 $2,717 1.7%
741140 Greenwood Twp Saint Clair $132,887 $0 $0 $132,887 $135,096 $0 $135,096 $2,209 1.7%
741150 Ira Twp Saint Clair $447,391 $0 $0 $447,391 $454,829 $0 $454,829 $7,438 1.7%
741160 Kenockee Twp Saint Clair $213,413 $0 $0 $213,413 $216,962 $0 $216,962 $3,549 1.7%
741170 Kimball Twp Saint Clair $808,552 $24,369 $7,561 $840,482 $821,996 $33,088 $855,084 $14,602 1.7%
741180 Lynn Twp Saint Clair $106,188 $0 $0 $106,188 $107,954 $0 $107,954 $1,766 1.7%
741190 Mussey Twp Saint Clair $200,108 $0 $0 $200,108 $203,434 $0 $203,434 $3,326 1.7%
September 30, 2019 FY 2019 Actuals and FY 2020 Projected - 2019 P.A. 56 - May Consensus Page 123 of 144
Prepared by the Revenue Sharing and Grants Division, Michigan Department of Treasury
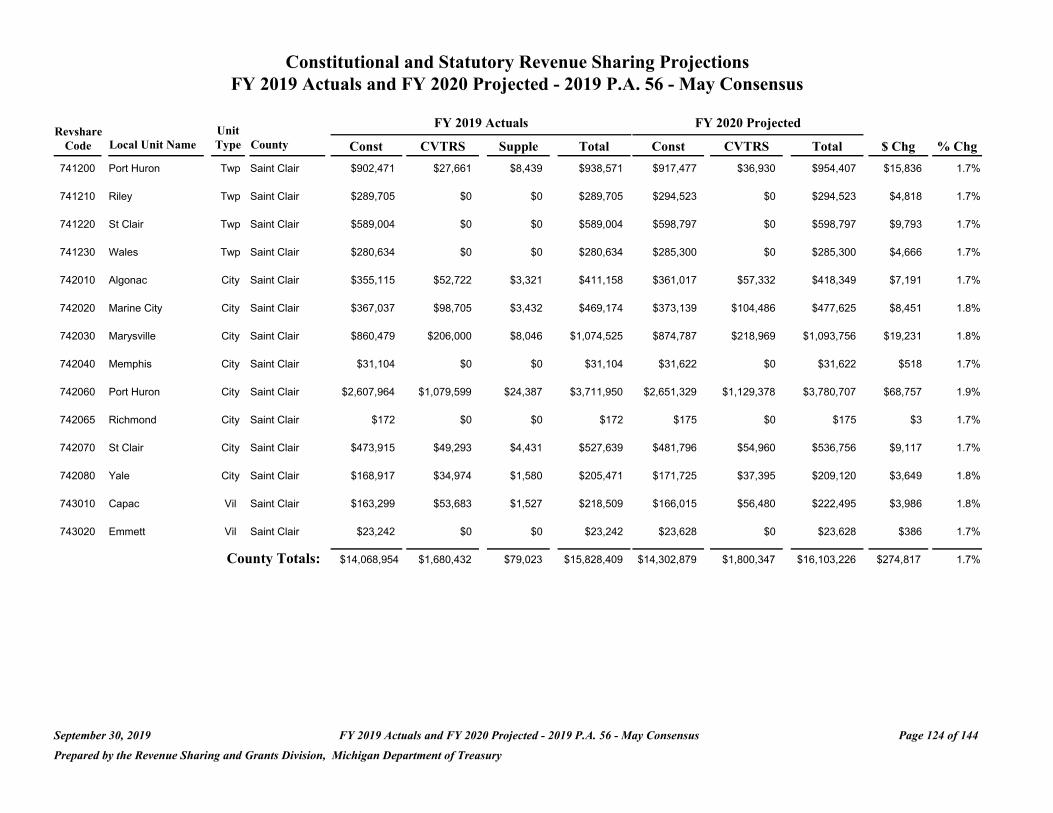
Constitutional and Statutory Revenue Sharing Projections FY 2019 Actuals and FY 2020 Projected - 2019 P.A. 56 - May Consensus
Revshare Unit FY 2019 Actuals FY 2020 Projected
Code Local Unit Name Type County Const CVTRS Supple Total Const CVTRS Total $ Chg % Chg
741200 Port Huron Twp Saint Clair $902,471 $27,661 $8,439 $938,571 $917,477 $36,930 $954,407 $15,836 1.7%
741210 Riley Twp Saint Clair $289,705 $0 $0 $289,705 $294,523 $0 $294,523 $4,818 1.7%
741220 St Clair Twp Saint Clair $589,004 $0 $0 $589,004 $598,797 $0 $598,797 $9,793 1.7%
741230 Wales Twp Saint Clair $280,634 $0 $0 $280,634 $285,300 $0 $285,300 $4,666 1.7%
742010 Algonac City Saint Clair $355,115 $52,722 $3,321 $411,158 $361,017 $57,332 $418,349 $7,191 1.7%
742020 Marine City City Saint Clair $367,037 $98,705 $3,432 $469,174 $373,139 $104,486 $477,625 $8,451 1.8%
742030 Marysville City Saint Clair $860,479 $206,000 $8,046 $1,074,525 $874,787 $218,969 $1,093,756 $19,231 1.8%
742040 Memphis City Saint Clair $31,104 $0 $0 $31,104 $31,622 $0 $31,622 $518 1.7%
742060 Port Huron City Saint Clair $2,607,964 $1,079,599 $24,387 $3,711,950 $2,651,329 $1,129,378 $3,780,707 $68,757 1.9%
742065 Richmond City Saint Clair $172 $0 $0 $172 $175 $0 $175 $3 1.7%
742070 St Clair City Saint Clair $473,915 $49,293 $4,431 $527,639 $481,796 $54,960 $536,756 $9,117 1.7%
742080 Yale City Saint Clair $168,917 $34,974 $1,580 $205,471 $171,725 $37,395 $209,120 $3,649 1.8%
743010 Capac Vil Saint Clair $163,299 $53,683 $1,527 $218,509 $166,015 $56,480 $222,495 $3,986 1.8%
743020 Emmett Vil Saint Clair $23,242 $0 $0 $23,242 $23,628 $0 $23,628 $386 1.7%
County Totals: $14,068,954 $1,680,432 $79,023 $15,828,409 $14,302,879 $1,800,347 $16,103,226 $274,817 1.7%
September 30, 2019 FY 2019 Actuals and FY 2020 Projected - 2019 P.A. 56 - May Consensus Page 124 of 144
Prepared by the Revenue Sharing and Grants Division, Michigan Department of Treasury
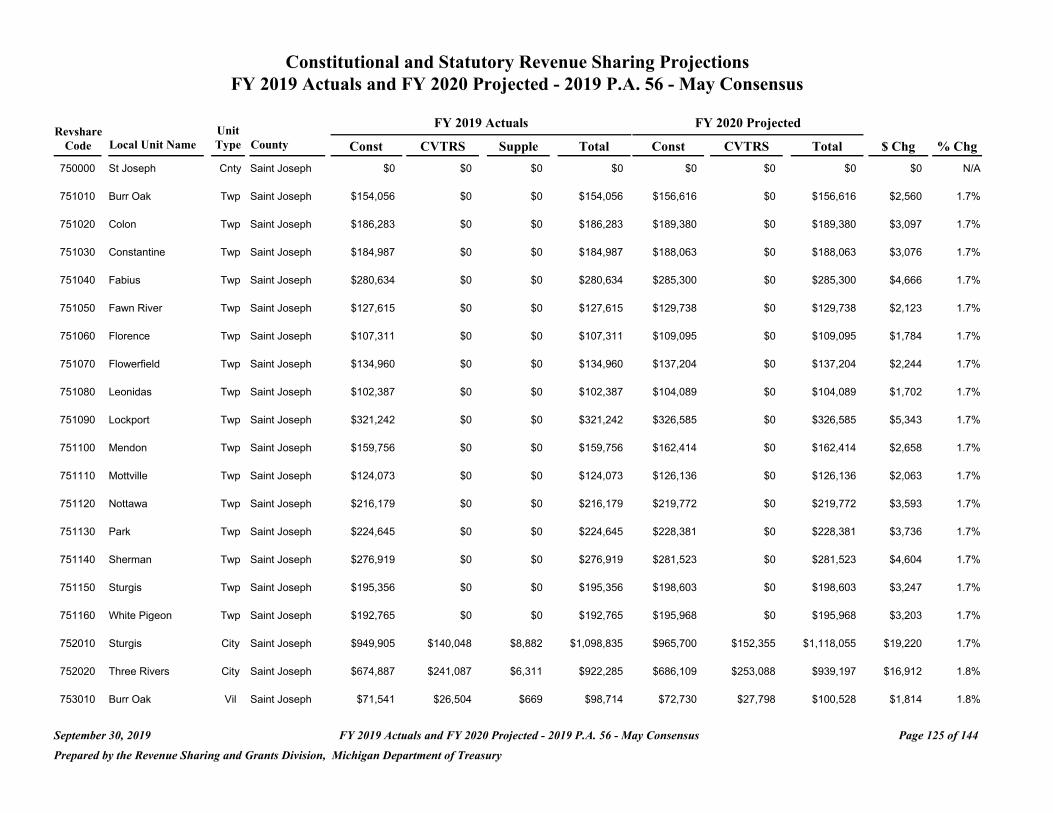
Constitutional and Statutory Revenue Sharing Projections FY 2019 Actuals and FY 2020 Projected - 2019 P.A. 56 - May Consensus
FY 2019 Actuals FY 2020 Projected Revshare Unit
Code Local Unit Name Type County Const CVTRS Supple Total Const CVTRS Total $ Chg % Chg
750000 St Joseph Cnty Saint Joseph $0 $0 $0 $0 $0 $0 $0 $0 N/A
751010 Burr Oak Twp Saint Joseph $154,056 $0 $0 $154,056 $156,616 $0 $156,616 $2,560 1.7%
751020 Colon Twp Saint Joseph $186,283 $0 $0 $186,283 $189,380 $0 $189,380 $3,097 1.7%
751030 Constantine Twp Saint Joseph $184,987 $0 $0 $184,987 $188,063 $0 $188,063 $3,076 1.7%
751040 Fabius Twp Saint Joseph $280,634 $0 $0 $280,634 $285,300 $0 $285,300 $4,666 1.7%
751050 Fawn River Twp Saint Joseph $127,615 $0 $0 $127,615 $129,738 $0 $129,738 $2,123 1.7%
751060 Florence Twp Saint Joseph $107,311 $0 $0 $107,311 $109,095 $0 $109,095 $1,784 1.7%
751070 Flowerfield Twp Saint Joseph $134,960 $0 $0 $134,960 $137,204 $0 $137,204 $2,244 1.7%
751080 Leonidas Twp Saint Joseph $102,387 $0 $0 $102,387 $104,089 $0 $104,089 $1,702 1.7%
751090 Lockport Twp Saint Joseph $321,242 $0 $0 $321,242 $326,585 $0 $326,585 $5,343 1.7%
751100 Mendon Twp Saint Joseph $159,756 $0 $0 $159,756 $162,414 $0 $162,414 $2,658 1.7%
751110 Mottville Twp Saint Joseph $124,073 $0 $0 $124,073 $126,136 $0 $126,136 $2,063 1.7%
751120 Nottawa Twp Saint Joseph $216,179 $0 $0 $216,179 $219,772 $0 $219,772 $3,593 1.7%
751130 Park Twp Saint Joseph $224,645 $0 $0 $224,645 $228,381 $0 $228,381 $3,736 1.7%
751140 Sherman Twp Saint Joseph $276,919 $0 $0 $276,919 $281,523 $0 $281,523 $4,604 1.7%
751150 Sturgis Twp Saint Joseph $195,356 $0 $0 $195,356 $198,603 $0 $198,603 $3,247 1.7%
751160 White Pigeon Twp Saint Joseph $192,765 $0 $0 $192,765 $195,968 $0 $195,968 $3,203 1.7%
752010 Sturgis City Saint Joseph $949,905 $140,048 $8,882 $1,098,835 $965,700 $152,355 $1,118,055 $19,220 1.7%
752020 Three Rivers City Saint Joseph $674,887 $241,087 $6,311 $922,285 $686,109 $253,088 $939,197 $16,912 1.8%
753010 Burr Oak Vil Saint Joseph $71,541 $26,504 $669 $98,714 $72,730 $27,798 $100,528 $1,814 1.8%
September 30, 2019 FY 2019 Actuals and FY 2020 Projected - 2019 P.A. 56 - May Consensus Page 125 of 144
Prepared by the Revenue Sharing and Grants Division, Michigan Department of Treasury
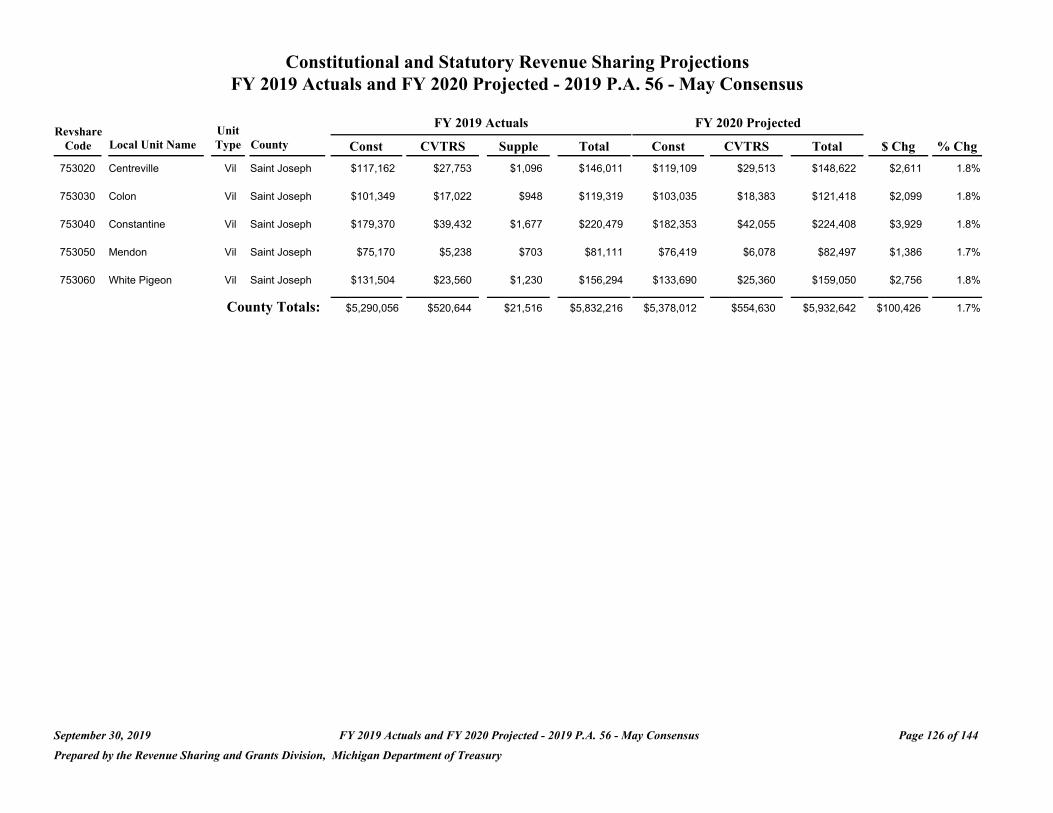
Constitutional and Statutory Revenue Sharing Projections FY 2019 Actuals and FY 2020 Projected - 2019 P.A. 56 - May Consensus
Revshare Unit FY 2019 Actuals FY 2020 Projected
Code Local Unit Name Type County Const CVTRS Supple Total Const CVTRS Total $ Chg % Chg
753020 Centreville Vil Saint Joseph $117,162 $27,753 $1,096 $146,011 $119,109 $29,513 $148,622 $2,611 1.8%
753030 Colon Vil Saint Joseph $101,349 $17,022 $948 $119,319 $103,035 $18,383 $121,418 $2,099 1.8%
753040 Constantine Vil Saint Joseph $179,370 $39,432 $1,677 $220,479 $182,353 $42,055 $224,408 $3,929 1.8%
753050 Mendon Vil Saint Joseph $75,170 $5,238 $703 $81,111 $76,419 $6,078 $82,497 $1,386 1.7%
753060 White Pigeon Vil Saint Joseph $131,504 $23,560 $1,230 $156,294 $133,690 $25,360 $159,050 $2,756 1.8%
County Totals: $5,290,056 $520,644 $21,516 $5,832,216 $5,378,012 $554,630 $5,932,642 $100,426 1.7%
September 30, 2019 FY 2019 Actuals and FY 2020 Projected - 2019 P.A. 56 - May Consensus Page 126 of 144
Prepared by the Revenue Sharing and Grants Division, Michigan Department of Treasury
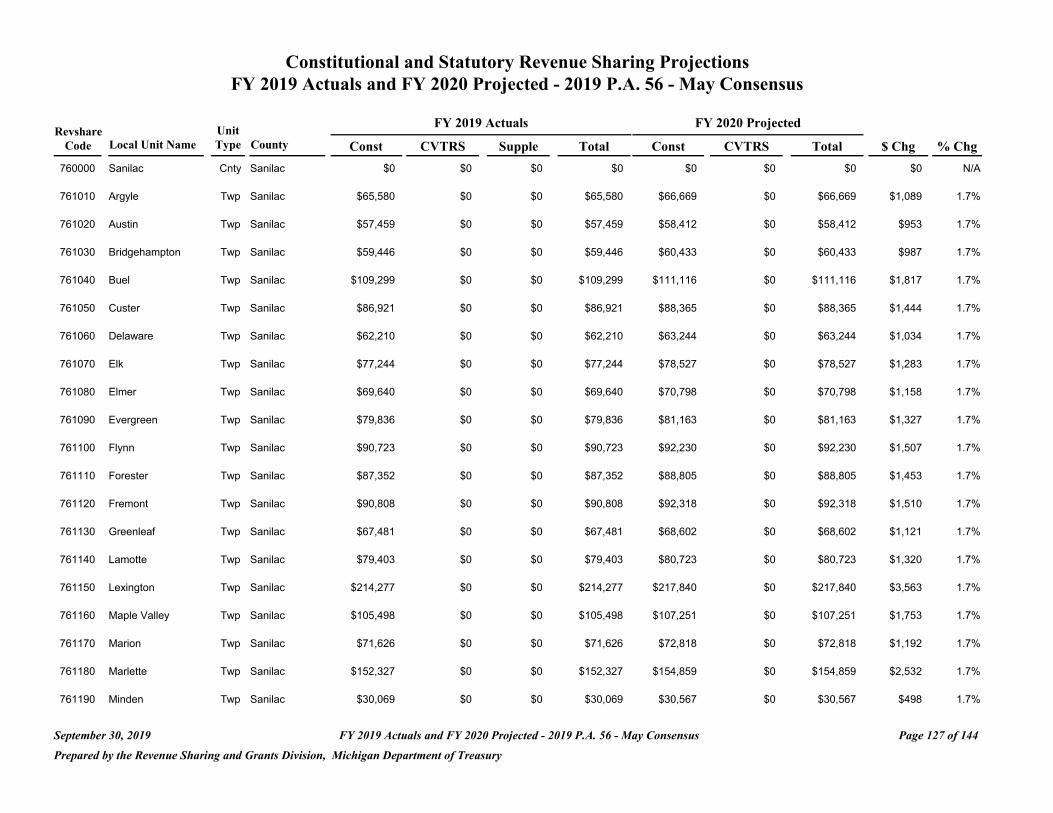
Constitutional and Statutory Revenue Sharing Projections FY 2019 Actuals and FY 2020 Projected - 2019 P.A. 56 - May Consensus
FY 2019 Actuals FY 2020 Projected Revshare Unit
Code Local Unit Name Type County Const CVTRS Supple Total Const CVTRS Total $ Chg % Chg
760000 Sanilac Cnty Sanilac $0 $0 $0 $0 $0 $0 $0 $0 N/A
761010 Argyle Twp Sanilac $65,580 $0 $0 $65,580 $66,669 $0 $66,669 $1,089 1.7%
761020 Austin Twp Sanilac $57,459 $0 $0 $57,459 $58,412 $0 $58,412 $953 1.7%
761030 Bridgehampton Twp Sanilac $59,446 $0 $0 $59,446 $60,433 $0 $60,433 $987 1.7%
761040 Buel Twp Sanilac $109,299 $0 $0 $109,299 $111,116 $0 $111,116 $1,817 1.7%
761050 Custer Twp Sanilac $86,921 $0 $0 $86,921 $88,365 $0 $88,365 $1,444 1.7%
761060 Delaware Twp Sanilac $62,210 $0 $0 $62,210 $63,244 $0 $63,244 $1,034 1.7%
761070 Elk Twp Sanilac $77,244 $0 $0 $77,244 $78,527 $0 $78,527 $1,283 1.7%
761080 Elmer Twp Sanilac $69,640 $0 $0 $69,640 $70,798 $0 $70,798 $1,158 1.7%
761090 Evergreen Twp Sanilac $79,836 $0 $0 $79,836 $81,163 $0 $81,163 $1,327 1.7%
761100 Flynn Twp Sanilac $90,723 $0 $0 $90,723 $92,230 $0 $92,230 $1,507 1.7%
761110 Forester Twp Sanilac $87,352 $0 $0 $87,352 $88,805 $0 $88,805 $1,453 1.7%
761120 Fremont Twp Sanilac $90,808 $0 $0 $90,808 $92,318 $0 $92,318 $1,510 1.7%
761130 Greenleaf Twp Sanilac $67,481 $0 $0 $67,481 $68,602 $0 $68,602 $1,121 1.7%
761140 Lamotte Twp Sanilac $79,403 $0 $0 $79,403 $80,723 $0 $80,723 $1,320 1.7%
761150 Lexington Twp Sanilac $214,277 $0 $0 $214,277 $217,840 $0 $217,840 $3,563 1.7%
761160 Maple Valley Twp Sanilac $105,498 $0 $0 $105,498 $107,251 $0 $107,251 $1,753 1.7%
761170 Marion Twp Sanilac $71,626 $0 $0 $71,626 $72,818 $0 $72,818 $1,192 1.7%
761180 Marlette Twp Sanilac $152,327 $0 $0 $152,327 $154,859 $0 $154,859 $2,532 1.7%
761190 Minden Twp Sanilac $30,069 $0 $0 $30,069 $30,567 $0 $30,567 $498 1.7%
September 30, 2019 FY 2019 Actuals and FY 2020 Projected - 2019 P.A. 56 - May Consensus Page 127 of 144
Prepared by the Revenue Sharing and Grants Division, Michigan Department of Treasury
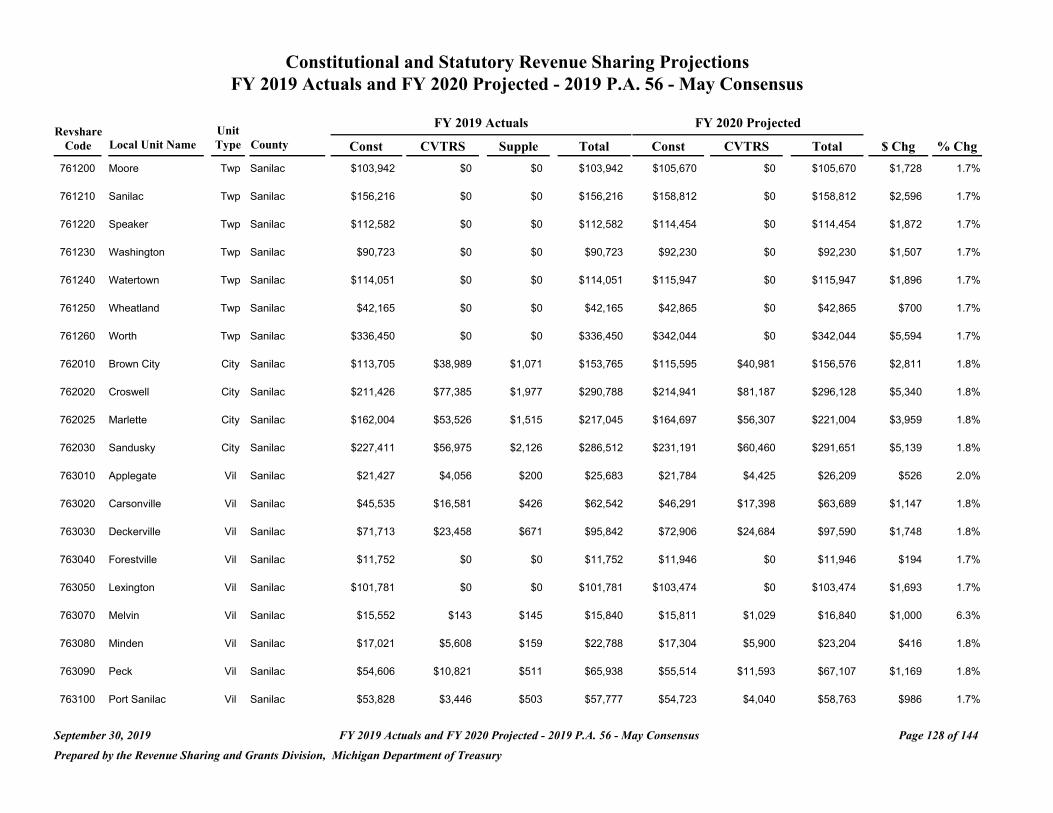
Constitutional and Statutory Revenue Sharing Projections FY 2019 Actuals and FY 2020 Projected - 2019 P.A. 56 - May Consensus
FY 2019 Actuals FY 2020 Projected Revshare Unit
Code Local Unit Name Type County Const CVTRS Supple Total Const CVTRS Total $ Chg % Chg
761200 Moore Twp Sanilac $103,942 $0 $0 $103,942 $105,670 $0 $105,670 $1,728 1.7%
761210 Sanilac Twp Sanilac $156,216 $0 $0 $156,216 $158,812 $0 $158,812 $2,596 1.7%
761220 Speaker Twp Sanilac $112,582 $0 $0 $112,582 $114,454 $0 $114,454 $1,872 1.7%
761230 Washington Twp Sanilac $90,723 $0 $0 $90,723 $92,230 $0 $92,230 $1,507 1.7%
761240 Watertown Twp Sanilac $114,051 $0 $0 $114,051 $115,947 $0 $115,947 $1,896 1.7%
761250 Wheatland Twp Sanilac $42,165 $0 $0 $42,165 $42,865 $0 $42,865 $700 1.7%
761260 Worth Twp Sanilac $336,450 $0 $0 $336,450 $342,044 $0 $342,044 $5,594 1.7%
762010 Brown City City Sanilac $113,705 $38,989 $1,071 $153,765 $115,595 $40,981 $156,576 $2,811 1.8%
762020 Croswell City Sanilac $211,426 $77,385 $1,977 $290,788 $214,941 $81,187 $296,128 $5,340 1.8%
762025 Marlette City Sanilac $162,004 $53,526 $1,515 $217,045 $164,697 $56,307 $221,004 $3,959 1.8%
762030 Sandusky City Sanilac $227,411 $56,975 $2,126 $286,512 $231,191 $60,460 $291,651 $5,139 1.8%
763010 Applegate Vil Sanilac $21,427 $4,056 $200 $25,683 $21,784 $4,425 $26,209 $526 2.0%
763020 Carsonville Vil Sanilac $45,535 $16,581 $426 $62,542 $46,291 $17,398 $63,689 $1,147 1.8%
763030 Deckerville Vil Sanilac $71,713 $23,458 $671 $95,842 $72,906 $24,684 $97,590 $1,748 1.8%
763040 Forestville Vil Sanilac $11,752 $0 $0 $11,752 $11,946 $0 $11,946 $194 1.7%
763050 Lexington Vil Sanilac $101,781 $0 $0 $101,781 $103,474 $0 $103,474 $1,693 1.7%
763070 Melvin Vil Sanilac $15,552 $143 $145 $15,840 $15,811 $1,029 $16,840 $1,000 6.3%
763080 Minden Vil Sanilac $17,021 $5,608 $159 $22,788 $17,304 $5,900 $23,204 $416 1.8%
763090 Peck Vil Sanilac $54,606 $10,821 $511 $65,938 $55,514 $11,593 $67,107 $1,169 1.8%
763100 Port Sanilac Vil Sanilac $53,828 $3,446 $503 $57,777 $54,723 $4,040 $58,763 $986 1.7%
September 30, 2019 FY 2019 Actuals and FY 2020 Projected - 2019 P.A. 56 - May Consensus Page 128 of 144
Prepared by the Revenue Sharing and Grants Division, Michigan Department of Treasury

Constitutional and Statutory Revenue Sharing Projections FY 2019 Actuals and FY 2020 Projected - 2019 P.A. 56 - May Consensus
FY 2019 Actuals FY 2020 Projected Revshare Unit
Code Local Unit Name Type County Const CVTRS Supple Total Const CVTRS Total $ Chg % Chg
County Totals: $3,721,089 $290,988 $9,304 $4,021,381 $3,782,939 $308,004 $4,090,943 $69,562 1.7%
September 30, 2019 FY 2019 Actuals and FY 2020 Projected - 2019 P.A. 56 - May Consensus Page 129 of 144
Prepared by the Revenue Sharing and Grants Division, Michigan Department of Treasury
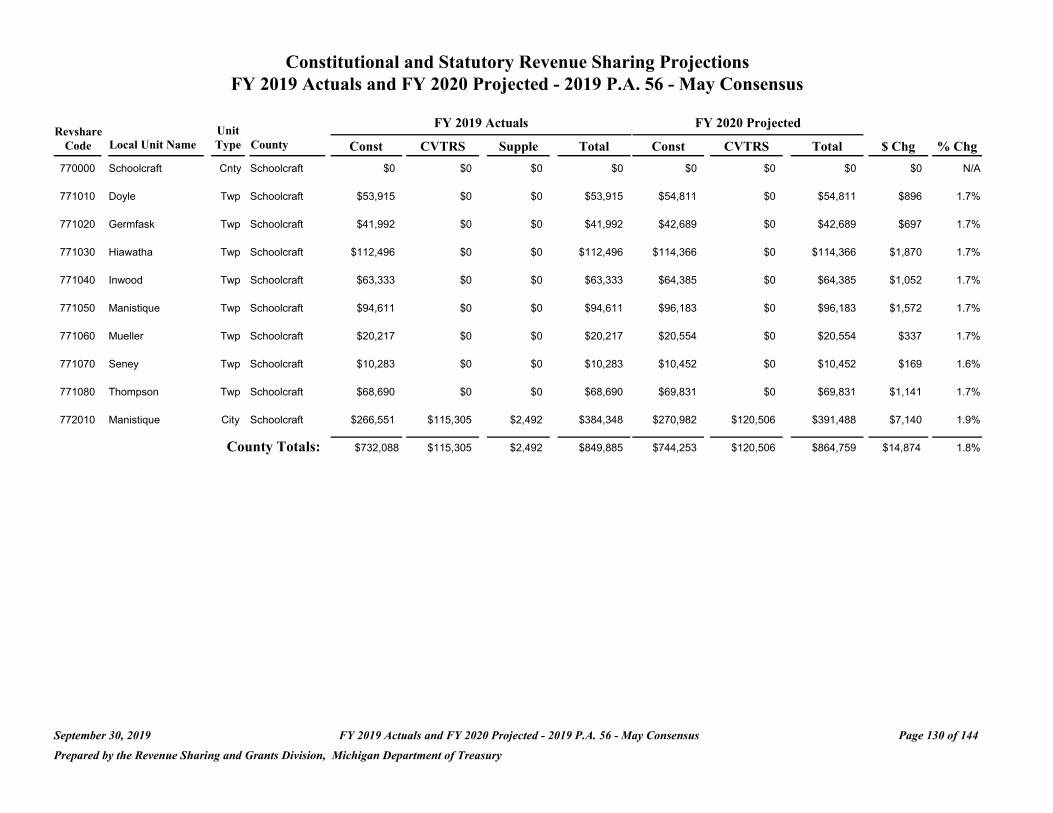
Constitutional and Statutory Revenue Sharing Projections FY 2019 Actuals and FY 2020 Projected - 2019 P.A. 56 - May Consensus
Revshare Unit FY 2019 Actuals FY 2020 Projected
Code Local Unit Name Type County Const CVTRS Supple Total Const CVTRS Total $ Chg % Chg
770000 Schoolcraft Cnty Schoolcraft $0 $0 $0 $0 $0 $0 $0 $0 N/A
771010 Doyle Twp Schoolcraft $53,915 $0 $0 $53,915 $54,811 $0 $54,811 $896 1.7%
771020 Germfask Twp Schoolcraft $41,992 $0 $0 $41,992 $42,689 $0 $42,689 $697 1.7%
771030 Hiawatha Twp Schoolcraft $112,496 $0 $0 $112,496 $114,366 $0 $114,366 $1,870 1.7%
771040 Inwood Twp Schoolcraft $63,333 $0 $0 $63,333 $64,385 $0 $64,385 $1,052 1.7%
771050 Manistique Twp Schoolcraft $94,611 $0 $0 $94,611 $96,183 $0 $96,183 $1,572 1.7%
771060 Mueller Twp Schoolcraft $20,217 $0 $0 $20,217 $20,554 $0 $20,554 $337 1.7%
771070 Seney Twp Schoolcraft $10,283 $0 $0 $10,283 $10,452 $0 $10,452 $169 1.6%
771080 Thompson Twp Schoolcraft $68,690 $0 $0 $68,690 $69,831 $0 $69,831 $1,141 1.7%
772010 Manistique City Schoolcraft $266,551 $115,305 $2,492 $384,348 $270,982 $120,506 $391,488 $7,140 1.9%
County Totals: $732,088 $115,305 $2,492 $849,885 $744,253 $120,506 $864,759 $14,874 1.8%
September 30, 2019 FY 2019 Actuals and FY 2020 Projected - 2019 P.A. 56 - May Consensus Page 130 of 144
Prepared by the Revenue Sharing and Grants Division, Michigan Department of Treasury
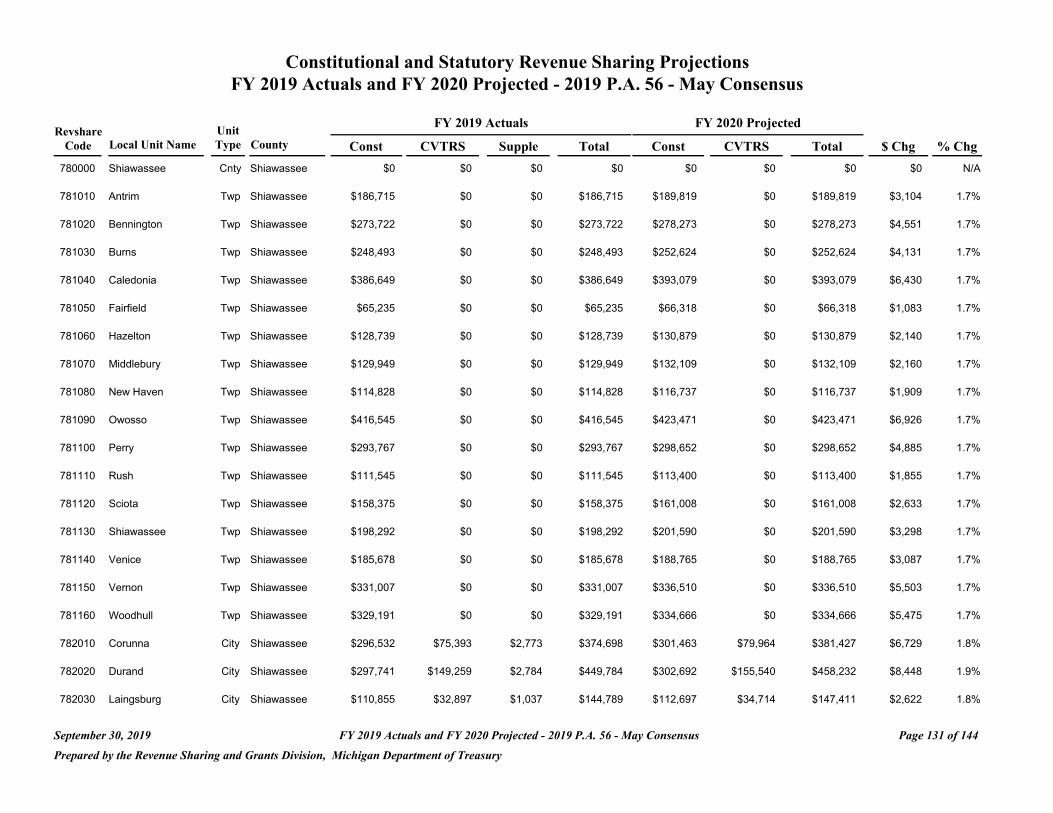
Constitutional and Statutory Revenue Sharing Projections FY 2019 Actuals and FY 2020 Projected - 2019 P.A. 56 - May Consensus
FY 2019 Actuals FY 2020 Projected Revshare Unit
Code Local Unit Name Type County Const CVTRS Supple Total Const CVTRS Total $ Chg % Chg
780000 Shiawassee Cnty Shiawassee $0 $0 $0 $0 $0 $0 $0 $0 N/A
781010 Antrim Twp Shiawassee $186,715 $0 $0 $186,715 $189,819 $0 $189,819 $3,104 1.7%
781020 Bennington Twp Shiawassee $273,722 $0 $0 $273,722 $278,273 $0 $278,273 $4,551 1.7%
781030 Burns Twp Shiawassee $248,493 $0 $0 $248,493 $252,624 $0 $252,624 $4,131 1.7%
781040 Caledonia Twp Shiawassee $386,649 $0 $0 $386,649 $393,079 $0 $393,079 $6,430 1.7%
781050 Fairfield Twp Shiawassee $65,235 $0 $0 $65,235 $66,318 $0 $66,318 $1,083 1.7%
781060 Hazelton Twp Shiawassee $128,739 $0 $0 $128,739 $130,879 $0 $130,879 $2,140 1.7%
781070 Middlebury Twp Shiawassee $129,949 $0 $0 $129,949 $132,109 $0 $132,109 $2,160 1.7%
781080 New Haven Twp Shiawassee $114,828 $0 $0 $114,828 $116,737 $0 $116,737 $1,909 1.7%
781090 Owosso Twp Shiawassee $416,545 $0 $0 $416,545 $423,471 $0 $423,471 $6,926 1.7%
781100 Perry Twp Shiawassee $293,767 $0 $0 $293,767 $298,652 $0 $298,652 $4,885 1.7%
781110 Rush Twp Shiawassee $111,545 $0 $0 $111,545 $113,400 $0 $113,400 $1,855 1.7%
781120 Sciota Twp Shiawassee $158,375 $0 $0 $158,375 $161,008 $0 $161,008 $2,633 1.7%
781130 Shiawassee Twp Shiawassee $198,292 $0 $0 $198,292 $201,590 $0 $201,590 $3,298 1.7%
781140 Venice Twp Shiawassee $185,678 $0 $0 $185,678 $188,765 $0 $188,765 $3,087 1.7%
781150 Vernon Twp Shiawassee $331,007 $0 $0 $331,007 $336,510 $0 $336,510 $5,503 1.7%
781160 Woodhull Twp Shiawassee $329,191 $0 $0 $329,191 $334,666 $0 $334,666 $5,475 1.7%
782010 Corunna City Shiawassee $296,532 $75,393 $2,773 $374,698 $301,463 $79,964 $381,427 $6,729 1.8%
782020 Durand City Shiawassee $297,741 $149,259 $2,784 $449,784 $302,692 $155,540 $458,232 $8,448 1.9%
782030 Laingsburg City Shiawassee $110,855 $32,897 $1,037 $144,789 $112,697 $34,714 $147,411 $2,622 1.8%
September 30, 2019 FY 2019 Actuals and FY 2020 Projected - 2019 P.A. 56 - May Consensus Page 131 of 144
Prepared by the Revenue Sharing and Grants Division, Michigan Department of Treasury
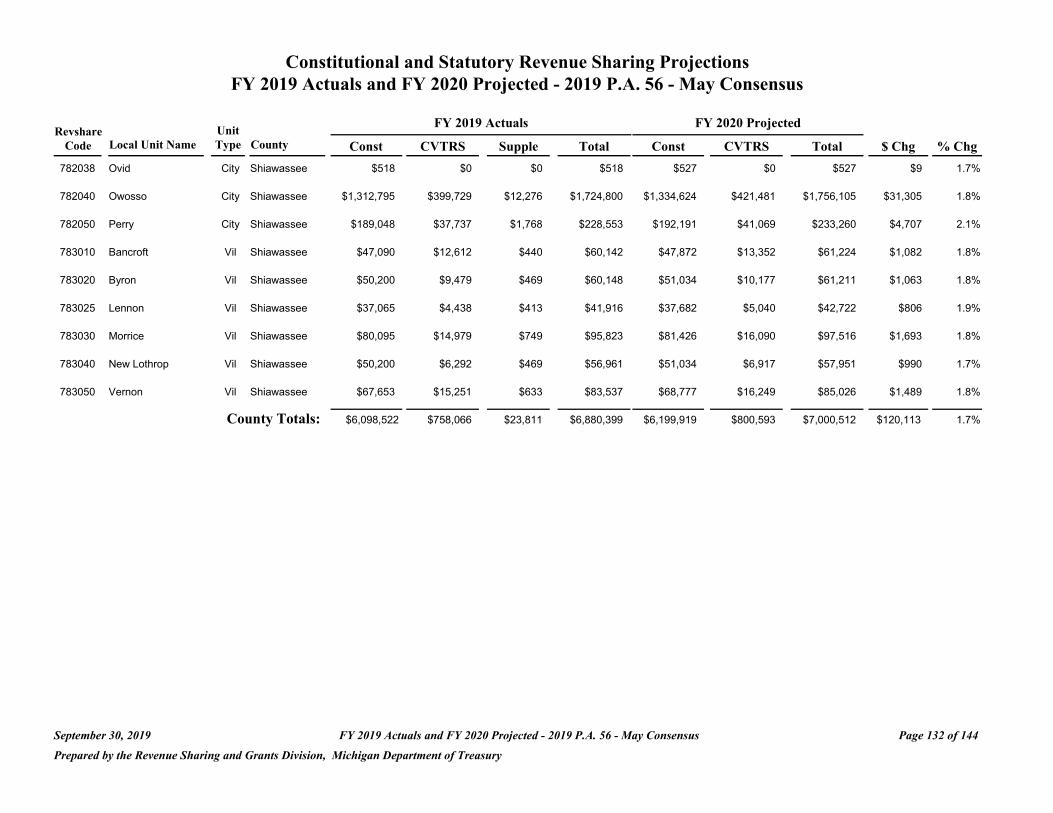
Constitutional and Statutory Revenue Sharing Projections FY 2019 Actuals and FY 2020 Projected - 2019 P.A. 56 - May Consensus
Revshare Unit FY 2019 Actuals FY 2020 Projected
Code Local Unit Name Type County Const CVTRS Supple Total Const CVTRS Total $ Chg % Chg
782038 Ovid City Shiawassee $518 $0 $0 $518 $527 $0 $527 $9 1.7%
782040 Owosso City Shiawassee $1,312,795 $399,729 $12,276 $1,724,800 $1,334,624 $421,481 $1,756,105 $31,305 1.8%
782050 Perry City Shiawassee $189,048 $37,737 $1,768 $228,553 $192,191 $41,069 $233,260 $4,707 2.1%
783010 Bancroft Vil Shiawassee $47,090 $12,612 $440 $60,142 $47,872 $13,352 $61,224 $1,082 1.8%
783020 Byron Vil Shiawassee $50,200 $9,479 $469 $60,148 $51,034 $10,177 $61,211 $1,063 1.8%
783025 Lennon Vil Shiawassee $37,065 $4,438 $413 $41,916 $37,682 $5,040 $42,722 $806 1.9%
783030 Morrice Vil Shiawassee $80,095 $14,979 $749 $95,823 $81,426 $16,090 $97,516 $1,693 1.8%
783040 New Lothrop Vil Shiawassee $50,200 $6,292 $469 $56,961 $51,034 $6,917 $57,951 $990 1.7%
783050 Vernon Vil Shiawassee $67,653 $15,251 $633 $83,537 $68,777 $16,249 $85,026 $1,489 1.8%
County Totals: $6,098,522 $758,066 $23,811 $6,880,399 $6,199,919 $800,593 $7,000,512 $120,113 1.7%
September 30, 2019 FY 2019 Actuals and FY 2020 Projected - 2019 P.A. 56 - May Consensus Page 132 of 144
Prepared by the Revenue Sharing and Grants Division, Michigan Department of Treasury

Constitutional and Statutory Revenue Sharing Projections FY 2019 Actuals and FY 2020 Projected - 2019 P.A. 56 - May Consensus
FY 2019 Actuals FY 2020 Projected Revshare Unit
Code Local Unit Name Type County Const CVTRS Supple Total Const CVTRS Total $ Chg % Chg
790000 Tuscola Cnty Tuscola $0 $0 $0 $0 $0 $0 $0 $0 N/A
791010 Akron Twp Tuscola $108,090 $0 $0 $108,090 $109,886 $0 $109,886 $1,796 1.7%
791020 Almer Twp Tuscola $182,740 $0 $0 $182,740 $185,779 $0 $185,779 $3,039 1.7%
791030 Arbela Twp Tuscola $265,254 $0 $0 $265,254 $269,665 $0 $269,665 $4,411 1.7%
791040 Columbia Twp Tuscola $67,048 $0 $0 $67,048 $68,162 $0 $68,162 $1,114 1.7%
791050 Dayton Twp Tuscola $159,671 $0 $0 $159,671 $162,326 $0 $162,326 $2,655 1.7%
791060 Denmark Twp Tuscola $139,970 $0 $0 $139,970 $142,299 $0 $142,299 $2,329 1.7%
791070 Elkland Twp Tuscola $95,042 $0 $0 $95,042 $96,622 $0 $96,622 $1,580 1.7%
791080 Ellington Twp Tuscola $115,088 $0 $0 $115,088 $117,001 $0 $117,001 $1,913 1.7%
791090 Elmwood Twp Tuscola $70,764 $0 $0 $70,764 $71,940 $0 $71,940 $1,176 1.7%
791100 Fairgrove Twp Tuscola $74,825 $0 $0 $74,825 $76,068 $0 $76,068 $1,243 1.7%
791110 Fremont Twp Tuscola $204,082 $0 $0 $204,082 $207,475 $0 $207,475 $3,393 1.7%
791120 Gilford Twp Tuscola $64,024 $0 $0 $64,024 $65,088 $0 $65,088 $1,064 1.7%
791130 Indianfields Twp Tuscola $228,965 $0 $0 $228,965 $232,773 $0 $232,773 $3,808 1.7%
791140 Juniata Twp Tuscola $135,392 $0 $0 $135,392 $137,643 $0 $137,643 $2,251 1.7%
791150 Kingston Twp Tuscola $102,733 $0 $0 $102,733 $104,440 $0 $104,440 $1,707 1.7%
791160 Koylton Twp Tuscola $132,196 $0 $0 $132,196 $134,393 $0 $134,393 $2,197 1.7%
791170 Millington Twp Tuscola $283,574 $0 $0 $283,574 $288,287 $0 $288,287 $4,713 1.7%
791180 Novesta Twp Tuscola $128,826 $0 $0 $128,826 $130,967 $0 $130,967 $2,141 1.7%
791190 Tuscola Twp Tuscola $179,889 $0 $0 $179,889 $182,880 $0 $182,880 $2,991 1.7%
September 30, 2019 FY 2019 Actuals and FY 2020 Projected - 2019 P.A. 56 - May Consensus Page 133 of 144
Prepared by the Revenue Sharing and Grants Division, Michigan Department of Treasury
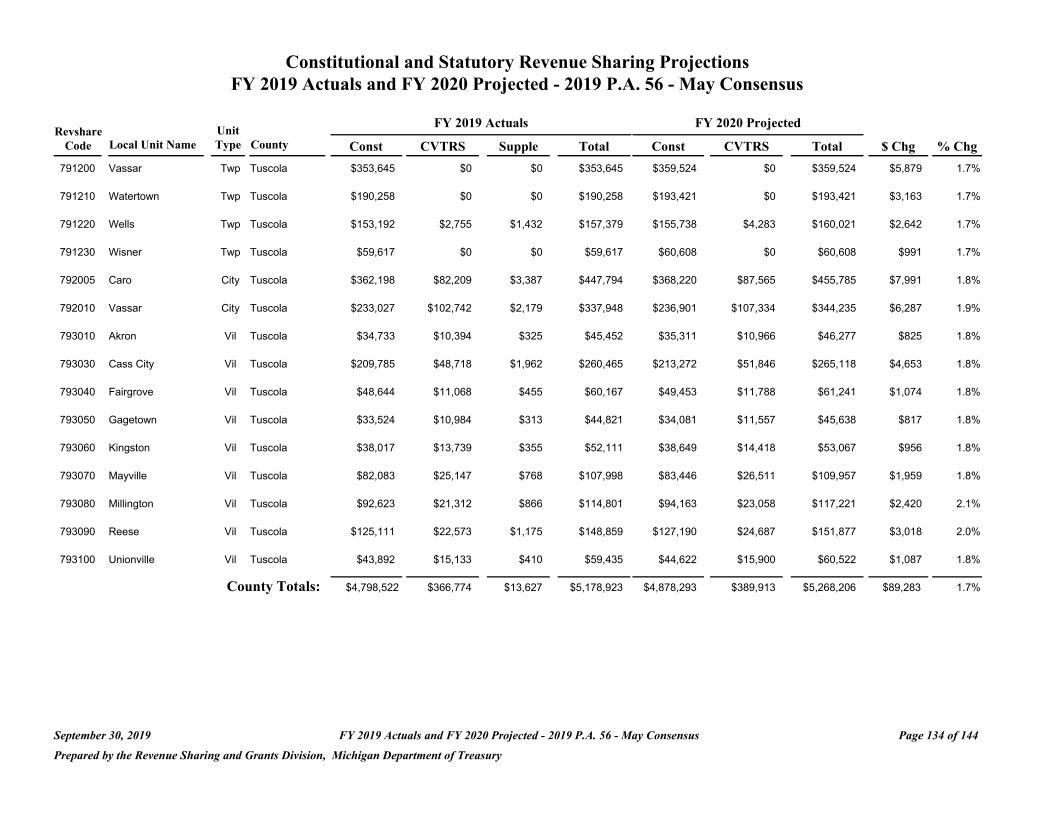
Constitutional and Statutory Revenue Sharing Projections FY 2019 Actuals and FY 2020 Projected - 2019 P.A. 56 - May Consensus
Revshare Unit FY 2019 Actuals FY 2020 Projected
Code Local Unit Name Type County Const CVTRS Supple Total Const CVTRS Total $ Chg % Chg
791200 Vassar Twp Tuscola $353,645 $0 $0 $353,645 $359,524 $0 $359,524 $5,879 1.7%
791210 Watertown Twp Tuscola $190,258 $0 $0 $190,258 $193,421 $0 $193,421 $3,163 1.7%
791220 Wells Twp Tuscola $153,192 $2,755 $1,432 $157,379 $155,738 $4,283 $160,021 $2,642 1.7%
791230 Wisner Twp Tuscola $59,617 $0 $0 $59,617 $60,608 $0 $60,608 $991 1.7%
792005 Caro City Tuscola $362,198 $82,209 $3,387 $447,794 $368,220 $87,565 $455,785 $7,991 1.8%
792010 Vassar City Tuscola $233,027 $102,742 $2,179 $337,948 $236,901 $107,334 $344,235 $6,287 1.9%
793010 Akron Vil Tuscola $34,733 $10,394 $325 $45,452 $35,311 $10,966 $46,277 $825 1.8%
793030 Cass City Vil Tuscola $209,785 $48,718 $1,962 $260,465 $213,272 $51,846 $265,118 $4,653 1.8%
793040 Fairgrove Vil Tuscola $48,644 $11,068 $455 $60,167 $49,453 $11,788 $61,241 $1,074 1.8%
793050 Gagetown Vil Tuscola $33,524 $10,984 $313 $44,821 $34,081 $11,557 $45,638 $817 1.8%
793060 Kingston Vil Tuscola $38,017 $13,739 $355 $52,111 $38,649 $14,418 $53,067 $956 1.8%
793070 Mayville Vil Tuscola $82,083 $25,147 $768 $107,998 $83,446 $26,511 $109,957 $1,959 1.8%
793080 Millington Vil Tuscola $92,623 $21,312 $866 $114,801 $94,163 $23,058 $117,221 $2,420 2.1%
793090 Reese Vil Tuscola $125,111 $22,573 $1,175 $148,859 $127,190 $24,687 $151,877 $3,018 2.0%
793100 Unionville Vil Tuscola $43,892 $15,133 $410 $59,435 $44,622 $15,900 $60,522 $1,087 1.8%
County Totals: $4,798,522 $366,774 $13,627 $5,178,923 $4,878,293 $389,913 $5,268,206 $89,283 1.7%
September 30, 2019 FY 2019 Actuals and FY 2020 Projected - 2019 P.A. 56 - May Consensus Page 134 of 144
Prepared by the Revenue Sharing and Grants Division, Michigan Department of Treasury
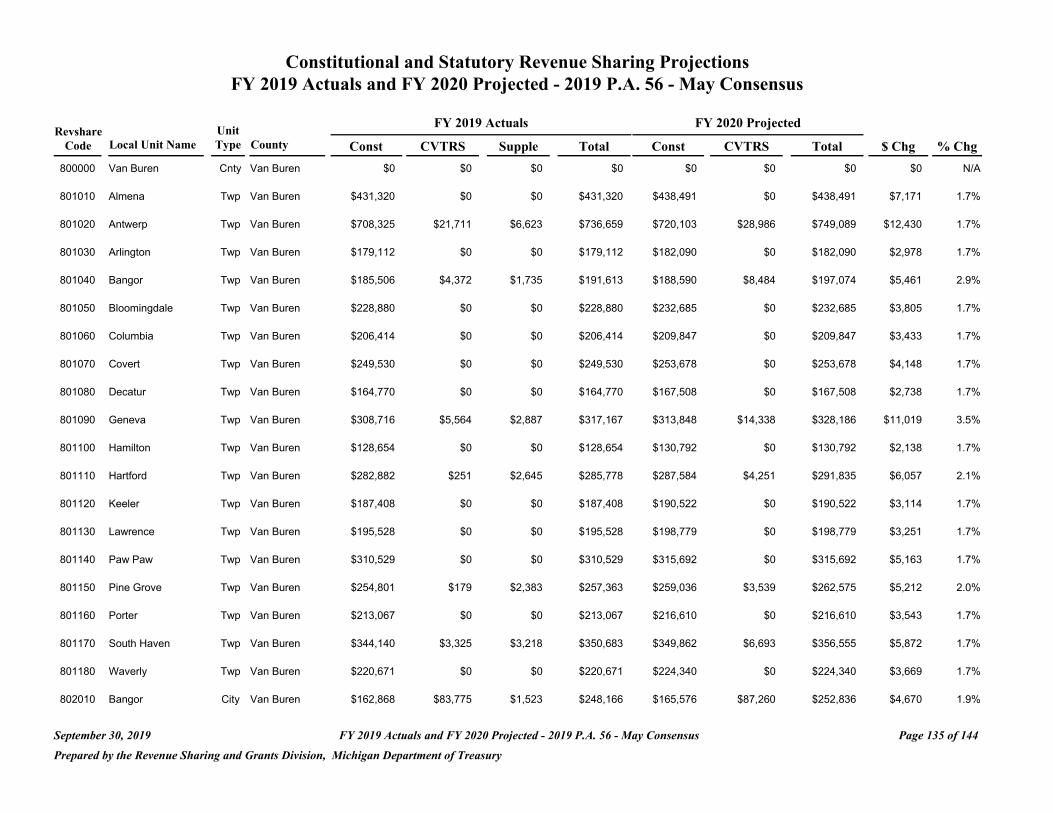
Constitutional and Statutory Revenue Sharing Projections FY 2019 Actuals and FY 2020 Projected - 2019 P.A. 56 - May Consensus
FY 2019 Actuals FY 2020 Projected Revshare Unit
Code Local Unit Name Type County Const CVTRS Supple Total Const CVTRS Total $ Chg % Chg
800000 Van Buren Cnty Van Buren $0 $0 $0 $0 $0 $0 $0 $0 N/A
801010 Almena Twp Van Buren $431,320 $0 $0 $431,320 $438,491 $0 $438,491 $7,171 1.7%
801020 Antwerp Twp Van Buren $708,325 $21,711 $6,623 $736,659 $720,103 $28,986 $749,089 $12,430 1.7%
801030 Arlington Twp Van Buren $179,112 $0 $0 $179,112 $182,090 $0 $182,090 $2,978 1.7%
801040 Bangor Twp Van Buren $185,506 $4,372 $1,735 $191,613 $188,590 $8,484 $197,074 $5,461 2.9%
801050 Bloomingdale Twp Van Buren $228,880 $0 $0 $228,880 $232,685 $0 $232,685 $3,805 1.7%
801060 Columbia Twp Van Buren $206,414 $0 $0 $206,414 $209,847 $0 $209,847 $3,433 1.7%
801070 Covert Twp Van Buren $249,530 $0 $0 $249,530 $253,678 $0 $253,678 $4,148 1.7%
801080 Decatur Twp Van Buren $164,770 $0 $0 $164,770 $167,508 $0 $167,508 $2,738 1.7%
801090 Geneva Twp Van Buren $308,716 $5,564 $2,887 $317,167 $313,848 $14,338 $328,186 $11,019 3.5%
801100 Hamilton Twp Van Buren $128,654 $0 $0 $128,654 $130,792 $0 $130,792 $2,138 1.7%
801110 Hartford Twp Van Buren $282,882 $251 $2,645 $285,778 $287,584 $4,251 $291,835 $6,057 2.1%
801120 Keeler Twp Van Buren $187,408 $0 $0 $187,408 $190,522 $0 $190,522 $3,114 1.7%
801130 Lawrence Twp Van Buren $195,528 $0 $0 $195,528 $198,779 $0 $198,779 $3,251 1.7%
801140 Paw Paw Twp Van Buren $310,529 $0 $0 $310,529 $315,692 $0 $315,692 $5,163 1.7%
801150 Pine Grove Twp Van Buren $254,801 $179 $2,383 $257,363 $259,036 $3,539 $262,575 $5,212 2.0%
801160 Porter Twp Van Buren $213,067 $0 $0 $213,067 $216,610 $0 $216,610 $3,543 1.7%
801170 South Haven Twp Van Buren $344,140 $3,325 $3,218 $350,683 $349,862 $6,693 $356,555 $5,872 1.7%
801180 Waverly Twp Van Buren $220,671 $0 $0 $220,671 $224,340 $0 $224,340 $3,669 1.7%
802010 Bangor City Van Buren $162,868 $83,775 $1,523 $248,166 $165,576 $87,260 $252,836 $4,670 1.9%
September 30, 2019 FY 2019 Actuals and FY 2020 Projected - 2019 P.A. 56 - May Consensus Page 135 of 144
Prepared by the Revenue Sharing and Grants Division, Michigan Department of Treasury
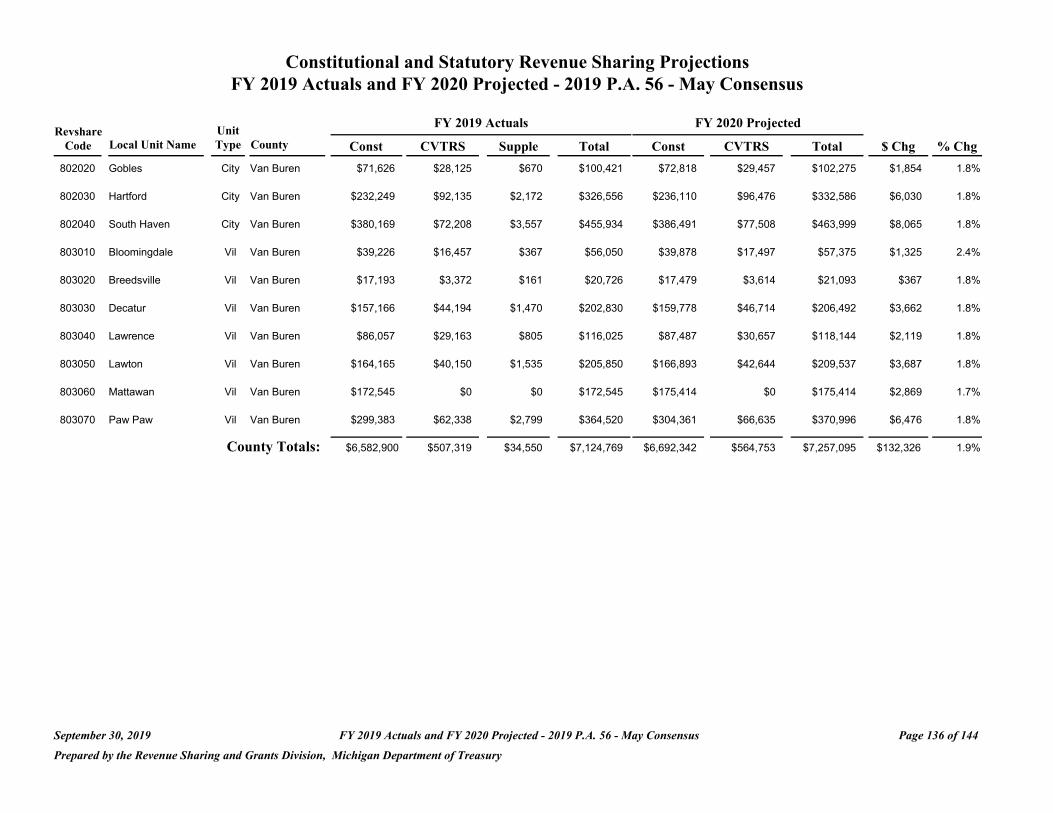
Constitutional and Statutory Revenue Sharing Projections FY 2019 Actuals and FY 2020 Projected - 2019 P.A. 56 - May Consensus
Revshare Unit FY 2019 Actuals FY 2020 Projected
Code Local Unit Name Type County Const CVTRS Supple Total Const CVTRS Total $ Chg % Chg
802020 Gobles City Van Buren $71,626 $28,125 $670 $100,421 $72,818 $29,457 $102,275 $1,854 1.8%
802030 Hartford City Van Buren $232,249 $92,135 $2,172 $326,556 $236,110 $96,476 $332,586 $6,030 1.8%
802040 South Haven City Van Buren $380,169 $72,208 $3,557 $455,934 $386,491 $77,508 $463,999 $8,065 1.8%
803010 Bloomingdale Vil Van Buren $39,226 $16,457 $367 $56,050 $39,878 $17,497 $57,375 $1,325 2.4%
803020 Breedsville Vil Van Buren $17,193 $3,372 $161 $20,726 $17,479 $3,614 $21,093 $367 1.8%
803030 Decatur Vil Van Buren $157,166 $44,194 $1,470 $202,830 $159,778 $46,714 $206,492 $3,662 1.8%
803040 Lawrence Vil Van Buren $86,057 $29,163 $805 $116,025 $87,487 $30,657 $118,144 $2,119 1.8%
803050 Lawton Vil Van Buren $164,165 $40,150 $1,535 $205,850 $166,893 $42,644 $209,537 $3,687 1.8%
803060 Mattawan Vil Van Buren $172,545 $0 $0 $172,545 $175,414 $0 $175,414 $2,869 1.7%
803070 Paw Paw Vil Van Buren $299,383 $62,338 $2,799 $364,520 $304,361 $66,635 $370,996 $6,476 1.8%
County Totals: $6,582,900 $507,319 $34,550 $7,124,769 $6,692,342 $564,753 $7,257,095 $132,326 1.9%
September 30, 2019 FY 2019 Actuals and FY 2020 Projected - 2019 P.A. 56 - May Consensus Page 136 of 144
Prepared by the Revenue Sharing and Grants Division, Michigan Department of Treasury
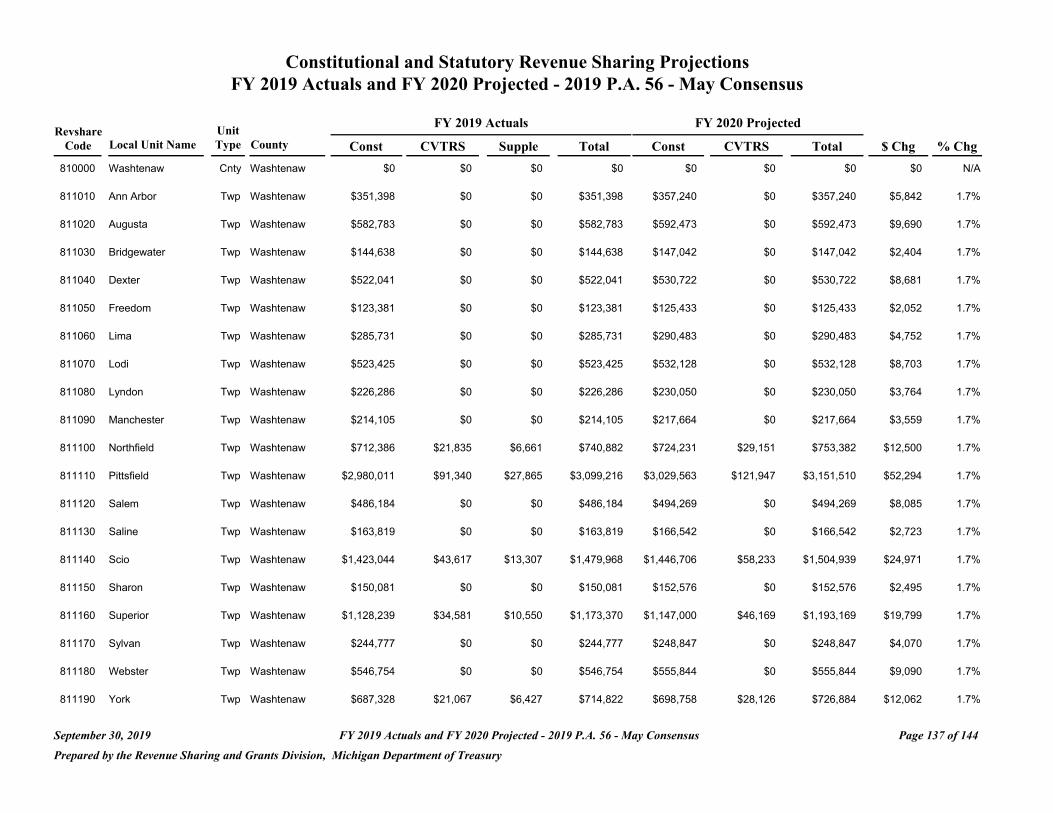
Constitutional and Statutory Revenue Sharing Projections FY 2019 Actuals and FY 2020 Projected - 2019 P.A. 56 - May Consensus
FY 2019 Actuals FY 2020 Projected Revshare Unit
Code Local Unit Name Type County Const CVTRS Supple Total Const CVTRS Total $ Chg % Chg
810000 Washtenaw Cnty Washtenaw $0 $0 $0 $0 $0 $0 $0 $0 N/A
811010 Ann Arbor Twp Washtenaw $351,398 $0 $0 $351,398 $357,240 $0 $357,240 $5,842 1.7%
811020 Augusta Twp Washtenaw $582,783 $0 $0 $582,783 $592,473 $0 $592,473 $9,690 1.7%
811030 Bridgewater Twp Washtenaw $144,638 $0 $0 $144,638 $147,042 $0 $147,042 $2,404 1.7%
811040 Dexter Twp Washtenaw $522,041 $0 $0 $522,041 $530,722 $0 $530,722 $8,681 1.7%
811050 Freedom Twp Washtenaw $123,381 $0 $0 $123,381 $125,433 $0 $125,433 $2,052 1.7%
811060 Lima Twp Washtenaw $285,731 $0 $0 $285,731 $290,483 $0 $290,483 $4,752 1.7%
811070 Lodi Twp Washtenaw $523,425 $0 $0 $523,425 $532,128 $0 $532,128 $8,703 1.7%
811080 Lyndon Twp Washtenaw $226,286 $0 $0 $226,286 $230,050 $0 $230,050 $3,764 1.7%
811090 Manchester Twp Washtenaw $214,105 $0 $0 $214,105 $217,664 $0 $217,664 $3,559 1.7%
811100 Northfield Twp Washtenaw $712,386 $21,835 $6,661 $740,882 $724,231 $29,151 $753,382 $12,500 1.7%
811110 Pittsfield Twp Washtenaw $2,980,011 $91,340 $27,865 $3,099,216 $3,029,563 $121,947 $3,151,510 $52,294 1.7%
811120 Salem Twp Washtenaw $486,184 $0 $0 $486,184 $494,269 $0 $494,269 $8,085 1.7%
811130 Saline Twp Washtenaw $163,819 $0 $0 $163,819 $166,542 $0 $166,542 $2,723 1.7%
811140 Scio Twp Washtenaw $1,423,044 $43,617 $13,307 $1,479,968 $1,446,706 $58,233 $1,504,939 $24,971 1.7%
811150 Sharon Twp Washtenaw $150,081 $0 $0 $150,081 $152,576 $0 $152,576 $2,495 1.7%
811160 Superior Twp Washtenaw $1,128,239 $34,581 $10,550 $1,173,370 $1,147,000 $46,169 $1,193,169 $19,799 1.7%
811170 Sylvan Twp Washtenaw $244,777 $0 $0 $244,777 $248,847 $0 $248,847 $4,070 1.7%
811180 Webster Twp Washtenaw $546,754 $0 $0 $546,754 $555,844 $0 $555,844 $9,090 1.7%
811190 York Twp Washtenaw $687,328 $21,067 $6,427 $714,822 $698,758 $28,126 $726,884 $12,062 1.7%
September 30, 2019 FY 2019 Actuals and FY 2020 Projected - 2019 P.A. 56 - May Consensus Page 137 of 144
Prepared by the Revenue Sharing and Grants Division, Michigan Department of Treasury
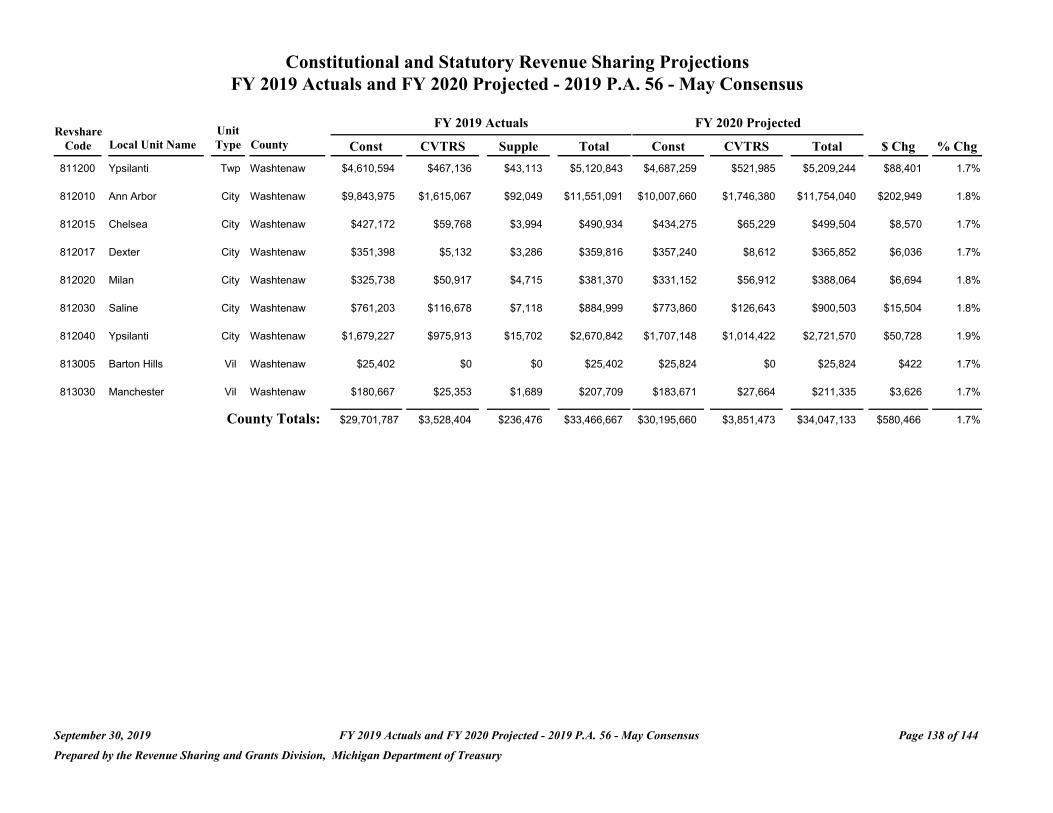
Constitutional and Statutory Revenue Sharing Projections FY 2019 Actuals and FY 2020 Projected - 2019 P.A. 56 - May Consensus
Revshare Unit FY 2019 Actuals FY 2020 Projected
Code Local Unit Name Type County Const CVTRS Supple Total Const CVTRS Total $ Chg % Chg
811200 Ypsilanti Twp Washtenaw $4,610,594 $467,136 $43,113 $5,120,843 $4,687,259 $521,985 $5,209,244 $88,401 1.7%
812010 Ann Arbor City Washtenaw $9,843,975 $1,615,067 $92,049 $11,551,091 $10,007,660 $1,746,380 $11,754,040 $202,949 1.8%
812015 Chelsea City Washtenaw $427,172 $59,768 $3,994 $490,934 $434,275 $65,229 $499,504 $8,570 1.7%
812017 Dexter City Washtenaw $351,398 $5,132 $3,286 $359,816 $357,240 $8,612 $365,852 $6,036 1.7%
812020 Milan City Washtenaw $325,738 $50,917 $4,715 $381,370 $331,152 $56,912 $388,064 $6,694 1.8%
812030 Saline City Washtenaw $761,203 $116,678 $7,118 $884,999 $773,860 $126,643 $900,503 $15,504 1.8%
812040 Ypsilanti City Washtenaw $1,679,227 $975,913 $15,702 $2,670,842 $1,707,148 $1,014,422 $2,721,570 $50,728 1.9%
813005 Barton Hills Vil Washtenaw $25,402 $0 $0 $25,402 $25,824 $0 $25,824 $422 1.7%
813030 Manchester Vil Washtenaw $180,667 $25,353 $1,689 $207,709 $183,671 $27,664 $211,335 $3,626 1.7%
County Totals: $29,701,787 $3,528,404 $236,476 $33,466,667 $30,195,660 $3,851,473 $34,047,133 $580,466 1.7%
September 30, 2019 FY 2019 Actuals and FY 2020 Projected - 2019 P.A. 56 - May Consensus Page 138 of 144
Prepared by the Revenue Sharing and Grants Division, Michigan Department of Treasury
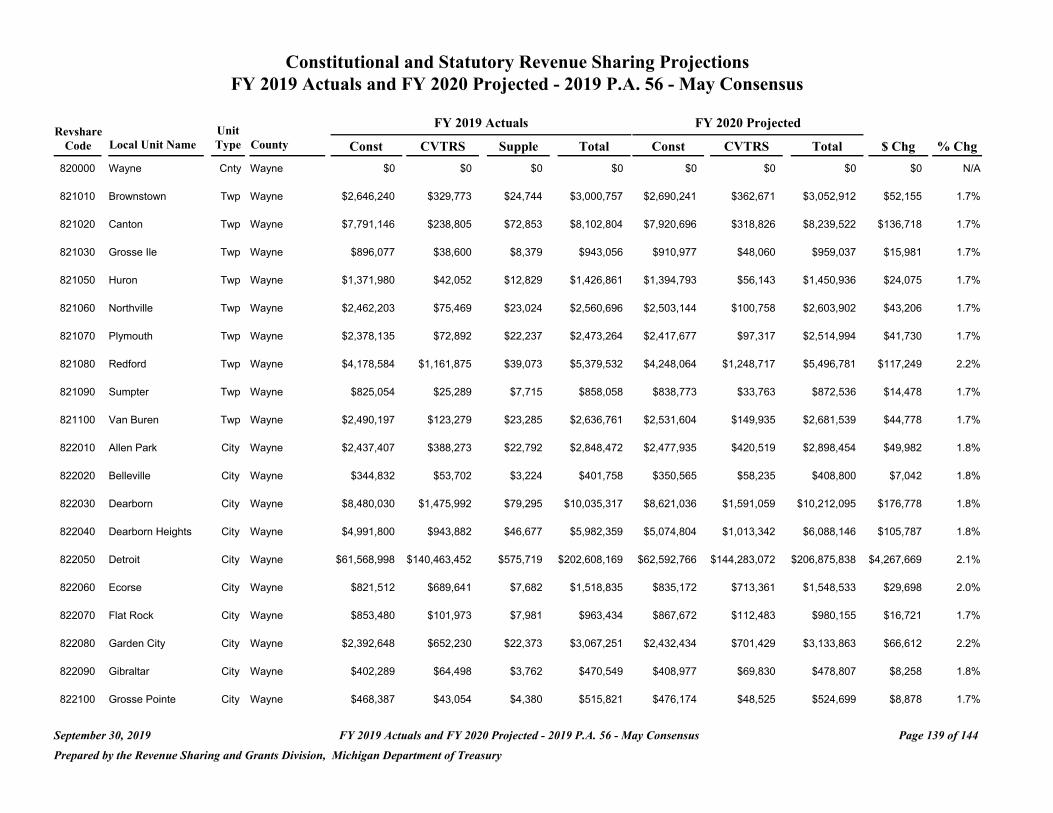
Constitutional and Statutory Revenue Sharing Projections FY 2019 Actuals and FY 2020 Projected - 2019 P.A. 56 - May Consensus
FY 2019 Actuals FY 2020 Projected Revshare Unit
Code Local Unit Name Type County Const CVTRS Supple Total Const CVTRS Total $ Chg % Chg
820000 Wayne Cnty Wayne $0 $0 $0 $0 $0 $0 $0 $0 N/A
821010 Brownstown Twp Wayne $2,646,240 $329,773 $24,744 $3,000,757 $2,690,241 $362,671 $3,052,912 $52,155 1.7%
821020 Canton Twp Wayne $7,791,146 $238,805 $72,853 $8,102,804 $7,920,696 $318,826 $8,239,522 $136,718 1.7%
821030 Grosse Ile Twp Wayne $896,077 $38,600 $8,379 $943,056 $910,977 $48,060 $959,037 $15,981 1.7%
821050 Huron Twp Wayne $1,371,980 $42,052 $12,829 $1,426,861 $1,394,793 $56,143 $1,450,936 $24,075 1.7%
821060 Northville Twp Wayne $2,462,203 $75,469 $23,024 $2,560,696 $2,503,144 $100,758 $2,603,902 $43,206 1.7%
821070 Plymouth Twp Wayne $2,378,135 $72,892 $22,237 $2,473,264 $2,417,677 $97,317 $2,514,994 $41,730 1.7%
821080 Redford Twp Wayne $4,178,584 $1,161,875 $39,073 $5,379,532 $4,248,064 $1,248,717 $5,496,781 $117,249 2.2%
821090 Sumpter Twp Wayne $825,054 $25,289 $7,715 $858,058 $838,773 $33,763 $872,536 $14,478 1.7%
821100 Van Buren Twp Wayne $2,490,197 $123,279 $23,285 $2,636,761 $2,531,604 $149,935 $2,681,539 $44,778 1.7%
822010 Allen Park City Wayne $2,437,407 $388,273 $22,792 $2,848,472 $2,477,935 $420,519 $2,898,454 $49,982 1.8%
822020 Belleville City Wayne $344,832 $53,702 $3,224 $401,758 $350,565 $58,235 $408,800 $7,042 1.8%
822030 Dearborn City Wayne $8,480,030 $1,475,992 $79,295 $10,035,317 $8,621,036 $1,591,059 $10,212,095 $176,778 1.8%
822040 Dearborn Heights City Wayne $4,991,800 $943,882 $46,677 $5,982,359 $5,074,804 $1,013,342 $6,088,146 $105,787 1.8%
822050 Detroit City Wayne $61,568,998 $140,463,452 $575,719 $202,608,169 $62,592,766 $144,283,072 $206,875,838 $4,267,669 2.1%
822060 Ecorse City Wayne $821,512 $689,641 $7,682 $1,518,835 $835,172 $713,361 $1,548,533 $29,698 2.0%
822070 Flat Rock City Wayne $853,480 $101,973 $7,981 $963,434 $867,672 $112,483 $980,155 $16,721 1.7%
822080 Garden City City Wayne $2,392,648 $652,230 $22,373 $3,067,251 $2,432,434 $701,429 $3,133,863 $66,612 2.2%
822090 Gibraltar City Wayne $402,289 $64,498 $3,762 $470,549 $408,977 $69,830 $478,807 $8,258 1.8%
822100 Grosse Pointe City Wayne $468,387 $43,054 $4,380 $515,821 $476,174 $48,525 $524,699 $8,878 1.7%
September 30, 2019 FY 2019 Actuals and FY 2020 Projected - 2019 P.A. 56 - May Consensus Page 139 of 144
Prepared by the Revenue Sharing and Grants Division, Michigan Department of Treasury
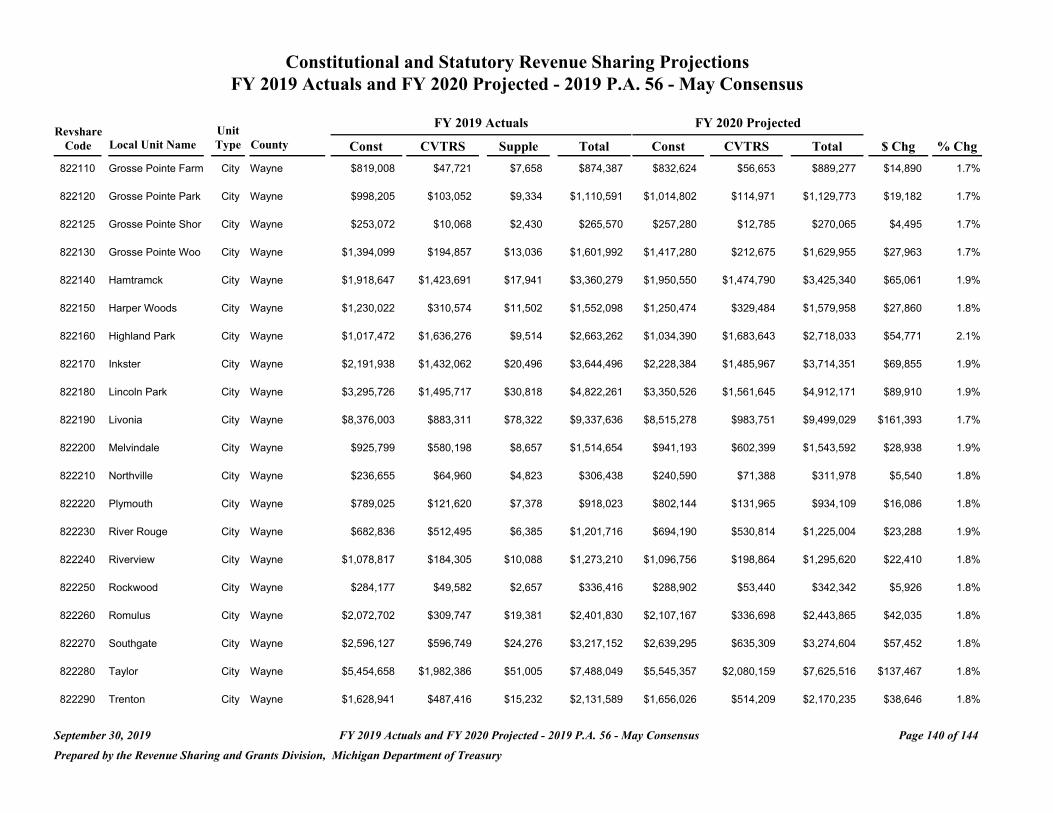
Constitutional and Statutory Revenue Sharing Projections FY 2019 Actuals and FY 2020 Projected - 2019 P.A. 56 - May Consensus
FY 2019 Actuals FY 2020 Projected Revshare Unit
Code Local Unit Name Type County Const CVTRS Supple Total Const CVTRS Total $ Chg % Chg
822110 Grosse Pointe Farm City Wayne $819,008 $47,721 $7,658 $874,387 $832,624 $56,653 $889,277 $14,890 1.7%
822120 Grosse Pointe Park City Wayne $998,205 $103,052 $9,334 $1,110,591 $1,014,802 $114,971 $1,129,773 $19,182 1.7%
822125 Grosse Pointe Shor City Wayne $253,072 $10,068 $2,430 $265,570 $257,280 $12,785 $270,065 $4,495 1.7%
822130 Grosse Pointe Woo City Wayne $1,394,099 $194,857 $13,036 $1,601,992 $1,417,280 $212,675 $1,629,955 $27,963 1.7%
822140 Hamtramck City Wayne $1,918,647 $1,423,691 $17,941 $3,360,279 $1,950,550 $1,474,790 $3,425,340 $65,061 1.9%
822150 Harper Woods City Wayne $1,230,022 $310,574 $11,502 $1,552,098 $1,250,474 $329,484 $1,579,958 $27,860 1.8%
822160 Highland Park City Wayne $1,017,472 $1,636,276 $9,514 $2,663,262 $1,034,390 $1,683,643 $2,718,033 $54,771 2.1%
822170 Inkster City Wayne $2,191,938 $1,432,062 $20,496 $3,644,496 $2,228,384 $1,485,967 $3,714,351 $69,855 1.9%
822180 Lincoln Park City Wayne $3,295,726 $1,495,717 $30,818 $4,822,261 $3,350,526 $1,561,645 $4,912,171 $89,910 1.9%
822190 Livonia City Wayne $8,376,003 $883,311 $78,322 $9,337,636 $8,515,278 $983,751 $9,499,029 $161,393 1.7%
822200 Melvindale City Wayne $925,799 $580,198 $8,657 $1,514,654 $941,193 $602,399 $1,543,592 $28,938 1.9%
822210 Northville City Wayne $236,655 $64,960 $4,823 $306,438 $240,590 $71,388 $311,978 $5,540 1.8%
822220 Plymouth City Wayne $789,025 $121,620 $7,378 $918,023 $802,144 $131,965 $934,109 $16,086 1.8%
822230 River Rouge City Wayne $682,836 $512,495 $6,385 $1,201,716 $694,190 $530,814 $1,225,004 $23,288 1.9%
822240 Riverview City Wayne $1,078,817 $184,305 $10,088 $1,273,210 $1,096,756 $198,864 $1,295,620 $22,410 1.8%
822250 Rockwood City Wayne $284,177 $49,582 $2,657 $336,416 $288,902 $53,440 $342,342 $5,926 1.8%
822260 Romulus City Wayne $2,072,702 $309,747 $19,381 $2,401,830 $2,107,167 $336,698 $2,443,865 $42,035 1.8%
822270 Southgate City Wayne $2,596,127 $596,749 $24,276 $3,217,152 $2,639,295 $635,309 $3,274,604 $57,452 1.8%
822280 Taylor City Wayne $5,454,658 $1,982,386 $51,005 $7,488,049 $5,545,357 $2,080,159 $7,625,516 $137,467 1.8%
822290 Trenton City Wayne $1,628,941 $487,416 $15,232 $2,131,589 $1,656,026 $514,209 $2,170,235 $38,646 1.8%
September 30, 2019 FY 2019 Actuals and FY 2020 Projected - 2019 P.A. 56 - May Consensus Page 140 of 144
Prepared by the Revenue Sharing and Grants Division, Michigan Department of Treasury
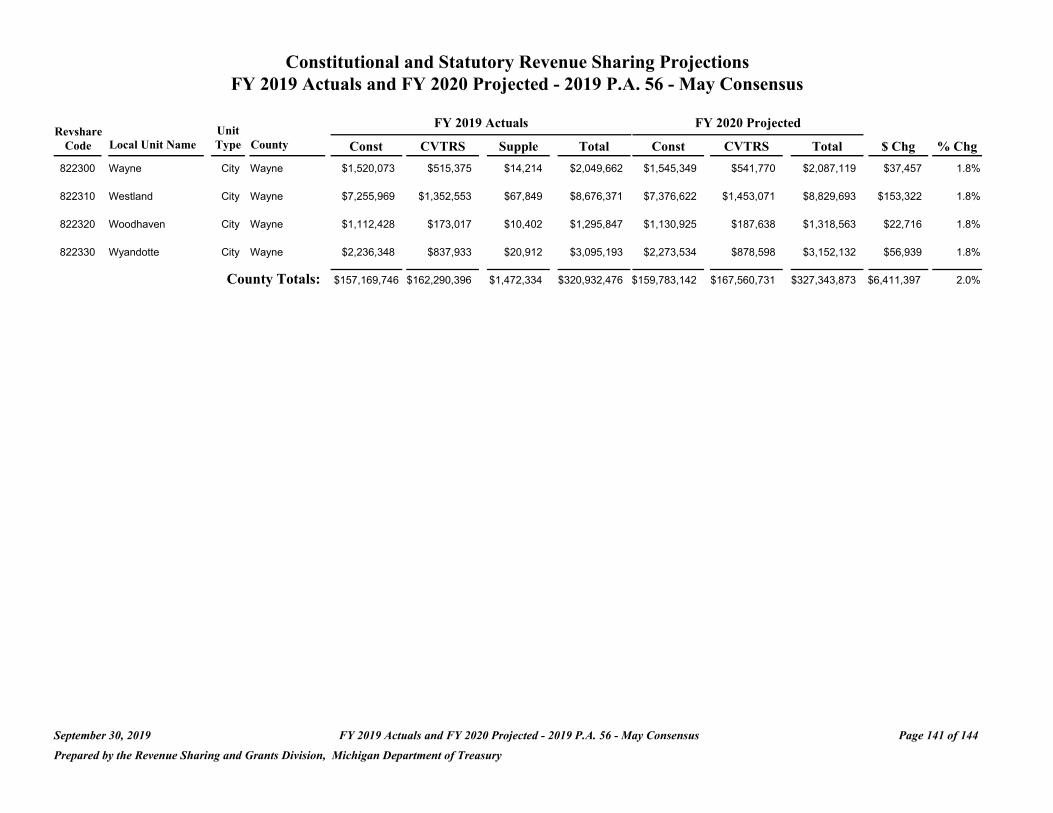
Constitutional and Statutory Revenue Sharing Projections FY 2019 Actuals and FY 2020 Projected - 2019 P.A. 56 - May Consensus
Revshare Code Local Unit Name
822300 Wayne
Unit Type County
City Wayne
Const $1,520,073
FY 2019 Actuals
CVTRS Supple
$515,375 $14,214
Total $2,049,662
FY 2020 Projected
Const CVTRS Total $1,545,349 $541,770 $2,087,119
$ Chg
$37,457
% Chg
1.8%
822310 Westland City Wayne $7,255,969 $1,352,553 $67,849 $8,676,371 $7,376,622 $1,453,071 $8,829,693 $153,322 1.8%
822320 Woodhaven City Wayne $1,112,428 $173,017 $10,402 $1,295,847 $1,130,925 $187,638 $1,318,563 $22,716 1.8%
822330 Wyandotte City Wayne $2,236,348 $837,933 $20,912 $3,095,193 $2,273,534 $878,598 $3,152,132 $56,939 1.8%
County Totals: $157,169,746 $162,290,396 $1,472,334 $320,932,476 $159,783,142 $167,560,731 $327,343,873 $6,411,397 2.0%
September 30, 2019 FY 2019 Actuals and FY 2020 Projected - 2019 P.A. 56 - May Consensus Page 141 of 144
Prepared by the Revenue Sharing and Grants Division, Michigan Department of Treasury
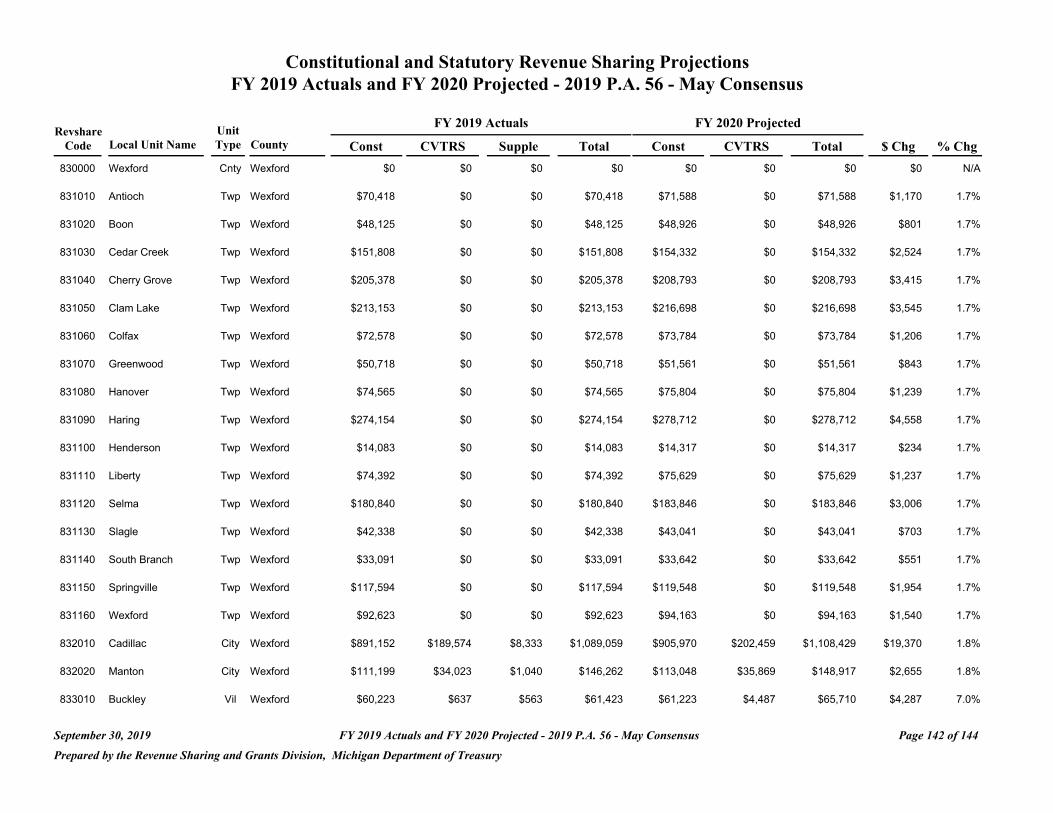
Constitutional and Statutory Revenue Sharing Projections FY 2019 Actuals and FY 2020 Projected - 2019 P.A. 56 - May Consensus
FY 2019 Actuals FY 2020 Projected Revshare Unit
Code Local Unit Name Type County Const CVTRS Supple Total Const CVTRS Total $ Chg % Chg
830000 Wexford Cnty Wexford $0 $0 $0 $0 $0 $0 $0 $0 N/A
831010 Antioch Twp Wexford $70,418 $0 $0 $70,418 $71,588 $0 $71,588 $1,170 1.7%
831020 Boon Twp Wexford $48,125 $0 $0 $48,125 $48,926 $0 $48,926 $801 1.7%
831030 Cedar Creek Twp Wexford $151,808 $0 $0 $151,808 $154,332 $0 $154,332 $2,524 1.7%
831040 Cherry Grove Twp Wexford $205,378 $0 $0 $205,378 $208,793 $0 $208,793 $3,415 1.7%
831050 Clam Lake Twp Wexford $213,153 $0 $0 $213,153 $216,698 $0 $216,698 $3,545 1.7%
831060 Colfax Twp Wexford $72,578 $0 $0 $72,578 $73,784 $0 $73,784 $1,206 1.7%
831070 Greenwood Twp Wexford $50,718 $0 $0 $50,718 $51,561 $0 $51,561 $843 1.7%
831080 Hanover Twp Wexford $74,565 $0 $0 $74,565 $75,804 $0 $75,804 $1,239 1.7%
831090 Haring Twp Wexford $274,154 $0 $0 $274,154 $278,712 $0 $278,712 $4,558 1.7%
831100 Henderson Twp Wexford $14,083 $0 $0 $14,083 $14,317 $0 $14,317 $234 1.7%
831110 Liberty Twp Wexford $74,392 $0 $0 $74,392 $75,629 $0 $75,629 $1,237 1.7%
831120 Selma Twp Wexford $180,840 $0 $0 $180,840 $183,846 $0 $183,846 $3,006 1.7%
831130 Slagle Twp Wexford $42,338 $0 $0 $42,338 $43,041 $0 $43,041 $703 1.7%
831140 South Branch Twp Wexford $33,091 $0 $0 $33,091 $33,642 $0 $33,642 $551 1.7%
831150 Springville Twp Wexford $117,594 $0 $0 $117,594 $119,548 $0 $119,548 $1,954 1.7%
831160 Wexford Twp Wexford $92,623 $0 $0 $92,623 $94,163 $0 $94,163 $1,540 1.7%
832010 Cadillac City Wexford $891,152 $189,574 $8,333 $1,089,059 $905,970 $202,459 $1,108,429 $19,370 1.8%
832020 Manton City Wexford $111,199 $34,023 $1,040 $146,262 $113,048 $35,869 $148,917 $2,655 1.8%
833010 Buckley Vil Wexford $60,223 $637 $563 $61,423 $61,223 $4,487 $65,710 $4,287 7.0%
September 30, 2019 FY 2019 Actuals and FY 2020 Projected - 2019 P.A. 56 - May Consensus Page 142 of 144
Prepared by the Revenue Sharing and Grants Division, Michigan Department of Treasury
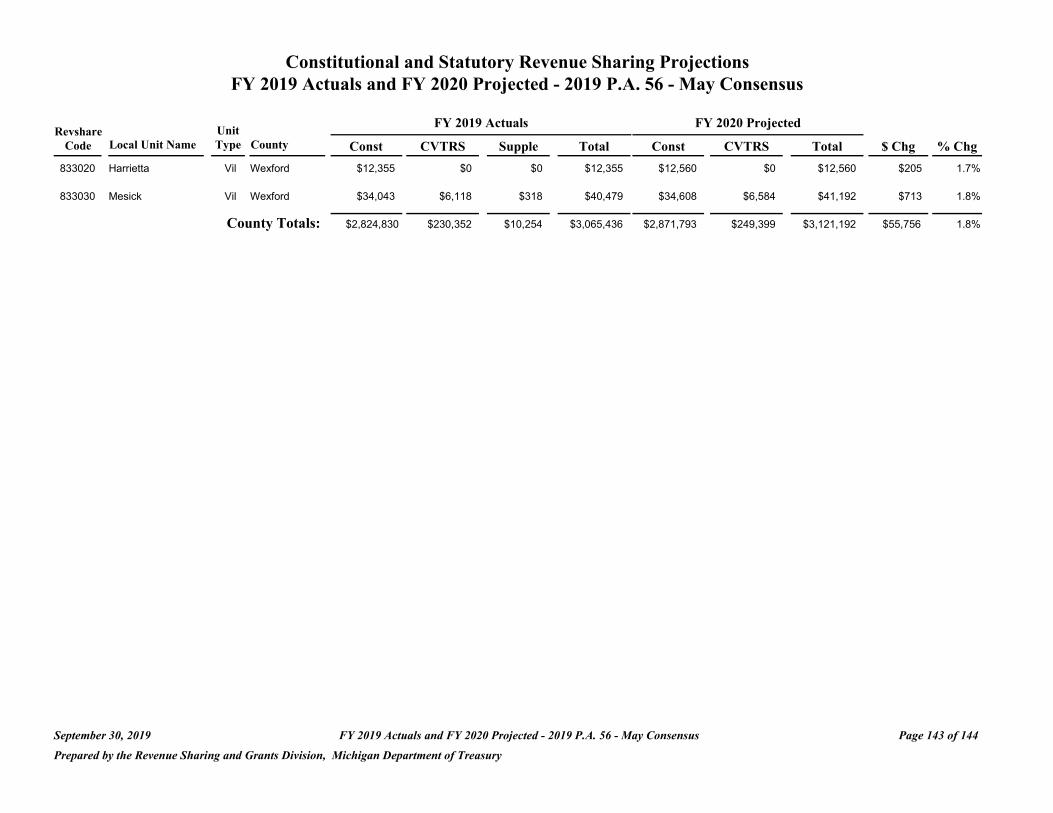
Constitutional and Statutory Revenue Sharing Projections FY 2019 Actuals and FY 2020 Projected - 2019 P.A. 56 - May Consensus
Revshare Code Local Unit Name
833020 Harrietta
Unit Type County
Vil Wexford
Const $12,355
FY 2019 Actuals
CVTRS Supple
$0 $0
Total $12,355
FY 2020 Projected
Const CVTRS
$12,560 $0
Total $12,560
$ Chg
$205
% Chg
1.7%
833030 Mesick Vil Wexford $34,043 $6,118 $318 $40,479 $34,608 $6,584 $41,192 $713 1.8%
County Totals: $2,824,830 $230,352 $10,254 $3,065,436 $2,871,793 $249,399 $3,121,192 $55,756 1.8%
September 30, 2019 FY 2019 Actuals and FY 2020 Projected - 2019 P.A. 56 - May Consensus Page 143 of 144
Prepared by the Revenue Sharing and Grants Division, Michigan Department of Treasury
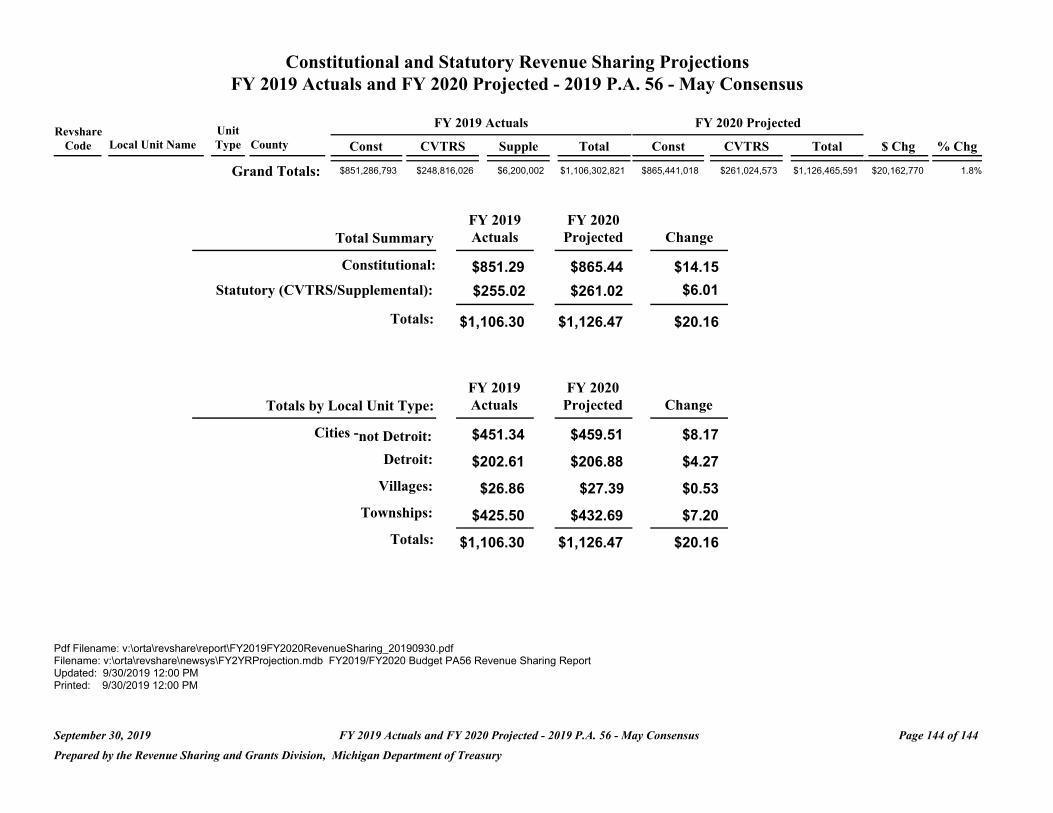
Constitutional and Statutory Revenue Sharing Projections FY 2019 Actuals and FY 2020 Projected - 2019 P.A. 56 - May Consensus
FY 2019 Actuals FY 2020 Projected Revshare Unit
Code Local Unit Name Type County Const CVTRS Supple Total Const CVTRS Total $ Chg % Chg
Grand Totals: $851,286,793 $248,816,026 $6,200,002 $1,106,302,821 $865,441,018 $261,024,573 $1,126,465,591 $20,162,770 1.8%
Total Summary FY 2019 Actuals
FY 2020 Projected Change
Constitutional: $851.29 $865.44 $14.15
$255.02 $261.02 $6.01
Totals: $1,106.30 $1,126.47 $20.16
Totals bFY 2019 Actuals
FY 2020 Projected Change y Local Unit Type:
Cities -not Detroit: $451.34 $459.51 $8.17
Detroit: $202.61 $206.88 $4.27
Villages: $26.86 $27.39 $0.53
Townships: $425.50 $432.69 $7.20
Totals: $1,106.30 $1,126.47 $20.16
Statutory (CVTRS/Supplemental):
Pdf Filename: v:\orta\revshare\report\FY2019FY2020RevenueSharing_20190930.pdf Filename: v:\orta\revshare\newsys\FY2YRProjection.mdb FY2019/FY2020 Budget PA56 Revenue Sharing Report Updated: 9/30/2019 12:00 PM Printed: 9/30/2019 12:00 PM
September 30, 2019 FY 2019 Actuals and FY 2020 Projected - 2019 P.A. 56 - May Consensus Page 144 of 144
Prepared by the Revenue Sharing and Grants Division, Michigan Department of Treasury