Embed Size (px)
Citation preview
FISCAL YEAR 2022
CLASSIFICATION HEARING
November 30, 2021
Select Board Jennifer Roberts, Chair
Charles Russo, Vice Chair Members
Daniel E. Carty Janie W. Dretler
William Schineller
Board of Assessors Trevor Haydon, Chair
Joshua M. Fox Liam J. Vesely
Harald Scheid Consulting Assessor & Jonathan H. Frank, MAI Cynthia Gerry, Director of Assessing
1 Fiscal Year 2022 Classification Hearing
Introduction
Each year, prior to the mailing of 3rd quarter tax bills, a public hearing is held by the Select Board in conjunction with the Board of Assessors. The public hearing known as the Classification Hearing provides an opportunity for the Select Board to discuss and decide on the distribution of the tax burden to be allocated among the major classes of property. Chapter 40, Section 56 of the Massachusetts General Laws, dictates the hearing procedure. Prior to the Hearing, all properties must be assessed at their full and fair cash value as of the January 1st assessment date. The Fiscal Year 2022 assessment date is January 1, 2021. The steps necessary to complete the Classification Hearing and Tax Rate Setting process are defined below:
Pre-classification Hearing Steps Step 1: Determination of the property tax levy (Budget Process) Step 2: Determine assessed valuations (Assessors) Step 3: Tabulate assessed valuations by class (Assessors) Step 4: Obtain DOR value certification (Assessors) Step 5: Obtain certification of new growth revenues (Assessors)
Classification Hearing Steps Step 6: Classification hearing presentation (Assessors & Select Board) Step 7: Review and discuss tax shift options (Select Board) Step 8: Voting a tax shift factor (Select Board)
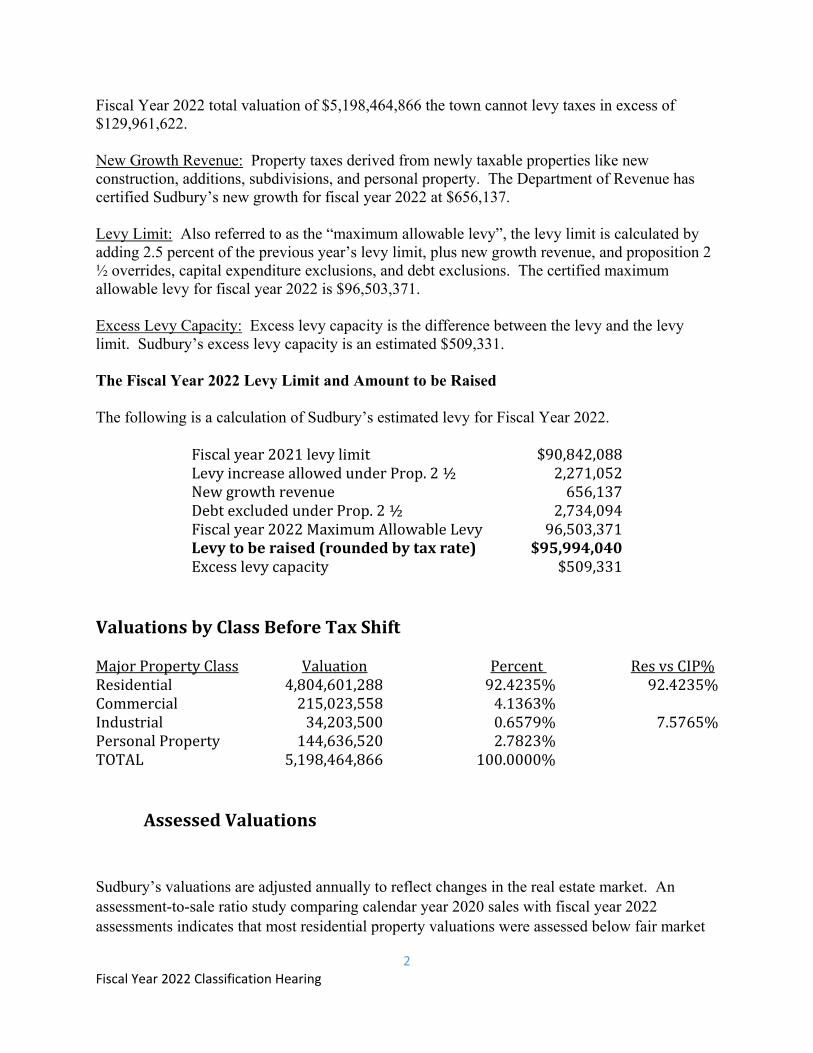
Post Classification Hearing Steps Step 9: Sign the LA-5 Classification Form (Select Board) Step 10: Send annual recap to DOR for tax rate approval (Assessors) Step 11: Obtain DOR approval of tax rates (DOR) Terminology The following represents frequently used tax discussion terminology: Levy: The tax levy (or levy) is the amount of property taxes to be raised. The levy amount is determined by the budget process. The total amount of the approved budget less revenues from other sources like motor vehicle excise, municipal fees, and state aid is the amount to be raised through property taxation. In Sudbury, for Fiscal Year 2022, the levy to be raised is $95,994,040. This represents a 3.8% increase over last year’s levy of $92,441,614. Levy Ceiling: The levy ceiling is 2.5 percent of the full value of the town and represents the maximum property tax revenue that can be raised under Proposition 2 ½. Based on Sudbury’s
2 Fiscal Year 2022 Classification Hearing
Fiscal Year 2022 total valuation of $5,198,464,866 the town cannot levy taxes in excess of $129,961,622. New Growth Revenue: Property taxes derived from newly taxable properties like new construction, additions, subdivisions, and personal property. The Department of Revenue has certified Sudbury’s new growth for fiscal year 2022 at $656,137. Levy Limit: Also referred to as the “maximum allowable levy”, the levy limit is calculated by adding 2.5 percent of the previous year’s levy limit, plus new growth revenue, and proposition 2 ½ overrides, capital expenditure exclusions, and debt exclusions. The certified maximum allowable levy for fiscal year 2022 is $96,503,371. Excess Levy Capacity: Excess levy capacity is the difference between the levy and the levy limit. Sudbury’s excess levy capacity is an estimated $509,331. The Fiscal Year 2022 Levy Limit and Amount to be Raised The following is a calculation of Sudbury’s estimated levy for Fiscal Year 2022. Fiscal year 2021 levy limit $90,842,088 Levy increase allowed under Prop. 2 ½ 2,271,052 New growth revenue 656,137 Debt excluded under Prop. 2 ½ 2,734,094 Fiscal year 2022 Maximum Allowable Levy 96,503,371 Levytoberaised(roundedbytaxrate) $95,994,040 Excess levy capacity $509,331 ValuationsbyClassBeforeTaxShift Major Property Class Valuation Percent Res vs CIP% Residential 4,804,601,288 92.4235% 92.4235% Commercial 215,023,558 4.1363% Industrial 34,203,500 0.6579% 7.5765% Personal Property 144,636,520 2.7823% TOTAL 5,198,464,866 100.0000% AssessedValuations
Sudbury’s valuations are adjusted annually to reflect changes in the real estate market. An assessment-to-sale ratio study comparing calendar year 2020 sales with fiscal year 2022 assessments indicates that most residential property valuations were assessed below fair market
3 Fiscal Year 2022 Classification Hearing
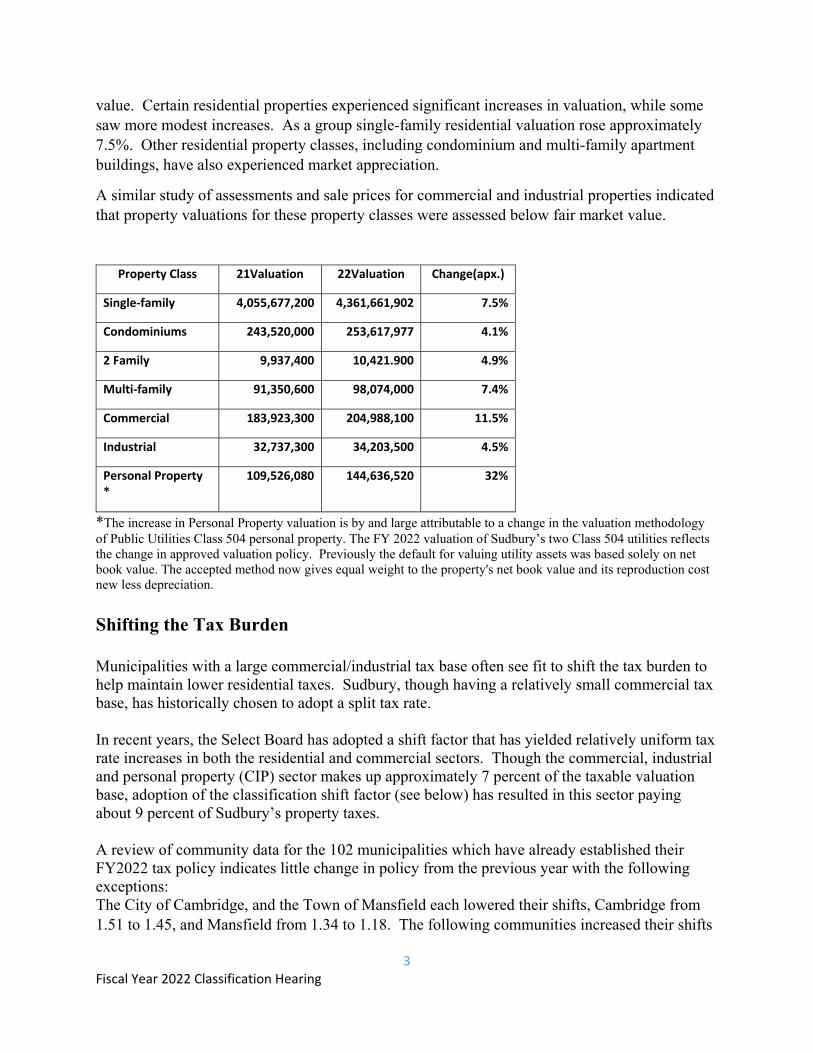
value. Certain residential properties experienced significant increases in valuation, while some saw more modest increases. As a group single-family residential valuation rose approximately 7.5%. Other residential property classes, including condominium and multi-family apartment buildings, have also experienced market appreciation.
A similar study of assessments and sale prices for commercial and industrial properties indicated that property valuations for these property classes were assessed below fair market value.
Property Class 21Valuation 22Valuation Change(apx.)
Single‐family 4,055,677,200 4,361,661,902 7.5%
Condominiums 243,520,000 253,617,977 4.1%
2 Family 9,937,400 10,421.900 4.9%
Multi‐family 91,350,600 98,074,000 7.4%
Commercial 183,923,300 204,988,100 11.5%
Industrial 32,737,300 34,203,500 4.5%
Personal Property *
109,526,080 144,636,520 32%
*The increase in Personal Property valuation is by and large attributable to a change in the valuation methodology of Public Utilities Class 504 personal property. The FY 2022 valuation of Sudbury’s two Class 504 utilities reflects the change in approved valuation policy. Previously the default for valuing utility assets was based solely on net book value. The accepted method now gives equal weight to the property's net book value and its reproduction cost new less depreciation.
Shifting the Tax Burden Municipalities with a large commercial/industrial tax base often see fit to shift the tax burden to help maintain lower residential taxes. Sudbury, though having a relatively small commercial tax base, has historically chosen to adopt a split tax rate. In recent years, the Select Board has adopted a shift factor that has yielded relatively uniform tax rate increases in both the residential and commercial sectors. Though the commercial, industrial and personal property (CIP) sector makes up approximately 7 percent of the taxable valuation base, adoption of the classification shift factor (see below) has resulted in this sector paying about 9 percent of Sudbury’s property taxes. A review of community data for the 102 municipalities which have already established their FY2022 tax policy indicates little change in policy from the previous year with the following exceptions: The City of Cambridge, and the Town of Mansfield each lowered their shifts, Cambridge from 1.51 to 1.45, and Mansfield from 1.34 to 1.18. The following communities increased their shifts
4 Fiscal Year 2022 Classification Hearing
this year: Adams, Attleboro, Avon, Berlin, Chicopee, Fall River, Hadley, Lincoln, Lynnfield, Newton, North Andover, North Attleborough, Reading, Rowe, Seekonk and West Bridgewater. SeeAddendumEforfulllist.
5 Fiscal Year 2022 Classification Hearing
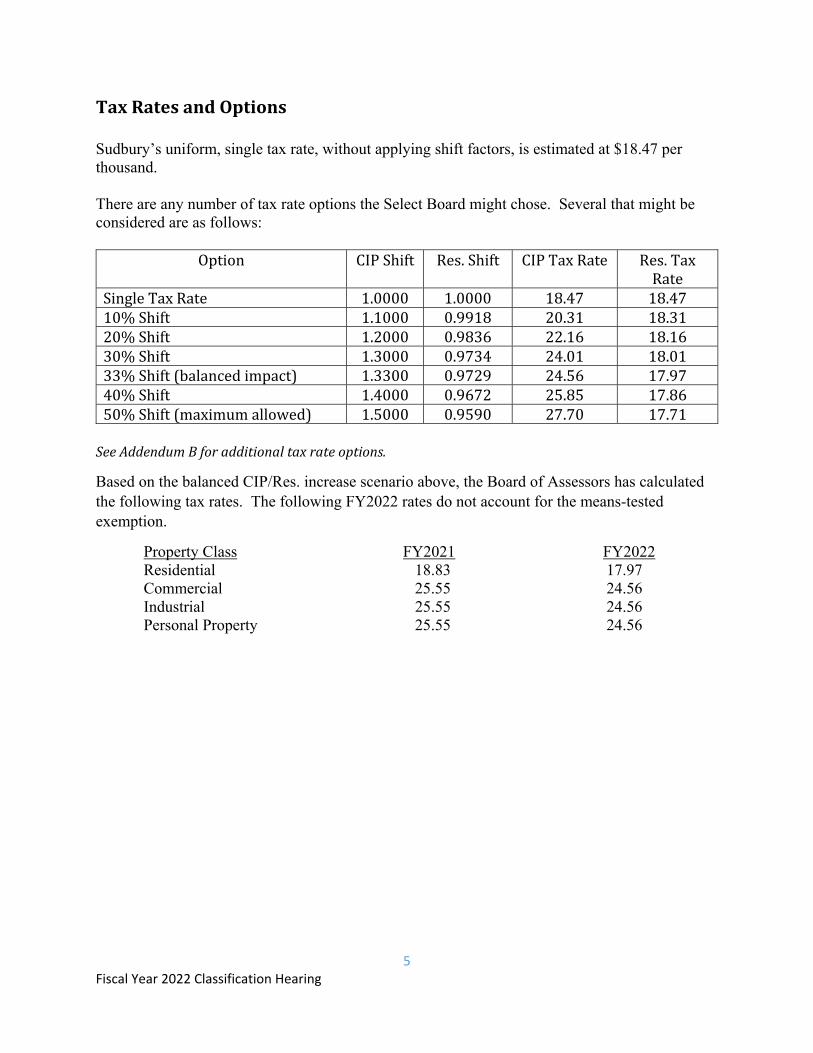
TaxRatesandOptionsSudbury’s uniform, single tax rate, without applying shift factors, is estimated at $18.47 per thousand. There are any number of tax rate options the Select Board might chose. Several that might be considered are as follows:
Option CIP Shift Res. Shift CIP Tax Rate Res. Tax Rate
Single Tax Rate 1.0000 1.0000 18.47 18.47 10% Shift 1.1000 0.9918 20.31 18.31 20% Shift 1.2000 0.9836 22.16 18.16 30% Shift 1.3000 0.9734 24.01 18.01 33% Shift (balanced impact) 1.3300 0.9729 24.56 17.97 40% Shift 1.4000 0.9672 25.85 17.86 50% Shift (maximum allowed) 1.5000 0.9590 27.70 17.71
SeeAddendumBforadditionaltaxrateoptions.
Based on the balanced CIP/Res. increase scenario above, the Board of Assessors has calculated the following tax rates. The following FY2022 rates do not account for the means-tested exemption.
Property Class FY2021 FY2022 Residential 18.83 17.97 Commercial 25.55 24.56 Industrial 25.55 24.56 Personal Property 25.55 24.56
6 Fiscal Year 2022 Classification Hearing
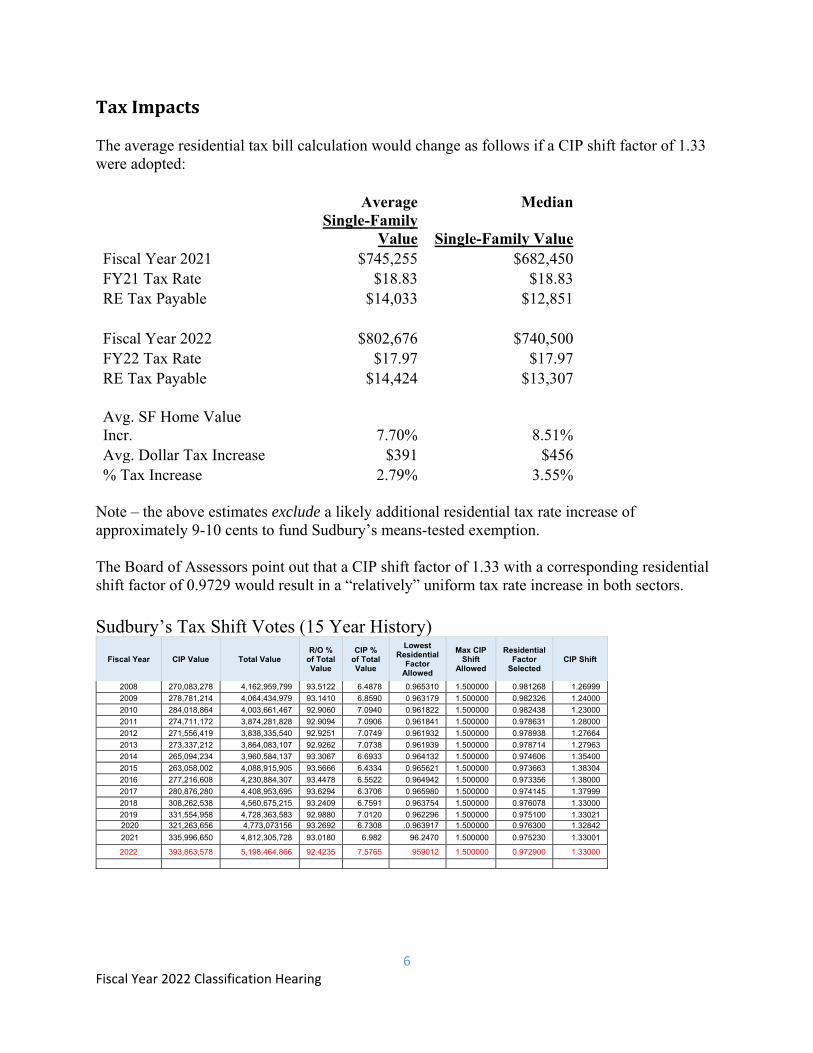
TaxImpacts The average residential tax bill calculation would change as follows if a CIP shift factor of 1.33 were adopted:
Average Median
Single-Family
Value Single-Family Value Fiscal Year 2021 $745,255 $682,450 FY21 Tax Rate $18.83 $18.83 RE Tax Payable $14,033 $12,851
Fiscal Year 2022 $802,676 $740,500 FY22 Tax Rate $17.97 $17.97 RE Tax Payable $14,424 $13,307
Avg. SF Home Value Incr. 7.70% 8.51% Avg. Dollar Tax Increase $391 $456 % Tax Increase 2.79% 3.55%
Note – the above estimates exclude a likely additional residential tax rate increase of approximately 9-10 cents to fund Sudbury’s means-tested exemption. The Board of Assessors point out that a CIP shift factor of 1.33 with a corresponding residential shift factor of 0.9729 would result in a “relatively” uniform tax rate increase in both sectors. Sudbury’s Tax Shift Votes (15 Year History)
Fiscal Year CIP Value Total Value R/O %
of Total Value
CIP % of Total Value
Lowest Residential
Factor Allowed
Max CIP Shift
Allowed
Residential Factor
Selected CIP Shift
2008 270,083,278 4,162,959,799 93.5122 6.4878 0.965310 1.500000 0.981268 1.26999
2009 278,781,214 4,064,434,979 93.1410 6.8590 0.963179 1.500000 0.982326 1.24000
2010 284,018,864 4,003,661,467 92.9060 7.0940 0.961822 1.500000 0.982438 1.23000
2011 274,711,172 3,874,281,828 92.9094 7.0906 0.961841 1.500000 0.978631 1.28000
2012 271,556,419 3,838,335,540 92.9251 7.0749 0.961932 1.500000 0.978938 1.27664
2013 273,337,212 3,864,083,107 92.9262 7.0738 0.961939 1.500000 0.978714 1.27963
2014 265,094,234 3,960,584,137 93.3067 6.6933 0.964132 1.500000 0.974606 1.35400
2015 263,058,002 4,088,915,905 93.5666 6.4334 0.965621 1.500000 0.973663 1.38304
2016 277,216,608 4,230,884,307 93.4478 6.5522 0.964942 1.500000 0.973356 1.38000
2017 280,876,280 4,408,953,695 93.6294 6.3706 0.965980 1.500000 0.974145 1.37999
2018 308,262,538 4,560,675,215 93.2409 6.7591 0.963754 1.500000 0.976078 1.33000
2019 331,554,958 4,728,363,583 92.9880 7.0120 0.962296 1.500000 0.975100 1.33021 2020 321,263,656 4,773,073156 93.2692 6.7308 .0.963917 1.500000 0.976300 1.32842
2021 335,996,650 4,812,305,728 93.0180 6.982 96.2470 1.500000 0.975230 1.33001
2022 393,863,578 5,198,464,866 92.4235 7.5765 .959012 1.500000 0.972900 1.33000
7 Fiscal Year 2022 Classification Hearing
Voting a Tax Shift Factor If the Select Board were to balance the impact of the tax increase equally between CIP and Residential, the Board would vote as follows: The Select Board of Sudbury votes in accordance with M.G.L., Ch. 40, Sec. 56, as amended, the percentage of local tax levy which will be borne by each class of real and personal property, relative to setting the Fiscal Year 2022 tax rates and sets the Residential Factor at 0.9729, (or other selected Factor) with a corresponding CIP shift of 1.33 (or other corresponding CIP shift), pending certification of the Town’s annual tax recap by the Massachusetts Department of Revenue. OptionalExemptions:
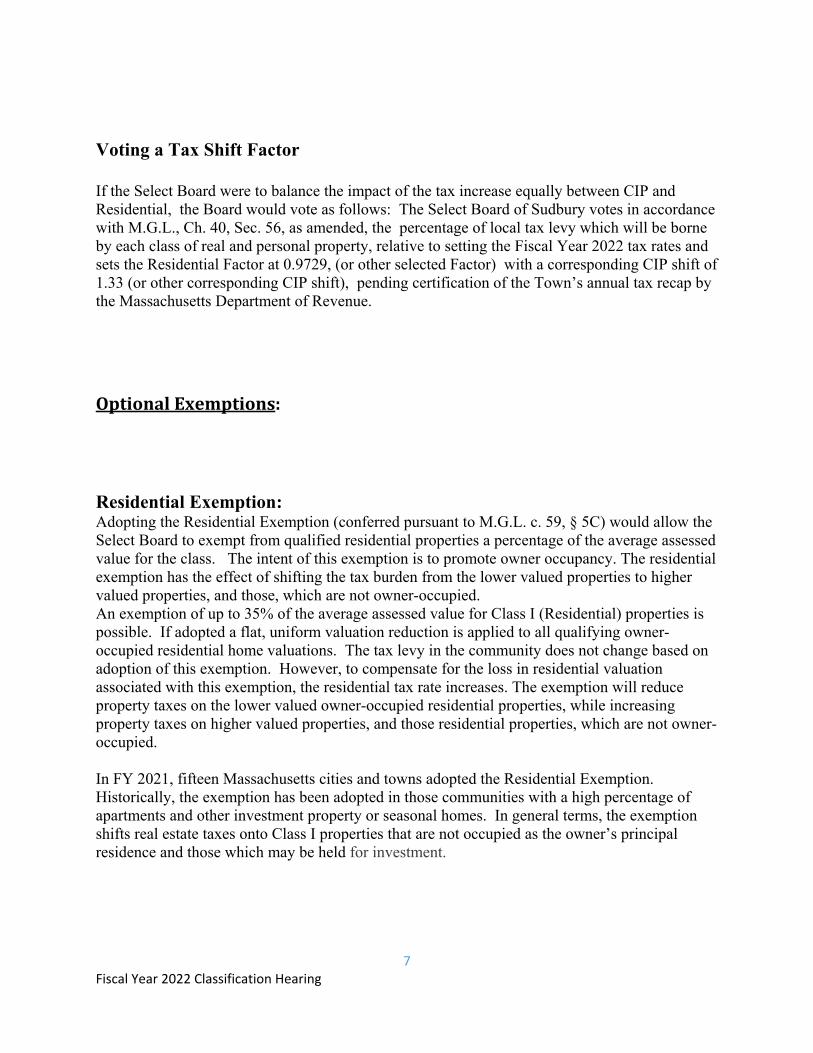
Residential Exemption: Adopting the Residential Exemption (conferred pursuant to M.G.L. c. 59, § 5C) would allow the Select Board to exempt from qualified residential properties a percentage of the average assessed value for the class. The intent of this exemption is to promote owner occupancy. The residential exemption has the effect of shifting the tax burden from the lower valued properties to higher valued properties, and those, which are not owner-occupied. An exemption of up to 35% of the average assessed value for Class I (Residential) properties is possible. If adopted a flat, uniform valuation reduction is applied to all qualifying owner-occupied residential home valuations. The tax levy in the community does not change based on adoption of this exemption. However, to compensate for the loss in residential valuation associated with this exemption, the residential tax rate increases. The exemption will reduce property taxes on the lower valued owner-occupied residential properties, while increasing property taxes on higher valued properties, and those residential properties, which are not owner-occupied. In FY 2021, fifteen Massachusetts cities and towns adopted the Residential Exemption. Historically, the exemption has been adopted in those communities with a high percentage of apartments and other investment property or seasonal homes. In general terms, the exemption shifts real estate taxes onto Class I properties that are not occupied as the owner’s principal residence and those which may be held for investment.
8 Fiscal Year 2022 Classification Hearing
Residential Exemption Communities
Boston 35%
Somerville 35%
Waltham 35%
Cambridge 30%
Chelsea 35%
Malden 30%
Everett 25%
Nantucket 25%
Provincetown 25%
Watertown 23%
Brookline 21%
Barnstable 20%
Truro 25%
Wellfleet 25%
Tisbury 18% Sudbury’s fiscal year 2022 data suggests 88% of Sudbury’s homeowners could potentially meet the basic criteria for exemption this year.
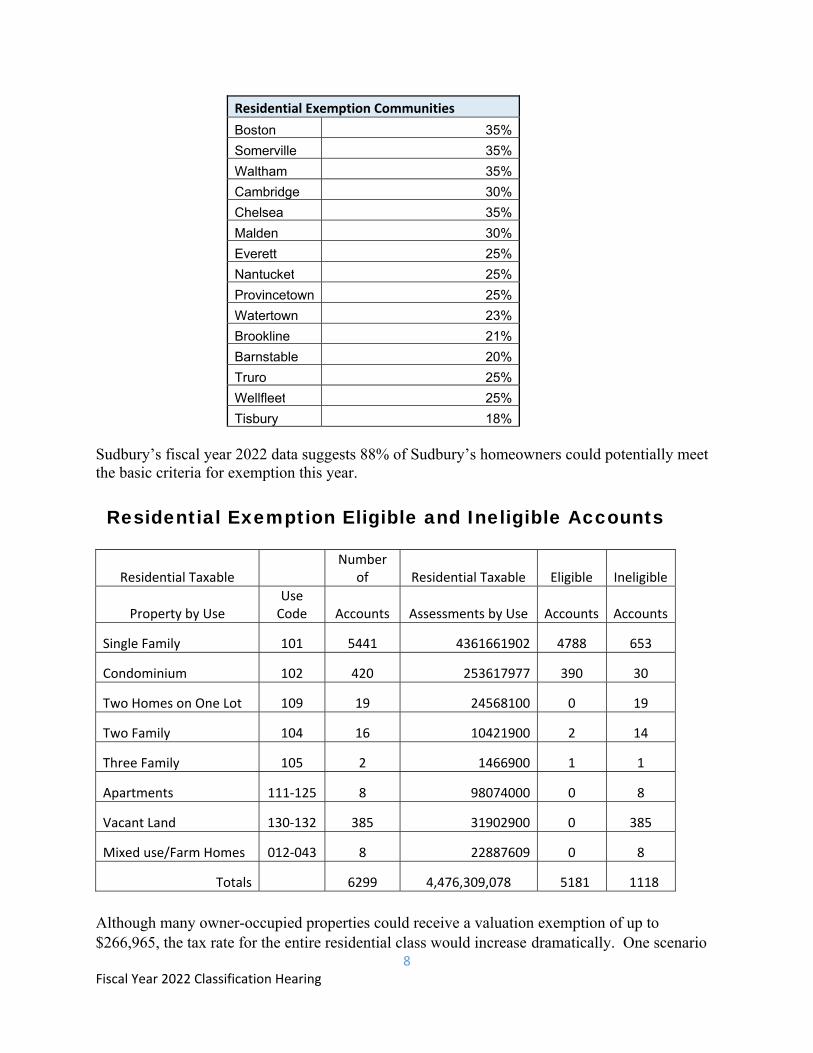
Residential Exemption Eligible and Ineligible Accounts
Residential Taxable Number
of Residential Taxable Eligible Ineligible
Property by Use Use Code Accounts Assessments by Use Accounts Accounts
Single Family 101 5441 4361661902 4788 653
Condominium 102 420 253617977 390 30
Two Homes on One Lot 109 19 24568100 0 19
Two Family 104 16 10421900 2 14
Three Family 105 2 1466900 1 1
Apartments 111‐125 8 98074000 0 8
Vacant Land 130‐132 385 31902900 0 385
Mixed use/Farm Homes 012‐043 8 22887609 0 8
Totals 6299 4,476,309,078 5181 1118
Although many owner-occupied properties could receive a valuation exemption of up to $266,965, the tax rate for the entire residential class would increase dramatically. One scenario
9 Fiscal Year 2022 Classification Hearing
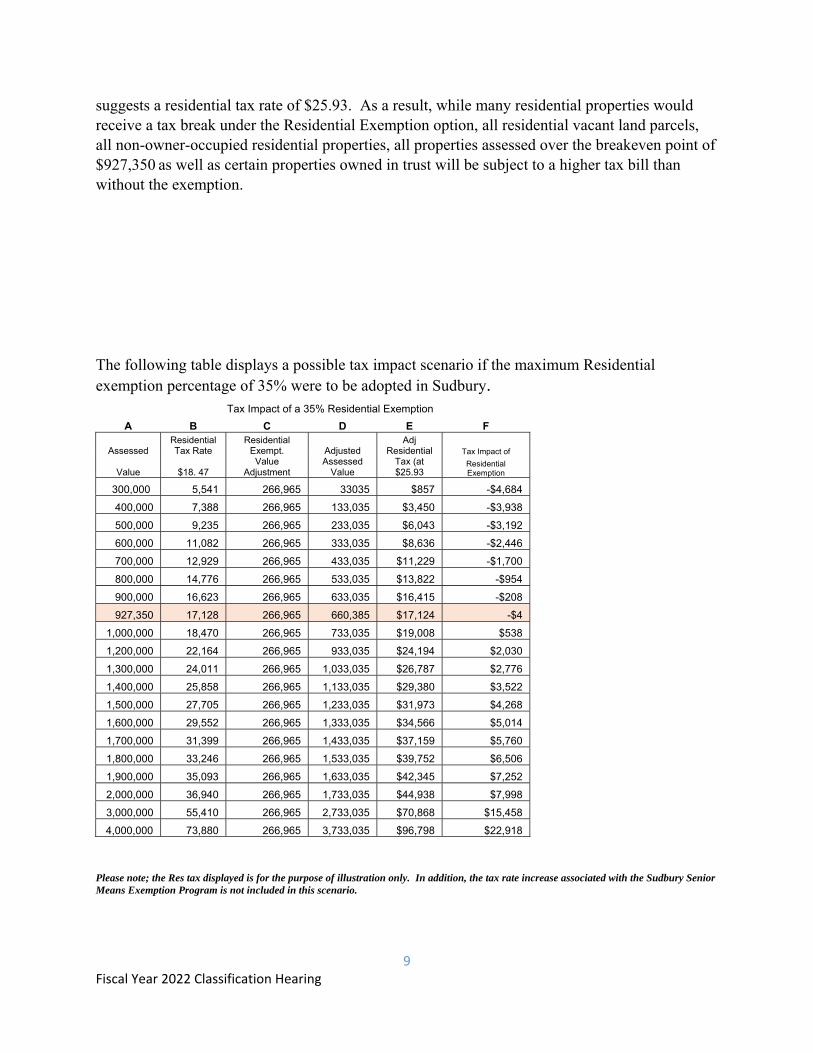
suggests a residential tax rate of $25.93. As a result, while many residential properties would receive a tax break under the Residential Exemption option, all residential vacant land parcels, all non-owner-occupied residential properties, all properties assessed over the breakeven point of $927,350 as well as certain properties owned in trust will be subject to a higher tax bill than without the exemption.
The following table displays a possible tax impact scenario if the maximum Residential exemption percentage of 35% were to be adopted in Sudbury.
Tax Impact of a 35% Residential Exemption
A B C D E F
Assessed Residential Tax Rate
Residential Exempt. Adjusted
Adj Residential Tax Impact of
Value $18. 47 Value
Adjustment Assessed
ValueTax (at $25.93
Residential Exemption
300,000 5,541 266,965 33035 $857 -$4,684
400,000 7,388 266,965 133,035 $3,450 -$3,938
500,000 9,235 266,965 233,035 $6,043 -$3,192
600,000 11,082 266,965 333,035 $8,636 -$2,446
700,000 12,929 266,965 433,035 $11,229 -$1,700
800,000 14,776 266,965 533,035 $13,822 -$954
900,000 16,623 266,965 633,035 $16,415 -$208
927,350 17,128 266,965 660,385 $17,124 -$4
1,000,000 18,470 266,965 733,035 $19,008 $538
1,200,000 22,164 266,965 933,035 $24,194 $2,030
1,300,000 24,011 266,965 1,033,035 $26,787 $2,776
1,400,000 25,858 266,965 1,133,035 $29,380 $3,522
1,500,000 27,705 266,965 1,233,035 $31,973 $4,268
1,600,000 29,552 266,965 1,333,035 $34,566 $5,014
1,700,000 31,399 266,965 1,433,035 $37,159 $5,760
1,800,000 33,246 266,965 1,533,035 $39,752 $6,506
1,900,000 35,093 266,965 1,633,035 $42,345 $7,252
2,000,000 36,940 266,965 1,733,035 $44,938 $7,998
3,000,000 55,410 266,965 2,733,035 $70,868 $15,458
4,000,000 73,880 266,965 3,733,035 $96,798 $22,918
Please note; the Res tax displayed is for the purpose of illustration only. In addition, the tax rate increase associated with the Sudbury Senior Means Exemption Program is not included in this scenario.
10 Fiscal Year 2022 Classification Hearing
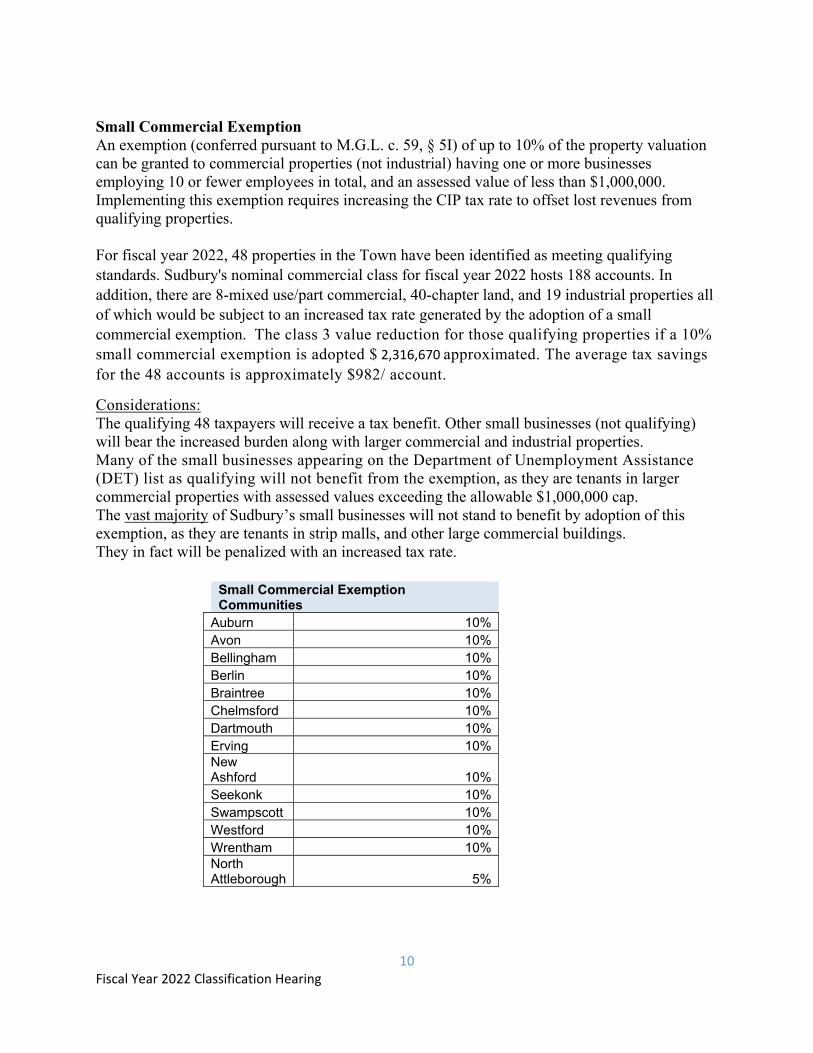
Small Commercial Exemption An exemption (conferred pursuant to M.G.L. c. 59, § 5I) of up to 10% of the property valuation can be granted to commercial properties (not industrial) having one or more businesses employing 10 or fewer employees in total, and an assessed value of less than $1,000,000. Implementing this exemption requires increasing the CIP tax rate to offset lost revenues from qualifying properties. For fiscal year 2022, 48 properties in the Town have been identified as meeting qualifying standards. Sudbury's nominal commercial class for fiscal year 2022 hosts 188 accounts. In addition, there are 8-mixed use/part commercial, 40-chapter land, and 19 industrial properties all of which would be subject to an increased tax rate generated by the adoption of a small commercial exemption. The class 3 value reduction for those qualifying properties if a 10% small commercial exemption is adopted $ 2,316,670 approximated. The average tax savings for the 48 accounts is approximately $982/ account.
Considerations: The qualifying 48 taxpayers will receive a tax benefit. Other small businesses (not qualifying) will bear the increased burden along with larger commercial and industrial properties. Many of the small businesses appearing on the Department of Unemployment Assistance (DET) list as qualifying will not benefit from the exemption, as they are tenants in larger commercial properties with assessed values exceeding the allowable $1,000,000 cap. The vast majority of Sudbury’s small businesses will not stand to benefit by adoption of this exemption, as they are tenants in strip malls, and other large commercial buildings. They in fact will be penalized with an increased tax rate.
Small Commercial Exemption Communities
Auburn 10%Avon 10%Bellingham 10%Berlin 10%Braintree 10%Chelmsford 10%Dartmouth 10%Erving 10%New Ashford 10%Seekonk 10%Swampscott 10%Westford 10%Wrentham 10%North Attleborough 5%
11 Fiscal Year 2022 Classification Hearing
Open Space Exemption In addition to the above-mentioned options, there is one more option, to discuss briefly, since this exemption is not applicable in Sudbury at this time. It is known as the Open Space Exemption. In order for a municipality to utilize an open space exemption, the community must first have adopted the Open Space Class. While most residential land is Class 1, there is an additional classification which may be created for some vacant land (Class 2). The definition of open space in this context is: land which is not otherwise classified and which is not taxable under provisions of chapters 61, 61A or 61B, or taxable under a permanent conservation restriction, and which land is not held for the production of income but is maintained in an open or natural condition and which contributes significantly to the benefit and enjoyment of the public. The Open Space Class was developed to provide a tax break to land owners, as incentive to preserve open land or at least slow development. Adopting this classification would result in a discount of the residential tax obligation of up to 25% for those parcels classified as open space. Any tax savings awarded to open space property owners will be subsidized by all other residential property owners. Commercial, Industrial, and Personal Property will not be affected. Sudbury currently has 62 parcels of land enrolled in the various chapter land programs. Chapter land enrollment carries certain program withdrawal restrictions which are described below. If a community were to adopt this open space classification, any property classified as open space (not enrolled in chapter land programs) would receive the benefit of the favorable tax structure without any of the restrictions associated with the existing chapter land programs. Implementation of the Open Space Classification would take up to a year following written request of the Select Board.
12 Fiscal Year 2022 Classification Hearing
Classified Land - Chapters 61, 61A and 61B
There are three “Chapter Land” programs available: Forestry (M.G.L. Chapter 61), Agriculture / Horticulture (M.G.L. Chapter 61A), and Recreation (M.G.L. Chapter 61B). Chapter 61 - Forestry Land is designed to encourage the preservation and enhancement of the Commonwealth’s forests. A parcel must consist of at least 10 contiguous acres of land under the same ownership and be managed under a 10-year management plan approved and certified by the State Forester in order to qualify for and retain classification as forest land under Chapter 61. Chapter 61A - Agricultural and Horticultural Land is designed to encourage the preservation of the Commonwealth's valuable farmland and promote active agricultural and horticultural land use. The property must consist of at least 5 contiguous acres of land under the same ownership and be "actively devoted" to agricultural or horticultural use in order to qualify for and retain classification as agricultural or horticultural land under Chapter 61A. An equal amount of contiguous non-productive land may also qualify for classification. For the land to be considered "actively devoted" to a farm use, it must have been farmed for the two years prior to the year of classification and must have produced a certain amount of sales. The minimum gross sales requirement is $500 for the first 5 acres of productive land being classified. Chapter 61B - Recreational Land is designed to encourage the preservation of the Commonwealth’s open space and promote recreational land uses. Property must consist of at least 5 contiguous acres of land under the same ownership in order to qualify for and retain classification as recreational land under Chapter 61B. The land must fall into one of the following two categories to qualify: It must be maintained in a substantially natural, wild or open condition or must be maintained in a landscaped condition permitting the preservation of wildlife and natural resources. It does not have to be open to the public, but can be held as private, undeveloped, open space land. Liens Once an initial application for classification has been approved, the local assessors will record a statement at the Registry of Deeds indicating that the land has been classified as forestry under Chapter 61, agricultural / horticultural land under Chapter 61A or recreational land under Chapter 61B. The statement will constitute a lien on the land for all taxes due under the respective chapters. Municipal Option to Purchase The city or town has an option to purchase any classified land whenever the owner plans to sell or convert it to a residential, commercial, or industrial use. The owner must notify by certified mail the selectmen, assessors, planning board and conservation commission of the town of any intention to sell or convert the land to those uses. If the owner plans to sell the land, the town has the right to match a bona fide offer to purchase it. If the owner plans to convert it, the city or town has the right to purchase it at its fair market value, which is determined by an impartial appraisal. The city or town may also assign its option to a non-profit, conservation organization. The owner cannot sell or convert the land until at least 120 days have passed since the mailing of the required notices or until the owner has been notified in writing that the option will not be exercised, whichever is earlier.
13 Fiscal Year 2022 Classification Hearing
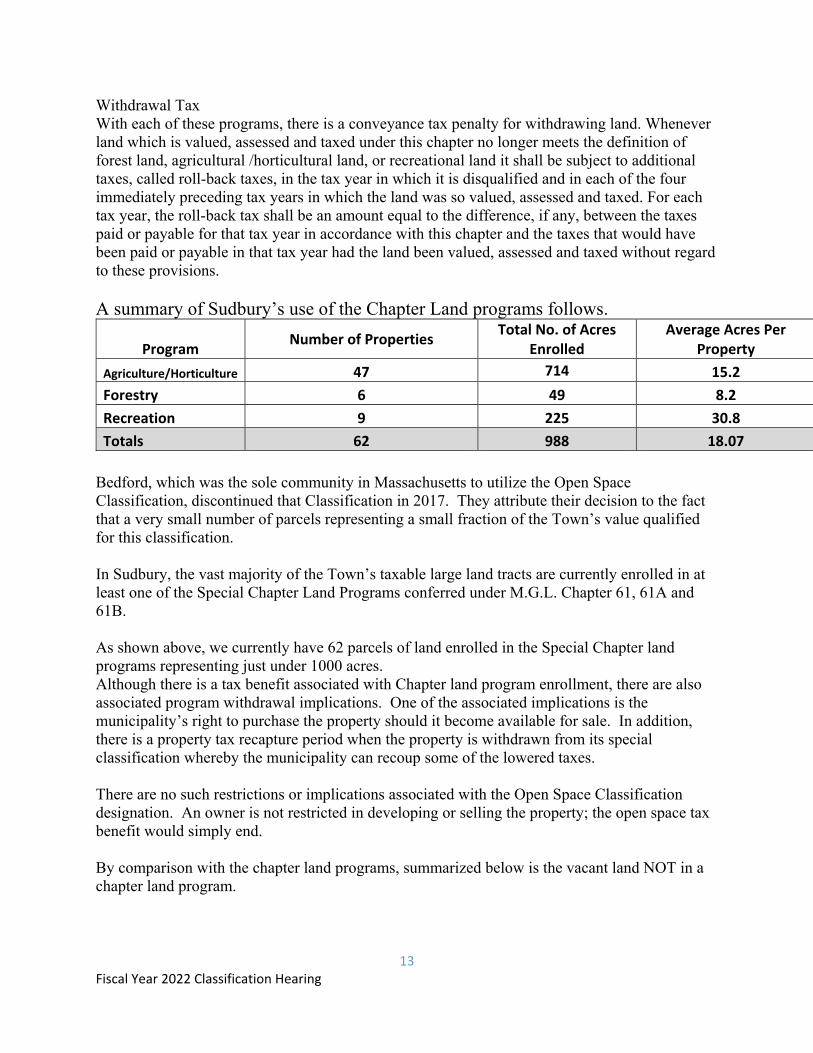
Withdrawal Tax With each of these programs, there is a conveyance tax penalty for withdrawing land. Whenever land which is valued, assessed and taxed under this chapter no longer meets the definition of forest land, agricultural /horticultural land, or recreational land it shall be subject to additional taxes, called roll-back taxes, in the tax year in which it is disqualified and in each of the four immediately preceding tax years in which the land was so valued, assessed and taxed. For each tax year, the roll-back tax shall be an amount equal to the difference, if any, between the taxes paid or payable for that tax year in accordance with this chapter and the taxes that would have been paid or payable in that tax year had the land been valued, assessed and taxed without regard to these provisions. A summary of Sudbury’s use of the Chapter Land programs follows.
Program Number of Properties
Total No. of Acres Enrolled
Average Acres Per Property
Agriculture/Horticulture 47 714 15.2
Forestry 6 49 8.2
Recreation 9 225 30.8
Totals 62 988 18.07
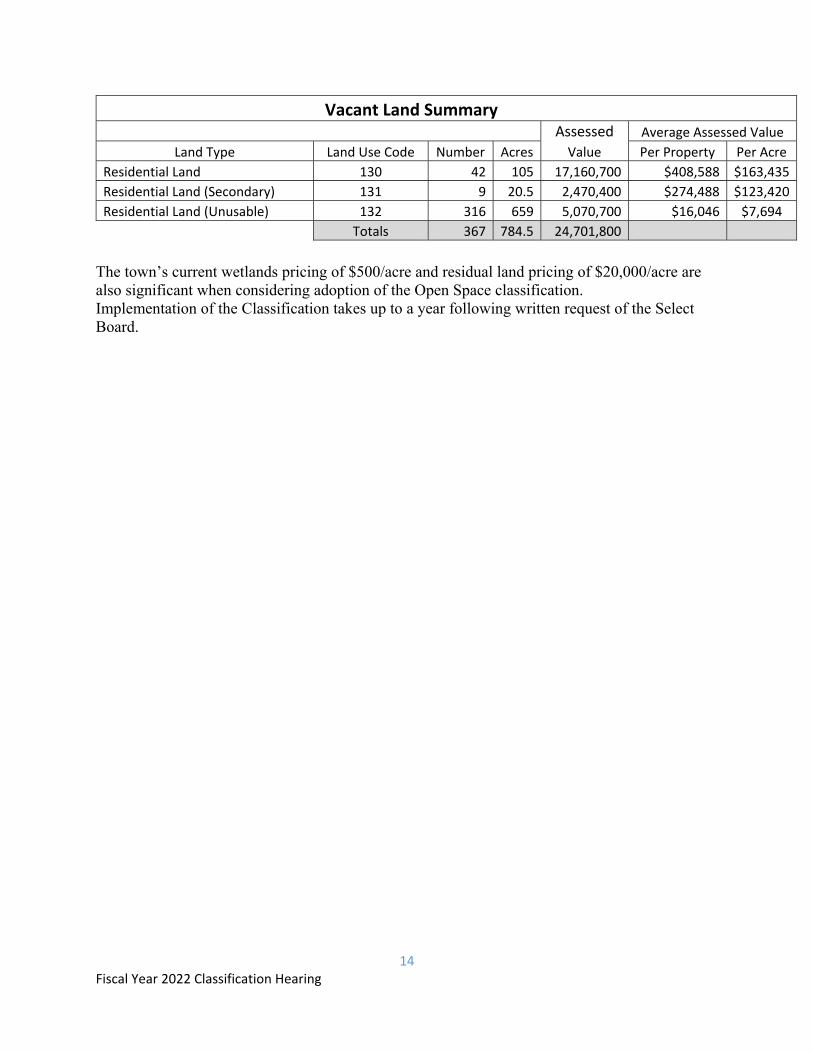
Bedford, which was the sole community in Massachusetts to utilize the Open Space Classification, discontinued that Classification in 2017. They attribute their decision to the fact that a very small number of parcels representing a small fraction of the Town’s value qualified for this classification. In Sudbury, the vast majority of the Town’s taxable large land tracts are currently enrolled in at least one of the Special Chapter Land Programs conferred under M.G.L. Chapter 61, 61A and 61B. As shown above, we currently have 62 parcels of land enrolled in the Special Chapter land programs representing just under 1000 acres. Although there is a tax benefit associated with Chapter land program enrollment, there are also associated program withdrawal implications. One of the associated implications is the municipality’s right to purchase the property should it become available for sale. In addition, there is a property tax recapture period when the property is withdrawn from its special classification whereby the municipality can recoup some of the lowered taxes. There are no such restrictions or implications associated with the Open Space Classification designation. An owner is not restricted in developing or selling the property; the open space tax benefit would simply end. By comparison with the chapter land programs, summarized below is the vacant land NOT in a chapter land program.
14 Fiscal Year 2022 Classification Hearing
Vacant Land Summary
Assessed Average Assessed Value
Land Type Land Use Code Number Acres Value Per Property Per Acre
Residential Land 130 42 105 17,160,700 $408,588 $163,435
Residential Land (Secondary) 131 9 20.5 2,470,400 $274,488 $123,420
Residential Land (Unusable) 132 316 659 5,070,700 $16,046 $7,694
Totals 367 784.5 24,701,800
The town’s current wetlands pricing of $500/acre and residual land pricing of $20,000/acre are also significant when considering adoption of the Open Space classification. Implementation of the Classification takes up to a year following written request of the Select Board.
15 Fiscal Year 2022 Classification Hearing
VOTING THE EXEMPTIONS Example Motions/Vote(s): Residential and Small Commercial Exemption Options: This language including negative and affirmative options speaks to the Residential Exemption: Motion: [Not] to adopt a Residential Exemption for Fiscal Year 2022, or Motion: [To] adopt a Residential Exemption for Fiscal Year 2022 of ____% of the Average of all Residential Value for those eligible residential properties, which will shift the burden within the Residential Class. This language including negative and affirmative options speaks to the Small Commercial: Motion: [Not] adopt the Small Commercial Exemption for Fiscal Year 2022, or Motion: [To] adopt the Small Commercial Exemption for Fiscal Year 2022 business (as) on the DET list valued at less than $1 million, which will shift the burden within the Commercial & Industrial Classes.
The Open Space exemption cannot presently be implemented, and therefore, no vote need be taken by the Select Board with respect to this exemption.
16 Fiscal Year 2022 Classification Hearing
ADDENDUM A
SUDBURY'S MEANS TESTED SENIOR TAX EXEMPTION
Finally, we are asking this evening that the Board vote on the cap to be used to fund the Sudbury Senior Means Tested Exemption Program for Fiscal year 2022. Section 3 of Chapter 169 of the Acts of 2012, specifies that the total cap on the exemptions granted by the act shall be set annually by the Select Board, within a range of .5 to 1 per cent of the residential property tax levy for the town of Sudbury. The vote is traditionally taken following the mandatory Classification Hearing votes.
Massachusetts Chapter 169 of the Acts of 2012 established, and Chapter 10 of the Acts of 2016 renewed a pilot program in Sudbury for granting certain qualified senior residents a measure property tax relief. Fiscal year 2022 is the ninth year of the program. The exemption is similar to the Residential Tax Exemption in that it shifts the tax burden from qualified residential property owners to other residential property owners. For Fiscal year 2014, the statute limited the total exemptions granted under the pilot program to a dollar cap equal to 0.5% of the residential levy (after any CIP shift). For Fiscal year 2021, the Select Board voted to increase the cap to 0.5115%. For fiscal year 2022, Select Board have the option, if needed, to increase this percentage up to and including 1.0%. Applications are required, and the Assessors administer this program for all applicants deemed qualified by the Board of Assessors. For fiscal year 2022, the Assessors received 95 applications and the Board of Assessors identified 94 applicants tentatively qualified to receive the exemption. In order for the Assessors to complete the necessary calculations, Select Board must first vote the Residential Factor and CIP shift values for fiscal year 2022 at the Classification Hearing. That vote will determine a tentative residential tax rate, which will then be used in the calculations and result in an increase in the tentative residential tax rate. For fiscal year 2022, the indicated need seems to point to a cap on the percentage of residential tax levy required to fund the program may be approximately the same as last year. Our calculations indicate the cap on the exemption percentage of the residential tax levy of .5____% should be sufficient to fund the program for Fiscal year 2022. The exact percentage will be based upon the voted residential factor. The Act also provides an alternative to increasing the cap, whereby the income threshold may be adjusted above the nominal 10.0% until the need is reduced to fall within the cap.
17 Fiscal Year 2022 Classification Hearing
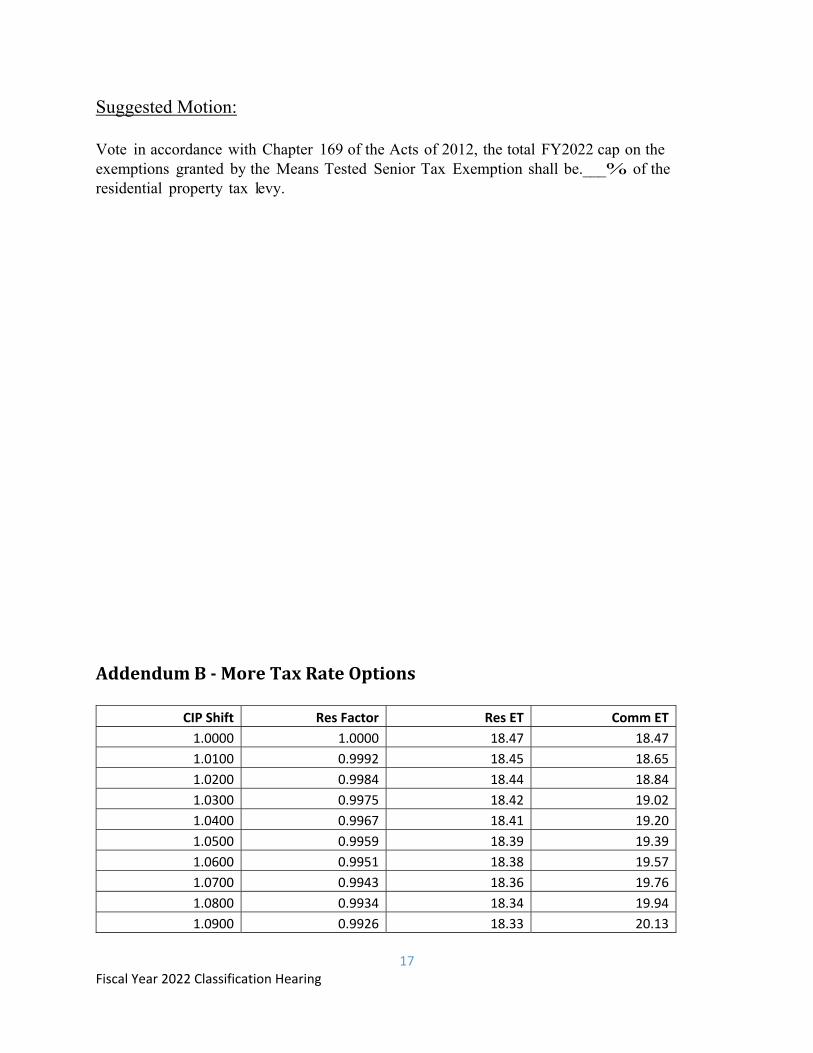
Suggested Motion: Vote in accordance with Chapter 169 of the Acts of 2012, the total FY2022 cap on the exemptions granted by the Means Tested Senior Tax Exemption shall be.___% of the residential property tax levy. AddendumB‐MoreTaxRateOptions
CIP Shift Res Factor Res ET Comm ET
1.0000 1.0000 18.47 18.47
1.0100 0.9992 18.45 18.65
1.0200 0.9984 18.44 18.84
1.0300 0.9975 18.42 19.02
1.0400 0.9967 18.41 19.20
1.0500 0.9959 18.39 19.39
1.0600 0.9951 18.38 19.57
1.0700 0.9943 18.36 19.76
1.0800 0.9934 18.34 19.94
1.0900 0.9926 18.33 20.13
18 Fiscal Year 2022 Classification Hearing
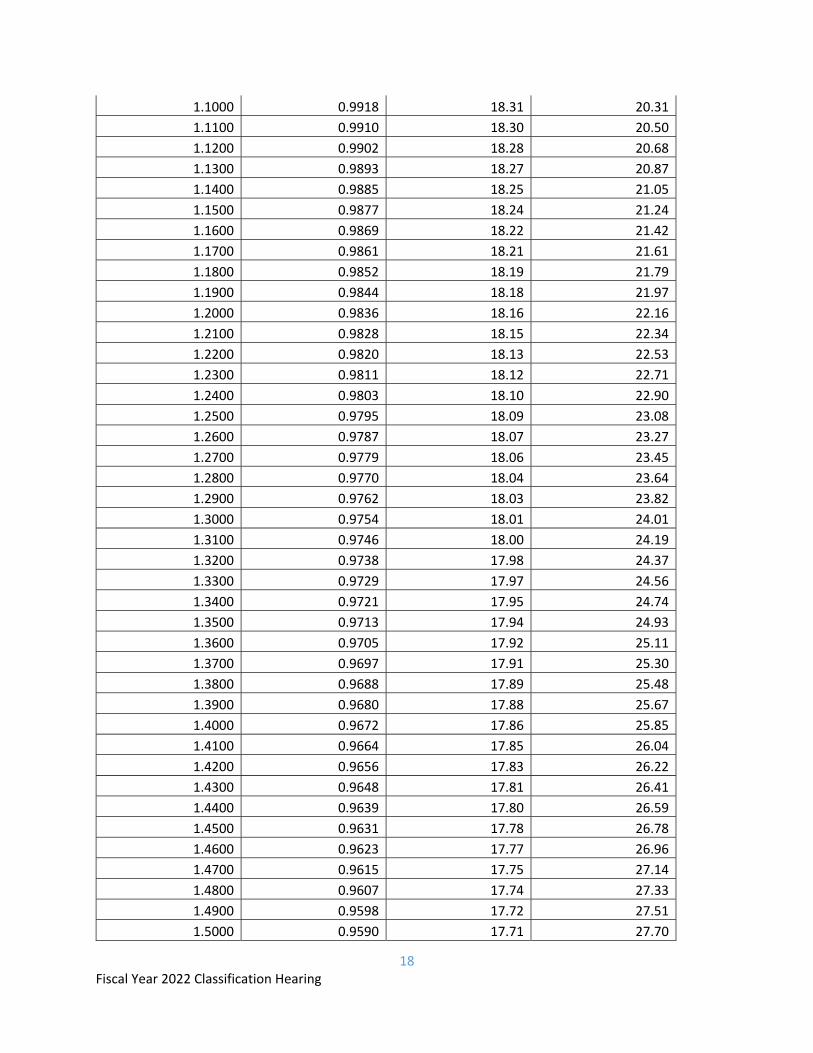
1.1000 0.9918 18.31 20.31
1.1100 0.9910 18.30 20.50
1.1200 0.9902 18.28 20.68
1.1300 0.9893 18.27 20.87
1.1400 0.9885 18.25 21.05
1.1500 0.9877 18.24 21.24
1.1600 0.9869 18.22 21.42
1.1700 0.9861 18.21 21.61
1.1800 0.9852 18.19 21.79
1.1900 0.9844 18.18 21.97
1.2000 0.9836 18.16 22.16
1.2100 0.9828 18.15 22.34
1.2200 0.9820 18.13 22.53
1.2300 0.9811 18.12 22.71
1.2400 0.9803 18.10 22.90
1.2500 0.9795 18.09 23.08
1.2600 0.9787 18.07 23.27
1.2700 0.9779 18.06 23.45
1.2800 0.9770 18.04 23.64
1.2900 0.9762 18.03 23.82
1.3000 0.9754 18.01 24.01
1.3100 0.9746 18.00 24.19
1.3200 0.9738 17.98 24.37
1.3300 0.9729 17.97 24.56
1.3400 0.9721 17.95 24.74
1.3500 0.9713 17.94 24.93
1.3600 0.9705 17.92 25.11
1.3700 0.9697 17.91 25.30
1.3800 0.9688 17.89 25.48
1.3900 0.9680 17.88 25.67
1.4000 0.9672 17.86 25.85
1.4100 0.9664 17.85 26.04
1.4200 0.9656 17.83 26.22
1.4300 0.9648 17.81 26.41
1.4400 0.9639 17.80 26.59
1.4500 0.9631 17.78 26.78
1.4600 0.9623 17.77 26.96
1.4700 0.9615 17.75 27.14
1.4800 0.9607 17.74 27.33
1.4900 0.9598 17.72 27.51
1.5000 0.9590 17.71 27.70
19 Fiscal Year 2022 Classification Hearing
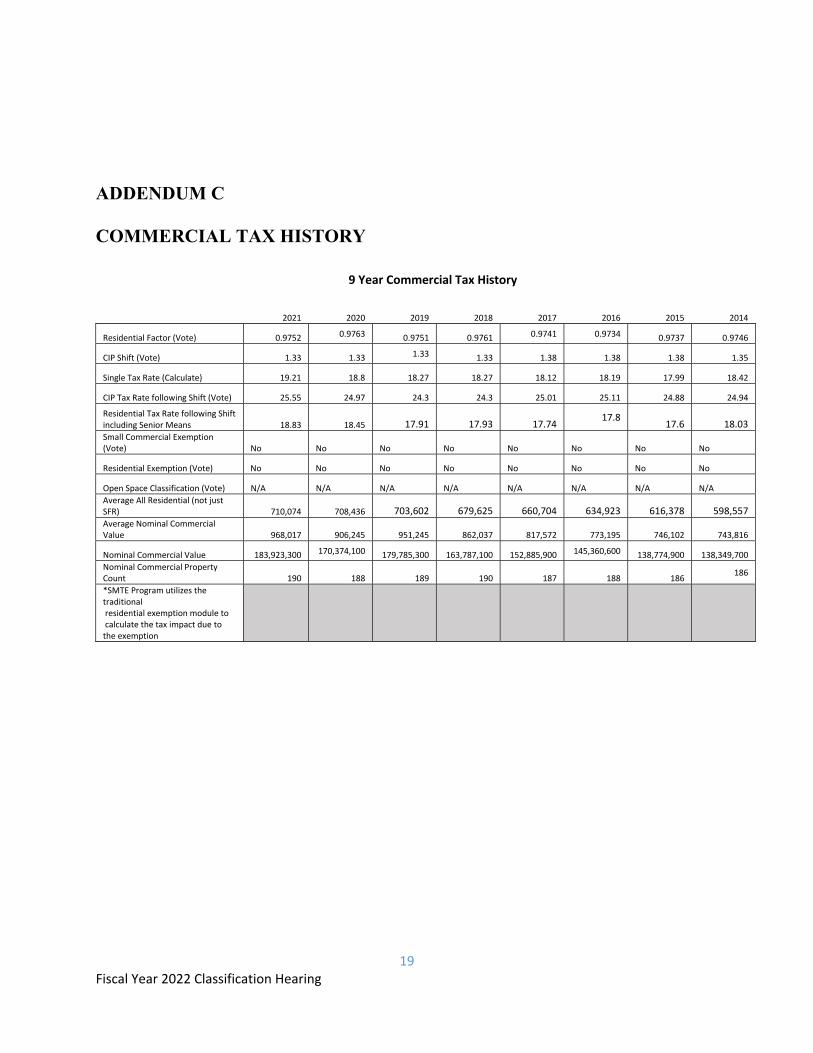
ADDENDUM C COMMERCIAL TAX HISTORY
9 Year Commercial Tax History
2021 2020 2019 2018 2017 2016 2015 2014
Residential Factor (Vote) 0.9752 0.9763 0.9751 0.9761 0.9741 0.9734 0.9737 0.9746
CIP Shift (Vote) 1.33 1.33 1.33 1.33 1.38 1.38 1.38 1.35
Single Tax Rate (Calculate) 19.21 18.8 18.27 18.27 18.12 18.19 17.99 18.42
CIP Tax Rate following Shift (Vote) 25.55 24.97 24.3 24.3 25.01 25.11 24.88 24.94
Residential Tax Rate following Shift including Senior Means 18.83 18.45 17.91 17.93 17.74
17.8 17.6 18.03
Small Commercial Exemption (Vote) No No No No No No No No
Residential Exemption (Vote) No No No No No No No No
Open Space Classification (Vote) N/A N/A N/A N/A N/A N/A N/A N/A
Average All Residential (not just SFR) 710,074 708,436 703,602 679,625 660,704 634,923 616,378 598,557 Average Nominal Commercial Value 968,017 906,245 951,245 862,037 817,572 773,195 746,102 743,816
Nominal Commercial Value 183,923,300 170,374,100 179,785,300 163,787,100 152,885,900 145,360,600 138,774,900 138,349,700
Nominal Commercial Property Count 190 188 189 190 187 188 186
186
*SMTE Program utilizes the traditional residential exemption module to calculate the tax impact due to the exemption
20 Fiscal Year 2022 Classification Hearing
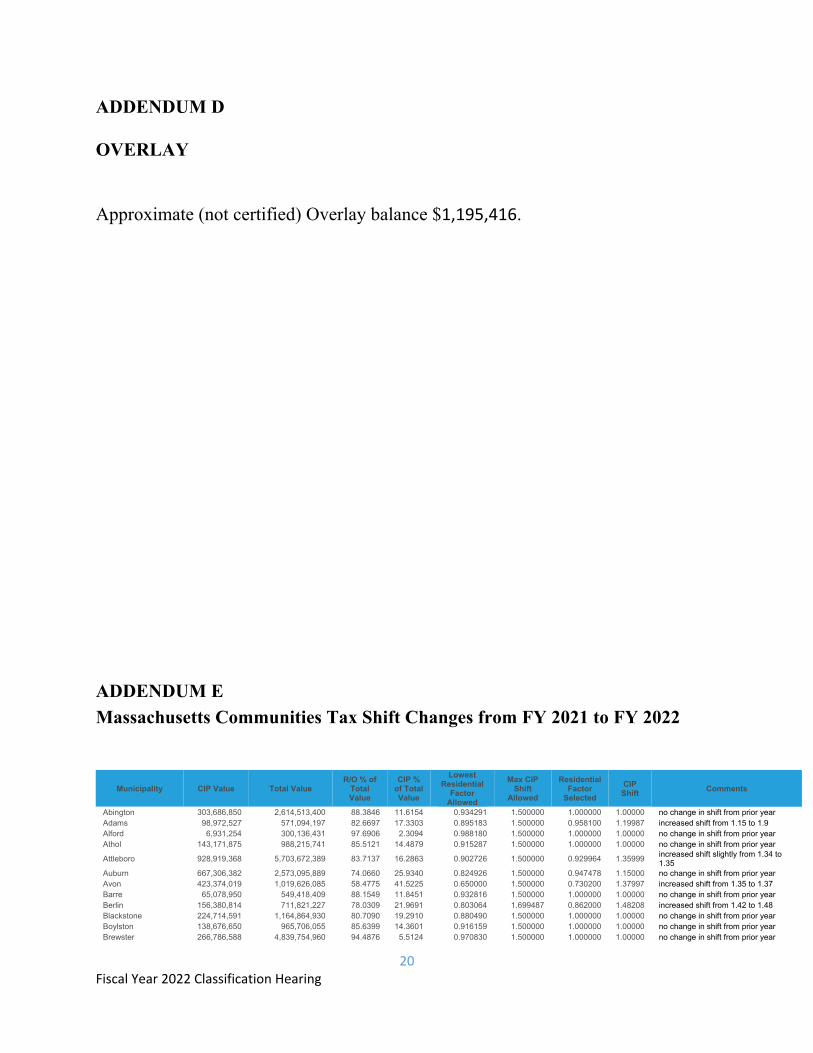
ADDENDUM D OVERLAY Approximate (not certified) Overlay balance $1,195,416.
ADDENDUM E
Massachusetts Communities Tax Shift Changes from FY 2021 to FY 2022
Municipality CIP Value Total Value R/O % of
Total Value
CIP % of Total Value
Lowest Residential
Factor Allowed
Max CIP Shift
Allowed
Residential Factor
Selected
CIP Shift
Comments
Abington 303,686,850 2,614,513,400 88.3846 11.6154 0.934291 1.500000 1.000000 1.00000 no change in shift from prior year Adams 98,972,527 571,094,197 82.6697 17.3303 0.895183 1.500000 0.958100 1.19987 increased shift from 1.15 to 1.9 Alford 6,931,254 300,136,431 97.6906 2.3094 0.988180 1.500000 1.000000 1.00000 no change in shift from prior year Athol 143,171,875 988,215,741 85.5121 14.4879 0.915287 1.500000 1.000000 1.00000 no change in shift from prior year
Attleboro 928,919,368 5,703,672,389 83.7137 16.2863 0.902726 1.500000 0.929964 1.35999 increased shift slightly from 1.34 to 1.35
Auburn 667,306,382 2,573,095,889 74.0660 25.9340 0.824926 1.500000 0.947478 1.15000 no change in shift from prior year Avon 423,374,019 1,019,626,085 58.4775 41.5225 0.650000 1.500000 0.730200 1.37997 increased shift from 1.35 to 1.37 Barre 65,078,950 549,418,409 88.1549 11.8451 0.932816 1.500000 1.000000 1.00000 no change in shift from prior year Berlin 156,380,814 711,821,227 78.0309 21.9691 0.803064 1.699487 0.862000 1.48208 increased shift from 1.42 to 1.48 Blackstone 224,714,591 1,164,864,930 80.7090 19.2910 0.880490 1.500000 1.000000 1.00000 no change in shift from prior year Boylston 138,676,650 965,706,055 85.6399 14.3601 0.916159 1.500000 1.000000 1.00000 no change in shift from prior year Brewster 266,786,588 4,839,754,960 94.4876 5.5124 0.970830 1.500000 1.000000 1.00000 no change in shift from prior year
21 Fiscal Year 2022 Classification Hearing
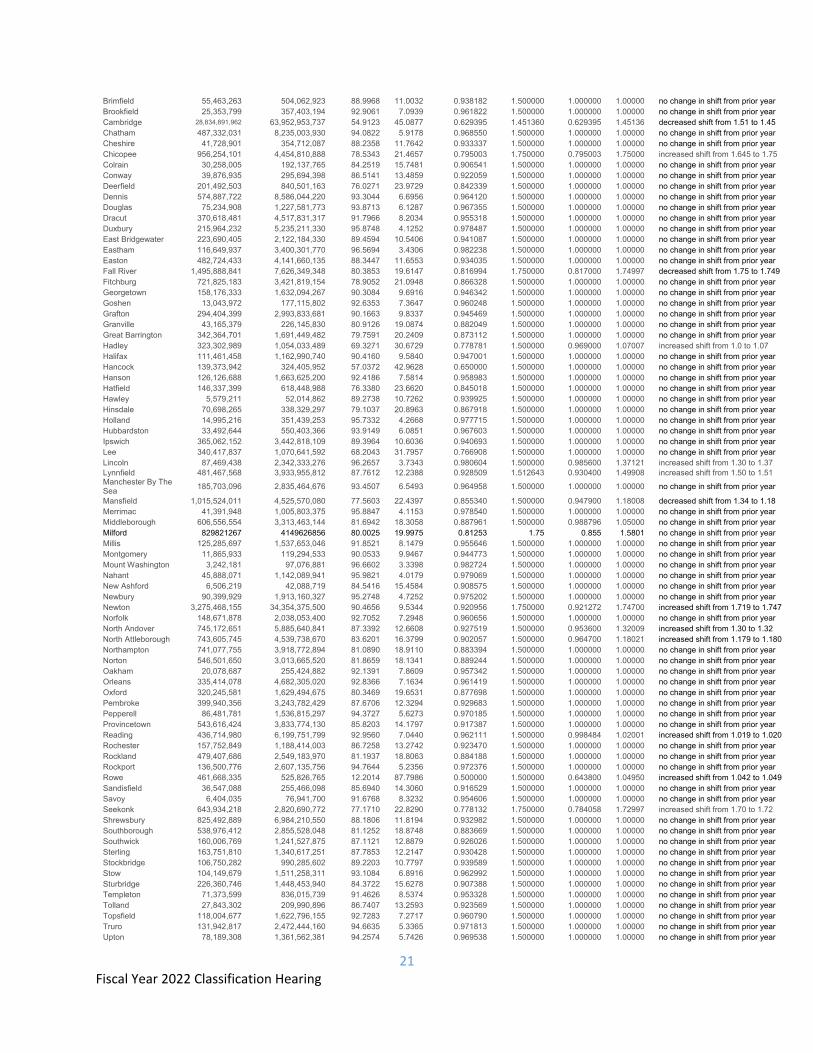
Brimfield 55,463,263 504,062,923 88.9968 11.0032 0.938182 1.500000 1.000000 1.00000 no change in shift from prior year Brookfield 25,353,799 357,403,194 92.9061 7.0939 0.961822 1.500000 1.000000 1.00000 no change in shift from prior year Cambridge 28,834,891,962 63,952,953,737 54.9123 45.0877 0.629395 1.451360 0.629395 1.45136 decreased shift from 1.51 to 1.45 Chatham 487,332,031 8,235,003,930 94.0822 5.9178 0.968550 1.500000 1.000000 1.00000 no change in shift from prior year Cheshire 41,728,901 354,712,087 88.2358 11.7642 0.933337 1.500000 1.000000 1.00000 no change in shift from prior year Chicopee 956,254,101 4,454,810,888 78.5343 21.4657 0.795003 1.750000 0.795003 1.75000 increased shift from 1.645 to 1.75 Colrain 30,258,005 192,137,765 84.2519 15.7481 0.906541 1.500000 1.000000 1.00000 no change in shift from prior year Conway 39,876,935 295,694,398 86.5141 13.4859 0.922059 1.500000 1.000000 1.00000 no change in shift from prior year Deerfield 201,492,503 840,501,163 76.0271 23.9729 0.842339 1.500000 1.000000 1.00000 no change in shift from prior year Dennis 574,887,722 8,586,044,220 93.3044 6.6956 0.964120 1.500000 1.000000 1.00000 no change in shift from prior year Douglas 75,234,908 1,227,581,773 93.8713 6.1287 0.967355 1.500000 1.000000 1.00000 no change in shift from prior year Dracut 370,618,481 4,517,831,317 91.7966 8.2034 0.955318 1.500000 1.000000 1.00000 no change in shift from prior year Duxbury 215,964,232 5,235,211,330 95.8748 4.1252 0.978487 1.500000 1.000000 1.00000 no change in shift from prior year East Bridgewater 223,690,405 2,122,184,330 89.4594 10.5406 0.941087 1.500000 1.000000 1.00000 no change in shift from prior year Eastham 116,649,937 3,400,301,770 96.5694 3.4306 0.982238 1.500000 1.000000 1.00000 no change in shift from prior year Easton 482,724,433 4,141,660,135 88.3447 11.6553 0.934035 1.500000 1.000000 1.00000 no change in shift from prior year Fall River 1,495,888,841 7,626,349,348 80.3853 19.6147 0.816994 1.750000 0.817000 1.74997 decreased shift from 1.75 to 1.749 Fitchburg 721,825,183 3,421,819,154 78.9052 21.0948 0.866328 1.500000 1.000000 1.00000 no change in shift from prior year Georgetown 158,176,333 1,632,094,267 90.3084 9.6916 0.946342 1.500000 1.000000 1.00000 no change in shift from prior year Goshen 13,043,972 177,115,802 92.6353 7.3647 0.960248 1.500000 1.000000 1.00000 no change in shift from prior year Grafton 294,404,399 2,993,833,681 90.1663 9.8337 0.945469 1.500000 1.000000 1.00000 no change in shift from prior year Granville 43,165,379 226,145,830 80.9126 19.0874 0.882049 1.500000 1.000000 1.00000 no change in shift from prior year Great Barrington 342,364,701 1,691,449,482 79.7591 20.2409 0.873112 1.500000 1.000000 1.00000 no change in shift from prior year Hadley 323,302,989 1,054,033,489 69.3271 30.6729 0.778781 1.500000 0.969000 1.07007 increased shift from 1.0 to 1.07 Halifax 111,461,458 1,162,990,740 90.4160 9.5840 0.947001 1.500000 1.000000 1.00000 no change in shift from prior year Hancock 139,373,942 324,405,952 57.0372 42.9628 0.650000 1.500000 1.000000 1.00000 no change in shift from prior year Hanson 126,126,688 1,663,625,200 92.4186 7.5814 0.958983 1.500000 1.000000 1.00000 no change in shift from prior year Hatfield 146,337,399 618,448,988 76.3380 23.6620 0.845018 1.500000 1.000000 1.00000 no change in shift from prior year Hawley 5,579,211 52,014,862 89.2738 10.7262 0.939925 1.500000 1.000000 1.00000 no change in shift from prior year Hinsdale 70,698,265 338,329,297 79.1037 20.8963 0.867918 1.500000 1.000000 1.00000 no change in shift from prior year Holland 14,995,216 351,439,253 95.7332 4.2668 0.977715 1.500000 1.000000 1.00000 no change in shift from prior year Hubbardston 33,492,644 550,403,366 93.9149 6.0851 0.967603 1.500000 1.000000 1.00000 no change in shift from prior year Ipswich 365,062,152 3,442,818,109 89.3964 10.6036 0.940693 1.500000 1.000000 1.00000 no change in shift from prior year Lee 340,417,837 1,070,641,592 68.2043 31.7957 0.766908 1.500000 1.000000 1.00000 no change in shift from prior year Lincoln 87,469,438 2,342,333,276 96.2657 3.7343 0.980604 1.500000 0.985600 1.37121 increased shift from 1.30 to 1.37 Lynnfield 481,467,568 3,933,955,812 87.7612 12.2388 0.928509 1.512643 0.930400 1.49908 increased shift from 1.50 to 1.51Manchester By The Sea
185,703,096 2,835,464,676 93.4507 6.5493 0.964958 1.500000 1.000000 1.00000 no change in shift from prior year
Mansfield 1,015,524,011 4,525,570,080 77.5603 22.4397 0.855340 1.500000 0.947900 1.18008 decreased shift from 1.34 to 1.18 Merrimac 41,391,948 1,005,803,375 95.8847 4.1153 0.978540 1.500000 1.000000 1.00000 no change in shift from prior year Middleborough 606,556,554 3,313,463,144 81.6942 18.3058 0.887961 1.500000 0.988796 1.05000 no change in shift from prior year Milford 829821267 4149626856 80.0025 19.9975 0.81253 1.75 0.855 1.5801 no change in shift from prior year Millis 125,285,697 1,537,653,046 91.8521 8.1479 0.955646 1.500000 1.000000 1.00000 no change in shift from prior year Montgomery 11,865,933 119,294,533 90.0533 9.9467 0.944773 1.500000 1.000000 1.00000 no change in shift from prior year Mount Washington 3,242,181 97,076,881 96.6602 3.3398 0.982724 1.500000 1.000000 1.00000 no change in shift from prior year Nahant 45,888,071 1,142,089,941 95.9821 4.0179 0.979069 1.500000 1.000000 1.00000 no change in shift from prior year New Ashford 6,506,219 42,088,719 84.5416 15.4584 0.908575 1.500000 1.000000 1.00000 no change in shift from prior year Newbury 90,399,929 1,913,160,327 95.2748 4.7252 0.975202 1.500000 1.000000 1.00000 no change in shift from prior year Newton 3,275,468,155 34,354,375,500 90.4656 9.5344 0.920956 1.750000 0.921272 1.74700 increased shift from 1.719 to 1.747 Norfolk 148,671,878 2,038,053,400 92.7052 7.2948 0.960656 1.500000 1.000000 1.00000 no change in shift from prior year North Andover 745,172,651 5,885,640,841 87.3392 12.6608 0.927519 1.500000 0.953600 1.32009 increased shift from 1.30 to 1.32 North Attleborough 743,605,745 4,539,738,670 83.6201 16.3799 0.902057 1.500000 0.964700 1.18021 increased shift from 1.179 to 1.180 Northampton 741,077,755 3,918,772,894 81.0890 18.9110 0.883394 1.500000 1.000000 1.00000 no change in shift from prior year Norton 546,501,650 3,013,665,520 81.8659 18.1341 0.889244 1.500000 1.000000 1.00000 no change in shift from prior year Oakham 20,078,687 255,424,882 92.1391 7.8609 0.957342 1.500000 1.000000 1.00000 no change in shift from prior year Orleans 335,414,078 4,682,305,020 92.8366 7.1634 0.961419 1.500000 1.000000 1.00000 no change in shift from prior year Oxford 320,245,581 1,629,494,675 80.3469 19.6531 0.877698 1.500000 1.000000 1.00000 no change in shift from prior year Pembroke 399,940,356 3,243,782,429 87.6706 12.3294 0.929683 1.500000 1.000000 1.00000 no change in shift from prior year Pepperell 86,481,781 1,536,815,297 94.3727 5.6273 0.970185 1.500000 1.000000 1.00000 no change in shift from prior year Provincetown 543,616,424 3,833,774,130 85.8203 14.1797 0.917387 1.500000 1.000000 1.00000 no change in shift from prior year Reading 436,714,980 6,199,751,799 92.9560 7.0440 0.962111 1.500000 0.998484 1.02001 increased shift from 1.019 to 1.020 Rochester 157,752,849 1,188,414,003 86.7258 13.2742 0.923470 1.500000 1.000000 1.00000 no change in shift from prior year Rockland 479,407,686 2,549,183,970 81.1937 18.8063 0.884188 1.500000 1.000000 1.00000 no change in shift from prior year Rockport 136,500,776 2,607,135,756 94.7644 5.2356 0.972376 1.500000 1.000000 1.00000 no change in shift from prior year Rowe 461,668,335 525,826,765 12.2014 87.7986 0.500000 1.500000 0.643800 1.04950 increased shift from 1.042 to 1.049 Sandisfield 36,547,088 255,466,098 85.6940 14.3060 0.916529 1.500000 1.000000 1.00000 no change in shift from prior year Savoy 6,404,035 76,941,700 91.6768 8.3232 0.954606 1.500000 1.000000 1.00000 no change in shift from prior year Seekonk 643,934,218 2,820,690,772 77.1710 22.8290 0.778132 1.750000 0.784058 1.72997 increased shift from 1.70 to 1.72 Shrewsbury 825,492,889 6,984,210,550 88.1806 11.8194 0.932982 1.500000 1.000000 1.00000 no change in shift from prior year Southborough 538,976,412 2,855,528,048 81.1252 18.8748 0.883669 1.500000 1.000000 1.00000 no change in shift from prior year Southwick 160,006,769 1,241,527,875 87.1121 12.8879 0.926026 1.500000 1.000000 1.00000 no change in shift from prior year Sterling 163,751,810 1,340,617,251 87.7853 12.2147 0.930428 1.500000 1.000000 1.00000 no change in shift from prior year Stockbridge 106,750,282 990,285,602 89.2203 10.7797 0.939589 1.500000 1.000000 1.00000 no change in shift from prior year Stow 104,149,679 1,511,258,311 93.1084 6.8916 0.962992 1.500000 1.000000 1.00000 no change in shift from prior year Sturbridge 226,360,746 1,448,453,940 84.3722 15.6278 0.907388 1.500000 1.000000 1.00000 no change in shift from prior year Templeton 71,373,599 836,015,739 91.4626 8.5374 0.953328 1.500000 1.000000 1.00000 no change in shift from prior year Tolland 27,843,302 209,990,896 86.7407 13.2593 0.923569 1.500000 1.000000 1.00000 no change in shift from prior year Topsfield 118,004,677 1,622,796,155 92.7283 7.2717 0.960790 1.500000 1.000000 1.00000 no change in shift from prior year Truro 131,942,817 2,472,444,160 94.6635 5.3365 0.971813 1.500000 1.000000 1.00000 no change in shift from prior year Upton 78,189,308 1,361,562,381 94.2574 5.7426 0.969538 1.500000 1.000000 1.00000 no change in shift from prior year
22 Fiscal Year 2022 Classification Hearing
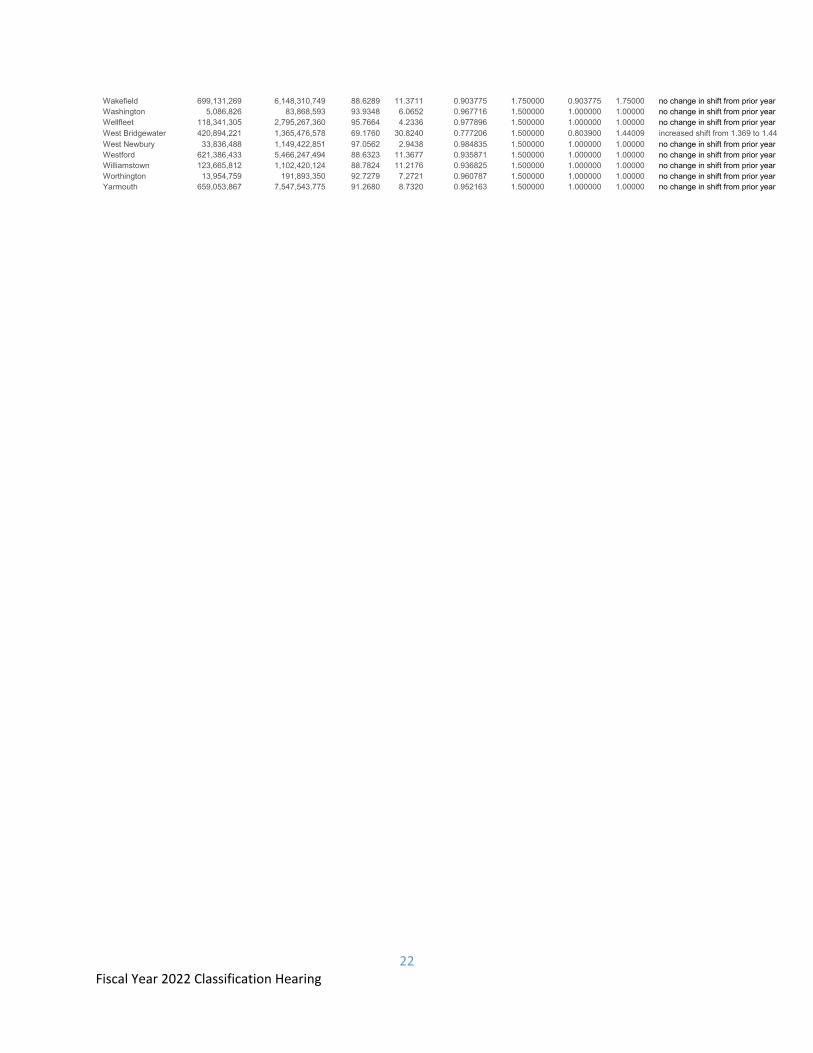
Wakefield 699,131,269 6,148,310,749 88.6289 11.3711 0.903775 1.750000 0.903775 1.75000 no change in shift from prior year Washington 5,086,826 83,868,593 93.9348 6.0652 0.967716 1.500000 1.000000 1.00000 no change in shift from prior year Wellfleet 118,341,305 2,795,267,360 95.7664 4.2336 0.977896 1.500000 1.000000 1.00000 no change in shift from prior year West Bridgewater 420,894,221 1,365,476,578 69.1760 30.8240 0.777206 1.500000 0.803900 1.44009 increased shift from 1.369 to 1.44 West Newbury 33,836,488 1,149,422,851 97.0562 2.9438 0.984835 1.500000 1.000000 1.00000 no change in shift from prior year Westford 621,386,433 5,466,247,494 88.6323 11.3677 0.935871 1.500000 1.000000 1.00000 no change in shift from prior year Williamstown 123,665,812 1,102,420,124 88.7824 11.2176 0.936825 1.500000 1.000000 1.00000 no change in shift from prior year Worthington 13,954,759 191,893,350 92.7279 7.2721 0.960787 1.500000 1.000000 1.00000 no change in shift from prior year Yarmouth 659,053,867 7,547,543,775 91.2680 8.7320 0.952163 1.500000 1.000000 1.00000 no change in shift from prior year