Embed Size (px)
Citation preview
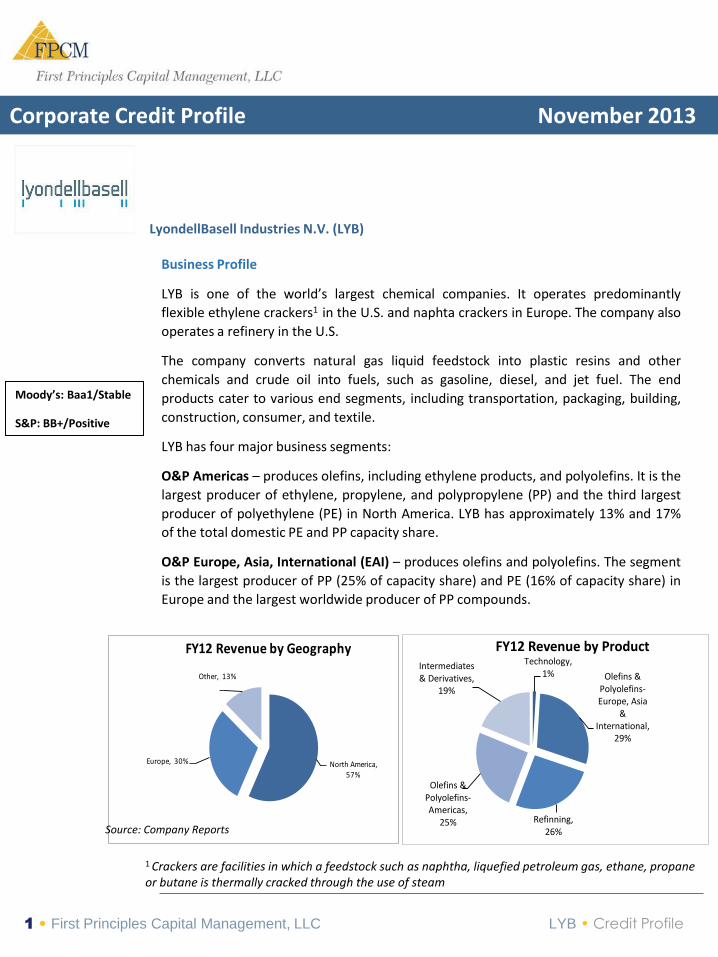
North America, 57%
Europe, 30%
Other, 13%
FY12 Revenue by Geography
Corporate Credit Profile November 2013
Moody’s: Baa1/Stable
S&P: BB+/Positive
1 • First Principles Capital Management, LLC LYB • Credit Profile
LyondellBasell Industries N.V. (LYB)
Business Profile
LYB is one of the world’s largest chemical companies. It operates predominantly
flexible ethylene crackers1 in the U.S. and naphta crackers in Europe. The company also
operates a refinery in the U.S.
The company converts natural gas liquid feedstock into plastic resins and other
chemicals and crude oil into fuels, such as gasoline, diesel, and jet fuel. The end
products cater to various end segments, including transportation, packaging, building,
construction, consumer, and textile.
LYB has four major business segments:
O&P Americas – produces olefins, including ethylene products, and polyolefins. It is the
largest producer of ethylene, propylene, and polypropylene (PP) and the third largest
producer of polyethylene (PE) in North America. LYB has approximately 13% and 17%
of the total domestic PE and PP capacity share.
O&P Europe, Asia, International (EAI) – produces olefins and polyolefins. The segment
is the largest producer of PP (25% of capacity share) and PE (16% of capacity share) in
Europe and the largest worldwide producer of PP compounds.
Source: Company Reports
Technology, 1% Olefins &
Polyolefins-Europe, Asia
& International,
29%
Refinning, 26%
Olefins & Polyolefins-Americas,
25%
Intermediates & Derivatives,
19%
FY12 Revenue by Product
1 Crackers are facilities in which a feedstock such as naphtha, liquefied petroleum gas, ethane, propane or butane is thermally cracked through the use of steam
Intermediates and Derivatives produces propylene oxide and its co-products and
derivatives, as well as acetyls, ethylene oxide and its derivatives. LYB is the second
largest producer of polonium (PO) globally with 19% capacity share.
The Refining segment refines crude oil at its Houston refinery. The firm is the largest
global producer of MTBE (Methyl Tertiary Butyl Ether) and ETBE (Ethyl Tert-Butyl
Ether), which are gasoline additives that help meet increasing standards for cleaner
burning fuels.
Recent Events
Prior history of bankruptcy. The January 2009 bankruptcy filing was triggered by
aggressive leverage and insufficient liquidity, as the company faced increasing oil and
natural gas prices and declining demand during the last downturn. LYB emerged from
Chapter 11 in April 2010. Post bankruptcy, a new management team (former Chevron
executives) restructured the business.
Ramp-up of share repurchases. LYB issued 10-year and 30-year bonds for a total of
$1.5 billion in July 2013, mostly for share repurchases. The company has spent $1.3
billion on share repurchases since it received approval in May of up to 10% of the
company’s outstanding stock, leaving approximately $3 billion worth of share
repurchases under the program.
Reduction of private equity ownership. Following a series of trades over the past year,
Apollo Management has continuously reduced its ownership stake in LYB to ~5%, down
from a one-third stake back in 2010. In 2008, the private equity firm had invested $2
billion in distressed debt of the company’s U.S. unit. The debt was converted into an
equity stake in a subsequent bankruptcy reorganization. Including the recent trade,
Apollo has taken out over 3.5 times its initial investment, and is expected to come back
to the market to sell its final block of shares in LYB. Of note, Access Industries, run by
Russian investor Leonard Blavatnik, still owns ~15% of LYB.
Growth projects. After spending the last several years shutting down multiple higher-
cost units, management is focusing on maximizing the production capacity. The
company initiated multiple capital growth initiatives in 2012 which will be coming
online through 2016, for an estimated total cost of $1.8 billion. Post completion, LYB’s
ethylene capacity in the U.S. will increase by 18%, further exploiting LYB’s cost
advantage versus European and Asian peers which is underpinned by low cost NGL
2 • First Principles Capital Management, LLC LYB • Credit Profile

(Natural Gas Liquid) feedstocks, in particular ethane.
Credit rating upgrades. In March 2013, S&P upgraded LYB’s credit rating from BBB- to
BBB. Moody’s also upgraded the credit rating twice in 2013, from Baa3 to Baa1 in May
2013 and August 2013 given continued improving credit metrics and a reduction in
Apollo’s equity ownership in the company.
Industry Update
Over the last cycle, U.S. ethylene producers had much higher cost structures
compared to European and Asian producers as U.S. natural gas prices spiked.
However, with the increase in crude oil prices and advent of shale gas, U.S. producers
have significantly lowered their cost base.
North American ethylene producers using NGLs continue to realize peak-like ethylene
margins (see chart on pg 3). Persistently high crude oil prices have kept ethylene
prices elevated through 3Q13 although prices are expected to decrease in 4Q13 due
to seasonally lower demand. Meanwhile, ethane-based ethylene margins remain at
near-peak levels due to inexpensive ethane feedstocks. Margins for offshore crude oil-
based producers remain challenged by a persistently high oil price, hence the cost of
crude oil-based ethylene feedstock, naphtha, remains elevated.
Ethane prices are meaningfully lower yoy due to abundant NGL supplies from the
development of domestic shale plays.
Natural gas liquids, including ethane and propane, are the preferred feedstocks for
LYB’s North American ethylene production. The U.S. shale gas revolution has been a
significant driver of profitability in LYB’s North American O&P and Intermediate and
Derivatives business units. In LYB’s North American O&P segment, the proportion of
ethylene production from NGLs has increased to 90% in 2Q13.
3 • First Principles Capital Management, LLC LYB • Credit Profile
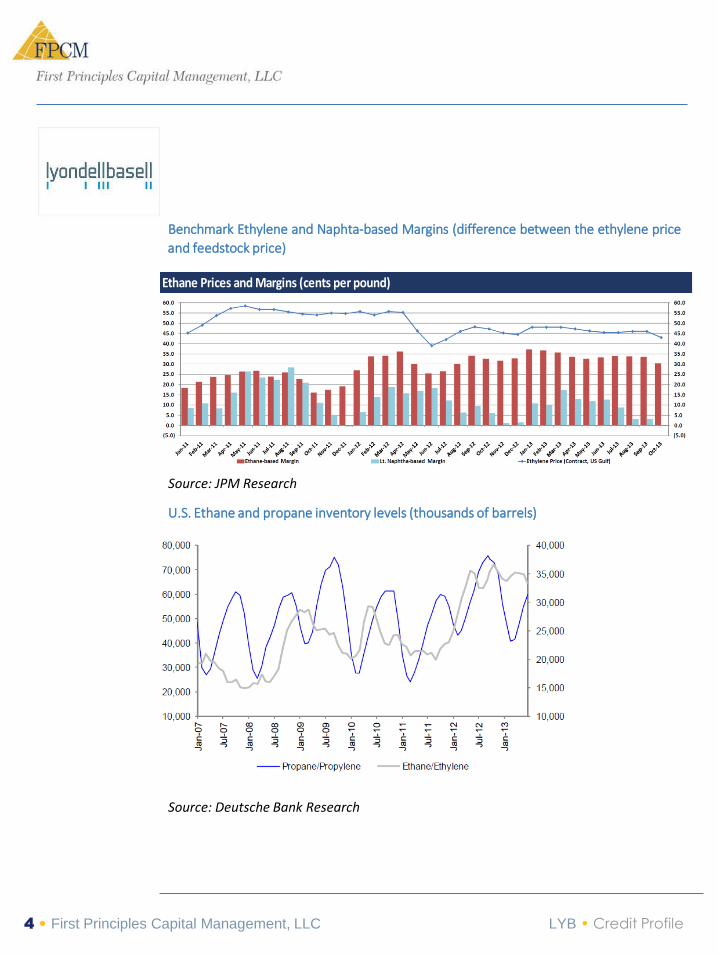
Benchmark Ethylene and Naphta-based Margins (difference between the ethylene price
and feedstock price)
Europe
Source: JPM Research
U.S. Ethane and propane inventory levels (thousands of barrels)
Source: Deutsche Bank Research
Ethane Prices and Margins (cents per pound)
4 • First Principles Capital Management, LLC LYB • Credit Profile
Interim Results
LTM 9/30/13:
LYB reported moderate revenue decrease of 2.9% compared to FY12 as O&P Americas
and EAI gains were more than offset by Refining and Intermediates & Derivatives
declines.
LTM Revenue - Revenue decline was mostly driven by the Refining segment (-9.4%
compared to FY12). This segment continued to lag given lower production due to
maintenance work on an operating unit, a decline in crack spread 1 due to timing of
crude purchases, along with higher renewable fuel and natural gas costs. This segment
also continues to be pressured by an oversupply of gasoline.
The revenue decline (-4.7% compared to FY12) in the Intermediates & Derivatives
segment was driven by continued pressure on butanediol and solvents margins driven
by oversupply in Asia.
LTM EBITDA - Despite lower revenue, EBITDA continued to grow as the company
continued to manage costs, despite lower production from several facilities being
shutdown for maintenance and raw material costs, mainly oil-based naphta in the U.S.
and Europe and propane - 15% of feedstocks - in the U.S.
In particular, the higher-margin core O&P Americas business continues to perform
well due to sustained U.S. NGL advantage leading to better ethylene margins. O&P
facilities in North America are operating close to full capacity, and continue to drive
the bulk of LYB’s performance. Meanwhile, conditions remain more challenging in
Europe given constrained demand and lower margins.
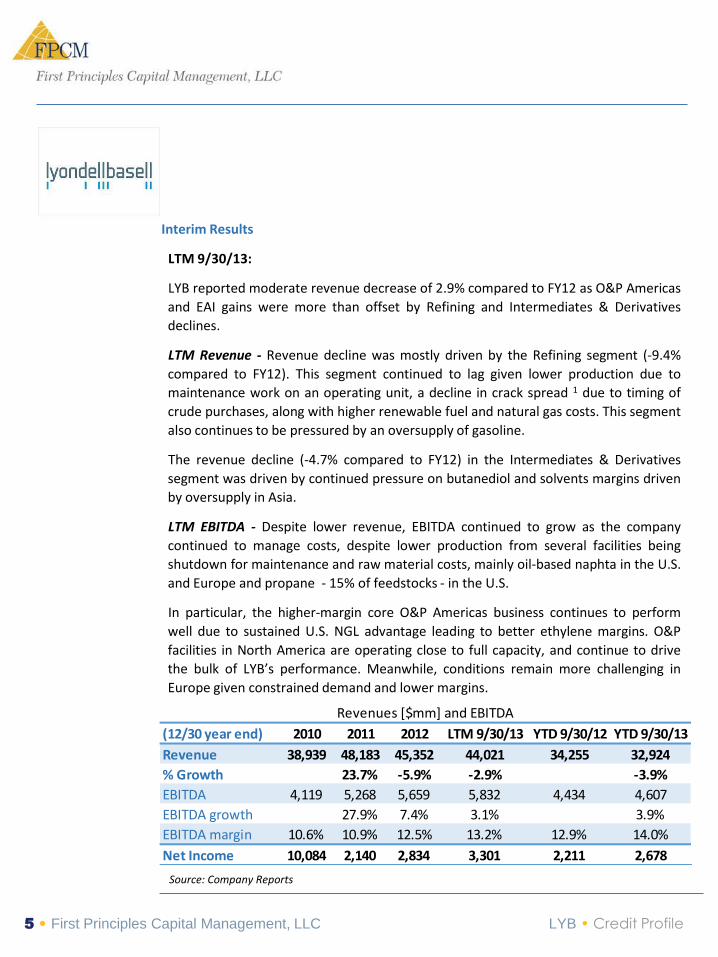
Source: Company Reports
5 • First Principles Capital Management, LLC LYB • Credit Profile
(12/30 year end) 2010 2011 2012 LTM 9/30/13 YTD 9/30/12 YTD 9/30/13
Revenue 38,939 48,183 45,352 44,021 34,255 32,924
% Growth 23.7% -5.9% -2.9% -3.9%
EBITDA 4,119 5,268 5,659 5,832 4,434 4,607
EBITDA growth 27.9% 7.4% 3.1% 3.9%
EBITDA margin 10.6% 10.9% 12.5% 13.2% 12.9% 14.0%
Net Income 10,084 2,140 2,834 3,301 2,211 2,678
Revenues [$mm] and EBITDA
Capital Structure and Liquidity
The company maintains strong liquidity of $6.4 billion with $4.4 billion in cash and full
availability under its $2 billion credit facility.
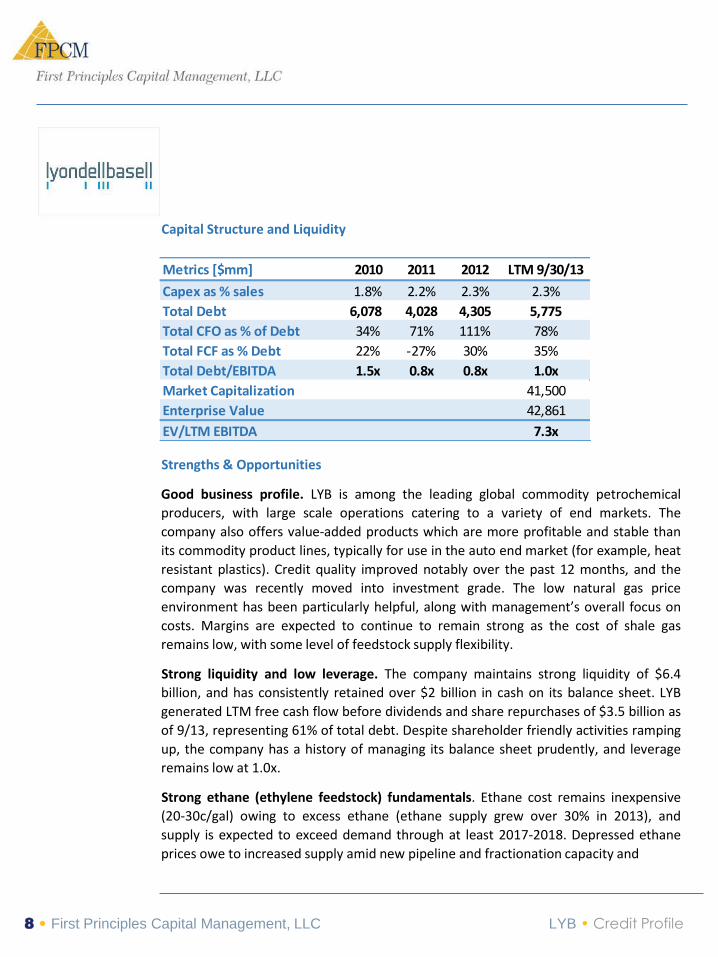
Leverage of 1.0x is low, in line with industry average of 1.2x in September 2013. There
are no near term debt maturities, with the next maturity in 2019.
In May 2013, the company extended its $2 billion revolving credit facility by one year
until May 2018. In addition, LYB has a $1 billion accounts receivable facility due Sept
2015, and a EUR 450 million accounts receivable program (due April 2016).
Historically, LYB has generated strong and consistent cash flow. Capex needs remain
below 3% of sales, resulting in positive free cash flow before dividends and share
repurchases. Base capex spending is $700-$800 million per year, and growth capex is
expected to be $750 million per year over the next two years. Despite elevated capex
to complete growth projects, the company expects to remain free cash flow positive.
However, LYB is expected to continue shareholder-friendly activities.
Since 2010, leverage has remained below 1.5x, and the company can comfortably
service its debt with EBITDA that covers interest close to 20 times.
Debt Maturity Schedule [$mm]
500
1,000
1,500
2,000
2,500
3,000
2014 2015 2016 2017 2018 2019 2020 2021 >2022
Source: Company Reports
Debt Maturities [$mm]
2014 0
2015 0
2016 0
2017 0
Thereafter 5775
Total 5,775
6 • First Principles Capital Management, LLC LYB • Credit Profile

Capital Structure and Liquidity
Source: Company Reports
LYB Capitalization [$mm] 9/30/2013Debt/LTM
EBITDA
$2Bn Revolving Credit Facility due 2018 0
5.000% Sr. Notes due 2019 2,000
6.000% Sr. Notes due 2021 1,000
4.000% Guaranteed Notes due 2023 740
5.750% Sr. Notes due 2024 1,000
8.000% Guaranteed Notes due 2027 300
5.250% Guaranteed Notes due 2043 728
Other 7
Total Debt 5,775 1.0x
Cash 4,414
Net Total Debt 1,361 0.2x
LTM 9/30/13 EBITDA 5,832
7 • First Principles Capital Management, LLC LYB • Credit Profile
Liquidity [$mm] 2010 2011 2012 LTM 9/30/13
CFO 2,043 2,860 4,787 4,522
Total Capex (692) (1,050) (1,060) (1,012)
FCF 1,351 1,810 3,727 3,510
Dividends 0 (2,893) (2,415) (266)
Share Repurchases 0 0 0 (1,251)
Net FCF 1,351 (1,083) 1,312 1,993
2,000
Cash & Marketable 4,414
Liquidity 6,414
$2Bn Revolving Bank Facility
Capital Structure and Liquidity
Strengths & Opportunities
Good business profile. LYB is among the leading global commodity petrochemical
producers, with large scale operations catering to a variety of end markets. The
company also offers value-added products which are more profitable and stable than
its commodity product lines, typically for use in the auto end market (for example, heat
resistant plastics). Credit quality improved notably over the past 12 months, and the
company was recently moved into investment grade. The low natural gas price
environment has been particularly helpful, along with management’s overall focus on
costs. Margins are expected to continue to remain strong as the cost of shale gas
remains low, with some level of feedstock supply flexibility.
Strong liquidity and low leverage. The company maintains strong liquidity of $6.4
billion, and has consistently retained over $2 billion in cash on its balance sheet. LYB
generated LTM free cash flow before dividends and share repurchases of $3.5 billion as
of 9/13, representing 61% of total debt. Despite shareholder friendly activities ramping
up, the company has a history of managing its balance sheet prudently, and leverage
remains low at 1.0x.
Strong ethane (ethylene feedstock) fundamentals. Ethane cost remains inexpensive
(20-30c/gal) owing to excess ethane (ethane supply grew over 30% in 2013), and
supply is expected to exceed demand through at least 2017-2018. Depressed ethane
prices owe to increased supply amid new pipeline and fractionation capacity and
8 • First Principles Capital Management, LLC LYB • Credit Profile
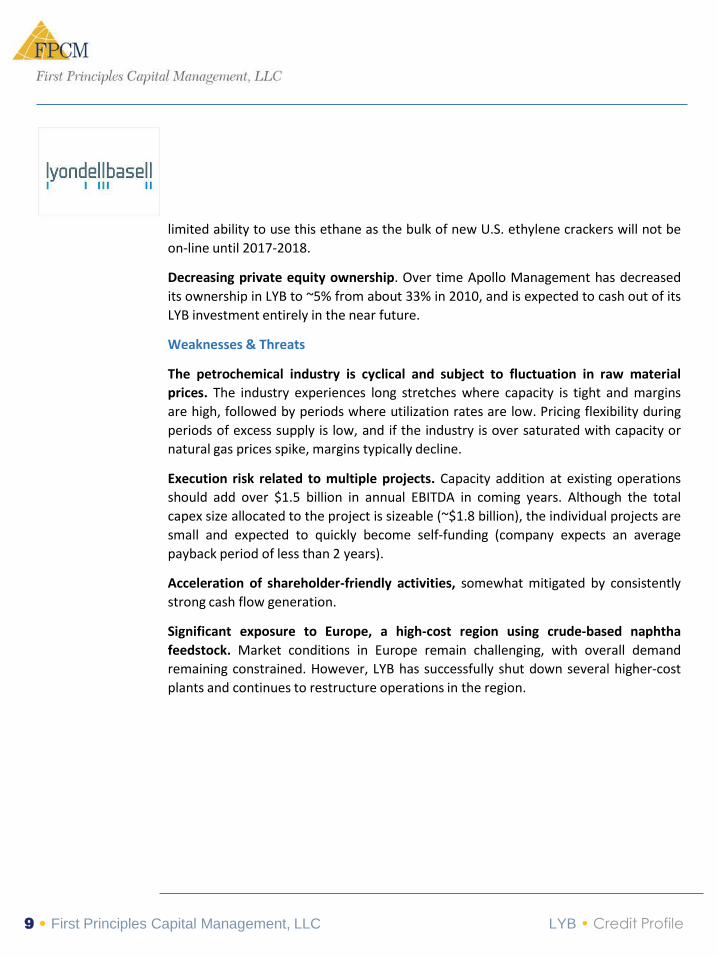
Metrics [$mm] 2010 2011 2012 LTM 9/30/13
Capex as % sales 1.8% 2.2% 2.3% 2.3%
Total Debt 6,078 4,028 4,305 5,775
Total CFO as % of Debt 34% 71% 111% 78%
Total FCF as % Debt 22% -27% 30% 35%
Total Debt/EBITDA 1.5x 0.8x 0.8x 1.0x
Market Capitalization 41,500
Enterprise Value 42,861
EV/LTM EBITDA 7.3x
limited ability to use this ethane as the bulk of new U.S. ethylene crackers will not be
on-line until 2017-2018.
Decreasing private equity ownership. Over time Apollo Management has decreased
its ownership in LYB to ~5% from about 33% in 2010, and is expected to cash out of its
LYB investment entirely in the near future.
Weaknesses & Threats
The petrochemical industry is cyclical and subject to fluctuation in raw material
prices. The industry experiences long stretches where capacity is tight and margins
are high, followed by periods where utilization rates are low. Pricing flexibility during
periods of excess supply is low, and if the industry is over saturated with capacity or
natural gas prices spike, margins typically decline.
Execution risk related to multiple projects. Capacity addition at existing operations
should add over $1.5 billion in annual EBITDA in coming years. Although the total
capex size allocated to the project is sizeable (~$1.8 billion), the individual projects are
small and expected to quickly become self-funding (company expects an average
payback period of less than 2 years).
Acceleration of shareholder-friendly activities, somewhat mitigated by consistently
strong cash flow generation.
Significant exposure to Europe, a high-cost region using crude-based naphtha
feedstock. Market conditions in Europe remain challenging, with overall demand
remaining constrained. However, LYB has successfully shut down several higher-cost
plants and continues to restructure operations in the region.
9 • First Principles Capital Management, LLC LYB • Credit Profile
Outlook
Management indicated during the least earnings call that there is no cash or leverage
targets for the company. Management expects FY13 and FY14 capex to be roughly $1.5
billion (including $750 million related to growth capex in the next two years), up $300
million from FY12.
Credit View
The company exhibits a strong credit profile supported by a leading market position in
key commodities, and a very conservative financial profile, with low leverage and
strong cash flow generation and liquidity.
Since emerging from bankruptcy, the company’s performance and margins have
improved significantly helped by strong market conditions, underpinned by low cost
NGL feedstocks. Going forward, LYB’s margins may be challenged by softening of
commodity plastics pricing and oversupplied markets given additional capacity coming
to market in the U.S. and Asia (although the bulk of the new projects are not expected
to come on-line until 2017), and a higher feedstock environment.
Still, LYB’s outlook continues to look fundamentally strong given the very attractive
cash flow profile, low leverage and attractive exposure to low-cost NGLs in North
America where LYB derives most of its exposure. In particular, long term prospects
appear robust as ethane fundamentals remain strong. The company should also benefit
from upcoming capacity expansion, adding $1.6 - $2.0 billion of incremental EBITDA by
2016. These projects should preempt other planned capacity expansion in North
America, providing LYB with an ongoing strategic advantage.
Recommendation – Maintain
Maintain position in LYB bond (5.00% bond due 4/15/19 currently yields 2.67%). In
comparison, DOW’s 8.55% bond due 5/15/19 yields 2.95% with slightly higher spreads.
Contact Information:
Sandy Jephson
Senior Credit Analyst
212-324-6014
10 • First Principles Capital Management, LLC LYB • Credit Profile
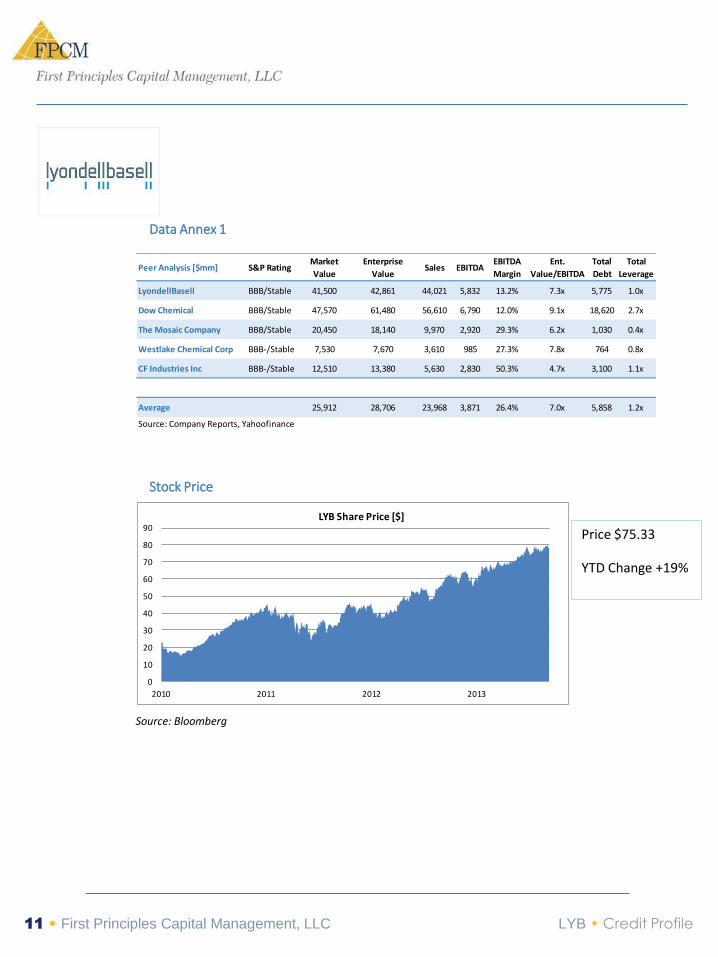
Data Annex 1
Stock Price
Valuation
Price $75.33
YTD Change +19%
Source: Bloomberg
Peer Analysis [$mm] S&P RatingMarket
Value
Enterprise
ValueSales EBITDA
EBITDA
Margin
Ent.
Value/EBITDA
Total
Debt
Total
Leverage
LyondellBasell BBB/Stable 41,500 42,861 44,021 5,832 13.2% 7.3x 5,775 1.0x
Dow Chemical BBB/Stable 47,570 61,480 56,610 6,790 12.0% 9.1x 18,620 2.7x
The Mosaic Company BBB/Stable 20,450 18,140 9,970 2,920 29.3% 6.2x 1,030 0.4x
Westlake Chemical Corp BBB-/Stable 7,530 7,670 3,610 985 27.3% 7.8x 764 0.8x
CF Industries Inc BBB-/Stable 12,510 13,380 5,630 2,830 50.3% 4.7x 3,100 1.1x
Average 25,912 28,706 23,968 3,871 26.4% 7.0x 5,858 1.2x
Source: Company Reports, Yahoofinance
0
10
20
30
40
50
60
70
80
90
2010 2011 2012 2013
LYB Share Price [$]
11 • First Principles Capital Management, LLC LYB • Credit Profile
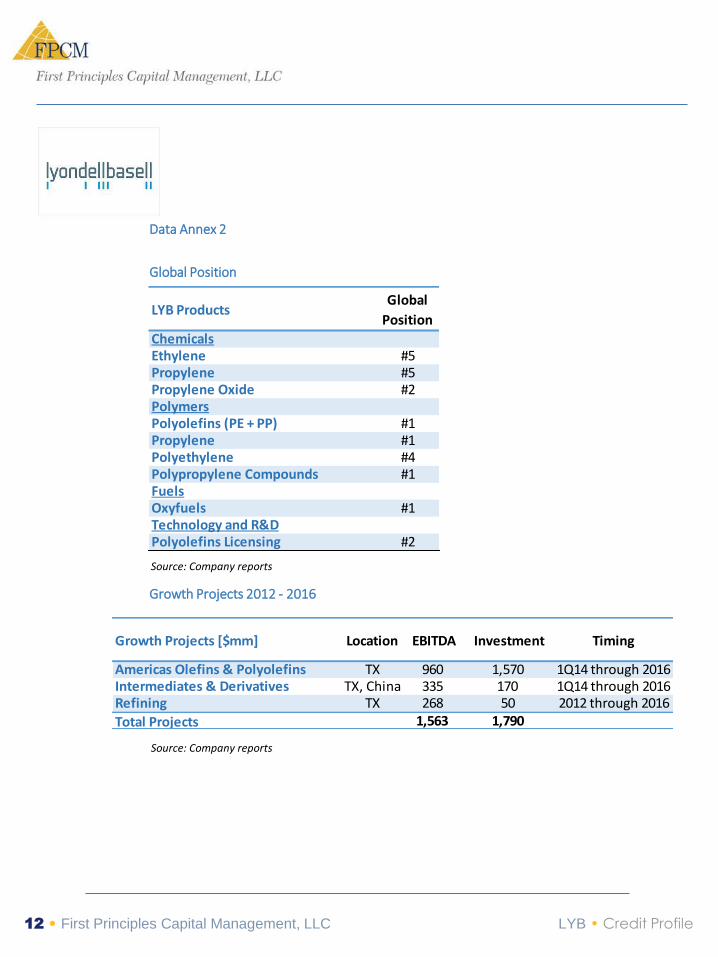
Data Annex 2
Global Position
Growth Projects 2012 - 2016
Source: Company reports
Source: Company reports
LYB ProductsGlobal
Position
ChemicalsEthylene #5Propylene #5Propylene Oxide #2PolymersPolyolefins (PE + PP) #1Propylene #1Polyethylene #4Polypropylene Compounds #1FuelsOxyfuels #1Technology and R&DPolyolefins Licensing #2
Growth Projects [$mm] Location EBITDA Investment Timing
Americas Olefins & Polyolefins TX 960 1,570 1Q14 through 2016Intermediates & Derivatives TX, China 335 170 1Q14 through 2016Refining TX 268 50 2012 through 2016
Total Projects 1,563 1,790
12 • First Principles Capital Management, LLC LYB • Credit Profile
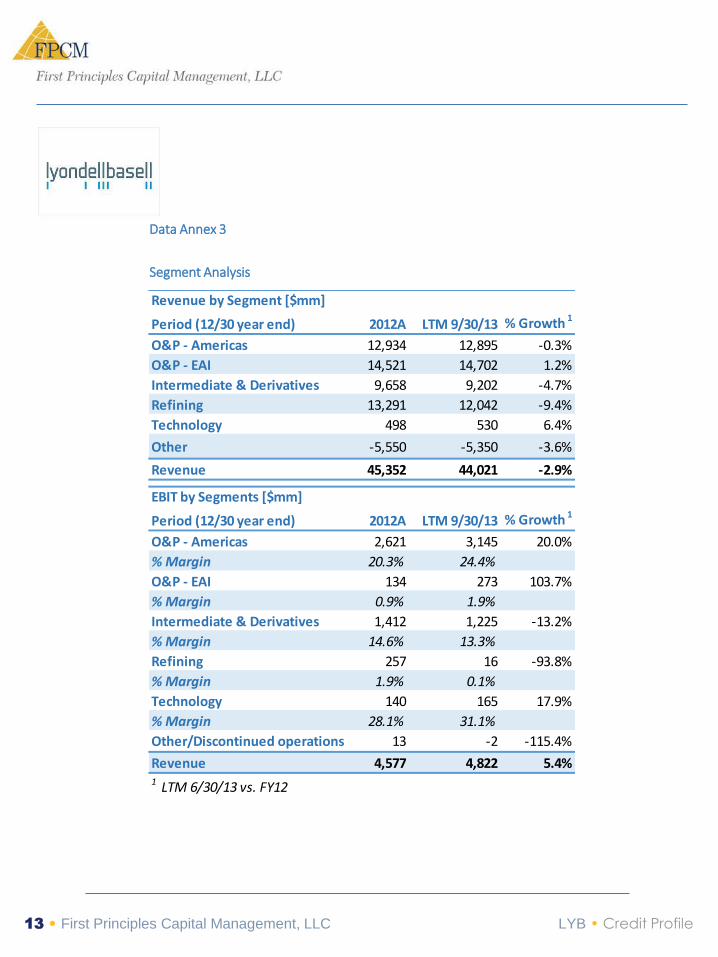
Data Annex 3
Segment Analysis
Period (12/30 year end) 2012A LTM 9/30/13 % Growth 1
O&P - Americas 12,934 12,895 -0.3%
O&P - EAI 14,521 14,702 1.2%
Intermediate & Derivatives 9,658 9,202 -4.7%
Refining 13,291 12,042 -9.4%
Technology 498 530 6.4%
Other -5,550 -5,350 -3.6%
Revenue 45,352 44,021 -2.9%
Period (12/30 year end) 2012A LTM 9/30/13 % Growth 1
O&P - Americas 2,621 3,145 20.0%
% Margin 20.3% 24.4%
O&P - EAI 134 273 103.7%
% Margin 0.9% 1.9%
Intermediate & Derivatives 1,412 1,225 -13.2%
% Margin 14.6% 13.3%
Refining 257 16 -93.8%
% Margin 1.9% 0.1%
Technology 140 165 17.9%
% Margin 28.1% 31.1%
Other/Discontinued operations 13 -2 -115.4%
Revenue 4,577 4,822 5.4%1 LTM 6/30/13 vs. FY12
Revenue by Segment [$mm]
EBIT by Segments [$mm]
13 • First Principles Capital Management, LLC LYB • Credit Profile
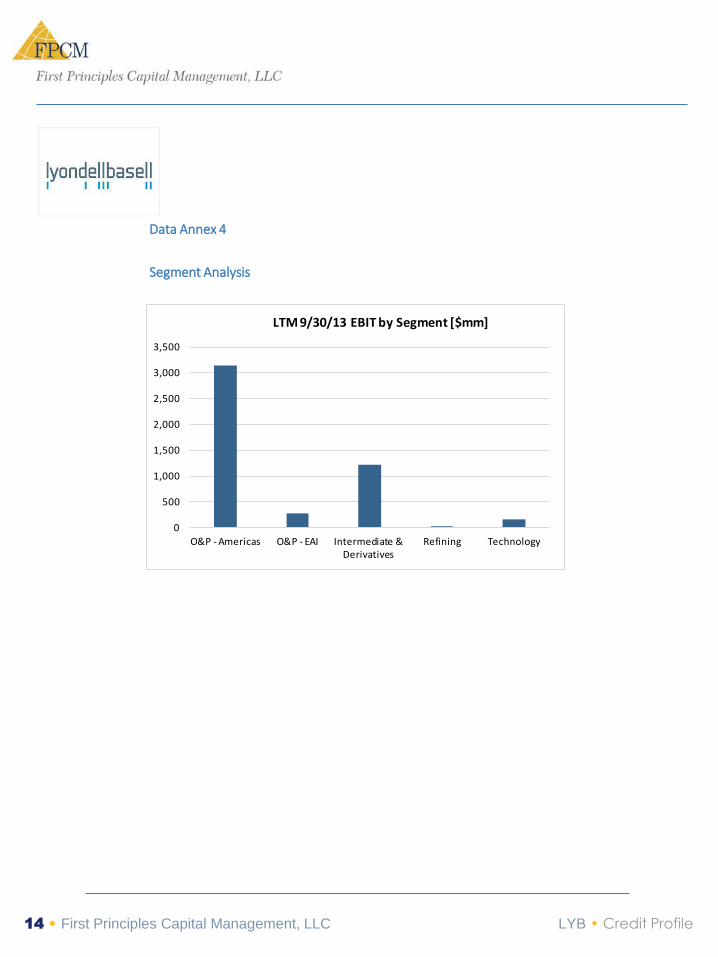
Data Annex 4
Segment Analysis
0
500
1,000
1,500
2,000
2,500
3,000
3,500
O&P - Americas O&P - EAI Intermediate & Derivatives
Refining Technology
LTM 9/30/13 EBIT by Segment [$mm]
14 • First Principles Capital Management, LLC LYB • Credit Profile
15 • First Principles Capital Management, LLC LYB • Credit Profile
Disclosure
Additional information is available upon request. Information has been obtained from
sources believed to be reliable but First Principles Capital Management, LLC or its
affiliates (collectively “FPCM”) do not warrant its completeness or accuracy except with
respect to any disclosures relative to FPCM and the analyst's involvement with the
company that is the subject of the research. All pricing is as of the close of market for
the securities discussed, unless otherwise stated. Opinions and estimates constitute
our judgment as of the date of this material and are subject to change without notice.
Past performance is not indicative of future results. This material is not intended as an
offer or solicitation for the purchase or sale of any financial instrument. The opinions
and recommendations herein do not take into account individual client circumstances,
objectives, or needs and are not intended as recommendations of particular securities,
financial instruments or strategies to particular clients. The recipient of this report must
make its own independent decisions regarding any securities or financial instruments
mentioned herein. Periodic updates may be provided on companies/industries based
on company specific developments or announcements, market conditions or any other
publicly available information.
Copyright FPCM 2014