Embed Size (px)
Citation preview
Galveston Open Government Project
v.
Galveston Poverty Industry
by David StanowskiPresident
Galveston Open Government Project, Inc.
GalvestonOGP.org
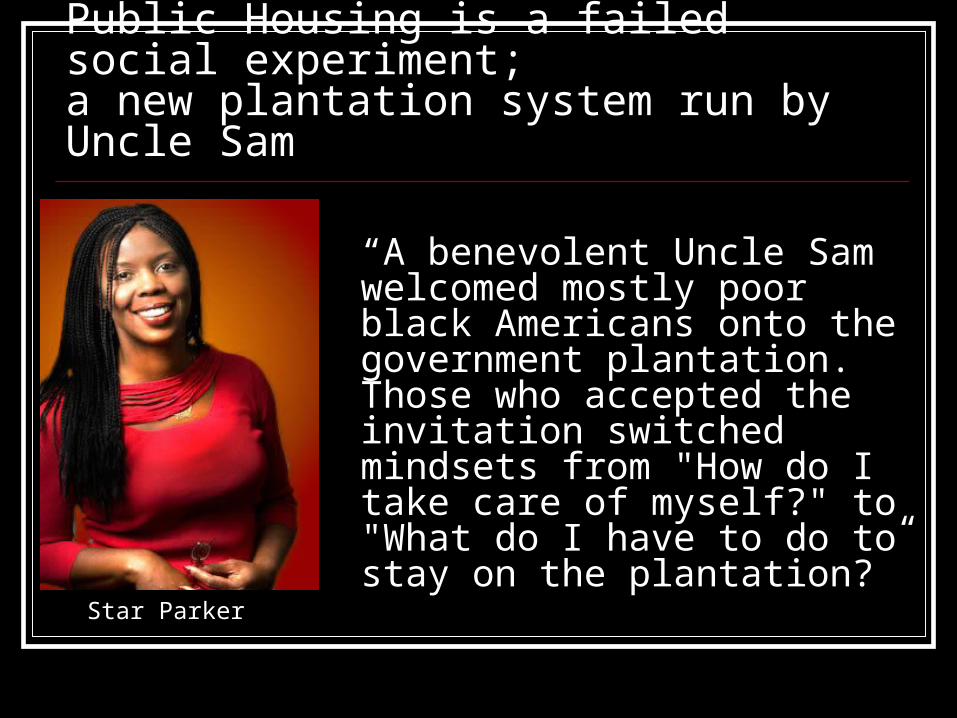
Public Housing is a failed social experiment;a new plantation system run by Uncle Sam
“A benevolent Uncle Sam welcomed mostly poor black Americans onto the government plantation. Those who accepted the invitation switched mindsets from "How do I take care of myself?" to "What do I have to do to stay on the plantation?”
Star Parker
“Instead of solving economic problems, government welfare socialism created monstrous moral and spiritual problems…”
“The legacy of American socialism is our blighted inner cities, dysfunctional inner city schools, and broken black families.”
“Trillions of dollars later, black poverty is the same. But black families are not, with triple the incidence of single-parent homes and out-of-wedlock births.”
Why does Galveston have Public Housing? NO CITY in this country is required to build
and operate public housing. It is the CHOICE of city government. MOST cities choose NOT to build and
operate public housing, because it is a liability NOT an asset.
Galveston is the ONLY city in the County that chooses to have Public Housing.
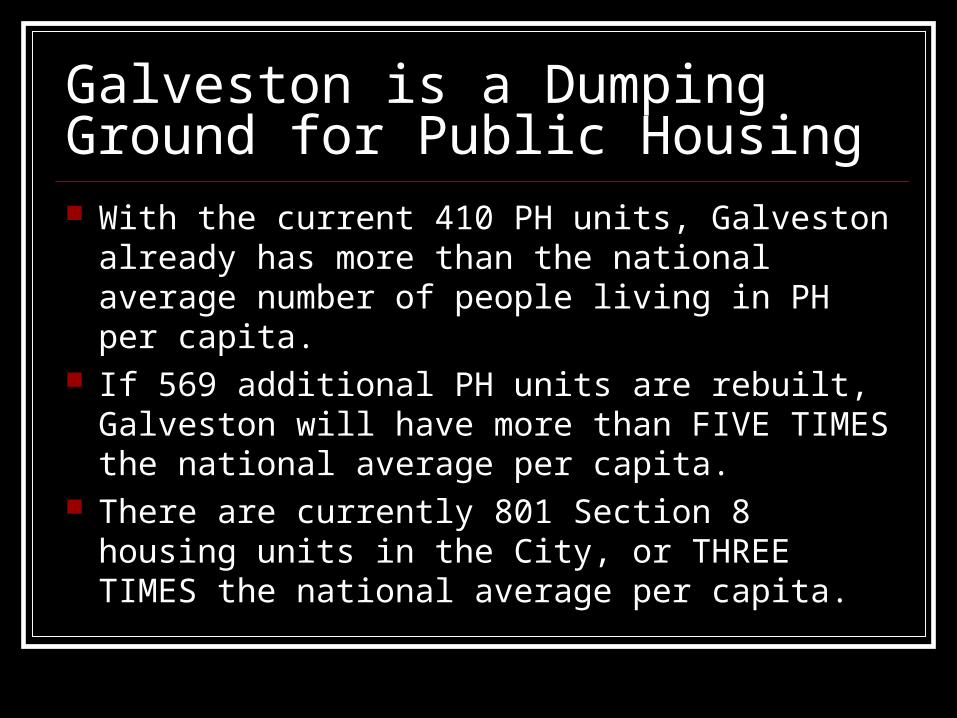
Galveston is a Dumping Ground for Public Housing With the current 410 PH units, Galveston already
has more than the national average number of people living in PH per capita.
If 569 additional PH units are rebuilt, Galveston will have more than FIVE TIMES the national average per capita.
There are currently 801 Section 8 housing units in the City, or THREE TIMES the national average per capita.
Public Housing Density in Galveston versus other SE TX Cities Galveston Beaumont Victoria Bryan Port Arthur Texas City Huntsville Nacogdoches Baytown Houston
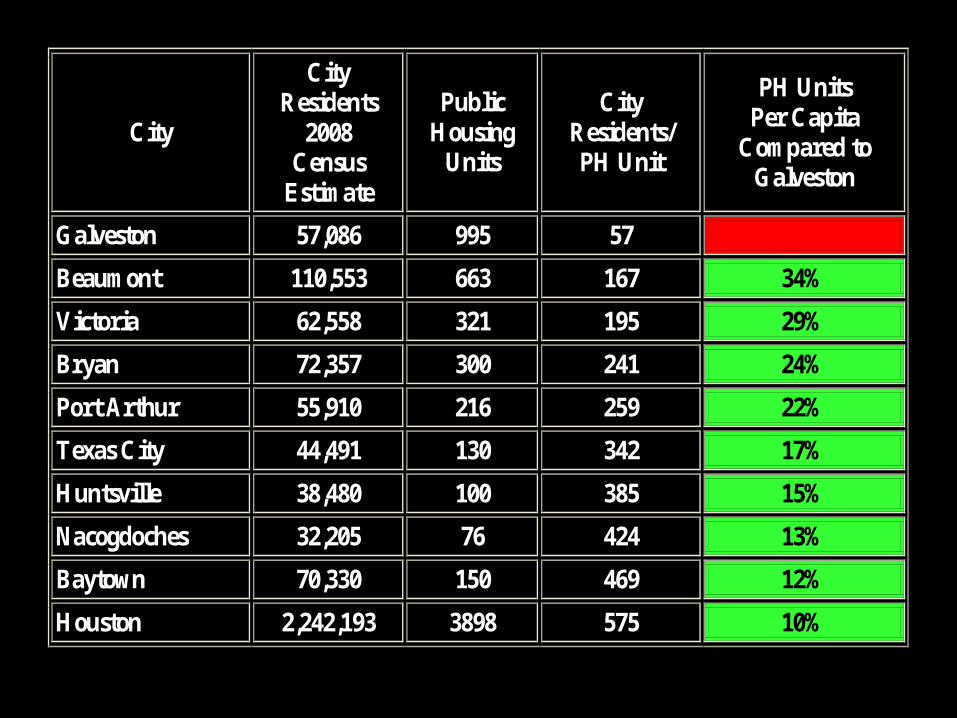
City
City Residents
2008 Census
Estimate
Public Housing
Units
City Residents/ PH Unit
PH Units Per Capita
Compared to Galveston
Galveston 57,086 995 57
Beaumont 110,553 663 167 34%
Victoria 62,558 321 195 29%
Bryan 72,357 300 241 24%
Port Arthur 55,910 216 259 22%
Texas City 44,491 130 342 17%
Huntsville 38,480 100 385 15%
Nacogdoches 32,205 76 424 13%
Baytown 70,330 150 469 12%
Houston 2,242,193 3898 575 10%
What can be done to save Galveston? Plan A: Shut down Public Housing.
Plan B: Force Public Housing into High-Opportunity neighborhoods.
Plan C: Demand GHA rebuild using the authentic East Lake model.
Plan A: Shut Down Public Housing Requires a national campaign. Mobilize support from: Conservative & Libertarian organizations,
politicians, spokesman, and national media. Convince a court that PH is a complete
failure. Legal fund needed may exceed $1 million
(breaking new legal ground).
Plan A: Status Report NO SUPPORT from: Conservative &
Libertarian organizations, politicians, spokesman, and national media.
NO SUPPORT from City government. Fearful citizens: many unwilling to offer
public support and/or donate money. Very unlikely to raise $1 million locally.
Plan B: Force Public Housing into High-Opportunity Neighborhoods Mobilize support from: Liberal & Progressive organizations,
politicians, spokesman, and national media. Convince a court that PH must be built in
high-opportunity neighborhoods; primarily on the Mainland.
Legal fund needed $25,000-$70,000 (following long line of precedent).
Plan B: Status Report No Support from: Liberal & Progressive
organizations, politicians, spokesman, and national media.
Except, the Kirwan Institute will be doing a “Communities of Opportunity” study.
City government might support this plan. Legal fees are doable.
Plan C: Demand GHA rebuild using the Authentic East Lake model East Lake developments seem to be the Public
Housing model that will have the least negative impact on the community.
They achieve their superior results by offering:
private security, and on-site: charter schools, child development centers, community centers, PLUS day-care and after-school programs.
Plan C: Status Report The GHA does NOT have a plan to build any
PH units following the authentic East Lake model. They are pretending that scattered sites can achieve the same results. Bait-and-switch.
Scattered sites cannot possibly offer the facilities that produce the superior results of East Lake developments.
No legal challenge available; it is a political issue that must be debated with the Mayor.
Focus on Plan B.Force the GHA to follow the latest interpretations of the Fair Housing Act.
Professor John A. Powell: Co-founded the Poverty & Race Research Action Council
(PRRAC), Founded the Institute on Race and Poverty (IRP) at the
University of Minnesota, and the Kirwan Institute for the Study of Race & Ethnicity at
Ohio State University. He is also the former National Legal Director of the American
Civil Liberties Union (ACLU). He is widely recognized as a premier expert on issues
relating to race, ethnicity, poverty, and the law, and currently serves as the executive director of the Kirwan Institute.
Communities of Opportunity Professor Powell was one of the primary expert
witnesses in the Thompson v HUD case, and proposed a “Communities of Opportunity” approach to guide the remedy.
As Professor Powell ranked each census tract in the Baltimore metropolitan area, it became obvious that there were not enough "high-opportunity" neighborhoods in the City itself that could serve as acceptable locations for Public Housing.
Regional Approach For this reason, his analysis convinced the court that the
remedy must look to and include the surrounding area in a regional approach. Exactly what HUD says should be done in its "Fair Housing Planning Guide", dated March 1996.
There is little doubt that the Communities of Opportunity approach is what should be used to guide the proper selection of Public Housing locations in Galveston County.
The Kirwan Institute has generously offered to do a Communities of Opportunity study of Galveston County!!!!
Measuring Opportunity Opportunity is measured in three primary categories: Economic Opportunity and Mobility, Neighborhood Health, and Educational Opportunity. Census tracts define neighborhoods which are classified
into five groups (very-low, low, moderate, high, and very-high opportunity) based on the quintile in which their opportunity index scores fall.
Public Housing should be located in high-opportunity neighborhoods.

Indicators of Economic Opportunity and Mobility: Job growth over the most recent 4-year period. The number of entry-level and low-skill jobs. The number of entry-level and low-skill jobs per
capita. The percentage of the area within one-half mile
of a public transit line. The median commute time.
Indicators of Neighborhood Health:
Population change over the last 10 years. Crime rate. Poverty rate. Vacant property rates. Median value of owner-occupied homes.
Indicators of Educational Opportunity: The percentage of elementary and middle school
students qualifying for free and reduced lunch. The percentage of classes taught by highly
qualified teachers. The percentage of elementary school students
proficient in reading. The percentage of elementary school students
proficient in math.
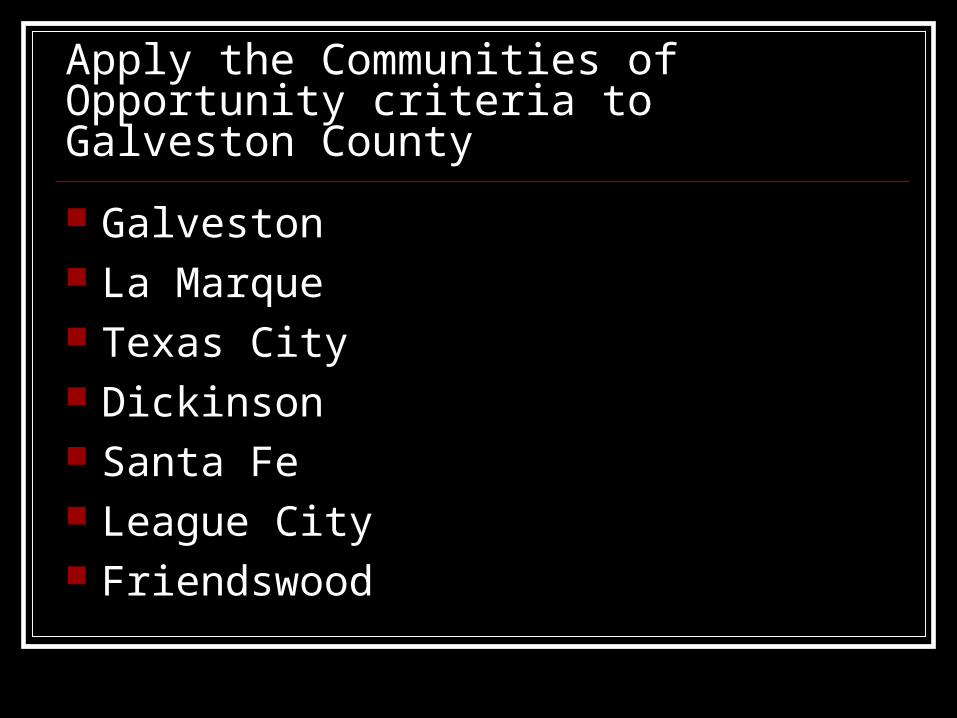
Apply the Communities of Opportunity criteria to Galveston County
Galveston La Marque Texas City Dickinson Santa Fe League City Friendswood
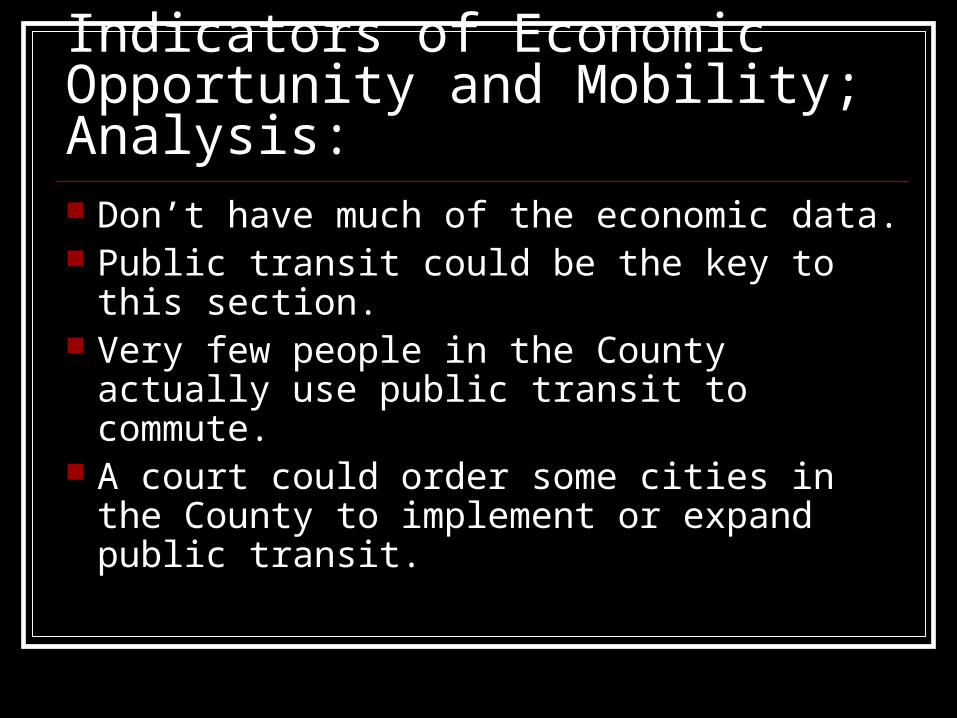
Indicators of Economic Opportunity and Mobility; Analysis: Don’t have much of the economic data. Public transit could be the key to this
section. Very few people in the County actually use
public transit to commute. A court could order some cities in the
County to implement or expand public transit.
Indicators of Neighborhood Health:
Indicators of Neighborhood Health:
Indicators of Neighborhood Health; Analysis:
See tables that follow:
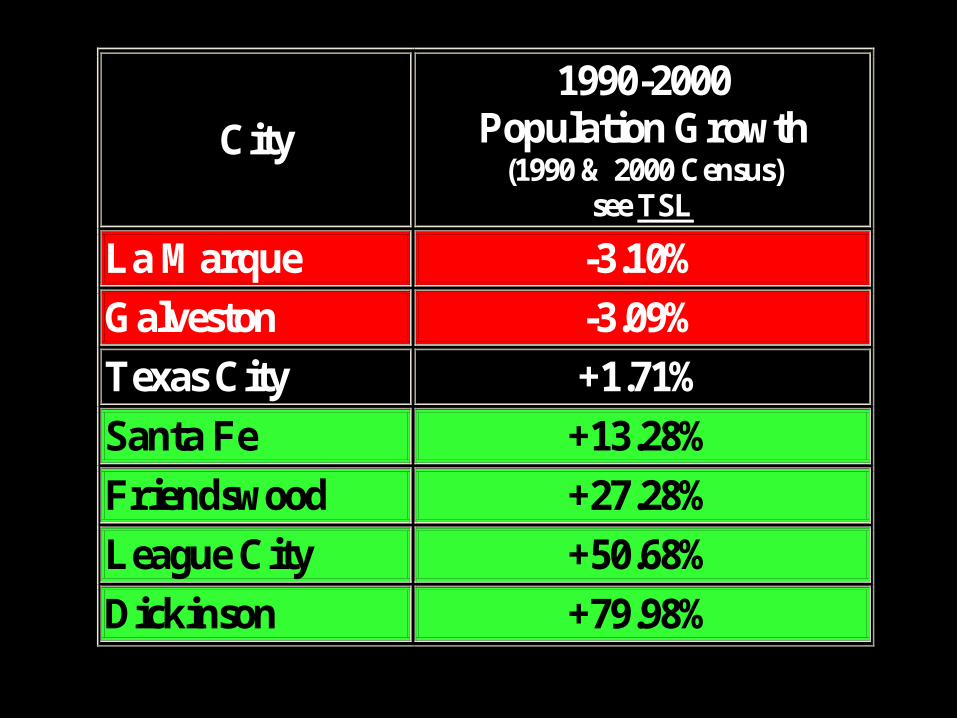
City
1990-2000 Population Growth
(1990 & 2000 Census) see TSL
La Marque -3.10%
Galveston -3.09%
Texas City +1.71%
Santa Fe +13.28%
Friendswood +27.28%
League City +50.68%
Dickinson +79.98%
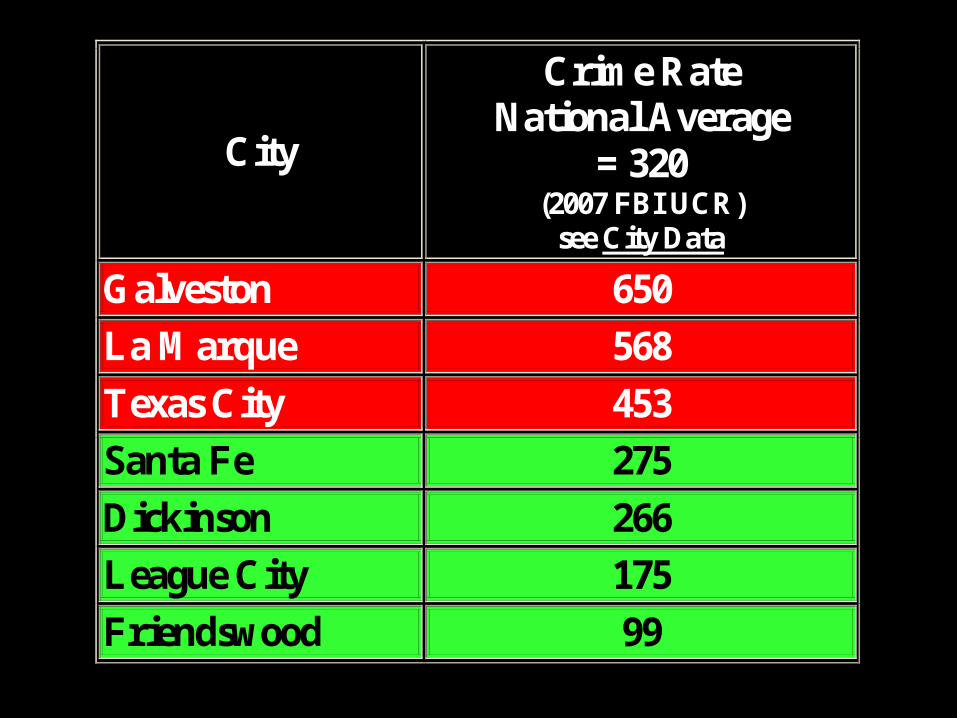
City
Crime Rate National Average
= 320 (2007 FBI UCR)
see City Data
Galveston 650
La Marque 568
Texas City 453
Santa Fe 275
Dickinson 266
League City 175
Friendswood 99
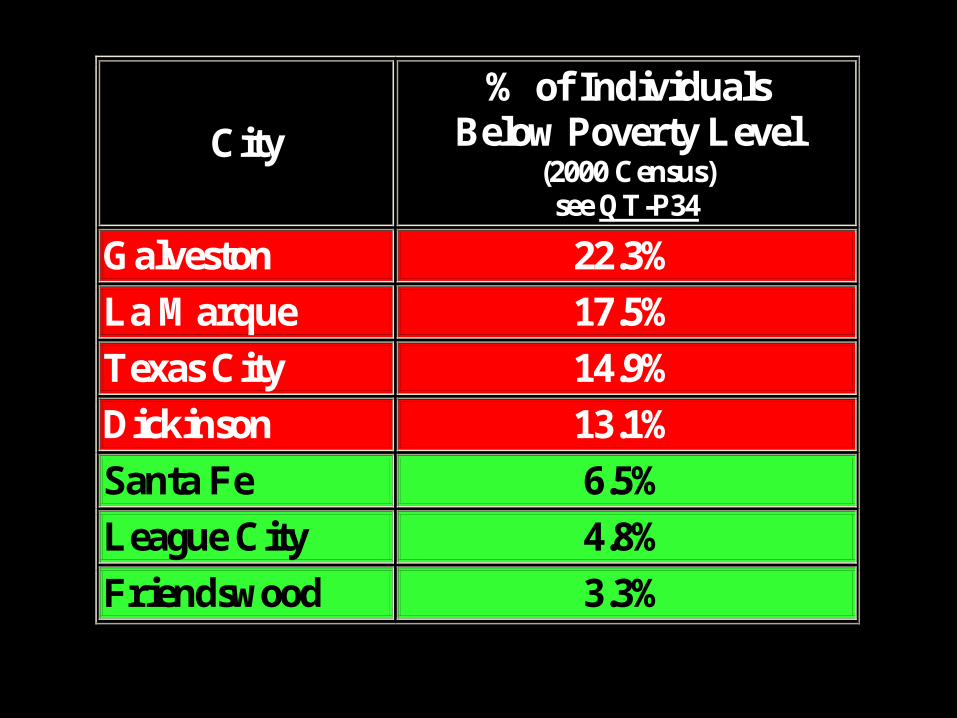
City
% of Individuals Below Poverty Level
(2000 Census) see QT-P34
Galveston 22.3%
La Marque 17.5%
Texas City 14.9%
Dickinson 13.1%
Santa Fe 6.5%
League City 4.8%
Friendswood 3.3%
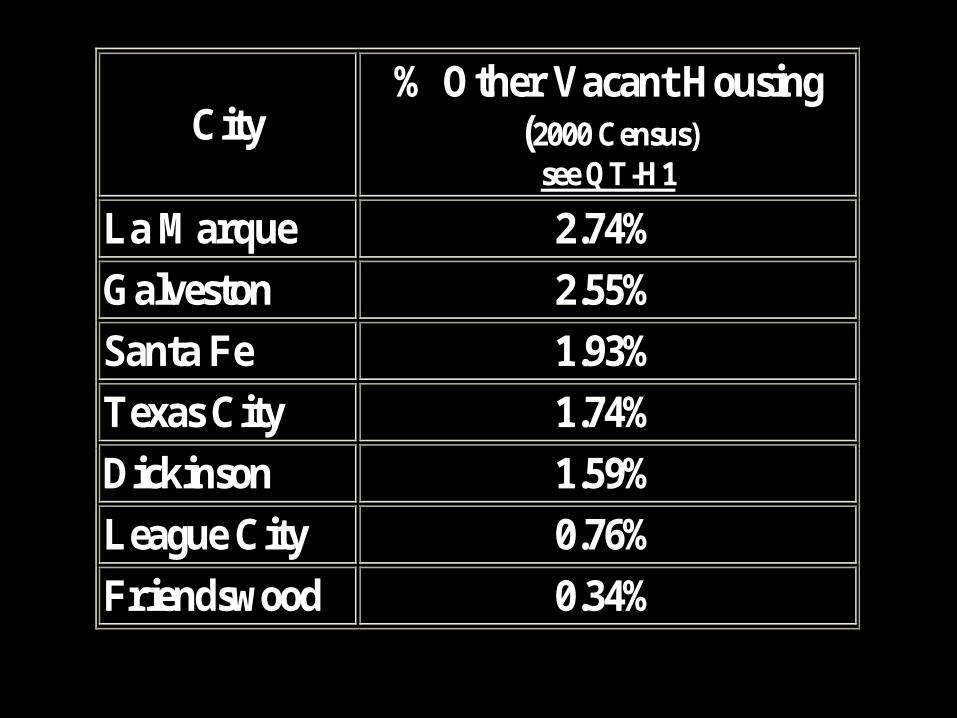
City
% Other Vacant Housing (2000 Census)
see QT-H1 La Marque 2.74%
Galveston 2.55%
Santa Fe 1.93%
Texas City 1.74%
Dickinson 1.59%
League City 0.76%
Friendswood 0.34%
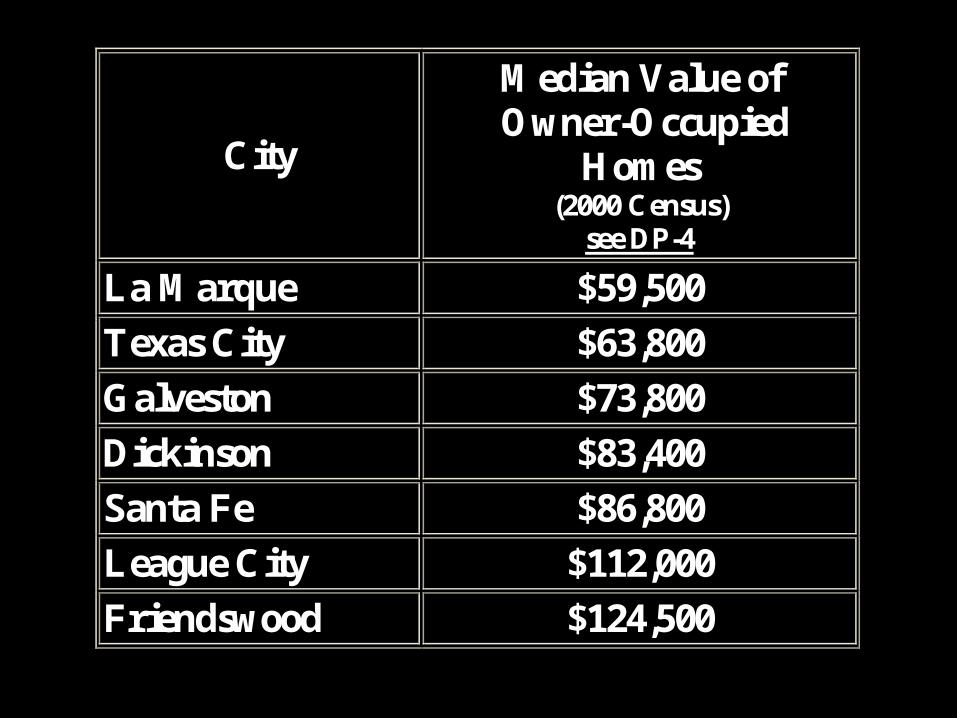
City
Median Value of Owner-Occupied
Homes (2000 Census)
see DP-4 La Marque $59,500
Texas City $63,800
Galveston $73,800
Dickinson $83,400
Santa Fe $86,800
League City $112,000
Friendswood $124,500
Indicators of Educational Opportunity; Analysis:
See tables that follow:
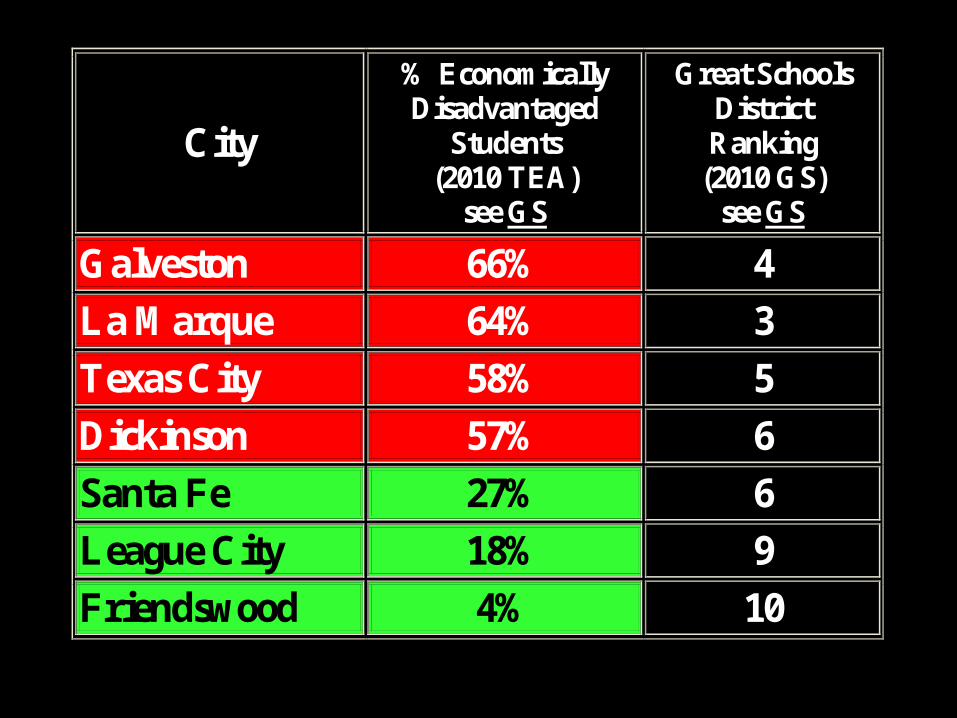
City
% Economically Disadvantaged
Students (2010 TEA)
see GS
Great Schools District Ranking
(2010 GS) see GS
Galveston 66% 4
La Marque 64% 3
Texas City 58% 5
Dickinson 57% 6
Santa Fe 27% 6
League City 18% 9
Friendswood 4% 10
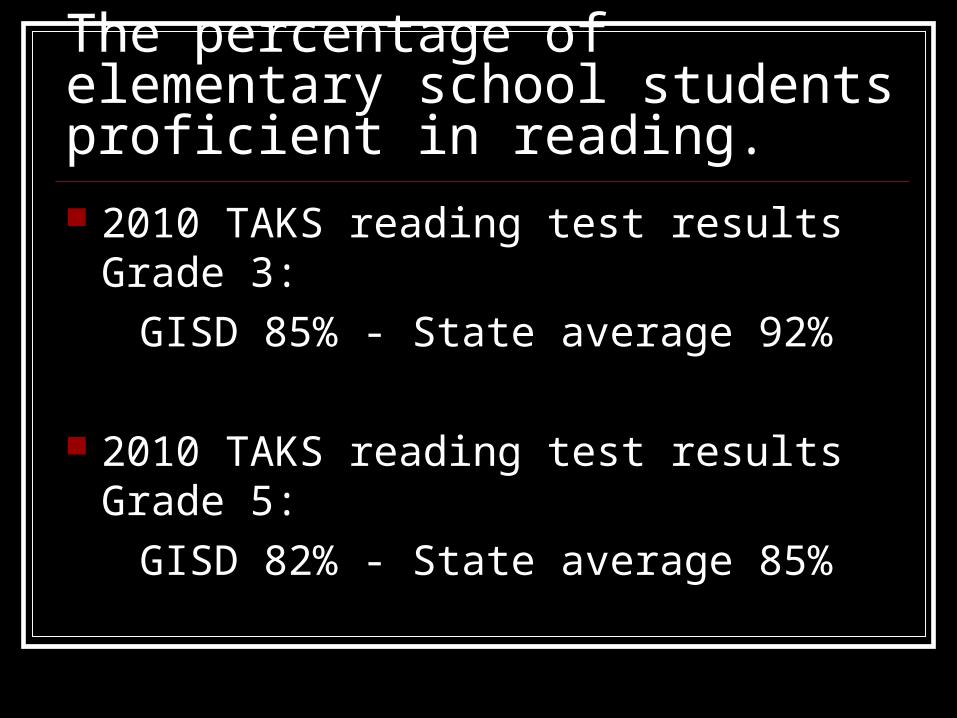
The percentage of elementary school students proficient in reading.
2010 TAKS reading test results Grade 3:
GISD 85% - State average 92%
2010 TAKS reading test results Grade 5:
GISD 82% - State average 85%
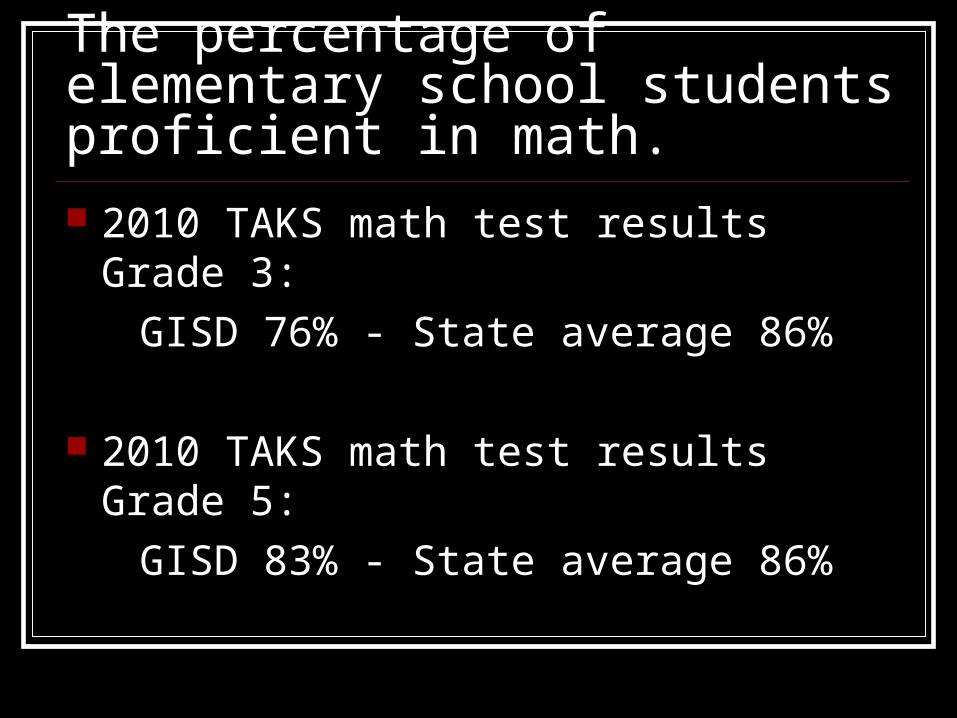
The percentage of elementary school students proficient in math.
2010 TAKS math test results Grade 3:
GISD 76% - State average 86%
2010 TAKS math test results Grade 5:
GISD 83% - State average 86%
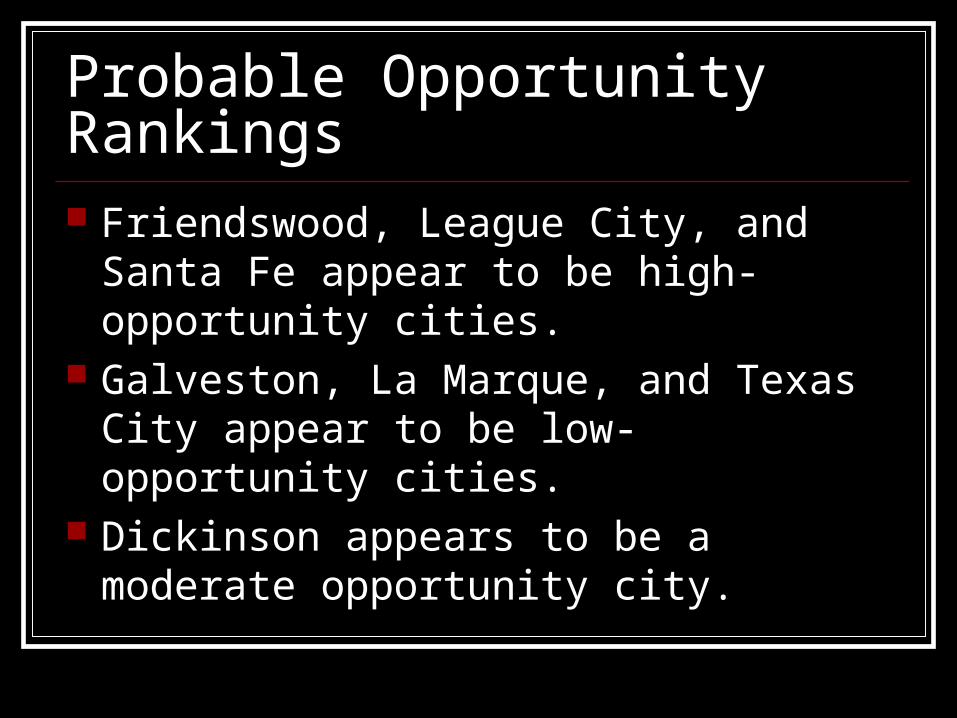
Probable Opportunity Rankings Friendswood, League City, and Santa Fe
appear to be high-opportunity cities. Galveston, La Marque, and Texas City
appear to be low-opportunity cities. Dickinson appears to be a moderate
opportunity city.
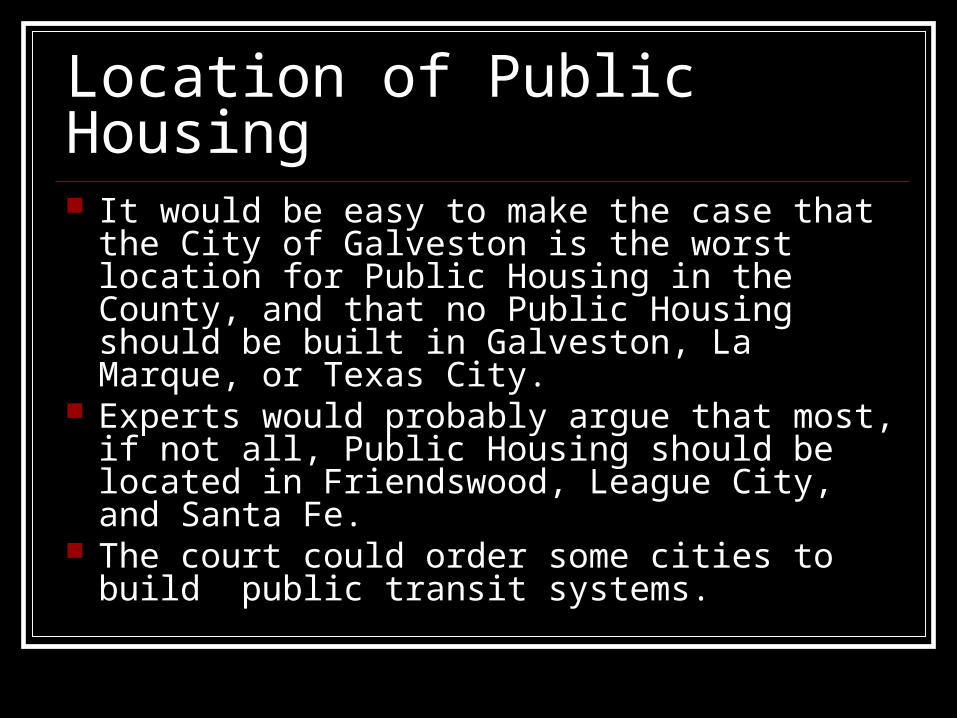
Location of Public Housing It would be easy to make the case that the City
of Galveston is the worst location for Public Housing in the County, and that no Public Housing should be built in Galveston, La Marque, or Texas City.
Experts would probably argue that most, if not all, Public Housing should be located in Friendswood, League City, and Santa Fe.
The court could order some cities to build public transit systems.
City of Galveston; Analysis by Census Tract
Poverty. Race and Ethnicity.
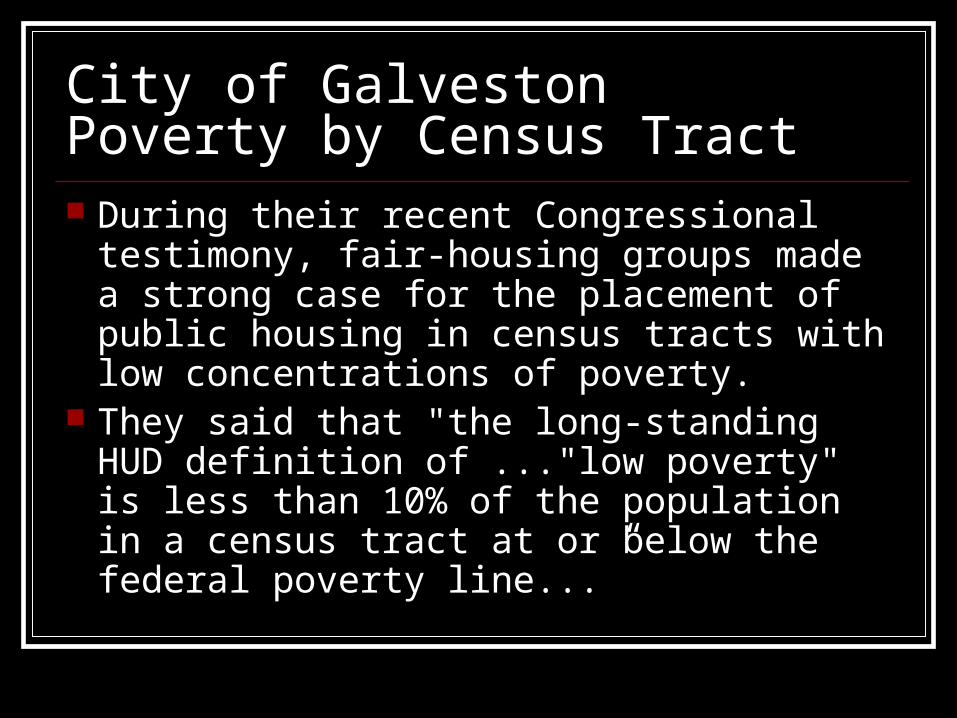
City of Galveston Poverty by Census Tract During their recent Congressional
testimony, fair-housing groups made a strong case for the placement of public housing in census tracts with low concentrations of poverty.
They said that "the long-standing HUD definition of ..."low poverty" is less than 10% of the population in a census tract at or below the federal poverty line...”
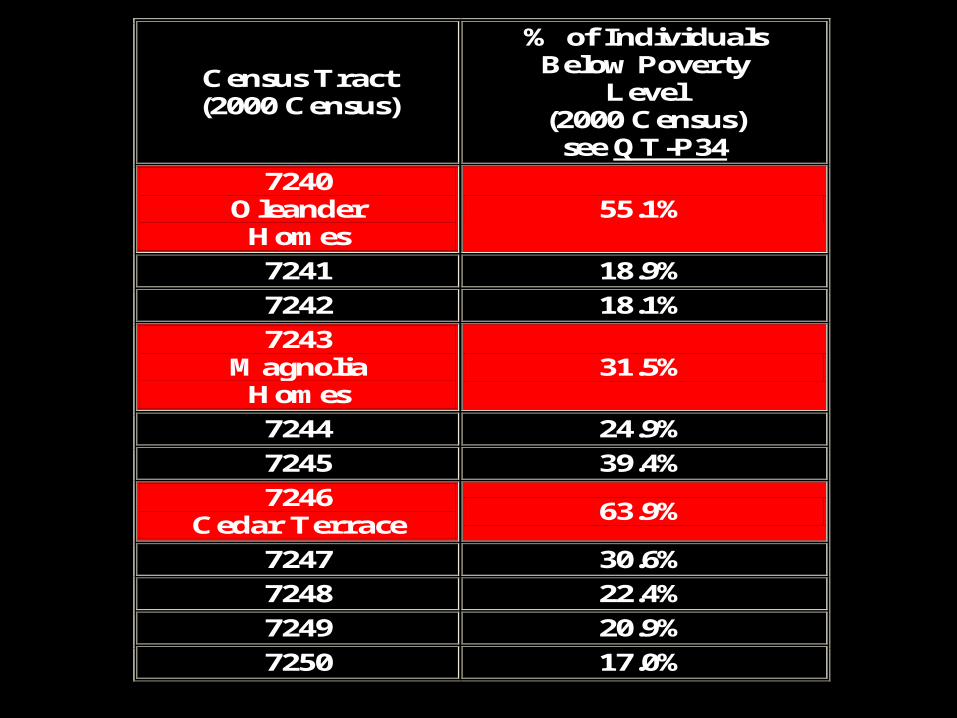
Census Tract (2000 Census)
% of Individuals Below Poverty
Level (2000 Census)
see QT-P34
7240 Oleander
Homes
55.1%
7241 18.9%
7242 18.1%
7243 Magnolia
Homes
31.5%
7244 24.9%
7245 39.4%
7246 Cedar Terrace
63.9%
7247 30.6%
7248 22.4%
7249 20.9%
7250 17.0%
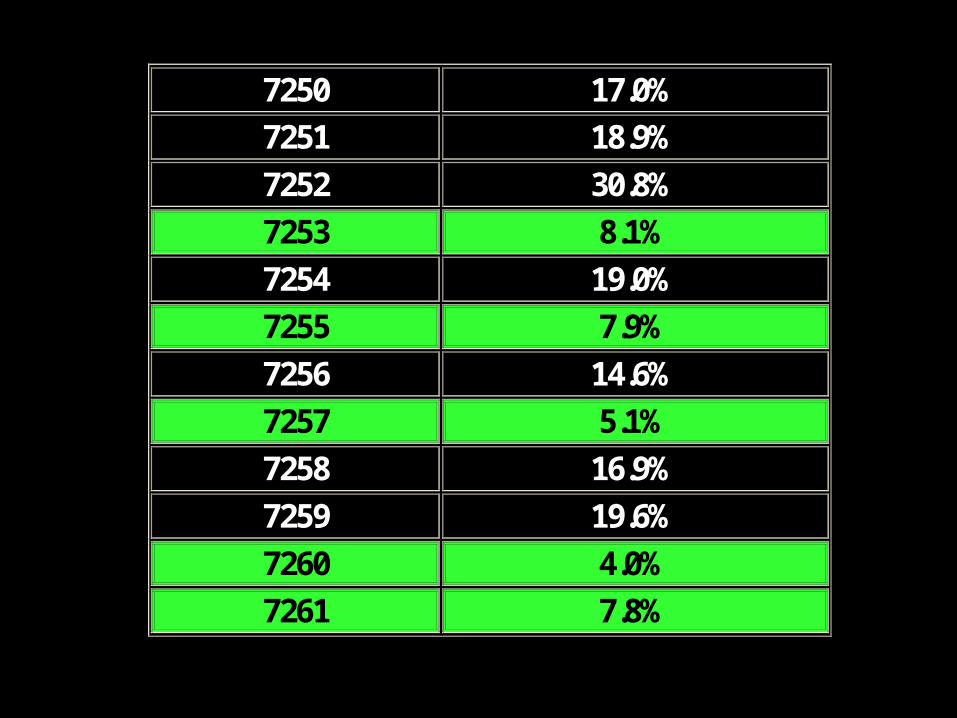
7250 17.0%
7251 18.9%
7252 30.8%
7253 8.1%
7254 19.0%
7255 7.9%
7256 14.6%
7257 5.1%
7258 16.9%
7259 19.6%
7260 4.0%
7261 7.8%
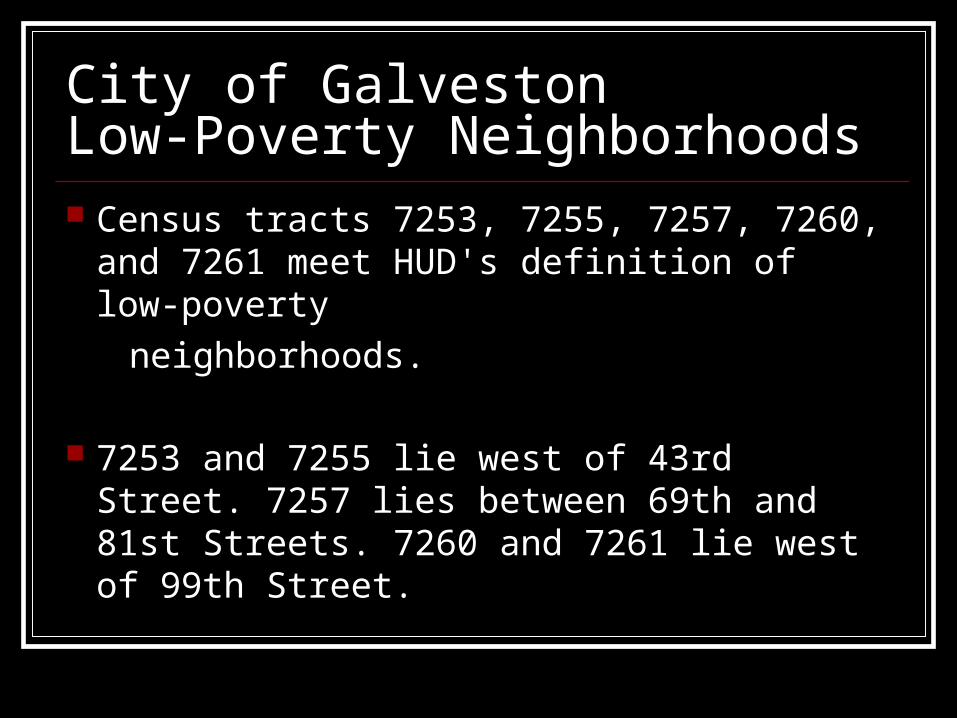
City of GalvestonLow-Poverty Neighborhoods
Census tracts 7253, 7255, 7257, 7260, and 7261 meet HUD's definition of low-poverty
neighborhoods.
7253 and 7255 lie west of 43rd Street. 7257 lies between 69th and 81st Streets. 7260 and 7261 lie west of 99th Street.
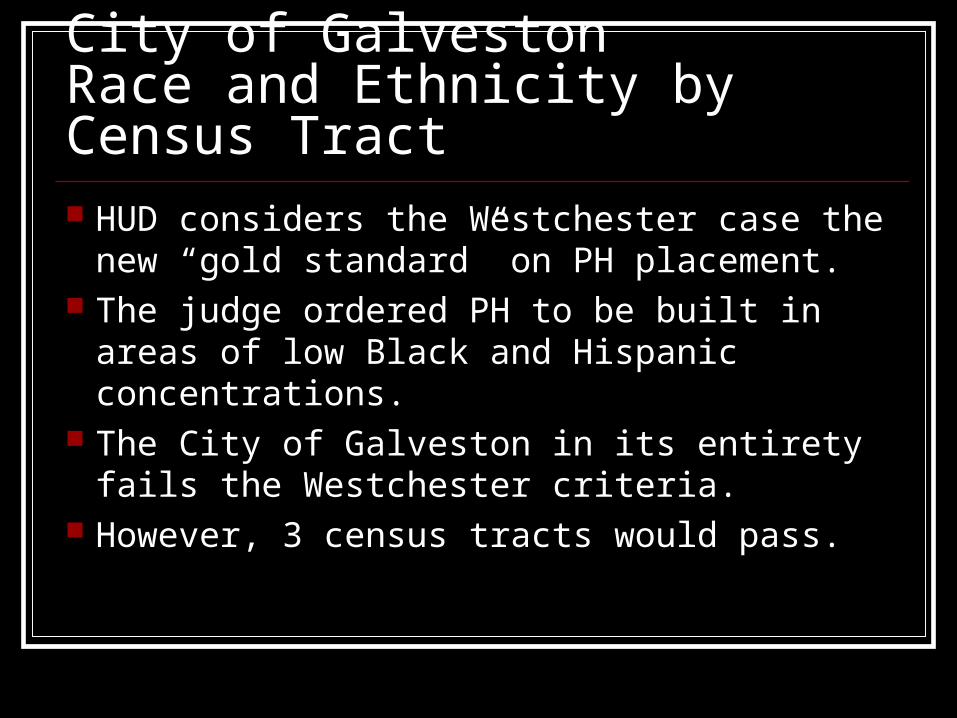
City of GalvestonRace and Ethnicity by Census Tract
HUD considers the Westchester case the new “gold standard” on PH placement.
The judge ordered PH to be built in areas of low Black and Hispanic concentrations.
The City of Galveston in its entirety fails the Westchester criteria.
However, 3 census tracts would pass.
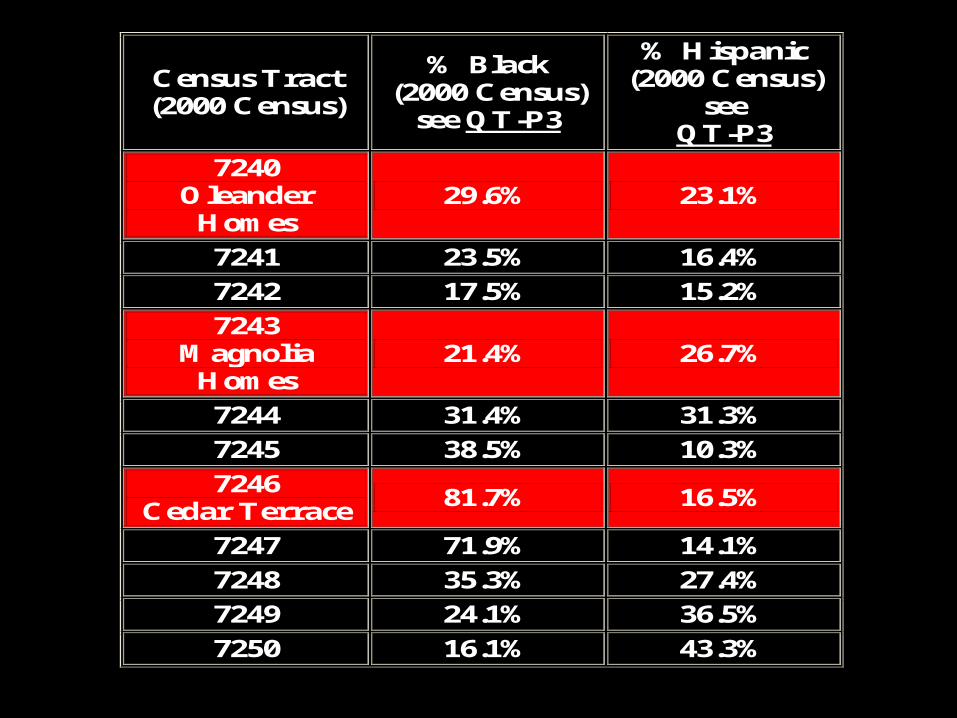
Census Tract (2000 Census)
% Black (2000 Census)
see QT-P3
% Hispanic (2000 Census)
see QT-P3
7240 Oleander
Homes
29.6% 23.1%
7241 23.5% 16.4%
7242 17.5% 15.2%
7243 Magnolia
Homes
21.4% 26.7%
7244 31.4% 31.3%
7245 38.5% 10.3%
7246 Cedar Terrace
81.7% 16.5%
7247 71.9% 14.1%
7248 35.3% 27.4%
7249 24.1% 36.5%
7250 16.1% 43.3%
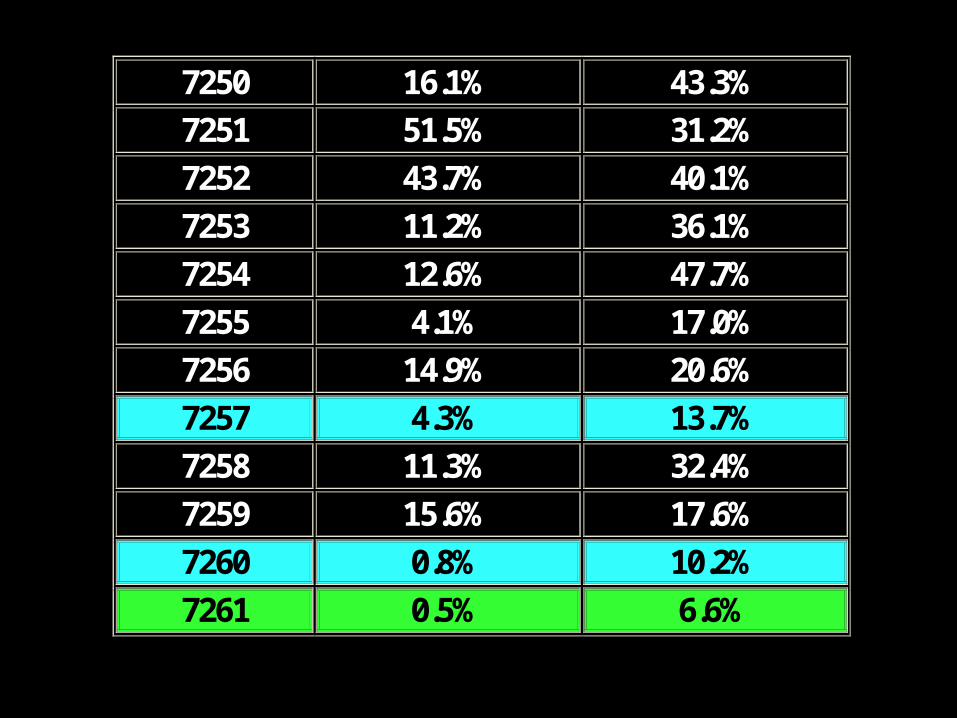
7250 16.1% 43.3%
7251 51.5% 31.2%
7252 43.7% 40.1%
7253 11.2% 36.1%
7254 12.6% 47.7%
7255 4.1% 17.0%
7256 14.9% 20.6%
7257 4.3% 13.7%
7258 11.3% 32.4%
7259 15.6% 17.6%
7260 0.8% 10.2%
7261 0.5% 6.6%
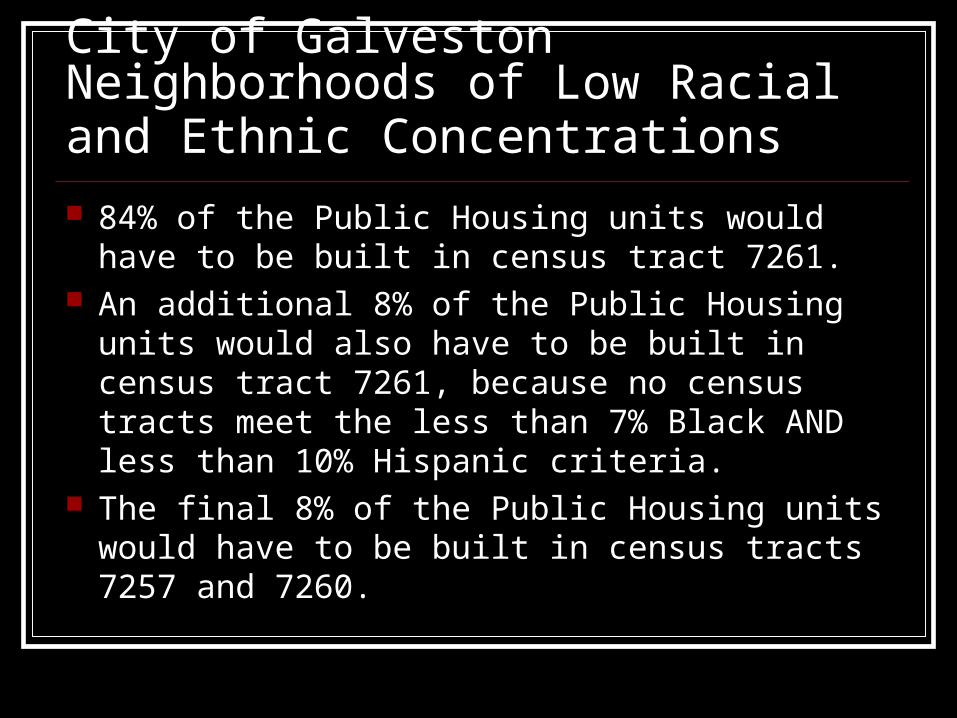
City of Galveston Neighborhoods of Low Racial and Ethnic Concentrations 84% of the Public Housing units would have to be
built in census tract 7261. An additional 8% of the Public Housing units
would also have to be built in census tract 7261, because no census tracts meet the less than 7% Black AND less than 10% Hispanic criteria.
The final 8% of the Public Housing units would have to be built in census tracts 7257 and 7260.
Should any PH be built in Galveston? It is certainly possible that a few census
tracts in the City of Galveston may qualify as high-opportunity neighborhoods.
Some of the 5 census tracts selected above might pass the full screening; all lie west of 43rd Street.
However, there are certainly better choices on the Mainland.
Is this the Tipping Point? Galveston is a wonderful and even magical place,
but it is very fragile, because it has been locked into a long and painful decline for the last 50 years, so it simply does not have the strength to shoulder the tremendous burden of additional Public Housing. This is why the GOGP will continue to insist upon a policy that will place all new Public Housing in other parts of the County!
We Have a Lawyer! After two years, the GOGP has found a lawyer
who will represent the people’s interest!! He will begin with a research effort to suggest the
best cause of action. If the GHA does not adopt a Communities of
Opportunity approach to develop its actual plans; A lawsuit will be filed.