Embed Size (px)
DESCRIPTION
centrifugal compressors
Citation preview
Copyright 2003, Pipeline Simulation Interest Group This paper was prepared for presentation at the PSIG Annual Meeting held in Williamsburg, Virginia, 11 October – 13 October 2006. This paper was selected for presentation by the PSIG Board of Directors following review of information contained in an abstract submitted by the author(s). The material, as presented, does not necessarily reflect any position of the Pipeline Simulation Interest Group, its officers, or members. Papers presented at PSIG meetings are subject to publication review by Editorial Committees of the Pipeline Simulation Interest Group. Electronic reproduction, distribution, or storage of any part of this paper for commercial purposes without the written consent of PSIG is prohibited. Permission to reproduce in print is restricted to an abstract of not more than 300 words; illustrations may not be copied. The abstract must contain conspicuous acknowledgment of where and by whom the paper was presented. Write Librarian, Pipeline Simulation Interest Group, P.O. Box 22625, Houston, TX 77227, U.S.A., fax 01-713-586-5955.
ABSTRACT Thermo-hydraulic simulations of centrifugal
compressors are usually based on a set of information derived from manufacturer design tools that are used for compressor modeling.
When operating gas pipelines transportation companies use the simulation tool to predict and anticipate the behavior of the gas pipeline under different scenarios. The operation with different gas compositions from different supplies is not uncommon as well as the exposure to gas quality changes whenever contingencies happen to the gas processing plants.
This paper address this important subject, presents a methodology of evaluation, a sensitivity study using different gas qualities and shows the impact on compression overall performance.
A compressor is selected based on a set of conditions and then is checked for performance changes when working with different gas quality. The results are presented for comparison purposes and some suggestions are also presented on how to handle this situation to guarantee that the thermo-hydraulic simulation tools will always provide good results when dealing with natural gas quality changes.
INTRODUCTION It is not uncommon to operate a gas pipeline with
different gas compositions and even in those pipelines where we expect a stable operating condition operating problems from gas supply may cause the gas to be out of specification. The purpose of this paper is to evaluate this scenario and
check its influence on centrifugal compressor performance and then suggest a procedure that might help designers, operating companies and also vendors to deal with such a situation.
TECHNOLOGY DEVELOPMENT The development of centrifugal compressor and gas
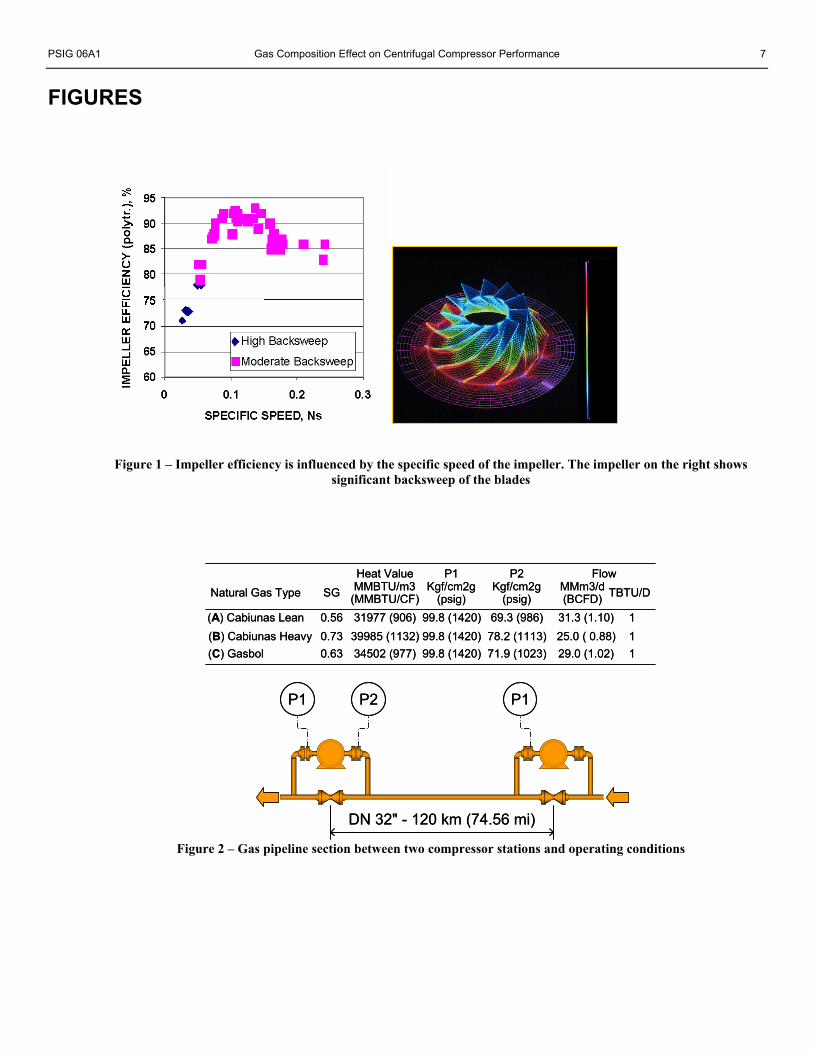
turbine design through the last 20 years has been impressive. Pipeline compressors now routinely achieve or exceed 85% isentropic efficiency, while exhibiting wide operating ranges. The study of operating scenarios suggests certain requirements for the compression system. Beyond the quest for higher compressor peak efficiencies, the operating requirements set forth in this study, as well as in other references (Kurz, 2001) require a compressor capable of operating over a wide operating range at high efficiency.
A wide operating range in a centrifugal compressor (figure 1) can be achieved by a combination of means. Aerodynamic theory suggests a strong relationship between operating range, efficiency and impeller backsweep1. However, there is a practical limit to the amount of backsweep. In particular, increasing backsweep reduces the capability of an impeller of given tip speed to make head. With the capability to use two impellers in a casing, this perceived disadvantage can be eliminated. The operating range is further increased by the use of vaneless diffusers.
The aerodynamic aspects can be considered with the following:
4/3
2/1
HQNNs = (1)
Equation (1), and the subsequent discussion use N in min-1, H in J/kg, and Q in m3/s.
Centrifugal impellers can be described by their
specific speed, where a high specific speed depicts a low head, high flow impeller. There is a range of specific speeds where centrifugal impellers tend to exhibit good aerodynamic performance, while both very low and very high specific speeds penalize the performance. Specific speeds between
1 Backsweep: Impeller blade geometry such, that the blades at the impeller exit, point into a direction against the rotation of the impeller. The flow (in a coordinate system rotating with the impeller) therefore leaves the impeller in a more tangential direction.
PSIG 06A1
Gas Composition Effect on Centrifugal Compressor Performance Sidney Pereira dos Santos, PETROBRAS Matt Lubomirsky, SOLAR TURBINES
2 SIDNEY P. SANTOS, MATT LUBOMIRSKY PSIG 06A1
0.09 and 0.14 tend to yield good efficiency. Mixed flow impellers can extend this range to higher specific speeds.
It must be noted that the actual running speed (N) is determined by the power turbine speed of the gas turbine, unless a gearbox is used. For aerodynamic and mechanical reasons, power turbine speeds are lower for larger gas turbines than for smaller ones. For example, a typical 15-MW (20,000-hp) class gas turbine may have a power turbine speed of about 8500 rpm, while a typical 3.5-MW (5000-hp) class gas turbine may run at about 16,000 rpm.
METHODOLOGY The proposed methodology assumes that the gas
volumes to be delivered to the market (Gas Fired Power Plant or Local Distribution Company) are energy based. Different gas compositions have different LHV (Low Heat Value) and for the same amount of energy gas volumes may differ significantly impacting compressor performance, temperature and pressure drop across the pipeline. The following steps were adopted:
1. Identify different gas compositions 2. Run thermo-hydraulic simulations using generic
compressor 3. Pre-select compressors and drivers based on the
thermo-hydraulic results 4. Check compressors efficiencies 5. Check the overall efficiencies for compressor units
(Compressor + Gas turbine) 6. Perform technical and economic evaluation 7. Make the final decision on the equipment selection.
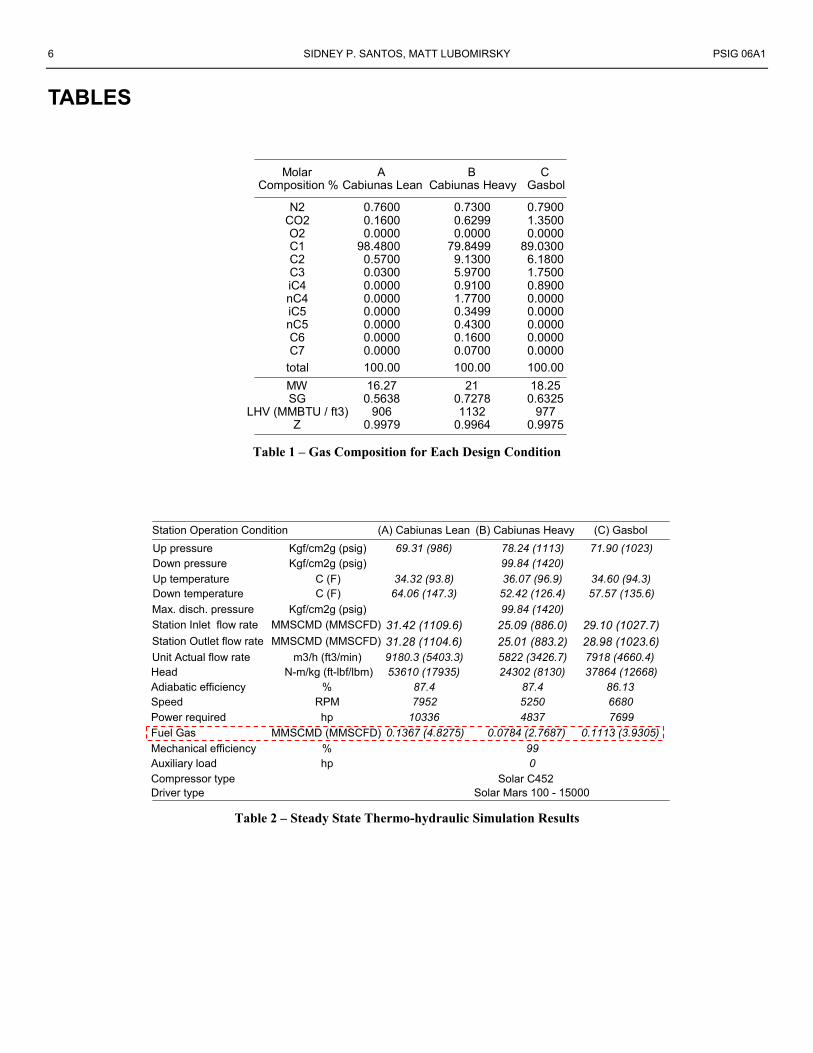
Thermo-hydraulic Simulation – Steady State
The thermo-hydraulic simulations were performed using generic compressors and drivers, in steady state, for three different gas compositions (table 1) and the results are presented (figure 2 and table2).
Pre-selection of Equipment
Pre-selection of equipment was based on gas compositions and conditions taken from the thermo-hydraulic simulations.
To properly design and select compressor stages a few issues should be taken into consideration. The project specifics dictated, in this case, the need to operate at a substantial range of gas specific gravities and, thus, energy content. Since the amount of energy that should be delivered to the consumer is defined, the actual compressor station throughput would also vary substantially.
Due to the different mass flow rate as a cause for the different energy throughput, the need for head that the compressor should build would vary as well. Therefore, the
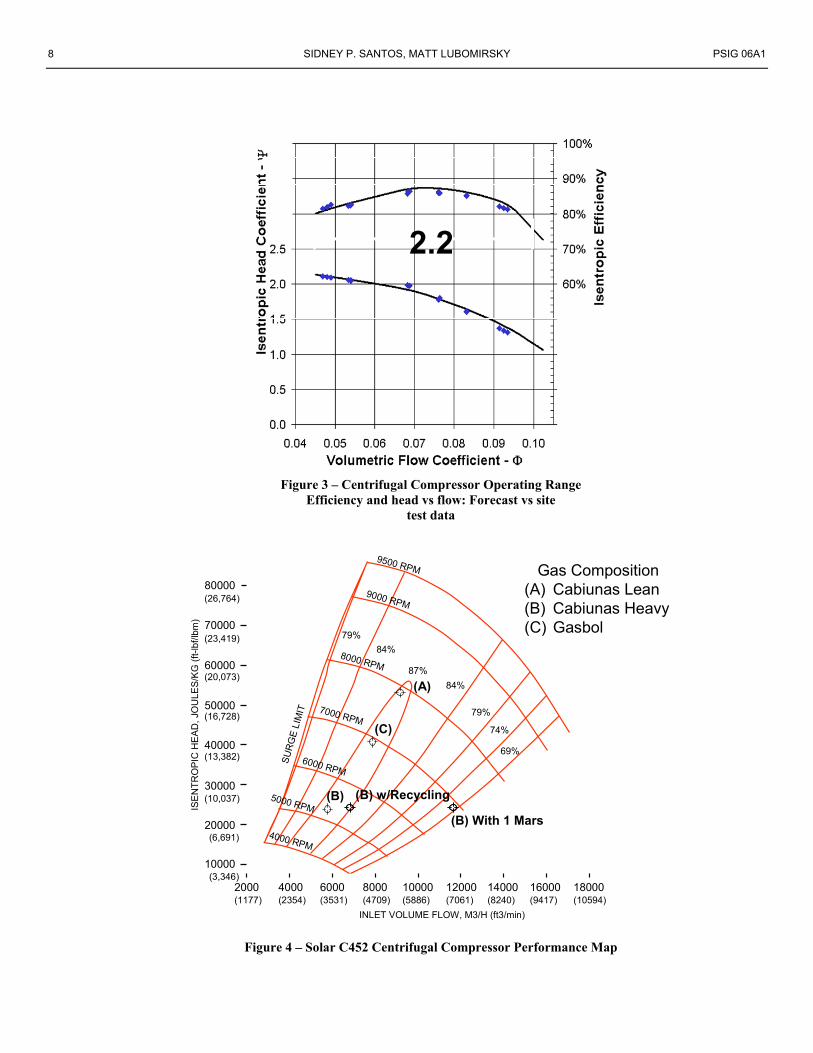
staging that covers these widest range of conditions should be the one that uses latest advances in centrifugal compressor technologies (figure 3) The additional benefit of using modern centrifugal compressors comes from the fact that by knowing the pipeline resistance curve the compressor stage selection can be designed so that all main operating points A, B, and C will lay in the compressor highest efficiency island (figure 4)
CASE STUDY This case study focuses on a gas pipeline section
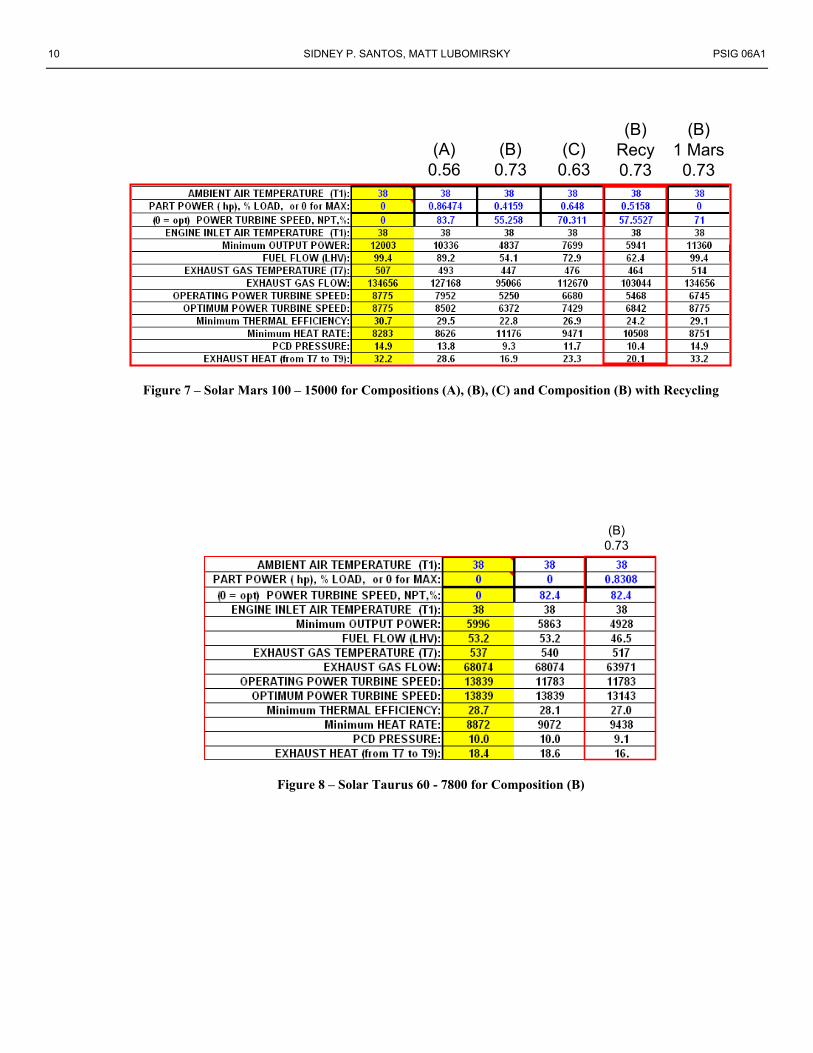
between 2 (two) compressors stations (figure 2), designed to operate with 3 (three) different gas compositions (table 1). The pipeline will operate with the same amount of time with each gas composition. This hypothetical pipeline delivers 1 x 10¹² BTU/D to the market. The gas composition effects on the gas pipeline and compressor station operation variables and, consequently, on centrifugal compressor performance are identified and evaluated. The base case operates with a lean natural gas composition named (A) Cabiunas Lean, natural gas composition named (B) Cabiunas Heavy and a typical gas composition from the Bolivia-Brasil Gas Pipeline named (C) Gasbol. All these cases were simulated to check their effect on the pre-selected centrifugal compressor. Four compressor station configurations were evaluated as described below:
Configuration I: Compressor station with 2 (two) Mars 100 units
operating with 3 (three) different gas compositions (A), (B) and (C), without stand-by unit. It operates 1/3 of the time with each gas composition. For Composition (B) only recycling is required to keep compressor unit operating above 50% load.
Configuration II: Compressor station with 3 (three) Mars 100 units as
Configuration I above but with one stand-by unit.
Configuration III: Compressor station with 2 (two) Mars units and 2
(two) additional Taurus 60 units to handle Composition (B). Provides the benefit of fuel savings but requires incremental Capex and O&M. This configuration also provides some back- up power for the station.
Configuration IV: Same as Configuration III but with 3 (three) Mars
units.
Technical Assumptions
Pipeline Diameter: DN 32” Design code: ANSI B31.8 Max. Allowed Working Pres. – MAOP: 101.2 kgf/cm2
(1440 PSIG)
PSIG 06A1 Gas Composition Effect on Centrifugal Compressor Performance 3
Pipe material: API 5L X70 Pipe internal roughness (epoxy painted): 0.009 mm
(350 minches) Pipeline Inlet Pressure: 99.84 kgf/cm2
(1420 psig) Minimum Pipeline Delivery Pressure: 35 kgf/cm2 (498 psig) Pipeline overall heat transfer: 1.9 Kcal/h.m2.C 0.39 Btu/h.ft2.F Soil temperature: 16 to 30 C
(61 to 86 F) Depth of burial: 1 m (3 feet) Compressor Station Maximum Compression ratio: 1.6 Suction and Discharge Header pressure drop: 0.35 kgf/cm2 (5 psi) After cooler pressure drop: 0.35 kgf/cm2 (5 psi) After cooler outside temperature: 52.6 C (127 F) Site elevation 100 m (328 feet) Site Temperature 38 C (100.4 F) Flow Equation: Colebrook
Centrifugal Compressors - Performance Maps
Centrifugal compressor performance maps (figures 4 and 5), have been pre-selected based on operating conditions and gas compositions using Solar dedicated software.
TECHNICAL EVALUATION The results obtained for this case study helped to
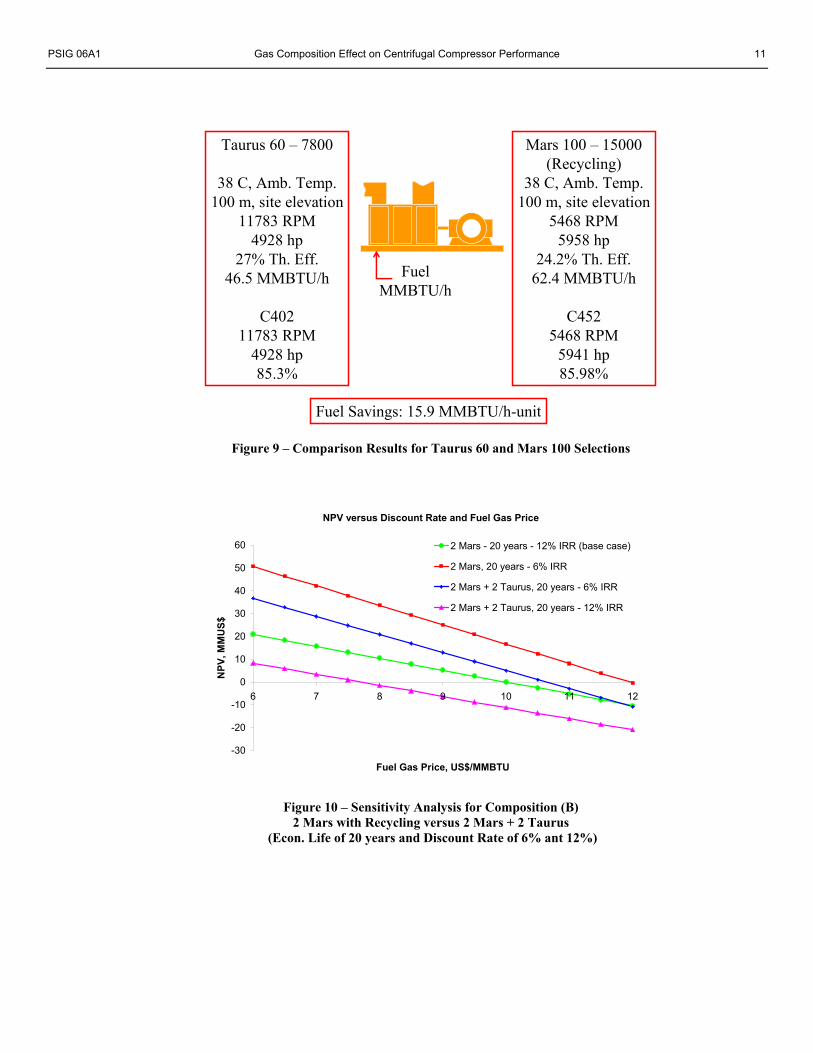
identify some interesting points related to compressor unit pre-selection under different operating conditions and gas compositions. The first configuration is closely related to the improvement in the design and manufacturing of pipeline centrifugal compressors, as presented previously and uses Solar C452 centrifugal compressor with Solar Mars 100 – 15000 for Compositions (A), (B) and (C).
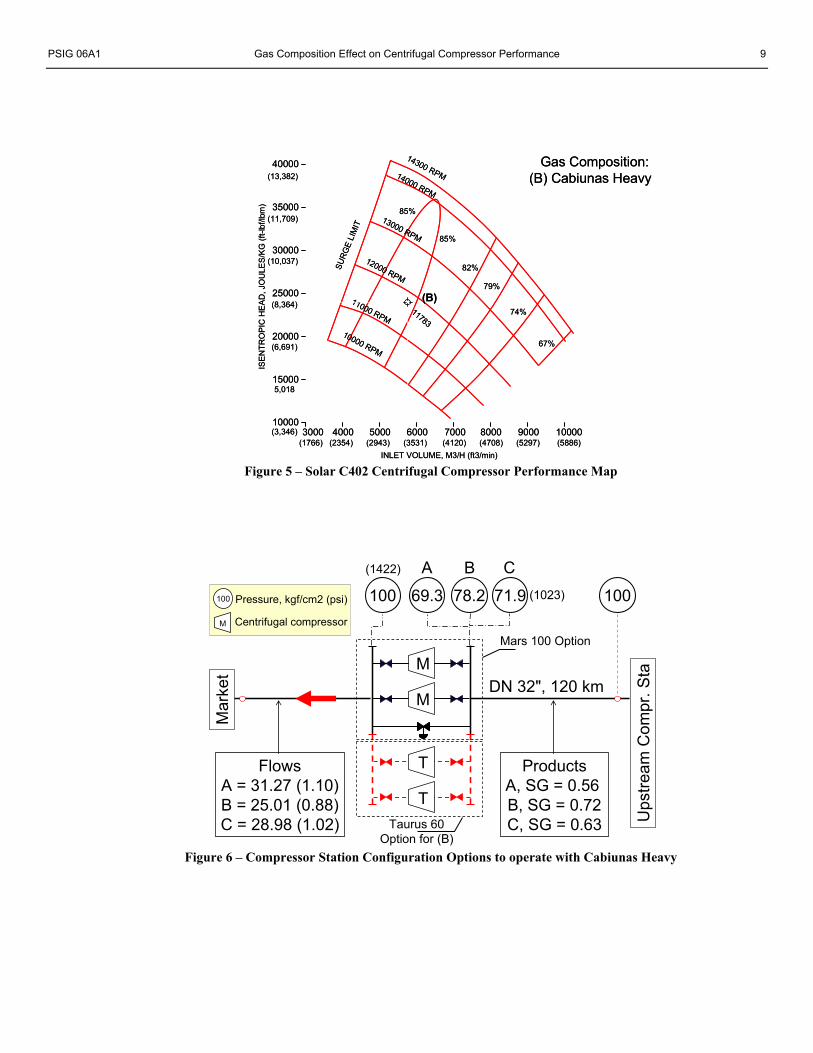
The second point is related to the opportunity of operating Composition (B) with a dedicated compressor using Solar Taurus 60 and Solar C402 centrifugal compressor (figure 6).
Solar C452 with Mars 100 – 15000
Solar C452 centrifugal compressor with Mars 100 – 15000 gas turbine can operate with all three Compositions (A, B and C) in the best efficiency region of the performance map (figure 4).
The analysis including Solar Mars 100 gas turbine driver was important to evaluate the turbo-compressor unit (figure 6) and presented some other important aspects to be considered. The operating point for Composition (B) requires 41.59% of gas turbine available power (figure 7) and,
therefore, would require the gas turbine to operate outside of its lean-premix mode (figure 7).
Composition (B) can not be operated with just one Mars unit (figure 4) since the operation point is in the centrifugal compressor stonewall and low efficiency area (~69%). One Mars unit does not have power enough to operate with Composition (B). To handle this situation, recycling (or suction valve throttle as an option) has been considered and its economic impact due to fuel usage, capex and O&M has been quantified.
For Composition (B) without recycling, the overall efficiency is 19.93% (22.8% of GT x 87.40% of CC) and 20.81% (24.2% of GT x 85.98% of CC) with recycling.
Solar C402 with Taurus 60 – 7800
For this selection (figures 5 and 8) the overall efficiency goes up to 23.03% (27.0% of GT x 85.30% of CC), operating at 83.08% of gas turbine available power. In this case the overall efficiency is higher than in the previous alternative and allows SoloNox operation. The fuel savings related the better overall efficiency amount to 15.9 MMBTU/h-unit (figure 9).
To make a good decision designer needs to take the operating aspect into account and also perform the economic evaluation of the alternatives.
ECONOMIC EVALUATION For the economic evaluation of the alternative of
installing 2 (two) Taurus 60 – 7800 compressor units to operate with Composition (B), compared to keeping the operation with 2 (two) or 3 (three) Mars 100 – 15000 (Configurations I and II) with recycling, the following assumptions were adopted:
Economic Assumption
• Construction schedule: 2 years • Capex (2 Taurus 60 – 7800) : 11.80 MMUS$ • O&M (without Fuel): 1.070 MMUS$
– Maintenance (5% of Capex): 0.590 MMUS$ – Overhaul/year (2 Taurus 60): 0.480 MMUS$
• Depreciation: 20 years • Taxes: 40% • Fuel for Mars 100 (recycling): 62.4 MMBTU/h-unit • Fuel for Taurus 60: 46.50 MMBTU/h-unit • Operating time with Comp. (B): 1/3 of the year • Fuel savings/year (Taurus 60): 2.790 MMUS$ • Incremental Transportation Cap.: 0.019 MMSCMD 0.675 MMSCFD • Transportation Rate: N/A • Fuel price: 10.00 US$/MMBTU • Discount rate: 12% a year
4 SIDNEY P. SANTOS, MATT LUBOMIRSKY PSIG 06A1
Economic Evaluation Criteria The compressor station project with 2 (two) or 3 (three)
Mars 100 -15000 compressor units has the following economic results:
Economic life: 20 years Discount rate: 12% per year NPV: 0
Configuration I (2 Mars) Gross revenue: 21.90 MMUS$/year O&M 2.82 MMUS$/year Gas Fuel 13.11 MMUS$/year
Configuration II (3 Mars) Gross revenue: 24.38 MMUS$/year O&M 3.29 MMUS$/year Gas Fuel 13.11 MMUS$/year
The economic evaluation focussed only on the alternatives differences related to the potential installation of 2 (two) Solar Taurus 60 compressor units to operate with Composition (B). This alternative requires additional investment, increses O&M costs but, due to its better overall performance, avoids the costs related to fuel gas as listed below. The installation effects of 2 (two) Taurus units are exactly the same for Configurations III and IV as below.
• Incremental O&M (without Fuel): 1.34 MMUS$ • Fuel savings/year (Taurus 60): 2.76/3 MMUS$
Fuel savings impact positively on pipeline transportation capacity since fuel gas will not be transported to the compressor station and, therefore, is a source of incremental revenue for the Transportation Company. In this case study the amount of incremental capacity, in the range of 0,019 MMSCMD or 0.675 MMSCFD (one third of the year) was considered to be too small to be included in the economic evaluation.
Base Cases
Two Base Cases were considered: Compressor station with 2 (two) Mars 100 – 15000 and Compressor Station with 3 (three) Solar Mars 100 – 15000 both operating the 3 (three) diferents Compositions (A), (B) and (C).
The economic evaluation of the 2 (two) base cases was performed to produce NPV equal to ZERO. The revenues for these 2 (two) base cases must recover the required investment at a discount rate of 12% and economc life of 20 (twenty) years.
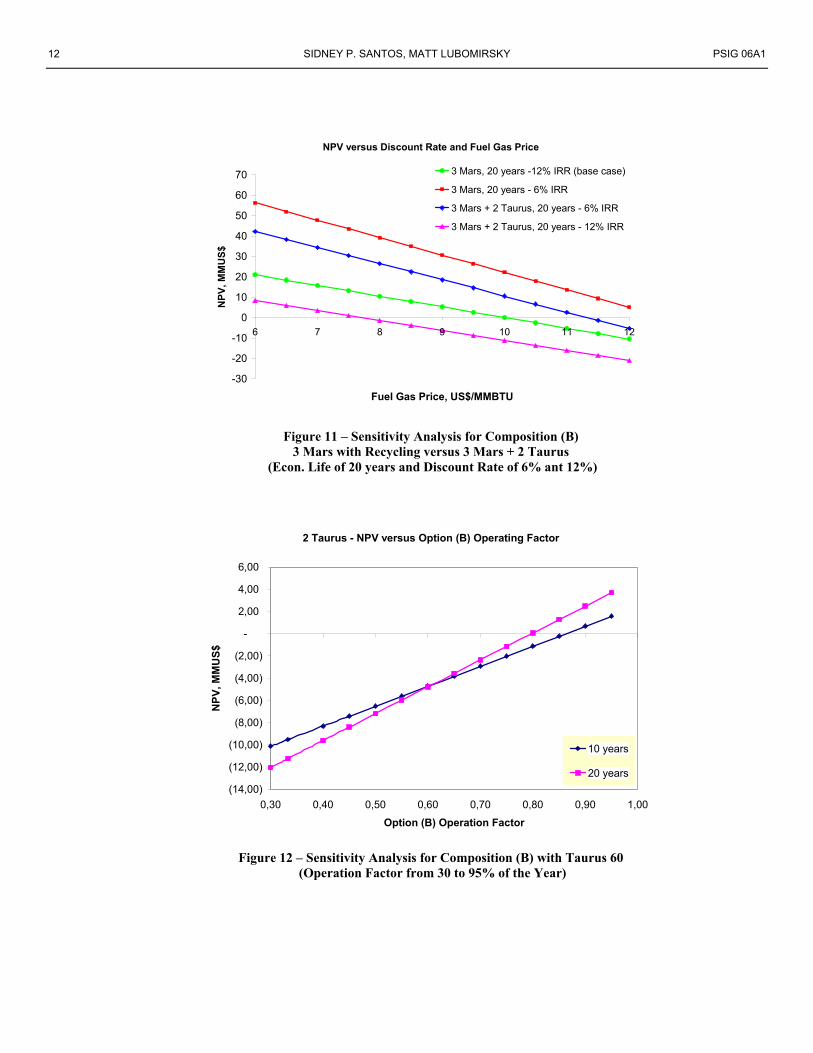
The impact on the compressor station project NPV, when installing 2 (two) Taurus 60 was quantified and the results are presented (figures 10, 11 and 12).
Sensitivity Analysis
A sensitivity study is presented to show how each selected
variable such as gas fuel price, operating time and discount rate would affect the operation and investment decision.
Figure 10 shows the sensitivity analysis with the following conditions:
Economic life: 20 years Discount rates: from 6 to 12% Fuel gas price: from 6 to 12 US$/MMBTU
Figure 11 as figure 10 but with economic life of 20 years.
Figure 12 shows the sensitivity analysis with the following conditions:
Economic life: 10 and 20 years Discount rate: 12 % Fuel gas price: 10 US$/MMBTU Operation time: from 30 to 95%
Whenever the operation time for Composition (B) differs from 33% of the year the remaining time is split equally between Compositions (A) and (C).
CONCLUSIONS As can be seen from figures 10 and 11 the alternative of
installing 2 (two) Taurus 60 compressor units is not feasible for all combinations of fuel gas prices and discount rates that produce negative NPVs, and is feasible for those that produce positive NPVs.
The alternative of using Solar Mars 100 – 15000 compressor units with a certain amount of recycling presents good economic results and will be preferred whenever the sensitivity described above for Composition (B) with Taurus 60 presents negative results for NPV.
These results underline the importance of performing a technical and economic evaluation for the alternatives available for compressor station configuration (Santos, 2004) and unit sizing. Designers must always quantify the alternatives and make a decision taking all the technical and economic aspects into consideration.
In conclusion, gas composition affects compressor units overall efficiency but this aspect has to be carefully addressed to prevent biased decisions related to equipment selection.
REFERENCES 1. Kurz, R., Ohanian, S. and Lubomirsky, M., 2003, “On
Compressor Station Layout”, Proceedings of ASME TURBOEXPO 2003.
2. Santos, S. P., 2004, “Series or Parallel Arrangement for a
Compressor Station? – A recurring Question That Needs a Convincing Answer.” Pipeline Simulation Interest Group
PSIG 06A1 Gas Composition Effect on Centrifugal Compressor Performance 5
ACKNOWLEDGEMENTS The authors want to thank PETROBRAS and Solar Turbines Incorporated for making this information available to the PSIG members and also Rainer Kurz, Oil and Gas Systems Analysis Manager of Solar Turbines for reviewing the paper and providing pertinent comments.
ABOUT THE AUTHORS Sidney Pereira dos Santos, the author, is a Senior Consultant at PETROBRAS Gas Business Unit, has a BS in Mechanical Engineering and a MBA in Corporate Finance, 19 years in the oil and gas pipeline design at PETROBRAS. He has been deeply involved in most of the gas pipeline projects
such as the Bolivia-Brazil project and the ongoing gas pipeline expansion in Brazil and has been conducting technical and economic studies and conceptual design for the upcoming projects.
Phone: +55 21 3229-4419 e-mail: [email protected]
Matt Lubomirsky, the coauthor, is Senior Principal Application Engineer at Solar Turbines Incorporated Oil and Gas Systems Analysis Business Unit, has BS in Mechanical Engineering from Leningrad Institute of Technology, Russia. He has 13 years of experience in turbine-compressor package selections for the different oil and gas applications, and has been deeply involved in complex pipeline studies and analysis.
Phone: 1-858-694-1627 e-mail: [email protected]
6 SIDNEY P. SANTOS, MATT LUBOMIRSKY PSIG 06A1
TABLES
Molar Composition %
ACabiunas Lean
BCabiunas Heavy
CGasbol
N2 0.7600 0.7300 0.7900CO2 0.1600 0.6299 1.3500O2 0.0000 0.0000 0.0000C1 98.4800 79.8499 89.0300C2 0.5700 9.1300 6.1800C3 0.0300 5.9700 1.7500iC4 0.0000 0.9100 0.8900nC4 0.0000 1.7700 0.0000iC5 0.0000 0.3499 0.0000nC5 0.0000 0.4300 0.0000C6 0.0000 0.1600 0.0000C7 0.0000 0.0700 0.0000
total 100.00 100.00 100.00MW 16.27 21 18.25SG 0.5638 0.7278 0.6325
LHV (MMBTU / ft3) 906 1132 977Z 0.9979 0.9964 0.9975
Table 1 – Gas Composition for Each Design Condition
Station Operation ConditionUp pressure Kgf/cm2g (psig)Down pressure Kgf/cm2g (psig)Up temperature C (F)Down temperature C (F)Max. disch. pressure Kgf/cm2g (psig)Station Inlet flow rate MMSCMD (MMSCFD)Station Outlet flow rate MMSCMD (MMSCFD)Unit Actual flow rate m3/h (ft3/min)Head N-m/kg (ft-lbf/lbm)Adiabatic efficiency %
Power required hpFuel Gas MMSCMD (MMSCFD)Mechanical efficiency %Auxiliary load hpCompressor typeDriver type
(B) Cabiunas Heavy(A) Cabiunas Lean (C) Gasbol69.31 (986)
99.84 (1420)34.32 (93.8)
64.06 (147.3)99.84 (1420)
31.42 (1109.6)31.28 (1104.6)9180.3 (5403.3)53610 (17935)
87.4
103360.1367 (4.8275)
Solar Mars 100 - 15000Solar C452
78.24 (1113)
36.07 (96.9)52.42 (126.4)
25.09 (886.0)25.01 (883.2)5822 (3426.7)24302 (8130)
87.4
48370.0784 (2.7687)
990
71.90 (1023)
34.60 (94.3)57.57 (135.6)
29.10 (1027.7)28.98 (1023.6)7918 (4660.4)37864 (12668)
86.13
76990.1113 (3.9305)
Speed RPM 7952 5250 6680
Table 2 – Steady State Thermo-hydraulic Simulation Results
PSIG 06A1 Gas Composition Effect on Centrifugal Compressor Performance 7
FIGURES
Figure 1 – Impeller efficiency is influenced by the specific speed of the impeller. The impeller on the right shows significant backsweep of the blades
P1 P1P2
DN 32" - 120 km (74.56 mi)Flow
Heat Value P1 P2 FlowNatural Gas Type SG MMBTU/m3
(MMBTU/CF)Kgf/cm2g
(psig)Kgf/cm2g
(psig)MMm3/d (BCFD) TBTU/D
(A) Cabiunas Lean 0.56 31977 (906) 99.8 (1420) 69.3 (986) 31.3 (1.10) 1(B) Cabiunas Heavy 0.73 39985 (1132) 99.8 (1420) 78.2 (1113) 25.0 ( 0.88) 1(C) Gasbol 0.63 34502 (977) 99.8 (1420) 71.9 (1023) 29.0 (1.02) 1
Figure 2 – Gas pipeline section between two compressor stations and operating conditions
8 SIDNEY P. SANTOS, MATT LUBOMIRSKY PSIG 06A1
2.22.2
Figure 3 – Centrifugal Compressor Operating Range
Efficiency and head vs flow: Forecast vs site test data
2000 4000 6000 8000 10000 12000 14000 16000 18000
10000
20000
30000
40000
50000
60000
70000
80000
ISE
NTR
OPI
C H
EA
D, J
OU
LES
/KG
(ft-l
bf/lb
m)
INLET VOLUME FLOW, M3/H (ft3/min)
SUR
GE
LIM
IT
79%
9500 RPM
9000 RPM
8000 RPM
84%
7000 RPM
87%
6000 RPM
5000 RPM
4000 RPM
84%
79%
74%
69%
Gas Composition(A) Cabiunas Lean(B) Cabiunas Heavy(C) Gasbol
(A)
(C)
(B)
(26,764)
(23,419)
(20,073)
(16,728)
(13,382)
(10,037)
(6,691)
(3,346)
(1177) (2354) (3531) (4709) (5886) (7061) (8240) (9417) (10594)
(B) With 1 Mars
(B) w/Recycling
Figure 4 – Solar C452 Centrifugal Compressor Performance Map
PSIG 06A1 Gas Composition Effect on Centrifugal Compressor Performance 9
82%
79%
74%
67%
85%
85%
10000 RPM
11000 RPM
12000 RPM
13000 RPM
14000 RPM
14300 RPM
SURG
E LI
MIT
3000 4000 5000 6000 7000 8000 9000 10000
40000
35000
30000
25000
20000
15000
10000
INLET VOLUME, M3/H (ft3/min)
ISE
NTR
OPI
C H
EA
D, J
OU
LES/
KG
(ft-l
bf/lb
m)
11783
Gas Composition:(B) Cabiunas Heavy
(B)
(1766) (2354) (2943) (3531) (4120) (4708) (5297) (5886)
(13,382)
(11,709)
(10,037)
(8,364)
(6,691)
5,018
(3,346)
Figure 5 – Solar C402 Centrifugal Compressor Performance Map
T
T
Ups
tream
Com
pr. S
ta
100 69.3 100
DN 32", 120 km
Mar
ket M
M
ProductsA, SG = 0.56 B, SG = 0.72C, SG = 0.63
78.2 71.9
A B C
FlowsA = 31.27 (1.10)B = 25.01 (0.88)C = 28.98 (1.02) Taurus 60
Option for (B)
100 Pressure, kgf/cm2 (psi)
M Centrifugal compressor
(1422)
(1023)
Mars 100 Option
Figure 6 – Compressor Station Configuration Options to operate with Cabiunas Heavy
10 SIDNEY P. SANTOS, MATT LUBOMIRSKY PSIG 06A1
(A)0.56
(B)0.73
(C)0.63
(B)Recy0.73
(B)1 Mars
0.73
Figure 7 – Solar Mars 100 – 15000 for Compositions (A), (B), (C) and Composition (B) with Recycling
(B)0.73
Figure 8 – Solar Taurus 60 - 7800 for Composition (B)
PSIG 06A1 Gas Composition Effect on Centrifugal Compressor Performance 11
FuelMMBTU/h
Taurus 60 – 7800
38 C, Amb. Temp.100 m, site elevation
11783 RPM4928 hp
27% Th. Eff.46.5 MMBTU/h
C40211783 RPM
4928 hp85.3%
Mars 100 – 15000(Recycling)
38 C, Amb. Temp.100 m, site elevation
5468 RPM5958 hp
24.2% Th. Eff.62.4 MMBTU/h
C4525468 RPM
5941 hp85.98%
Fuel Savings: 15.9 MMBTU/h-unit
Figure 9 – Comparison Results for Taurus 60 and Mars 100 Selections
NPV versus Discount Rate and Fuel Gas Price
-30
-20
-10
0
10
20
30
40
50
60
6 7 8 9 10 11 12
Fuel Gas Price, US$/MMBTU
NPV
, MM
US$
2 Mars - 20 years - 12% IRR (base case)
2 Mars, 20 years - 6% IRR
2 Mars + 2 Taurus, 20 years - 6% IRR
2 Mars + 2 Taurus, 20 years - 12% IRR
Figure 10 – Sensitivity Analysis for Composition (B) 2 Mars with Recycling versus 2 Mars + 2 Taurus
(Econ. Life of 20 years and Discount Rate of 6% ant 12%)
12 SIDNEY P. SANTOS, MATT LUBOMIRSKY PSIG 06A1
NPV versus Discount Rate and Fuel Gas Price
-30
-20
-10
0
10
20
30
40
50
60
70
6 7 8 9 10 11 12
Fuel Gas Price, US$/MMBTU
NPV
, MM
US$
3 Mars, 20 years -12% IRR (base case)
3 Mars, 20 years - 6% IRR
3 Mars + 2 Taurus, 20 years - 6% IRR
3 Mars + 2 Taurus, 20 years - 12% IRR
Figure 11 – Sensitivity Analysis for Composition (B) 3 Mars with Recycling versus 3 Mars + 2 Taurus
(Econ. Life of 20 years and Discount Rate of 6% ant 12%)
2 Taurus - NPV versus Option (B) Operating Factor
(14,00)
(12,00)
(10,00)
(8,00)
(6,00)
(4,00)
(2,00)
-
2,00
4,00
6,00
0,30 0,40 0,50 0,60 0,70 0,80 0,90 1,00
Option (B) Operation Factor
NPV
, MM
US$
10 years
20 years
Figure 12 – Sensitivity Analysis for Composition (B) with Taurus 60 (Operation Factor from 30 to 95% of the Year)