Embed Size (px)
Citation preview
NATURAL GAS INFORMATION 2019 FINAL EDITION
DATABASE DOCUMENTATION

2 - NATURAL GAS INFORMATION: DATABASE DOCUMENTATION (2019 first edition)
INTERNATIONAL ENERGY AGENCY
This document provides support information for the IEA Annual Natural Gas Statistics database. This document can be found online at: http://wds.iea.org/wds/pdf/gas_documentation.pdf Please address your inquiries to [email protected]. Please note that all IEA data are subject to the Terms and Conditions which can be found on the IEA’s website at: www.iea.org/t&c/termsandconditions/
NATURAL GAS INFORMATION: DATABASE DOCUMENTATION (2019 Final Edition) - 3
INTERNATIONAL ENERGY AGENCY
TABLE OF CONTENTS
1. CHANGES FROM LAST EDITION ............................................................................... 4
2. DATABASE STRUCTURE ........................................................................................... 6
3. FLOW DEFINITIONS .................................................................................................... 7
4. PRODUCT DEFINITIONS ........................................................................................... 14
5. GEOGRAPHICAL COVERAGE ................................................................................. 15
6. COUNTRY NOTES AND SOURCES .......................................................................... 27
7. UNITS AND CONVERSIONS ..................................................................................... 46
8. ABBREVIATIONS ...................................................................................................... 50
4 - NATURAL GAS INFORMATION: DATABASE DOCUMENTATION (2019 first edition)
INTERNATIONAL ENERGY AGENCY
1. CHANGES FROM LAST EDITION In the current release the files for OECD countries are updated with complete information for 2018. The World files NGWBAL and NGWIMP include data up to 2017 with preliminary supply data for 2018.
In the 2019 edition of this online data service the default data display is figures rounded to zero decimal places.
However, from 2017 data onwards, further detail, up to the three decimal place level, is available where reported by the national administrations, upon selecting View > Decimals in the Menu bar. Please note that the constituent data summed to produce regional and flow aggregates may be reported at differing levels of precision. Therefore, care should be taken when using data for aggregated flows beyond the level of 0 decimal places.
Data up to and including 2016 has been rounded to 0 decimal places.
Note: Periods (.) are used to separate decimal places.
Geographical coverage Lithuania became the 36th OECD member in July 2018. Accordingly, starting with the 2019 first edition, Lithua-nia appears in the list of OECD members and is included in the zone aggregates for data starting in 1990. Prior to 1990, data for Lithuania are included in Former Soviet Union.
From 2011 data onwards, France now includes Monaco, and the following overseas departments (Guadeloupe; French Guiana; Martinique; Mayotte; and Réunion); and excludes the overseas collectivities (New Caledonia; French Polynesia; Saint Barthélemy; Saint Martin; Saint Pierre and Miquelon; and Wallis and Futuna). Prior to 2011, France includes Monaco and excludes the following overseas departments and territories: Guadeloupe; French Guiana; Martinique; Mayotte and Réunion; New Caledonia; French Polynesia; Saint Barthélemy; Saint Martin; Saint Pierre and Miquelon; and Wallis and Futuna.
South Africa joined as an Association country in November 2018. Accordingly, South Africa is now included in the IEA and Accession/Association list of countries and aggregates in the World files NGWBAL and NGWIMP.
The country previously known as Former Yugoslav Republic of Macedonia has been renamed as Republic of North Macedonia.
Old longname New longname Shortname Old shortname (if changed)
Former Yugoslav Republic of Mace-donia
Republic of North Macedonia NORTHMACED FYROM

NATURAL GAS INFORMATION: DATABASE DOCUMENTATION (2019 Final Edition) - 5
INTERNATIONAL ENERGY AGENCY
Flows In this edition the number of flows published in the OECD Natural Gas Supply and Consumption file (NGBALCON.ivt) has been expanded. This includes a new industry sector aggregate (“Manufacturing”). To ac-commodate this change, the industry sub-sectors have been reordered.
AOSPROD.ivt
Old longname New longname Shortname Old shortname
(if changed)
Manufacturing MANUFACT
Total other sectors Removed TOTOTHER
6 - NATURAL GAS INFORMATION: DATABASE DOCUMENTATION (2019 first edition)
INTERNATIONAL ENERGY AGENCY
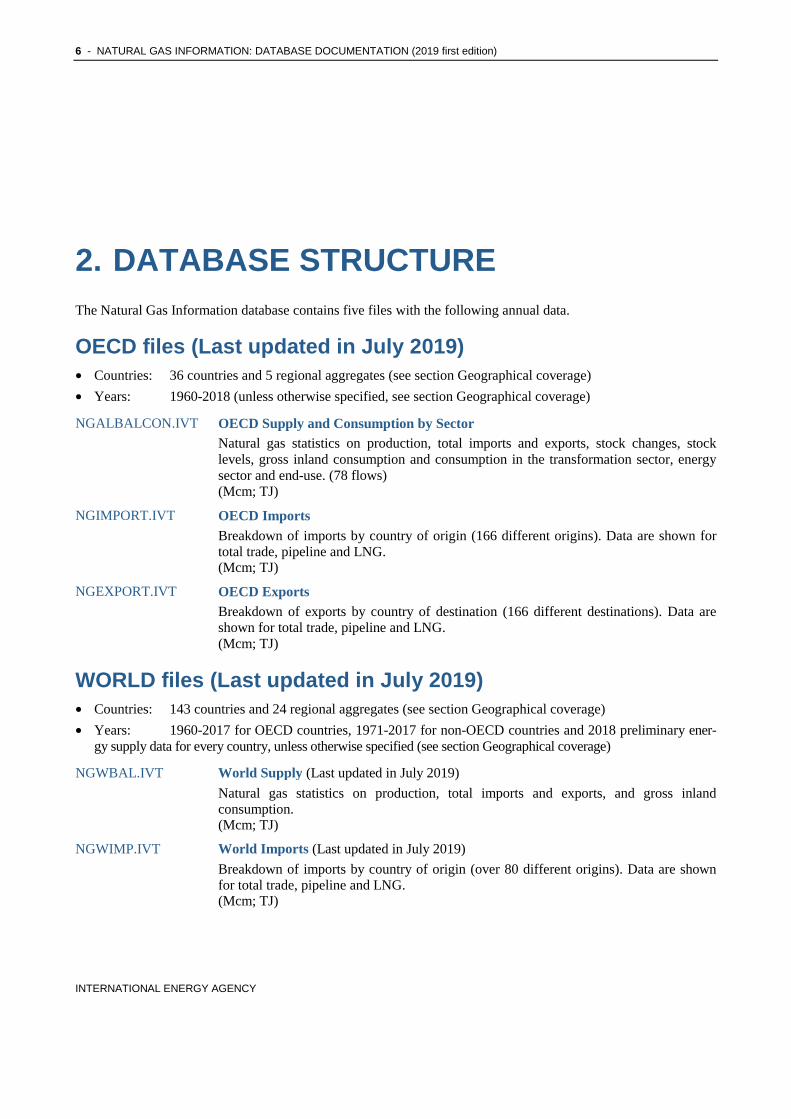
2. DATABASE STRUCTURE The Natural Gas Information database contains five files with the following annual data.
OECD files (Last updated in July 2019) • Countries: 36 countries and 5 regional aggregates (see section Geographical coverage)
• Years: 1960-2018 (unless otherwise specified, see section Geographical coverage)
NGALBALCON.IVT OECD Supply and Consumption by Sector Natural gas statistics on production, total imports and exports, stock changes, stock levels, gross inland consumption and consumption in the transformation sector, energy sector and end-use. (78 flows) (Mcm; TJ)
NGIMPORT.IVT OECD Imports Breakdown of imports by country of origin (166 different origins). Data are shown for total trade, pipeline and LNG. (Mcm; TJ)
NGEXPORT.IVT OECD Exports Breakdown of exports by country of destination (166 different destinations). Data are shown for total trade, pipeline and LNG. (Mcm; TJ)
WORLD files (Last updated in July 2019) • Countries: 143 countries and 24 regional aggregates (see section Geographical coverage)
• Years: 1960-2017 for OECD countries, 1971-2017 for non-OECD countries and 2018 preliminary ener-gy supply data for every country, unless otherwise specified (see section Geographical coverage)
NGWBAL.IVT World Supply (Last updated in July 2019)
Natural gas statistics on production, total imports and exports, and gross inland consumption. (Mcm; TJ)
NGWIMP.IVT World Imports (Last updated in July 2019)
Breakdown of imports by country of origin (over 80 different origins). Data are shown for total trade, pipeline and LNG. (Mcm; TJ)
NATURAL GAS INFORMATION: DATABASE DOCUMENTATION (2019 Final Edition) - 7
INTERNATIONAL ENERGY AGENCY
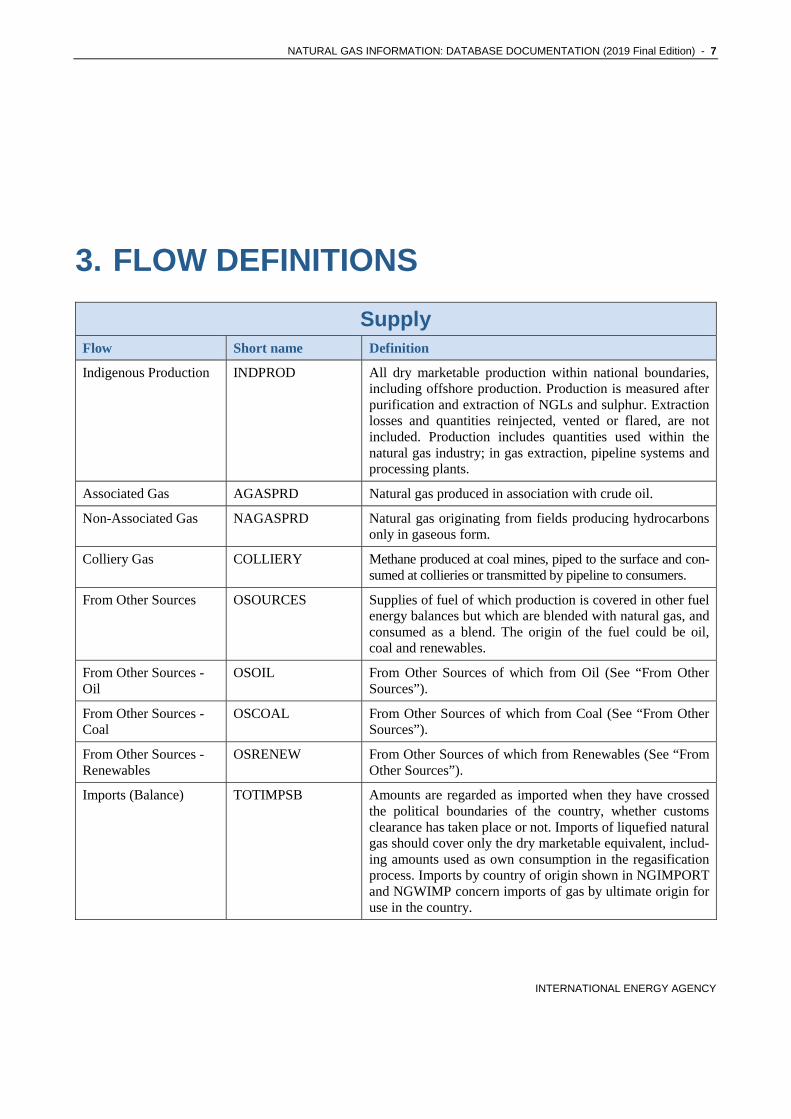
3. FLOW DEFINITIONS
Supply
Flow Short name Definition
Indigenous Production INDPROD All dry marketable production within national boundaries, including offshore production. Production is measured after purification and extraction of NGLs and sulphur. Extraction losses and quantities reinjected, vented or flared, are not included. Production includes quantities used within the natural gas industry; in gas extraction, pipeline systems and processing plants.
Associated Gas AGASPRD Natural gas produced in association with crude oil.
Non-Associated Gas NAGASPRD Natural gas originating from fields producing hydrocarbons only in gaseous form.
Colliery Gas COLLIERY Methane produced at coal mines, piped to the surface and con-sumed at collieries or transmitted by pipeline to consumers.
From Other Sources OSOURCES Supplies of fuel of which production is covered in other fuel energy balances but which are blended with natural gas, and consumed as a blend. The origin of the fuel could be oil, coal and renewables.
From Other Sources - Oil
OSOIL From Other Sources of which from Oil (See “From Other Sources”).
From Other Sources - Coal
OSCOAL From Other Sources of which from Coal (See “From Other Sources”).
From Other Sources - Renewables
OSRENEW From Other Sources of which from Renewables (See “From Other Sources”).
Imports (Balance) TOTIMPSB Amounts are regarded as imported when they have crossed the political boundaries of the country, whether customs clearance has taken place or not. Imports of liquefied natural gas should cover only the dry marketable equivalent, includ-ing amounts used as own consumption in the regasification process. Imports by country of origin shown in NGIMPORT and NGWIMP concern imports of gas by ultimate origin for use in the country.
8 - NATURAL GAS INFORMATION: DATABASE DOCUMENTATION (2019 first edition)
INTERNATIONAL ENERGY AGENCY
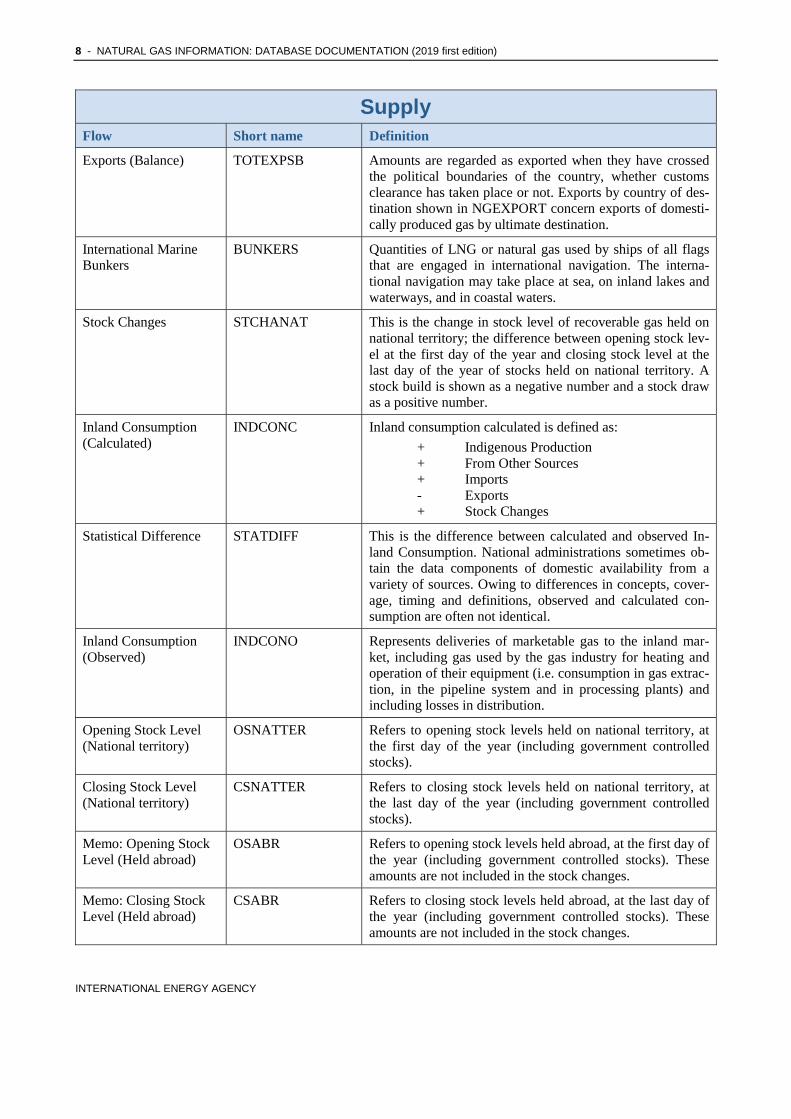
Supply
Flow Short name Definition
Exports (Balance) TOTEXPSB Amounts are regarded as exported when they have crossed the political boundaries of the country, whether customs clearance has taken place or not. Exports by country of des-tination shown in NGEXPORT concern exports of domesti-cally produced gas by ultimate destination.
International Marine Bunkers
BUNKERS Quantities of LNG or natural gas used by ships of all flags that are engaged in international navigation. The interna-tional navigation may take place at sea, on inland lakes and waterways, and in coastal waters.
Stock Changes STCHANAT This is the change in stock level of recoverable gas held on national territory; the difference between opening stock lev-el at the first day of the year and closing stock level at the last day of the year of stocks held on national territory. A stock build is shown as a negative number and a stock draw as a positive number.
Inland Consumption (Calculated)
INDCONC Inland consumption calculated is defined as:
+ Indigenous Production + From Other Sources + Imports - Exports + Stock Changes
Statistical Difference STATDIFF This is the difference between calculated and observed In-land Consumption. National administrations sometimes ob-tain the data components of domestic availability from a variety of sources. Owing to differences in concepts, cover-age, timing and definitions, observed and calculated con-sumption are often not identical.
Inland Consumption (Observed)
INDCONO Represents deliveries of marketable gas to the inland mar-ket, including gas used by the gas industry for heating and operation of their equipment (i.e. consumption in gas extrac-tion, in the pipeline system and in processing plants) and including losses in distribution.
Opening Stock Level (National territory)
OSNATTER Refers to opening stock levels held on national territory, at the first day of the year (including government controlled stocks).
Closing Stock Level (National territory)
CSNATTER Refers to closing stock levels held on national territory, at the last day of the year (including government controlled stocks).
Memo: Opening Stock Level (Held abroad)
OSABR Refers to opening stock levels held abroad, at the first day of the year (including government controlled stocks). These amounts are not included in the stock changes.
Memo: Closing Stock Level (Held abroad)
CSABR Refers to closing stock levels held abroad, at the last day of the year (including government controlled stocks). These amounts are not included in the stock changes.

NATURAL GAS INFORMATION: DATABASE DOCUMENTATION (2019 Final Edition) - 9
INTERNATIONAL ENERGY AGENCY
Supply
Flow Short name Definition
Memo: Gas Vented VENTED The volume of gas released into the air on the production site or at the gas processing plant.
Memo: Gas Flared FLARED The volume of gas burned in flares on the production site or at the gas processing plant.
Memo: Cushion Gas Closing Stock Level
CUSHCSNAT Total volume of gas required as a permanent inventory to maintain adequate underground storage reservoir pressures and deliverability rates throughout the output cycle. These amounts are not included in the stock levels or stock changes.
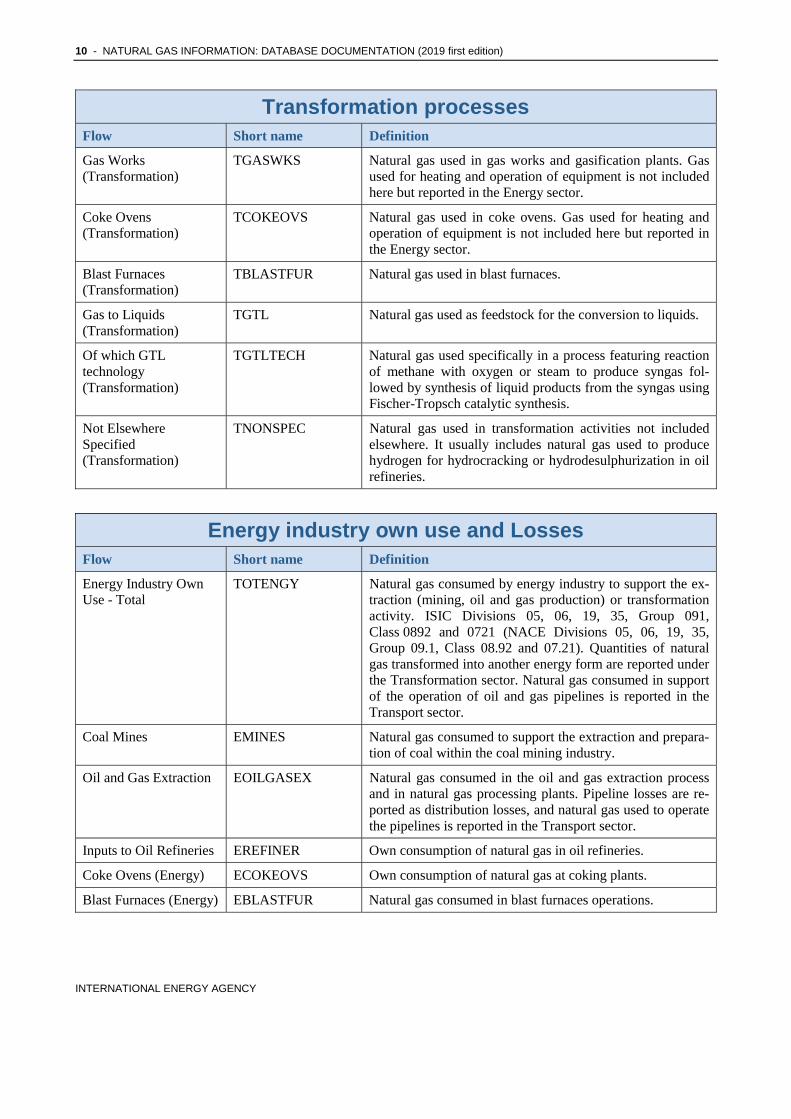
Transformation processes Flow Short name Definition
Transformation - Total TOTTRANF Comprises fuel inputs to both public and private electricity, combined heat and power plants and heat plants. An auto-producer is an industrial establishment which, in addition to its main activities, generates electricity, wholly or partly for its own use. It includes railway's own production of electric-ity. Heat plants and combined heat and power plants only cover fuel inputs for that part of the heat which is sold to a third party. Transformation sector also comprises fuels used as feedstocks in gas works, coke ovens and blast furnaces.
Main Activity Producer Electricity Plants
MAINELEC Includes inputs of gas for the production of electricity in main activity producer electricity plants, whose primary purpose is to produce, transmit or distribute electricity.
Autoproducer Electricity Plants
AUTOELEC Includes inputs of gas for the production of electricity by an enterprise which, in addition to its main activities, generates electricity wholly or partly for its own use, e.g. industrial establishments, railways, refineries, etc.
Main Activity Producer Combined Heat and Power Plants
MAINCHP Includes inputs of gas to main activity producer combined heat and power plants which generate electricity and useful heat in a single installation.
Autoproducer Combined Heat and Power Plants
AUTOCHP Includes inputs of gas to autoproducer combined heat and power plants which generate electricity and useful heat in a single installation. All fuel inputs for electricity production are taken into account, while for heat production, only that part of inputs to heat which is sold to third parties (e.g. to a network) is shown.
Main Activity Producer Heat Plants
MAINHEAT Includes inputs of gas to main activity producer plants which are designed to produce heat only.
Autoproducer Heat Plants
AUTOHEAT Includes inputs of gas to autoproducer plants which are de-signed to produce heat only. Data for autoproducer heat plants represent inputs of fuel to plants which sell heat to a third party under the provisions of a contract.
10 - NATURAL GAS INFORMATION: DATABASE DOCUMENTATION (2019 first edition)
INTERNATIONAL ENERGY AGENCY
Transformation processes Flow Short name Definition
Gas Works (Transformation)
TGASWKS Natural gas used in gas works and gasification plants. Gas used for heating and operation of equipment is not included here but reported in the Energy sector.
Coke Ovens (Transformation)
TCOKEOVS Natural gas used in coke ovens. Gas used for heating and operation of equipment is not included here but reported in the Energy sector.
Blast Furnaces (Transformation)
TBLASTFUR Natural gas used in blast furnaces.
Gas to Liquids (Transformation)
TGTL Natural gas used as feedstock for the conversion to liquids.
Of which GTL technology (Transformation)
TGTLTECH Natural gas used specifically in a process featuring reaction of methane with oxygen or steam to produce syngas fol-lowed by synthesis of liquid products from the syngas using Fischer-Tropsch catalytic synthesis.
Not Elsewhere Specified (Transformation)
TNONSPEC Natural gas used in transformation activities not included elsewhere. It usually includes natural gas used to produce hydrogen for hydrocracking or hydrodesulphurization in oil refineries.
Energy industry own use and Losses Flow Short name Definition
Energy Industry Own Use - Total
TOTENGY Natural gas consumed by energy industry to support the ex-traction (mining, oil and gas production) or transformation activity. ISIC Divisions 05, 06, 19, 35, Group 091, Class 0892 and 0721 (NACE Divisions 05, 06, 19, 35, Group 09.1, Class 08.92 and 07.21). Quantities of natural gas transformed into another energy form are reported under the Transformation sector. Natural gas consumed in support of the operation of oil and gas pipelines is reported in the Transport sector.
Coal Mines EMINES Natural gas consumed to support the extraction and prepara-tion of coal within the coal mining industry.
Oil and Gas Extraction EOILGASEX Natural gas consumed in the oil and gas extraction process and in natural gas processing plants. Pipeline losses are re-ported as distribution losses, and natural gas used to operate the pipelines is reported in the Transport sector.
Inputs to Oil Refineries EREFINER Own consumption of natural gas in oil refineries.
Coke Ovens (Energy) ECOKEOVS Own consumption of natural gas at coking plants.
Blast Furnaces (Energy) EBLASTFUR Natural gas consumed in blast furnaces operations.

NATURAL GAS INFORMATION: DATABASE DOCUMENTATION (2019 Final Edition) - 11
INTERNATIONAL ENERGY AGENCY
Energy industry own use and Losses Flow Short name Definition
Gas Works (Energy) EGASWKS Own consumption of natural gas at gas works and gasifica-tion plants.
Electricity, CHP and Heat Plants
EPOWERPLT Own consumption of natural gas in electric plants, com-bined heat and power plants, and heat plants.
Liquefaction (LNG) / Regasification
ELNG Natural gas consumed as fuel at gas liquefaction and regasi-fication plants.
Gas to Liquids (Energy) EGTL Natural gas consumed as fuel at the Gas-to-Liquid conver-sion plants.
Of which GTL technology (Energy)
EGTLTECH Natural gas consumed as fuel at the GTL technology plants.
Not Elsewhere Specified (Energy)
ENONSPEC Natural gas used in energy activities not included elsewhere.
Distribution Losses DISTLOSS Losses due to transport and distribution, as well as pipeline losses.
Final consumption Flow Short name Definition
Final Consumption FINCONS Final consumption is the sum of consumption by the differ-ent end-use sectors (in the Transport, Industry and Other sectors). It excludes deliveries for transformation and/or own use of the energy producing industries.
Transport - Total TOTTRANS Natural gas consumed for all transport activity irrespective of the economic sector in which the activity occurs. ISIC Divisions 49, 50 and 51 (NACE Divisions 49, 50 and 51).
Road ROAD Compressed natural gas (CNG) for use in road vehicles. Excludes natural gas consumed in stationary engines, which is reported under Other Sectors.
of which Biogas ROADBIOGAS Amounts of biogas included in road consumption.
Pipeline Transport PIPELINE Natural gas used in support of the operation of oil and gas pipelines.
Not Elsewhere Specified (Transport)
TRNONSPE Natural gas used in transport activities not included elsewhere.
Industry - Total TOTIND Natural gas consumed by the industrial undertaking in sup-port of its primary activities. Includes quantities of natural gas consumed in heat only and CHP plants for the produc-tion of heat used by the plant itself. Quantities of natural gas consumed for production of heat that is sold and for the production of electricity, are reported under the appropriate Transformation sector.
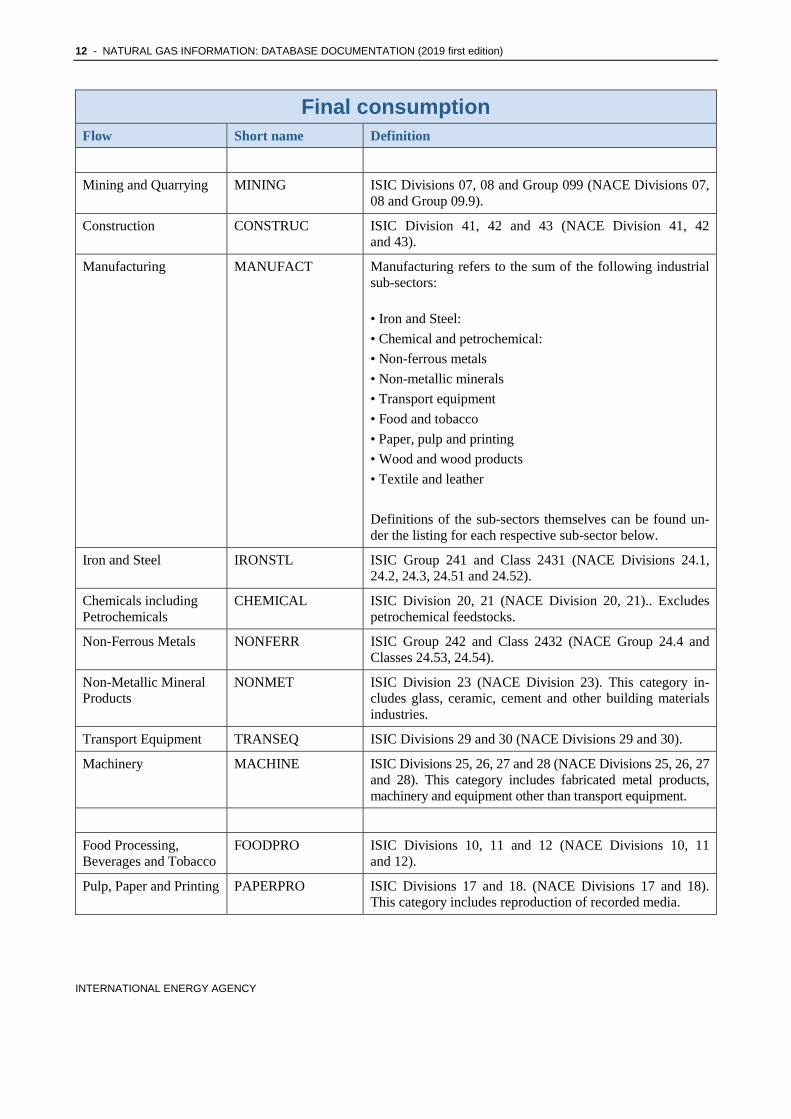
12 - NATURAL GAS INFORMATION: DATABASE DOCUMENTATION (2019 first edition)
INTERNATIONAL ENERGY AGENCY
Final consumption Flow Short name Definition
Mining and Quarrying MINING ISIC Divisions 07, 08 and Group 099 (NACE Divisions 07, 08 and Group 09.9).
Construction CONSTRUC ISIC Division 41, 42 and 43 (NACE Division 41, 42 and 43).
Manufacturing MANUFACT Manufacturing refers to the sum of the following industrial sub-sectors:
• Iron and Steel:
• Chemical and petrochemical:
• Non-ferrous metals
• Non-metallic minerals
• Transport equipment
• Food and tobacco
• Paper, pulp and printing
• Wood and wood products
• Textile and leather
Definitions of the sub-sectors themselves can be found un-der the listing for each respective sub-sector below.
Iron and Steel IRONSTL ISIC Group 241 and Class 2431 (NACE Divisions 24.1, 24.2, 24.3, 24.51 and 24.52).
Chemicals including Petrochemicals
CHEMICAL ISIC Division 20, 21 (NACE Division 20, 21).. Excludes petrochemical feedstocks.
Non-Ferrous Metals NONFERR ISIC Group 242 and Class 2432 (NACE Group 24.4 and Classes 24.53, 24.54).
Non-Metallic Mineral Products
NONMET ISIC Division 23 (NACE Division 23). This category in-cludes glass, ceramic, cement and other building materials industries.
Transport Equipment TRANSEQ ISIC Divisions 29 and 30 (NACE Divisions 29 and 30).
Machinery MACHINE ISIC Divisions 25, 26, 27 and 28 (NACE Divisions 25, 26, 27 and 28). This category includes fabricated metal products, machinery and equipment other than transport equipment.
Food Processing, Beverages and Tobacco
FOODPRO ISIC Divisions 10, 11 and 12 (NACE Divisions 10, 11 and 12).
Pulp, Paper and Printing PAPERPRO ISIC Divisions 17 and 18. (NACE Divisions 17 and 18). This category includes reproduction of recorded media.
NATURAL GAS INFORMATION: DATABASE DOCUMENTATION (2019 Final Edition) - 13
INTERNATIONAL ENERGY AGENCY
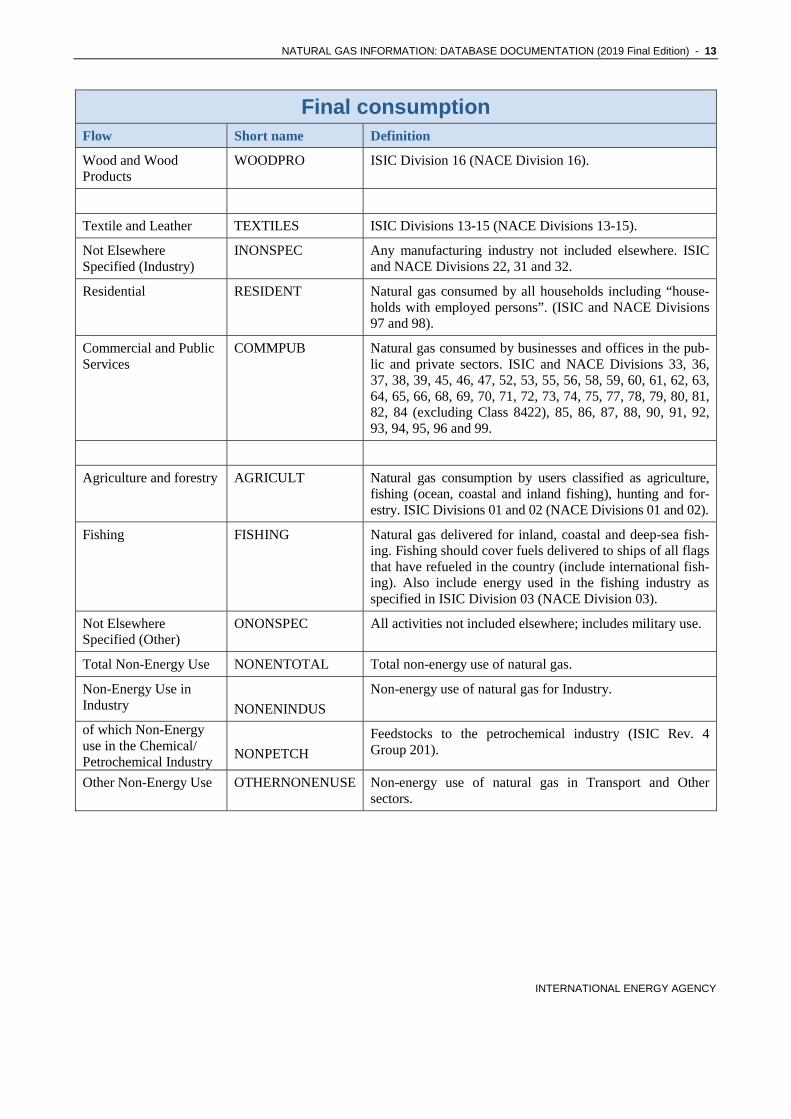
Final consumption Flow Short name Definition
Wood and Wood Products
WOODPRO ISIC Division 16 (NACE Division 16).
Textile and Leather TEXTILES ISIC Divisions 13-15 (NACE Divisions 13-15).
Not Elsewhere Specified (Industry)
INONSPEC Any manufacturing industry not included elsewhere. ISIC and NACE Divisions 22, 31 and 32.
Residential RESIDENT Natural gas consumed by all households including “house-holds with employed persons”. (ISIC and NACE Divisions 97 and 98).
Commercial and Public Services
COMMPUB Natural gas consumed by businesses and offices in the pub-lic and private sectors. ISIC and NACE Divisions 33, 36, 37, 38, 39, 45, 46, 47, 52, 53, 55, 56, 58, 59, 60, 61, 62, 63, 64, 65, 66, 68, 69, 70, 71, 72, 73, 74, 75, 77, 78, 79, 80, 81, 82, 84 (excluding Class 8422), 85, 86, 87, 88, 90, 91, 92, 93, 94, 95, 96 and 99.
Agriculture and forestry AGRICULT Natural gas consumption by users classified as agriculture, fishing (ocean, coastal and inland fishing), hunting and for-estry. ISIC Divisions 01 and 02 (NACE Divisions 01 and 02).
Fishing FISHING Natural gas delivered for inland, coastal and deep-sea fish-ing. Fishing should cover fuels delivered to ships of all flags that have refueled in the country (include international fish-ing). Also include energy used in the fishing industry as specified in ISIC Division 03 (NACE Division 03).
Not Elsewhere Specified (Other)
ONONSPEC All activities not included elsewhere; includes military use.
Total Non-Energy Use NONENTOTAL Total non-energy use of natural gas.
Non-Energy Use in Industry
NONENINDUS
Non-energy use of natural gas for Industry.
of which Non-Energy use in the Chemical/Petrochemical Industry
NONPETCH
Feedstocks to the petrochemical industry (ISIC Rev. 4 Group 201).
Other Non-Energy Use OTHERNONENUSE Non-energy use of natural gas in Transport and Other sectors.
14 - NATURAL GAS INFORMATION: DATABASE DOCUMENTATION (2019 first edition)
INTERNATIONAL ENERGY AGENCY
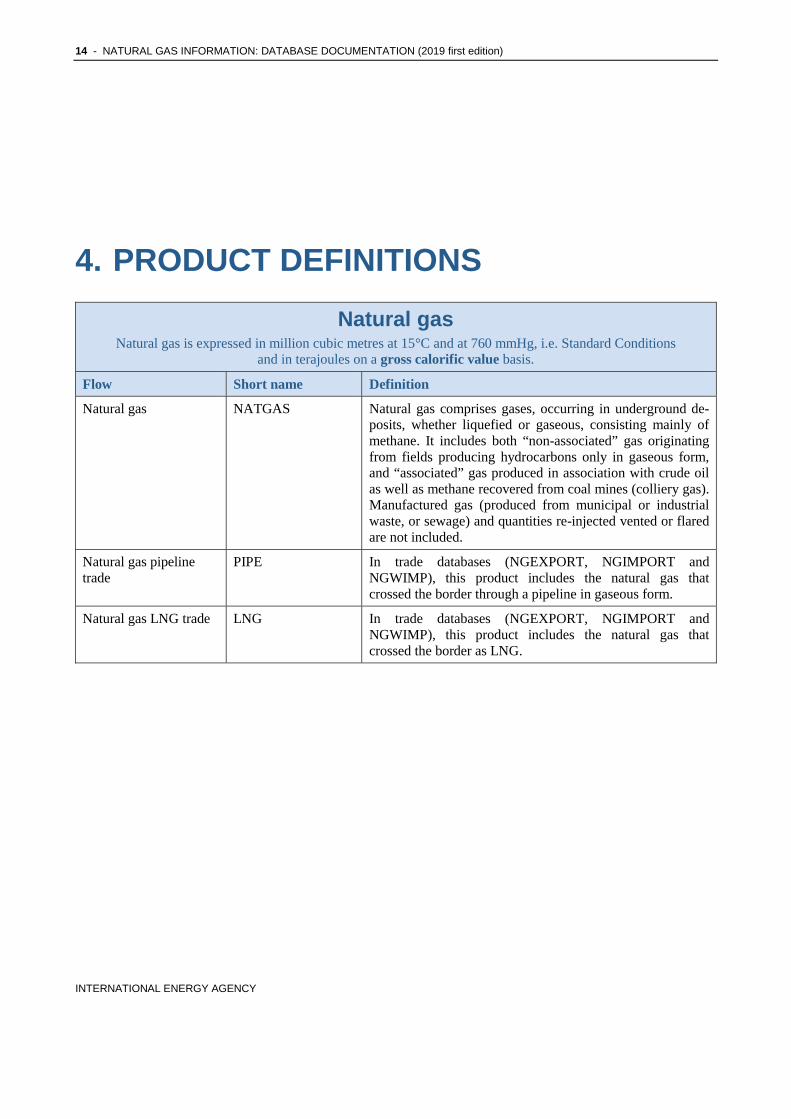
4. PRODUCT DEFINITIONS
Natural gas Natural gas is expressed in million cubic metres at 15°C and at 760 mmHg, i.e. Standard Conditions
and in terajoules on a gross calorific value basis. Flow Short name Definition
Natural gas NATGAS Natural gas comprises gases, occurring in underground de-posits, whether liquefied or gaseous, consisting mainly of methane. It includes both “non-associated” gas originating from fields producing hydrocarbons only in gaseous form, and “associated” gas produced in association with crude oil as well as methane recovered from coal mines (colliery gas). Manufactured gas (produced from municipal or industrial waste, or sewage) and quantities re-injected vented or flared are not included.
Natural gas pipeline trade
PIPE In trade databases (NGEXPORT, NGIMPORT and NGWIMP), this product includes the natural gas that crossed the border through a pipeline in gaseous form.
Natural gas LNG trade LNG In trade databases (NGEXPORT, NGIMPORT and NGWIMP), this product includes the natural gas that crossed the border as LNG.
NATURAL GAS INFORMATION: DATABASE DOCUMENTATION (2019 Final Edition) - 15
INTERNATIONAL ENERGY AGENCY
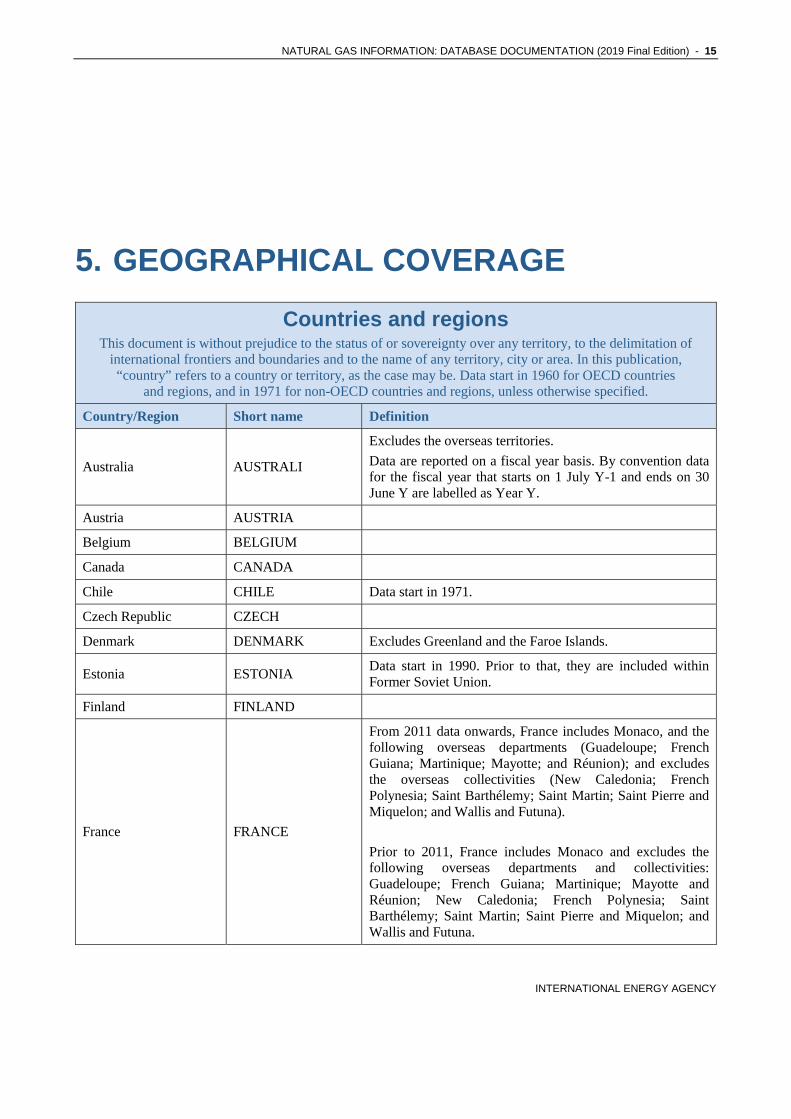
5. GEOGRAPHICAL COVERAGE
Countries and regions This document is without prejudice to the status of or sovereignty over any territory, to the delimitation of
international frontiers and boundaries and to the name of any territory, city or area. In this publication, “country” refers to a country or territory, as the case may be. Data start in 1960 for OECD countries
and regions, and in 1971 for non-OECD countries and regions, unless otherwise specified.
Country/Region Short name Definition
Australia AUSTRALI
Excludes the overseas territories.
Data are reported on a fiscal year basis. By convention data for the fiscal year that starts on 1 July Y-1 and ends on 30 June Y are labelled as Year Y.
Austria AUSTRIA
Belgium BELGIUM
Canada CANADA
Chile CHILE Data start in 1971.
Czech Republic CZECH
Denmark DENMARK Excludes Greenland and the Faroe Islands.
Estonia ESTONIA Data start in 1990. Prior to that, they are included within Former Soviet Union.
Finland FINLAND
France FRANCE
From 2011 data onwards, France includes Monaco, and the following overseas departments (Guadeloupe; French Guiana; Martinique; Mayotte; and Réunion); and excludes the overseas collectivities (New Caledonia; French Polynesia; Saint Barthélemy; Saint Martin; Saint Pierre and Miquelon; and Wallis and Futuna).
Prior to 2011, France includes Monaco and excludes the following overseas departments and collectivities: Guadeloupe; French Guiana; Martinique; Mayotte and Réunion; New Caledonia; French Polynesia; Saint Barthélemy; Saint Martin; Saint Pierre and Miquelon; and Wallis and Futuna.
16 - NATURAL GAS INFORMATION: DATABASE DOCUMENTATION (2019 first edition)
INTERNATIONAL ENERGY AGENCY
Countries and regions This document is without prejudice to the status of or sovereignty over any territory, to the delimitation of
international frontiers and boundaries and to the name of any territory, city or area. In this publication, “country” refers to a country or territory, as the case may be. Data start in 1960 for OECD countries
and regions, and in 1971 for non-OECD countries and regions, unless otherwise specified.
Country/Region Short name Definition
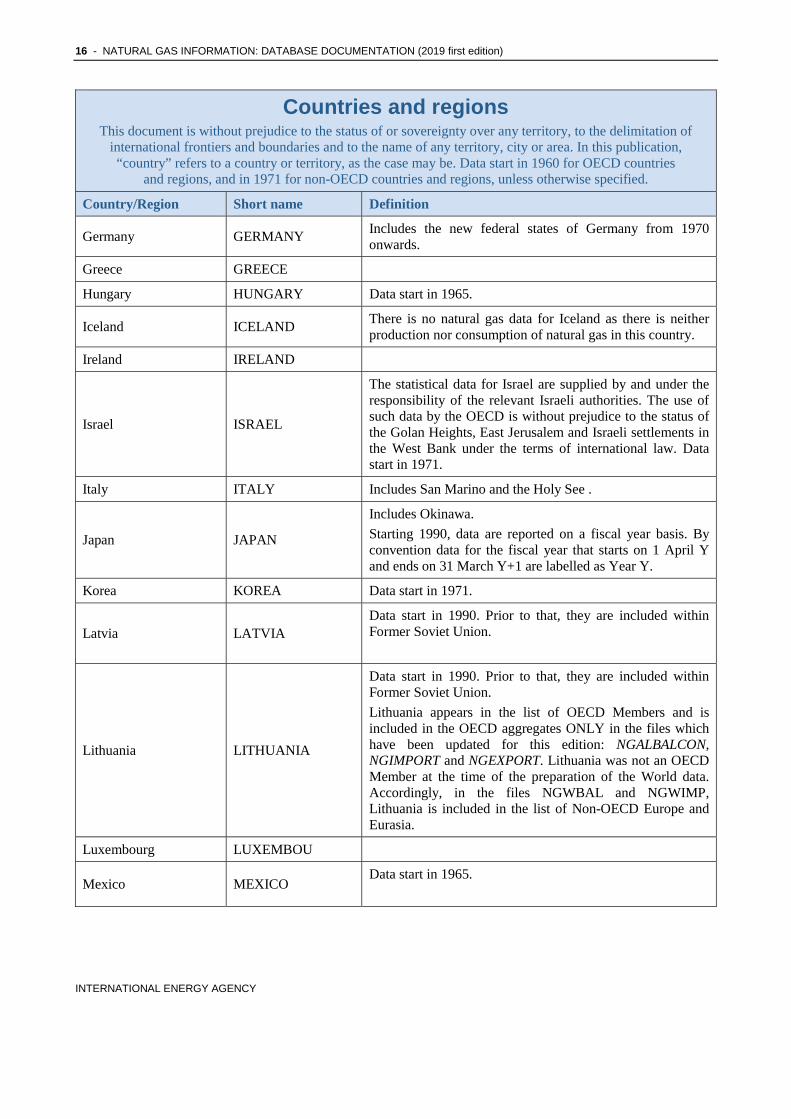
Germany GERMANY Includes the new federal states of Germany from 1970 onwards.
Greece GREECE
Hungary HUNGARY Data start in 1965.
Iceland ICELAND There is no natural gas data for Iceland as there is neither production nor consumption of natural gas in this country.
Ireland IRELAND
Israel ISRAEL
The statistical data for Israel are supplied by and under the responsibility of the relevant Israeli authorities. The use of such data by the OECD is without prejudice to the status of the Golan Heights, East Jerusalem and Israeli settlements in the West Bank under the terms of international law. Data start in 1971.
Italy ITALY Includes San Marino and the Holy See .
Japan JAPAN
Includes Okinawa.
Starting 1990, data are reported on a fiscal year basis. By convention data for the fiscal year that starts on 1 April Y and ends on 31 March Y+1 are labelled as Year Y.
Korea KOREA Data start in 1971.
Latvia LATVIA Data start in 1990. Prior to that, they are included within Former Soviet Union.
Lithuania LITHUANIA
Data start in 1990. Prior to that, they are included within Former Soviet Union.
Lithuania appears in the list of OECD Members and is included in the OECD aggregates ONLY in the files which have been updated for this edition: NGALBALCON, NGIMPORT and NGEXPORT. Lithuania was not an OECD Member at the time of the preparation of the World data. Accordingly, in the files NGWBAL and NGWIMP, Lithuania is included in the list of Non-OECD Europe and Eurasia.
Luxembourg LUXEMBOU
Mexico MEXICO Data start in 1965.
NATURAL GAS INFORMATION: DATABASE DOCUMENTATION (2019 Final Edition) - 17
INTERNATIONAL ENERGY AGENCY
Countries and regions This document is without prejudice to the status of or sovereignty over any territory, to the delimitation of
international frontiers and boundaries and to the name of any territory, city or area. In this publication, “country” refers to a country or territory, as the case may be. Data start in 1960 for OECD countries
and regions, and in 1971 for non-OECD countries and regions, unless otherwise specified.
Country/Region Short name Definition
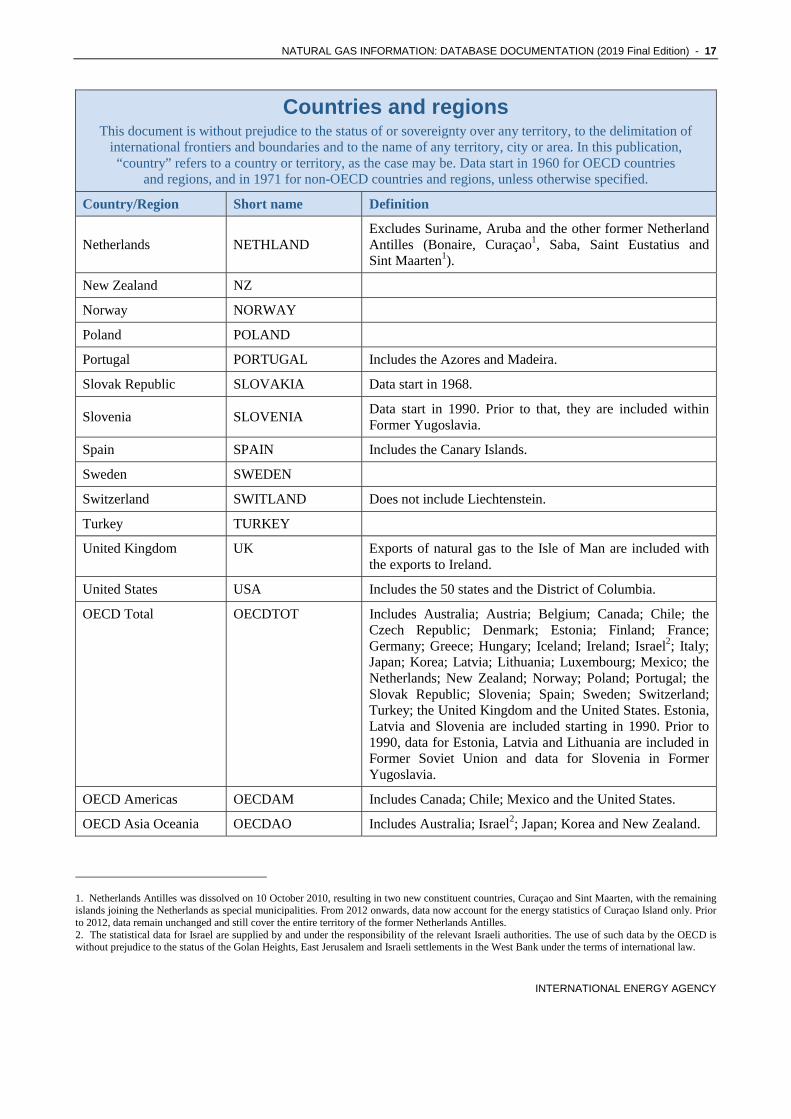
Netherlands NETHLAND Excludes Suriname, Aruba and the other former Netherland Antilles (Bonaire, Curaçao1, Saba, Saint Eustatius and Sint Maarten1).
New Zealand NZ
Norway NORWAY
Poland POLAND
Portugal PORTUGAL Includes the Azores and Madeira.
Slovak Republic SLOVAKIA Data start in 1968.
Slovenia SLOVENIA Data start in 1990. Prior to that, they are included within Former Yugoslavia.
Spain SPAIN Includes the Canary Islands.
Sweden SWEDEN
Switzerland SWITLAND Does not include Liechtenstein.
Turkey TURKEY
United Kingdom UK Exports of natural gas to the Isle of Man are included with the exports to Ireland.
United States USA Includes the 50 states and the District of Columbia.
OECD Total OECDTOT Includes Australia; Austria; Belgium; Canada; Chile; the Czech Republic; Denmark; Estonia; Finland; France; Germany; Greece; Hungary; Iceland; Ireland; Israel2; Italy; Japan; Korea; Latvia; Lithuania; Luxembourg; Mexico; the Netherlands; New Zealand; Norway; Poland; Portugal; the Slovak Republic; Slovenia; Spain; Sweden; Switzerland; Turkey; the United Kingdom and the United States. Estonia, Latvia and Slovenia are included starting in 1990. Prior to 1990, data for Estonia, Latvia and Lithuania are included in Former Soviet Union and data for Slovenia in Former Yugoslavia.
OECD Americas OECDAM Includes Canada; Chile; Mexico and the United States.
OECD Asia Oceania OECDAO Includes Australia; Israel2; Japan; Korea and New Zealand.
1. Netherlands Antilles was dissolved on 10 October 2010, resulting in two new constituent countries, Curaçao and Sint Maarten, with the remaining islands joining the Netherlands as special municipalities. From 2012 onwards, data now account for the energy statistics of Curaçao Island only. Prior to 2012, data remain unchanged and still cover the entire territory of the former Netherlands Antilles. 2. The statistical data for Israel are supplied by and under the responsibility of the relevant Israeli authorities. The use of such data by the OECD is without prejudice to the status of the Golan Heights, East Jerusalem and Israeli settlements in the West Bank under the terms of international law.
18 - NATURAL GAS INFORMATION: DATABASE DOCUMENTATION (2019 first edition)
INTERNATIONAL ENERGY AGENCY
Countries and regions This document is without prejudice to the status of or sovereignty over any territory, to the delimitation of
international frontiers and boundaries and to the name of any territory, city or area. In this publication, “country” refers to a country or territory, as the case may be. Data start in 1960 for OECD countries
and regions, and in 1971 for non-OECD countries and regions, unless otherwise specified.
Country/Region Short name Definition
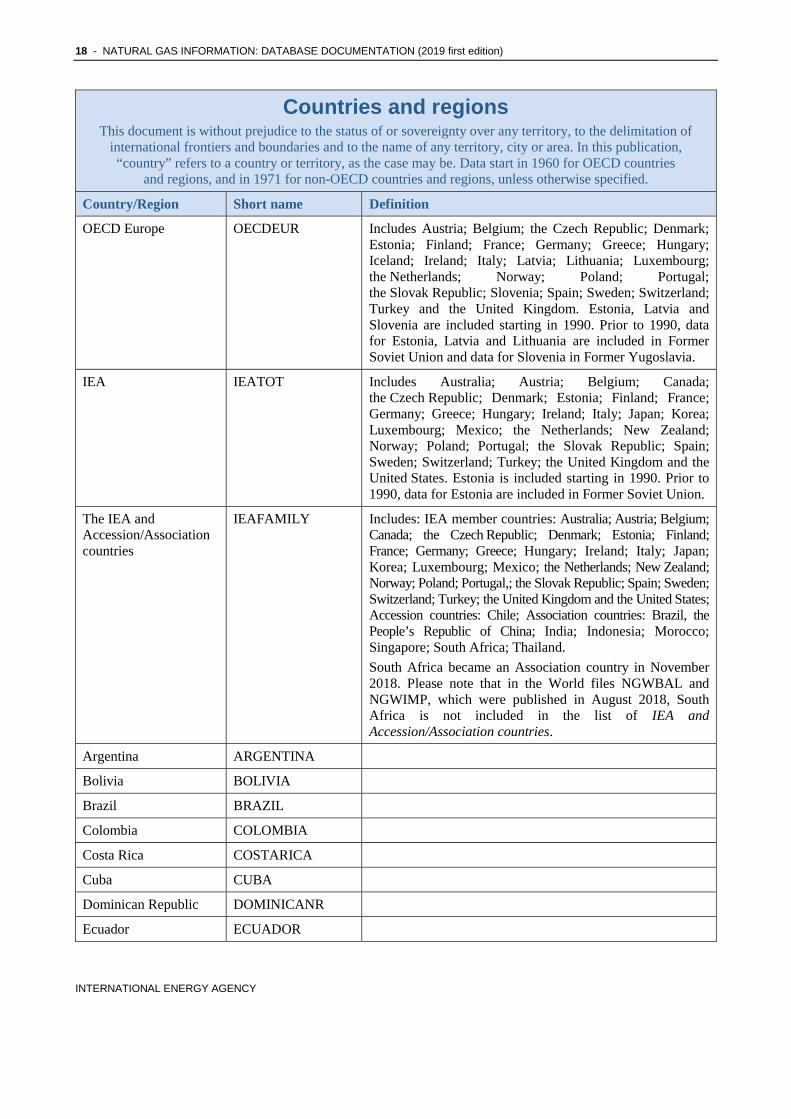
OECD Europe OECDEUR Includes Austria; Belgium; the Czech Republic; Denmark; Estonia; Finland; France; Germany; Greece; Hungary; Iceland; Ireland; Italy; Latvia; Lithuania; Luxembourg; the Netherlands; Norway; Poland; Portugal; the Slovak Republic; Slovenia; Spain; Sweden; Switzerland; Turkey and the United Kingdom. Estonia, Latvia and Slovenia are included starting in 1990. Prior to 1990, data for Estonia, Latvia and Lithuania are included in Former Soviet Union and data for Slovenia in Former Yugoslavia.
IEA IEATOT Includes Australia; Austria; Belgium; Canada; the Czech Republic; Denmark; Estonia; Finland; France; Germany; Greece; Hungary; Ireland; Italy; Japan; Korea; Luxembourg; Mexico; the Netherlands; New Zealand; Norway; Poland; Portugal; the Slovak Republic; Spain; Sweden; Switzerland; Turkey; the United Kingdom and the United States. Estonia is included starting in 1990. Prior to 1990, data for Estonia are included in Former Soviet Union.
The IEA and Accession/Association countries
IEAFAMILY Includes: IEA member countries: Australia; Austria; Belgium; Canada; the Czech Republic; Denmark; Estonia; Finland; France; Germany; Greece; Hungary; Ireland; Italy; Japan; Korea; Luxembourg; Mexico; the Netherlands; New Zealand; Norway; Poland; Portugal,; the Slovak Republic; Spain; Sweden; Switzerland; Turkey; the United Kingdom and the United States; Accession countries: Chile; Association countries: Brazil, the People’s Republic of China; India; Indonesia; Morocco; Singapore; South Africa; Thailand.
South Africa became an Association country in November 2018. Please note that in the World files NGWBAL and NGWIMP, which were published in August 2018, South Africa is not included in the list of IEA and Accession/Association countries.
Argentina ARGENTINA
Bolivia BOLIVIA
Brazil BRAZIL
Colombia COLOMBIA
Costa Rica COSTARICA
Cuba CUBA
Dominican Republic DOMINICANR
Ecuador ECUADOR
NATURAL GAS INFORMATION: DATABASE DOCUMENTATION (2019 Final Edition) - 19
INTERNATIONAL ENERGY AGENCY
Countries and regions This document is without prejudice to the status of or sovereignty over any territory, to the delimitation of
international frontiers and boundaries and to the name of any territory, city or area. In this publication, “country” refers to a country or territory, as the case may be. Data start in 1960 for OECD countries
and regions, and in 1971 for non-OECD countries and regions, unless otherwise specified.
Country/Region Short name Definition
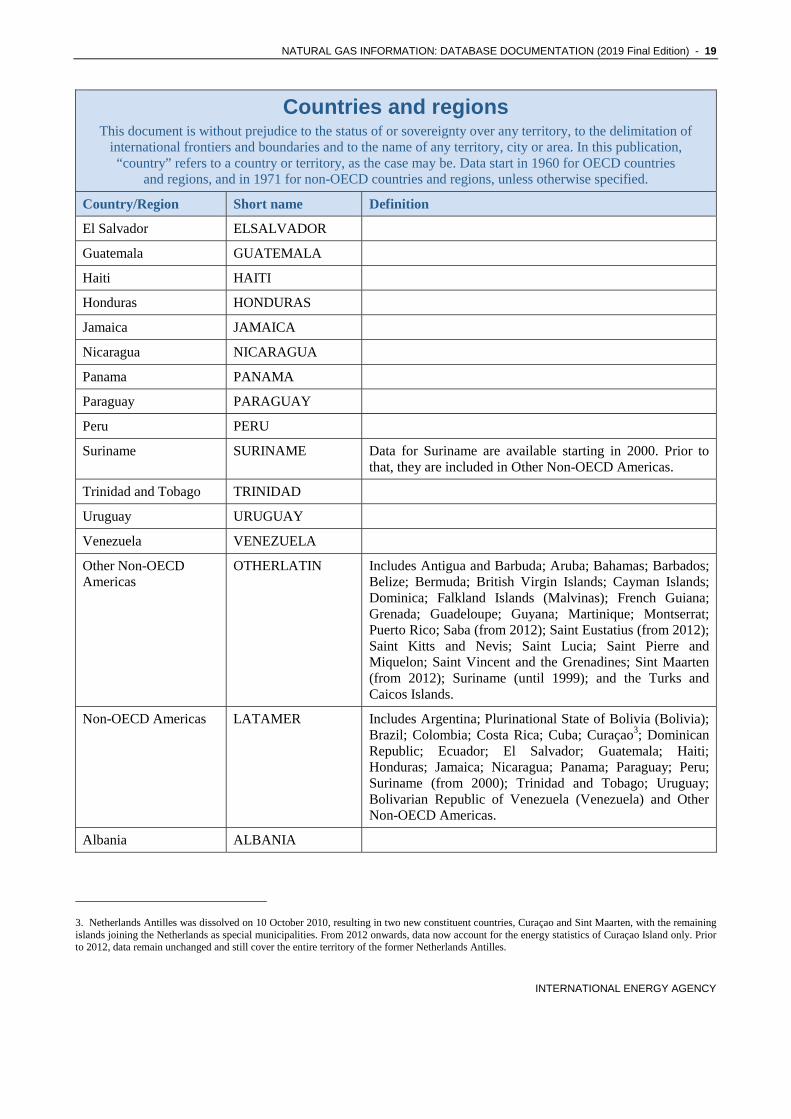
El Salvador ELSALVADOR
Guatemala GUATEMALA
Haiti HAITI
Honduras HONDURAS
Jamaica JAMAICA
Nicaragua NICARAGUA
Panama PANAMA
Paraguay PARAGUAY
Peru PERU
Suriname SURINAME Data for Suriname are available starting in 2000. Prior to that, they are included in Other Non-OECD Americas.
Trinidad and Tobago TRINIDAD
Uruguay URUGUAY
Venezuela VENEZUELA
Other Non-OECD Americas
OTHERLATIN Includes Antigua and Barbuda; Aruba; Bahamas; Barbados; Belize; Bermuda; British Virgin Islands; Cayman Islands; Dominica; Falkland Islands (Malvinas); French Guiana; Grenada; Guadeloupe; Guyana; Martinique; Montserrat; Puerto Rico; Saba (from 2012); Saint Eustatius (from 2012); Saint Kitts and Nevis; Saint Lucia; Saint Pierre and Miquelon; Saint Vincent and the Grenadines; Sint Maarten (from 2012); Suriname (until 1999); and the Turks and Caicos Islands.
Non-OECD Americas LATAMER Includes Argentina; Plurinational State of Bolivia (Bolivia); Brazil; Colombia; Costa Rica; Cuba; Curaçao3; Dominican Republic; Ecuador; El Salvador; Guatemala; Haiti; Honduras; Jamaica; Nicaragua; Panama; Paraguay; Peru; Suriname (from 2000); Trinidad and Tobago; Uruguay; Bolivarian Republic of Venezuela (Venezuela) and Other Non-OECD Americas.
Albania ALBANIA
3. Netherlands Antilles was dissolved on 10 October 2010, resulting in two new constituent countries, Curaçao and Sint Maarten, with the remaining islands joining the Netherlands as special municipalities. From 2012 onwards, data now account for the energy statistics of Curaçao Island only. Prior to 2012, data remain unchanged and still cover the entire territory of the former Netherlands Antilles.
20 - NATURAL GAS INFORMATION: DATABASE DOCUMENTATION (2019 first edition)
INTERNATIONAL ENERGY AGENCY
Countries and regions This document is without prejudice to the status of or sovereignty over any territory, to the delimitation of
international frontiers and boundaries and to the name of any territory, city or area. In this publication, “country” refers to a country or territory, as the case may be. Data start in 1960 for OECD countries
and regions, and in 1971 for non-OECD countries and regions, unless otherwise specified.
Country/Region Short name Definition
Armenia ARMENIA Data for Armenia are available starting in 1990. Prior to that, they are included in Former Soviet Union.
Azerbaijan AZERBAIJAN Data for Azerbaijan are available starting in 1990. Prior to that, they are included in Former Soviet Union.
Belarus BELARUS Data for Belarus are available starting in 1990. Prior to that, they are included in Former Soviet Union.
Bosnia and Herzegovina
BOSNIAHERZ Data for Bosnia and Herzegovina are available starting in 1990. Prior to that, they are included in Former Yugoslavia.
Bulgaria BULGARIA
Croatia CROATIA Data for Croatia are available starting in 1990. Prior to that, they are included in Former Yugoslavia.
Cyprus CYPRUS Note by Turkey: The information in this document with reference to “Cyprus” relates to the southern part of the Island. There is no single authority representing both Turkish and Greek Cypriot people on the Island. Turkey recognizes the Turkish Republic of Northern Cyprus (TRNC). Until a lasting and equitable solution is found within the context of the United Nations, Turkey shall preserve its position concerning the “Cyprus” issue.
Note by all the European Union Member States of the OECD and the European Union: The Republic of Cyprus is recognised by all members of the United Nations with the exception of Turkey. The information in this report relates to the area under the effective control of the Government of the Republic of Cyprus.
Republic of North Madeconia
NORTHMACED Data for the Republic of North Macedonia are available starting in 1990. Prior to that, they are included in Former Yugoslavia.
Georgia GEORGIA Data for Georgia are available starting in 1990. Prior to that, they are included in Former Soviet Union.
Gibraltar GIBRALTAR
Kazakhstan KAZAKHSTAN Data for Kazakhstan are available starting in 1990. Prior to that, they are included in Former Soviet Union.
Kosovo KOSOVO Data for Kosovo are available starting in 2000. Between 1990 and 1999, data for Kosovo are included in Serbia. Prior to 1990, they are included in Former Yugoslavia.
NATURAL GAS INFORMATION: DATABASE DOCUMENTATION (2019 Final Edition) - 21
INTERNATIONAL ENERGY AGENCY
Countries and regions This document is without prejudice to the status of or sovereignty over any territory, to the delimitation of
international frontiers and boundaries and to the name of any territory, city or area. In this publication, “country” refers to a country or territory, as the case may be. Data start in 1960 for OECD countries
and regions, and in 1971 for non-OECD countries and regions, unless otherwise specified.
Country/Region Short name Definition
Kyrgyzstan KYRGYZSTAN Data for Kyrgyzstan are available starting in 1990. Prior to that, they are included in Former Soviet Union.
Malta MALTA
Republic of Moldova MOLDOVA Data for Moldova are available starting in 1990. Prior to that, they are included in Former Soviet Union.
Montenegro MONTENEGRO Data for Montenegro are available starting in 2005. Between 1990 and 2004, data for Montenegro are included in Serbia. Prior to 1990, they are included in Former Yugoslavia.
Romania ROMANIA
Russia RUSSIA Data for Russia are available starting in 1990. Prior to that, they are included in Former Soviet Union.
Serbia SERBIA Data for Serbia are available starting in 1990. Prior to that, they are included in Former Yugoslavia. Serbia includes Montenegro until 2004 and Kosovo until 1999.
Tajikistan TAJIKISTAN Data for Tajikistan are available starting in 1990. Prior to that, they are included in Former Soviet Union.
Turkmenistan TURKMENIST Data for Turkmenistan are available starting in 1990. Prior to that, they are included in Former Soviet Union.
Ukraine UKRAINE Data for Ukraine are available starting in 1990. Prior to that, they are included in Former Soviet Union.
Uzbekistan UZBEKISTAN Data for Uzbekistan are available starting in 1990. Prior to that, they are included in Former Soviet Union.
Other Former Soviet Union
OTHFUSSR Before 1990, includes Armenia; Azerbaijan; Belarus; Estonia; Georgia; Kazakhstan; Kyrgyzstan; Latvia; Lithuania; Republic of Moldova; Russian Federation; Tajikistan; Turkmenistan; Ukraine and Uzbekistan.
Other Former Yugoslavia
OTHFYUGO Before 1990, includes Bosnia and Herzegovina; Croatia; Republic of North Macedonia; Kosovo; Montenegro; Slovenia and Serbia.
22 - NATURAL GAS INFORMATION: DATABASE DOCUMENTATION (2019 first edition)
INTERNATIONAL ENERGY AGENCY
Countries and regions This document is without prejudice to the status of or sovereignty over any territory, to the delimitation of
international frontiers and boundaries and to the name of any territory, city or area. In this publication, “country” refers to a country or territory, as the case may be. Data start in 1960 for OECD countries
and regions, and in 1971 for non-OECD countries and regions, unless otherwise specified.
Country/Region Short name Definition
Non-OECD Europe and Eurasia
NOECDEUR Includes Albania; Armenia; Azerbaijan; Belarus; Bosnia and Herzegovina; Bulgaria; Croatia; Cyprus4,5; Republic of North Macedonia; Georgia; Gibraltar; Kazakhstan; Kosovo; Kyrgyzstan; Latvia; Lithuania6; Malta; Republic of Moldova (Moldova); Montenegro; Romania; Russian Federation; Serbia7; Tajikistan; Turkmenistan; Ukraine; Uzbekistan; Former Soviet Union (prior to 1990) and Former Yugoslavia (prior to 1990).
Prior to 1990, data for Estonia are included in Former Soviet Union and data for Slovenia in Former Yugoslavia.
Algeria ALGERIA
Angola ANGOLA
Benin BENIN
Botswana BOTSWANA Data for Botswana are available from 1981. Prior to that, they are included in Other Africa.
Cameroon CAMEROON
Congo CONGO
Democratic Republic of the Congo
CONGOREP
Côte d'Ivoire COTEIVOIRE
Egypt EGYPT Data for Egypt are reported on a fiscal year basis. By convention, data for the fiscal year that starts on 1 July Y and ends on 30 June Y+1 are labelled as year Y.
Eritrea ERITREA Data for Eritrea are available from 1992. Prior to that, they are included in Ethiopia.
Ethiopia ETHIOPIA Ethiopia includes Eritrea prior to 1992.
Gabon GABON
4. Note by Turkey: The information in this document with reference to “Cyprus” relates to the southern part of the Island. There is no single authority representing both Turkish and Greek Cypriot people on the Island. Turkey recognises the Turkish Republic of Northern Cyprus (TRNC). Until a lasting and equitable solution is found within the context of the United Nations, Turkey shall preserve its position concerning the “Cyprus issue”. 5. Note by all the European Union Member States of the OECD and the European Union: The Republic of Cyprus is recognised by all members of the United Nations with the exception of Turkey. The information in this document relates to the area under the effective control of the Government of the Republic of Cyprus. 6. Lithuania appears in the list of OECD Members and is included in the OECD aggregates ONLY in the files which have been updated for this edi-tion: NGBALCON, NGEXPORT and NGIMPORT. Lithuania was not an OECD Member at the time of the preparation of the World data. Accord-ingly, in the files NGWBAL and NGWIMP, Lithuania is included in the non-OECD data. This file will be updated in August 2019. 7. Serbia includes Montenegro until 2004 and Kosovo until 1999.
NATURAL GAS INFORMATION: DATABASE DOCUMENTATION (2019 Final Edition) - 23
INTERNATIONAL ENERGY AGENCY
Countries and regions This document is without prejudice to the status of or sovereignty over any territory, to the delimitation of
international frontiers and boundaries and to the name of any territory, city or area. In this publication, “country” refers to a country or territory, as the case may be. Data start in 1960 for OECD countries
and regions, and in 1971 for non-OECD countries and regions, unless otherwise specified.
Country/Region Short name Definition
Ghana GHANA
Kenya KENYA
Libya LIBYA
Mauritius MAURITIUS
Morocco MOROCCO
Mozambique MOZAMBIQUE
Namibia NAMIBIA Data for Namibia are available starting in 1991. Prior to that, data are included in Other Africa.
Niger NIGER Prior to 2000, data for Niger are presented in Other Africa.
Nigeria NIGERIA
Senegal SENEGAL
South Africa SOUTHAFRIC South Africa became an Association country in November 2018. Please note that in the World files NGWBAL and NGWIMP, which were published in August 2018, South Africa is not included in the list of IEA and Accession/Association countries.
South Sudan SSUDAN Data for South Sudan are available from 2012. Prior to 2012, they are included in Sudan.
Sudan SUDAN South Sudan became an independent country on 9 July 2011. From 2012, data for South Sudan are reported separately.
United Republic of Tanzania
TANZANIA Oil data are reported on a fiscal year basis, beginning on the 1 July Y and ending on the 30 June Y+1.
Togo TOGO
Tunisia TUNISIA
Zambia ZAMBIA
Zimbabwe ZIMBABWE
Other Africa OTHERAFRIC Includes Botswana (until 1980); Burkina Faso; Burundi; Cape Verde; Central African Republic; Chad; Comoros; Djibouti; Equatorial Guinea; Gambia; Guinea; Guinea-Bissau; Lesotho; Liberia; Madagascar; Malawi; Mali; Mauritania; Namibia (until 1990); Niger (until 1999) Réunion; Rwanda; Sao Tome and Principe; Seychelles; Sierra Leone; Somalia; Swaziland; and Uganda.
24 - NATURAL GAS INFORMATION: DATABASE DOCUMENTATION (2019 first edition)
INTERNATIONAL ENERGY AGENCY
Countries and regions This document is without prejudice to the status of or sovereignty over any territory, to the delimitation of
international frontiers and boundaries and to the name of any territory, city or area. In this publication, “country” refers to a country or territory, as the case may be. Data start in 1960 for OECD countries
and regions, and in 1971 for non-OECD countries and regions, unless otherwise specified.
Country/Region Short name Definition
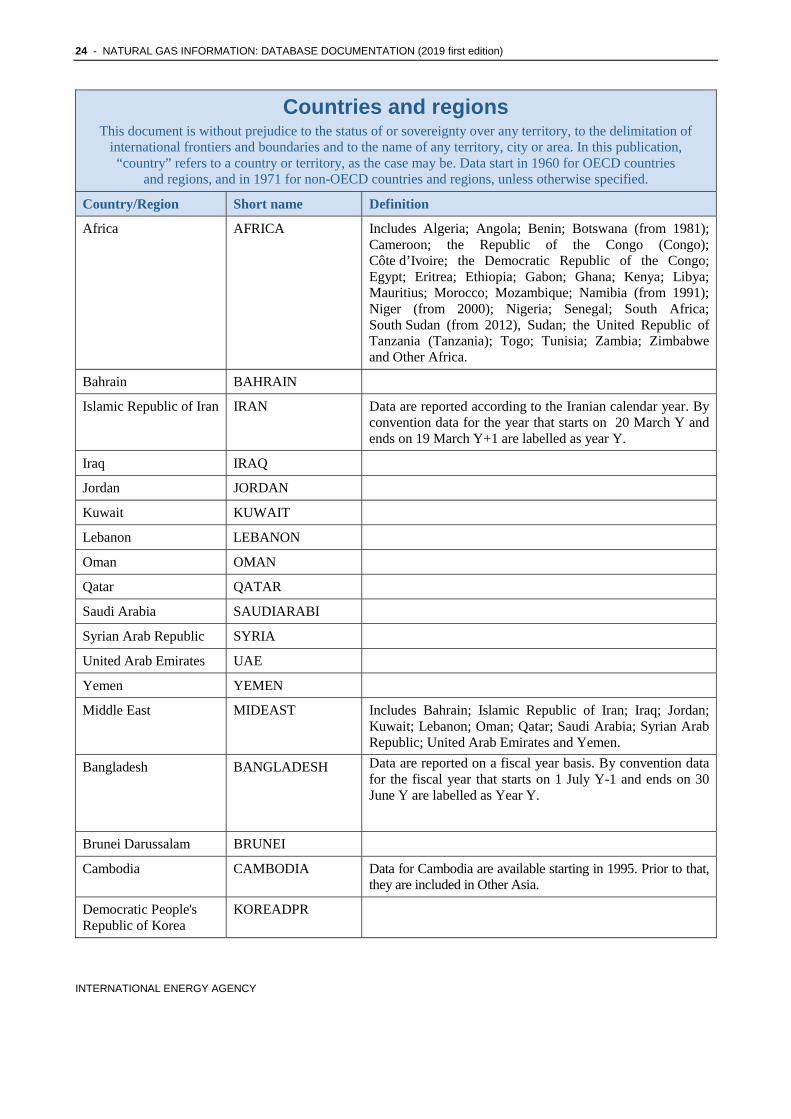
Africa AFRICA Includes Algeria; Angola; Benin; Botswana (from 1981); Cameroon; the Republic of the Congo (Congo); Côte d’Ivoire; the Democratic Republic of the Congo; Egypt; Eritrea; Ethiopia; Gabon; Ghana; Kenya; Libya; Mauritius; Morocco; Mozambique; Namibia (from 1991); Niger (from 2000); Nigeria; Senegal; South Africa; South Sudan (from 2012), Sudan; the United Republic of Tanzania (Tanzania); Togo; Tunisia; Zambia; Zimbabwe and Other Africa.
Bahrain BAHRAIN
Islamic Republic of Iran IRAN Data are reported according to the Iranian calendar year. By convention data for the year that starts on 20 March Y and ends on 19 March Y+1 are labelled as year Y.
Iraq IRAQ
Jordan JORDAN
Kuwait KUWAIT
Lebanon LEBANON
Oman OMAN
Qatar QATAR
Saudi Arabia SAUDIARABI
Syrian Arab Republic SYRIA
United Arab Emirates UAE
Yemen YEMEN
Middle East MIDEAST Includes Bahrain; Islamic Republic of Iran; Iraq; Jordan; Kuwait; Lebanon; Oman; Qatar; Saudi Arabia; Syrian Arab Republic; United Arab Emirates and Yemen.
Bangladesh BANGLADESH Data are reported on a fiscal year basis. By convention data for the fiscal year that starts on 1 July Y-1 and ends on 30 June Y are labelled as Year Y.
Brunei Darussalam BRUNEI
Cambodia CAMBODIA Data for Cambodia are available starting in 1995. Prior to that, they are included in Other Asia.
Democratic People's Republic of Korea
KOREADPR
NATURAL GAS INFORMATION: DATABASE DOCUMENTATION (2019 Final Edition) - 25
INTERNATIONAL ENERGY AGENCY
Countries and regions This document is without prejudice to the status of or sovereignty over any territory, to the delimitation of
international frontiers and boundaries and to the name of any territory, city or area. In this publication, “country” refers to a country or territory, as the case may be. Data start in 1960 for OECD countries
and regions, and in 1971 for non-OECD countries and regions, unless otherwise specified.
Country/Region Short name Definition
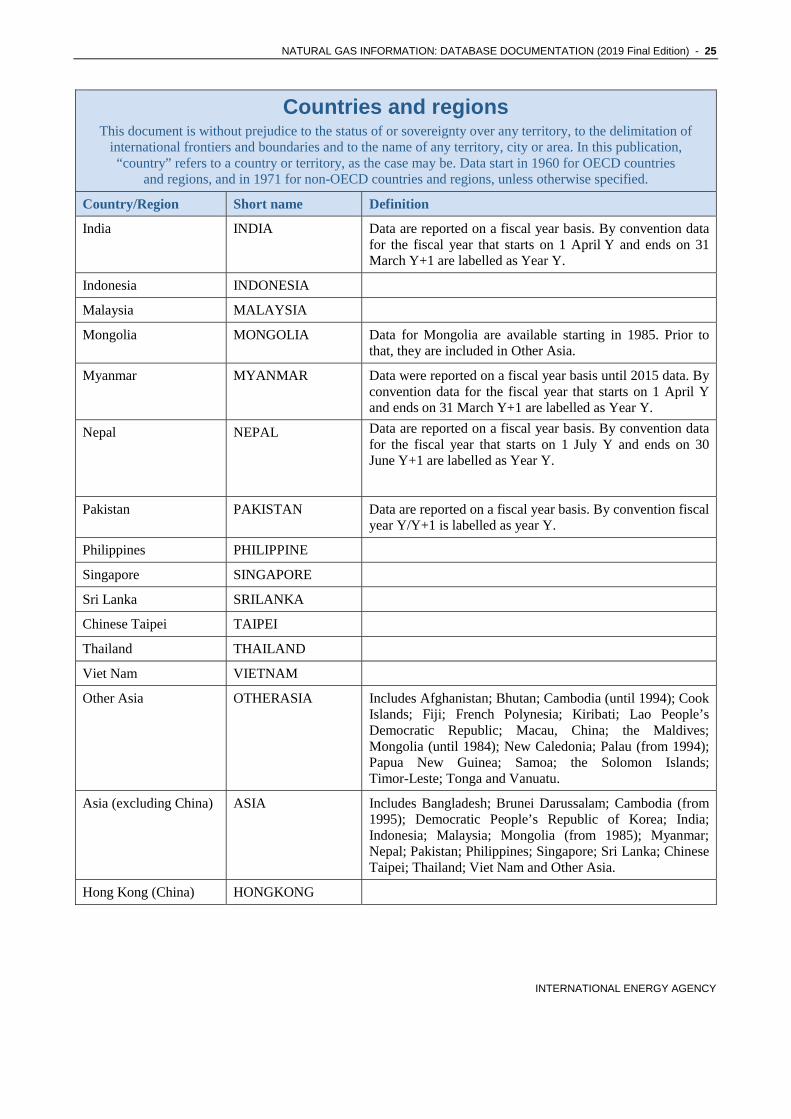
India INDIA Data are reported on a fiscal year basis. By convention data for the fiscal year that starts on 1 April Y and ends on 31 March Y+1 are labelled as Year Y.
Indonesia INDONESIA
Malaysia MALAYSIA
Mongolia MONGOLIA Data for Mongolia are available starting in 1985. Prior to that, they are included in Other Asia.
Myanmar MYANMAR Data were reported on a fiscal year basis until 2015 data. By convention data for the fiscal year that starts on 1 April Y and ends on 31 March Y+1 are labelled as Year Y.
Nepal NEPAL Data are reported on a fiscal year basis. By convention data for the fiscal year that starts on 1 July Y and ends on 30 June Y+1 are labelled as Year Y.
Pakistan PAKISTAN Data are reported on a fiscal year basis. By convention fiscal year Y/Y+1 is labelled as year Y.
Philippines PHILIPPINE
Singapore SINGAPORE
Sri Lanka SRILANKA
Chinese Taipei TAIPEI
Thailand THAILAND
Viet Nam VIETNAM
Other Asia OTHERASIA Includes Afghanistan; Bhutan; Cambodia (until 1994); Cook Islands; Fiji; French Polynesia; Kiribati; Lao People’s Democratic Republic; Macau, China; the Maldives; Mongolia (until 1984); New Caledonia; Palau (from 1994); Papua New Guinea; Samoa; the Solomon Islands; Timor-Leste; Tonga and Vanuatu.
Asia (excluding China) ASIA Includes Bangladesh; Brunei Darussalam; Cambodia (from 1995); Democratic People’s Republic of Korea; India; Indonesia; Malaysia; Mongolia (from 1985); Myanmar; Nepal; Pakistan; Philippines; Singapore; Sri Lanka; Chinese Taipei; Thailand; Viet Nam and Other Asia.
Hong Kong (China) HONGKONG
26 - NATURAL GAS INFORMATION: DATABASE DOCUMENTATION (2019 first edition)
INTERNATIONAL ENERGY AGENCY
Countries and regions This document is without prejudice to the status of or sovereignty over any territory, to the delimitation of
international frontiers and boundaries and to the name of any territory, city or area. In this publication, “country” refers to a country or territory, as the case may be. Data start in 1960 for OECD countries
and regions, and in 1971 for non-OECD countries and regions, unless otherwise specified.
Country/Region Short name Definition
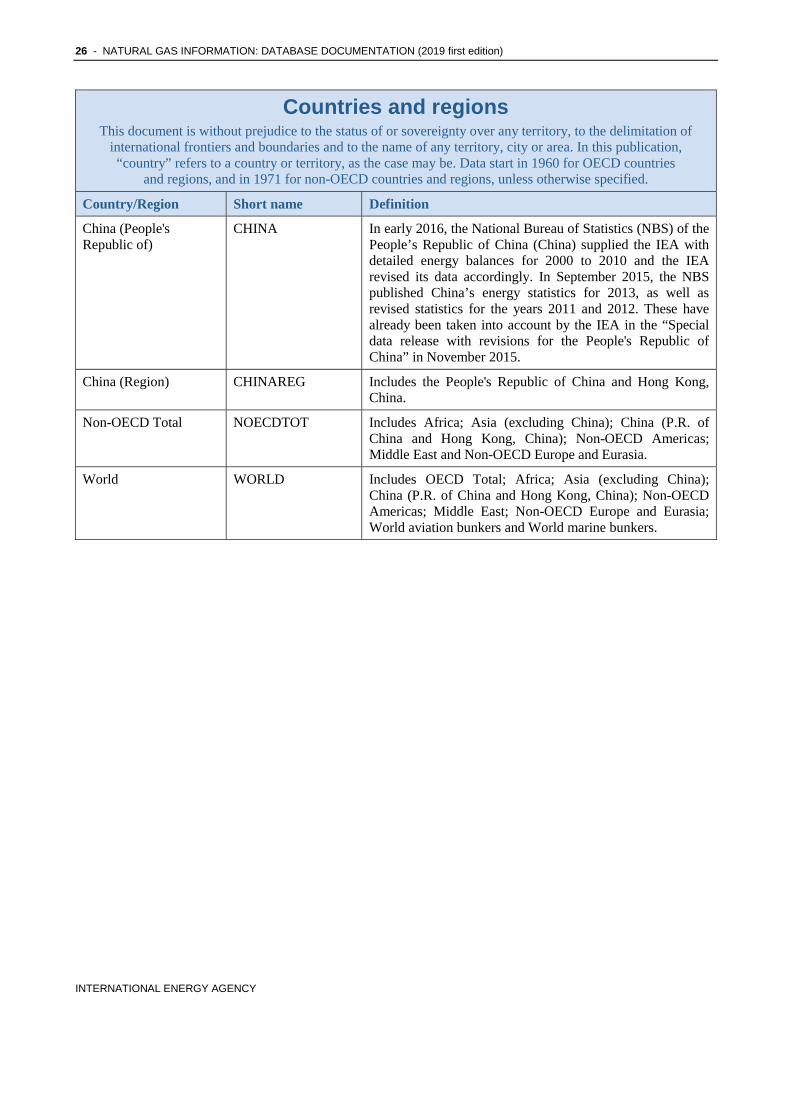
China (People's Republic of)
CHINA In early 2016, the National Bureau of Statistics (NBS) of the People’s Republic of China (China) supplied the IEA with detailed energy balances for 2000 to 2010 and the IEA revised its data accordingly. In September 2015, the NBS published China’s energy statistics for 2013, as well as revised statistics for the years 2011 and 2012. These have already been taken into account by the IEA in the “Special data release with revisions for the People's Republic of China” in November 2015.
China (Region) CHINAREG Includes the People's Republic of China and Hong Kong, China.
Non-OECD Total NOECDTOT Includes Africa; Asia (excluding China); China (P.R. of China and Hong Kong, China); Non-OECD Americas; Middle East and Non-OECD Europe and Eurasia.
World WORLD Includes OECD Total; Africa; Asia (excluding China); China (P.R. of China and Hong Kong, China); Non-OECD Americas; Middle East; Non-OECD Europe and Eurasia; World aviation bunkers and World marine bunkers.
NATURAL GAS INFORMATION: DATABASE DOCUMENTATION (2017 preliminary edition) - 27
INTERNATIONAL ENERGY AGENCY
6. COUNTRY NOTES AND SOURCES
OECD Countries General notes
Natural Gas Information 2019 is the latest edition of a publication on natural gas that has been produced an-nually since 1996. Previously, statistical information on natural gas was included in the publication Oil and Gas Information; however given the increasing prom-inence of natural gas in the global economy, the need was seen for a publication dedicated solely to this en-ergy source.
In this release,the files for OECD countries in the online data service are updated as of July 209 (NGBALCON, NGEXPORT and NGIMPORT). The World files (NGWBAL and NGWIMP) include data up to 2017 with preliminary supply data for 2018. These files will be updated in August 2020 with the final release which will include World data up to 2018 and preliminary supply data for 2019.
Natural Gas Information 2019 brings together in one volume the basic statistics compiled by the IEA on natural gas supply and demand. It also includes in-formation on prices, storage capacity, LNG and pipe-line trade, LNG terminals as well as maps on the dis-tribution network in OECD countries8,9.
The notes given in this document refer to the data for the years 1960 to 2018 published in the on-line data service. In general, more detailed notes are available for data starting in 1990.
8. This document is without prejudice to the status of or sovereignty over any territory, to the delimitation of international frontiers and boundaries and to the name of any territory, city or area. 9. In this publication, “country” refers to a country or a territory, as the case may be.
Data are obtained through annual submission of natu-ral gas questionnaires from National Administrations, as indicated for each country in the sources section.
In some instances, it has been necessary for the IEA to estimate some data. Explanations of the estimates are provided in the country notes. Energy data for 2017 for non-Member countries published in the World files have been estimated by the IEA secretariat.
Australia
Source
Department of the Environment and Energy, Canberra.
General notes
• In the 2019 edition, the Australian administration proceeded to major revisions on the supply side from 2013 onwards due to a change in methodol-ogy on production quantities and more recent sources on calorific values. Additionally the oil and gas extraction, and liquefaction (LNG) / re-gasification plants on the demand side were re-vised from 2003 onwards, which resulted in in-creased statistical difference. Work is undertaken by the administration in order to provide new re-visions in the 2020 edition that will address this gap.
• In the 2016 edition, the Australian administration revised natural gas demand data for some flows back to 2010, resulting in breaks in time series between 2009 and 2010.
• Prior to 1991 natural gas data included ethane.
• Data after 1973 are based on national surveys.
• All data refer to fiscal years, which run from 1 July to 30 June (e.g. 2016 = 1 July 2015 to 30 June 2016).
xxviii - NATURAL GAS INFORMATION: DATABASE DOCUMENTATION (2018 preliminary edition)
INTERNATIONAL ENERGY AGENCY
• For reasons of data confidentiality, Australia does not provide a breakdown of exports by destination and data prior to 2015 are estimated by the Secre-tariat. Since the 2017 edition, Australian admin-istration started to provide estimates of the LNG exports to their main markets, whereas in the 2018 edition the 2017 preliminary data were pro-vided by the Australian Bureau of Statistics (ABS) barring exports to Chinese Taipei.
Supply
• For 2018, there is a continuation of the increase in indigenous production (+15%) and exports (+18%) of gas, which started in 2017 due to the LNG exporting capacity coming online in 2016 and 2017.
• Around 30% of the production (mainly coal seam gas) is estimated by the Australian administration.
• In the 2015 edition the Australian administration revised production and certain consumption flows back to 2006. The production figures now include previously uncaptured flows.
• Pipeline imports are from the Joint Petroleum De-velopment Area, an area jointly administered by Timor-Leste and Australia pursuant to the Timor Sea Treaty.
Transformation
• From 2011 to 2016, the non-specified transfor-mation of natural gas represents amounts used to produce hydrogen for hydrocracking in refineries.
• Prior to 1973 there are no detailed data available for autoproducers and for sub-sector industry consumption. Autoproducer data are included in main activity producer before 1974.
Consumption
• Consumption in the residential and agriculture and forestry sectors are estimated by the Australi-an administration based on models.
• There are breaks between 2002 and 2003 in due to major revisions made in the oil and gas extrac-tion, and liquefaction (LNG) / regasification plants in the context of the 2019 edition.
• Between 2009 and 2010 some breaks in time series may occur due to changes in methodologies and to improved data sources. Revisions to the con-sumption data include changes to energy use in liquefaction plants, and a shift of gas works gas (transformation) to non-specified energy from
2006 onwards. Revisions to previous years are pending.
• Until 2005 natural gas consumed to fuel the distri-bution of natural gas in natural gas networks was re-ported as transformation for gas works gas produc-tion.
• Between 2001 and 2002 there are breaks in time series for consumption data due to an industry structural shift and changes in methodology.
• In 1999 and 2000 end-use consumption data are estimated by the Australian administration.
Austria
Source
Bundesanstalt Statistik Österreich, Vienna.
General note
• Prior to 2000 differences due to measurement are included with distribution losses.
Supply
• Export amounts are calculated by the national admin-istration by subtracting stock changes and domestic consumption from import figures. The split by country is confidential so all the exports are report-ed under not elsewhere specified since 2002. Simi-larly, all imports are reported under not elsewhere specified since 2014 for confidentiality reasons.
Transformation
• In the 2018 edition, the time series for blast Fur-naces was reclassified from 1990 onwards, and thus moved from the transformation to the energy sector.
• Between 1995 and 1996 there is a break in time series for autoproducer electricity and CHP plants due to the availability of more detailed da-ta.
• In 1980 the consumption of natural gas in gas works within the transformation sector stopped.
Consumption
• In the 2019 edition, Austrian administration re-vised oil and gas extraction and oil refinery con-sumption data for 2005 onwards based on data reported to the Emissions Trading Scheme (ETS). Additionally, it revised data since 2005 for other
NATURAL GAS INFORMATION: DATABASE DOCUMENTATION (2018 preliminary edition) - xxix
INTERNATIONAL ENERGY AGENCY
sectors’ flows since 2005 and industry since 2012 based on a combination of the results of sample surveys and data from the regulator.
• In 2013 the increase in pipeline transport con-sumption is due to a new methodology of data collection. Historical revisions are pending.
• Any inconsistencies in the time series for commer-cial/public services until 2011 are the result of this sub-sector being computed as a residual. Since 2012 the commercial/public services consumption figures are surveyed annually and the consumption quantities in small and medium enterprises in in-dustry are the projected results of biannual sample surveys.
Belgium
Source
Observatoire de l'Energie, Brussels.
Supply
• For 2018 data, trade includes real transit. This results in higher figures for Germany, the Netherlands and the UK.
• Since 2009 gas trade in Belgium includes imported LNG which is regasified and subsequently ex-ported to other countries.
• Imports include spot purchases.
• The LNG consumption data in international ma-rine bunkers are confidential.
Transformation
• The Belgian administration is in the process of revising 2011 and 2010 transformation sector data. As such, an unusually high quantity of nat-ural gas is reported under not elsewhere specified (transformation).
• From 2000 natural gas begun to replace blast furnace gas in the iron and steel industry.
Consumption
• Consumption in the transport equipment sub-sector decreased in 2015 due to the closure of a big industry of this sector in December 2014.
• In 2003 the large decrease in non-specified indus-try consumption is due to improvements in data collection.
Canada
Source
Natural Resources Canada, Ottawa.
General notes
• In the 2019 edition, the Canadian administration proceeded to data revisions from 2005 onwards based on the revised source statistics from Statis-tics Canada and with the aim of achieving greater consistency with the Energy Efficiency Indicators data submission to IEA.
• Prior to 1990 data for consumption of natural gas for construction are not available.
• Prior to 1978 consumption in the non-specified category of the industry sector includes gas used as fuel in oil refineries.
Supply
• 2015 is the first year when stock levels were measured in Canada. Based on this measurement and the stock change of previous years, Canadian authorities have estimated the stock level back to 2005.
• Indigenous production is measured by the Canadi-an administration by upscaling the marketable production by approximately 11% to account for own-use in the extraction process.
• Associated gas has been estimated by the Canadian administration for 2016 and 2017.
• Non-associated gas production data include colliery gas as well as associated gas produced in Alberta.
Transformation
• In 2000 the increase in main activity electricity producer data is due to new generation plants in Alberta and Ontario.
• Due to confidentiality reasons, the Canadian ad-ministration estimated natural gas consumption in oil refineries for the 2014-2017.
xxx - NATURAL GAS INFORMATION: DATABASE DOCUMENTATION (2018 preliminary edition)
INTERNATIONAL ENERGY AGENCY
• Gas-to-liquids (Transformation) represents quanti-ties of natural gas consumed in the production of synthetic crude oil.
• Non-specified (Transformation) represents quanti-ties of natural gas used for the upgrading of re-fined oil products.
Consumption
• In the 2019 edition, the oil and gas extraction con-sumption was revised from 2005 onwards in order to more accurately separate it from other min-ing/extractive activities.
• In the 2019 edition, an improved methodology was applied to industry sector for 2005 onwards re-sulting in a share of the non-specified industry be-ing allocated to various industrial sub-sectors and creating breaks between 2004 and 2005.
• Starting from 2014, distribution losses will no longer be reported by Canada as this flow was historically computed as a balancing variable.
• Due to confidentiality reasons, the Canadian ad-ministration estimated natural gas consumption in the following sectors for 2014-2017: iron and steel, non-ferrous metal, transport equipment and machinery.
• In 2011 the increase consumption by non-metallic mineral production is due to switching from coal to natural gas in cement manufacturing.
• Prior to 1978 agriculture/forestry is included in industry, and no detailed industry sub-sector data are available.
Chile
Source
Ministerio de Energía, Santiago.
General notes
• Since 2008 stocks levels data are available.
• The 2017 values for not elsewhere specified (Transformation) and oil refineries have been es-timated by the IEA Secretariat.
Supply
• Exports of regasified LNG to Argentina started in 2016, after the works to enable reverse flows in the interconnector finished.
• Since 2009 data representing LPG injected into the natural gas distribution network are availa-ble. They are reported in from other sources – Oil.
Transformation
• For 2009 and 2010 inputs of natural gas to auto-producer CHP plants were estimated by the Chilean administration. For other years these in-puts are included in autoproducer electricity.
• Not elsewhere specified (Transformation) repre-sents natural gas that is blended with refinery gas.
Consumption
• Natural gas used for oil and gas extraction is in-cluded in gas consumption for energy sector own use under oil refineries.
• Non-specified (transport) corresponds to marine transport.
Czech Republic
Source
Czech Statistical Office, Prague.
General notes
• Prior to 1994 data in transport sector are for for-mer Czechoslovakia.
• Between 1993 and 1994 there are some breaks in time series due to a change in the energy balance methodology between former Czechoslovakia and the Czech Republic.
Supply
• From 2013 all non-associated gas production was reclassified as colliery gas production.
Consumption
• There is a break in time series in the industry and transformation sectors between 2009 and 2010 due to new available data from distribution com-panies.
• Since 2008 hydrogen production is reported in petrochemical feedstocks as non-energy use. Up to 2007, chemical and petrochemical consump-tion includes both energy and non-energy use.
NATURAL GAS INFORMATION: DATABASE DOCUMENTATION (2018 preliminary edition) - xxxi
INTERNATIONAL ENERGY AGENCY
Denmark
Source
Danish Energy Agency, Copenhagen.
General note
• In the 2004 edition, the Danish administration re-vised the time series back to 1972. .
Supply
• In the 2019 edition, biogas (receipts from other sources - Renewables) was reported for the first time.
Consumption
• The consumption of LNG for marine transport and international marine bunkers is not reported due to confidentiality.
• The breakdown for industrial consumption for the latest year is estimated by the Danish administra-tion using the previous year’s split and revised the following year.
• Gas works (Transformation) represents natural gas blended and distributed as “town gas”. Revi-sions to this flow are expected for the 2020 edi-tion.
Estonia
Source
Statistics Estonia, Tallinn.
General note
• Data for Estonia are available starting in 1990. Prior to that, they are included in Former Soviet Union.
Consumption
• Consumption reported under not elsewhere speci-fied (Energy) represents consumption of different activities of companies in the energy sector (NACE 35) for own uses without transformation.
• There are inconsistencies in the time series for residential consumption as this sector is comput-ed as a residual.
• In 2014 Estonia’s main company in the chemical and petrochemical sector ceased activity, result-ing in no non-energy use of natural gas.
• In 2009 Estonia’s main producer of fertilisers ceased activity, resulting in a sharp decrease in the non-energy use of natural gas. The plant reo-pened in 2012.
Finland
Source
Statistics Finland, Helsinki.
General notes
• In 2018, more operators entered the market. As a result, stock data stopped being confidential.
• Finland imports LNG since September 2016. As there is only one company operating in this mar-ket, LNG supply data is confidential and have been excluded from the supply side flows. Be-tween 1999 and 2000 there are some breaks in the time series due to a new survey system and a re-classification of the data.
• Between 1989 and 1990 there are some breaks in the time series as data from 1990 to 1999 were revised by the Finnish administration in 2002.
Supply
• Data are reported for international marine bunkers consumption since 2017.
• The opening and closing stock levels data are con-fidential and stock changes data for 2017 are a es-timates by the Finnish administration.
Transformation
• Not elsewhere specified (Transformation) data rep-resent natural gas used for hydrogen manufacture. This hydrogen is used for hydrodesulphurization and hydrocracking in oil refineries
Consumption
• Distribution losses for 2017 include the quantities of boil-off natural gas originating from the natu-ral evaporation of LNG in tanks.
• Not elsewhere specified (Transport) includes LNG consumption for domestic navigation.
xxxii - NATURAL GAS INFORMATION: DATABASE DOCUMENTATION (2018 preliminary edition)
INTERNATIONAL ENERGY AGENCY
• Since 1995 the breakdown between residential and commercial/public services is available due to new system of data collection.
• Prior to 1989 data for consumption in the residen-tial and agriculture/forestry sectors were estimat-ed by the Finnish administration.
France
Source
Ministère de la Transition Écologique et Solidaire
General notes
• Starting from the 2018 edition, the French admin-istration revised the methodology used in order to bring it more in line with the international stand-ards. More specifically, (i) Supply figures were revised for the period 2007-2016, (ii) transformation sector consumption for 2007-2016, (iii) energy sector consumption for 2011-2016, (iv) transport and commercial/public ser-vices for 2000-2016, (v) industry sector for 2011-2016 and (vi) imports and exports for 2011-2016.
• In the 2019 edition, the French administration re-vised the demand side from 2011 onwards by im-proving the methodology with the consolidation of data from SDSE surveys and additional official sources.
• Until 2007 some statistical differences reported by the French utilities were included in distribution losses. Since 2008 these amounts are included under statistical difference.
• Between 1999 and 2000 there are some breaks in time series due to a new methodology for prepar-ing the natural gas balances.
• The data include the French overseas departments, however natural gas is neither produced, nor consumed in these departments.
Supply
• From 2000 onwards the exports breakdown is not available.
• There is a break in stocks between 2004 and 2005.
• Pipeline imports from not elsewhere specified origin may contain spot purchases of LNG.
• The pipeline imports and pipeline exports data include transit amounts.
• From 1990 to 1998 statistical differences include gas consumption which is not broken down by sectors.
Consumption
• The increase in natural gas consumption in the electricity sector for 2016 and 2017 has been mainly driven by the decrease in nuclear genera-tion due to maintenance operations, which was compensated by gas-fired power plants.
• Between 2005 and 2006 there is a break in the time series in the industry sub-sectors.
• Gas for pipelines is included in distribution losses.
Germany
Source
Federal Statistical Office (DESTATIS), Wiesbaden.
General notes
• Between 2009 and 2010 there is a break in time series due to a new, more comprehensive legal framework that resulted in methodological chang-es for production and new calorific values for natural gas.
• Between 2002 and 2003 there are breaks in the time series for some sectors due to modifications in reporting methodology.
• Between 1994 and 1995 there are some breaks in time series due to the fact that the industry sub-sector breakdown is based on the 1995 NACE classi-fication.
• Between 2016 and 2017 there is a break in the gross calorific value of natural gas in the observed inland consumption, because the German administration ac-quired better information on the import amounts of L-Gas (low calorific gas) for the 2017 data.
Supply
• In 2016 and 2017, natural gas imports from the Netherlands are included under not elsewhere specified origin due to confidentiality. Not else-where-specified imports also include gas imported from the UK and Denmark.
NATURAL GAS INFORMATION: DATABASE DOCUMENTATION (2018 preliminary edition) - xxxiii
INTERNATIONAL ENERGY AGENCY
• Imports include all the gas purchased by German companies, whether it is finally consumed in Germany or not.
• Exports include all the gas sold by German com-panies (these are mainly re-exports) and the coun-try of destination is not reported due to confiden-tiality issues..
• The low GCV of the vented gas is due to its high Sulphur content. This flow was revised back to 2003.
Transformation
• In 2003 there is a break in time series for electrici-ty and CHP plants (both autoproducers and main activity producers).
• Prior to 1995 inputs of natural gas for main activ-ity producer heat plants are included with main activity producer CHP plants.
Consumption
• Since 2003 there are no official data for the con-struction sector.
• Since 2003 consumption in agriculture/forestry and other not elsewhere specified (Other), which were previously estimated, are no longer shown, and losses data have been included in statistical difference.
• Since 2003 gas consumption in coke ovens was negligible.
• Prior to 1995 end-use consumption data are based on Arbeitsgemeinschaft Energiebilanzen.
• Before 1970 there is no detailed breakdown avail-able for the industry sector with the exception of iron and steel and chemical and petrochemical industries.
Greece
Source
Ministry for Environment and Energy, Athens.
General notes
• Natural gas produced in Greece has a higher than average GCV due to a high content of C2/C4 hydrocarbons.
• In 1997 a new pipeline between Russia and Greece became operational.
Supply
• In November 1998 the production of natural gas stopped in and started again in December 1999.
Consumption
• Between 2010 and 2011 there is a break in time series for the non-ferrous metals due to a new methodology for measuring gas consumed by this sub-sector.
• Since 2017, natural gas has started to be con-sumed in the construction sub-sector as well.
• In 1998 consumption in the residential sector is included with commercial/public services.
Hungary
Source
Hungarian Energy and Public Utility Regulatory Authority, Budapest.
General note
• Between 1996 and 1997 some breaks in time series exist due to a new methodology applied by the Hungarian administration.
Supply
• Between 2012 and 2013 there is a break in the stock levels due to a change in the methodology.
• Between 2001 and 2002 there is a break in the time series for the stock levels.
• From 2001 to 2004 statistical difference includes natural gas used for refilling cushion gas.
• Imports and exports data are reported according to the TSO’s data, which include transit volumes.
Transformation
• Since 2010, data reported for not elsewhere speci-fied (Transformation) represent natural gas used for hydrogen manufacture used in refineries for hydrodesulphurization. Prior to this year, these quantities are reported under oil refineries.
• Prior to 2004, iron and steel consumption includes transformation of natural gas in blast furnaces.
• The increase in main activity producer CHP plants data in 2000 is due to a reclassification of auto-producer plants into main activity producer plants.
xxxiv - NATURAL GAS INFORMATION: DATABASE DOCUMENTATION (2018 preliminary edition)
INTERNATIONAL ENERGY AGENCY
• Since 1997, two autoproducer heat plants have been reclassified to main activity producer heat plants.
Consumption
• Consumption under the not elsewhere specified (Other) sector includes military usage.
• Between 2012 and 2013 there are some breaks in the time series for the energy sector, transport and industry consumption due to a new method-ology. Historical revisions are pending.
Iceland
There is no natural gas data for Iceland, as there is neither production nor consumption.
Ireland
Sources
Sustainable Energy Authority of Ireland, Cork.
General note
• Since April 2017 there is no gas storage facility in Ireland.
Supply
• Natural gas indigenous production has been in-creasing since 2015 when the Corrib Gas field began production at the end of that year.
• In 2009 the data sources for the opening stock lev-el and the closing stock level are different. This has resulted in a very low value for the GCV of the stock change.
• Since 1996 the increase in imports is due to the de-pletion of the Kinsale gas field and the availability of a new pipeline system to the United Kingdom.
Transformation
• Since 2006 a different methodology for allocating unsold steam from autoproducer CHP is used.
• Not elsewhere specified (Transformation) corre-sponds to natural gas blended with refinery gas.
Consumption
• In the 2019 edition, the Irish administration re-vised the distribution losses based on new data
coming from the Emissions Trading Scheme, which had a knock-on effect in the final con-sumption data, primarily for industry.
• In 2011, the increase in non-ferrous metals con-sumption is due to a fuel switch to natural gas.
• Since 2009 the disaggregation of consumption into all the industry sub sectors excluding non-ferrous metals is done according to data from the Census of Industrial Production (CIP). The last energy consumption data available from the CIP are from 2009 and therefore the 2009-2015 sub-sector breakdown is the same every year.
• In 2007, the increase in machinery consumption is due to changes in industry sub-sector structure and fuel usage.
• In 2004, there is a break in the time series in food, beverages and tobacco consumption due to a change in methodology.
• In 2003, feedstock use in the chemical and petro-chemical industry stopped due to the shutdown of a fertiliser plant.
• In 2001, natural gas consumption in the iron and steel industry stopped due to the shutdown of Ire-land’s main steel plant.
• Prior to 1986, detailed figures for the consumption of natural gas in industry and other sectors are not available.
Israel
Source
Israel Central Bureau of Statistics, Jerusalem.
General note
• The 2019 edition includes 2017 data and revisions in consumption for 2016 based on the Energy Bal-ances published by the Israeli Central Bureau of Statistics (CBS). This results in breaks in the time series between 2012 and 2013.
• 2018 data was estimated by the IEA Secretariat.
• From 2012 all natural gas data, except inputs to electricity production, are estimated by the IEA Secretariat.
Supply
• Imports of natural gas began in 2008.
NATURAL GAS INFORMATION: DATABASE DOCUMENTATION (2018 preliminary edition) - xxxv
INTERNATIONAL ENERGY AGENCY
Transformation
• In the 2017 edition, the Israeli administration revised transformation data back to 2013 creating breaks in the time series between 2012 and 2013.
• In the 2019 edition, the not elsewhere specified (Transformation) since 2013 refers to quantities of natural gas used for the generation of hydro-gen, which is subsequently used for hydrodesul-phurization in oil refineries. In the previous edi-tions, these figures were reported as energy con-sumption of gas in oil refineries.
• In the 2019 edition, the 2016 and 2017 gas inputs to main producers and autoproducers of electrici-ty were estimated by the IEA Secretariat.
Consumption
• In the 2019 edition, the Israeli administration re-vised industry and other sectors data for 2016. Due to lack of categorisation, industry is classi-fied as not elsewhere specified (Industry) and the other sectors as not elsewhere specified (Other).
Italy
Source
Ministry of Economic Development, Rome.
General notes
• From 1991 data for losses include some statistical differences. However, since 1994 improved col-lection methods have decreased these differences.
• Between 1989 and 1990 there is a break in stocks level.
Supply
• Imports from Croatia represent natural gas trans-ferred with a pipeline directly to Italy from fields in Croatian territory in the Adriatic Sea.
Transformation
• Prior to 2008, inputs of natural gas to all heat production in industry were reported in final consumption.
• Between 2003 and 2004 there are breaks in time series in industry and transformation due to a new data reporting methodology
• From 2000 to 2002 no autoproducer data are avail-able due to confidentiality reasons. These data are included in main activity producer plants.
• In 1996 the production of gas works gas from natural gas ceased.
Consumption
• From 2007 a more detailed breakdown of con-sumption for energy industry own use is availa-ble.
• Prior to 1990 consumption in commercial/public services is included in residential.
• Prior to 1970 the breakdown of industry data is only available for iron and steel and chemical and petrochemical industry; all other data are includ-ed in not elsewhere specified (Industry).
• Except for liquefaction plants, data for the energy sector are estimated and include statistical differ-ences and other non-specified consumption.
Japan
Source
The Institute of Energy Economics, Tokyo.
General notes
• The 2019 edition contains major revisions to time series which go back to 1990. These reflect the revisions in the Energy Balance Table from the Ministry of Economy, Trade and Industry, which is the data source.
• From 1990 data are reported on a fiscal year basis, which runs from 1 April to 31 March (e.g. 2015 = April 2015 to March 2016).
Supply
• In the 2019 edition, indigenous production, re-ceipts from other sources, imports data, stock changes and stock levels were revised back to 1990.
• In certain cases, the country of the last consign-ment of natural gas is often reported as the coun-try of origin for the LNG imports, instead of the country where the gas was produced
xxxvi - NATURAL GAS INFORMATION: DATABASE DOCUMENTATION (2018 preliminary edition)
INTERNATIONAL ENERGY AGENCY
Transformation
• In the 2019 edition, main activity and auto-producer electricity plants were revised back to 1990. Similarly, flows of the energy sector were revised back up to 1990.
• Since 1990 most of the gas works gas production and consumption has been included with natural gas.
Consumption
• In the 2019 edition, own consumption in electrici-ty, CHP and heat plants was subject to a major revision since 1990.
• In the 2019 edition, all the transport, industry and other sectors flows were revised back to 1990.
Korea
Source
Korea Energy Economics Institute, Ulsan.
General note
• Energy industry own-use in liquefaction plants includes measuring errors and losses.
Supply
• Korea reports production of natural gas since 2005. The production is decreasing and the reser-voir is expected to be possibly depleted by the end of 2018.
• The receipts from other sources from 2006 to 2012 represent the amount of liquefied petroleum gases that are either blended with natural gas or are directly used in city gas distribution networks.
Consumption
• Energy industry own use in liquefaction plants in-cludes losses and measuring errors.
• Prior to 2007 consumption of natural gas in ma-chinery was included with transport equipment.
• From 1987 to 1991 the breakdown of final con-sumption has been estimated by the Secretariat, as well as the residential subsector for 1992.
Latvia
Source
Central Statistical Bureau, Riga.
General note
• Data for Latvia are available starting in 1990. Prior to that, they are included in Former Soviet Union in World Energy Statistics.
Supply
• Stock levels in Latvia do not include stocks held in national territory for other countries.
Transformation
• In 2017 there was a steep decrease reported in main activity CHP consumption and a respective increase in main activity heat consumption due to the classification of fuel inputs according to the units of the plants instead of the plants as a whole that was previously used.
Consumption
• The consumption in the iron and steel industry decreased in 2014 due to the bankruptcy of the major company in the market.
Lithuania
Source
Statistics Lithuania, Vilnius.
General note
• Data for Lithuania are available starting in 1990. Prior to that, they are included in Former Soviet Union in World Energy Statistics.
Supply
• The export quantities since 2014 represent import-ed LNG which is regasified and subsequently ex-ported to other countries.
Transformation
• Not elsewhere specified (Transformation) data rep-resent natural gas used for methanol manufac-ture, which is used as input in oil refineries.
NATURAL GAS INFORMATION: DATABASE DOCUMENTATION (2018 preliminary edition) - xxxvii
INTERNATIONAL ENERGY AGENCY
Consumption
• There is a break between 2010 and 2011 in the not elsewhere specified (Energy) timeseries due to natural gas being consumed for heat that was used to destroy radioactive waste after the de-commissioning of the only Lithuanian nuclear plant at the end of 2009.
Luxembourg
Source
STATEC – Institut national de la statistique et des études économiques du Grand-Duché du Luxembourg, Luxembourg.
General note
• In 1982 there is a break in the time series in transfor-mation and industry due to a change in methodology.
Supply
• Not elsewhere specified imports include gas pur-chased on the spot market.
Transformation
• Since 2002 the increase of gas consumption in the transformation sector is due to a new 350-MW combined cycle power plant.
The last main activity producer electricity gas-consuming plant closed in 2016.Consumption
• In the 2017 edition, Luxembourg integrated sup-plementary data from ETS companies and revised industrial consumption back to the year 2000.
• The breakdown of Total final consumption for the latest year is preliminary and will be finalised in the next edition of the book.
• Since 2012, the methodology to determine final consumption was changed in order to integrate basic data from National Accounts.
• Since 2000, a more detailed breakdown of final consumption data is available due to a change in methodology.
• Since 2000, consumption in the non-ferrous metals sub-sector is included in iron and steel for rea-sons of confidentiality.
• Since 2000, consumption in not elsewhere speci-fied (Industry) includes activity of companies re-classified to preserve the confidentiality.
• Prior to 2000 residential consumption includes consumption in commercial/public services and agriculture/forestry.
Mexico
Source
Secretaría de Energía, Mexico City.
General note
• Mexico is currently improving the data collection process and revisions of historical data are ex-pected in the following editions.
• In 2013 there are breaks in series due to a change in the methodology for reporting energy data. The Mexican administration is currently working on the revision of historical data.
• Since 1993 data have been submitted by the “Sec-retaría de Energía”.
• Natural gas reported in the IEA publications may be different from what is reported in the Mexican energy publications, as the IEA includes only dry gas and excludes natural gas liquids, which are considered as part of oil products.
Consumption
• The split of natural gas used for hydrogen manu-facture and used in refineries is not currently available and it will be provided in the 2020 edi-tion of this publication.
• Losses and pipeline transport are included in oil and gas extraction.
• Not elsewhere specified (Energy) was estimated by the Mexican administration for 2017 and will be revised in the 2020 edition.
• Revisions are expected to not elsewhere specified (Industry) in the 2020 edition, as the Mexican administration works on the disaggregation of the industry subsectors over the course of the year.
• From 1993 to 1999 oil and gas extraction and not elsewhere specified (Industry) data were estimat-ed.
• Since 1993 the breakdown of the energy sector and of other sectors is available.
xxxviii - NATURAL GAS INFORMATION: DATABASE DOCUMENTATION (2018 preliminary edition)
INTERNATIONAL ENERGY AGENCY
Netherlands
Source
Statistics Netherlands, The Hague.
General note
• In the 2018 edition, the Dutch administration re-vised the supply side data for 1990-2016 in order to (i) better account for flows from underground storages which used to be incorporated in the production data and also (ii) handle in-flows/outflows of gas stored in Germany as im-ports/exports.
• In the 2019 edition, the Dutch administration re-vised the opening and closing stock levels based on a dedicated questionnaire used. Additionally, industrial consumption was revised since 2012 based on inputs coming from the Emissions Trad-ing Scheme (ETS) data.
• Between 1981 and 1982, and between 1983 and 1984 there are breaks in time series due to the in-troduction of more comprehensive surveys on end-use consumption.
Supply
• A production cap of natural gas was set by the government in 2015, which has been extended and gradually tightened for 2016 and 2017.
• Due to confidentiality issues, the split of LNG im-ports is estimated by the Dutch administration based on trade data.
• In the past, the amounts reported under indigenous production also included quantities coming from stock changes. The reason was that the Dutch administration could not distinguish between quantities of natural gas falling under marketable production and amounts being moved from off-shore fields to onshore fields without undergoing any purification and/or other necessary produc-tion processes. From 2015 the data reported dis-tinguish between amounts to be reported as indig-enous production and amounts that should be classified as stock changes. This created a break in stocks levels between 2014 and 2015.
• Dutch trade figures include transit volumes.
• Imports from Germany include imports from Russia.
• Due to the revision in 2018 of inflows and out-flows from stored gas held in Germany, there have been amendments to historical imports and exports data.
• International marine bunkers were reported for the first time in the 2019 edition.
Transformation
• The values for not elsewhere specified (Energy) represents natural gas combusted by the distribu-tion operator for the purpose of operating the grid.
• In 2009 the increase in main activity electricity consumption is due to the opening of a new plant in the second half of 2008.
• In 2008 the large increase in autoproducer CHP plants consumption is due to a new autoproducer CHP plant which came on-stream.
Consumption
• Between 1987 and 1988 there is a break in the time series in the commercial/public services con-sumption due to a major reorganisation of three public utility companies.
• In the 2018 edition, the Dutch administration pro-vided data on the not elsewhere specified (Other) Non-energy use flow for the years 2007-2014, which represent the volume of gas injected as cushion gas in a new underground storage.
New Zealand
Source
Ministry of Business, Innovation and Employment, Wellington.
General notes
• 2018 data was estimated based on monthly data submitted to the IEA Secretariat.
• Between 2012 and 2013 there are breaks in series for the final consumption breakdown due to the introduction of a new survey.
• From 1977 to 1979 and from 1986 to 1989 losses are included in the statistical difference.
Supply
• There are no imports or exports of natural gas for New Zealand.
NATURAL GAS INFORMATION: DATABASE DOCUMENTATION (2018 preliminary edition) - xxxix
INTERNATIONAL ENERGY AGENCY
Transformation
• In 1998 there is a large increase in autoproducer CHP plants consumption as two new autoproduc-er CHP plants came on-stream.
Consumption
• In 2005 the decline in chemical and petrochemical industry consumption was due to the closure of the Motunui methanol production plant. The Mo-tunui plant was then reopened in late 2008.
• Prior to 2003 natural gas consumed in industry includes some gas for energy industry own-use.
• In February 1997 production of synthetic gasoline from natural gas ended.
• Since 1990 a detailed consumption breakdown for industry is available.
Norway
Source
Statistics Norway, Oslo.
General note
• At the time of publication of the 2019 edition, the Norwegian administration had qualified the natu-ral gas data for 2017 as provisional figures.
• In the 2018 edition, the Norwegian administration made widespread revisions to their data back to 2010, following the introduction of a new system for energy balances and energy accounts. Breaks in series may appear between 2009 and 2010 as a result.
• Since 2008 data on stocks are available.
Supply
• For Norway, the supply of natural gas is the re-sidual of two very large and opposite amounts: indigenous production and exports. As a result, large statistical differences in some years may lead to discrepancies in the growth rates of supply and demand of natural gas.
• In 2008 there is a break in the time series for in-digenous production as the production of gas amounts consumed by the offshore platforms were included.
• In 2000 non-associated gas production ceased.
• In 1992 the large increase in oil and gas extraction is due to the start-up of new fields.
• For the years 2010-2014 no split between coun-tries of origin was provided, therefore these were estimated by the IEA Secretariat.
Transformation
• Since 2007 gas inputs to all electricity and CHP plants are included in autoproducer electricity plants due to confidentiality.
• The last main activity electricity producer plant closed down in 2016.
Consumption
• In 2007 the increase in not elsewhere specified (Transport) is due to the wider use of gas-powered sea vessels.
• Since 2002 domestic navigation is included under not elsewhere specified (Transport).
• Before 2000 oil and gas extraction consumption also included some data which should have been included under total final consumption.
• Consumption for pipeline transport is included in oil and gas extraction.
Poland
Source
Central Statistical Office, Warsaw.
General notes
• Distribution losses may include some statistical differences.
Supply
• Exports include all the gas sold by companies op-erating in Poland (these are mainly re-exports).
• Imports from Germany mainly represent natural gas purchased through virtual reverse flow in the Polish section of the Yamal-Europe pipeline
• Since 2010 gas imports from Russia include gas produced in Azerbaijan, Turkmenistan, Kazakh-stan or Uzbekistan.
• In 2009 imports reported from Other FSU are from Turkmenistan, Kazakhstan or Uzbekistan.
xl - NATURAL GAS INFORMATION: DATABASE DOCUMENTATION (2018 preliminary edition)
INTERNATIONAL ENERGY AGENCY
• Natural gas reported in associated gas production contains some heavier hydrocarbons. This results in a high gross calorific value for this flow.
Transformation
• Not elsewhere specified (Transformation) data rep-resent natural gas used for hydrogen manufacture. This hydrogen is used for hydrodesulphurization in oil refineries.
• In 2013 and 2014 some CHP plants were used as backup reserve plants, resulting in a decrease in consumption under main activity producers CHP plants.
• In 2004 and 2005 small amounts of gas were used to start up main activity electricity producer plants.
• In the 2017 data, local small-CHP & heat plants were reclassified from the commercial/public ser-vices to the transformation sector and the residen-tial sub-sector.
Consumption
• Not elsewhere specified (Energy) own use includes gas used for heating and pumping operations in the distribution network.
Portugal
Source
Direcção-Geral de Energia e Geologia, Lisbon.
Supply
• The imports reported under not elsewhere speci-fied represent gas entering Portugal through the pipeline from Spain.
• Prior to February 2004 most LNG imports from Nigeria arrived via the Huelva terminal in Spain, where they were regasified and sent by pipeline to Portugal. From February 2004 LNG imports ar-rive directly at the Sines terminal.
• The surge in 2017 imports is attributed to the con-sumption of gas-fired power plants that filled in the gap of decreased hydro-generation due to a drought.
Transformation
• In 2014, the decrease in autoproducer CHP plants consumption was due to a plant closure.
• Since 2012, data reported for not elsewhere speci-fied (Transformation) represent natural gas used for hydrogen manufacture. Prior to this year, these quantities are reported under oil refineries.
• In 2002 the decrease in natural gas used for gas works is due to the closing of the Lisbon gas works plant in May 2001.
Slovak Republic
Source
Statistical Office of the Slovak Republic, Bratislava.
General notes
• Data for losses were not available between 2009 and 2013.
• Between 1970 and 1971, and between 1978 and 1979 there are breaks in time series due to a revision of data for 1968-1969 and 1979-92 made in 2003. Data for 1970 were estimated by the Secretariat.
Supply
• In 2002 the GCV of indigenous production in-creased significantly as extraction from a field with a low GCV ended.
• Imports include gas used for pipeline compressor stations.
Transformation
• In 2014, the decrease in autoproducer CHP plants consumption was due to a plant closure.
• The last autoproducer electricity plant stopped operation in 2016.
• Not elsewhere specified (Transformation) data represent natural gas used for hydrogen manu-facture. This hydrogen is used for hydrodesul-phurization and for hydrocracking in oil refiner-ies.
Consumption
• In 2016, non-energy use of natural gas in the chemical and petrochemical industry decreased
NATURAL GAS INFORMATION: DATABASE DOCUMENTATION (2018 preliminary edition) - xli
INTERNATIONAL ENERGY AGENCY
due to a two-month stoppage in ammonia produc-tion.
• In 2001, there is a break in time series for energy use in oil and gas extraction due to the applica-tion of the IEA’s definition starting that year.
• There are inconsistencies in the time series for commercial/public services as this sub-sector is computed as a residual.
Slovenia
Source
Statistical Office of the Republic of Slovenia, Ljubljana.
General notes
• From 1990 data for Slovenia are available. Prior to that, they are included in Former Yugoslavia.
• Between 1999 and 2000 there are some breaks in series due to the implementation of a new energy data collection system in January 2001.
Supply
• The country of the trading station where the gas was purchased is often reported as the country of origin for the imports, instead of the country where the gas was produced.
• In 2017 Slovenia started exporting small quantities of natural gas to Croatia.
Transformation
• In 2014, improvements in a main activity producer CHP plant resulted in a substantial reduction of natural gas consumption in this sector.
Consumption
• In 2011, the decrease in the chemical and petro-chemical sector non-energy use consumption is due to minimal use of gas for production of meth-anol.
• There are inconsistencies in the time series for commercial/public services as this sub-sector is computed by the Slovenian administration as a re-sidual.
Spain
Source
Ministry of Energy, Tourism and the Digital Agenda, Madrid.
General notes
• Spain in the 2018 edition implemented an im-provement in data collection for industry, so there are currently breaks in the time series and histori-cal revisions for 2015.
• In 2014, there are breaks in series for some trans-formation sectors due to the implementation of a new tool for data collection.
• Between 2008 and 2009 there is a break in stock levels due to the exclusion of mechanically re-coverable cushion gas from the reported levels.
• Between 2006 and 2007 there is a break in stocks levels due to a new methodology of including stocks in transport facilities and in storage facili-ties during testing phase.
• Between 2005 and 2006 there are some breaks in time series for the energy industry own use and for final consumption due to a change in the esti-mation methodology.
• Between 2002 and 2003 there is a break in stock levels due to an improvement in stocks level data from 2003 onwards.
Supply
• Between 1996 and 1997 total imports and domes-tic supply increased due to the enlargement of the gas grid.
• Pipeline imports data from France are reported based on the country of last consignment.
• Exports include re-exported gas volumes.
Transformation
• The increase in the transformation sector con-sumption for 2017 comes from more gas-fired plants being used to compensate decreased hydro generation due to a drought.
• Due to the implementation of an updated tool for gathering information on electricity generation plants in 2013 many autoproducer electricity plants were reclassified as autoproducer CHP plants.

xlii - NATURAL GAS INFORMATION: DATABASE DOCUMENTATION (2018 preliminary edition)
INTERNATIONAL ENERGY AGENCY
• In 1997 the increase in main activity producer elec-tricity consumption is due to two main activity electricity producers running on natural gas.
• Between 1993 and 1994 there is a break in time series in autoproducer CHP plants consumption, since a new survey revealed a large number of CHP autoproducers that were previously included in industry consumption.
• Since 1990 the decrease of natural gas inputs into gas works gas production is due to the substitu-tion of natural gas by manufactured gas.
Consumption
• Since 2001 the final consumption breakdown is estimated by the Spanish administration.
• Since 1988 the increase of natural gas used as feedstock is due to a substitution of naphtha for the production of fertilisers.
• Prior to 1982 natural gas consumption in textiles and leather, transportation equipment and ma-chinery has been included in not elsewhere speci-fied (Industry).
Sweden
Source
Energimyndigheten, Eskilstuna.
General notes
• In 2013, the natural gas consumed by oil refiner-ies has been estimated by the Secretariat.
• In 2008, total final consumption and its breakdown have been estimated by the Secretariat based on other Statistics Sweden publications.
• Since 2005 the natural gas inputs to gas works has been estimated by the Secretariat.
Supply
• Natural gas consumption data in international marine bunkers are available for the first time for the year 2017.
Transformation
• Autoproducer inputs to waste-heat production that are sold are reported in the respective end-use sectors and not in the transformation sector.
Consumption
• Prior to 1993 road transport is included in commercial/public services.
Switzerland
Source
Swiss Federal Office of Energy - SFOE, Ittigen.
Supply
• Gas imports are attributed according to the import-ing company’s registered office, instead of gas’s ultimate country of origin.
Transformation
• Since 2013 there are fluctuations in natural gas consumption of main activity producers CHP plants due to the fuel flexibility of a plant.
• In 1996 the increase of gas consumption in main activity CHP plants is due to more complete ac-counting for all producing entities.
Consumption
• .
• Between 1998 and 1999 there are breaks in series for the final consumption breakdown due to the introduction of a new survey.
• Between 1977 and 1978 there are breaks in time series due to the introduction of a new survey by industry type.
• In the 2019 edition, the not elsewhere specified (Other) flow is calculated as residual flow for natural gas. Up until the 2018 edition, the statis-tical differences used to be absorbed by agricul-ture/forestry.
Turkey
Source
Petrol leri Genel Müdürlü ü, Ankara.
General notes
• From 2009 there are some breaks in time series across all sectors as consumption data started
NATURAL GAS INFORMATION: DATABASE DOCUMENTATION (2018 preliminary edition) - xliii
INTERNATIONAL ENERGY AGENCY
being collected by a different institution, the Turkish Energy Market Regulatory Authority.
• In 2008, there is a break in time series for stock change due to a revision of storage capacity data.
• In 2006 there is a break in time series for non-energy use in chemical and petrochemical indus-try due to classification improvements.
• Not elsewhere specified (Industry) includes the natural gas distributed by OIZ (Organised Indus-trial Zones).
• In December 2016 the first Floating Storage and Regasification Unit (FSRU) terminal started to work allowing thus greater import quantities and stock levels.
Supply
• Exports reported the by the Turkish administration represent transit gas.
Transformation
• In the 2018 edition, the Turkish administration revised 2014 and 2015 data, as some main activi-ty producing plants in Turkey were reclassified as autoproducers.
• Not elsewhere specified (Transformation) of natu-ral gas represents amounts used to produce hydro-gen for hydrocracking in refineries.
Consumption
• In 2015, a new survey was introduced by the Turkish administration to collect industrial consumption data, resulting in a substantial decrease of con-sumption reported under not elsewhere specified (Industry).
• In 2013 no natural gas was consumed by blast furnaces due to it being replaced by coal and coke.
• Prior to 2001 commercial/public services con-sumption was included in the residential data.
• Between 1999 and 2001 the decrease in natural gas consumption in petrochemical feedstocks is due to the fertiliser industry.
• Since 1988 natural gas consumption data in the chemical and petrochemical industry (for fertilis-ers) and in not elsewhere specified (Industry) (dye industry) are available.
• Not elsewhere specified (Energy) sector includes gas used for heating and pumping operations in the distribution network.
United Kingdom
Source
Department for Business, Energy and Industrial Strat-egy - BEIS, London.
General notes
• Since 1992 distribution losses include metering differences and losses due to pipeline leakage.
• Prior to 1985 distribution losses include stock changes.
Supply
• In the 2018 edition, the UK administration revised the supply balance back to 2008 to update Nor-wegian imports from two terminals previously re-ported as indigenous production.
• In 2009 the increase in LNG imports is due to the expansion of the Isle of Grain terminal and to two new terminals at Milford Haven. These included gas that arrived at the Isle of Grain terminal in November and December 2008 but which was not unloaded until 2009.
• In 2002 the increase in imports is due to increased supplies from the Norwegian sector of the North Sea through the Vesterled pipeline, which was commissioned in the 4th quarter of 2001.
• Imports from Belgium reflect physical flows from unknown origin through the Bacton-Zeebrugge Interconnector.
• Exports reported under not elsewhere specified are all delivered to the Isle of Man, whereas not elsewhere specified imports come from the Do-minican Republic.
• In 2017 data the decrease in closing stock levels is related to the cessation of storage operations in Rough, UK’s single largest storage facility.
Transformation
• The natural gas reported in coke oven transfor-mation is used to form synthetic coke oven gas ra-ther than undergoing a coking process.
Consumption
• In the 2018 edition, natural gas consumption in the sectors of industry, residential, commer-
xliv - NATURAL GAS INFORMATION: DATABASE DOCUMENTATION (2018 preliminary edition)
INTERNATIONAL ENERGY AGENCY
cial/public services, was revised back to 2008 to include information from other data sources such as the Purchases Inquiry, EU ETS and ONS Index of Services and Production.
• In the 2019 edition, the UK administration pro-ceeded to revisions back to 2015 based on im-proved data from the Purchases Inquiry annual survey of the Office of National Statistics (ONS).
• Before 2008 consumption of natural gas in the commercial sector is included in not elsewhere specified (Other) while public services consump-tion is shown separately.
• Between 2007 and 2008 there are some breaks in time series in sectoral consumption due to a new methodology of data estimation.
• Consumption includes substitute natural gas made at gas works and piped into the natural gas distribution system.
• Not elsewhere specified (Energy) includes gas used for heating and pumping operations in the distribution network.
• Data in the not elsewhere specified (Industry) sec-tor refer to sales by independent gas suppliers un-allocated by categories.
• Natural gas consumed by the mining and quarry-ing and the wood and wood products sub-sectors is included under not elsewhere specified (Indus-try).
United States
Source
Energy Information administration, Washington, DC.
General notes
• Since the 2014 edition of this publication, energy final consumption data for the United States shows breaks in time series with historical data due to a change in methodology. The break in time series occurs between 2011 and 2012 for oil; and between 2001 and 2002 for electricity and natural gas. The new methodology is based on the last historical year of the most recent Annual Energy Outlook (AEO) publication. Changes oc-cur primarily in reported energy final consump-tion in the industrial sector and its subsectors, in-cluding the non-manufacturing industries of min-ing, construction and agriculture. Historical revi-sions are pending.
• Between 1995 and 2001 the detailed breakdown of industry consumption is estimated by the Energy Information Administration using the Manufac-turing Energy Consumption Survey (MECS), which is conducted quadrennially.
• Puerto Rico is currently not included in US data with the exception of natural gas consumed for electricity generation in 2017. LNG imports into Puerto Rico are reported in the Other non-OECD Americas regional aggregate.
Supply
• In the 2017 edition of this publication, the indige-nous production data for 2014 was revised by the US administration creating a break in the time series between 2013 and 2014 due to a change in the methodology. In addition, this increased the statistical difference that remained high in 2015 and 2016.
• The LNG exports have been increasing since 2015, due to new liquefaction capacity (i.e. Sabine Pass) coming online which also resulted in numerous new export destinations. LNG exports include re-exports.
Transformation
• Since 2012, data reported for not elsewhere speci-fied (Transformation) represent natural gas used for hydrogen manufacture. Prior to 2012, these quantities are reported under the chemical and petrochemical sector.
• Between 1999 and 2000 there are some breaks in time series for the transformation subsectors due to a new data reporting method.
• Between 1990 and 2002 the amounts of gas works gas that are blended with natural gas have been estimated on the basis of the output efficiency of the process.
• Since 1989 consumption by autoproducer CHP plants is available, while consumption by auto-producer electricity and main activity producer CHP plants is available since 1991. Prior to these years these consumptions are included with in-dustry and commerce/public services.
Consumption
• In the 2019 edition, revisions were made to the industry sector from 2015 onwards, by reallocat-ing natural gas consumption to the chemical and

NATURAL GAS INFORMATION: DATABASE DOCUMENTATION (2018 preliminary edition) - xlv
INTERNATIONAL ENERGY AGENCY
petrochemical sub-sector from other industrial sub-sectors.
• Due to revisions made to the iron and steel model, there is a break in the time series between 2014 and 2015 for the consumption in blast furnaces (Energy).
• Until 2001 agriculture/forestry consumption is included under industry.
• Prior to 1995 a detailed breakdown of industry consumption is not available (between 1990 and 1994 chemical consumption is estimated by the American administration).
• In 1991 data on natural gas use in the road sector were collected for the first time, and are not available for previous years.
• Not elsewhere specified (Energy) industry own use represents gas consumed for the production of ethanol.
• Consumption in fisheries is included under industry.
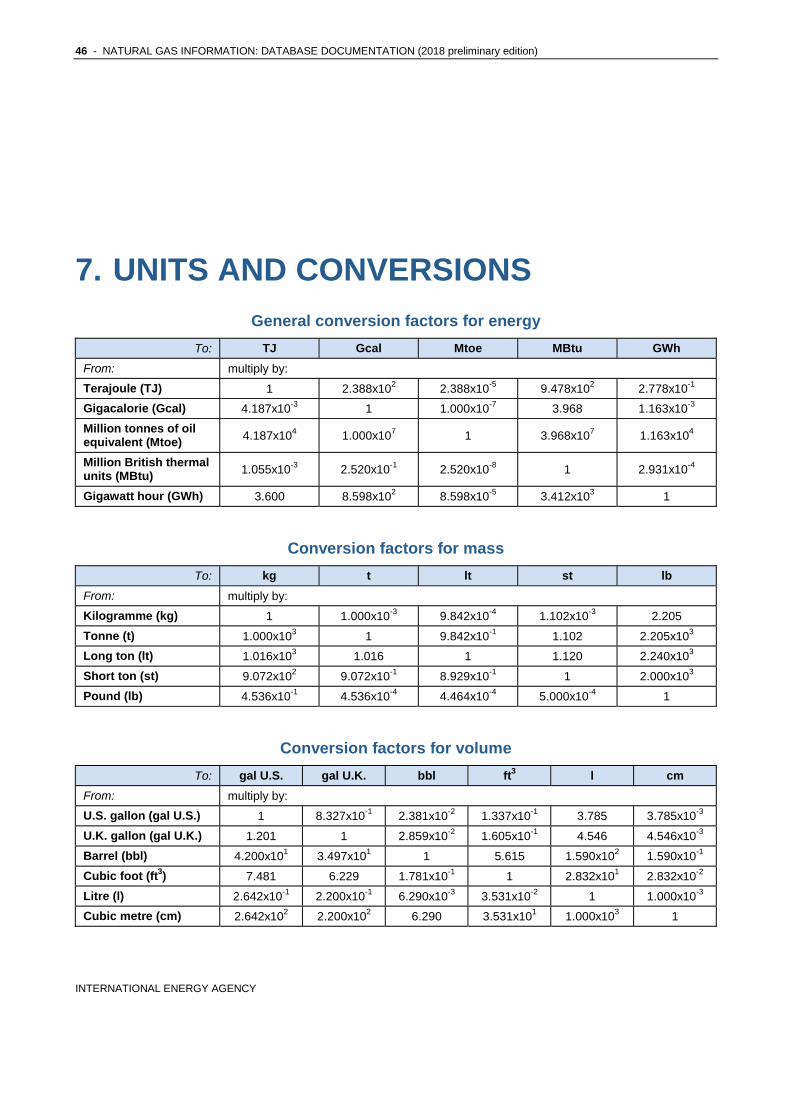
46 - NATURAL GAS INFORMATION: DATABASE DOCUMENTATION (2018 preliminary edition)
INTERNATIONAL ENERGY AGENCY
7. UNITS AND CONVERSIONS General conversion factors for energy
To: TJ Gcal Mtoe MBtu GWh
From: multiply by:
Terajoule (TJ) 1 2.388x10² 2.388x10⁻⁵ 9.478x10² 2.778x10⁻¹
Gigacalorie (Gcal) 4.187x10⁻³ 1 1.000x10⁻⁷ 3.968 1.163x10⁻³
Million tonnes of oil equivalent (Mtoe) 4.187x10⁴ 1.000x10⁷ 1 3.968x10⁷ 1.163x10⁴
Million British thermal units (MBtu) 1.055x10⁻³ 2.520x10⁻¹ 2.520x10⁻⁸ 1 2.931x10⁻⁴
Gigawatt hour (GWh) 3.600 8.598x10² 8.598x10⁻⁵ 3.412x10³ 1
Conversion factors for mass
To: kg t lt st lb
From: multiply by:
Kilogramme (kg) 1 1.000x10⁻³ 9.842x10⁻⁴ 1.102x10⁻³ 2.205
Tonne (t) 1.000x10³ 1 9.842x10⁻¹ 1.102 2.205x10³
Long ton (lt) 1.016x10³ 1.016 1 1.120 2.240x10³
Short ton (st) 9.072x10² 9.072x10⁻¹ 8.929x10⁻¹ 1 2.000x10³
Pound (lb) 4.536x10⁻¹ 4.536x10⁻⁴ 4.464x10⁻⁴ 5.000x10⁻⁴ 1
Conversion factors for volume
To: gal U.S. gal U.K. bbl ft3 l cm
From: multiply by:
U.S. gallon (gal U.S.) 1 8.327x10⁻¹ 2.381x10⁻² 1.337x10⁻¹ 3.785 3.785x10⁻³
U.K. gallon (gal U.K.) 1.201 1 2.859x10⁻² 1.605x10⁻¹ 4.546 4.546x10⁻³
Barrel (bbl) 4.200x101 3.497x101 1 5.615 1.590x10² 1.590x10⁻¹
Cubic foot (ft3) 7.481 6.229 1.781x10⁻¹ 1 2.832x101 2.832x10⁻²
Litre (l) 2.642x10⁻¹ 2.200x10⁻¹ 6.290x10⁻³ 3.531x10⁻² 1 1.000x10⁻³
Cubic metre (cm) 2.642x10² 2.200x10² 6.290 3.531x101 1.000x10³ 1
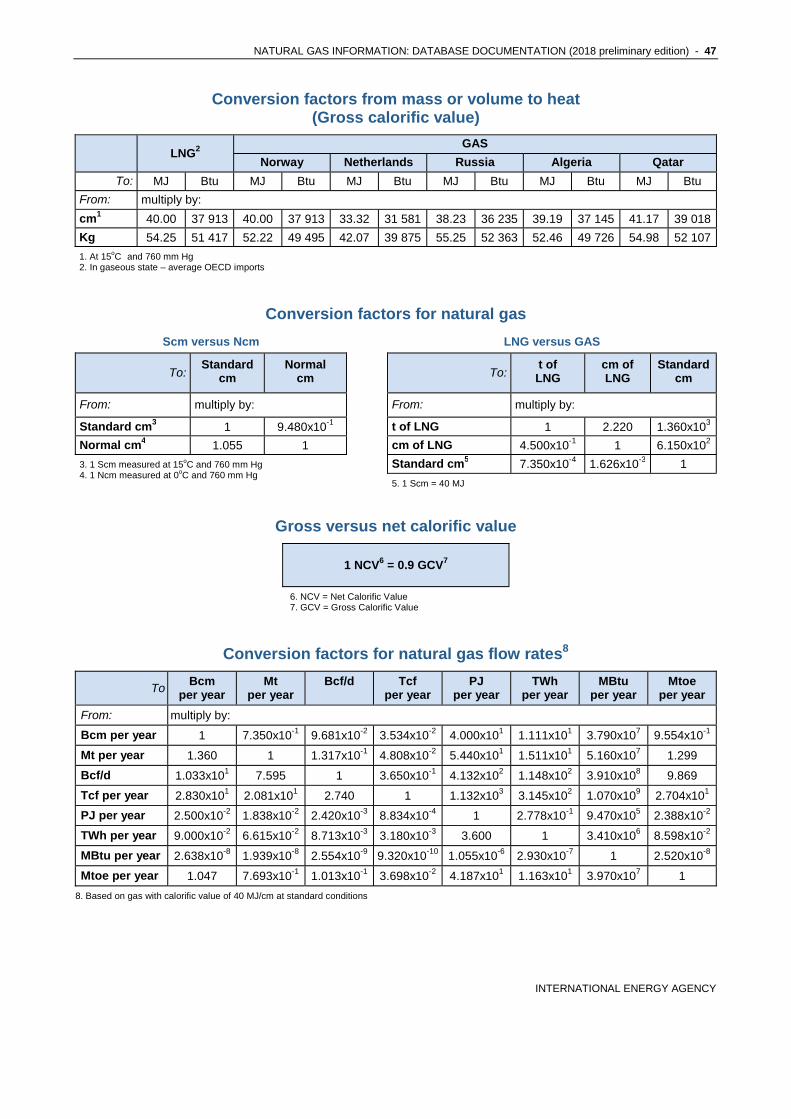
NATURAL GAS INFORMATION: DATABASE DOCUMENTATION (2018 preliminary edition) - 47
INTERNATIONAL ENERGY AGENCY
Conversion factors from mass or volume to heat (Gross calorific value)
LNG2 GAS
Norway Netherlands Russia Algeria Qatar
To: MJ Btu MJ Btu MJ Btu MJ Btu MJ Btu MJ Btu
From: multiply by:
cm1 40.00 37 913 40.00 37 913 33.32 31 581 38.23 36 235 39.19 37 145 41.17 39 018
Kg 54.25 51 417 52.22 49 495 42.07 39 875 55.25 52 363 52.46 49 726 54.98 52 107
1. At 15oC and 760 mm Hg 2. In gaseous state – average OECD imports
Conversion factors for natural gas
Scm versus Ncm LNG versus GAS
To: Standard
cm Normal
cm To:
t of LNG
cm of LNG
Standard cm
From: multiply by: From: multiply by:
Standard cm3 1 9.480x10⁻¹ t of LNG 1 2.220 1.360x10³
Normal cm4 1.055 1 cm of LNG 4.500x10⁻¹ 1 6.150x10²
3. 1 Scm measured at 15oC and 760 mm Hg 4. 1 Ncm measured at 0oC and 760 mm Hg
Standard cm5 7.350x10⁻⁴ 1.626x10⁻³ 1
5. 1 Scm = 40 MJ
Gross versus net calorific value
1 NCV6 = 0.9 GCV7
6. NCV = Net Calorific Value 7. GCV = Gross Calorific Value
Conversion factors for natural gas flow rates8
To Bcm
per year Mt
per year Bcf/d Tcf
per year PJ
per year TWh
per year MBtu
per year Mtoe
per year
From: multiply by:
Bcm per year 1 7.350x10⁻¹ 9.681x10⁻² 3.534x10⁻² 4.000x101 1.111x101 3.790x10⁷ 9.554x10⁻¹
Mt per year 1.360 1 1.317x10⁻¹ 4.808x10⁻² 5.440x101 1.511x101 5.160x10⁷ 1.299
Bcf/d 1.033x101 7.595 1 3.650x10⁻¹ 4.132x10² 1.148x10² 3.910x10⁸ 9.869
Tcf per year 2.830x101 2.081x101 2.740 1 1.132x10³ 3.145x10² 1.070x10⁹ 2.704x101
PJ per year 2.500x10⁻² 1.838x10⁻² 2.420x10⁻³ 8.834x10⁻⁴ 1 2.778x10⁻¹ 9.470x10⁵ 2.388x10⁻²
TWh per year 9.000x10⁻² 6.615x10⁻² 8.713x10⁻³ 3.180x10⁻³ 3.600 1 3.410x10⁶ 8.598x10⁻²
MBtu per year 2.638x10⁻⁸ 1.939x10⁻⁸ 2.554x10⁻⁹ 9.320x10⁻¹⁰ 1.055x10⁻⁶ 2.930x10⁻⁷ 1 2.520x10⁻⁸
Mtoe per year 1.047 7.693x10⁻¹ 1.013x10⁻¹ 3.698x10⁻² 4.187x101 1.163x101 3.970x10⁷ 1
8. Based on gas with calorific value of 40 MJ/cm at standard conditions
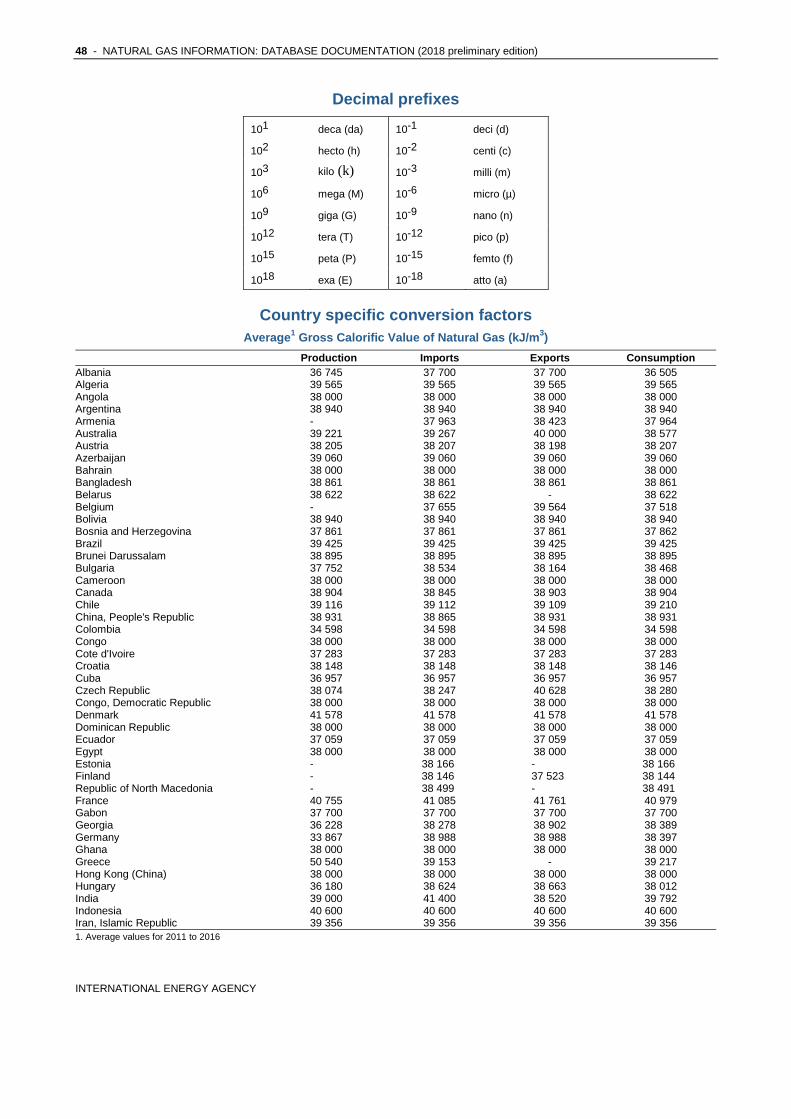
48 - NATURAL GAS INFORMATION: DATABASE DOCUMENTATION (2018 preliminary edition)
INTERNATIONAL ENERGY AGENCY
Decimal prefixes
101 deca (da) 10-1 deci (d)
102 hecto (h) 10-2 centi (c)
103 kilo (k) 10-3 milli (m)
106 mega (M) 10-6 micro (µ)
109 giga (G) 10-9 nano (n)
1012 tera (T) 10-12 pico (p)
1015 peta (P) 10-15 femto (f)
1018 exa (E) 10-18 atto (a)
Country specific conversion factors Average1 Gross Calorific Value of Natural Gas (kJ/m3)
Production Imports Exports Consumption Albania 36 745 37 700 37 700 36 505 Algeria 39 565 39 565 39 565 39 565 Angola 38 000 38 000 38 000 38 000 Argentina 38 940 38 940 38 940 38 940 Armenia - 37 963 38 423 37 964 Australia 39 221 39 267 40 000 38 577 Austria 38 205 38 207 38 198 38 207 Azerbaijan 39 060 39 060 39 060 39 060 Bahrain 38 000 38 000 38 000 38 000 Bangladesh 38 861 38 861 38 861 38 861 Belarus 38 622 38 622 - 38 622 Belgium - 37 655 39 564 37 518 Bolivia 38 940 38 940 38 940 38 940 Bosnia and Herzegovina 37 861 37 861 37 861 37 862 Brazil 39 425 39 425 39 425 39 425 Brunei Darussalam 38 895 38 895 38 895 38 895 Bulgaria 37 752 38 534 38 164 38 468 Cameroon 38 000 38 000 38 000 38 000 Canada 38 904 38 845 38 903 38 904 Chile 39 116 39 112 39 109 39 210 China, People's Republic 38 931 38 865 38 931 38 931 Colombia 34 598 34 598 34 598 34 598 Congo 38 000 38 000 38 000 38 000 Cote d'Ivoire 37 283 37 283 37 283 37 283 Croatia 38 148 38 148 38 148 38 146 Cuba 36 957 36 957 36 957 36 957 Czech Republic 38 074 38 247 40 628 38 280 Congo, Democratic Republic 38 000 38 000 38 000 38 000 Denmark 41 578 41 578 41 578 41 578 Dominican Republic 38 000 38 000 38 000 38 000 Ecuador 37 059 37 059 37 059 37 059 Egypt 38 000 38 000 38 000 38 000 Estonia - 38 166 - 38 166 Finland - 38 146 37 523 38 144 Republic of North Macedonia - 38 499 - 38 491 France 40 755 41 085 41 761 40 979 Gabon 37 700 37 700 37 700 37 700 Georgia 36 228 38 278 38 902 38 389 Germany 33 867 38 988 38 988 38 397 Ghana 38 000 38 000 38 000 38 000 Greece 50 540 39 153 - 39 217 Hong Kong (China) 38 000 38 000 38 000 38 000 Hungary 36 180 38 624 38 663 38 012 India 39 000 41 400 38 520 39 792 Indonesia 40 600 40 600 40 600 40 600 Iran, Islamic Republic 39 356 39 356 39 356 39 356 1. Average values for 2011 to 2016
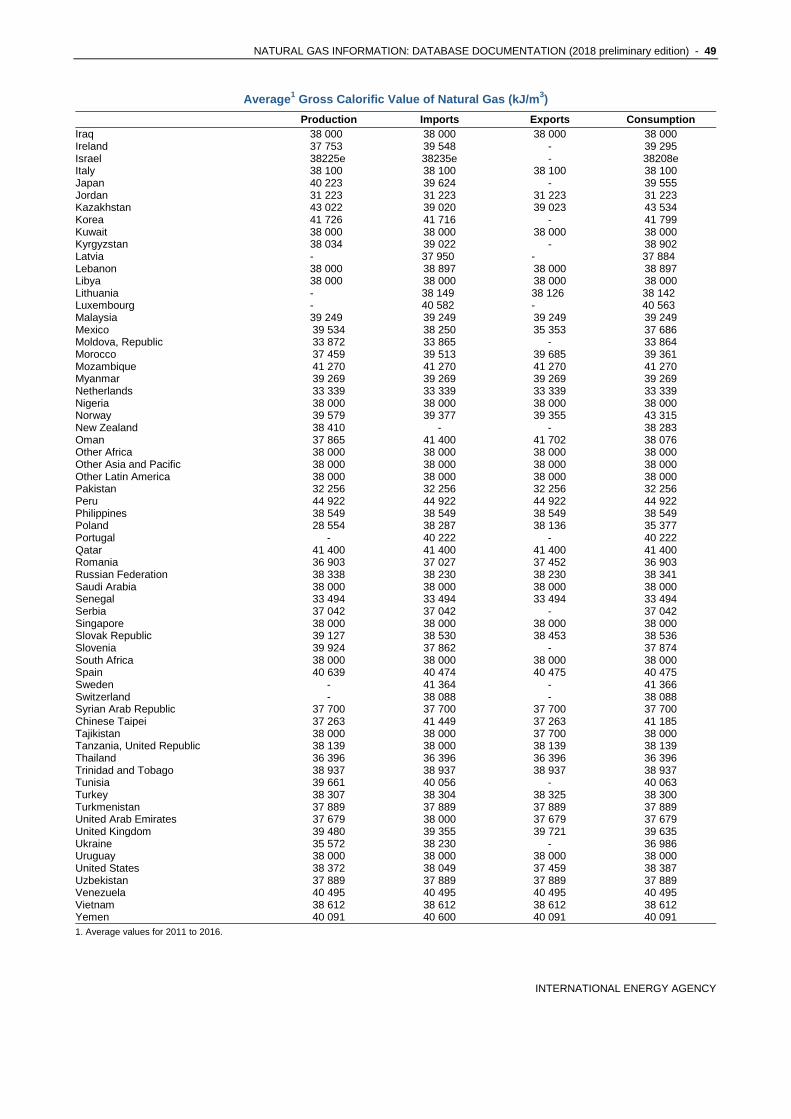
NATURAL GAS INFORMATION: DATABASE DOCUMENTATION (2018 preliminary edition) - 49
INTERNATIONAL ENERGY AGENCY
Average1 Gross Calorific Value of Natural Gas (kJ/m3)
Production Imports Exports Consumption Iraq 38 000 38 000 38 000 38 000 Ireland 37 753 39 548 - 39 295 Israel 38225e 38235e - 38208e Italy 38 100 38 100 38 100 38 100 Japan 40 223 39 624 - 39 555 Jordan 31 223 31 223 31 223 31 223 Kazakhstan 43 022 39 020 39 023 43 534 Korea 41 726 41 716 - 41 799 Kuwait 38 000 38 000 38 000 38 000 Kyrgyzstan 38 034 39 022 - 38 902 Latvia - 37 950 - 37 884 Lebanon 38 000 38 897 38 000 38 897 Libya 38 000 38 000 38 000 38 000 Lithuania - 38 149 38 126 38 142 Luxembourg - 40 582 - 40 563 Malaysia 39 249 39 249 39 249 39 249 Mexico 39 534 38 250 35 353 37 686 Moldova, Republic 33 872 33 865 - 33 864 Morocco 37 459 39 513 39 685 39 361 Mozambique 41 270 41 270 41 270 41 270 Myanmar 39 269 39 269 39 269 39 269 Netherlands 33 339 33 339 33 339 33 339 Nigeria 38 000 38 000 38 000 38 000 Norway 39 579 39 377 39 355 43 315 New Zealand 38 410 - - 38 283 Oman 37 865 41 400 41 702 38 076 Other Africa 38 000 38 000 38 000 38 000 Other Asia and Pacific 38 000 38 000 38 000 38 000 Other Latin America 38 000 38 000 38 000 38 000 Pakistan 32 256 32 256 32 256 32 256 Peru 44 922 44 922 44 922 44 922 Philippines 38 549 38 549 38 549 38 549 Poland 28 554 38 287 38 136 35 377 Portugal - 40 222 - 40 222 Qatar 41 400 41 400 41 400 41 400 Romania 36 903 37 027 37 452 36 903 Russian Federation 38 338 38 230 38 230 38 341 Saudi Arabia 38 000 38 000 38 000 38 000 Senegal 33 494 33 494 33 494 33 494 Serbia 37 042 37 042 - 37 042 Singapore 38 000 38 000 38 000 38 000 Slovak Republic 39 127 38 530 38 453 38 536 Slovenia 39 924 37 862 - 37 874 South Africa 38 000 38 000 38 000 38 000 Spain 40 639 40 474 40 475 40 475 Sweden - 41 364 - 41 366 Switzerland - 38 088 - 38 088 Syrian Arab Republic 37 700 37 700 37 700 37 700 Chinese Taipei 37 263 41 449 37 263 41 185 Tajikistan 38 000 38 000 37 700 38 000 Tanzania, United Republic 38 139 38 000 38 139 38 139 Thailand 36 396 36 396 36 396 36 396 Trinidad and Tobago 38 937 38 937 38 937 38 937 Tunisia 39 661 40 056 - 40 063 Turkey 38 307 38 304 38 325 38 300 Turkmenistan 37 889 37 889 37 889 37 889 United Arab Emirates 37 679 38 000 37 679 37 679 United Kingdom 39 480 39 355 39 721 39 635 Ukraine 35 572 38 230 - 36 986 Uruguay 38 000 38 000 38 000 38 000 United States 38 372 38 049 37 459 38 387 Uzbekistan 37 889 37 889 37 889 37 889 Venezuela 40 495 40 495 40 495 40 495 Vietnam 38 612 38 612 38 612 38 612 Yemen 40 091 40 600 40 091 40 091 1. Average values for 2011 to 2016.
50 - NATURAL GAS INFORMATION: DATABASE DOCUMENTATION (2018 preliminary edition)
INTERNATIONAL ENERGY AGENCY
8. ABBREVIATIONS
Bcm: billion cubic metres Btu: British thermal unit cm: cubic metre GWh: gigawatt hour kcal: kilocalorie kg: kilogramme kJ: kilojoule m3: cubic metre Mcm: million cubic metres Mt: million metric tonnes Ncm normal cubic metre Scm standard cubic metre t: metric ton = tonne TJ: terajoule toe: tonne of oil equivalent CHP: combined heat and power GCV: gross calorific value LNG: liquefied natural gas NCV: net calorific value TPES: total primary energy supply IEA: International Energy Agency OECD: Organisation for Economic Co-Operation and Development c confidential e estimated .. not available - nil x not applicable