Embed Size (px)
Citation preview
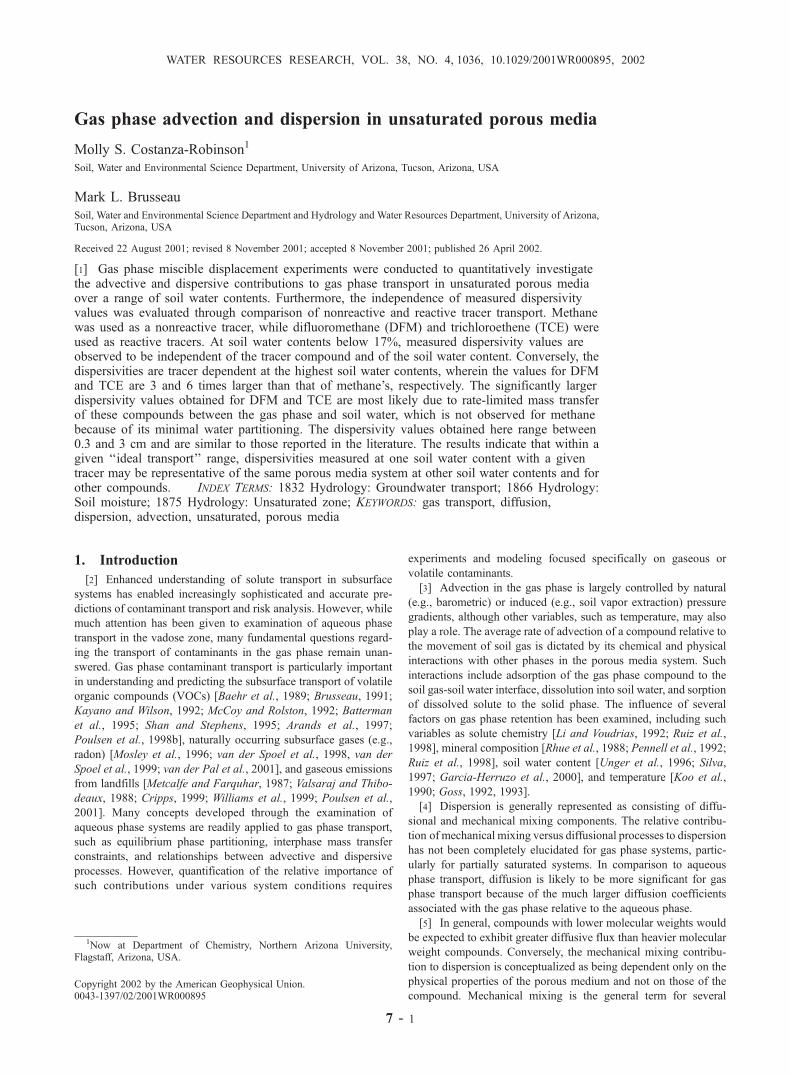
Gas phase advection and dispersion in unsaturated porous media
Molly S. Costanza-Robinson1
Soil, Water and Environmental Science Department, University of Arizona, Tucson, Arizona, USA
Mark L. Brusseau
Soil, Water and Environmental Science Department and Hydrology and Water Resources Department, University of Arizona,Tucson, Arizona, USA
Received 22 August 2001; revised 8 November 2001; accepted 8 November 2001; published 26 April 2002.
[1] Gas phase miscible displacement experiments were conducted to quantitatively investigatethe advective and dispersive contributions to gas phase transport in unsaturated porous mediaover a range of soil water contents. Furthermore, the independence of measured dispersivityvalues was evaluated through comparison of nonreactive and reactive tracer transport. Methanewas used as a nonreactive tracer, while difluoromethane (DFM) and trichloroethene (TCE) wereused as reactive tracers. At soil water contents below 17%, measured dispersivity values areobserved to be independent of the tracer compound and of the soil water content. Conversely, thedispersivities are tracer dependent at the highest soil water contents, wherein the values for DFMand TCE are 3 and 6 times larger than that of methane’s, respectively. The significantly largerdispersivity values obtained for DFM and TCE are most likely due to rate-limited mass transferof these compounds between the gas phase and soil water, which is not observed for methanebecause of its minimal water partitioning. The dispersivity values obtained here range between0.3 and 3 cm and are similar to those reported in the literature. The results indicate that within agiven ‘‘ideal transport’’ range, dispersivities measured at one soil water content with a giventracer may be representative of the same porous media system at other soil water contents and forother compounds. INDEX TERMS: 1832 Hydrology: Groundwater transport; 1866 Hydrology:Soil moisture; 1875 Hydrology: Unsaturated zone; KEYWORDS: gas transport, diffusion,dispersion, advection, unsaturated, porous media
1. Introduction
[2] Enhanced understanding of solute transport in subsurface
systems has enabled increasingly sophisticated and accurate pre-
dictions of contaminant transport and risk analysis. However, while
much attention has been given to examination of aqueous phase
transport in the vadose zone, many fundamental questions regard-
ing the transport of contaminants in the gas phase remain unan-
swered. Gas phase contaminant transport is particularly important
in understanding and predicting the subsurface transport of volatile
organic compounds (VOCs) [Baehr et al., 1989; Brusseau, 1991;
Kayano and Wilson, 1992; McCoy and Rolston, 1992; Batterman
et al., 1995; Shan and Stephens, 1995; Arands et al., 1997;
Poulsen et al., 1998b], naturally occurring subsurface gases (e.g.,
radon) [Mosley et al., 1996; van der Spoel et al., 1998, van der
Spoel et al., 1999; van der Pal et al., 2001], and gaseous emissions
from landfills [Metcalfe and Farquhar, 1987; Valsaraj and Thibo-
deaux, 1988; Cripps, 1999; Williams et al., 1999; Poulsen et al.,
2001]. Many concepts developed through the examination of
aqueous phase systems are readily applied to gas phase transport,
such as equilibrium phase partitioning, interphase mass transfer
constraints, and relationships between advective and dispersive
processes. However, quantification of the relative importance of
such contributions under various system conditions requires
experiments and modeling focused specifically on gaseous or
volatile contaminants.
[3] Advection in the gas phase is largely controlled by natural
(e.g., barometric) or induced (e.g., soil vapor extraction) pressure
gradients, although other variables, such as temperature, may also
play a role. The average rate of advection of a compound relative to
the movement of soil gas is dictated by its chemical and physical
interactions with other phases in the porous media system. Such
interactions include adsorption of the gas phase compound to the
soil gas-soil water interface, dissolution into soil water, and sorption
of dissolved solute to the solid phase. The influence of several
factors on gas phase retention has been examined, including such
variables as solute chemistry [Li and Voudrias, 1992; Ruiz et al.,
1998], mineral composition [Rhue et al., 1988; Pennell et al., 1992;
Ruiz et al., 1998], soil water content [Unger et al., 1996; Silva,
1997; Garcia-Herruzo et al., 2000], and temperature [Koo et al.,
1990; Goss, 1992, 1993].
[4] Dispersion is generally represented as consisting of diffu-
sional and mechanical mixing components. The relative contribu-
tion of mechanical mixing versus diffusional processes to dispersion
has not been completely elucidated for gas phase systems, partic-
ularly for partially saturated systems. In comparison to aqueous
phase transport, diffusion is likely to be more significant for gas
phase transport because of the much larger diffusion coefficients
associated with the gas phase relative to the aqueous phase.
[5] In general, compounds with lower molecular weights would
be expected to exhibit greater diffusive flux than heavier molecular
weight compounds. Conversely, the mechanical mixing contribu-
tion to dispersion is conceptualized as being dependent only on the
physical properties of the porous medium and not on those of the
compound. Mechanical mixing is the general term for several
1Now at Department of Chemistry, Northern Arizona University,Flagstaff, Arizona, USA.
Copyright 2002 by the American Geophysical Union.0043-1397/02/2001WR000895
7 - 1
WATER RESOURCES RESEARCH, VOL. 38, NO. 4, 1036, 10.1029/2001WR000895, 2002
specific sources of pore-scale velocity variations, including differ-
ences in pore size (e.g., larger pores promote higher velocities than
smaller pores), differences in velocity along the cross section of
individual pores (e.g., fluids have larger velocity in the center of
the pore relative to near the pore walls), and the tortuosity of flow
paths. Reported gas phase dispersivities, the primary term repre-
senting mechanical mixing, range between approximately 0.1 and
5 cm for various systems [Armstrong et al., 1994; Popovicova and
Brusseau, 1997; Ruiz et al., 1999; Garcia-Herruzo et al., 2000].
However, the influence of specific system properties, such as soil
water content or particle and pore size distributions on such values
has yet to be examined. Furthermore, it has not been demonstrated
that current means of measuring dispersivity values do indeed yield
solute-independent dispersivity values. For example, and as will be
discussed in detail in section 3, the incorporation of additional
transport processes, such as rate-limited mass transfer, into the
dispersivity term results in lumped values. Such lumped dispersiv-
ities will be larger for solutes experiencing greater nonideal trans-
port and, as a result, will be solute dependent.
[6] In the current study, gas phase miscible displacement experi-
ments were conducted to investigate the advective and dispersive
contributions to gas phase transport in unsaturated porous media
over a range of soil water contents. Compounds that demonstrate a
range of possible interactions with the porous medium system were
selected to assess how solute retention processes influenced the
measured dispersivities. The results were analyzed to quantitatively
determine the relative contributions of diffusion and mechanical
mixing to dispersive transport.
2. Materials and Methods
2.1. System Overview
[7] The experiments were conducted using a natural porous
medium, Vinton fine sand. Relevant physical properties of the
material are reported in Table 1. Methane was used as a non-
reactive tracer gas, while difluoromethane (DFM) and trichloroe-
thene (TCE) were used as reversibly retained reactive tracers to
examine the influence of interphase mass transfer processes on
dispersion processes. DFM is a water-soluble nonsorbing com-
pound, and its transport is therefore influenced by gas water mass
transfer. TCE interacts with both solid and aqueous phases of the
porous medium, and thus its transport is influenced by sorption and
gas water mass transfer. Physicochemical properties of the tracers
are summarized in Table 2.
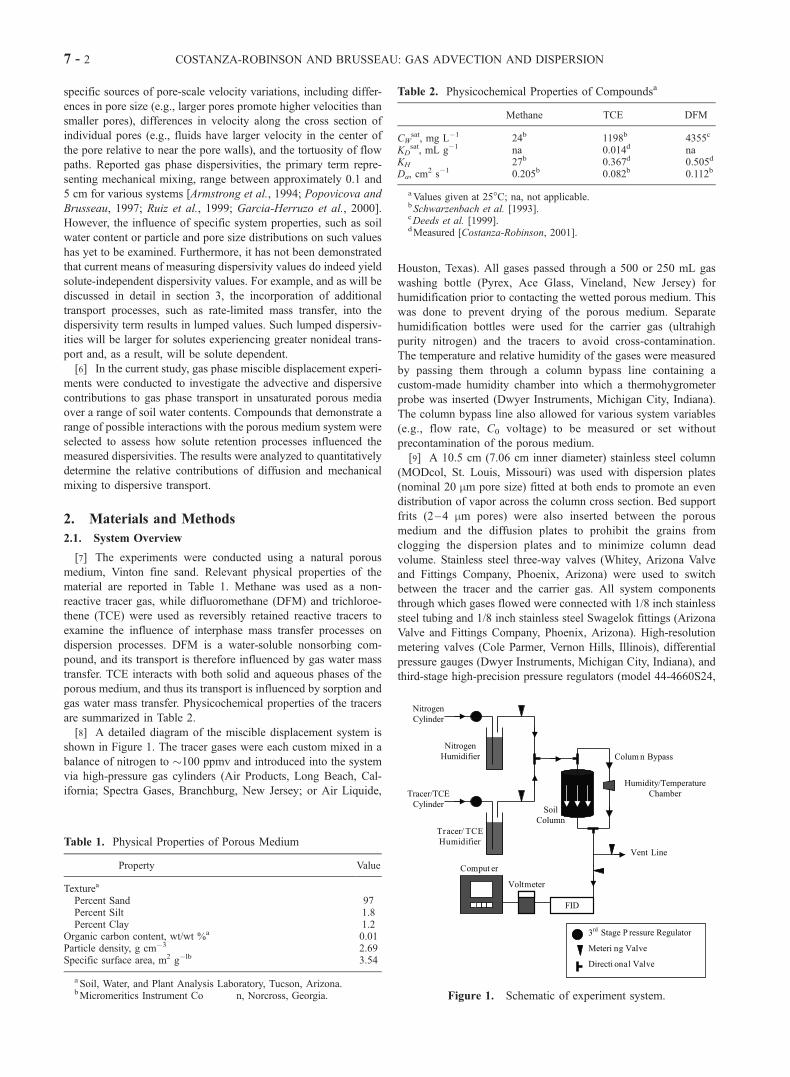
[8] A detailed diagram of the miscible displacement system is
shown in Figure 1. The tracer gases were each custom mixed in a
balance of nitrogen to �100 ppmv and introduced into the system
via high-pressure gas cylinders (Air Products, Long Beach, Cal-
ifornia; Spectra Gases, Branchburg, New Jersey; or Air Liquide,
Houston, Texas). All gases passed through a 500 or 250 mL gas
washing bottle (Pyrex, Ace Glass, Vineland, New Jersey) for
humidification prior to contacting the wetted porous medium. This
was done to prevent drying of the porous medium. Separate
humidification bottles were used for the carrier gas (ultrahigh
purity nitrogen) and the tracers to avoid cross-contamination.
The temperature and relative humidity of the gases were measured
by passing them through a column bypass line containing a
custom-made humidity chamber into which a thermohygrometer
probe was inserted (Dwyer Instruments, Michigan City, Indiana).
The column bypass line also allowed for various system variables
(e.g., flow rate, C0 voltage) to be measured or set without
precontamination of the porous medium.
[9] A 10.5 cm (7.06 cm inner diameter) stainless steel column
(MODcol, St. Louis, Missouri) was used with dispersion plates
(nominal 20 mm pore size) fitted at both ends to promote an even
distribution of vapor across the column cross section. Bed support
frits (2–4 mm pores) were also inserted between the porous
medium and the diffusion plates to prohibit the grains from
clogging the dispersion plates and to minimize column dead
volume. Stainless steel three-way valves (Whitey, Arizona Valve
and Fittings Company, Phoenix, Arizona) were used to switch
between the tracer and the carrier gas. All system components
through which gases flowed were connected with 1/8 inch stainless
steel tubing and 1/8 inch stainless steel Swagelok fittings (Arizona
Valve and Fittings Company, Phoenix, Arizona). High-resolution
metering valves (Cole Parmer, Vernon Hills, Illinois), differential
pressure gauges (Dwyer Instruments, Michigan City, Indiana), and
third-stage high-precision pressure regulators (model 44-4660S24,
Table 1. Physical Properties of Porous Medium
Property Value
Texturea
Percent Sand 97Percent Silt 1.8Percent Clay 1.2
Organic carbon content, wt/wt %a 0.01Particle density, g cm�3 2.69Specific surface area, m2 g�lb 3.54
aSoil, Water, and Plant Analysis Laboratory, Tucson, Arizona.bMicromeritics Instrument Co n, Norcross, Georgia.
Table 2. Physicochemical Properties of Compoundsa
Methane TCE DFM
CWsat, mg L�1 24b 1198b 4355c
KDsat, mL g�1 na 0.014d na
KH 27b 0.367d 0.505d
Da, cm2 s�1 0.205b 0.082b 0.112b
aValues given at 25�C; na, not applicable.bSchwarzenbach et al. [1993].cDeeds et al. [1999].dMeasured [Costanza-Robinson, 2001].
Figure 1. Schematic of experiment system.
7 - 2 COSTANZA-ROBINSON AND BRUSSEAU: GAS ADVECTION AND DISPERSION
Tescom, Elk River, Minnesota, or model 8310, Porter Instrument
Company, Hatfield, Pennsylvania) were used to control flow rates
and monitor pressures in the system. Pre-column flow rates were
measured using an online gas flowmeter (Sho-Rate, Emerson
Electric Company, Hatfield, Pennsylvania). A 25 mL bubble
flowmeter (Kimble-Kontes, Vineland, New Jersey) or digital
flowmeter (ADM2000, J&W Scientific, Folsom, California) was
inserted at the detector outlet to measure flow rates.
[10] The column effluent stream passed directly to an online
flame ionization detector (FID) (Varian 3700 or 3400, Varian
Associates, Walnut Creek, California) for analysis. The column
effluent was split, and only 20 mL min�1 were directed to the FID.
The stream was split to maintain the flame in the detector as well as
to remain within the linear detection range. The FID signal was
routed to a digital voltmeter (Micronta, Fort Worth, Texas) that was
interfaced to a personal computer using Wedge software (T.A.L.
Enterprises, Philadelphia, Pennsylvania). This configuration al-
lowed concentration (voltage) versus time data to be collected real
time at any specified time interval, typically between 20 s and 1
min.
2.2. Miscible Displacement Experiments
[11] The porous medium was heated overnight at 105�C to dry
it and remove any volatile contamination. After allowing the
porous medium to cool under vacuum in a dessicator, it was mixed
with the desired amount of water and packed wet into the column.
The porous medium was tamped in the column at small incre-
ments, typically 1 cm, to minimize the formation of particle-size
layering in the column. Aliquots of the wet porous medium were
collected prepacking and postpacking to gravimetrically determine
preexperiment soil water contents. After the experiment, the
column was unpacked, and a small (<20 g) aliquot was taken from
near the column inlet, three points along the axis of flow, and near
the column outlet for gravimetric soil water content measurement.
In addition, the remainder of the porous medium in the column was
used to measure a composite column-averaged soil water content.
In all cases the column average soil water content measured after
the experiment was close to the soil water content measured prior
to the experiment, indicating there was minimal loss of water
during the experiments.
[12] The experimental system, including all tubing, valves, and
connectors, was initially flushed for several minutes with methanol
to remove any residual machine oil or other organic contamination.
Sections of the system were flushed with water for up to 25 min.
The water-filled sections were then weighed, emptied, oven-dried,
and weighed again to determine the dead volume contained in
various portions of the system. The total system dead volume
measured in this manner was 4.5 cm3, which is �3% of the total
column porosity.
[13] The nitrogen carrier gas was flushed through the system
until a steady FID baseline was achieved prior to each tracer
experiment. The carrier flow rate was matched to the tracer gas
flow rate. Multitracer experiments could not be conducted because
of the use of flow-through detection, which does not incorporate
analytical separation. Therefore tracer experiments were conducted
sequentially, using identical experimental conditions. Experiments
were conducted at least in duplicate and often in triplicate. When
the column was not in use, it was sealed to minimize drying of the
system.
[14] In order to achieve a constant-concentration tracer input
pulse, the water in the tracer humidification bottle had to be
saturated with the compound of interest prior to introduction of
the gas to the column. Saturation was achieved by passing the gas
through the humidification bottle and the column bypass line until
a steady FID signal was observed. The tracer pulse was introduced
to the system by switching between the tracer and carrier gas line
using a three-way directional switching valve. The input pulse was
continued until a relative concentration of one was achieved.
Relative concentration is defined as the ratio of actual concen-
tration, C, to input concentration, C0. Upon switching back to the
carrier gas line to elute the tracers from the system, a significant
pressure surge was created because of back pressure in the system.
Use of a high-precision third-stage regulator minimized this surge,
but it could not be completely eliminated. The surge is manifested
in the breakthrough curves as a temporary increase in solute
concentration above C/C0 = 1.
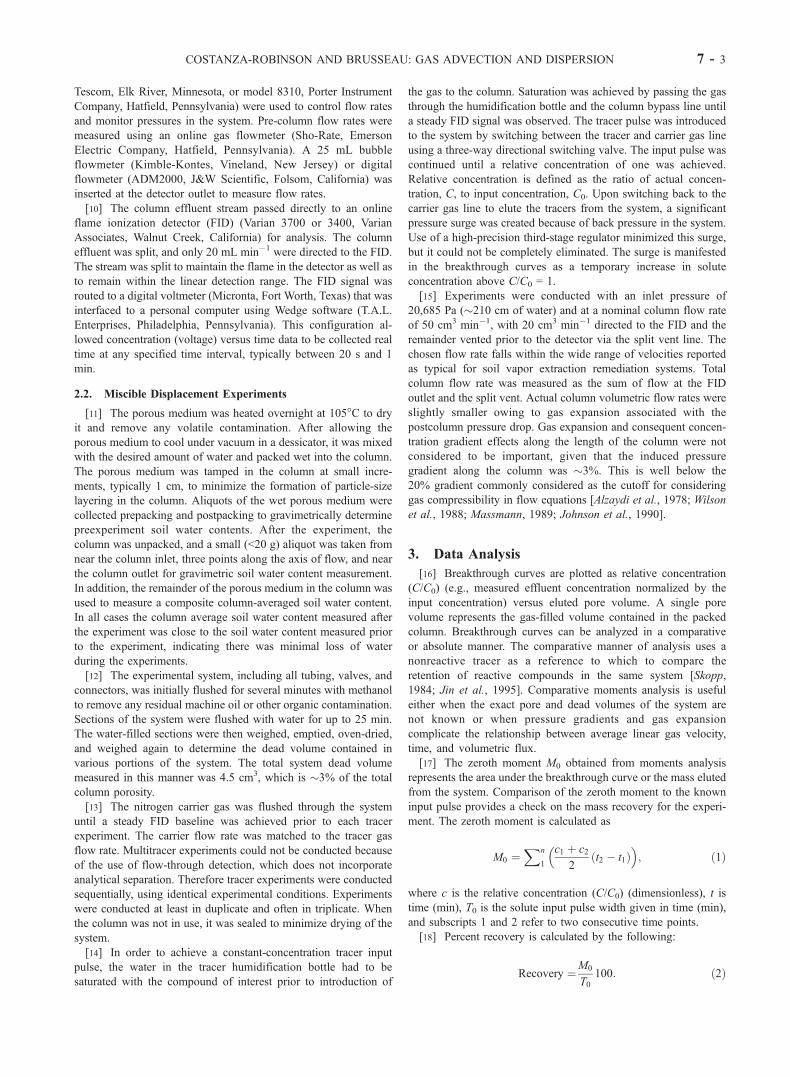
[15] Experiments were conducted with an inlet pressure of
20,685 Pa (�210 cm of water) and at a nominal column flow rate
of 50 cm3 min�1, with 20 cm3 min�1 directed to the FID and the
remainder vented prior to the detector via the split vent line. The
chosen flow rate falls within the wide range of velocities reported
as typical for soil vapor extraction remediation systems. Total
column flow rate was measured as the sum of flow at the FID
outlet and the split vent. Actual column volumetric flow rates were
slightly smaller owing to gas expansion associated with the
postcolumn pressure drop. Gas expansion and consequent concen-
tration gradient effects along the length of the column were not
considered to be important, given that the induced pressure
gradient along the column was �3%. This is well below the
20% gradient commonly considered as the cutoff for considering
gas compressibility in flow equations [Alzaydi et al., 1978; Wilson
et al., 1988; Massmann, 1989; Johnson et al., 1990].
3. Data Analysis
[16] Breakthrough curves are plotted as relative concentration
(C/C0) (e.g., measured effluent concentration normalized by the
input concentration) versus eluted pore volume. A single pore
volume represents the gas-filled volume contained in the packed
column. Breakthrough curves can be analyzed in a comparative
or absolute manner. The comparative manner of analysis uses a
nonreactive tracer as a reference to which to compare the
retention of reactive compounds in the same system [Skopp,
1984; Jin et al., 1995]. Comparative moments analysis is useful
either when the exact pore and dead volumes of the system are
not known or when pressure gradients and gas expansion
complicate the relationship between average linear gas velocity,
time, and volumetric flux.
[17] The zeroth moment M0 obtained from moments analysis
represents the area under the breakthrough curve or the mass eluted
from the system. Comparison of the zeroth moment to the known
input pulse provides a check on the mass recovery for the experi-
ment. The zeroth moment is calculated as
M0 ¼Xn
1
c1 þ c2
2t2 � t1ð Þ
� �; ð1Þ
where c is the relative concentration (C/C0) (dimensionless), t is
time (min), T0 is the solute input pulse width given in time (min),
and subscripts 1 and 2 refer to two consecutive time points.
[18] Percent recovery is calculated by the following:
Recovery ¼M0
T0100: ð2Þ
COSTANZA-ROBINSON AND BRUSSEAU: GAS ADVECTION AND DISPERSION 7 - 3
Mass recoveries significantly different from 100% can indicate
leaks in the system, irreversible sorption, degradation or transfor-
mation of the solute, lack of control over flow rates, or analytical
problems associated with sample analysis. None of these factors
are operative in this experimental system; therefore recoveries very
close to 100% are expected.
[19] For a nonreactive tracer, the mean travel time through the
system corresponds to the first normalized temporal moment, pulse
width corrected, and is calculated as
T ¼Pn
1c1t1þc2t2
2t2 � t1ð Þ
� �Pn
1c1þc2
2t2 � t1ð Þ
� � � 0:5T0: ð3Þ
The retardation factor is defined as the ratio of the mean travel time
of a given compound and the mean travel time of a nonreactive
tracer. Thus, by definition, the retardation factor of a nonreactive
tracer is one.
[20] The breakthrough curves were simulated using a one-
dimensional advective-dispersive solute transport model. Input
parameters for the model include the size of the input pulse (in
pore volumes) and the retardation factor. These two parameters are
obtained independently using the method of comparative moments,
described above. The output of the model, used in this manner, is
an optimized value for the Peclet number (Pe), defined here as a
dimensionless number representing the ratio of advective to dis-
persive processes experienced by a solute. The specific formulation
of the Peclet number varies as a function of the application and
field of study. The formulation used herein, where Pe is referenced
to a macroscopic length scale (i.e., column length) and to the total
dispersion coefficient, is commonly used in the fields of soil
physics and hydrology. Because different formulations are used
in other disciplines, such as chemical engineering, caution should
be exercised in interpreting the absolute values of Peclet numbers
reported herein and in comparing them to previous studies.
[21] The Peclet number is a function of the flow rate, the
diffusion coefficient of the solute, and the physical properties of
the porous medium. The optimized Peclet number can be related
directly to the dispersion coefficient D by the following equation:
D ¼ vL
Pe; ð4Þ
where v is the average linear velocity of the carrier gas (cm s�1)
and L is column length (cm). The dispersion coefficient can be
further defined as
D ¼ Datþ av; ð5Þ
where Da is the diffusion coefficient in air (cm s�1), t is the
tortuosity factor defined between 0 and 1 and inversely propor-
tional to tortuosity of the gas pathways in the porous media
(dimensionless), and a is the dispersivity (cm). Equation (5) can be
rewritten as
D ¼ Ddiff þ Dmm; ð6Þ
where the subscripts diff and mm refer to diffusion and
mechanical mixing processes, respectively. Values for D and
Ddiff will be determined from the optimized Peclet number and by
independent calculation, respectively. Ddiff is calculated using
diffusion coefficients reported in the literature and tortuosity
estimates, as described furth w. Values for the mechanical
mixing term Dmm are determined as the difference between D and
Ddiff.
[22] The tortuosity factor used in the dispersion equations will
depend on air-filled porosity in the system and thus is dependent on
soil water content for partially saturated systems. Tortuosity factors
predicted using a number of empirical and semiempirical models
have been reported in the literature [Penman, 1940; Millington,
1959; Moldrup et al., 1996, 1997; Schaefer et al., 1997; Moldrup
et al., 1998; Poulsen et al., 1998a; Moldrup et al., 2000]. The
various models have been shown to be most accurate for specific
soil types, in different soil water content regions, and for either
packed columns or undisturbed soil cores. A modification of the
composite Penman-Millington-Quirk (PMQ) model presented by
Moldrup et al. [1997] was used here because this equation has been
shown to most accurately predict tortuosity factors in packed
columns over a range of soil water contents. The modified PMQ
equation is written as
t ¼ 0:66nqan
� �2
; ð7Þ
where n is the total porosity of the porous medium (dimensionless).
As expected, a general decrease in the calculated tortuosity factor,
corresponding to increased tortuosity, is obtained with increasing
soil water contents. Potential uncertainty in the calculated
tortuosity factors is neglected in error calculations for the various
dispersion parameters, discussed in section 4.
[23] The value of Ddiff will vary according to the diffusion
coefficient of the compound in question. For example, it is
expected that methane will experience more diffusional dispersion
than will DFM because the diffusion coefficient for methane is
almost twice as large as for DFM (see Table 2). Conversely, the
dispersivity term a in Dmm is considered to be a property only of
the physical system and should be compound independent. There-
fore the Dmm term should remain constant for all compounds at a
given velocity in the same porous medium system, while disper-
sivity a should remain constant for all compounds regardless of
velocity. Thus methane’s Dmm value should be equal to that of
DFM or TCE under the same experimental conditions. If the
dispersivity values are observed to be compound independent, it
may be concluded that they are functions of only the porous
medium, as is generally assumed. Conversely, if the calculated
dispersivity values differ for methane, DFM, and TCE, it may be
concluded either that the diffusion behavior was not properly
accounted for or that processes other than mechanical mixing
and diffusion are contributing to dispersion.
[24] In addition to diffusion and mechanical mixing processes,
potential contributions from rate-limited mass transfer effects must
be considered for DFM and TCE dispersion. Partitioning between
the gas phase and soil water may cause aqueous phase diffusion
rate limitations to become significant if the soil water films are
sufficiently thick or if gas advection is sufficiently fast. At high soil
water contents, additional dispersion may be introduced by the
presence of isolated or disconnected air-filled porosity. While
methane would be excluded from such disconnected porosity,
dissolved DFM or TCE may diffuse to and volatilize into such
isolated air pockets in the porous medium. Thus the soil water may
cause observable mass transfer constraints. Such mass transfer rate
limitations are expected to be more significant at higher soil water
contents. In addition, TCE is also sorbed slightly by the soil grains.
Thus rate-limited sorption/desorption must also be considered as a
possible source of TCE dispersion. Because these additional
sources of dispersion would influence methane, DFM, and TCE
7 - 4 COSTANZA-ROBINSON AND BRUSSEAU: GAS ADVECTION AND DISPERSION
differently, solute dependence in the dispersivity value may be an
indication of such processes occurring in the system. In this case
the dispersivity would represent a ‘‘lumped’’ parameter and no
longer represent just the contribution of mechanical mixing.
4. Results and Discussion
4.1. Breakthrough Curves and Moment Analysis
[25] Miscible displacement experiments were conducted at 11
soil water contents ranging between �2 and �20%. TCE was not
used in experiments 7 and 8, and DFM was not used in experiment
9. The measured specifications and flow conditions for each
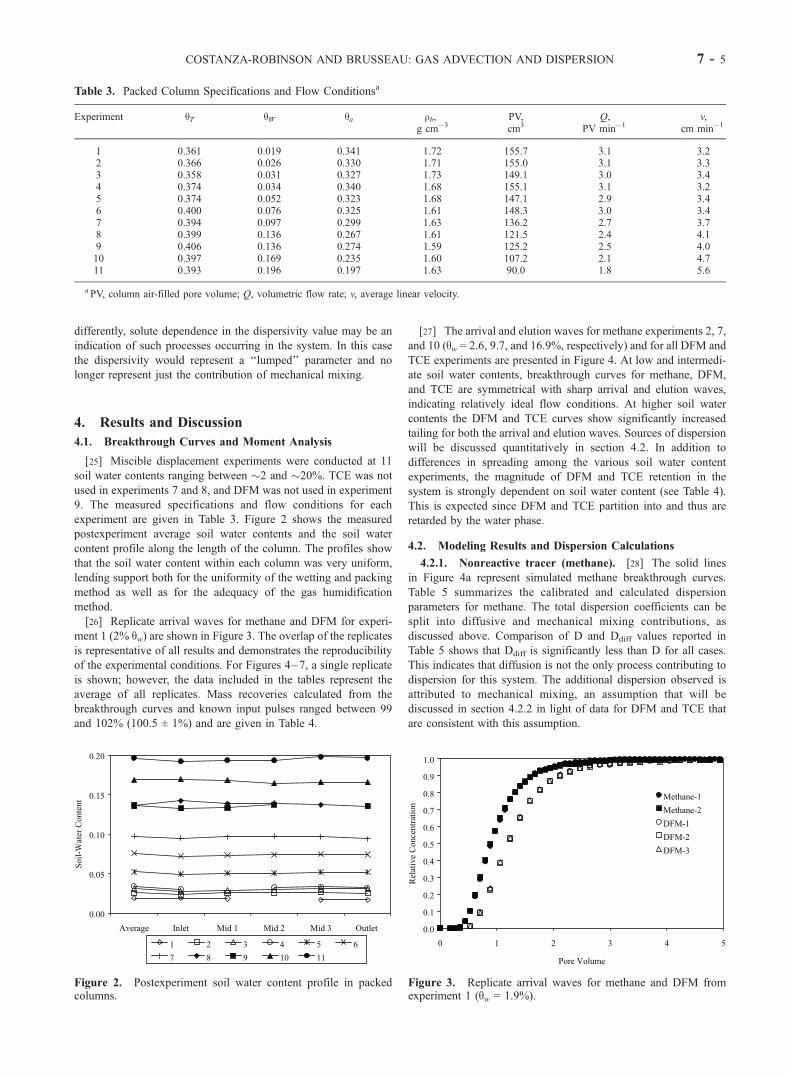
experiment are given in Table 3. Figure 2 shows the measured
postexperiment average soil water contents and the soil water
content profile along the length of the column. The profiles show
that the soil water content within each column was very uniform,
lending support both for the uniformity of the wetting and packing
method as well as for the adequacy of the gas humidification
method.
[26] Replicate arrival waves for methane and DFM for experi-
ment 1 (2% qw) are shown in Figure 3. The overlap of the replicatesis representative of all results and demonstrates the reproducibility
of the experimental conditions. For Figures 4–7, a single replicate
is shown; however, the data included in the tables represent the
average of all replicates. Mass recoveries calculated from the
breakthrough curves and known input pulses ranged between 99
and 102% (100.5 ± 1%) and are given in Table 4.
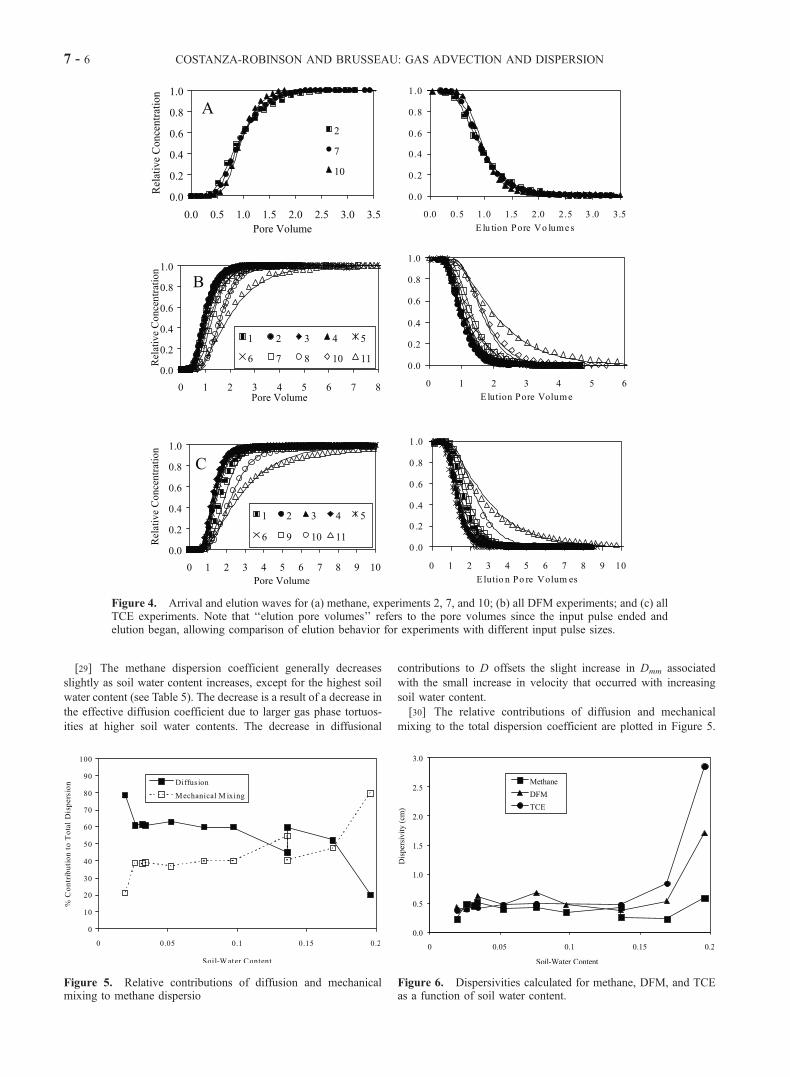
[27] The arrival and elution waves for methane experiments 2, 7,
and 10 (qw = 2.6, 9.7, and 16.9%, respectively) and for all DFM and
TCE experiments are presented in Figure 4. At low and intermedi-
ate soil water contents, breakthrough curves for methane, DFM,
and TCE are symmetrical with sharp arrival and elution waves,
indicating relatively ideal flow conditions. At higher soil water
contents the DFM and TCE curves show significantly increased
tailing for both the arrival and elution waves. Sources of dispersion
will be discussed quantitatively in section 4.2. In addition to
differences in spreading among the various soil water content
experiments, the magnitude of DFM and TCE retention in the
system is strongly dependent on soil water content (see Table 4).
This is expected since DFM and TCE partition into and thus are
retarded by the water phase.
4.2. Modeling Results and Dispersion Calculations
4.2.1. Nonreactive tracer (methane). [28] The solid lines
in Figure 4a represent simulated methane breakthrough curves.
Table 5 summarizes the calibrated and calculated dispersion
parameters for methane. The total dispersion coefficients can be
split into diffusive and mechanical mixing contributions, as
discussed above. Comparison of D and Ddiff values reported in
Table 5 shows that Ddiff is significantly less than D for all cases.
This indicates that diffusion is not the only process contributing to
dispersion for this system. The additional dispersion observed is
attributed to mechanical mixing, an assumption that will be
discussed in section 4.2.2 in light of data for DFM and TCE that
are consistent with this assumption.
Table 3. Packed Column Specifications and Flow Conditionsa
Experiment qT qW qa rb,g cm�3
PV,cm3
Q,PV min�1
v,cm min�1
1 0.361 0.019 0.341 1.72 155.7 3.1 3.22 0.366 0.026 0.330 1.71 155.0 3.1 3.33 0.358 0.031 0.327 1.73 149.1 3.0 3.44 0.374 0.034 0.340 1.68 155.1 3.1 3.25 0.374 0.052 0.323 1.68 147.1 2.9 3.46 0.400 0.076 0.325 1.61 148.3 3.0 3.47 0.394 0.097 0.299 1.63 136.2 2.7 3.78 0.399 0.136 0.267 1.61 121.5 2.4 4.19 0.406 0.136 0.274 1.59 125.2 2.5 4.010 0.397 0.169 0.235 1.60 107.2 2.1 4.711 0.393 0.196 0.197 1.63 90.0 1.8 5.6
aPV, column air-filled pore volume; Q, volumetric flow rate; v, average linear velocity.
Figure 2. Postexperiment soil water content profile in packedcolumns.
Figure 3. Replicate arrival waves for methane and DFM fromexperiment 1 (qw = 1.9%).
COSTANZA-ROBINSON AND BRUSSEAU: GAS ADVECTION AND DISPERSION 7 - 5
[29] The methane dispersion coefficient generally decreases
slightly as soil water content increases, except for the highest soil
water content (see Table 5). The decrease is a result of a decrease in
the effective diffusion coefficient due to larger gas phase tortuos-
ities at higher soil water contents. The decrease in diffusional
contributions to D offsets the slight increase in Dmm associated
with the small increase in velocity that occurred with increasing
soil water content.
[30] The relative contributions of diffusion and mechanical
mixing to the total dispersion coefficient are plotted in Figure 5.
Figure 4. Arrival and elution waves for (a) methane, experiments 2, 7, and 10; (b) all DFM experiments; and (c) allTCE experiments. Note that ‘‘elution pore volumes’’ refers to the pore volumes since the input pulse ended andelution began, allowing comparison of elution behavior for experiments with different input pulse sizes.
Figure 5. Relative contributions of diffusion and mechanicalmixing to methane dispersio
Figure 6. Dispersivities calculated for methane, DFM, and TCEas a function of soil water content.
7 - 6 COSTANZA-ROBINSON AND BRUSSEAU: GAS ADVECTION AND DISPERSION
For the lowest soil water content, diffusion provides the major
contribution, reflecting the lower tortuosity and resultant enhanced
diffusion associated with this lowest soil water content. Con-
versely, mechanical mixing provides the predominant contribution
for the highest soil water contents, reflecting the increased linear
velocities and greater tortuosities at the highest soil water contents
(see Table 3 and (5)). However, for the majority of the soil water
content range, diffusion and mechanical mixing contribute roughly
equally to total dispersion.
[31] To focus specifically on mechanical mixing, it is useful to
examine the dispersivity value, rather than the total D term. The
dispersivity coefficient calculated from the methane data remains
relatively constant for all soil water contents, with the possible
exception of the highest soil water content (Figure 6). This
indicates that despite increasing soil water content, there is negli-
gible increase in the degree of physical heterogeneity, such as
variability in the gas-filled pore distribution, affecting nonreactive
transport, except perhaps at the highest soil water content.
4.2.2. Reactive tracers. [32] The solid lines in Figures 4b
and 4c represent the simulated DFM and TCE breakthrough
curves, respectively. For experiments 10 and 11 the ideal
transport model does not fit the data quite as well as it does for
the lower soil water contents. Therefore it is instructive to closely
examine the observed DFM and TCE transport behavior to
determine whether nonequilibrium processes may be occurring in
the 17% (10) and 20% qW (11) experiments. The calculated and
calibrated dispersion parameters are summarized in Table 5.
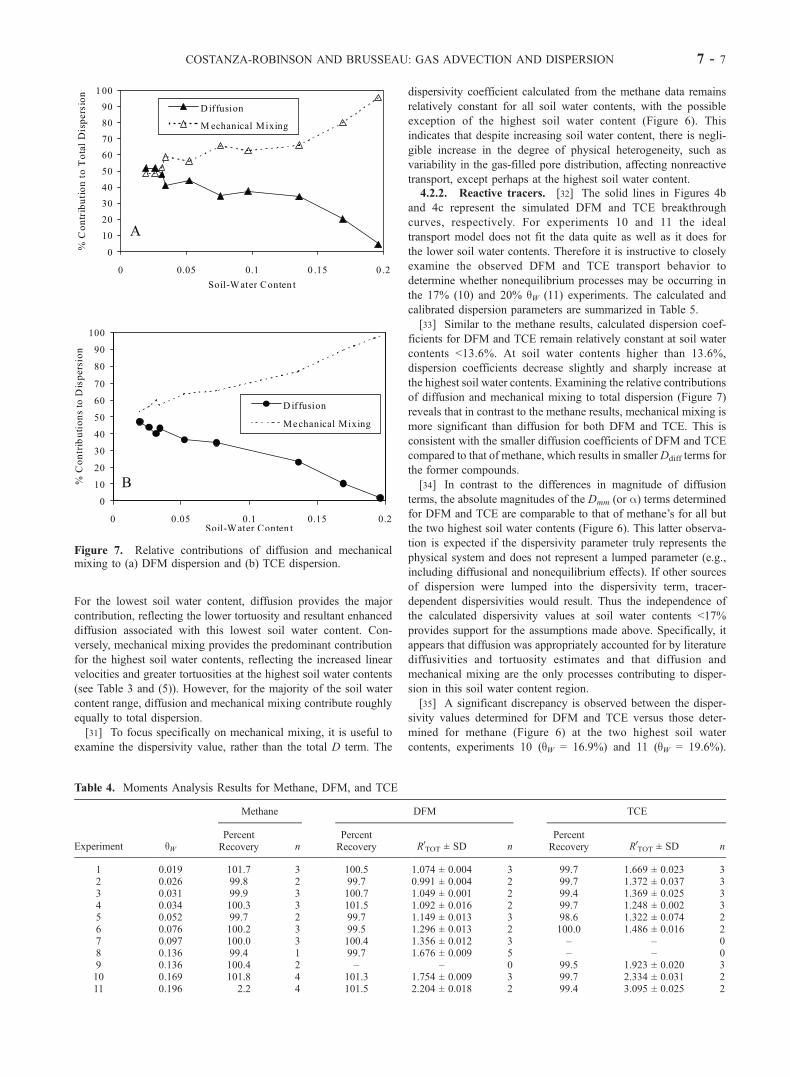
[33] Similar to the methane results, calculated dispersion coef-
ficients for DFM and TCE remain relatively constant at soil water
contents <13.6%. At soil water contents higher than 13.6%,
dispersion coefficients decrease slightly and sharply increase at
the highest soil water contents. Examining the relative contributions
of diffusion and mechanical mixing to total dispersion (Figure 7)
reveals that in contrast to the methane results, mechanical mixing is
more significant than diffusion for both DFM and TCE. This is
consistent with the smaller diffusion coefficients of DFM and TCE
compared to that of methane, which results in smallerDdiff terms for
the former compounds.
[34] In contrast to the differences in magnitude of diffusion
terms, the absolute magnitudes of the Dmm (or a) terms determined
for DFM and TCE are comparable to that of methane’s for all but
the two highest soil water contents (Figure 6). This latter observa-
tion is expected if the dispersivity parameter truly represents the
physical system and does not represent a lumped parameter (e.g.,
including diffusional and nonequilibrium effects). If other sources
of dispersion were lumped into the dispersivity term, tracer-
dependent dispersivities would result. Thus the independence of
the calculated dispersivity values at soil water contents <17%
provides support for the assumptions made above. Specifically, it
appears that diffusion was appropriately accounted for by literature
diffusivities and tortuosity estimates and that diffusion and
mechanical mixing are the only processes contributing to disper-
sion in this soil water content region.
[35] A significant discrepancy is observed between the disper-
sivity values determined for DFM and TCE versus those deter-
mined for methane (Figure 6) at the two highest soil water
contents, experiments 10 (qW = 16.9%) and 11 (qW = 19.6%).
Figure 7. Relative contributions of diffusion and mechanicalmixing to (a) DFM dispersion and (b) TCE dispersion.
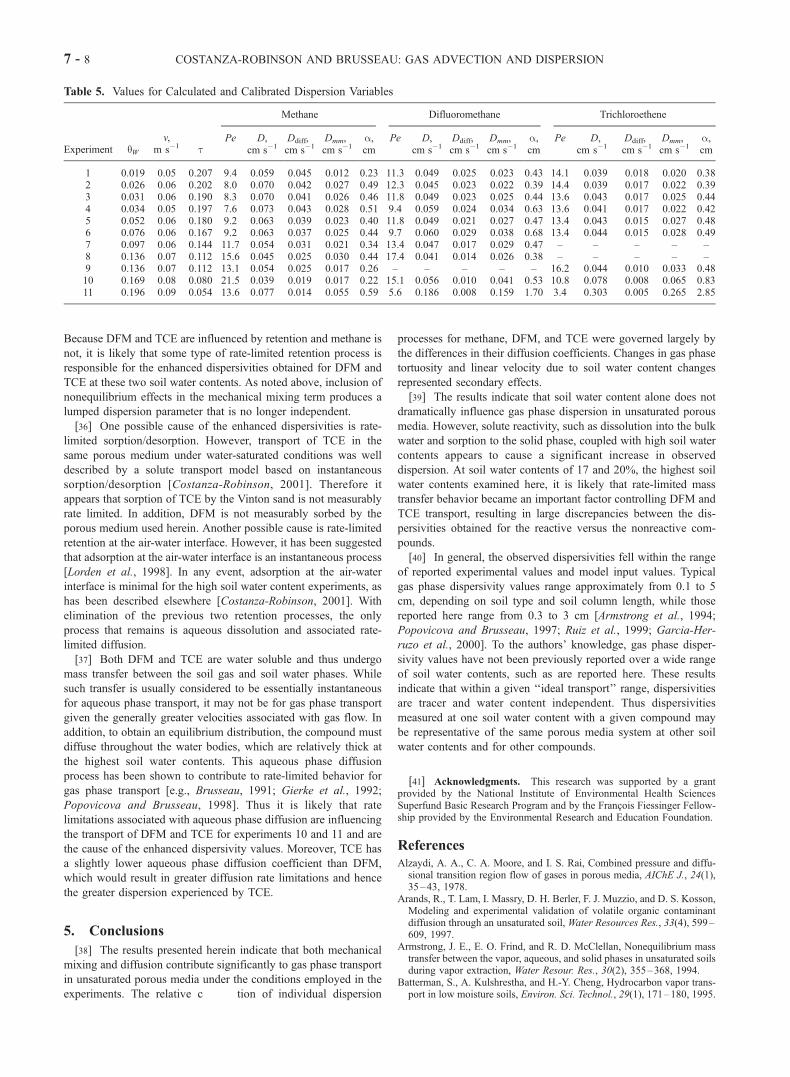
Table 4. Moments Analysis Results for Methane, DFM, and TCE
Methane DFM TCE
Experiment qWPercentRecovery n
PercentRecovery R0
TOT ± SD nPercentRecovery R0
TOT ± SD n
1 0.019 101.7 3 100.5 1.074 ± 0.004 3 99.7 1.669 ± 0.023 32 0.026 99.8 2 99.7 0.991 ± 0.004 2 99.7 1.372 ± 0.037 33 0.031 99.9 3 100.7 1.049 ± 0.001 2 99.4 1.369 ± 0.025 34 0.034 100.3 3 101.5 1.092 ± 0.016 2 99.7 1.248 ± 0.002 35 0.052 99.7 2 99.7 1.149 ± 0.013 3 98.6 1.322 ± 0.074 26 0.076 100.2 3 99.5 1.296 ± 0.013 2 100.0 1.486 ± 0.016 27 0.097 100.0 3 100.4 1.356 ± 0.012 3 – – 08 0.136 99.4 1 99.7 1.676 ± 0.009 5 – – 09 0.136 100.4 2 – – 0 99.5 1.923 ± 0.020 310 0.169 101.8 4 101.3 1.754 ± 0.009 3 99.7 2.334 ± 0.031 211 0.196 2.2 4 101.5 2.204 ± 0.018 2 99.4 3.095 ± 0.025 2
COSTANZA-ROBINSON AND BRUSSEAU: GAS ADVECTION AND DISPERSION 7 - 7
Because DFM and TCE are influenced by retention and methane is
not, it is likely that some type of rate-limited retention process is
responsible for the enhanced dispersivities obtained for DFM and
TCE at these two soil water contents. As noted above, inclusion of
nonequilibrium effects in the mechanical mixing term produces a
lumped dispersion parameter that is no longer independent.
[36] One possible cause of the enhanced dispersivities is rate-
limited sorption/desorption. However, transport of TCE in the
same porous medium under water-saturated conditions was well
described by a solute transport model based on instantaneous
sorption/desorption [Costanza-Robinson, 2001]. Therefore it
appears that sorption of TCE by the Vinton sand is not measurably
rate limited. In addition, DFM is not measurably sorbed by the
porous medium used herein. Another possible cause is rate-limited
retention at the air-water interface. However, it has been suggested
that adsorption at the air-water interface is an instantaneous process
[Lorden et al., 1998]. In any event, adsorption at the air-water
interface is minimal for the high soil water content experiments, as
has been described elsewhere [Costanza-Robinson, 2001]. With
elimination of the previous two retention processes, the only
process that remains is aqueous dissolution and associated rate-
limited diffusion.
[37] Both DFM and TCE are water soluble and thus undergo
mass transfer between the soil gas and soil water phases. While
such transfer is usually considered to be essentially instantaneous
for aqueous phase transport, it may not be for gas phase transport
given the generally greater velocities associated with gas flow. In
addition, to obtain an equilibrium distribution, the compound must
diffuse throughout the water bodies, which are relatively thick at
the highest soil water contents. This aqueous phase diffusion
process has been shown to contribute to rate-limited behavior for
gas phase transport [e.g., Brusseau, 1991; Gierke et al., 1992;
Popovicova and Brusseau, 1998]. Thus it is likely that rate
limitations associated with aqueous phase diffusion are influencing
the transport of DFM and TCE for experiments 10 and 11 and are
the cause of the enhanced dispersivity values. Moreover, TCE has
a slightly lower aqueous phase diffusion coefficient than DFM,
which would result in greater diffusion rate limitations and hence
the greater dispersion experienced by TCE.
5. Conclusions
[38] The results presented herein indicate that both mechanical
mixing and diffusion contribute significantly to gas phase transport
in unsaturated porous media under the conditions employed in the
experiments. The relative c tion of individual dispersion
processes for methane, DFM, and TCE were governed largely by
the differences in their diffusion coefficients. Changes in gas phase
tortuosity and linear velocity due to soil water content changes
represented secondary effects.
[39] The results indicate that soil water content alone does not
dramatically influence gas phase dispersion in unsaturated porous
media. However, solute reactivity, such as dissolution into the bulk
water and sorption to the solid phase, coupled with high soil water
contents appears to cause a significant increase in observed
dispersion. At soil water contents of 17 and 20%, the highest soil
water contents examined here, it is likely that rate-limited mass
transfer behavior became an important factor controlling DFM and
TCE transport, resulting in large discrepancies between the dis-
persivities obtained for the reactive versus the nonreactive com-
pounds.
[40] In general, the observed dispersivities fell within the range
of reported experimental values and model input values. Typical
gas phase dispersivity values range approximately from 0.1 to 5
cm, depending on soil type and soil column length, while those
reported here range from 0.3 to 3 cm [Armstrong et al., 1994;
Popovicova and Brusseau, 1997; Ruiz et al., 1999; Garcia-Her-
ruzo et al., 2000]. To the authors’ knowledge, gas phase disper-
sivity values have not been previously reported over a wide range
of soil water contents, such as are reported here. These results
indicate that within a given ‘‘ideal transport’’ range, dispersivities
are tracer and water content independent. Thus dispersivities
measured at one soil water content with a given compound may
be representative of the same porous media system at other soil
water contents and for other compounds.
[41] Acknowledgments. This research was supported by a grantprovided by the National Institute of Environmental Health SciencesSuperfund Basic Research Program and by the Francois Fiessinger Fellow-ship provided by the Environmental Research and Education Foundation.
ReferencesAlzaydi, A. A., C. A. Moore, and I. S. Rai, Combined pressure and diffu-sional transition region flow of gases in porous media, AIChE J., 24(1),35–43, 1978.
Arands, R., T. Lam, I. Massry, D. H. Berler, F. J. Muzzio, and D. S. Kosson,Modeling and experimental validation of volatile organic contaminantdiffusion through an unsaturated soil, Water Resources Res., 33(4), 599–609, 1997.
Armstrong, J. E., E. O. Frind, and R. D. McClellan, Nonequilibrium masstransfer between the vapor, aqueous, and solid phases in unsaturated soilsduring vapor extraction, Water Resour. Res., 30(2), 355–368, 1994.
Batterman, S., A. Kulshrestha, and H.-Y. Cheng, Hydrocarbon vapor trans-port in low moisture soils, Environ. Sci. Technol., 29(1), 171–180, 1995.
Table 5. Values for Calculated and Calibrated Dispersion Variables
Methane Difluoromethane Trichloroethene
Experiment qWv,
m s�1 tPe D,
cm s�1Ddiff,cm s�1
Dmm,cm s�1
a,cm
Pe D,cm s�1
Ddiff,cm s�1
Dmm,cm s�1
a,cm
Pe D,cm s�1
Ddiff,cm s�1
Dmm,cm s�1
a,cm
1 0.019 0.05 0.207 9.4 0.059 0.045 0.012 0.23 11.3 0.049 0.025 0.023 0.43 14.1 0.039 0.018 0.020 0.382 0.026 0.06 0.202 8.0 0.070 0.042 0.027 0.49 12.3 0.045 0.023 0.022 0.39 14.4 0.039 0.017 0.022 0.393 0.031 0.06 0.190 8.3 0.070 0.041 0.026 0.46 11.8 0.049 0.023 0.025 0.44 13.6 0.043 0.017 0.025 0.444 0.034 0.05 0.197 7.6 0.073 0.043 0.028 0.51 9.4 0.059 0.024 0.034 0.63 13.6 0.041 0.017 0.022 0.425 0.052 0.06 0.180 9.2 0.063 0.039 0.023 0.40 11.8 0.049 0.021 0.027 0.47 13.4 0.043 0.015 0.027 0.486 0.076 0.06 0.167 9.2 0.063 0.037 0.025 0.44 9.7 0.060 0.029 0.038 0.68 13.4 0.044 0.015 0.028 0.497 0.097 0.06 0.144 11.7 0.054 0.031 0.021 0.34 13.4 0.047 0.017 0.029 0.47 – – – – –8 0.136 0.07 0.112 15.6 0.045 0.025 0.030 0.44 17.4 0.041 0.014 0.026 0.38 – – – – –9 0.136 0.07 0.112 13.1 0.054 0.025 0.017 0.26 – – – – – 16.2 0.044 0.010 0.033 0.4810 0.169 0.08 0.080 21.5 0.039 0.019 0.017 0.22 15.1 0.056 0.010 0.041 0.53 10.8 0.078 0.008 0.065 0.8311 0.196 0.09 0.054 13.6 0.077 0.014 0.055 0.59 5.6 0.186 0.008 0.159 1.70 3.4 0.303 0.005 0.265 2.85
7 - 8 COSTANZA-ROBINSON AND BRUSSEAU: GAS ADVECTION AND DISPERSION
Brusseau, M. L., Transport of organic chemicals by gas advection in struc-tured or heterogeneous porous media: Development of a model andapplication to column experiments, Water Resour. Res., 27(12), 3189–3199, 1991.
Costanza-Robinson, M. S., Elucidation of retention processes governing thegas-phase transport of volatile organic compounds in unsaturated soilsystems, Ph.D. dissertation, Soil, Water and Environ. Sci. Dep., Univ.of Ariz., Tucson, 2001.
Cripps, A., Comparing solutions to soil gas flow problems with experimentand another solution, Build. Environ., 34, 735–740, 1999.
Deeds, N. E., D. C. McKinney, G. A. Pope, and G. A. Whitley Jr., Di-fluoromethane as partitioning tracer to estimate vadose water saturations,J. Environ. Eng., 125, 630–633, 1999.
Garcia-Herruzo, F., J. M. Rodriguez-Maroto, R. A. Garcia-Delgado,C. Gomez-Lahoz, and C. Vereda-Alonso, Column study of the influenceof air humidity on the retention of hydrocarbons on soil, Chemosphere,41, 1167–1172, 2000.
Garges, J. A., and A. L. Baehr, Type curves to determine the relativeimportance of advection and dispersion for solute and vapor transport,Ground Water, 36, 959–965, 1998.
Gierke, J. S., N. J. Hutzler, and D. B. McKenzie, Vapor transport inunsaturated soil columns: Implications for vapor extraction, WaterResources Res., 28(2), 323–335, 1992.
Goss, K.-U., Effects of temperature and relative humidity on the sorption oforganic vapors on quartz sand, Environ. Sci. Technol., 26, 2287–2294,1992.
Goss, K.-U., Effects of temperature and relative humidity on the sorption oforganic vapors on clay minerals, Environ. Sci. Technol., 27, 2127–2132,1993.
Jin, M., M. Delshad, V. Dwarakanath, D. C. McKinney, G. A. Pope,K. Sepehrnoori, and C. E. Tilburg, Partitioning tracer test for detection,estimation, and remediation performance assessment of subsurface non-aqueous phase liquids, Water Resources Res., 31(5), 1201–1211, 1995.
Johnson, P. C., M. W. Kemblowski, and J. D. Colthart, Quantitative analysisfor the cleanup of hydrocarbon-contaminated soils by in-situ venting,Ground Water, 28(3), 413–429, 1990.
Kayano, S., and D. J. Wilson, Soil clean up by in-situ aeration, X, Vaporstripping of mixtures of volatile organics obeying Raoult’s law, SeparationSci. Technol., 27(12), 1525–1554, 1992.
Koo, J.-K., D.-W. Ahn, S.-P. Yoon, and D.-H. Kim, Effects of water contentand temperature on equilibrium distribution of organic pollutants inunsaturated soil, Water Air Soil Pollut., 53, 267–277, 1990.
Li, C., and E. A. Voudrias, Difference in transport behavior between ali-phatic and aromatic petroleum vapors in unsaturated soil, Water Sci.Technol., 26(1-2), 89–98, 1992.
Lorden, S. W., W. Chen, and L. W. Lion, Experiments and modeling of thetransport of trichloroethene vapor in unsaturated aquifer material, Environ.Sci. Technol., 32(13), 2009–2017, 1998.
Massmann, J. W., Applying groundwater flow models in vapor extractionsystem design, J. Environ. Eng., 115(1), 129–149, 1989.
McCoy, B., and D. E. Rolston, Convective transport of gases in moistporous media: Effect of absorption, adsorption, and diffusion in soilaggregates, Environ. Sci. Technol., 26(12), 2468–2476, 1992.
Metcalfe, D. E., and G. J. Farquhar, Modeling gas migration throughunsaturated soils from waste disposal sites, Water Air Soil Pollut., 32,247–259, 1987.
Millington, R. J., Gas diffusion in porous media, Science, 130, 100–102,1959.
Moldrup, P., C. W. Druse, D. E. Rolston, and T. Yamaguchi, Modelingdiffusion and reaction in soils, III, Predicting gas diffusivity from theCampbell soil-water retention model, Soil Sci., 161(6), 366 –375,1996.
Moldrup, P., T. Olesen, D. E. Rolston, and T. Yamaguchi, Modeling diffu-sion and reaction in soils, VII, Predicting gas and ion diffusivity inundisturbed and sieved soils, Soil Sci., 162(9), 632–640, 1997.
Moldrup, P., T. G. Poulsen, P. Schjonning, T. Olesen, and T. Yamaguchi,Gas permeability in undisturbed soils: Measurements and predictivemodels, Soil Sci., 163(3), 180–189, 1998.
Moldrup, P., T. Olesen, P. Schjonning, T. Yamaguchi, and D. E. Rolston,Predicting the gas diffusion coefficient in undisturbed soil from soilwater characteristics, Soil Sci. Soc. Am. J., 64, 94–100, 2000.
Mosley, R. B., M. Y. Menetrez, R. Noddy, and S. A. Brubaker Jr., Theinfluences of diffusion and advective flow on the distribution of radonactivity within USEPA’s soil chamber, Environ. Int., 22(Suppl. 1), S521–S533, 1996.
Penman, H. L., Gas and vapour movements in the soil, I, The diffusion ofvapours through porous solids, J. Agric. Sci., 30, 437–462, 1940.
Pennell, K. D., R. D. Rhue, P. S. C. Rao, and C. T. Johnston, Vapor-phasesorption of p-xylene and water on soils and clay minerals, Environm. Sci.Technol., 26(4), 756–763, 1992.
Popovicova, J., and M. L. Brusseau, Dispersion and transport of gas-phasecontaminants in dry porous media: Effect of heterogeneity and gasvelocity, J. Contam. Hydrol., 28, 157–169, 1997.
Popovicova, J., and M. L. Brusseau, Contaminant mass transfer during gas-phase transport in unsaturated porous media,Water Resour. Res., 34, 83–92, 1998.
Poulsen, T. G., P. Moldrup, P. Schjonning, J. W. Massmann, and J. A.Hansen, Gas permeability and diffusivity in undisturbed soil: SVE im-plications, J. Environ. Eng., 124, 979–986, 1998a.
Poulsen, T. G., P. Moldrup, T. Yamaguchi, J. W. Massman, and J. A.Hansen, VOC vapor sorption in soil: Soil type dependent model andimplications for vapor extraction, J. Environ. Eng., 124, 146–155,1998b.
Poulsen, T. G., M. Christopherson, P. Moldrup, and P. Kjeldsen, Modelinglateral gas transport in soil adjacent to old landfill, J. Environ. Eng.,127(2), 145–153, 2001.
Rhue, R. D., P. S. C. Rao, and R. E. Smith, Vapor-phase adsorption ofalkylbenzenes and water on soils and clays, Chemosphere, 17, 727–741,1988.
Ruiz, J., R. Bibao, and M. B. Murillo, Adsorption of different VOC ontosoil minerals from gas phase: Influence of mineral, type of VOC, and airhumidity, Environ. Sci. Technol., 32(8), 1079–1084, 1998.
Ruiz, J., R. Bibao, and M. B. Murillo, Convective transport and removal ofvapors of two volatile compounds in sand columns under different airhumidity conditions, Environ. Sci. Technol., 33(21), 3774–3780, 1999.
Schaefer, C. E., R. R. Arands, H. A. van der Sloot, and D. S. Dosson,Modeling of the gaseous diffusion coefficient through unsaturated soilsystems, J. Contam. Hydrol., 29, 1–21, 1997.
Schwarzenbach, R. P., P. M. Gschwend, and D. M. Imboden, EnvironmentalOrganic Chemistry, John Wiley, New York, 1993.
Shan, C., and D. B. Stephens, An analytical solution for vertical transport ofvolatile chemicals in the vadose zone, J. Contam. Hydrol., 18, 259–277,1995.
Silva, J. A. K., Retention processes affecting VOC vapor transport in water-unsaturated porous media, M.S. thesis, Hydrol. and Water Resour. Dep.,Univ. of Ariz., Tucson, 1997.
Skopp, J., Analysis of solute movement in structured soils, paper presentedat ISSS Symposium on Water and Solute Movement in Heavy Clay Soils,Int. Inst. for Land Reclamation and Improvement, Wageningen, Nether-lands, 1984.
Unger, D. R., T. T. Lam, C. E. Schaefer, and D. S. Kosson, Predicting theeffect of moisture on vapor-phase sorption of volatile organic compoundsto soils, Environ. Sci. Technol., 30(4), 1081–1091, 1996.
Valsaraj, K. T., and L. J. Thibodeaux, Equilibrium adsorption of chemicalvapors on surface soils, landfills, and landfarms: A review, J. Hazard.Mater., 19, 79–99, 1988.
van der Pal, M., E. R. van der Graaf, R. J. de Meijer, M. H. de Wit, and N. A.Hendriks, Experimental setup for measuring diffusive and advectivetransport of radon through building materials, Sci. Total Environ., 272,315–321, 2001.
van der Spoel, W. H., E. R. van der Graaf, and R. J. de Meijer, Combineddiffusive and advective transport of radon in a homogeneous column ofdry sand, Health Phys., 74(1), 48–63, 1998.
van der Spoel, W. H., E. R. van der Graaf, and R. J. de Meijer, Diffusivetransport of radon in a column of moisturized sand, Health Phys., 77(2),163–177, 1999.
Williams, G. M., R. S. Ward, and D. J. Noy, Dynamics of landfill gasmigration in unconsolidated sands, Waste Mange. Res., 17(5), 327–342, 1999.
Wilson, D. J., A. N. Clarke, and J. H. Clarke, Soil clean-up by in-situaeration, I, Mathematical contamination by petroleum products, Separa-tion Sci. Technol., 23(10–11), 991–1037, 1988.
����������������������������M. S. Costanza-Robinson, Department of Chemistry, Northern Arizona
University, Flagstaff, Arizona 86011, USA.M. L. Brusseau, Soil, Water and Environmental Science Department,
429 Shantz Building #38, University of Arizona, Tucson, Arizona 85721,USA. ([email protected])
COSTANZA-ROBINSON AND BRUSSEAU: GAS ADVECTION AND DISPERSION 7 - 9