Embed Size (px)
Citation preview
GCSE Geography Support Booklet
Population Dynamics
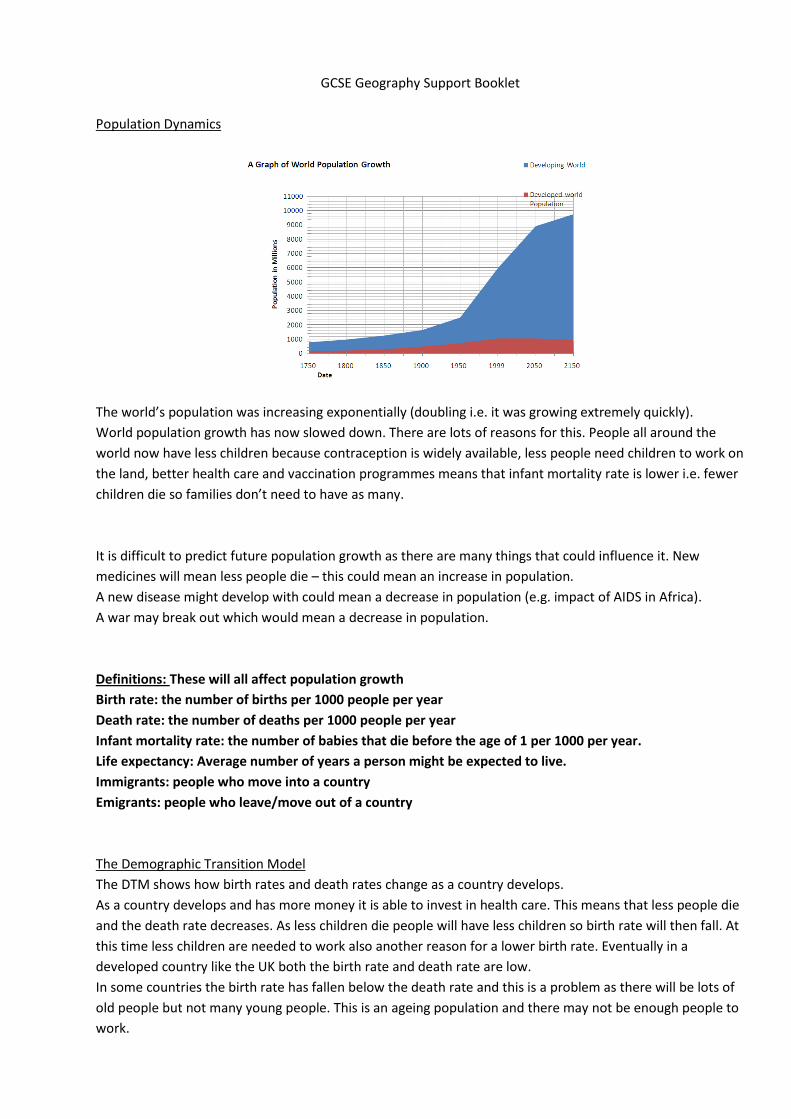
The world’s population was increasing exponentially (doubling i.e. it was growing extremely quickly).
World population growth has now slowed down. There are lots of reasons for this. People all around the
world now have less children because contraception is widely available, less people need children to work on
the land, better health care and vaccination programmes means that infant mortality rate is lower i.e. fewer
children die so families don’t need to have as many.
It is difficult to predict future population growth as there are many things that could influence it. New
medicines will mean less people die – this could mean an increase in population.
A new disease might develop with could mean a decrease in population (e.g. impact of AIDS in Africa).
A war may break out which would mean a decrease in population.
Definitions: These will all affect population growth
Birth rate: the number of births per 1000 people per year
Death rate: the number of deaths per 1000 people per year
Infant mortality rate: the number of babies that die before the age of 1 per 1000 per year.
Life expectancy: Average number of years a person might be expected to live.
Immigrants: people who move into a country
Emigrants: people who leave/move out of a country
The Demographic Transition Model
The DTM shows how birth rates and death rates change as a country develops.
As a country develops and has more money it is able to invest in health care. This means that less people die
and the death rate decreases. As less children die people will have less children so birth rate will then fall. At
this time less children are needed to work also another reason for a lower birth rate. Eventually in a
developed country like the UK both the birth rate and death rate are low.
In some countries the birth rate has fallen below the death rate and this is a problem as there will be lots of
old people but not many young people. This is an ageing population and there may not be enough people to
work.
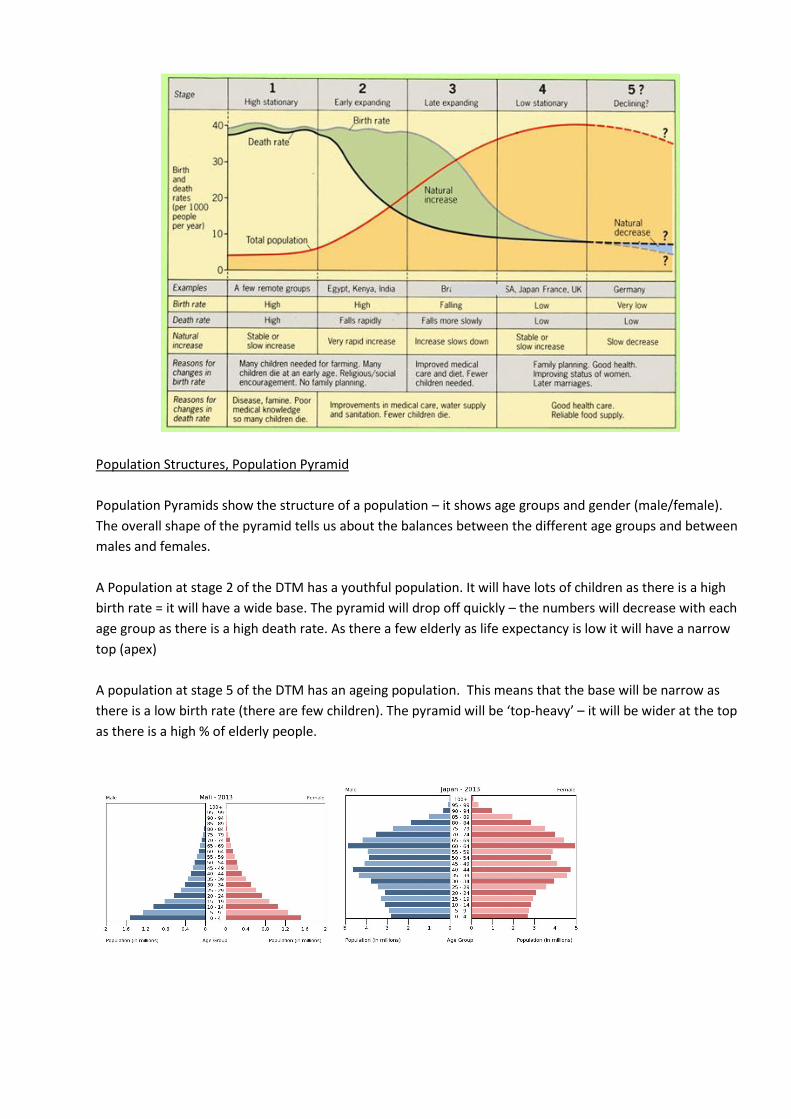
Population Structures, Population Pyramid
Population Pyramids show the structure of a population – it shows age groups and gender (male/female).
The overall shape of the pyramid tells us about the balances between the different age groups and between
males and females.
A Population at stage 2 of the DTM has a youthful population. It will have lots of children as there is a high
birth rate = it will have a wide base. The pyramid will drop off quickly – the numbers will decrease with each
age group as there is a high death rate. As there a few elderly as life expectancy is low it will have a narrow
top (apex)
A population at stage 5 of the DTM has an ageing population. This means that the base will be narrow as
there is a low birth rate (there are few children). The pyramid will be ‘top-heavy’ – it will be wider at the top
as there is a high % of elderly people.
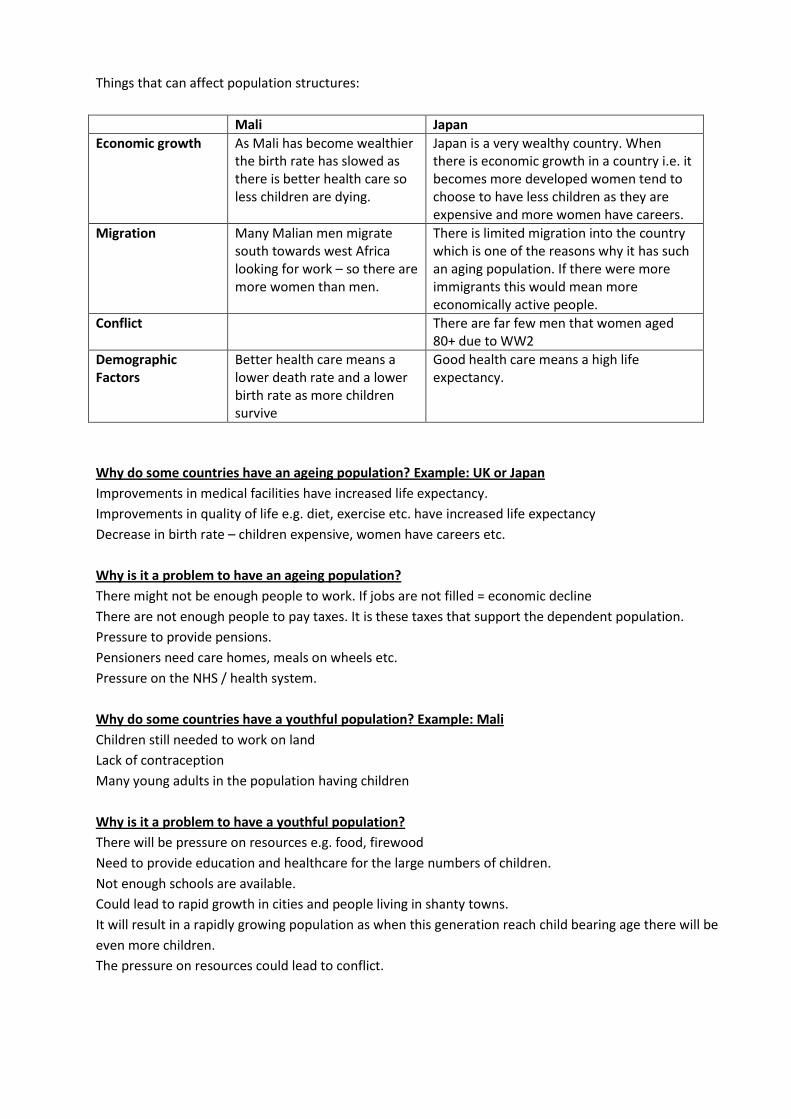
Things that can affect population structures:
Mali Japan
Economic growth
As Mali has become wealthier the birth rate has slowed as there is better health care so less children are dying.
Japan is a very wealthy country. When there is economic growth in a country i.e. it becomes more developed women tend to choose to have less children as they are expensive and more women have careers.
Migration
Many Malian men migrate south towards west Africa looking for work – so there are more women than men.
There is limited migration into the country which is one of the reasons why it has such an aging population. If there were more immigrants this would mean more economically active people.
Conflict
There are far few men that women aged 80+ due to WW2
Demographic Factors
Better health care means a lower death rate and a lower birth rate as more children survive
Good health care means a high life expectancy.
Why do some countries have an ageing population? Example: UK or Japan
Improvements in medical facilities have increased life expectancy.
Improvements in quality of life e.g. diet, exercise etc. have increased life expectancy
Decrease in birth rate – children expensive, women have careers etc.
Why is it a problem to have an ageing population?
There might not be enough people to work. If jobs are not filled = economic decline
There are not enough people to pay taxes. It is these taxes that support the dependent population.
Pressure to provide pensions.
Pensioners need care homes, meals on wheels etc.
Pressure on the NHS / health system.
Why do some countries have a youthful population? Example: Mali
Children still needed to work on land
Lack of contraception
Many young adults in the population having children
Why is it a problem to have a youthful population?
There will be pressure on resources e.g. food, firewood
Need to provide education and healthcare for the large numbers of children.
Not enough schools are available.
Could lead to rapid growth in cities and people living in shanty towns.
It will result in a rapidly growing population as when this generation reach child bearing age there will be
even more children.
The pressure on resources could lead to conflict.
Population Management
Governments may need to introduce policies to manage their populations. Governments want to have a
sustainable population / optimum population when population and resources are perfectly balanced e.g.
there is enough food, energy, space, jobs and housing for everyone without damaging the environment.
Why do governments need to manage their populations?
If a country is underpopulated there may not be enough people to work and pay taxes.
They may not be able to provide all the services needed in a country. The may not be able to exploit all their
resources. This is often the result of an ageing population.
If a country is overpopulated there will be pressure on resources such as food, energy, jobs, housing as there
will be too many people. This is often a youthful population which is rapidly growing.
Governments can manage their populations through trying to control birth rates or through controlling
migration.
Types of policies:
1. Pro-natalist = encouraging people to have more children.
Singapore 3 or more (if you can afford it)
Couples are given incentives to have more children:
Tax rebates for the third child and subsequent children
Cheap nurseries
Priority for best school places
Spacious apartments.
Pregnant women offered counselling to discourage abortions.
2. Anti-natalist = discouraging people from having children
China’s one-child policy
Introduced in 1979 –
Each couple were only allowed one child.
Those who had more than one child were penalised
Couples with only one child given a ‘one-child certificate entitling them to benefits such as cash
bonuses, longer maternity leave, better childcare, better access to housing.
Unmarried young people were persuaded to postpone marriage
Some women were forced to have abortions
Couples with more than one child were forced to be sterilised.
Was the policy successful?
The birth rate fell from 34 per 1,000 in 1970 to 13 per 1,000 in 2008
Population growth slowed down from 2.4% to 0.6%
Chinese tradition prefers sons – there has been selective abortions i.e. aborting girls. This has led to
there being more males than females, now 120 males to 100 females. A consequences of this is bride
kidnapping.
There are human rights issues – including babies being murdered in front of their parents.
There is a culture of ‘spoilt little emperors’
Migration policies
Governments may wish to:
Promote immigration if the country is underpopulated and they need more workers
Reduce immigration if the country is becoming overpopulated and there is a strain on resources, e.g. high
unemployment, lack of housing, not enough school places.
Ways to manage migration:
1. Open door policy
This is when a country allows the free admission of immigrants
This happened in the UK after the war when the British government encouraged migrants from colonies e.g.
the Caribbean. (1950-1960s ¼ million people came from the Caribbean).
The migrants filled jobs and helped rebuild the country after the war.
By the 1970’s the UK had more than enough labour, and controls were introduced to reduce the migrant
arrivals.
Positives: Help rebuild the country and met the shortage of labour
Negatives: Public money spent on meeting the needs of the immigrants e.g. housing, schools
When we went into a recession in the 1970’s the immigrants were an extra burden on employment.
2. Point based system
In 2008 the UK introduced this system. If you wish to come and work to settle down you need to gain a
certain amount of points. There are 5 tiers of migrants. Tier one has highly skilled workers such as scientists,
down to Tier five who are temporary workers e.g. musicians playing in a concert. This means that scientists
and highly skilled people eg doctors are more likely to be allowed into the UK where there is a skills shortage.
There may be a set quota for the number of migrants allowed in the country each year.
Impacts of migration
Positive Negative
They do jobs and add to the economy They often do the low paid jobs They pay taxes They create a dynamic and mixed culture
Tensions arise Hostility towards immigrants and discrimination Riots They became separated in ‘Ghettos’ – often in poor quality housing
Topic 2: Consuming Resources
Resources are things that people use and need.
There are 2 types of resources:
Natural – parts of the environment e.g. minerals, soil
Human – properties of a population e.g. technology, skills
These resources can be classified in a number of ways:
1. Availability
Non- renewable = cannot be ‘remade’ as it would take millions of years for them for form again e.g. coal, oil
Renewable = resources that can be maintained my management e.g. forests
Sustainable = resources that can be renewed if we act to replace them as we use them e.g. wood.
2. Type
Energy – coal, oil
Mineral – iron ore
Physical – wind, sunlight
Biological – timber
Supply and consumption
The supply (availability) and consumption (how much is being used) of resources have changed and will
change over time.
Things that may affect the supply:
A resource may run out e.g. oil
A new supply of a resource may be found e.g. North Sea Oil
Technology may improve which means a resource that a country was unable to actual
get may become available.
Things that may affect consumption:
As a country develops it may use more resources for instance more people own cars, more
people use electricity, e.g. China and India
As the population grows in a country so will its use of resources.
If there is a war in a country it may affect the country’s ability to import resources.
There are differences in the global supply and global consumption of oil (non-renewable energy) and wind
(renewable energy)
Why are there variations in the global supply
Why are there variations in the global consumption
Oil Can only supply it if you have the technology to extract it (get it) If the environment is extreme it will be difficult to get Oil supply has increased where more has been discovered e.g. Tarsands in Canada
Depends on wealth of country Dependence of use of the car High standard of living = air-conditioning, heating etc. Low petrol prices = encourage more people to use it. Rapid industrialisation (more industry to use energy) e.g. China
Wind If technology and money available to build turbines will be able to use more wind energy If the environment suitable i.e. is there enough wind?
Does the country need to use wind energy – is it running out of other resources?
How will international relations affect the supply and consumption of wind and oil?
Russia has large reserves of fossil fuels, however it is an unstable country and this is worrying. The
UK will rely more on Russia as North Sea Oil decreases. The UK opened talks in 2000 to try and
guarantee access to Russian Gas Supply.
In the UK the government worry about our need to import fossil fuels. The government is increasing
turning to renewable energy sources such as wind power.
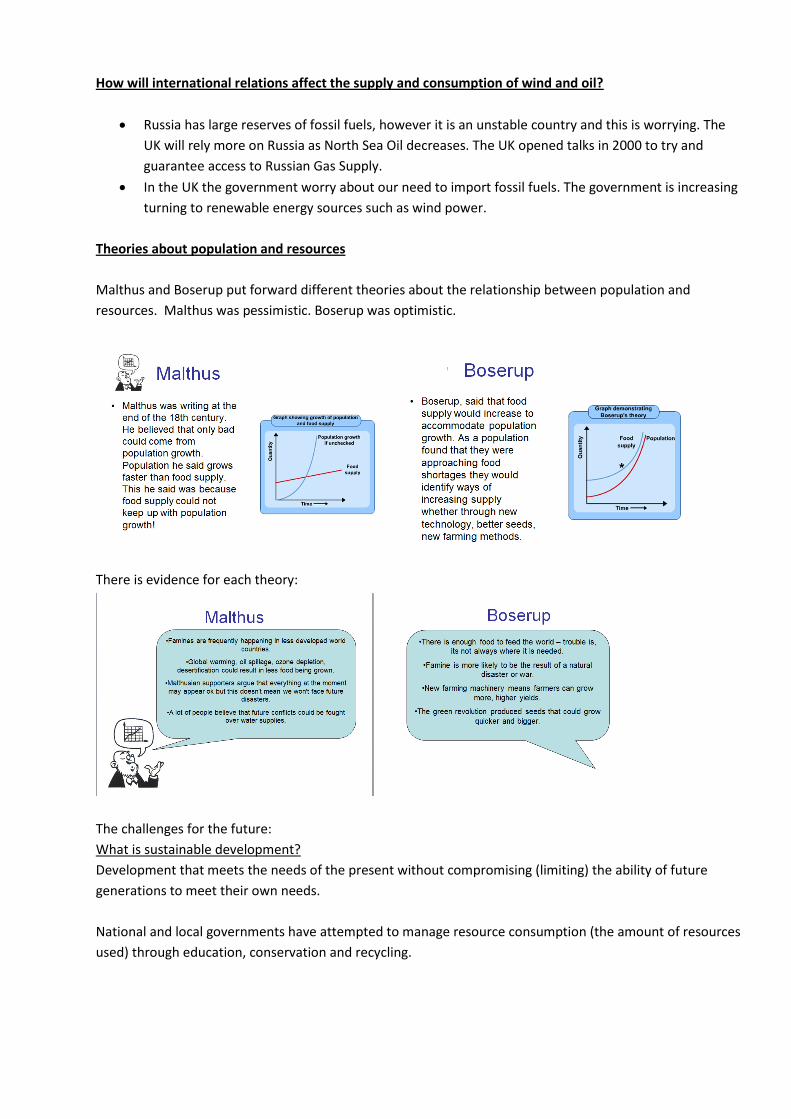
Theories about population and resources
Malthus and Boserup put forward different theories about the relationship between population and
resources. Malthus was pessimistic. Boserup was optimistic.
There is evidence for each theory:
The challenges for the future:
What is sustainable development?
Development that meets the needs of the present without compromising (limiting) the ability of future
generations to meet their own needs.
National and local governments have attempted to manage resource consumption (the amount of resources
used) through education, conservation and recycling.
How can we reduce resource consumption?
Use farmers markets – buy food that is produced locally. This food has travelled less distance and
may have a lower carbon footprint.
Encourage people to cycle instead of using cars – reduces car pollution and CO2 emissions.
Encourage people to reuse and recycle. This means materials are saved and used again. Up-cycling is
becoming more popular.
What are the advantages and disadvantages of using renewable energy (e.g. solar)?
It may be unlimited
It is environmentally friendly i.e. minimal carbon emissions
As technology improves so does production
Because weather is constantly changing it may be difficult to maintain a constant supply
Current production is small
It may be quite expensive to produce.
Can technology solve out resource problems? e.g. Hydrogen Economy
Some people think that technology will help our resource concerns and enable us to produce new and
efficient energy resources.
Use hydrogen in a fuel cell to create power.
This involves electrolysis – splitting water molecules into oxygen and hydrogen
Clean technology
Only by-product is water
However you need lots of electricity for electrolysis – where will this come from?
Topic 3: Globalisation
Globalisation is the process in which the world’s countries are all becoming part of one vast global
economy i.e. countries in the world are increasingly working together, trading more etc.
Employment Sectors
There are 4 employment (job) sectors
Primary = working with natural resources e.g. fishing, farming
Secondary = making things e.g. Manufacturing (working in a car factory) construction (building a house)
Tertiary = providing a service e.g. teachers, doctors, working in a shop
Quaternary = research/hi-tech e.g. biotechnology
The employment sector of a country means how the workforce is divided up between the main sectors. The
importance of each sector changes over time and is different in different countries.
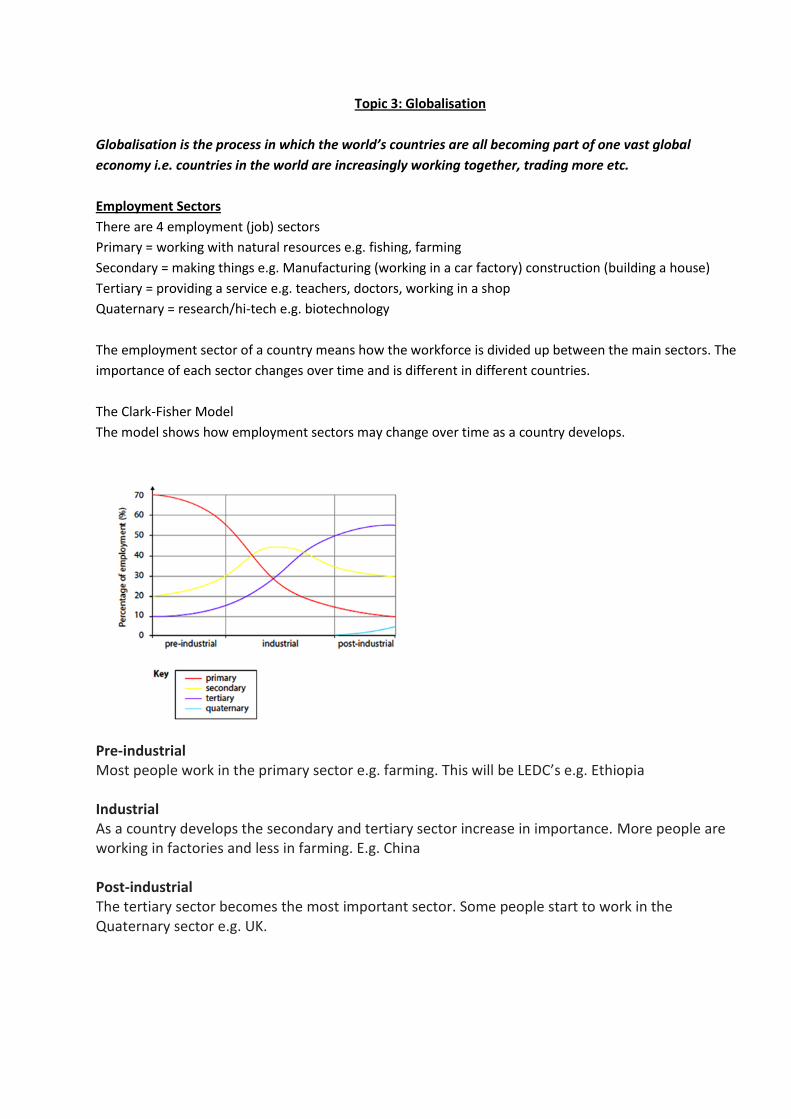
The Clark-Fisher Model
The model shows how employment sectors may change over time as a country develops.
Pre-industrial Most people work in the primary sector e.g. farming. This will be LEDC’s e.g. Ethiopia Industrial As a country develops the secondary and tertiary sector increase in importance. More people are working in factories and less in farming. E.g. China Post-industrial The tertiary sector becomes the most important sector. Some people start to work in the Quaternary sector e.g. UK.
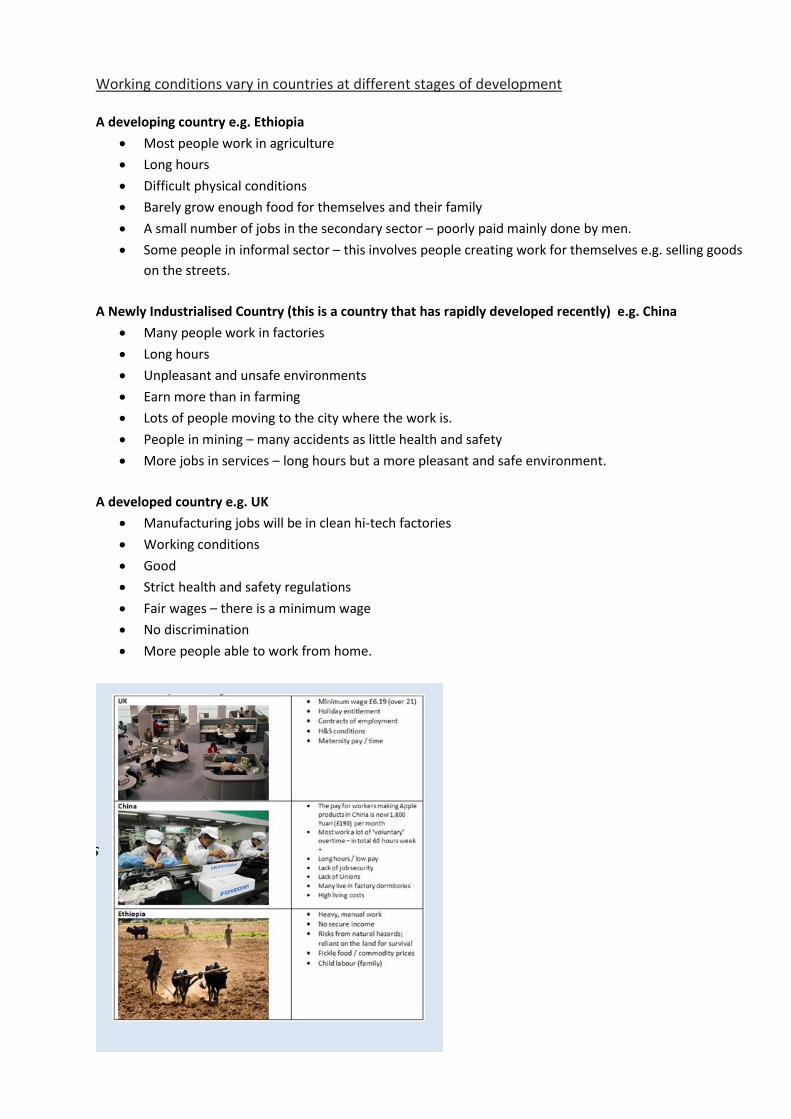
Working conditions vary in countries at different stages of development A developing country e.g. Ethiopia
Most people work in agriculture
Long hours
Difficult physical conditions
Barely grow enough food for themselves and their family
A small number of jobs in the secondary sector – poorly paid mainly done by men.
Some people in informal sector – this involves people creating work for themselves e.g. selling goods
on the streets.
A Newly Industrialised Country (this is a country that has rapidly developed recently) e.g. China
Many people work in factories
Long hours
Unpleasant and unsafe environments
Earn more than in farming
Lots of people moving to the city where the work is.
People in mining – many accidents as little health and safety
More jobs in services – long hours but a more pleasant and safe environment.
A developed country e.g. UK
Manufacturing jobs will be in clean hi-tech factories
Working conditions
Good
Strict health and safety regulations
Fair wages – there is a minimum wage
No discrimination
More people able to work from home.
Global institutions help to create a more global economy:
World Trade Organisation – sets rules of trade between countries
International Monetary Fund – tries to reduce poverty. Provides funds to countries e.g. to help
improve infrastructure. Provides advice and aid to countries
Transnational Corporations – Companies that operate in more than one country e.g. Nike, Tesco,
Coca-Cola.
What is the impact of globalisation on different groups of people?
MEDC
Men Some men have had to re-skill More self employment and working from home Well paid and good working conditions
Women More women in workforce as more flexible working hours. More part-time work. Some women still do not have equal pay to men
LEDC
Men Learning new skills. Employed in manufacturing and services. More opportunities to get a salary Men may migrate to city May be in the informal sector Often poor working conditions
Women More opportunity to work May have less children May be exploited Unsafe working environment Left by men in rural areas to work the land
Child labour
In the last 50 years international trade has increased significantly. Why?
Foreign Direct Investment: This is when a business from one country invests money in a company in another
country, or builds its own factory or office in another country. FDI has grown as the world has become more
globalised.
A good example of FDI is China investing into Africa. China needs oil and mineral resources and it is trying to
find new sources of these. Therefore they are investing in Africa to find these resources. They also need to
improve the infrastructure in countries in Africa (roads, rail etc) so they can export the materials back to
China.
What has enable trade and FDI to increase?
1. Lower transport costs. It is now much cheaper and quicker to transport goods around the world e.g.
container ships can carry huge volume of goods, cheaply.
2. Growth of TNC’s. Because there are now lots of TNC’s operating all over the world, they are
increasing the movement of goods around the world. TNC’s will often have their headquarters in one
country and manufacture their goods in a number of different countries e.g. Nike
3. Mergers – this is when one company combines with another company e.g. Disney and Pixar, Orange
and T-Mobile = EE.
4. State-led investment – when a government of one country invests into another country.
Improvements in technology have been key in allowing globalisation e.g. internet – this allows people to
communicate instantly wherever they are in the world.
We have seen a ‘global shift’ in industry and services. This means that economic activities (and jobs) have
moved from developed to developing countries.
A TNC in the secondary sector (manufacturing) = Nike
Why does it operate in different parts of the world?
Headquarters – Oregon USA. Why?
Skilled and educated workforce
Latest technology available
State of the art offices which attract the best people!
Manufacturing – Cambodia. Why
Can pay workers lower wages
Limited health and safety regulations in place = cheaper to run the factory
Limited environmental controls – cheaper to run factory as don’t have to deal with waster
etc.
Workers have few rights.
Able to use the raw materials from these countries.
A TNC in the tertiary sector (services) = Tesco
How does it operate in different parts of the world?
It is the largest food retailer in the UK and the third largest retailer in the world.
One of the reasons for its success is that it diversified into new markets (i.e. didn’t just stick with
food but starting selling other products like clothes, toys, home products)
It now has 6,000 stores and employs over 500,000 people in 14 countries.
It opened its first supermarkets abroad in the 1990’s in Eastern Europe e.g. Hungary.
In 1998 it opened stores in Taiwan and Thailand. It then spread throughout Asia – China, Japan.
Today 60% of its profits come from Asia – it is successful because it has moved into Asia which is a
rapidly growing market both in terms of growing population and growing economy – people are
becoming richer and have more to spend.
It is successful because it has a clear brand image – you would recognise Tesco’s wherever you are in
the world (a bit like McDonalds)
It is also successful because it has products that it sells in all its stores – but it has also introduced
products in particular countries that reflect the diets and taste of the host country – gloclaisation.
It also outsources its products from other countries – i.e. products for Tesco’s are made all around
the world – this way they are able to get products cheaper.
Topic 4 Development Dilemmas
Development: Economic and Social progress that leads to an improvement in the quality of life for an
increasing proportion of the population.
Development can be measured in a number of ways:
Economic development – the progress made by a country or area creating wealth through business, industry
and trade.
Social development – the progress made by a country in terms of improving the lives of people.
Measures of development:
Gross Domestic Product – money made within a country in a year divided by the number of people.
There is data available to do this but it hides gaps between the rich and poor.
Human Development Index (HDI) considers GDP, literacy rates and life expectancy. This is good as it
covers a wide range of factors but again does not consider differences within a country i.e. there
may be some very rich and some living in poverty.
Political Freedom – measures political rights and freedom i.e. freedom to vote – it is based on
Western ideas of ‘freedom’. Political freedom is hard to measure. Some countries e.g. in Middle East
are very wealthy but have little political freedom.
The development gap.
A development gap exists in the world – the gap between rich nations (those that have) and poor nations
(the have nots)
The gap has widened since 1980 i.e. there is now a bigger difference between the rich and poor. Incomes in
MEDC’s and the Asian Tigers (Hong Kong, South Korea, Singapore and Taiwan) have rapidly increased,
whereas growth has been much slower in the rest of the world.
Development has rapidly occurred in China and India. There has been little progress in some African
countries such as Ethiopia.
The richest 1% of people have as much money as the poorest 50%!
For one developing country in sub-Saharan Africa, consider recent social, political and economic
development.
Case Study: Uganda
Development / progress made:
Spending on healthcare has increased by 70%
Spending on education has increased by 40%. It is likely that all children will receive a primary
education in the upcoming years.
Large reserves of oil have been discovered which could earn Uganda an extra US $2billion a year.
Barriers to future progress:
Gender inequality – teenage girls often drop out of education to marry young. This means that the
birth rate is still high and the youthful population will grow.
87% of the population live in rural areas based on agriculture. Transport from these areas is difficult
and slow – it is difficult to get crops to the city to sell.
Political corruption means the money doesn’t always get to the people to help them.
The youthful population is a burden on the country.
There is a high % of people with HIV and Aids which is a burden on the country.
Why do countries develop over time?
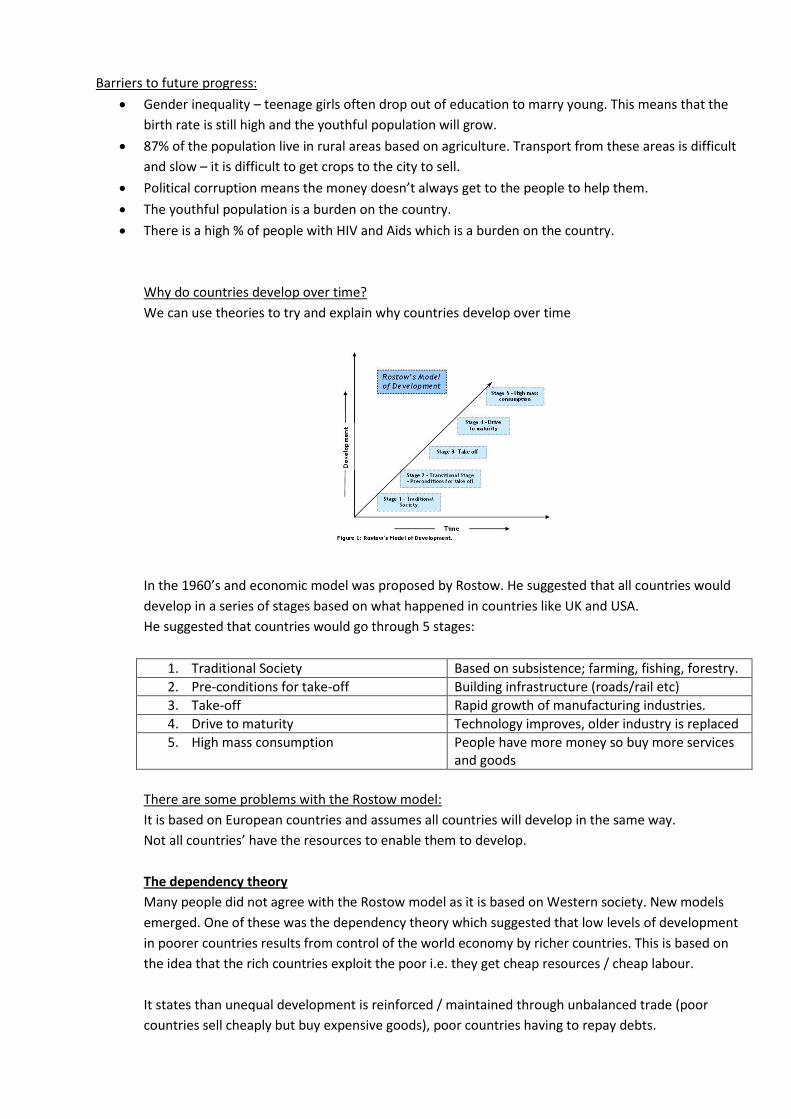
We can use theories to try and explain why countries develop over time
In the 1960’s and economic model was proposed by Rostow. He suggested that all countries would
develop in a series of stages based on what happened in countries like UK and USA.
He suggested that countries would go through 5 stages:
1. Traditional Society Based on subsistence; farming, fishing, forestry.
2. Pre-conditions for take-off Building infrastructure (roads/rail etc)
3. Take-off Rapid growth of manufacturing industries.
4. Drive to maturity Technology improves, older industry is replaced
5. High mass consumption People have more money so buy more services and goods
There are some problems with the Rostow model:
It is based on European countries and assumes all countries will develop in the same way.
Not all countries’ have the resources to enable them to develop.
The dependency theory
Many people did not agree with the Rostow model as it is based on Western society. New models
emerged. One of these was the dependency theory which suggested that low levels of development
in poorer countries results from control of the world economy by richer countries. This is based on
the idea that the rich countries exploit the poor i.e. they get cheap resources / cheap labour.
It states than unequal development is reinforced / maintained through unbalanced trade (poor
countries sell cheaply but buy expensive goods), poor countries having to repay debts.
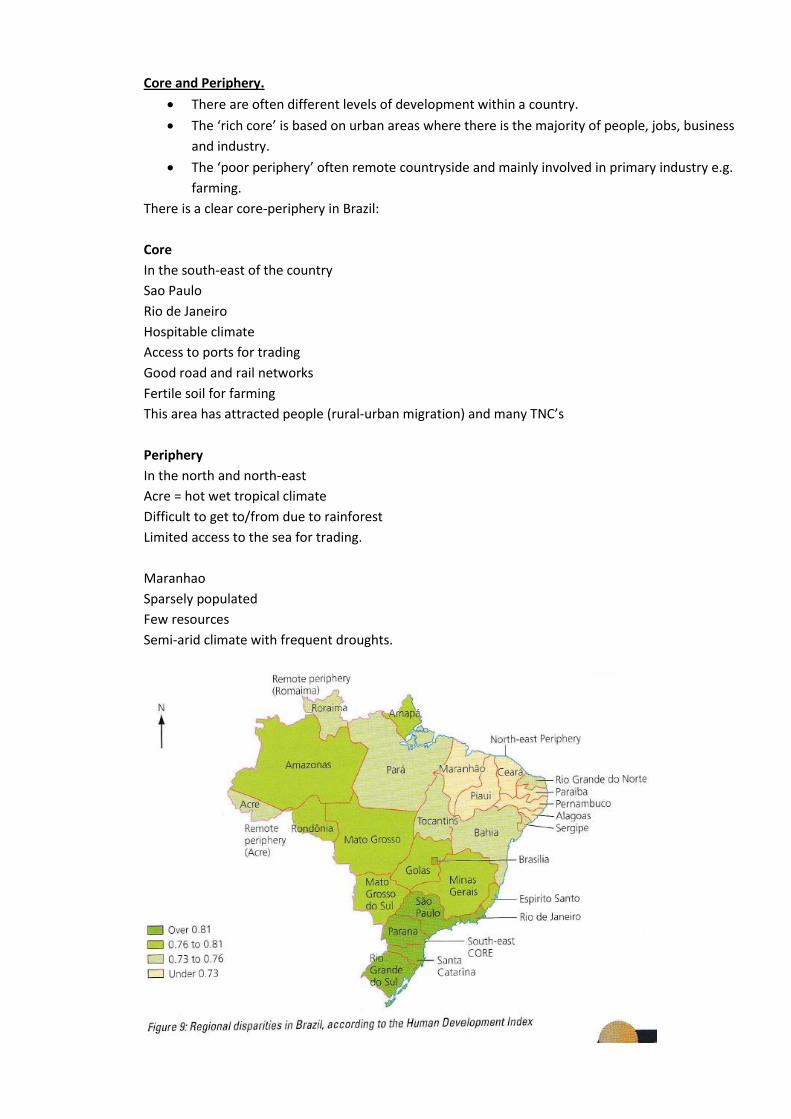
Core and Periphery.
There are often different levels of development within a country.
The ‘rich core’ is based on urban areas where there is the majority of people, jobs, business
and industry.
The ‘poor periphery’ often remote countryside and mainly involved in primary industry e.g.
farming.
There is a clear core-periphery in Brazil:
Core
In the south-east of the country
Sao Paulo
Rio de Janeiro
Hospitable climate
Access to ports for trading
Good road and rail networks
Fertile soil for farming
This area has attracted people (rural-urban migration) and many TNC’s
Periphery
In the north and north-east
Acre = hot wet tropical climate
Difficult to get to/from due to rainforest
Limited access to the sea for trading.
Maranhao
Sparsely populated
Few resources
Semi-arid climate with frequent droughts.
A government would worry about these disparities because the quality of life would be much lower for
people living in the peripheral areas. People from the periphery many move to the core leading to
overcrowding.
Top-down vs Bottom up
A country can use different ways to promote development. There are 2 types of development approaches:
Top-down and bottom up.
A table comparing top down and bottom up development projects
Top Down Bottom up
Scale Large and expensive ($22 -$39 billion for 3 Gorges Dam in China.)
Small scale. Less expensive (e.g. £34,000 for micro hydro scheme in Peru)
Aims To help the whole country develop quickly, especially urban cores. E.g roads, HEP dams, airports.
To help the remote rural periphery. To be appropriate for local peoples’ skills. To be low cost and easy to operate.
Funding Either from the government or usually borrowed from TNCs in developed countries or organisations like the world bank
Comes usually from the villagers themselves or charities e.g. CAFOD, Practical Action, Water Aid.
Technology Large scale, advanced technology. Detrimental effect on the environment.
Simple. Appropriate or intermediate technology. Easy for locals to use. Less impact on the environment.
Decisions Made by Governments and new laws often made to make the schemes go ahead Local people not involved in the decisions.
Local people much more involved in the whole process, from planning to daily operation.
Criticisms Country can get into debt, paying loans back for the project. Uses machinery and inappropriate technology rather than providing unskilled jobs for people. Expensive to operate and energy intensive.
Initial costs are still high for poor villagers. Poor people still have to pay for the electricity. Some specialist equipment may still need to be imported. It may take longer for a country to develop under these schemes as so small scale.
Exam question: Using named examples compare the main features of a top down project and a bottom up
project. (6 marks) Main features = scale, aims, funding and technology.
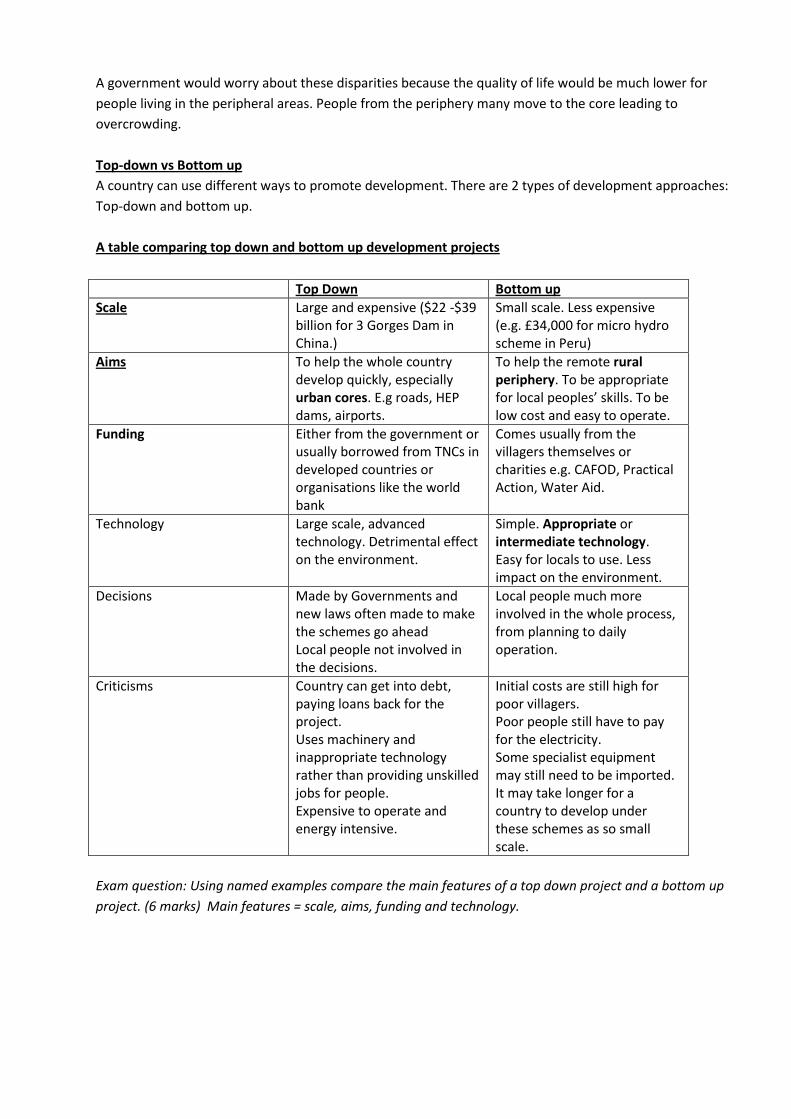
Sustainable development is ‘development that meets the needs to the present without compromising the
ability of future generations to meet their own needs’.
Sustainable development should be affordable, have long term benefits for the local people, limited impact
on the environment and use appropriate technology.
What has been the impact of one large scale project on different groups of people in a developing
country?
Case study: Three Gorges Dam , China
The building of the Three Gorges Dam affected many people in a positive way. Firstly the building of the dam
created 250,000 jobs for people from all over China. Once built the dam decreased the risk of flooding which
was important for the poor people living in the Hubei Province as they were are particular risk of flooding
and could lose their lives, homes and livelihoods during floods. The hydroelectricity generated from the dam
has also been a huge benefit to various groups of people. Businesses in the cities of shanghai and Beijing as
well as the residents now have a stable and efficient source of power. For businesses this could increase
profits and potentially create more jobs.
However the building of the dam also had a negative effect on people. 1.4 million people were forced to
relocate during the construction of the demeaning people lost their homes and communities. Fishermen in
the area were also affected as algae blooms have been recorded along the length of the dam which has
reduced fish numbers. As a result some fishermen have seen their income decrease. Finally although people
living in the Hubei province are now less affected by floods the building of the dam has increased the
potential for landslides in the area.
Topic 6: Changing Settlements in the UK
There have been many changes in urban areas in the last 50 years.
What has caused these changes?
Processes
Processes are things that have happened that have caused out urban areas to change. They include:
De-industrialisation – heavy industry e.g. ship building closing down
Government planning policies e.g. introducing greenbelts
Regeneration of inner city areas to improve the housing for people living in these areas
Immigration – migrants moving into an area.
These processes changed urban areas – some for the better, some for the worse! E.g. London vs Liverpool
London - economic and population growth Liverpool – economic and population decline
Economic processes
Lighter industry attracted to area because of good communication network (transport). Good links to Europe via Channel tunnel.
It became a world financial centre
The economic boom led to lots of luxury flats and apartments being built in the area.
Decline of traditional industry Containerisation = decline of docks.
Social processes Jobs were created Toxeth riots in 1981 1989 Hillsborough disaster.
Political processes In 1981 the Docklands became an Enterprise Zone = government lifted tax burdens and gave quick planning permission
Growth of financial services due to deregulation by the government
County Council went into debt
Demographic processes
Skilled labour force attracted new lighter industry
Loss of population 12,000 people a year leaving the city High unemployment
There are variations (differences) in the quality of urban residential areas.
The quality of urban areas has been affected by all the changes that have taken place.
Quality of urban areas considers housing, services, amenities and recreational areas.
In some areas the quality of the urban area is very high e.g. Chelsea in London.
In other areas the quality of the urban area is low – it is said to be deprived e.g. Newham
Deprivation is a measure of how either individuals or groups of people are at a disadvantage
compared with those living elsewhere.
Multiple Deprivation is when there are lots of aspects of an area that are of poor quality.
Some urban areas are more affluent (wealthier) than others. E.g. Overall Chelsea and St Albans are affluent
compared to Newham (less affluent / poorer)
An affluent area will have:
Expensive housing.
Good access to services such as doctors, schools, transport networks e.g. train station
Good access to amenities such as Parks, Golf courses, cinemas.
Good quality recreational areas e.g. open spaces and parks.
Facts: Chelsea has the 3rd highest proportion of people living in privately rented housing. 53% of residents
have at least a degree level education. 58% of residents are in very good health.
A less affluent area will have:
Cheaper housing and more council housing estates.
Less access to services such as doctors and good quality schools.
Less access to amenities such as shops and restaurants. May be near less desirable amenities such as
rubbish tips.
Not much recreational area as the houses are often cramped with little open space.
Facts: Incomes lower in Newham than anywhere else in England. People in Newham live in some of the
most densely packed housing estates in the UK. It is one of the most deprived areas in the UK
There can be variation within an urban area – think back to your controlled assessment about variations
within St Albans. i.e. differences between Sopwell (less affluent) and Veralum (more affluent)
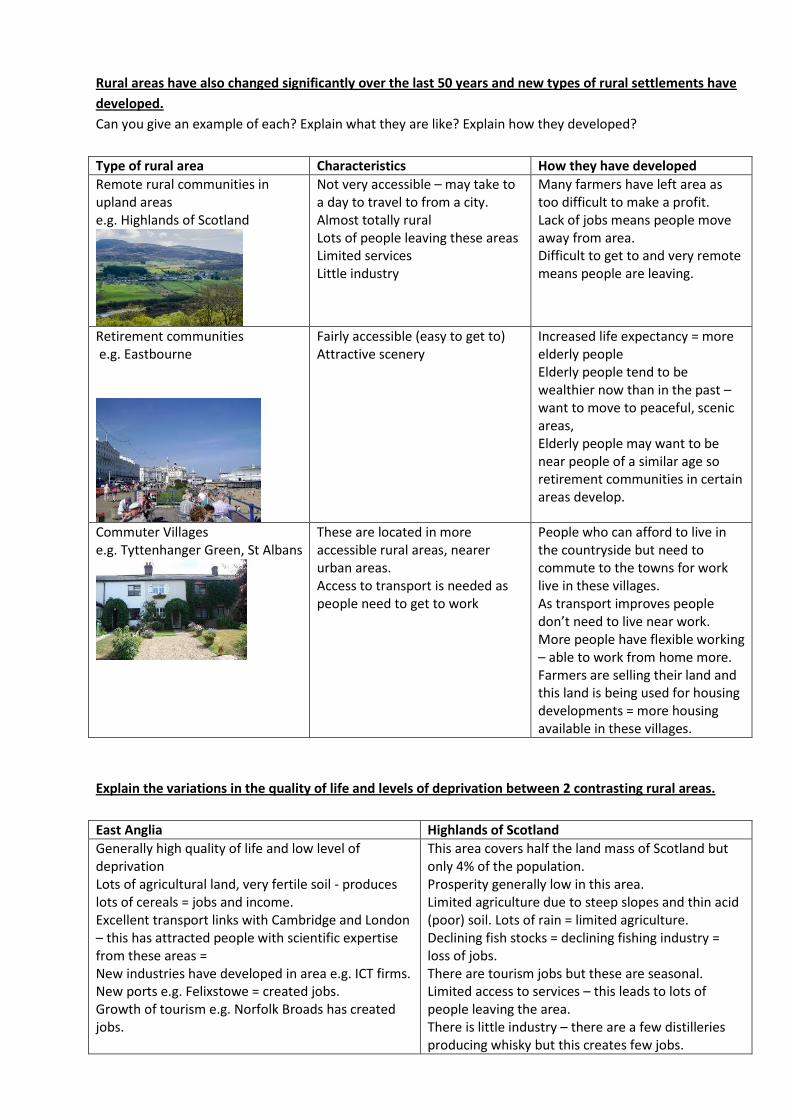
Rural areas have also changed significantly over the last 50 years and new types of rural settlements have
developed.
Can you give an example of each? Explain what they are like? Explain how they developed?
Type of rural area Characteristics How they have developed
Remote rural communities in upland areas e.g. Highlands of Scotland
Not very accessible – may take to a day to travel to from a city. Almost totally rural Lots of people leaving these areas Limited services Little industry
Many farmers have left area as too difficult to make a profit. Lack of jobs means people move away from area. Difficult to get to and very remote means people are leaving.
Retirement communities e.g. Eastbourne
Fairly accessible (easy to get to) Attractive scenery
Increased life expectancy = more elderly people Elderly people tend to be wealthier now than in the past – want to move to peaceful, scenic areas, Elderly people may want to be near people of a similar age so retirement communities in certain areas develop.
Commuter Villages e.g. Tyttenhanger Green, St Albans
These are located in more accessible rural areas, nearer urban areas. Access to transport is needed as people need to get to work
People who can afford to live in the countryside but need to commute to the towns for work live in these villages. As transport improves people don’t need to live near work. More people have flexible working – able to work from home more. Farmers are selling their land and this land is being used for housing developments = more housing available in these villages.
Explain the variations in the quality of life and levels of deprivation between 2 contrasting rural areas.
East Anglia Highlands of Scotland
Generally high quality of life and low level of deprivation Lots of agricultural land, very fertile soil - produces lots of cereals = jobs and income. Excellent transport links with Cambridge and London – this has attracted people with scientific expertise from these areas = New industries have developed in area e.g. ICT firms. New ports e.g. Felixstowe = created jobs. Growth of tourism e.g. Norfolk Broads has created jobs.
This area covers half the land mass of Scotland but only 4% of the population. Prosperity generally low in this area. Limited agriculture due to steep slopes and thin acid (poor) soil. Lots of rain = limited agriculture. Declining fish stocks = declining fishing industry = loss of jobs. There are tourism jobs but these are seasonal. Limited access to services – this leads to lots of people leaving the area. There is little industry – there are a few distilleries producing whisky but this creates few jobs.
How easy is it to manage the demand for high quality places to live?
What strategies can be used to improve the quality of rural settlements to make them more sustainable?
Many strategies can be used including Rural Development Schemes such as the Eden Project and Planning
Policies such as Greenbelts and National Parks.
The Eden project is an example of a rural development scheme that has been developed to stimulate
(improve) the economy of an area and also stop people migrating out of an area.
Facts:
A visitor attraction in Cornwall
Consists of 2 huge domes containing thousands of plants
Each area contains a different natural Biome
It has the world’s largest rainforest in captivity!
Has it been successful?
It employs 600 people directly
Attracts over 1 million visitors each year
Brings benefits to surrounding hotels, shops and restaurants
It always tries to use local suppliers for food etc. generating £7million for local suppliers
However….
Traffic has increased in the area.
It only brings profit to this area of Cornwall
Some other tourist attractions have lost visitors as they are attracted to the Eden project instead.
How successful have greenbelts and National Parks been in conserving valuable landscapes and allowing
economic development?
Success in conserving landscape
Problems with conserving landscape
Successes in allowing economic development
Problems in allowing economic development
Greenbelts An area around a city composed of mostly farmland and parkland in which development is strictly controlled. Its purpose is to stop the outward spread of the city
Have prevented urban sprawl. Have prevented neighbouring towns joining e.g. St Albans and Hatfield. Have preserved the character of historic towns e.g. St Albans
Have put more pressure on the rural land just outside the greenbelt i.e. has moved the problem somewhere else. Much of the greenbelt actually contains brownfield sites e.g. landfill
There has been some economic development in towns as the brownfield site have been regenerated e.g. Regeneration of the old Oaklands College. As St Albans has maintained its character it has attracted investment.
As developers can build on the greenbelt land it actually limits the growth in some areas.
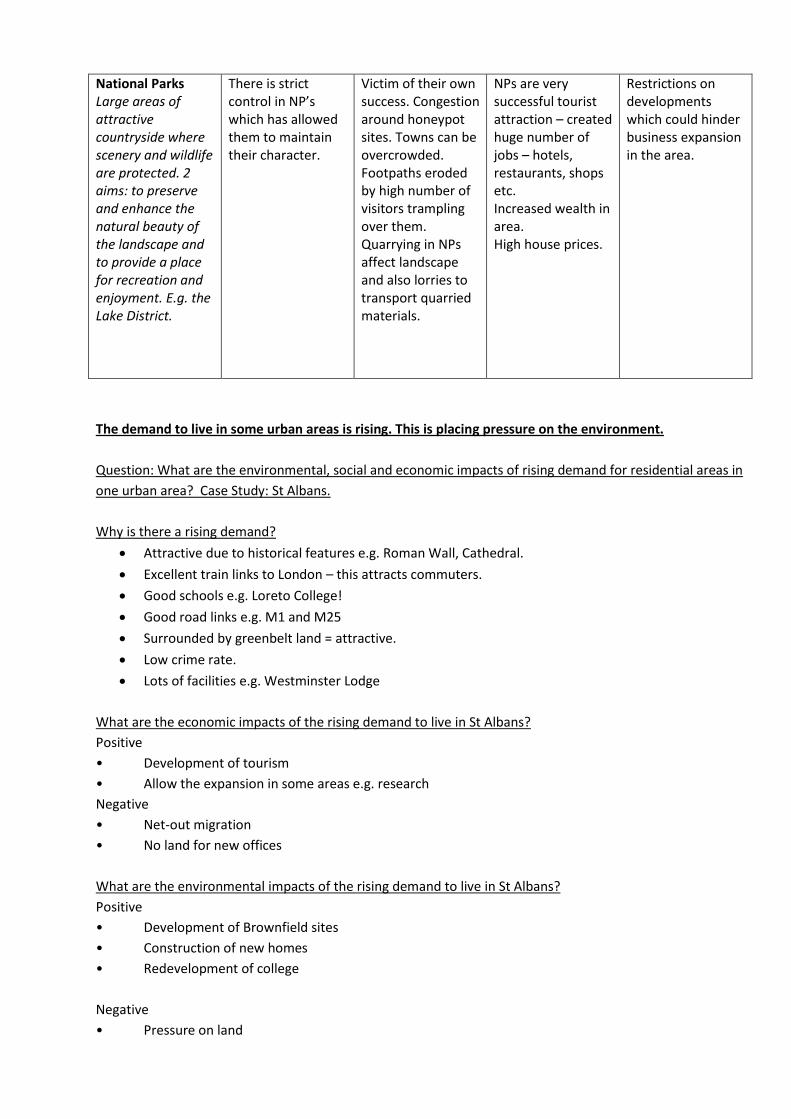
National Parks Large areas of attractive countryside where scenery and wildlife are protected. 2 aims: to preserve and enhance the natural beauty of the landscape and to provide a place for recreation and enjoyment. E.g. the Lake District.
There is strict control in NP’s which has allowed them to maintain their character.
Victim of their own success. Congestion around honeypot sites. Towns can be overcrowded. Footpaths eroded by high number of visitors trampling over them. Quarrying in NPs affect landscape and also lorries to transport quarried materials.
NPs are very successful tourist attraction – created huge number of jobs – hotels, restaurants, shops etc. Increased wealth in area. High house prices.
Restrictions on developments which could hinder business expansion in the area.
The demand to live in some urban areas is rising. This is placing pressure on the environment.
Question: What are the environmental, social and economic impacts of rising demand for residential areas in
one urban area? Case Study: St Albans.
Why is there a rising demand?
Attractive due to historical features e.g. Roman Wall, Cathedral.
Excellent train links to London – this attracts commuters.
Good schools e.g. Loreto College!
Good road links e.g. M1 and M25
Surrounded by greenbelt land = attractive.
Low crime rate.
Lots of facilities e.g. Westminster Lodge
What are the economic impacts of the rising demand to live in St Albans?
Positive
• Development of tourism
• Allow the expansion in some areas e.g. research
Negative
• Net-out migration
• No land for new offices
What are the environmental impacts of the rising demand to live in St Albans?
Positive
• Development of Brownfield sites
• Construction of new homes
• Redevelopment of college
Negative
• Pressure on land
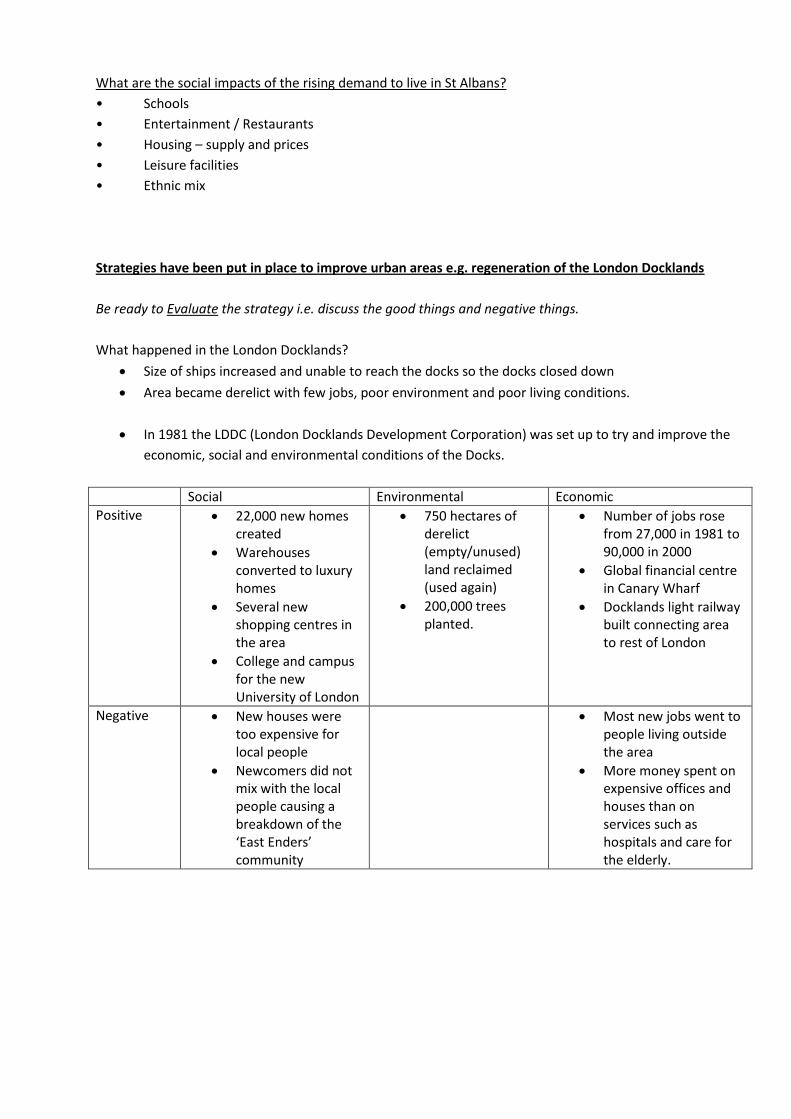
What are the social impacts of the rising demand to live in St Albans?
• Schools
• Entertainment / Restaurants
• Housing – supply and prices
• Leisure facilities
• Ethnic mix
Strategies have been put in place to improve urban areas e.g. regeneration of the London Docklands
Be ready to Evaluate the strategy i.e. discuss the good things and negative things.
What happened in the London Docklands?
Size of ships increased and unable to reach the docks so the docks closed down
Area became derelict with few jobs, poor environment and poor living conditions.
In 1981 the LDDC (London Docklands Development Corporation) was set up to try and improve the
economic, social and environmental conditions of the Docks.
Social Environmental Economic
Positive 22,000 new homes created
Warehouses converted to luxury homes
Several new shopping centres in the area
College and campus for the new University of London
750 hectares of derelict (empty/unused) land reclaimed (used again)
200,000 trees planted.
Number of jobs rose from 27,000 in 1981 to 90,000 in 2000
Global financial centre in Canary Wharf
Docklands light railway built connecting area to rest of London
Negative New houses were too expensive for local people
Newcomers did not mix with the local people causing a breakdown of the ‘East Enders’ community
Most new jobs went to people living outside the area
More money spent on expensive offices and houses than on services such as hospitals and care for the elderly.
Topic 7: The Challenge of an Urban World
How have cities grown and what challenges do they face?
Urbanisation = an increased proportion of people living in towns and cities.
Urbanisation is now happening most rapidly in LEDC’s.
Asia is seeing the most rapid growth of urban areas.
Reasons for growth of urban areas in LEDC’s
1. Natural increase (i.e. high number of births). It tends to be young adults who migrate to/live in the
cities and these are the child bearing age group.
2. Migration from the countryside to the city = Push:Pull factors
Push factors Pull factors
Lack of jobs Higher wages
Crop failure Perceived better quality of life
Lack of facilities Better health care
What are megacities?
Cities with more than 10 million people e.g. New York, Mexico City, Tokyo, Beijing.
What are the differences between megacities in the developed and developing world?
Developing World e.g. Shanghai, Mexico City
Developed World e.g. New York, Los Angeles
Economic activities (jobs)
Major centres of economic activity including manufacturing and financial and service industries.
Major centres of economic activity including manufacturing and financial and service industries.
Spatial growth(how the actual city grows)
Chaotic growth meaning less structure = less regular layout. Areas cannot be so easily defined as the city has grown so fast. People set up home on any land they can find. Expensive houses are separated from the rest often along main roads.
Have clear / distinct zones. The CBD is in the centre and the inner city zones and suburbs surround it. There still may be areas of poverty
Population The population structure tends to be dominated by older people. This is because fertility rates are low (women don’t have many children). Some people many still live in areas of poor housing such as Newham.
There are high fertility rates and high natural increase in developing megacities which means a youthful population. In 2012 over 1 billion people, nearly 1/7th of the world’s population lived in squatter settlements.
Urban challenges in the developed world e.g. London
Challenges that cities in the developed world face include food, energy, transport and waste disposal
demands. These challenges could lead to higher resource consumption in these cities i.e. people who live in
cities use more resources.
Food Food not grown in London – it has to be transport from other places in the UK or other countries = high carbon footprint (more carbon emissions) due to transport
Energy The demand for electricity in London is huge as there are so many homes and businesses. Energy generated in power stations which use fossil fuels = increased carbon footprint.
Transport Congestion in London at peak times. Exhaust fumes pollute the air. Congestion charge was introduced to reduce vehicles coming in to London.
Waste London produces 20 million tonnes of waste each year – mush of which is transported out and put into landfill.
Urban challenges in the developing world e.g. Dhaka
Challenges that cities in the developing world face include slum housing, the informal economy (forms of
employment that are not officially recognised e.g. people working for themselves on the streets) and urban
pollution. This can leads to a low quality of life.
Slum housing City growing so fast they can’t cope with number of people. People build homes on any spare land – often poor quality land prone to flooding/landslides. Lack of sewerage leads to disease e.g. cholera. Often no electricity or running water.
Informal economy
Most people work in the informal sector – shining shoes, selling water, making food to sell. Often on street corners.
Pollution Water is often polluted and can lead to death. Water can be polluted by animal and human waste, fertilisers, industrial chemicals.
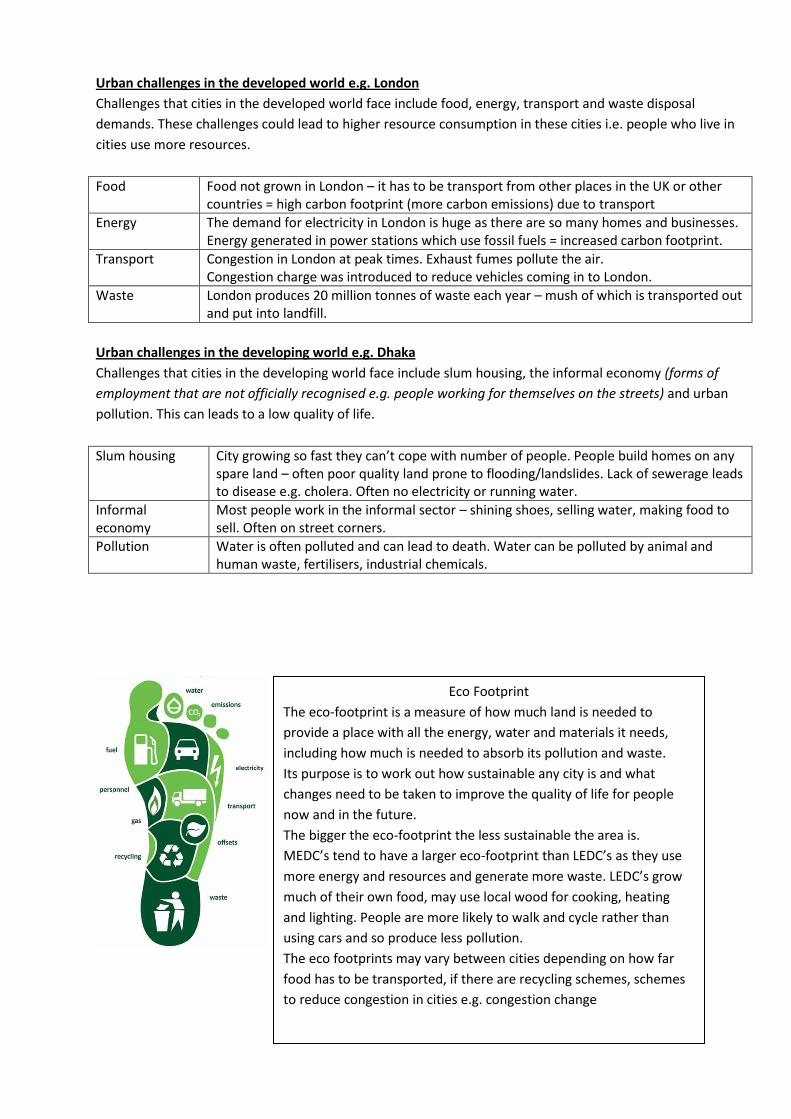
Eco Footprint
The eco-footprint is a measure of how much land is needed to
provide a place with all the energy, water and materials it needs,
including how much is needed to absorb its pollution and waste.
Its purpose is to work out how sustainable any city is and what
changes need to be taken to improve the quality of life for people
now and in the future.
The bigger the eco-footprint the less sustainable the area is.
MEDC’s tend to have a larger eco-footprint than LEDC’s as they use
more energy and resources and generate more waste. LEDC’s grow
much of their own food, may use local wood for cooking, heating
and lighting. People are more likely to walk and cycle rather than
using cars and so produce less pollution.
The eco footprints may vary between cities depending on how far
food has to be transported, if there are recycling schemes, schemes
to reduce congestion in cities e.g. congestion change
How can all the problems that urban areas face be managed (improved)?
York is a city that is trying to reduce its eco-footprint by reducing its energy consumption (amount of energy
it is using) and waste generation (amount of waste it produces).
How is York reducing its energy consumption?
The local council have produced tips for people to save energy in their homes:
Use a shower instead of bath, it uses 40% less water
Turn off lights when you leave a room
Wait for full load in washing machine and dishwasher.
All the information can be found on the council website. They also produced a leaflet called ‘Creating a
sustainable York’.
How is York reducing the amount of waste it creates?
People have different coloured bins to sort their waste – 30% less now going to landfill than in 2006
Businesses are asked to use electronic communications like email instead of paper
Shops and businesses now sort their own waste.
Introducing Sustainable transport is another way that cities can reduce their eco-footprint.
Sustainable transport in London:
Bus lanes – sped up the journey for buses and therefore encouraging more people to use them.
Congestion Charge: 7am to 6pm on weekdays in the congestion charge zone in London. This
encourages people to use public transport rather than use their car.
Improvement of the underground: to make it more efficient. Fares are expensive which puts some
people off using it.
Boris’s cycle super highway: to create a safe cycle lane to encourage people to cycle rather than use
a car. Lots of debate about whether there is enough room to put in the ‘cycle super highway’.
More park and ride schemes
Sustainable transport in Curitiba:
The system transports 2.6 million people per day and used by 70% of the city’s people.
It is very efficient and cheap
Buses are frequent – some every 90 seconds
One fare
Efficient bus stops – no steps, passengers get on and off via a platform to the bus stop.
Buses use natural gas = less pollution.
How can the quality of life in cities in LEDC’s be improved?
1. Through self-help schemes
e.g. Rocinha, a favela, in Brazil where 70,000 people live. The local authority is helping people help
themselves. They provide building materials e.g. breeze blocks and cement to improve their houses.
Houses are much more stable and can withstand floods and landslides.
2. Through Non – Governmental Organisations (NGO’s)
e.g. Kachhpura in India. One problem was that sewage and waste water drained into the main river
channel that ran through the town. An NGO called CURE (Centre for Urban and Regional Excellence)
has provided a low tech temporary solution sewage plant that disposes of sewage and waste water.
It needs little technical maintenance and doesn’t depend on electricity.
3. Urban Planning
e.g. Curitiba – a model for a greener urban future. The growth of Curitiba was very well planned.
Success based on public transport system– see notes above.
Another strategy to manage environmental challenges in the developing world is to develop less
polluted cities e.g. Masdar City.
Advantages:
Building angled to maximise shade from the sun = less air conditioning needed.
Solar panel on roofs = more sustainable energy
A steel tower acts as a wind tower drawing in cool breezes from above the city and directing
them into the courtyard.
Personal Rapid Transport (electrical cars) transport people around the city. No cars allowed
in Masdar = reduces pollution.
Disadvantages:
Huge cost $22 billion
Isolated from other communities
High cost of apartments – only wealthy can afford to live there
Whole plan dictated by government – community not involved.
However overall Masdar is seen as a model for innovation and sustainable ideas.