Embed Size (px)
Citation preview
Presented by:
Vijay Tallapragada
Chief, Global Climate and Weather Modeling Branch
Based on Work Done by EMC DA, Land Surface, Ensembles, Waves and
Hurricane Teams and GCWMB
EMC CCB (Decisional Brief)
March 8, 2016
GDAS/GFS V13.0.0 Upgrades
for 2016
1
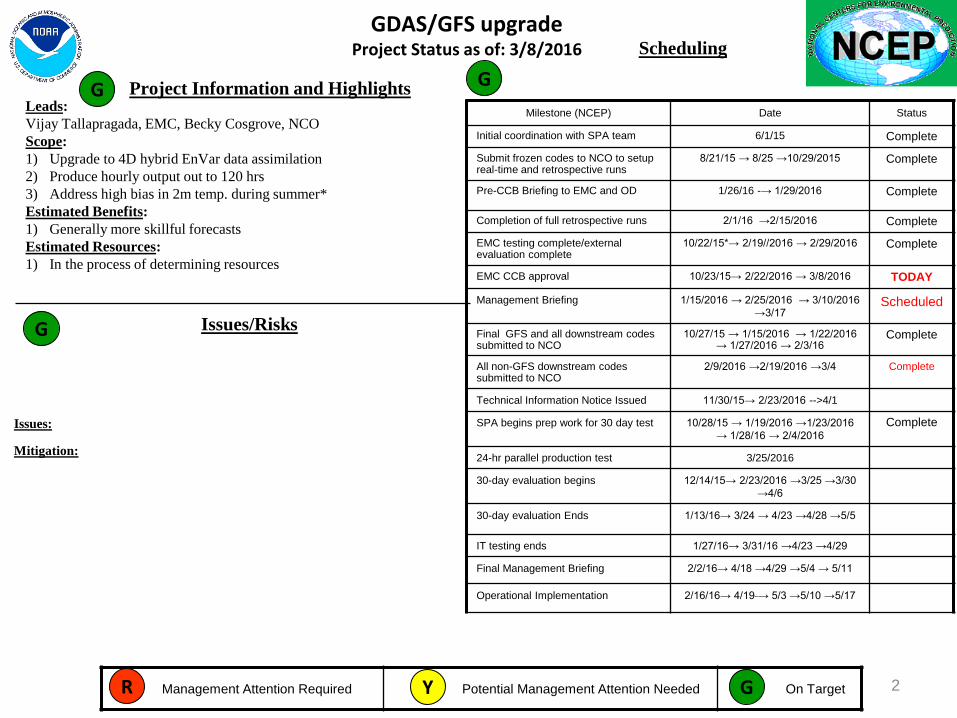
GDAS/GFS upgrade Project Status as of: 3/8/2016
Issues/Risks
Scheduling
Project Information and Highlights
Management Attention Required Potential Management Attention Needed On Target G R Y
Leads:
Vijay Tallapragada, EMC, Becky Cosgrove, NCO
Scope:
1) Upgrade to 4D hybrid EnVar data assimilation
2) Produce hourly output out to 120 hrs
3) Address high bias in 2m temp. during summer*
Estimated Benefits:
1) Generally more skillful forecasts
Estimated Resources:
1) In the process of determining resources
Issues:
Milestone (NCEP) Date Status
Initial coordination with SPA team 6/1/15 Complete
Submit frozen codes to NCO to setup real-time and retrospective runs
8/21/15 → 8/25 →10/29/2015 Complete
Pre-CCB Briefing to EMC and OD 1/26/16 -→ 1/29/2016 Complete
Completion of full retrospective runs 2/1/16 →2/15/2016 Complete
EMC testing complete/external evaluation complete
10/22/15*→ 2/19//2016 → 2/29/2016 Complete
EMC CCB approval 10/23/15→ 2/22/2016 → 3/8/2016 TODAY
Management Briefing 1/15/2016 → 2/25/2016 → 3/10/2016
→3/17 Scheduled
Final GFS and all downstream codes submitted to NCO
10/27/15 → 1/15/2016 → 1/22/2016 → 1/27/2016 → 2/3/16
Complete
All non-GFS downstream codes submitted to NCO
2/9/2016 →2/19/2016 →3/4 Complete
Technical Information Notice Issued 11/30/15→ 2/23/2016 -->4/1
SPA begins prep work for 30 day test 10/28/15 → 1/19/2016 →1/23/2016
→ 1/28/16 → 2/4/2016
Complete
24-hr parallel production test 3/25/2016
30-day evaluation begins 12/14/15→ 2/23/2016 →3/25 →3/30
→4/6
30-day evaluation Ends 1/13/16→ 3/24 → 4/23 →4/28 →5/5
IT testing ends 1/27/16→ 3/31/16 →4/23 →4/29
Final Management Briefing 2/2/16→ 4/18 →4/29 →5/4 → 5/11
Operational Implementation 2/16/16→ 4/19 → 5/3 →5/10 →5/17
G G
Mitigation:
G
2
Table of Contents
1) The GDAS/GFS is being upgraded to 4D-
Hybrid En-VAR System
2) Land surface improvements to address
summertime warm/dry biases in surface fields
3) Hourly output fields through 120-hr forecasts
4) Evaluation of GDAS/GFS upgrades based on
34 months of retrospective and real-time
experiments
3
Next GFS/GDAS in 2016
The 4D Hybrid En-Var
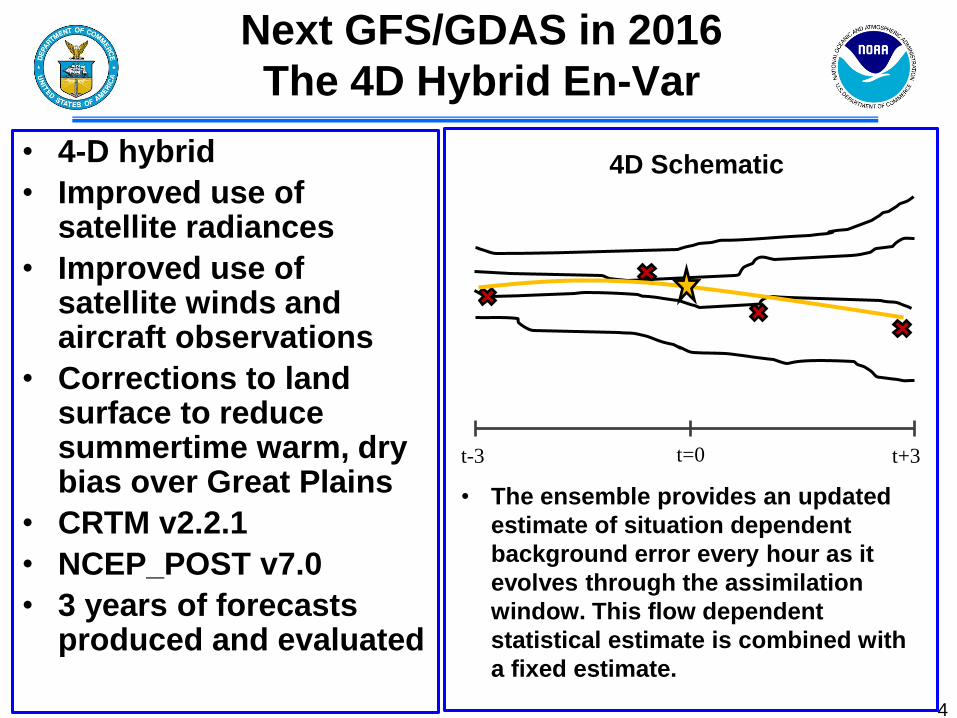
• 4-D hybrid
• Improved use of satellite radiances
• Improved use of satellite winds and aircraft observations
• Corrections to land surface to reduce summertime warm, dry bias over Great Plains
• CRTM v2.2.1
• NCEP_POST v7.0
• 3 years of forecasts produced and evaluated
t-3 t=0 t+3
• The ensemble provides an updated
estimate of situation dependent
background error every hour as it
evolves through the assimilation
window. This flow dependent
statistical estimate is combined with
a fixed estimate.
4D Schematic
4
5
DA and Model Changes
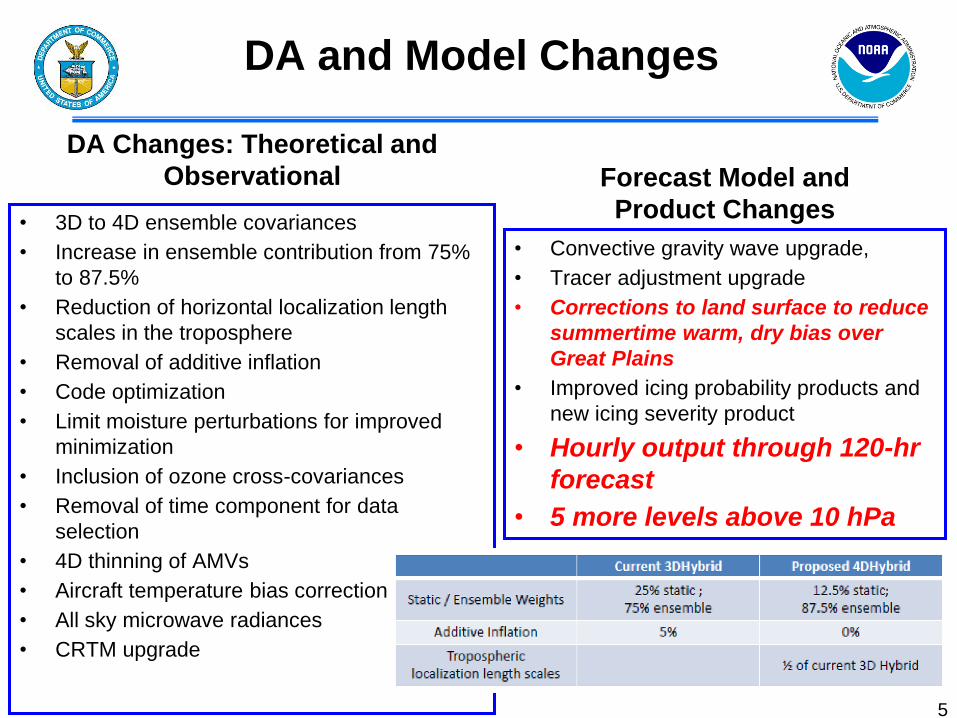
DA Changes: Theoretical and
Observational
• 3D to 4D ensemble covariances
• Increase in ensemble contribution from 75%
to 87.5%
• Reduction of horizontal localization length
scales in the troposphere
• Removal of additive inflation
• Code optimization
• Limit moisture perturbations for improved
minimization
• Inclusion of ozone cross-covariances
• Removal of time component for data
selection
• 4D thinning of AMVs
• Aircraft temperature bias correction
• All sky microwave radiances
• CRTM upgrade
Forecast Model and
Product Changes
• Convective gravity wave upgrade,
• Tracer adjustment upgrade
• Corrections to land surface to reduce
summertime warm, dry bias over
Great Plains
• Improved icing probability products and
new icing severity product
• Hourly output through 120-hr
forecast
• 5 more levels above 10 hPa
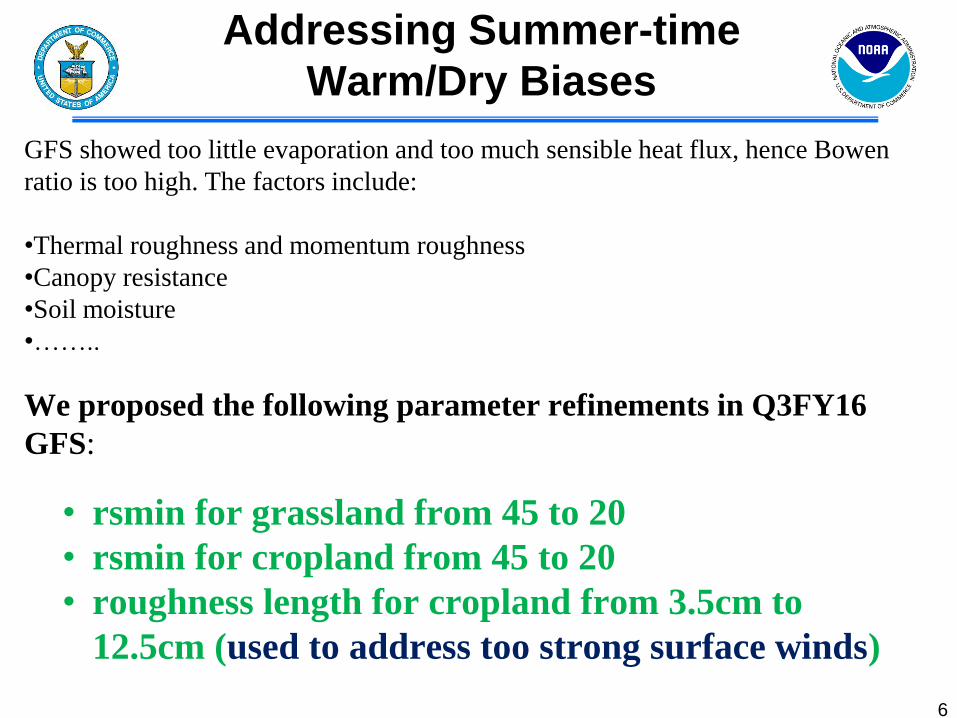
• rsmin for grassland from 45 to 20
• rsmin for cropland from 45 to 20
• roughness length for cropland from 3.5cm to
12.5cm (used to address too strong surface winds)
GFS showed too little evaporation and too much sensible heat flux, hence Bowen
ratio is too high. The factors include:
•Thermal roughness and momentum roughness
•Canopy resistance
•Soil moisture
•……..
We proposed the following parameter refinements in Q3FY16
GFS:
Addressing Summer-time
Warm/Dry Biases
6
New Model Upgrade Evaluation
Strategy
7
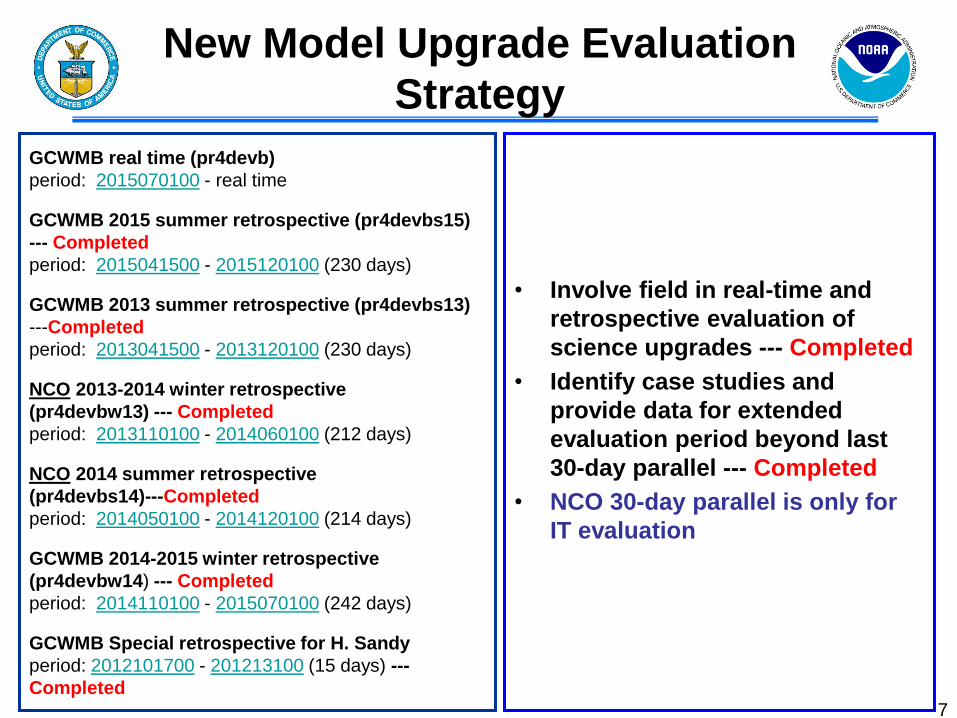
GCWMB real time (pr4devb)
period: 2015070100 - real time
GCWMB 2015 summer retrospective (pr4devbs15)
--- Completed
period: 2015041500 - 2015120100 (230 days)
GCWMB 2013 summer retrospective (pr4devbs13)
---Completed
period: 2013041500 - 2013120100 (230 days)
NCO 2013-2014 winter retrospective
(pr4devbw13) --- Completed
period: 2013110100 - 2014060100 (212 days)
NCO 2014 summer retrospective
(pr4devbs14)---Completed
period: 2014050100 - 2014120100 (214 days)
GCWMB 2014-2015 winter retrospective
(pr4devbw14) --- Completed
period: 2014110100 - 2015070100 (242 days)
GCWMB Special retrospective for H. Sandy
period: 2012101700 - 201213100 (15 days) ---
Completed
• Involve field in real-time and
retrospective evaluation of
science upgrades --- Completed
• Identify case studies and
provide data for extended
evaluation period beyond last
30-day parallel --- Completed
• NCO 30-day parallel is only for
IT evaluation
8
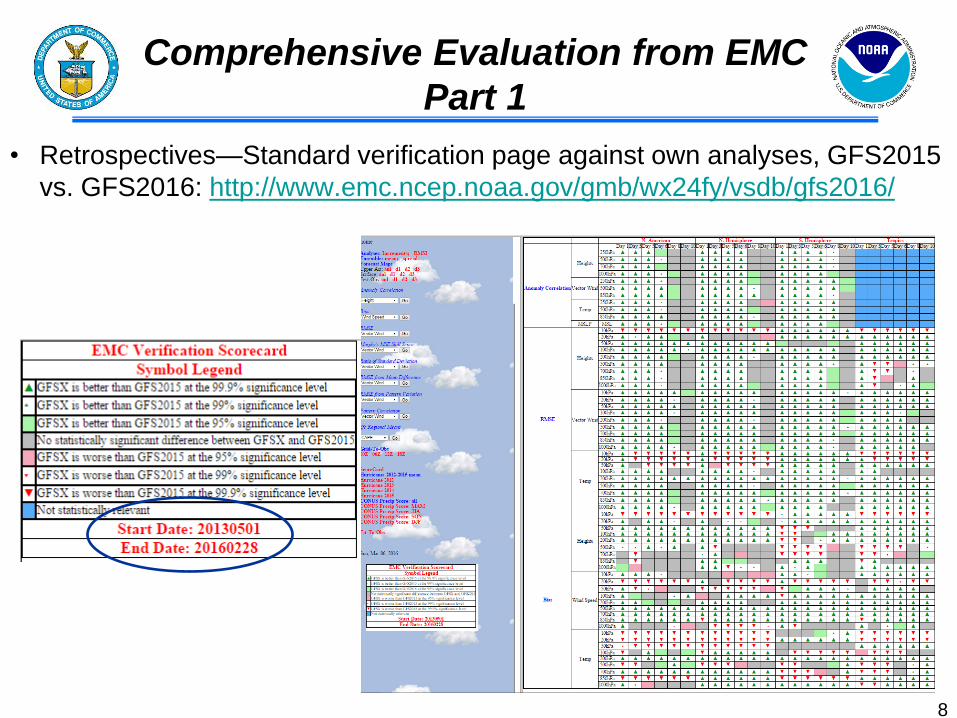
• Retrospectives—Standard verification page against own analyses, GFS2015
vs. GFS2016: http://www.emc.ncep.noaa.gov/gmb/wx24fy/vsdb/gfs2016/
Comprehensive Evaluation from EMC
Part 1
9
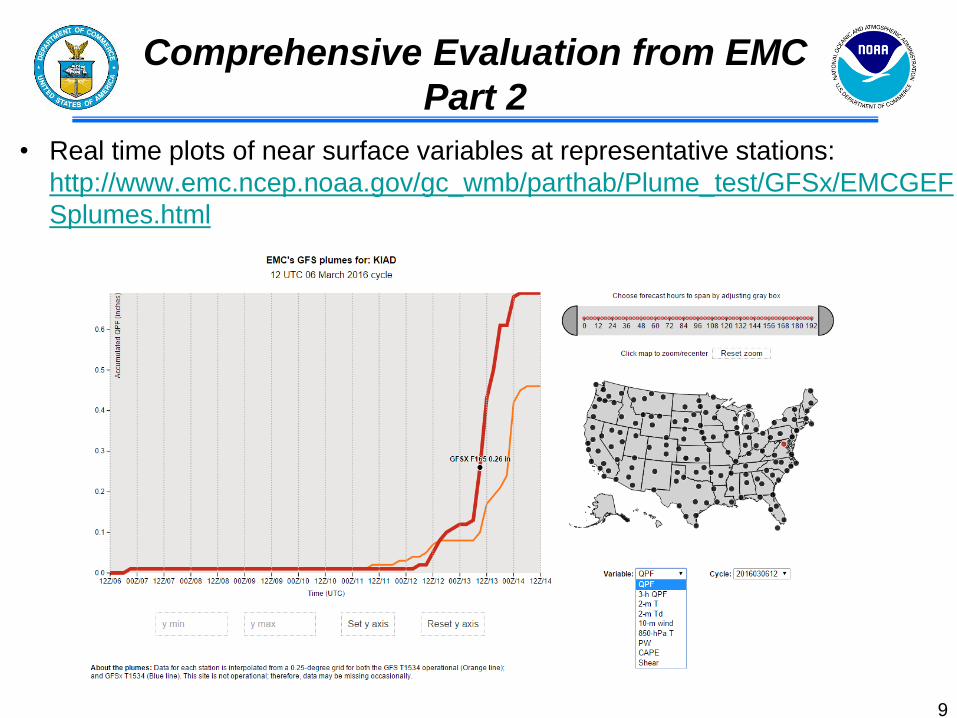
• Real time plots of near surface variables at representative stations:
http://www.emc.ncep.noaa.gov/gc_wmb/parthab/Plume_test/GFSx/EMCGEF
Splumes.html
Comprehensive Evaluation from EMC
Part 2
10
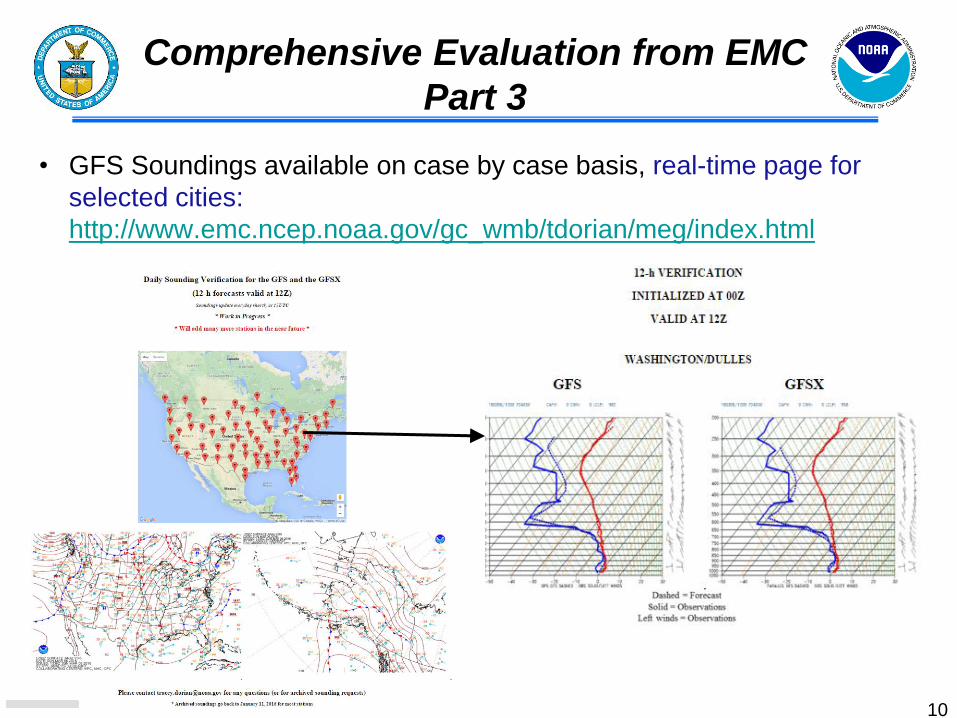
• GFS Soundings available on case by case basis, real-time page for
selected cities:
http://www.emc.ncep.noaa.gov/gc_wmb/tdorian/meg/index.html
Comprehensive Evaluation from EMC
Part 3
11
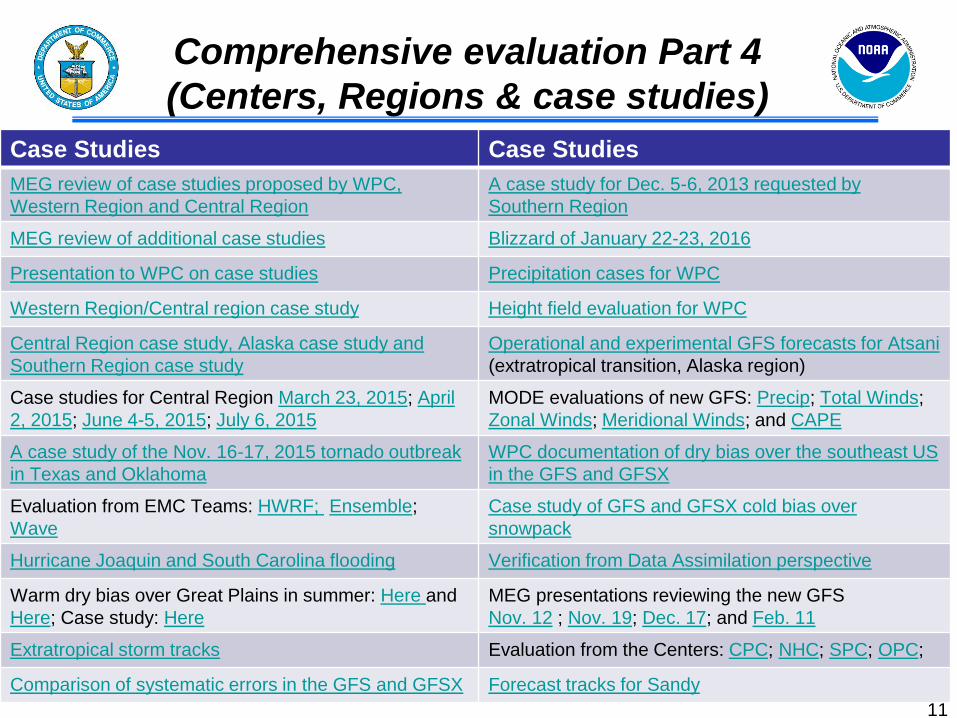
Case Studies Case Studies
MEG review of case studies proposed by WPC,
Western Region and Central Region
A case study for Dec. 5-6, 2013 requested by
Southern Region
MEG review of additional case studies Blizzard of January 22-23, 2016
Presentation to WPC on case studies Precipitation cases for WPC
Western Region/Central region case study Height field evaluation for WPC
Central Region case study, Alaska case study and
Southern Region case study
Operational and experimental GFS forecasts for Atsani
(extratropical transition, Alaska region)
Case studies for Central Region March 23, 2015; April
2, 2015; June 4-5, 2015; July 6, 2015
MODE evaluations of new GFS: Precip; Total Winds;
Zonal Winds; Meridional Winds; and CAPE
A case study of the Nov. 16-17, 2015 tornado outbreak
in Texas and Oklahoma
WPC documentation of dry bias over the southeast US
in the GFS and GFSX
Evaluation from EMC Teams: HWRF; Ensemble;
Wave
Case study of GFS and GFSX cold bias over
snowpack
Hurricane Joaquin and South Carolina flooding Verification from Data Assimilation perspective
Warm dry bias over Great Plains in summer: Here and
Here; Case study: Here
MEG presentations reviewing the new GFS
Nov. 12 ; Nov. 19; Dec. 17; and Feb. 11
Extratropical storm tracks Evaluation from the Centers: CPC; NHC; SPC; OPC;
Comparison of systematic errors in the GFS and GFSX Forecast tracks for Sandy
Comprehensive evaluation Part 4
(Centers, Regions & case studies)
Evaluation of Q3FY16
GDAS/GFS Upgrade:
EMC Perspective
12
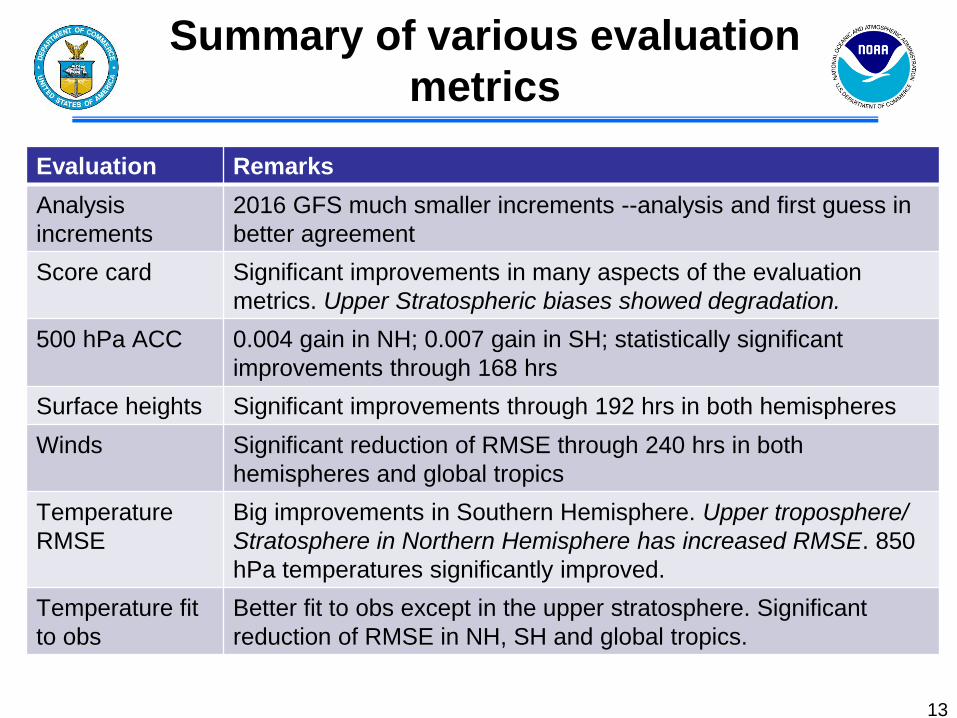
Summary of various evaluation
metrics
Evaluation Remarks
Analysis
increments
2016 GFS much smaller increments --analysis and first guess in
better agreement
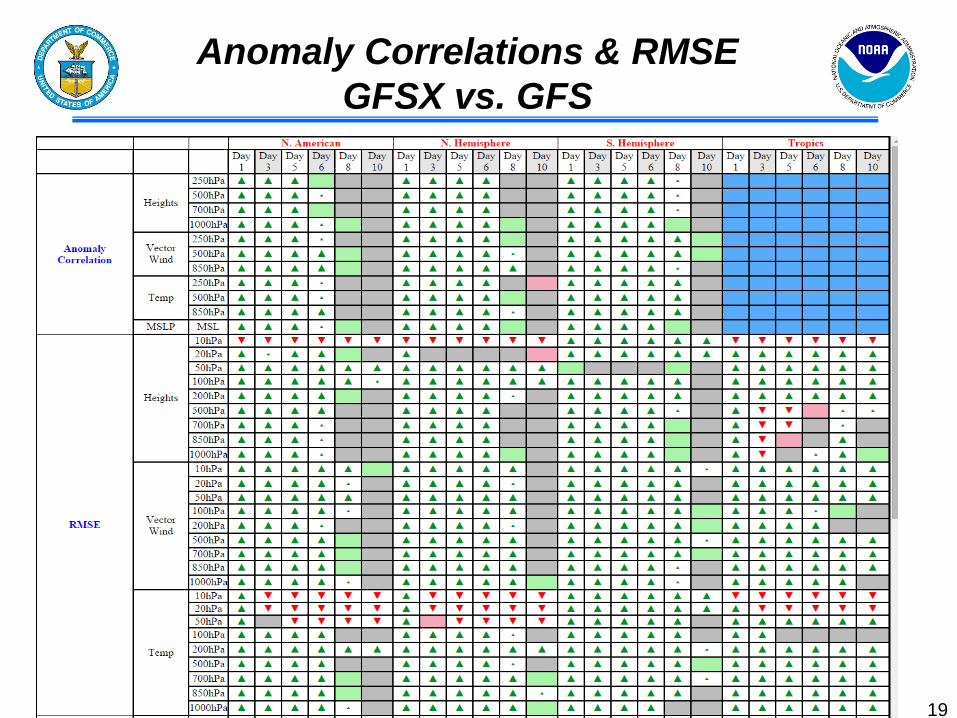
Score card Significant improvements in many aspects of the evaluation
metrics. Upper Stratospheric biases showed degradation.
500 hPa ACC 0.004 gain in NH; 0.007 gain in SH; statistically significant
improvements through 168 hrs
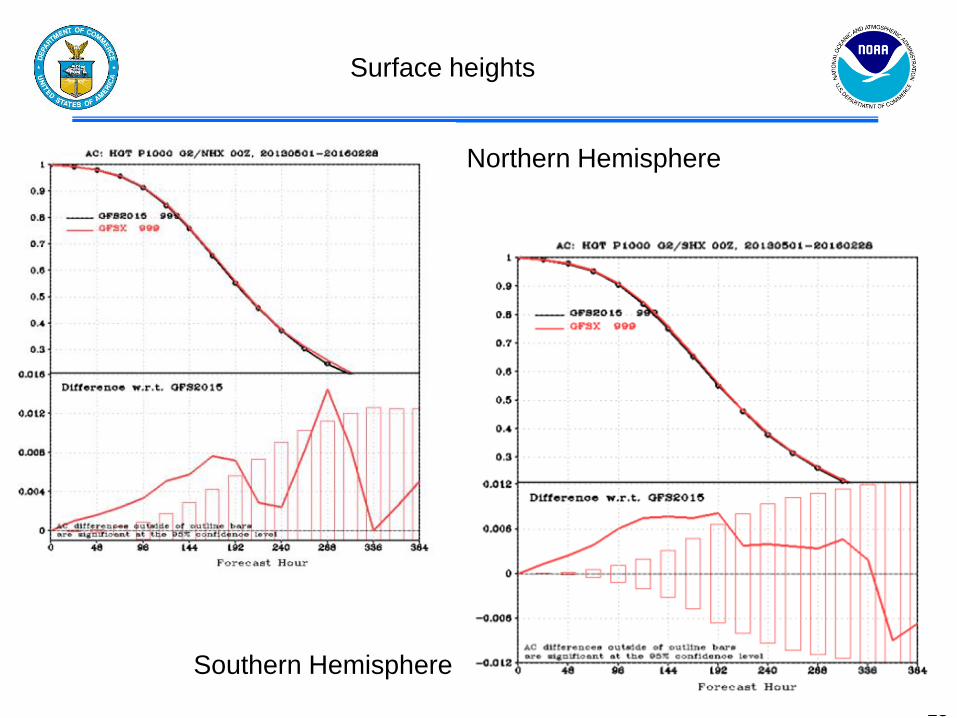
Surface heights Significant improvements through 192 hrs in both hemispheres
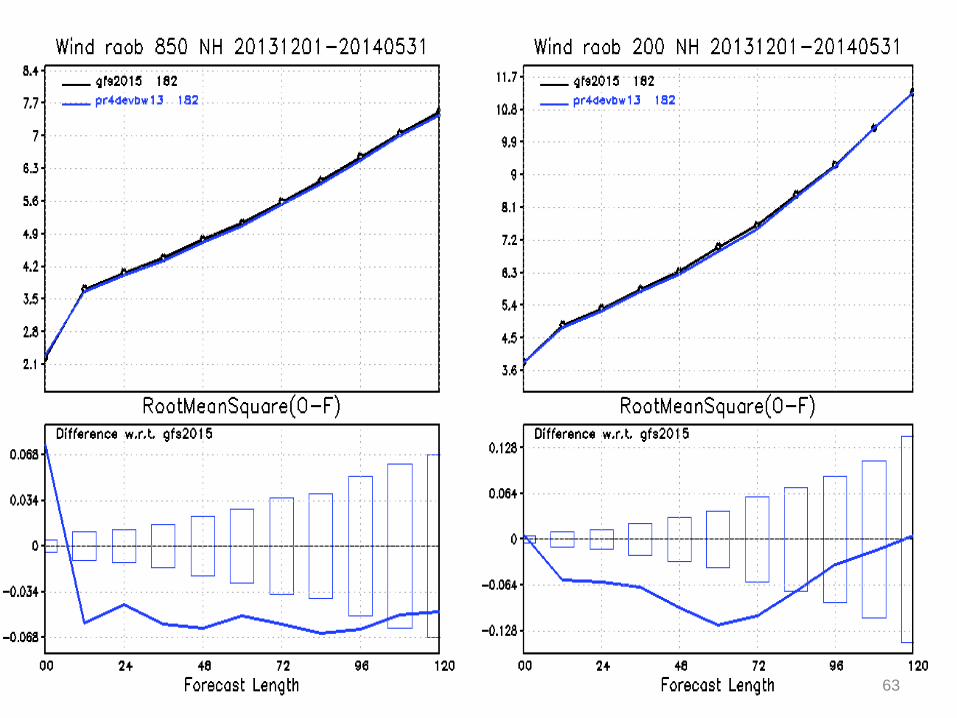
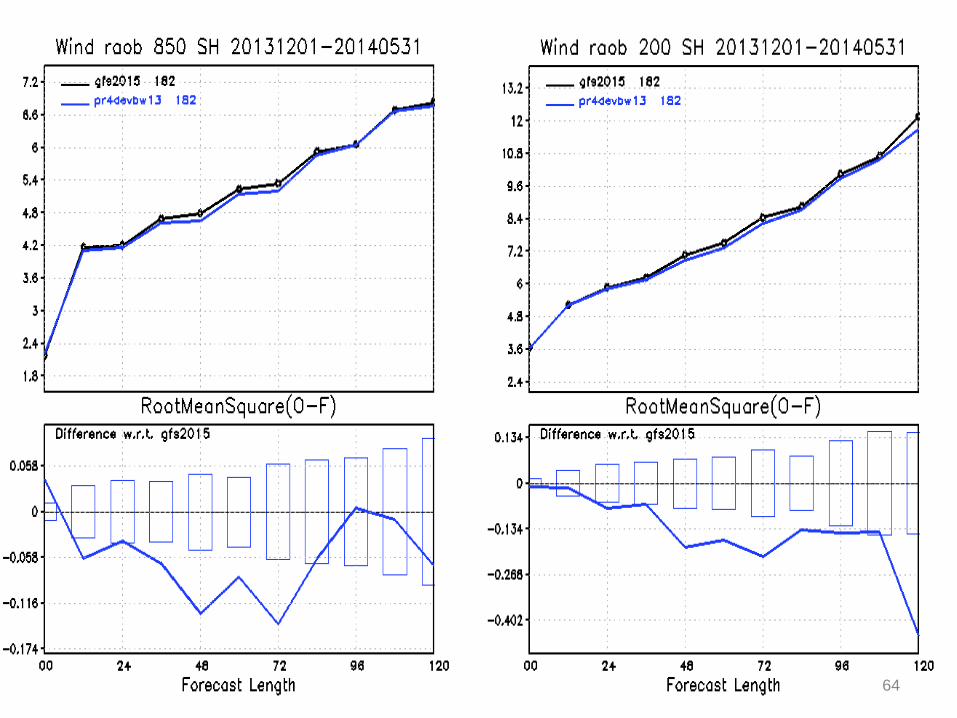
Winds Significant reduction of RMSE through 240 hrs in both
hemispheres and global tropics
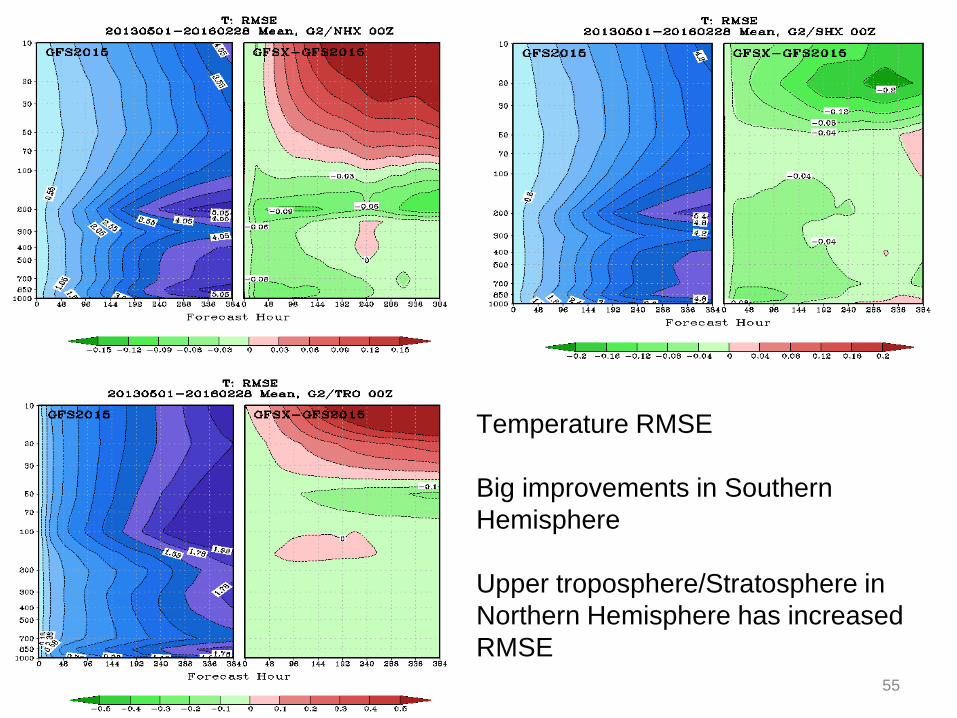
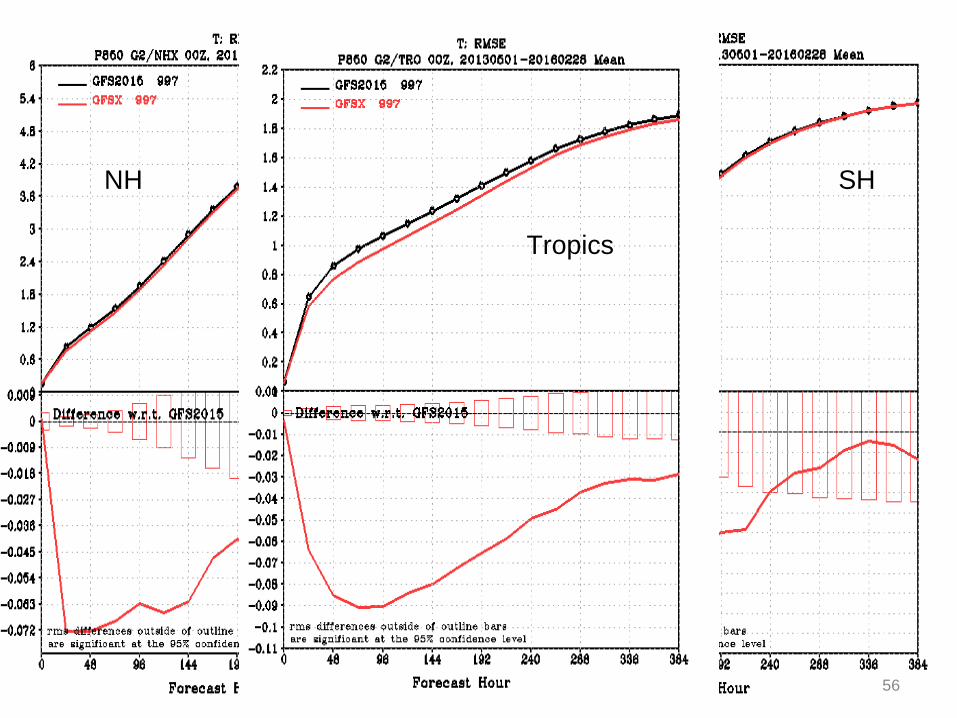
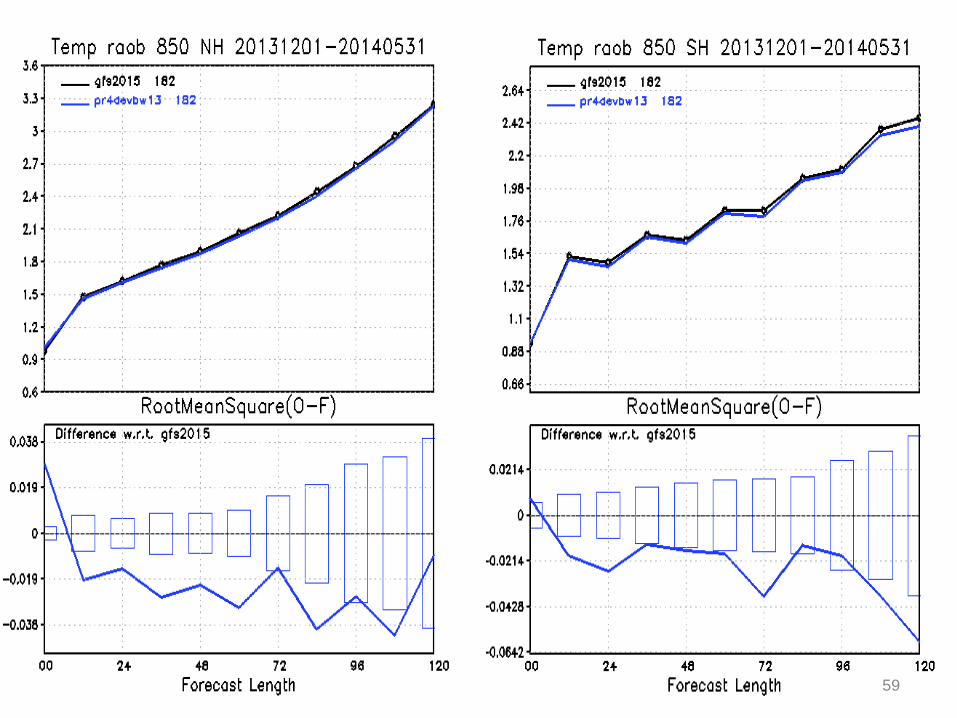
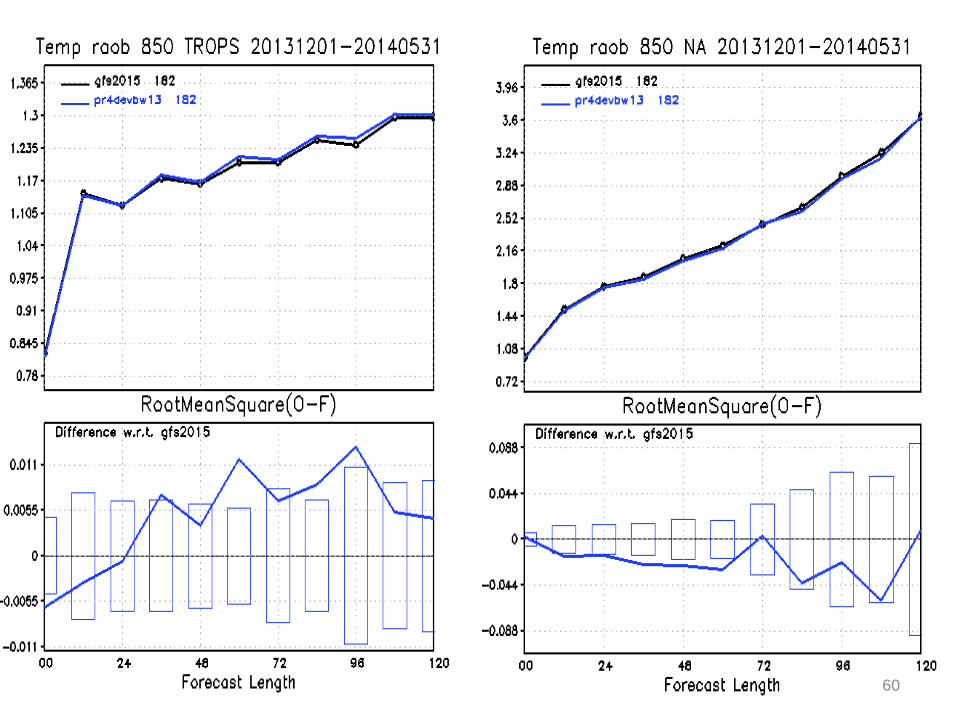
Temperature
RMSE
Big improvements in Southern Hemisphere. Upper troposphere/
Stratosphere in Northern Hemisphere has increased RMSE. 850
hPa temperatures significantly improved.
Temperature fit
to obs
Better fit to obs except in the upper stratosphere. Significant
reduction of RMSE in NH, SH and global tropics.
13
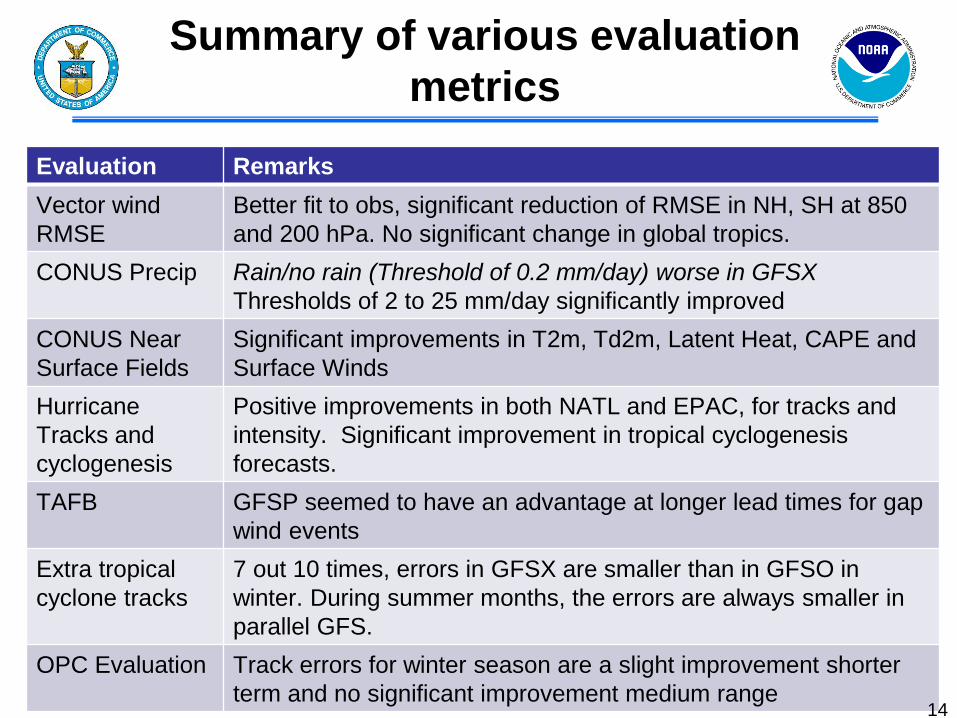
Summary of various evaluation
metrics
Evaluation Remarks
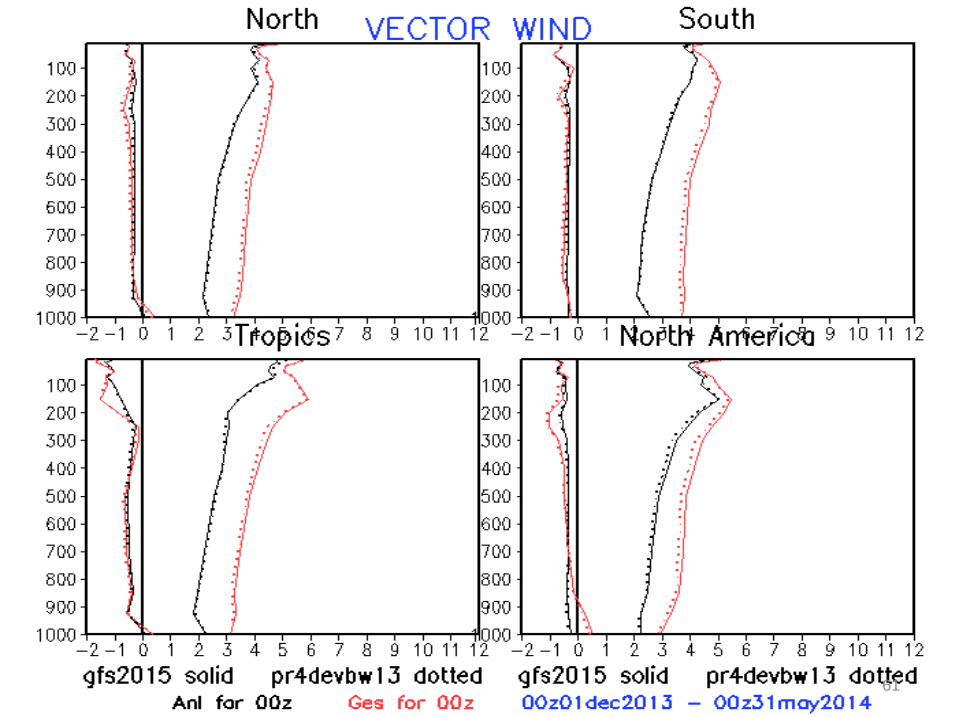
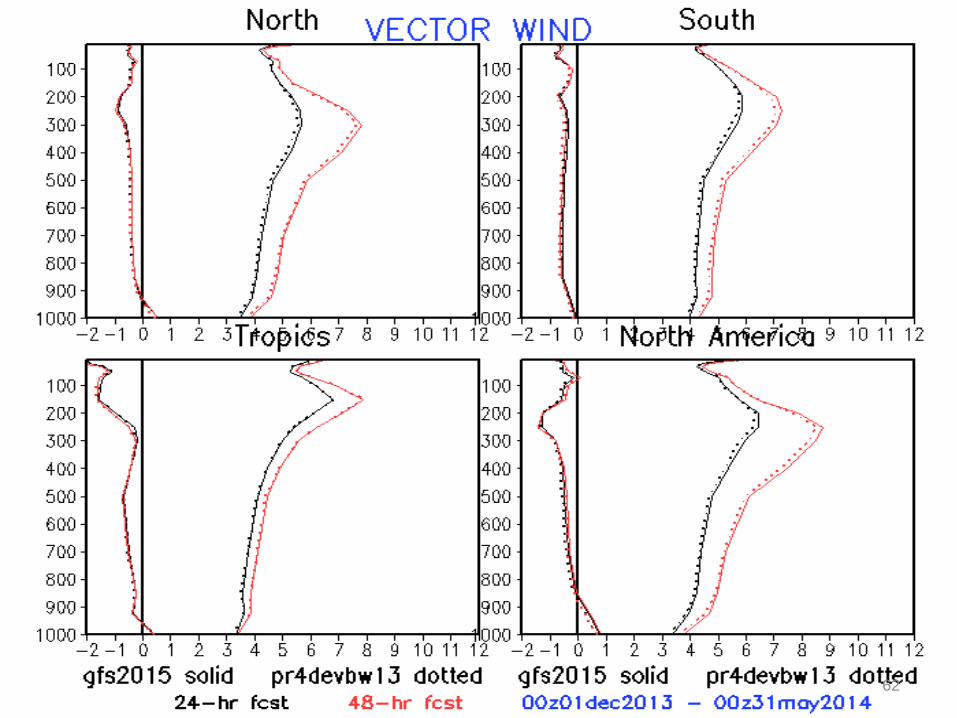
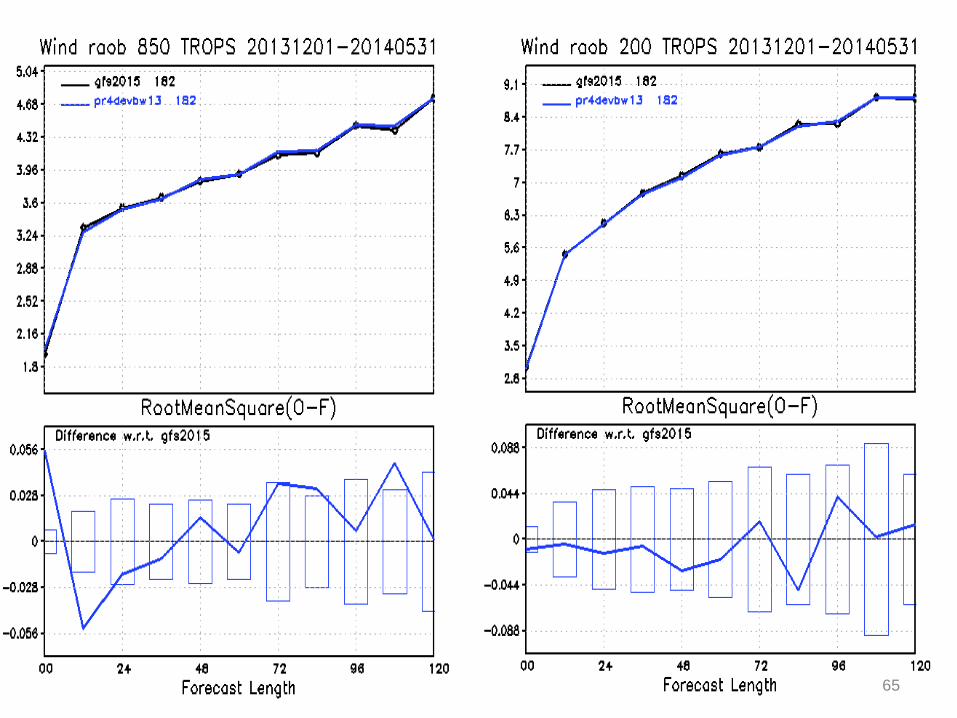
Vector wind
RMSE
Better fit to obs, significant reduction of RMSE in NH, SH at 850
and 200 hPa. No significant change in global tropics.
CONUS Precip Rain/no rain (Threshold of 0.2 mm/day) worse in GFSX
Thresholds of 2 to 25 mm/day significantly improved
CONUS Near
Surface Fields
Significant improvements in T2m, Td2m, Latent Heat, CAPE and
Surface Winds
Hurricane
Tracks and
cyclogenesis
Positive improvements in both NATL and EPAC, for tracks and
intensity. Significant improvement in tropical cyclogenesis
forecasts.
TAFB GFSP seemed to have an advantage at longer lead times for gap
wind events
Extra tropical
cyclone tracks
7 out 10 times, errors in GFSX are smaller than in GFSO in
winter. During summer months, the errors are always smaller in
parallel GFS.
OPC Evaluation Track errors for winter season are a slight improvement shorter
term and no significant improvement medium range 14
Summary of various evaluation
metrics
Evaluation Remarks
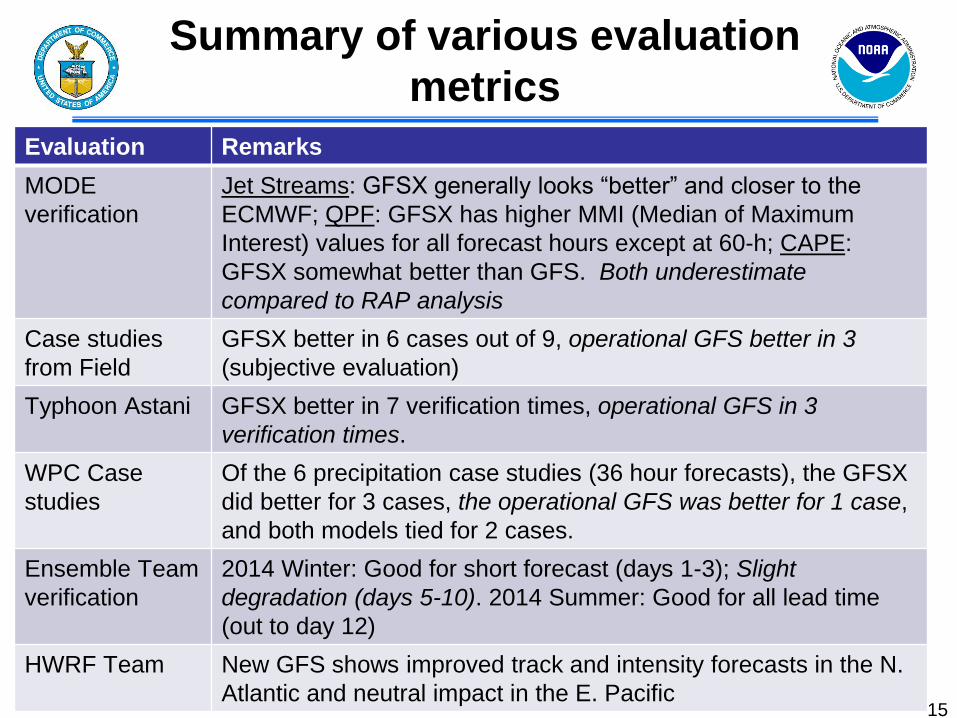
MODE
verification
Jet Streams: GFSX generally looks “better” and closer to the
ECMWF; QPF: GFSX has higher MMI (Median of Maximum
Interest) values for all forecast hours except at 60-h; CAPE:
GFSX somewhat better than GFS. Both underestimate
compared to RAP analysis
Case studies
from Field
GFSX better in 6 cases out of 9, operational GFS better in 3
(subjective evaluation)
Typhoon Astani GFSX better in 7 verification times, operational GFS in 3
verification times.
WPC Case
studies
Of the 6 precipitation case studies (36 hour forecasts), the GFSX
did better for 3 cases, the operational GFS was better for 1 case,
and both models tied for 2 cases.
Ensemble Team
verification
2014 Winter: Good for short forecast (days 1-3); Slight
degradation (days 5-10). 2014 Summer: Good for all lead time
(out to day 12)
HWRF Team New GFS shows improved track and intensity forecasts in the N.
Atlantic and neutral impact in the E. Pacific 15
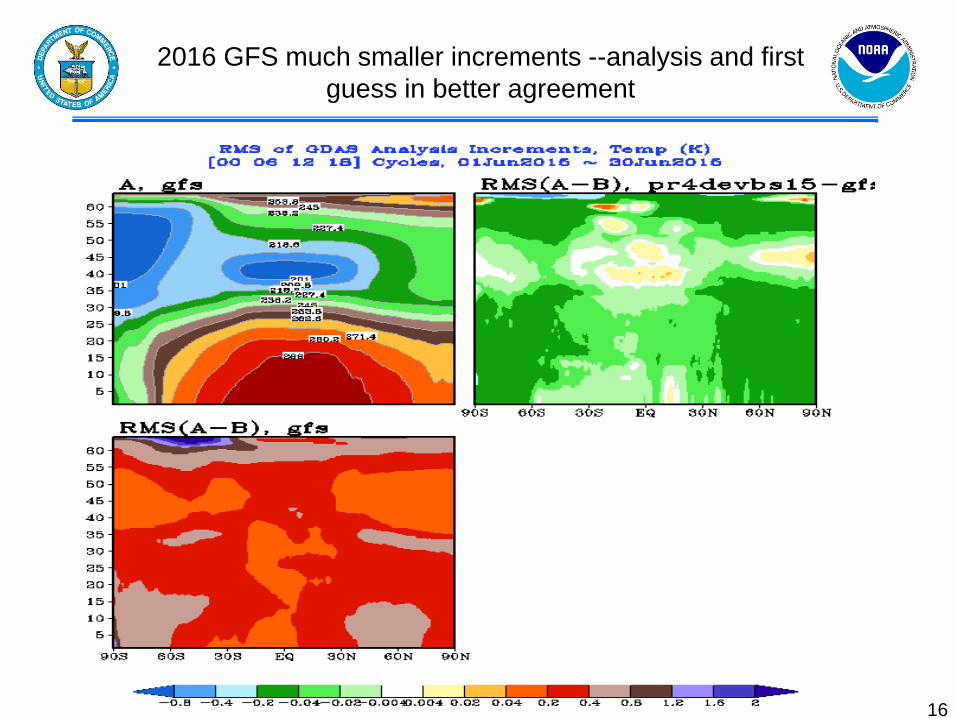
2016 GFS much smaller increments --analysis and first
guess in better agreement
16
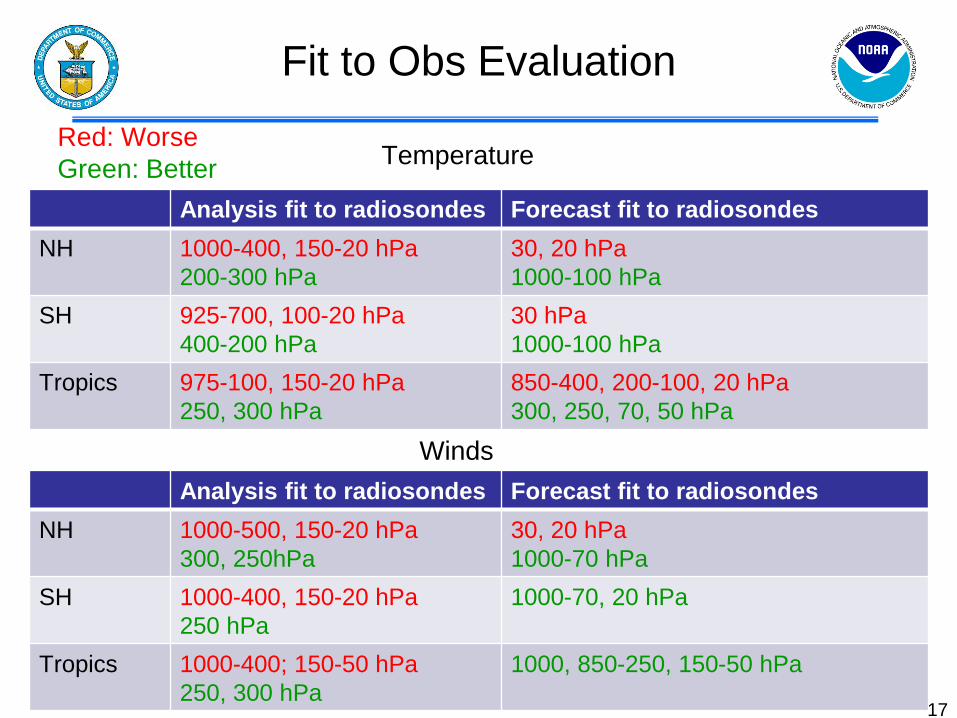
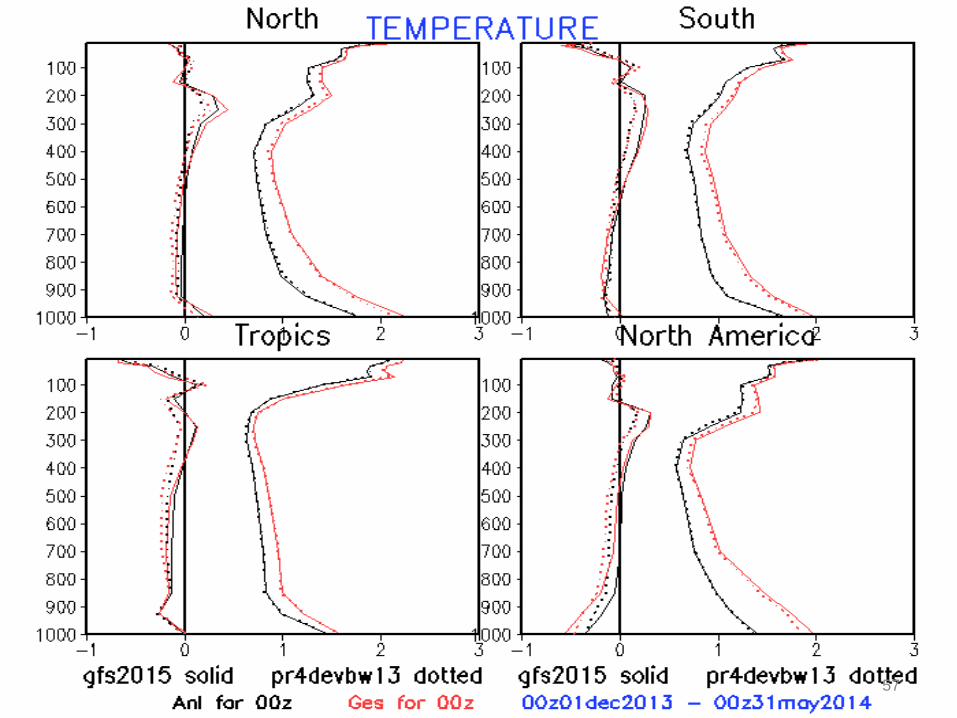
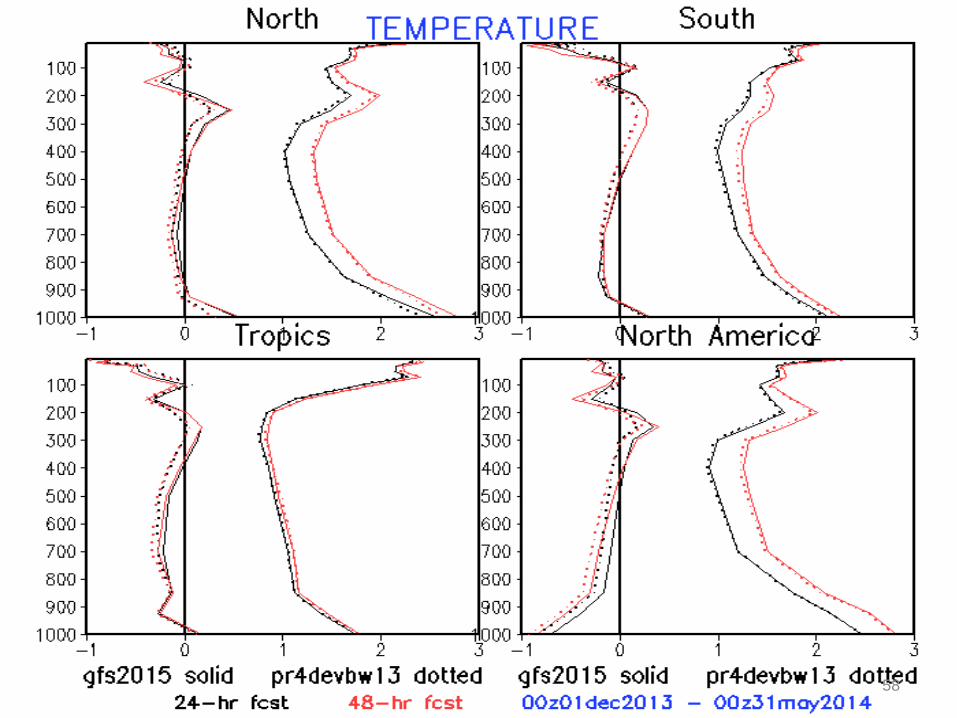
Fit to Obs Evaluation
Analysis fit to radiosondes Forecast fit to radiosondes
NH 1000-400, 150-20 hPa
200-300 hPa
30, 20 hPa
1000-100 hPa
SH 925-700, 100-20 hPa
400-200 hPa
30 hPa
1000-100 hPa
Tropics 975-100, 150-20 hPa
250, 300 hPa
850-400, 200-100, 20 hPa
300, 250, 70, 50 hPa
Temperature
Winds
Analysis fit to radiosondes Forecast fit to radiosondes
NH 1000-500, 150-20 hPa
300, 250hPa
30, 20 hPa
1000-70 hPa
SH 1000-400, 150-20 hPa
250 hPa
1000-70, 20 hPa
Tropics 1000-400; 150-50 hPa
250, 300 hPa
1000, 850-250, 150-50 hPa
Red: Worse
Green: Better
17
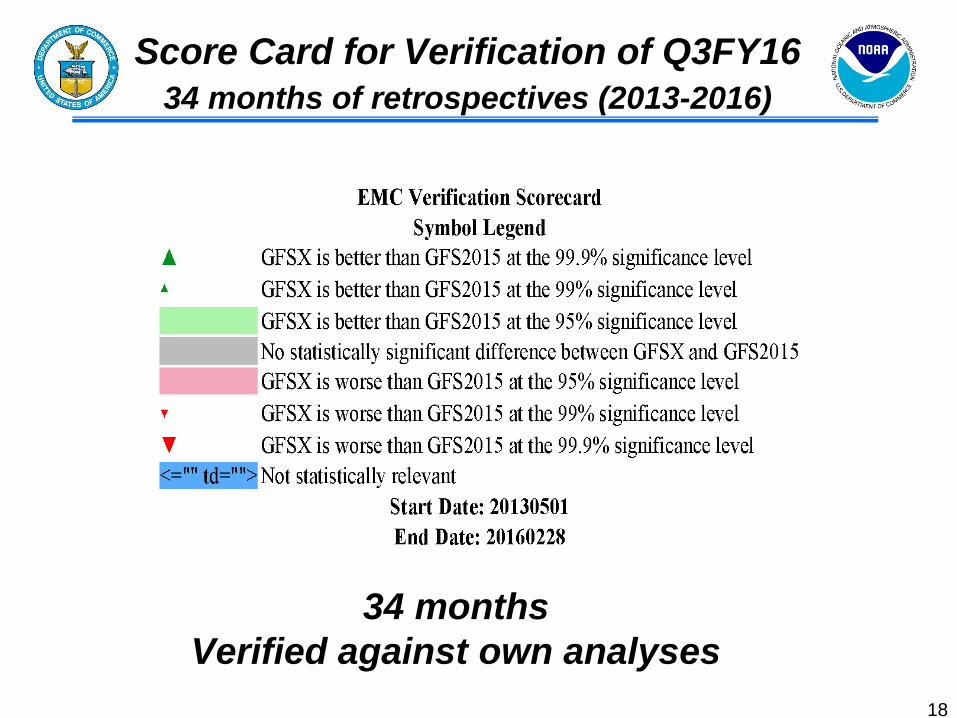
34 months
Verified against own analyses
Score Card for Verification of Q3FY16
34 months of retrospectives (2013-2016)
18
19
Anomaly Correlations & RMSE
GFSX vs. GFS
20
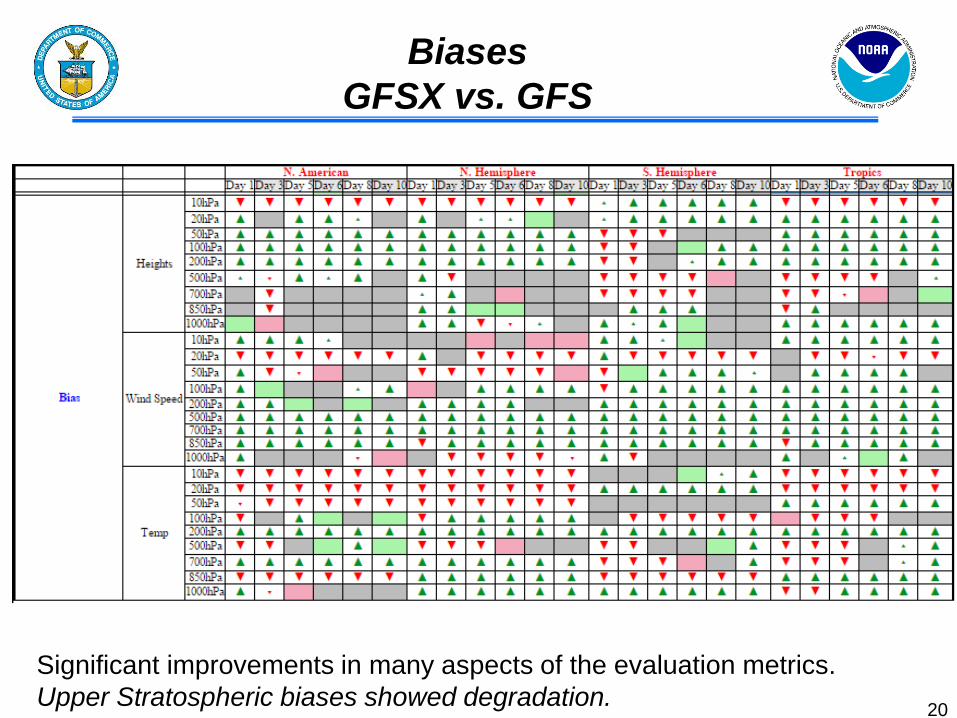
Biases
GFSX vs. GFS
Significant improvements in many aspects of the evaluation metrics.
Upper Stratospheric biases showed degradation.
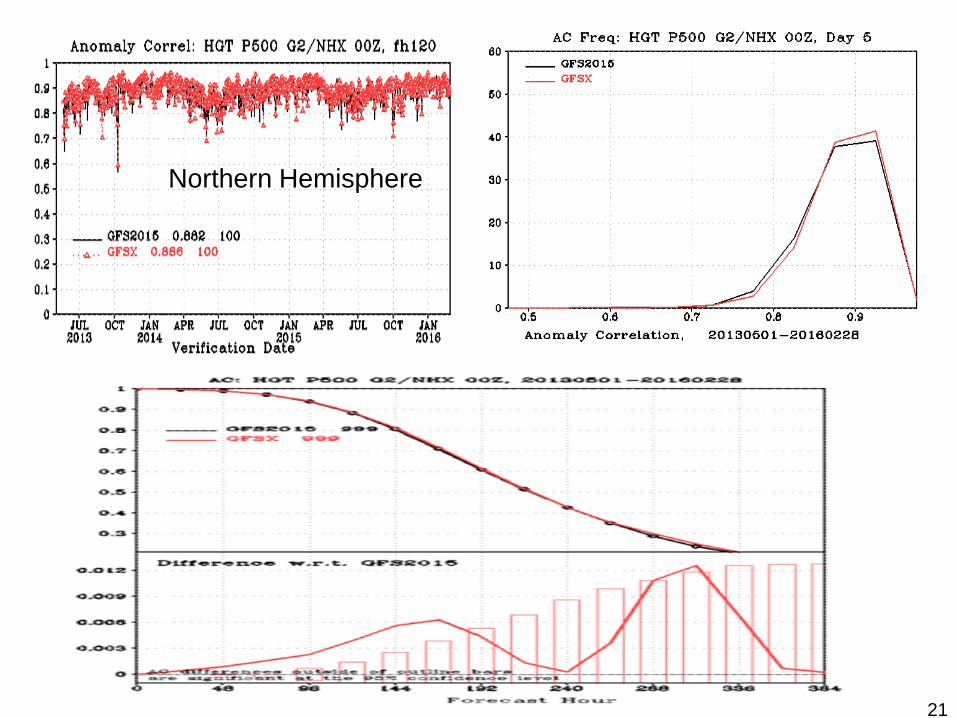
Northern Hemisphere
21
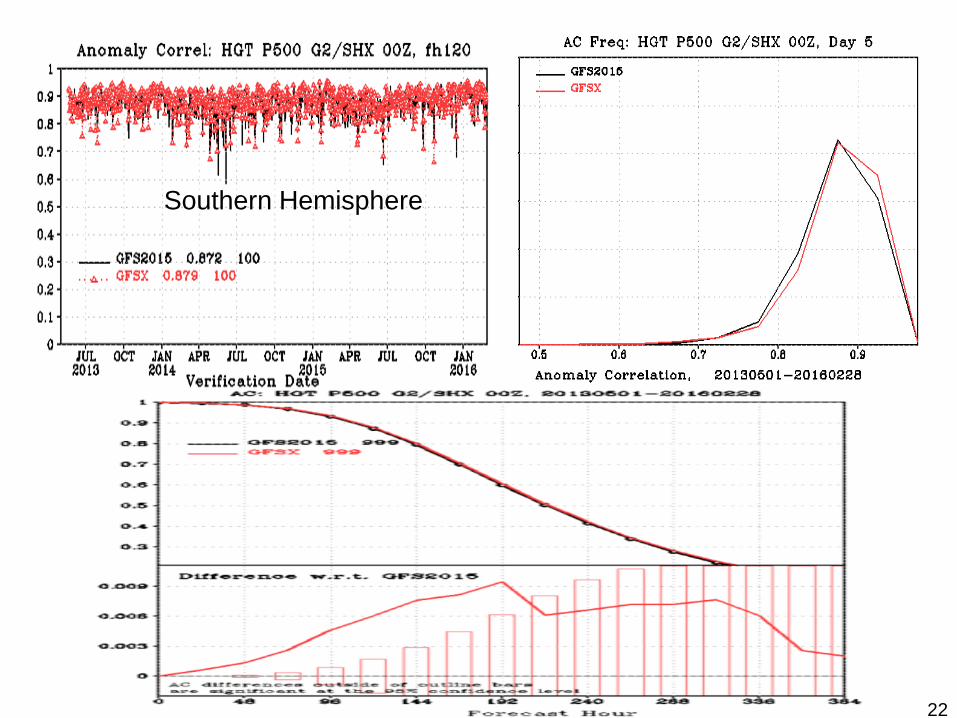
Southern Hemisphere
22
Northern Hemisphere
Southern Hemisphere
Surface heights
23
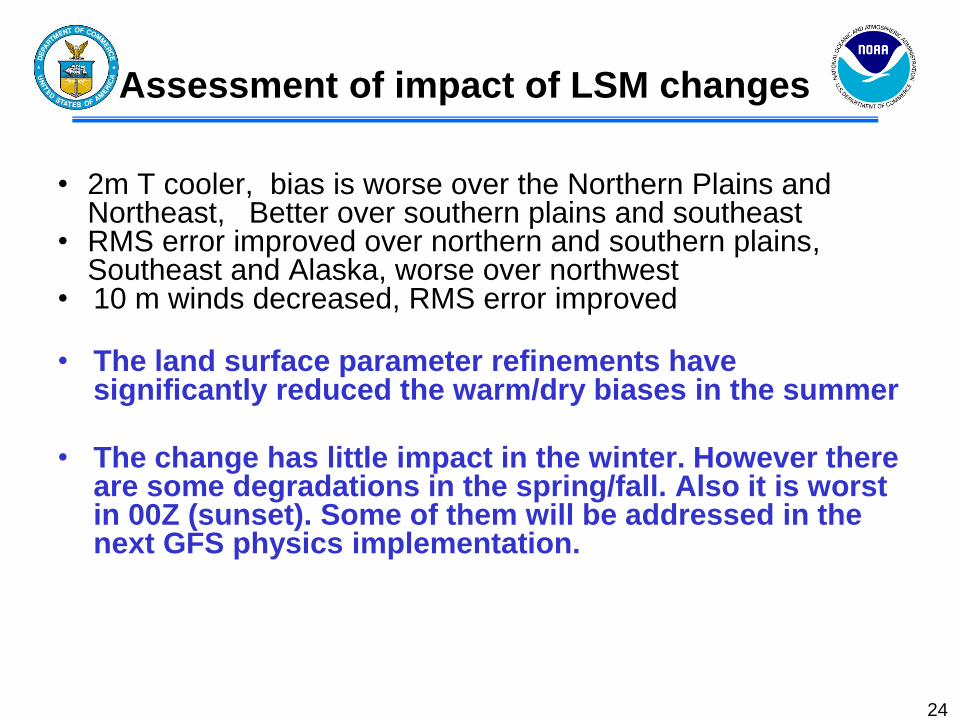
Assessment of impact of LSM changes
• 2m T cooler, bias is worse over the Northern Plains and Northeast, Better over southern plains and southeast
• RMS error improved over northern and southern plains, Southeast and Alaska, worse over northwest
• 10 m winds decreased, RMS error improved • The land surface parameter refinements have
significantly reduced the warm/dry biases in the summer • The change has little impact in the winter. However there
are some degradations in the spring/fall. Also it is worst in 00Z (sunset). Some of them will be addressed in the next GFS physics implementation.
24
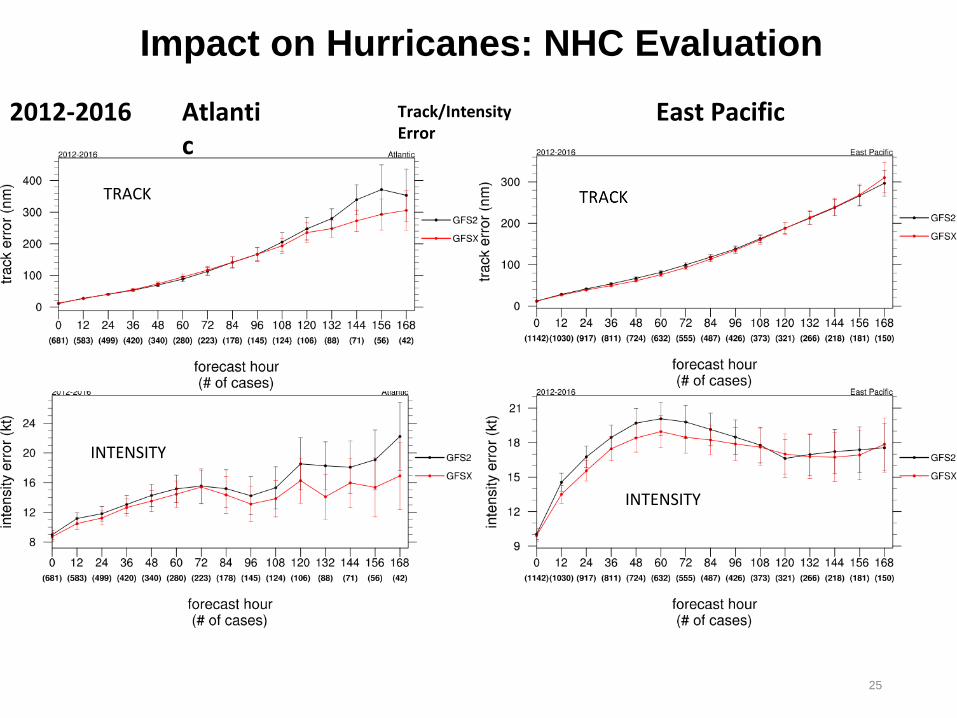
Atlantic
East Pacific 2012-2016 Track/Intensity Error
TRACK
INTENSITY
INTENSITY
Impact on Hurricanes: NHC Evaluation
25
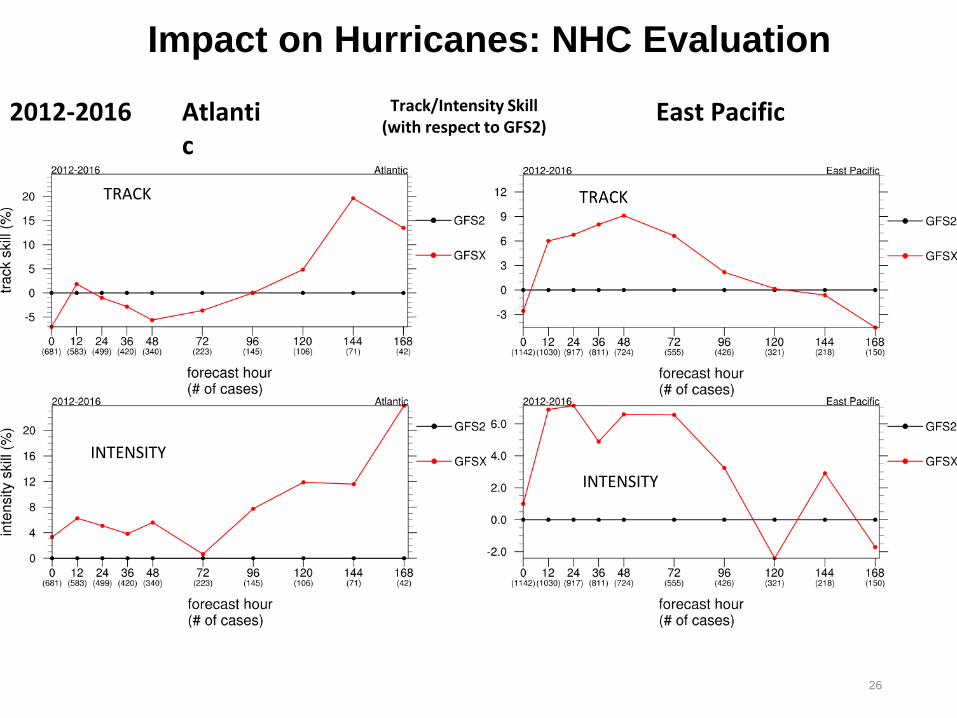
Atlantic
East Pacific 2012-2016 Track/Intensity Skill (with respect to GFS2)
TRACK
INTENSITY
INTENSITY
Impact on Hurricanes: NHC Evaluation
26
Atlantic East Pacific
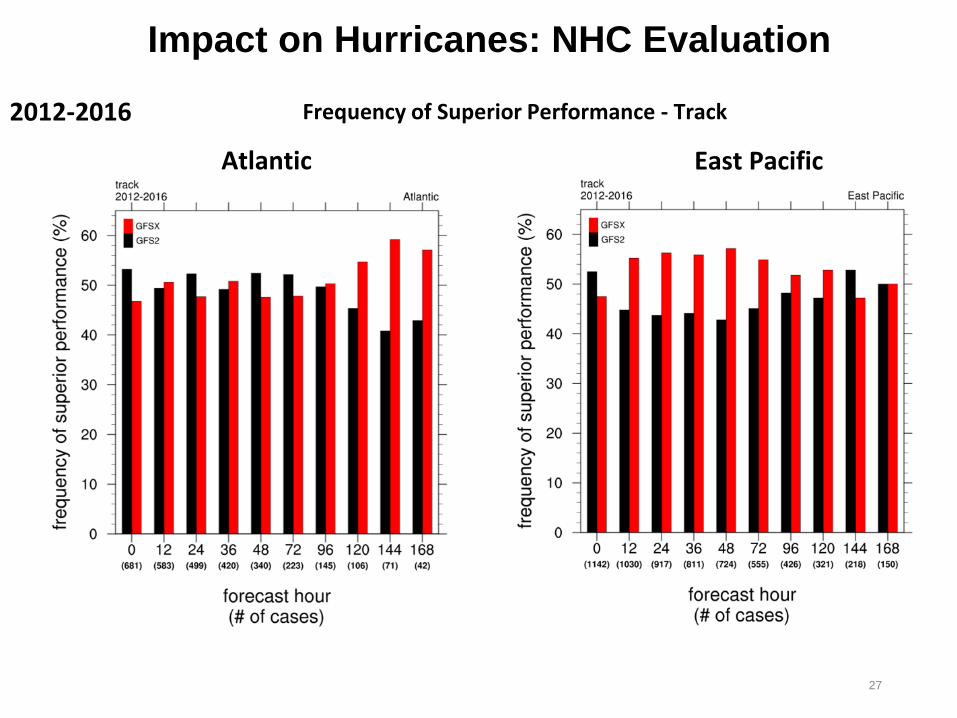
2012-2016 Frequency of Superior Performance - Track
Impact on Hurricanes: NHC Evaluation
27
Atlantic East Pacific
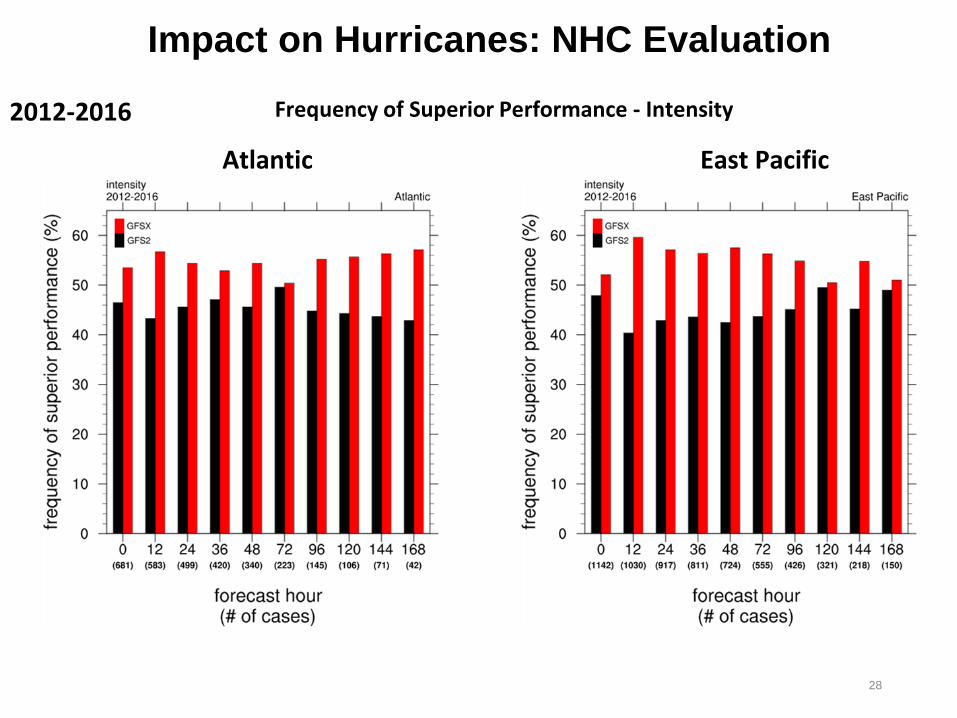
2012-2016 Frequency of Superior Performance - Intensity
Impact on Hurricanes: NHC Evaluation
28
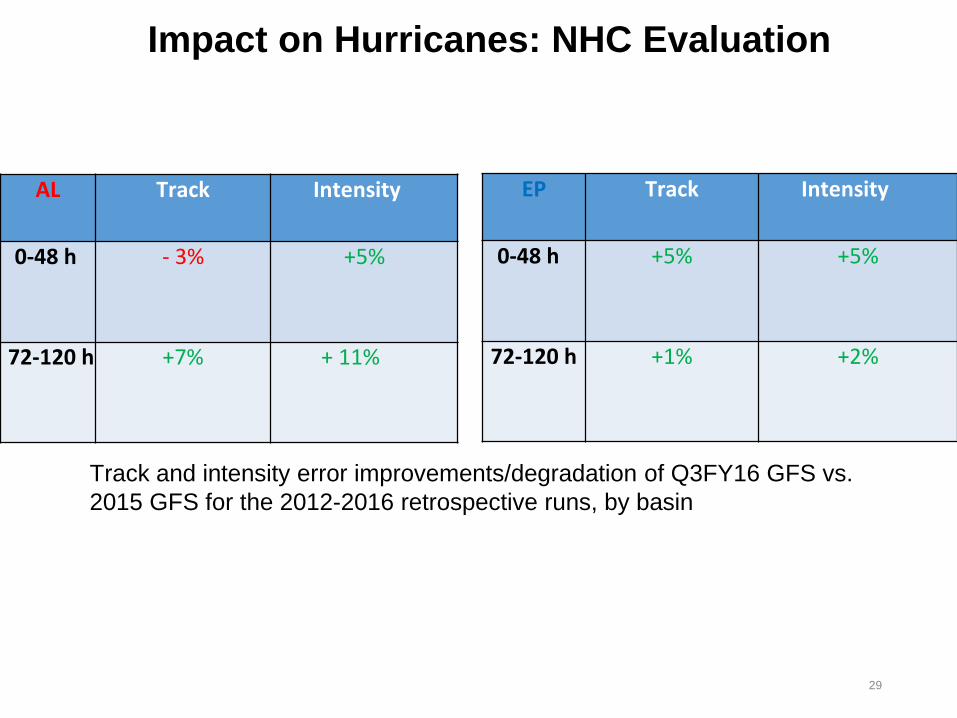
AL Track Intensity
0-48 h - 3% +5%
72-120 h +7% + 11%
EP Track Intensity
0-48 h +5% +5%
72-120 h +1% +2%
Track and intensity error improvements/degradation of Q3FY16 GFS vs.
2015 GFS for the 2012-2016 retrospective runs, by basin
Impact on Hurricanes: NHC Evaluation
29
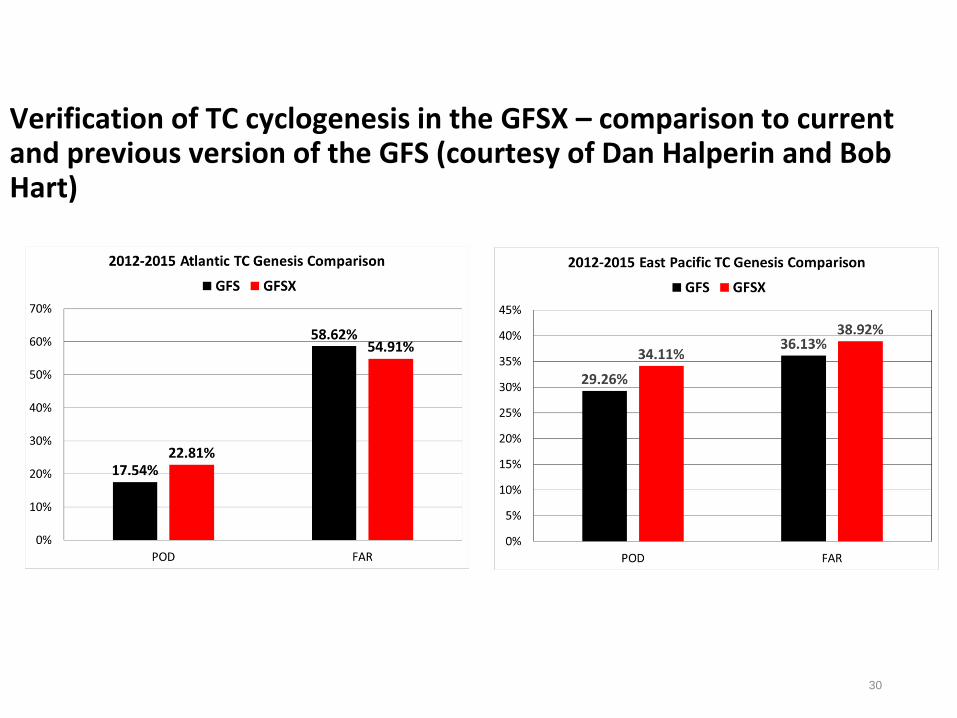
Verification of TC cyclogenesis in the GFSX – comparison to current and previous version of the GFS (courtesy of Dan Halperin and Bob Hart)
30
Comments from NHC and TAFB
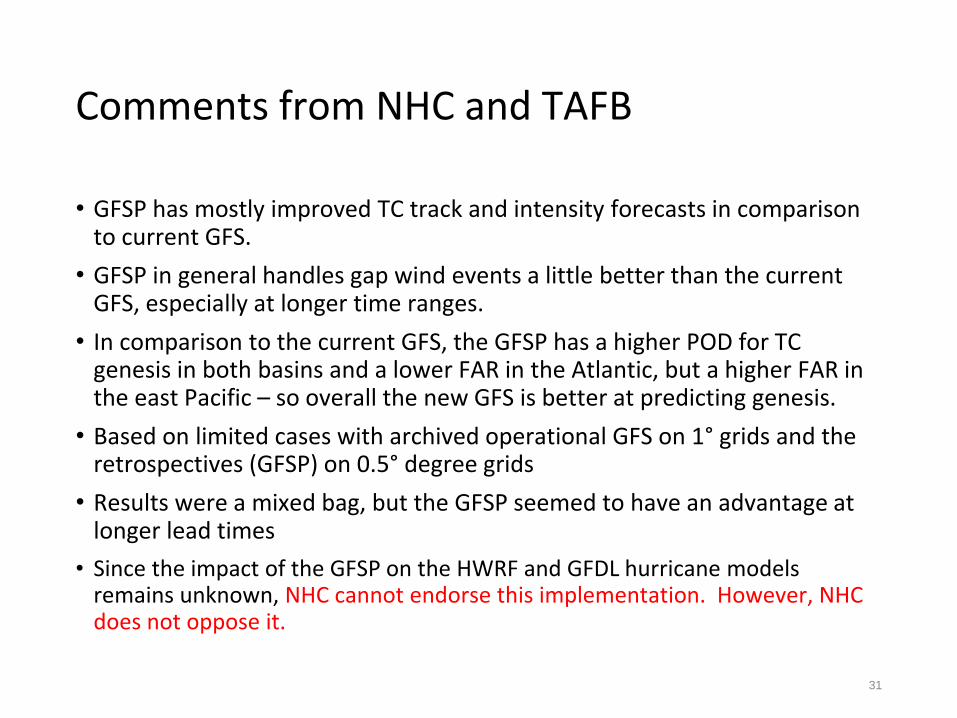
• GFSP has mostly improved TC track and intensity forecasts in comparison to current GFS.
• GFSP in general handles gap wind events a little better than the current GFS, especially at longer time ranges.
• In comparison to the current GFS, the GFSP has a higher POD for TC genesis in both basins and a lower FAR in the Atlantic, but a higher FAR in the east Pacific – so overall the new GFS is better at predicting genesis.
• Based on limited cases with archived operational GFS on 1° grids and the retrospectives (GFSP) on 0.5° degree grids
• Results were a mixed bag, but the GFSP seemed to have an advantage at longer lead times
• Since the impact of the GFSP on the HWRF and GFDL hurricane models remains unknown, NHC cannot endorse this implementation. However, NHC does not oppose it.
31
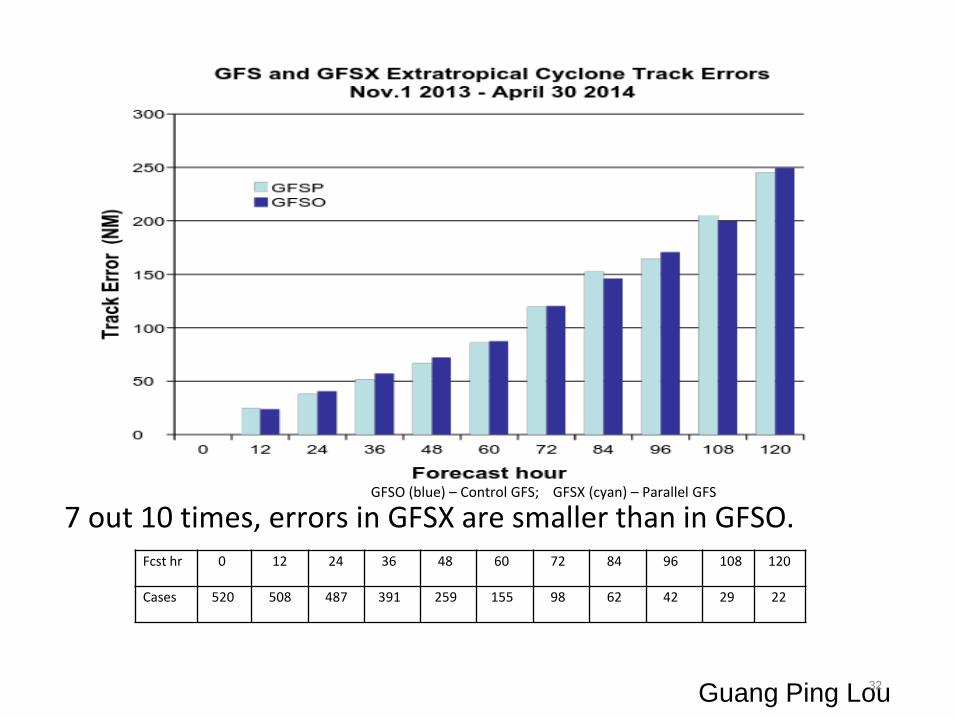
GFSO (blue) – Control GFS; GFSX (cyan) – Parallel GFS
7 out 10 times, errors in GFSX are smaller than in GFSO. Fcst hr 0 12 24 36 48 60 72 84 96 108 120
Cases 520 508 487 391 259 155 98 62 42 29 22
Guang Ping Lou 32
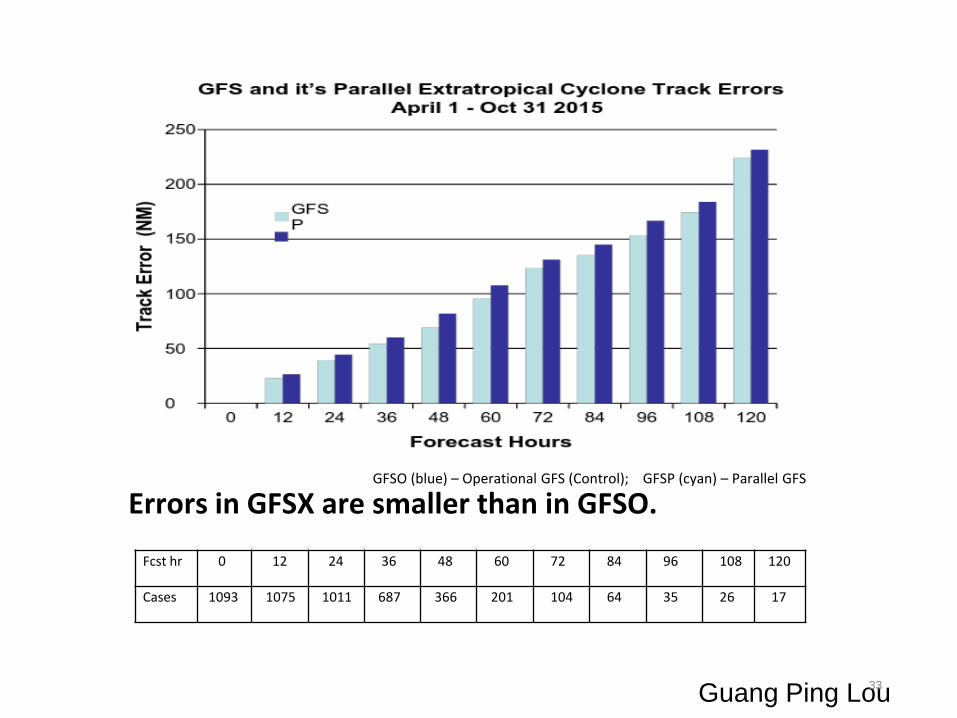
GFSO (blue) – Operational GFS (Control); GFSP (cyan) – Parallel GFS
Errors in GFSX are smaller than in GFSO.
Fcst hr 0 12 24 36 48 60 72 84 96 108 120
Cases 1093 1075 1011 687 366 201 104 64 35 26 17
Guang Ping Lou 33
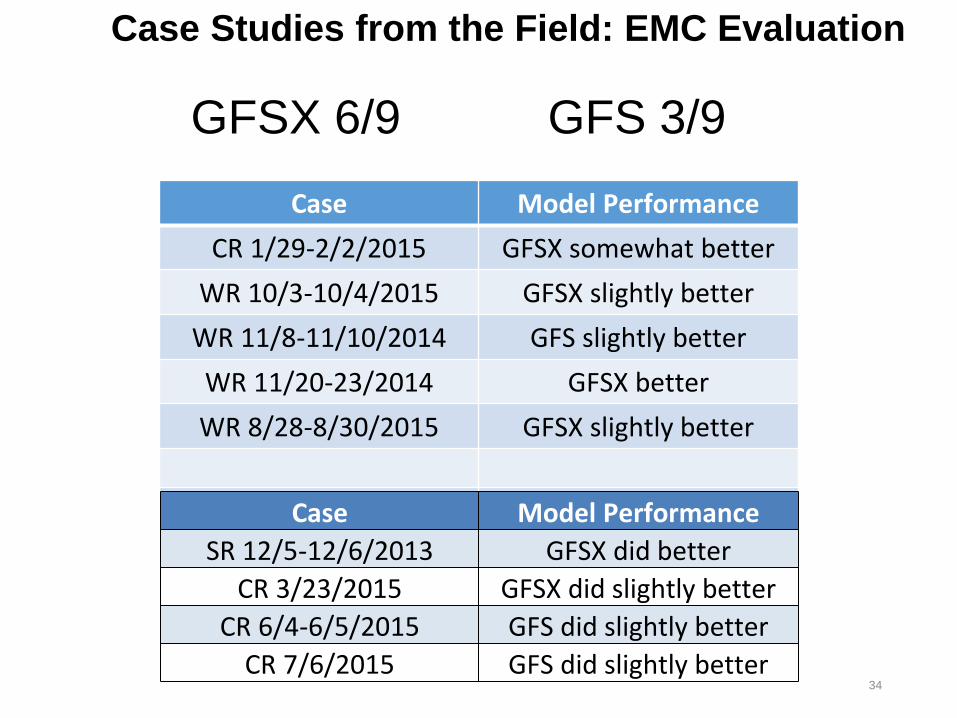
Case Model Performance
CR 1/29-2/2/2015 GFSX somewhat better
WR 10/3-10/4/2015 GFSX slightly better
WR 11/8-11/10/2014 GFS slightly better
WR 11/20-23/2014 GFSX better
WR 8/28-8/30/2015 GFSX slightly better
Case Model Performance
SR 12/5-12/6/2013 GFSX did better
CR 3/23/2015 GFSX did slightly better
CR 6/4-6/5/2015 GFS did slightly better
CR 7/6/2015 GFS did slightly better
GFSX 6/9 GFS 3/9
Case Studies from the Field: EMC Evaluation
34
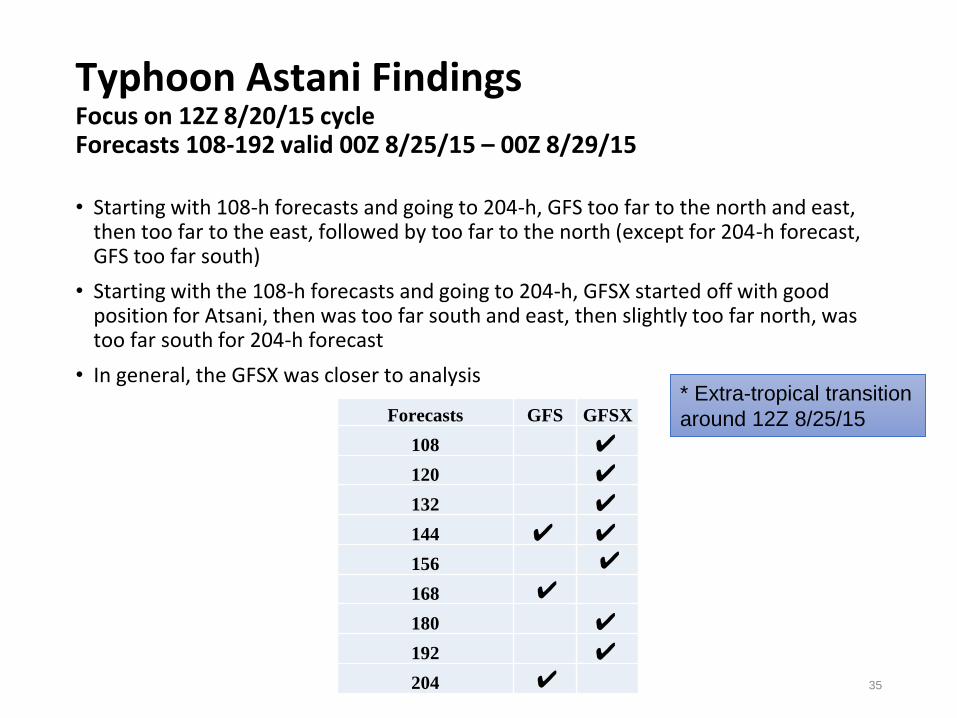
Typhoon Astani Findings Focus on 12Z 8/20/15 cycle Forecasts 108-192 valid 00Z 8/25/15 – 00Z 8/29/15
• Starting with 108-h forecasts and going to 204-h, GFS too far to the north and east, then too far to the east, followed by too far to the north (except for 204-h forecast, GFS too far south)
• Starting with the 108-h forecasts and going to 204-h, GFSX started off with good position for Atsani, then was too far south and east, then slightly too far north, was too far south for 204-h forecast
• In general, the GFSX was closer to analysis
Forecasts GFS GFSX
108 ✔
120 ✔
132 ✔
144 ✔ ✔
156 ✔
168 ✔
180 ✔
192 ✔
204 ✔
* Extra-tropical transition
around 12Z 8/25/15
35
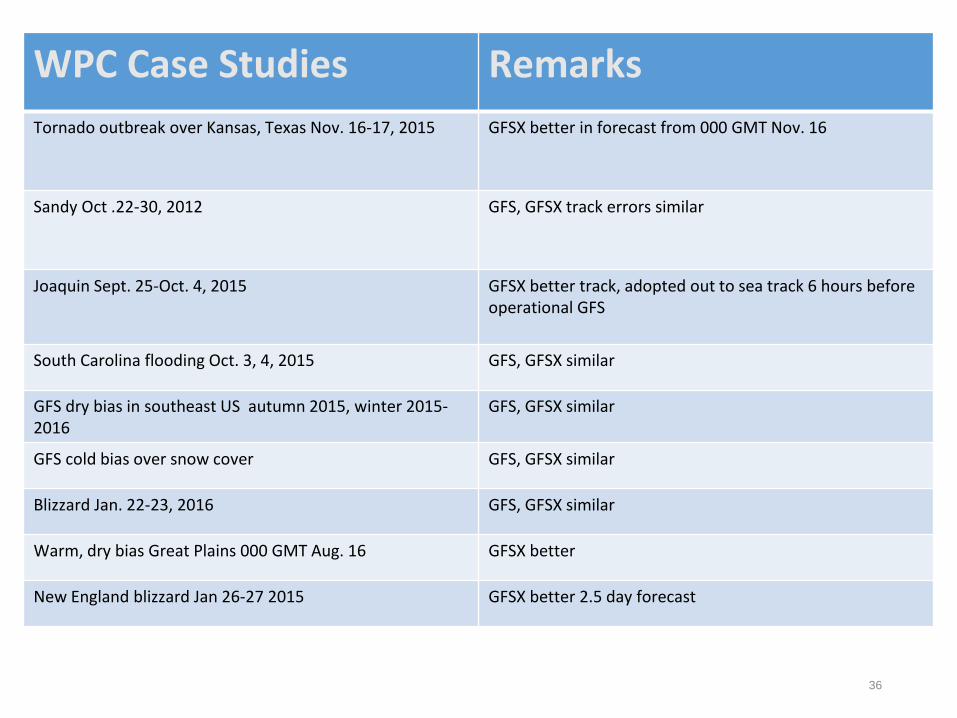
WPC Case Studies Remarks
Tornado outbreak over Kansas, Texas Nov. 16-17, 2015 GFSX better in forecast from 000 GMT Nov. 16
Sandy Oct .22-30, 2012 GFS, GFSX track errors similar
Joaquin Sept. 25-Oct. 4, 2015 GFSX better track, adopted out to sea track 6 hours before operational GFS
South Carolina flooding Oct. 3, 4, 2015 GFS, GFSX similar
GFS dry bias in southeast US autumn 2015, winter 2015-2016
GFS, GFSX similar
GFS cold bias over snow cover GFS, GFSX similar
Blizzard Jan. 22-23, 2016 GFS, GFSX similar
Warm, dry bias Great Plains 000 GMT Aug. 16 GFSX better
New England blizzard Jan 26-27 2015 GFSX better 2.5 day forecast
36
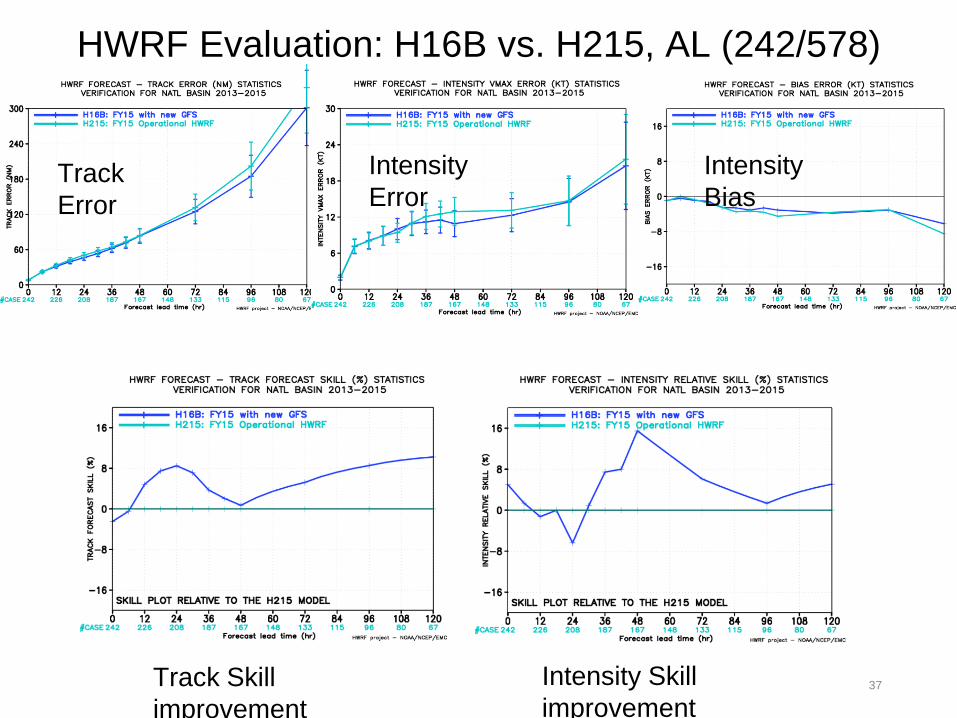
HWRF Evaluation: H16B vs. H215, AL (242/578)
Track
Error
Intensity
Error
Intensity
Bias
Track Skill
improvement
Intensity Skill
improvement 37
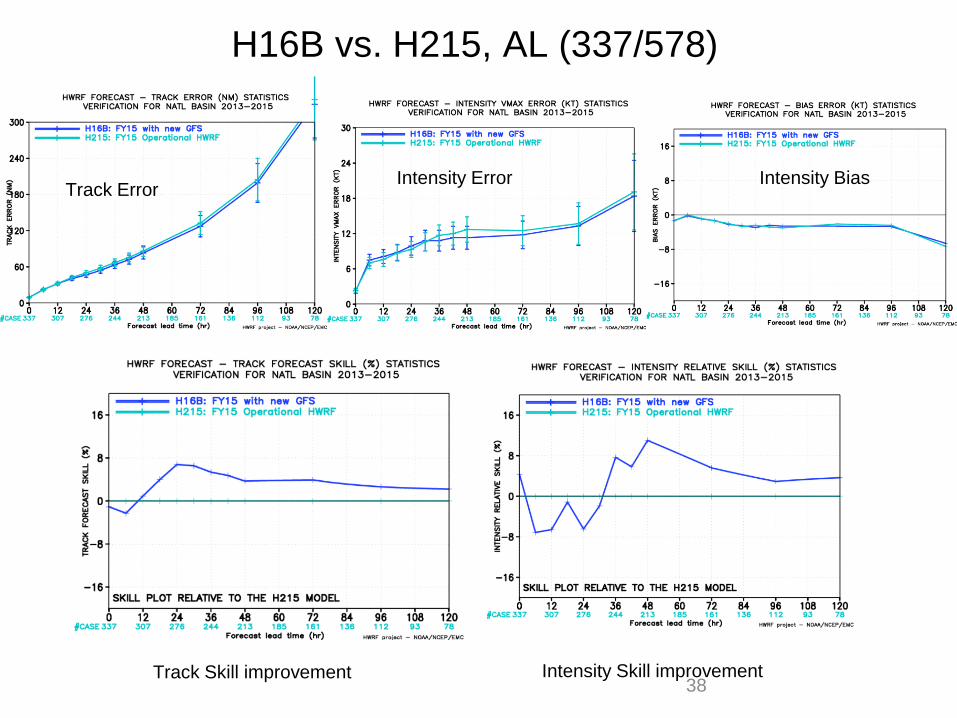
H16B vs. H215, AL (337/578)
Track Skill improvement Intensity Skill improvement 38
Track Error Intensity Error Intensity Bias
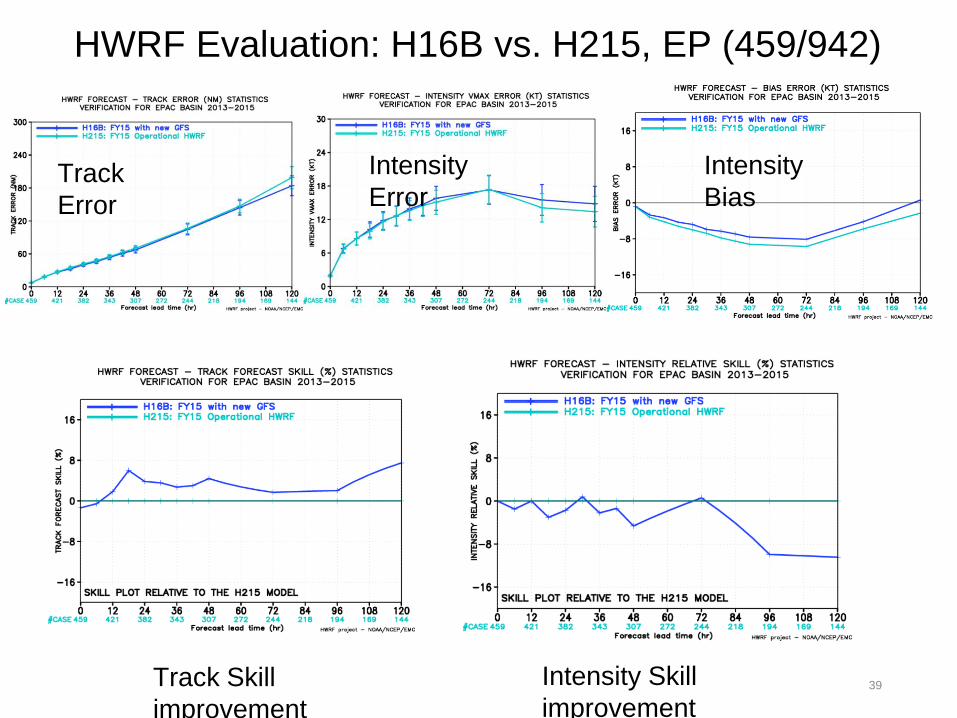
HWRF Evaluation: H16B vs. H215, EP (459/942)
Track Skill
improvement
Intensity Skill
improvement
Track
Error
Intensity
Error
Intensity
Bias
39
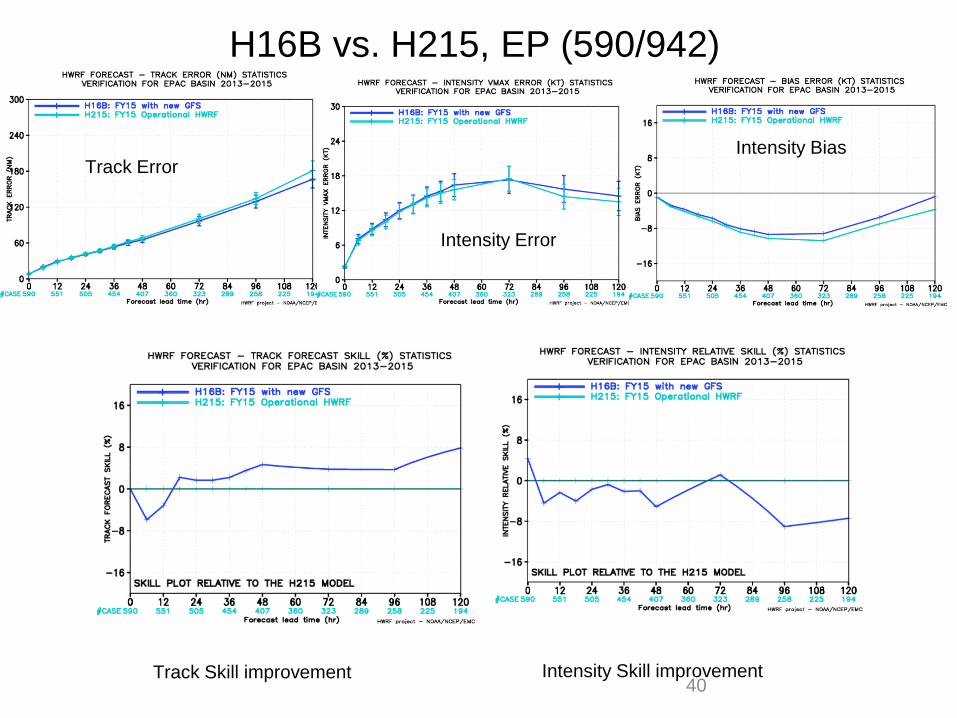
H16B vs. H215, EP (590/942)
Track Skill improvement Intensity Skill improvement 40
Track Error
Intensity Error
Intensity Bias
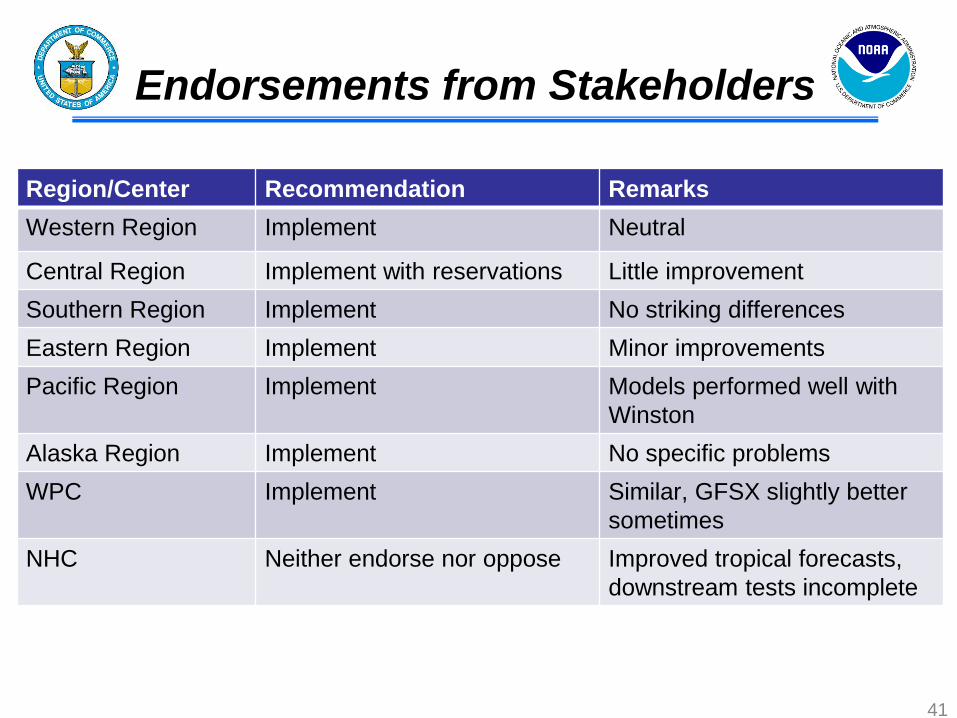
Endorsements from Stakeholders
Region/Center Recommendation Remarks
Western Region Implement Neutral
Central Region Implement with reservations Little improvement
Southern Region Implement No striking differences
Eastern Region Implement Minor improvements
Pacific Region Implement Models performed well with
Winston
Alaska Region Implement No specific problems
WPC Implement Similar, GFSX slightly better
sometimes
NHC Neither endorse nor oppose Improved tropical forecasts,
downstream tests incomplete
41
42
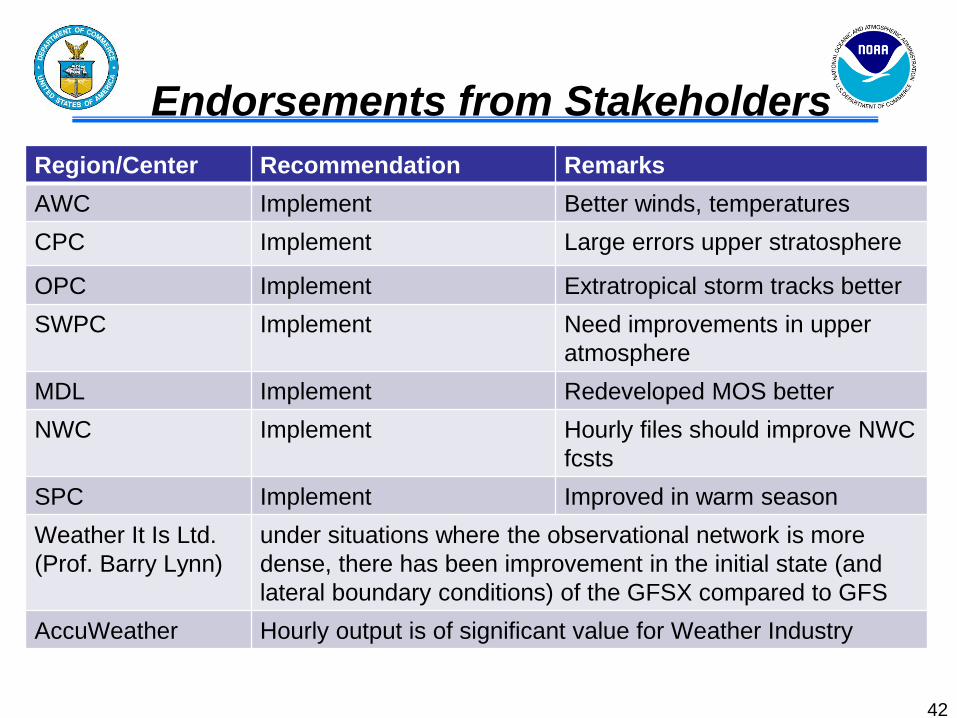
Region/Center Recommendation Remarks
AWC Implement Better winds, temperatures
CPC Implement Large errors upper stratosphere
OPC Implement Extratropical storm tracks better
SWPC Implement Need improvements in upper
atmosphere
MDL Implement Redeveloped MOS better
NWC Implement Hourly files should improve NWC
fcsts
SPC Implement Improved in warm season
Weather It Is Ltd.
(Prof. Barry Lynn)
under situations where the observational network is more
dense, there has been improvement in the initial state (and
lateral boundary conditions) of the GFSX compared to GFS
AccuWeather Hourly output is of significant value for Weather Industry
Endorsements from Stakeholders
EMC/GCWMB Assessment
• Positive evaluation (significantly positive
improvements in majority of the metrics)
• DA upgrades have been effective in reducing
the forecast errors in the short-range, and
improving analysis increment for almost all
prognostic variables
• Results shown significant improvement in week
1 forecasts verified against own analyses except
for heights and temperatures in stratosphere
• Rain no rain forecasts worse, but overall conus
precipitation improved significantly
43
• 2m temperature, dewpoint, 10 m wind forecasts against
station obs over CONUS, Alaska improved.
• CAPE forecasts over CONUS improved
• Forecasts of tropical storm genesis. track and intensity
forecasts improved.
• Mode verification of CAPE, Jet Streams, QPF and winds
shows GFSX slightly better
• Synoptic evaluations of GFSX produced no red flags.
GFSX, GFS similar; GFSX slightly better in some cases
• Forecasts of heights, temperatures, winds significantly
improved except for heights and temperatures in
stratosphere. Large errors in upper stratosphere
• CONUS precipitation forecasts improved for thresholds of 2-
25 mm/day, worse for thresholds of 0.2 mm/day 44
EMC/GCWMB Assessment
• Hourly GFS forecast output at 0.25 deg. resolution (grib2)
will be made available through 120 hr (ftp only)
• GFS Post is adding output on 5 more pressure levels in
stratosphere 1, 2, 3, 5, and 7 mb per request of CPC.
Each additional level has 6 records:
• Geopotential Height (HGT); Temperature (TMP); Relative
Humidity (RH);
• U- and V Components of Wind (UGRD & VGRD)
• Ozone Mixing Ratio (O3MR)
• Two New Products: Icing probability and Icing Severity are
also added to Aviation Weather (WAFS)
45
Hourly Output from GFS through 120 hrs
& Additional Fields
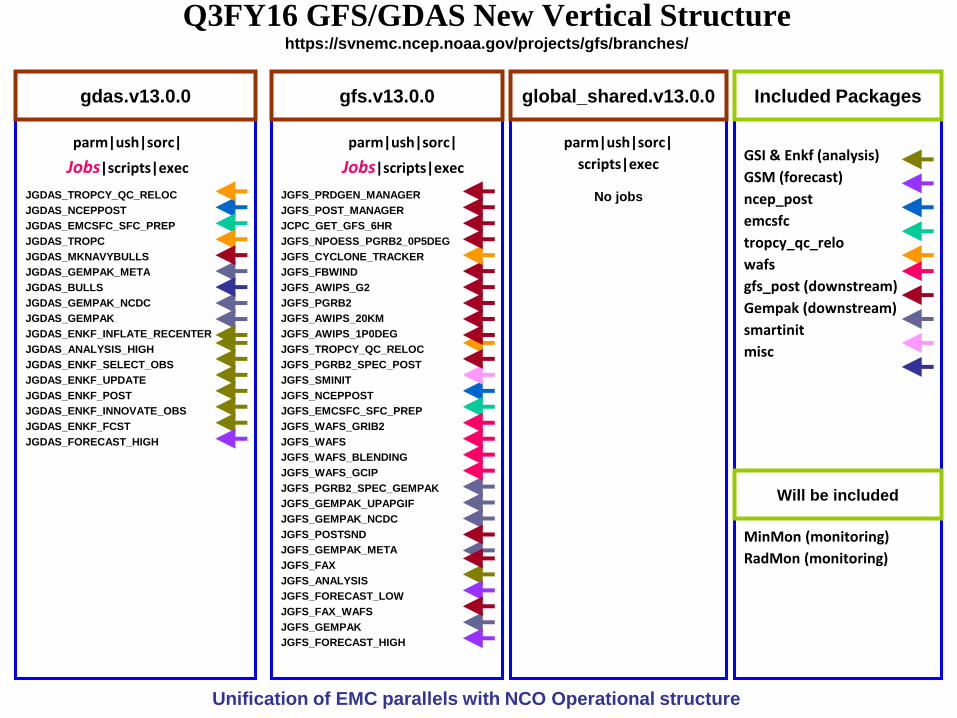
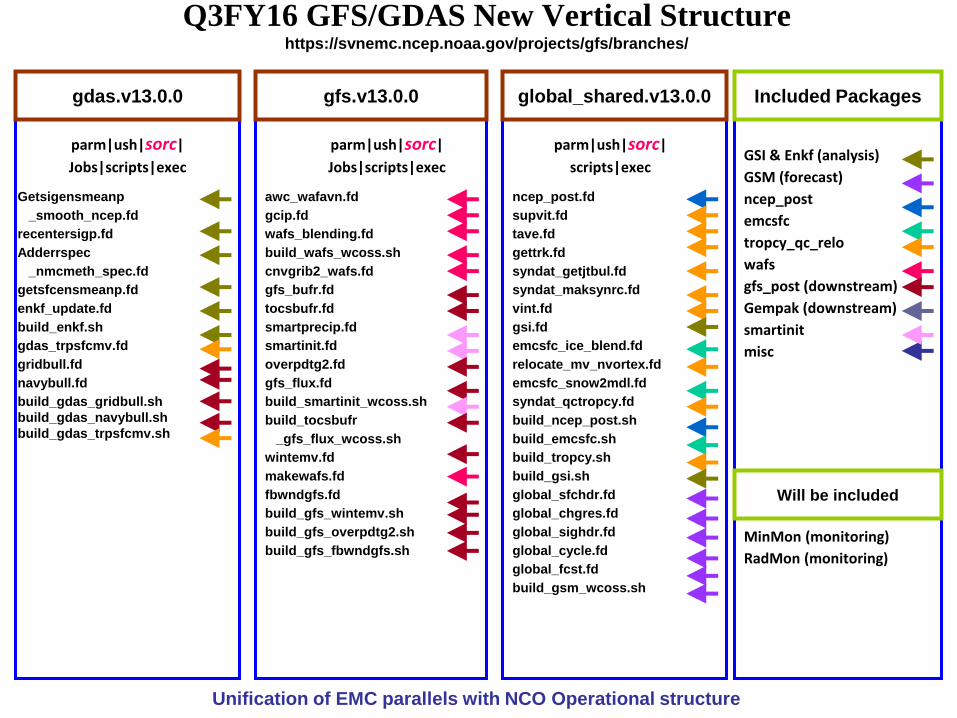
Q3FY16 GFS/GDAS New Vertical Structure https://svnemc.ncep.noaa.gov/projects/gfs/branches/
parm|ush|sorc|
Jobs|scripts|exec
gdas.v13.0.0 gfs.v13.0.0 global_shared.v13.0.0
GSI & Enkf (analysis)
GSM (forecast)
ncep_post
emcsfc
tropcy_qc_relo
wafs
gfs_post (downstream)
Gempak (downstream)
smartinit
misc
MinMon (monitoring)
RadMon (monitoring)
Included Packages
Will be included
parm|ush|sorc|
Jobs|scripts|exec
parm|ush|sorc|
scripts|exec
JGDAS_TROPCY_QC_RELOC
JGDAS_NCEPPOST
JGDAS_EMCSFC_SFC_PREP
JGDAS_TROPC
JGDAS_MKNAVYBULLS
JGDAS_GEMPAK_META
JGDAS_BULLS
JGDAS_GEMPAK_NCDC
JGDAS_GEMPAK
JGDAS_ENKF_INFLATE_RECENTER
JGDAS_ANALYSIS_HIGH
JGDAS_ENKF_SELECT_OBS
JGDAS_ENKF_UPDATE
JGDAS_ENKF_POST
JGDAS_ENKF_INNOVATE_OBS
JGDAS_ENKF_FCST
JGDAS_FORECAST_HIGH
JGFS_PRDGEN_MANAGER
JGFS_POST_MANAGER
JCPC_GET_GFS_6HR
JGFS_NPOESS_PGRB2_0P5DEG
JGFS_CYCLONE_TRACKER
JGFS_FBWIND
JGFS_AWIPS_G2
JGFS_PGRB2
JGFS_AWIPS_20KM
JGFS_AWIPS_1P0DEG
JGFS_TROPCY_QC_RELOC
JGFS_PGRB2_SPEC_POST
JGFS_SMINIT
JGFS_NCEPPOST
JGFS_EMCSFC_SFC_PREP
JGFS_WAFS_GRIB2
JGFS_WAFS
JGFS_WAFS_BLENDING
JGFS_WAFS_GCIP
JGFS_PGRB2_SPEC_GEMPAK
JGFS_GEMPAK_UPAPGIF
JGFS_GEMPAK_NCDC
JGFS_POSTSND
JGFS_GEMPAK_META
JGFS_FAX
JGFS_ANALYSIS
JGFS_FORECAST_LOW
JGFS_FAX_WAFS
JGFS_GEMPAK
JGFS_FORECAST_HIGH
No jobs
Unification of EMC parallels with NCO Operational structure
Q3FY16 GFS/GDAS New Vertical Structure https://svnemc.ncep.noaa.gov/projects/gfs/branches/
parm|ush|sorc|
Jobs|scripts|exec
gdas.v13.0.0 gfs.v13.0.0 global_shared.v13.0.0
GSI & Enkf (analysis)
GSM (forecast)
ncep_post
emcsfc
tropcy_qc_relo
wafs
gfs_post (downstream)
Gempak (downstream)
smartinit
misc
MinMon (monitoring)
RadMon (monitoring)
Included Packages
Will be included
parm|ush|sorc|
Jobs|scripts|exec
parm|ush|sorc|
scripts|exec
Getsigensmeanp
_smooth_ncep.fd
recentersigp.fd
Adderrspec
_nmcmeth_spec.fd
getsfcensmeanp.fd
enkf_update.fd
build_enkf.sh
gdas_trpsfcmv.fd
gridbull.fd
navybull.fd
build_gdas_gridbull.sh
build_gdas_navybull.sh
build_gdas_trpsfcmv.sh
awc_wafavn.fd
gcip.fd
wafs_blending.fd
build_wafs_wcoss.sh
cnvgrib2_wafs.fd
gfs_bufr.fd
tocsbufr.fd
smartprecip.fd
smartinit.fd
overpdtg2.fd
gfs_flux.fd
build_smartinit_wcoss.sh
build_tocsbufr
_gfs_flux_wcoss.sh
wintemv.fd
makewafs.fd
fbwndgfs.fd
build_gfs_wintemv.sh
build_gfs_overpdtg2.sh
build_gfs_fbwndgfs.sh
ncep_post.fd
supvit.fd
tave.fd
gettrk.fd
syndat_getjtbul.fd
syndat_maksynrc.fd
vint.fd
gsi.fd
emcsfc_ice_blend.fd
relocate_mv_nvortex.fd
emcsfc_snow2mdl.fd
syndat_qctropcy.fd
build_ncep_post.sh
build_emcsfc.sh
build_tropcy.sh
build_gsi.sh
global_sfchdr.fd
global_chgres.fd
global_sighdr.fd
global_cycle.fd
global_fcst.fd
build_gsm_wcoss.sh
Unification of EMC parallels with NCO Operational structure
GCWMB requests EMC Director
to approve implementation of
Q3FY16 GDAS/GFS upgrade
package.
Special acknowledgements:
John Derber, Russ Treadon, Glenn White, Fanglin Yang, Tracey Dorian, Partha Bhattacharjee, Lin
Gan, Boi Vuong, Qingfu Liu, Guangping Liu, Diane Stokes, Dennis Keyser, Yali Mao, Eugene Mirvis,
George Gayno, Zhan Zhang, Lin Zhu, Cathy Thomas, Ed Safford, Rahul Mahajan, Jeff Whitaker,
Yuejian Zhu, Steven Earle, Jen Yang & Becky Cosgrove 48
Next Steps
• Code Hand-off to NCO: Completed
• All non-GFS downstream codes submitted to NCO:
Completed
• Collect Evaluation Reports from the field: Completed
• Final EMC CCB: Today (Completed)
• OD Briefing: 3/17/16 (Scheduled)
• TIN: 4/1/2016 (on track)
• 30-day evaluation: 4/06 – 5/5
• Final OD Briefing by NCO: 5/11
• Implementation: 5/17
49
Backup Slides
50
Fit to Obs Evaluation with aircraft Obs
GFSX analyzed temperatures fit aircraft obs better all 3 layers
forecast temperatures fit aircraft obs better in upper and lower layers
GFSX analyzed and forecast winds fit aircraft obs better in all 3 layers
GFSX analyzed temperatures fit ACARS obs better in all 3 layers
forecast temperatures fit ACARS obs better in lower layer
GFSX analyzed and forecast winds fit ACARS obs better in all 3 layers
51
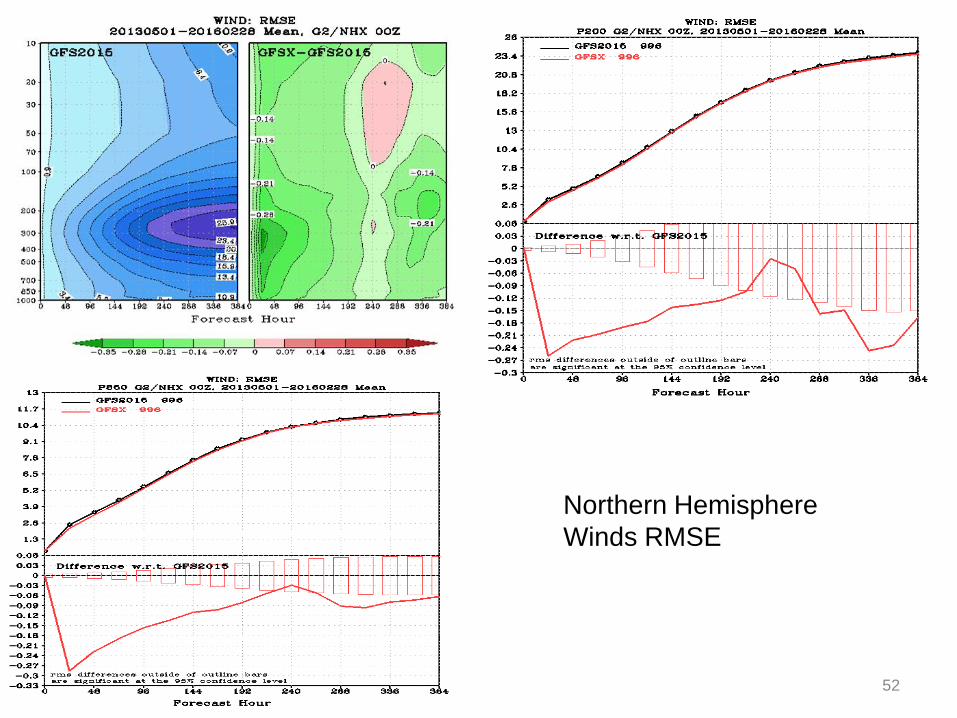
Northern Hemisphere
Winds RMSE
52
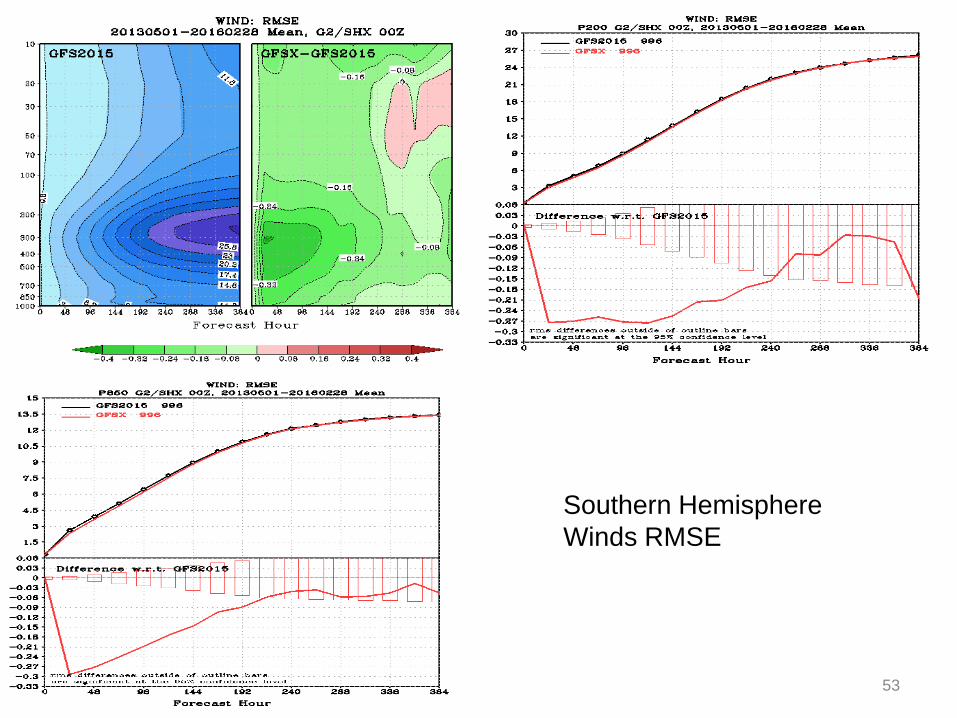
Southern Hemisphere
Winds RMSE
53
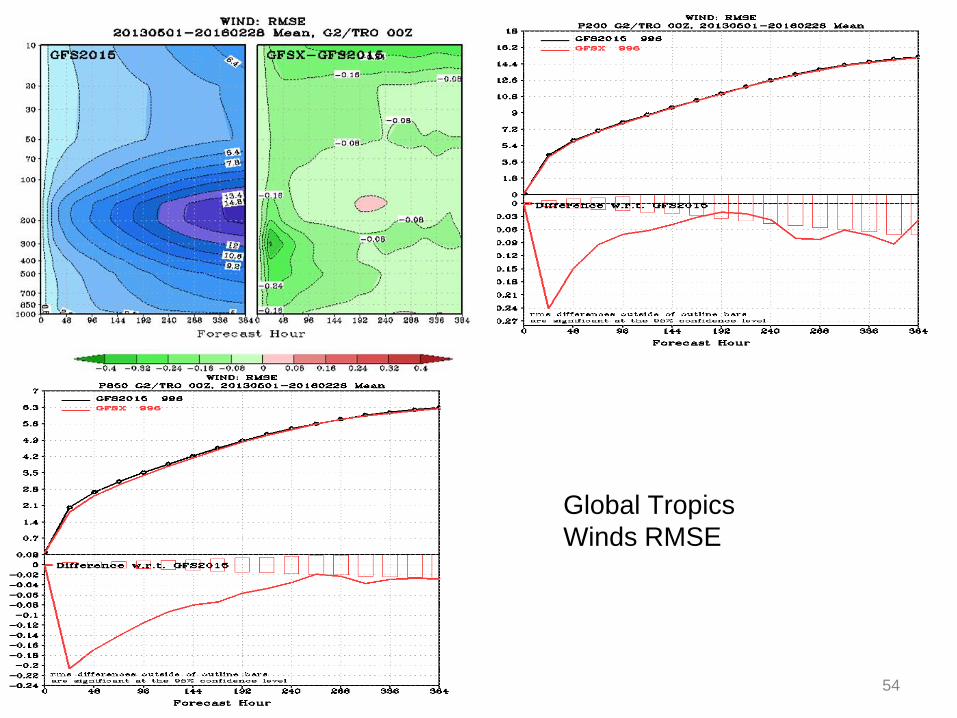
Global Tropics
Winds RMSE
54
Temperature RMSE
Big improvements in Southern
Hemisphere
Upper troposphere/Stratosphere in
Northern Hemisphere has increased
RMSE
55
NH SH
Tropics
56
57
58
59
60
61
62
63
64
65
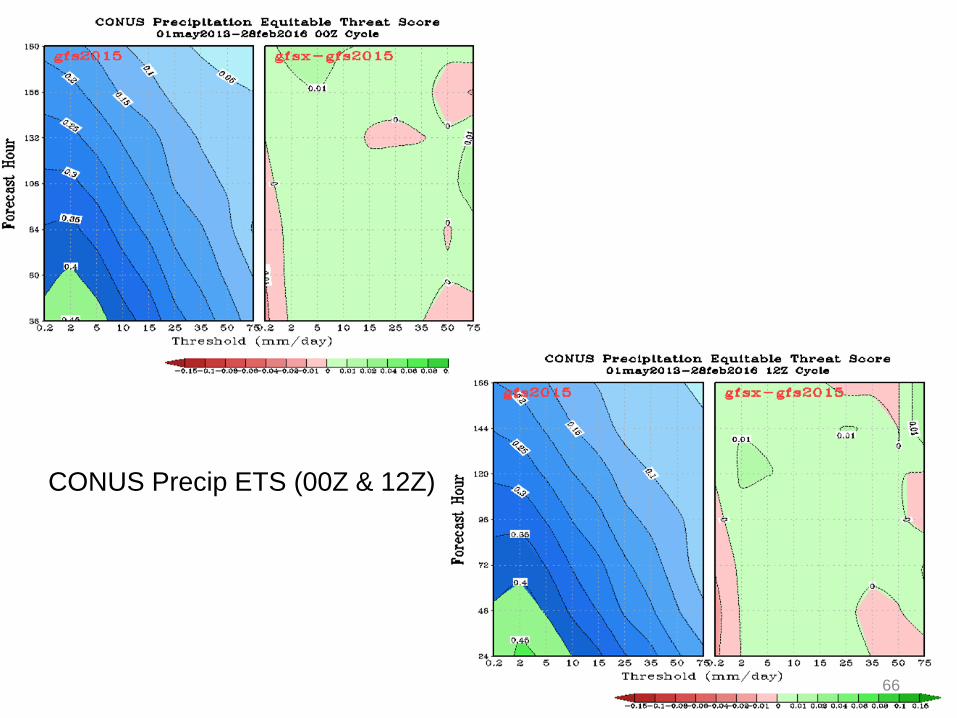
CONUS Precip ETS (00Z & 12Z)
66
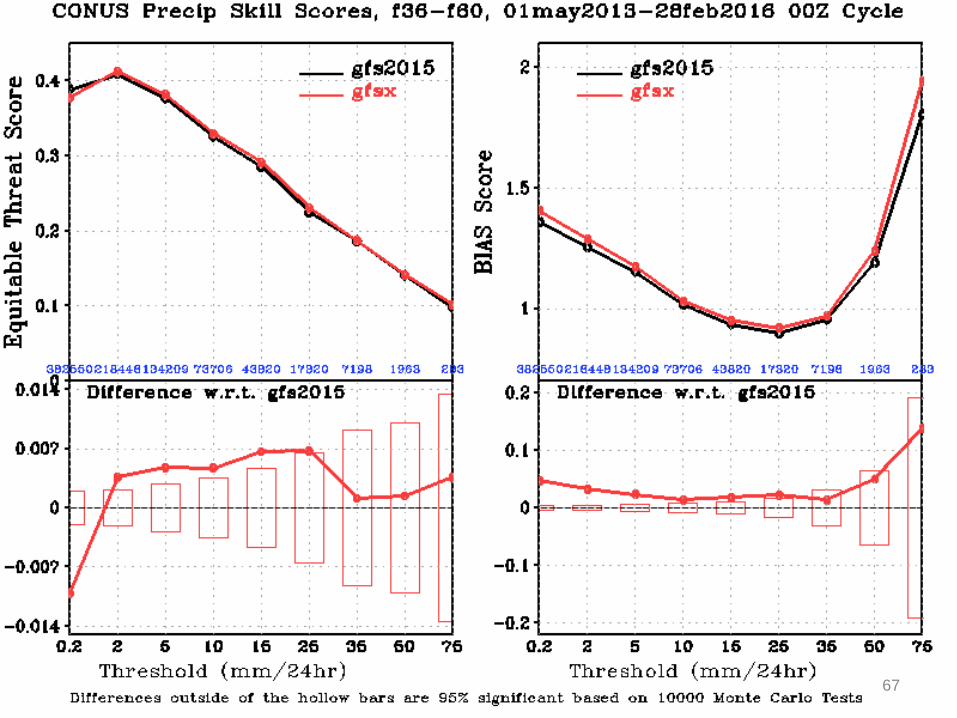
67
Equitable threat and bias scores for May 2013-February 2016 for CONUS
14 forecast lengths 00-24 hr to 156-180 hr for 00Z and 12Z forecasts
Nine Thresholds of 0.2 mm/day to 75 mm/day GFSX forecasts for thresholds of 0.2 mm/day significantly worse for 0-24 to 84-108 h forecasts Worse wet bias for thresholds of 0.2 mm/day GFSX forecasts for thresholds of 2, 5, 10 mm/day significantly better for 35/42 fcst lengths for thresholds of 15 mm/day significantly better 7/14 fcst lengths for thresholds of 25 mm/day significantly better 3/14 fcst lengths Slight tendency for less of dry bias 15-35 mm/day
Rain/no rain (Threshold of 0.2 mm/day) worse in GFSX
Thresholds of 2 to 25 mm/day significantly improved
68
Verification of near surface fields against surface observations
CONUS (six regions, also west and east)
and Alaska
Two years 0 and 12Z forecasts One year 6 and 18Z forecasts
69
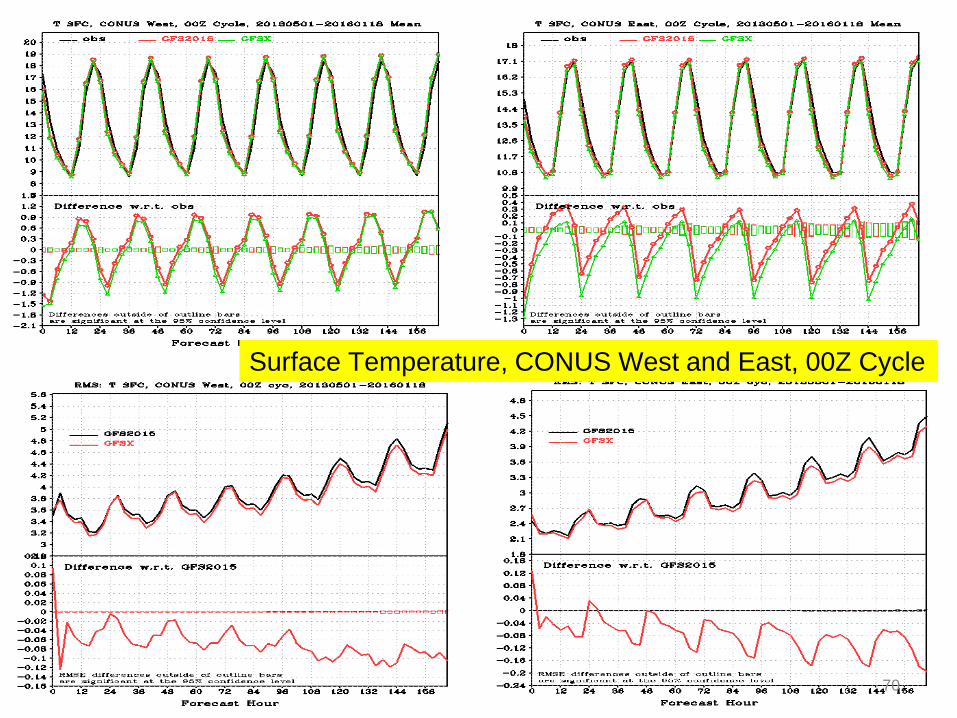
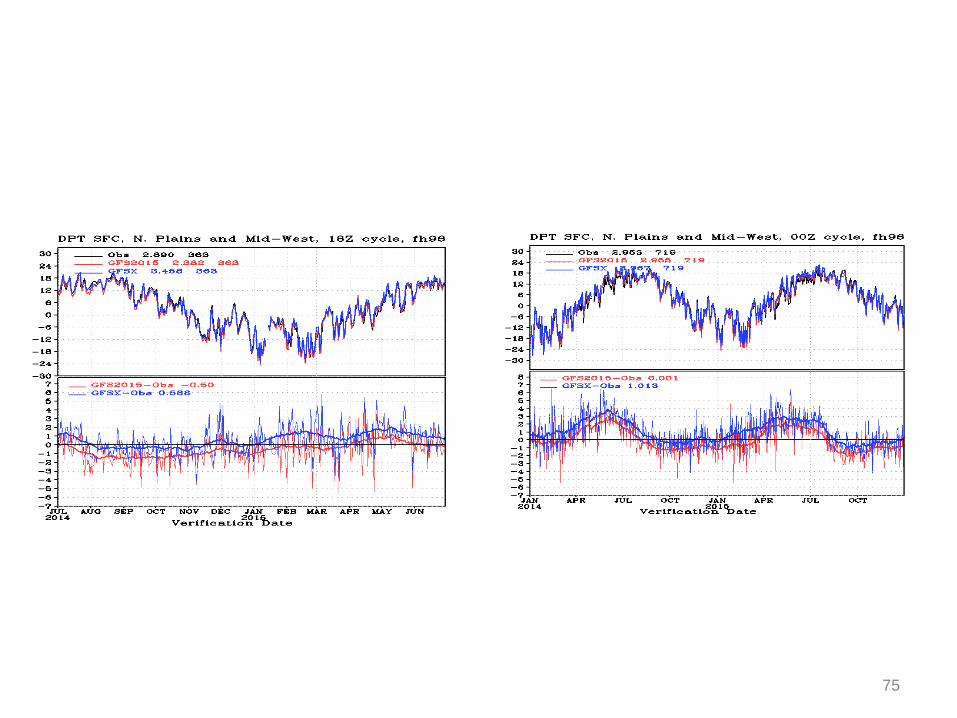
Surface Temperature, CONUS West and East, 00Z Cycle
70
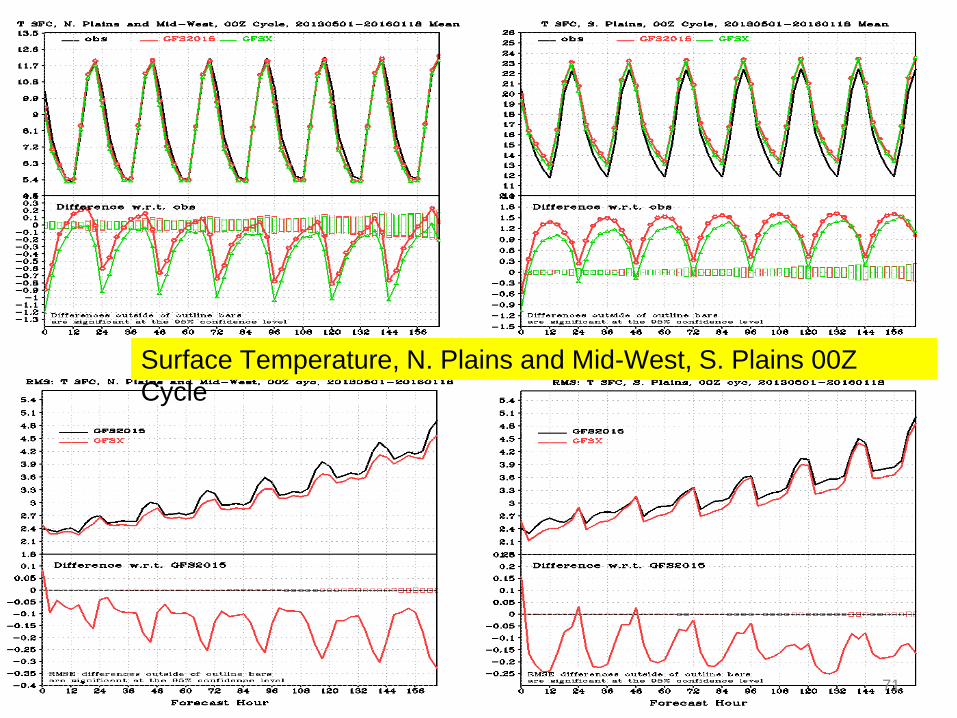
Surface Temperature, N. Plains and Mid-West, S. Plains 00Z
Cycle
71
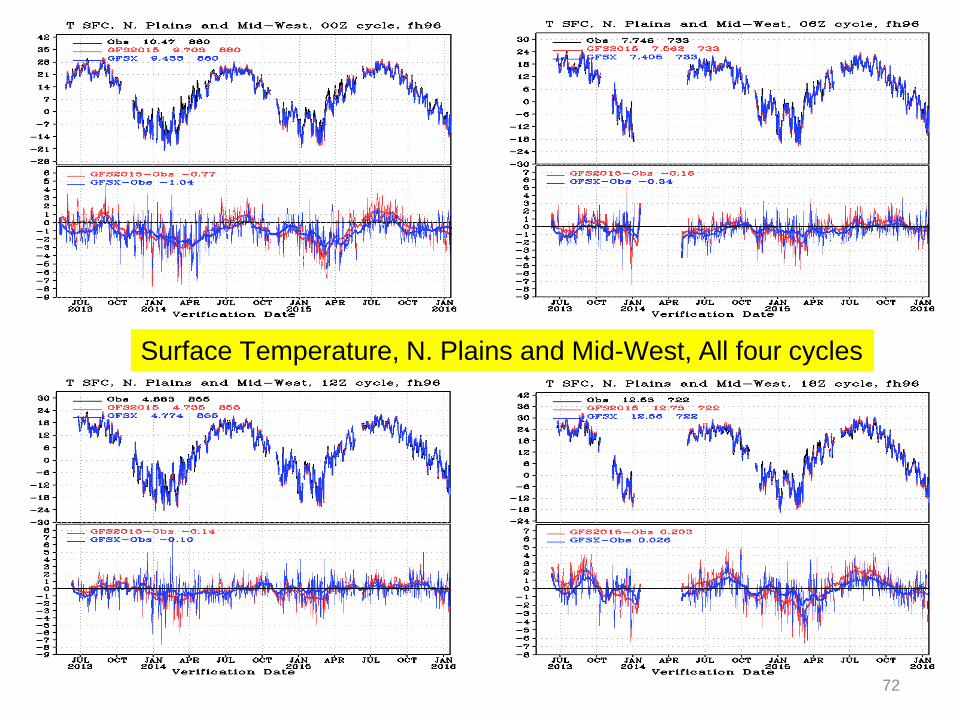
Surface Temperature, N. Plains and Mid-West, All four cycles
72
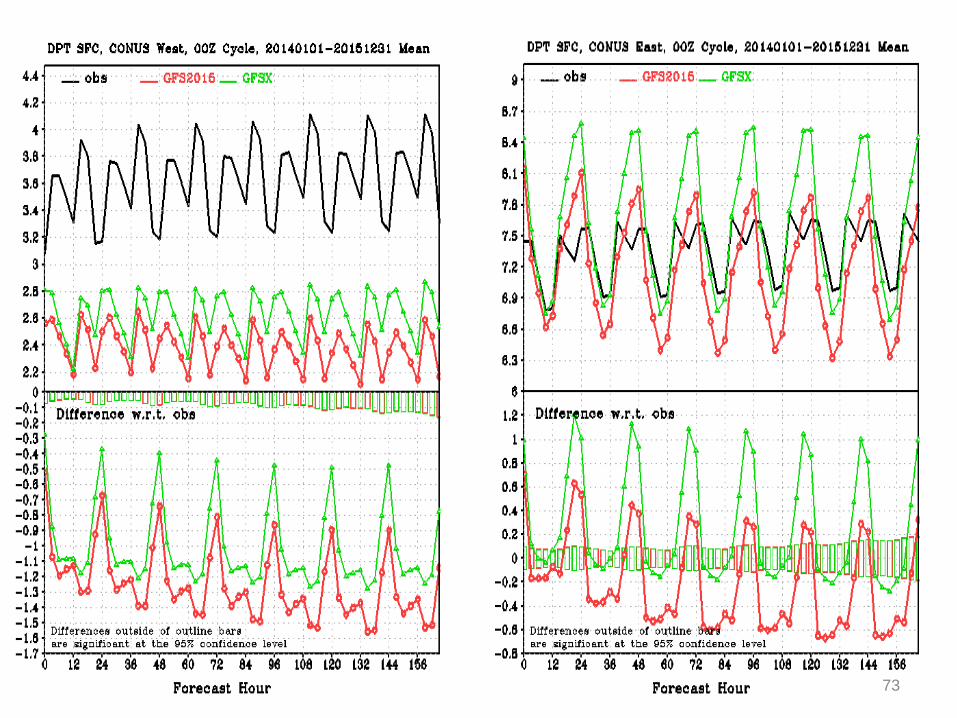
73
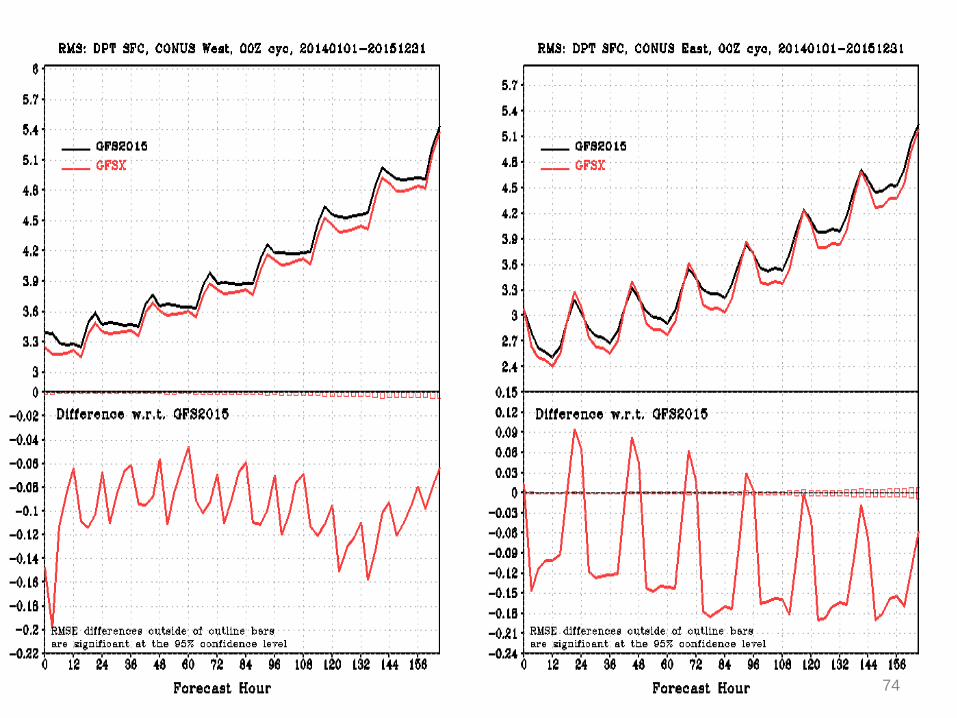
74
75
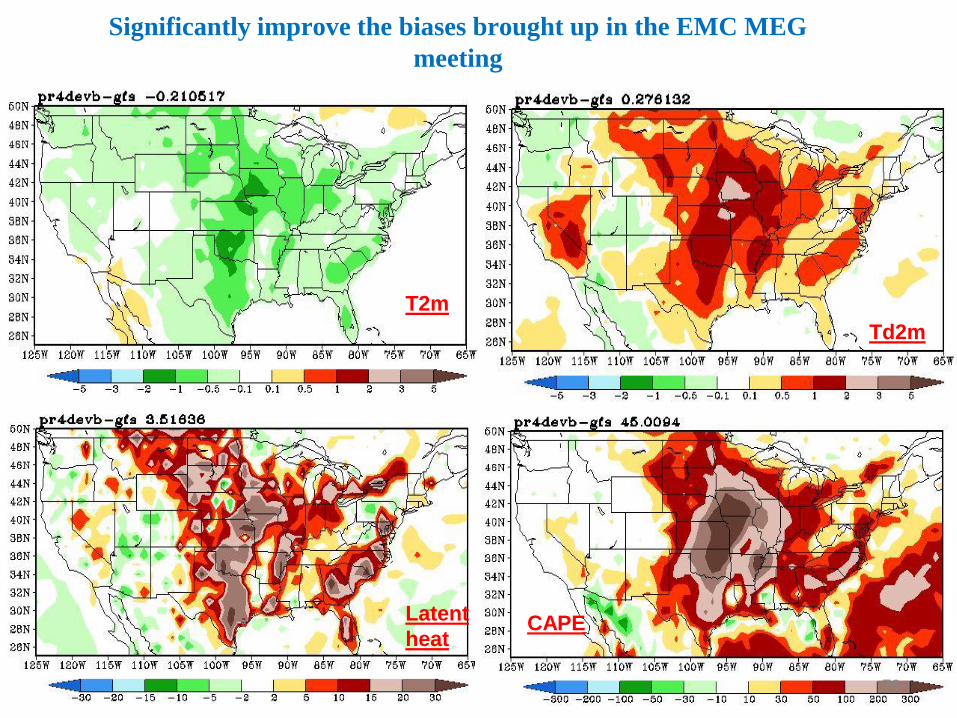
Significantly improve the biases brought up in the EMC MEG
meeting
T2m
Latent
heat
Td2m
CAPE
76
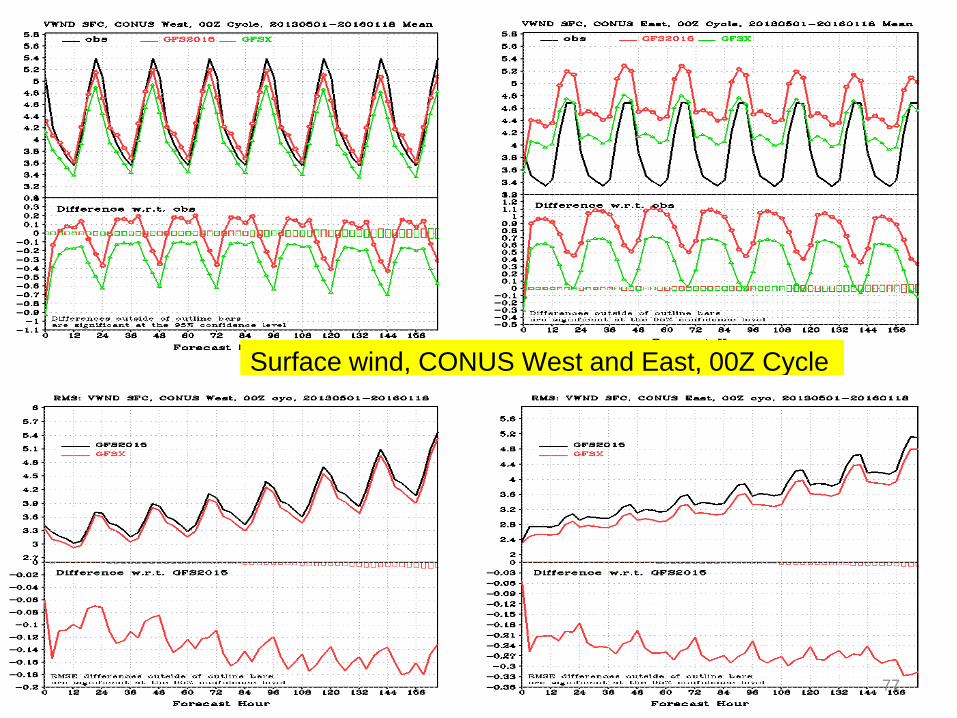
Surface wind, CONUS West and East, 00Z Cycle
77
Preliminary assessment of impact of LSM changes
• 2m T bias is worse over the Northern Plains and Northeast, Better over southern plains and southeast • RMS error improved over northern and southern plains, Southeast and Alaska, worse over northwest • 10 m winds decreased, RMS error improved • The land surface parameter refinements have significantly
reduced the warm/dry biases in the summer • The change has little impact in the winter. However there
are some degradations in the spring/fall. Also it is worst in 00Z (sunset). Some of them will be addressed in the next GFS physics implementation.
78
CPC Evaluation of GFSX - D+8 & Week 2; - Stratosphere
Craig Long & Jae-Kyung Schemm • 500 hPa height and 850 hPa temperature AC scores and RMS error were
compared for NH extra-tropics and the PNA sector for period Jun 1, 2013 – Nov 30, 2015.
• The skill comparisons show no significant changes in forecast performance at all leads to 15 days over the operational GFS during the test period except slight degradation at longer leads during boreal summer season over the NH and PNA sector.
• There is no negative impact in D+8 and Week 2 forecasts from this upgrade.
• Comparisons of GFSX analyses with MLS show GFSX temps to be about 1 deg colder from 200 to 10 mb. GFSX then become warmer between 10 and 1mb by as much as 4-6 degrees,
• Comparison of GFSX f120 with Anl show that f120 is 5-10 deg warm in winter hemisphere temp gradient latitudes above 10mb and about 5 deg cooler in summer hemisphere above 10mb. 79
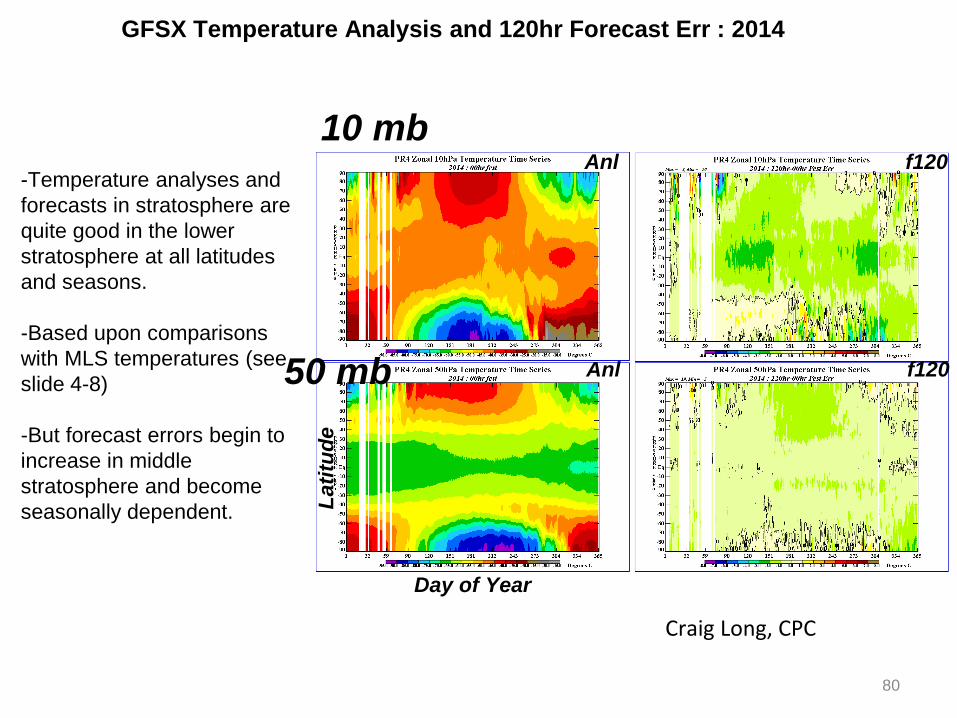
GFSX Temperature Analysis and 120hr Forecast Err : 2014
10 mb
50 mb
Anl f120
Anl f120
-Temperature analyses and
forecasts in stratosphere are
quite good in the lower
stratosphere at all latitudes
and seasons.
-Based upon comparisons
with MLS temperatures (see
slide 4-8)
-But forecast errors begin to
increase in middle
stratosphere and become
seasonally dependent.
Day of Year
Lati
tud
e
Craig Long, CPC
80
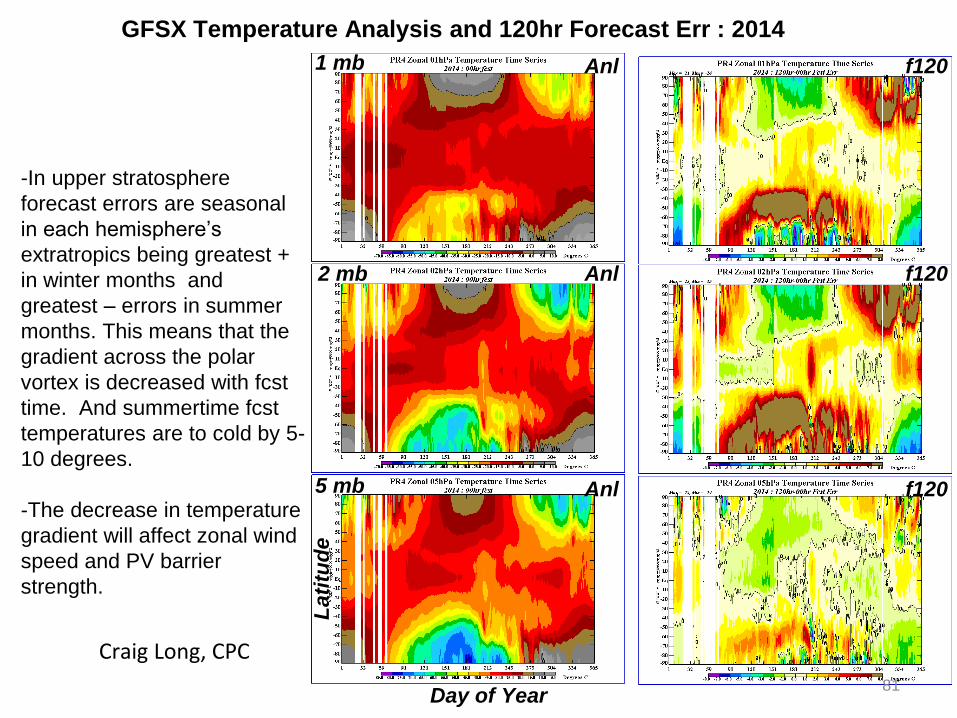
GFSX Temperature Analysis and 120hr Forecast Err : 2014
1 mb
2 mb
5 mb
Anl f120
Anl f120
Anl f120
-In upper stratosphere
forecast errors are seasonal
in each hemisphere’s
extratropics being greatest +
in winter months and
greatest – errors in summer
months. This means that the
gradient across the polar
vortex is decreased with fcst
time. And summertime fcst
temperatures are to cold by 5-
10 degrees.
-The decrease in temperature
gradient will affect zonal wind
speed and PV barrier
strength.
Day of Year
Lati
tud
e
Craig Long, CPC
81
Overall Evaluation - Stratosphere
• Recommendations: – Not a show stopper since there is not adverse effects to the troposphere,
but large temperature forecast errors need to be examined for a cause.
– These results hopefully will improve when the GFS model top is lifted and more
levels are added to the upper stratosphere/lower mesosphere (USLM).
– Currently the top AMSU channel 14 is not assimilated because there are not
enough model levels in the USLM for the foreward model to generate a good
guess.
– Adding more levels will allow the usage of AMSU channel 14 (unbias corrected)
and should improve the temperature analysis in the USLM.
82
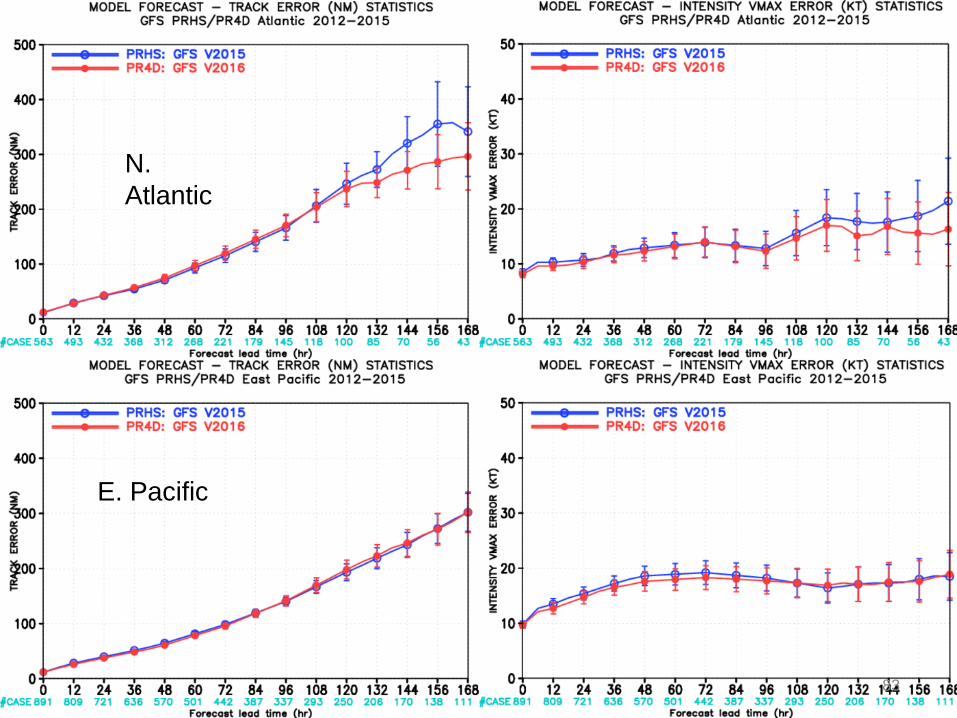
N.
Atlantic
E. Pacific
83
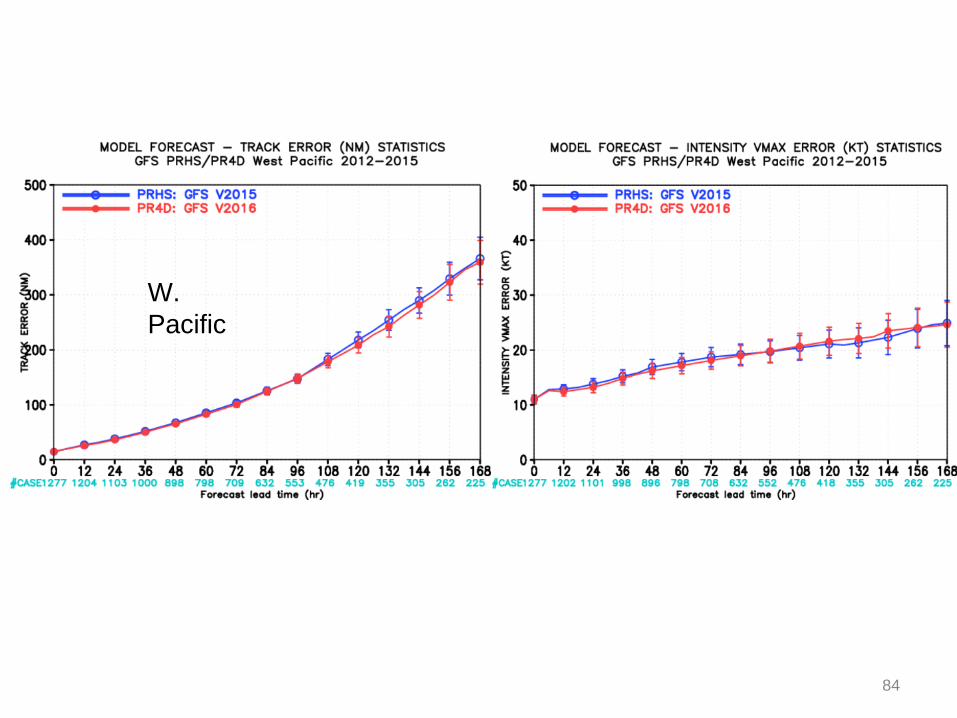
W.
Pacific
84
Mode Verification: GFS vs. GFSX
• Jet Streams: Overall models forecast jets well but present possible systematic biases according to MODE & GFSX generally looks “better” and closer to the ECMWF
• QPF: GFSX has higher MMI (Median of Maximum Interest) values for all forecast hours except at 60-h where it is lower than GFS and statistically significant; GFSX generally forecasts more objects than GFS and observations
• Total winds at 250mb: GFSX did seem a little bit better than the operational GFS based on the MODE statistics. Will look at meridional winds (which already show bigger differences between the GFS and GFSX) and then zonal winds.
85
Blizzard of January 2016
• High predictability of the 22–24 January 2016 blizzard that affected the East Coast: Medium-range models had a signal for a significant low along the East Coast about a week in advance of the storm
• Forecasts for the Mid-Atlantic were good. GFS, GFSX, and EC shifted the northern extent of the precipitation shield southward as the event neared, which caused uncertainty in the NYC area
86
DOWNSTREAM MODEL EVALUATION: GEFS & HWRF
87
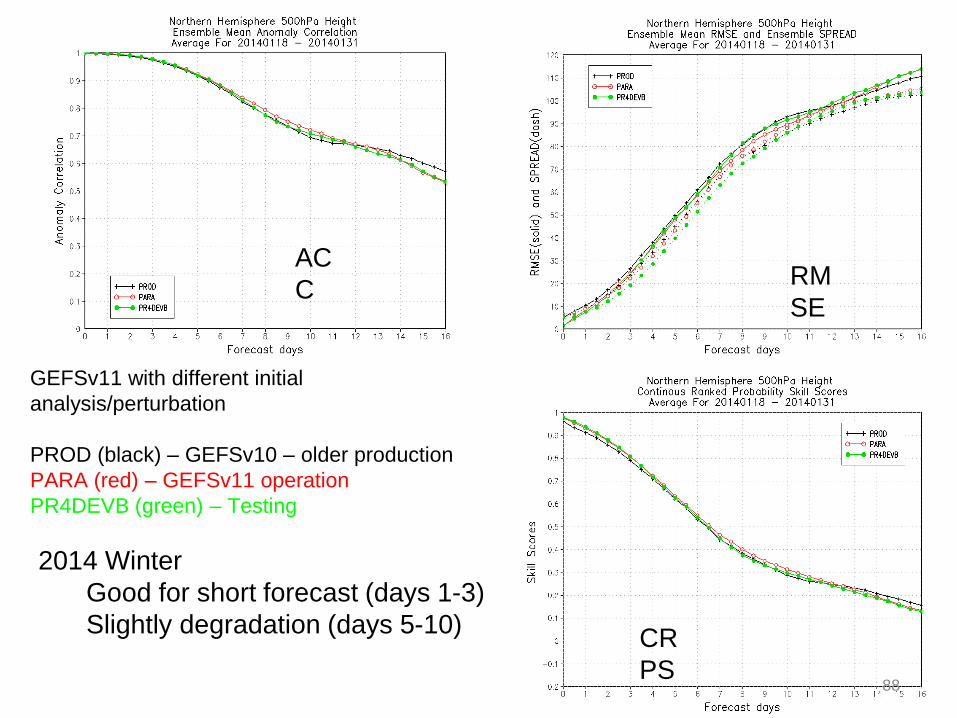
GEFSv11 with different initial
analysis/perturbation
PROD (black) – GEFSv10 – older production
PARA (red) – GEFSv11 operation
PR4DEVB (green) – Testing
AC
C RM
SE
CR
PS
2014 Winter
Good for short forecast (days 1-3)
Slightly degradation (days 5-10)
88
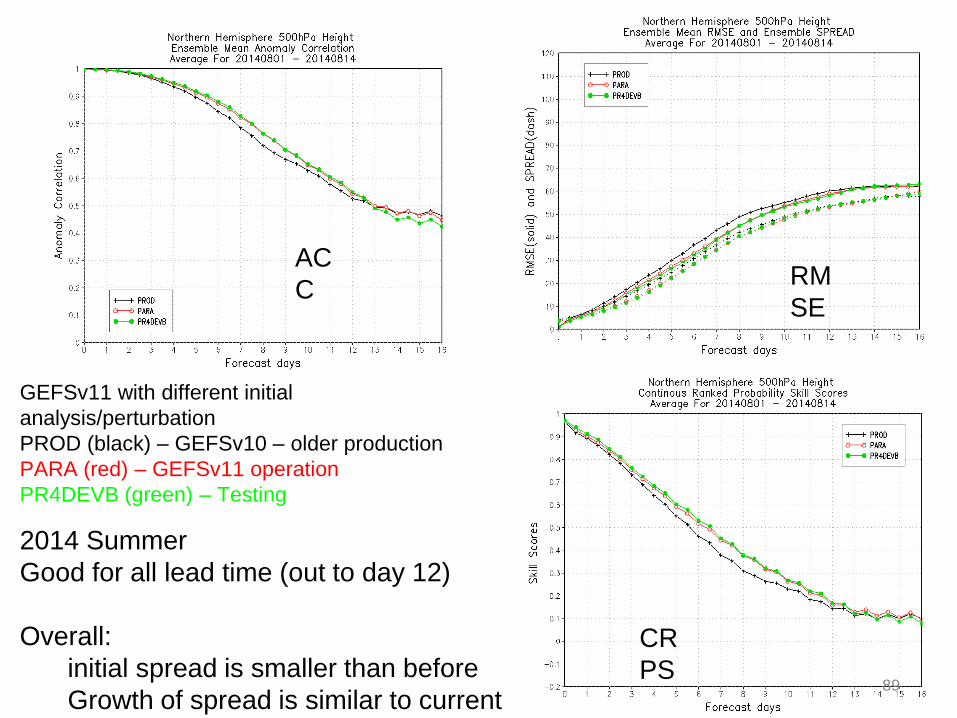
GEFSv11 with different initial
analysis/perturbation
PROD (black) – GEFSv10 – older production
PARA (red) – GEFSv11 operation
PR4DEVB (green) – Testing
AC
C RM
SE
CR
PS
2014 Summer
Good for all lead time (out to day 12)
Overall:
initial spread is smaller than before
Growth of spread is similar to current 89
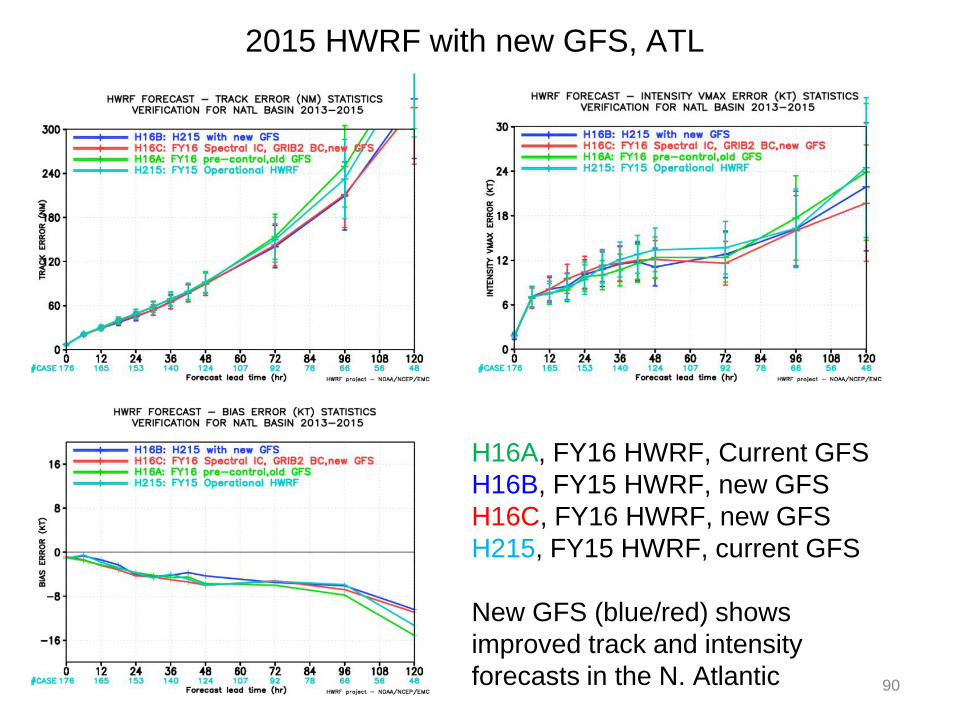
H16A, FY16 HWRF, Current GFS
H16B, FY15 HWRF, new GFS
H16C, FY16 HWRF, new GFS
H215, FY15 HWRF, current GFS
New GFS (blue/red) shows
improved track and intensity
forecasts in the N. Atlantic
2015 HWRF with new GFS, ATL
90
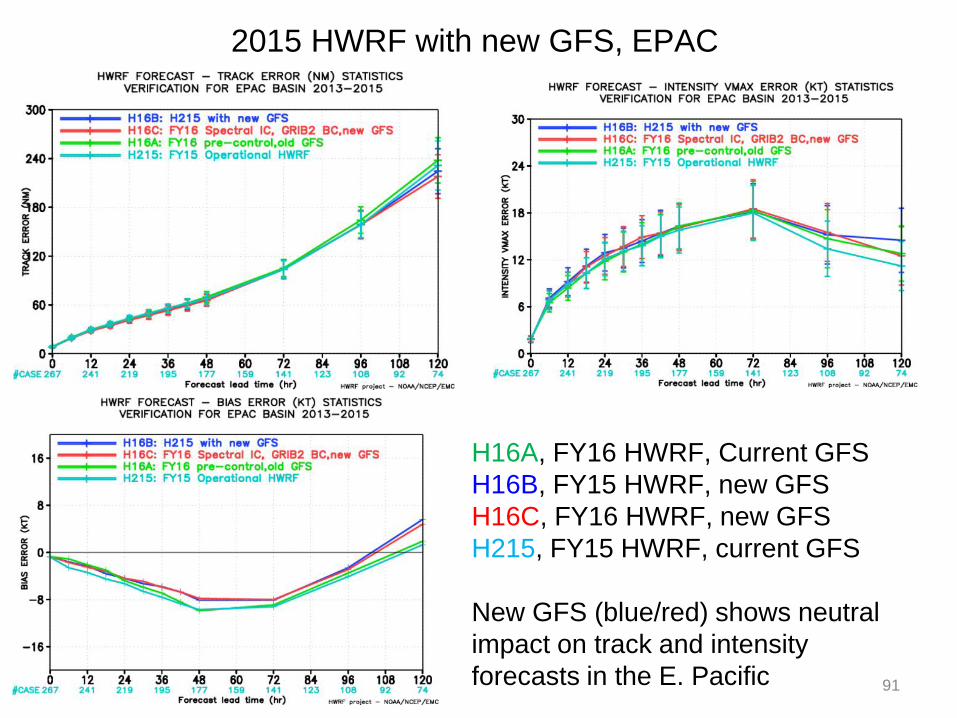
H16A, FY16 HWRF, Current GFS
H16B, FY15 HWRF, new GFS
H16C, FY16 HWRF, new GFS
H215, FY15 HWRF, current GFS
New GFS (blue/red) shows neutral
impact on track and intensity
forecasts in the E. Pacific
2015 HWRF with new GFS, EPAC
91
Extratropical Tracks
• For the winter, Nov.1 2013 - April 30 2014, position error is smaller in GFSX than in GFS control seven out of ten forecast hours (0 - 120hr in 12hr interval).
• For the summer, April 1 2015 - Oct. 31 2015, GFSX errors are always smaller than GFS control's.
92
Sounding and Height Case Studies
• For sounding case studies, GFSX looked better than operational GFS for North Platte, NE, looked the same for Aberdeen, SD, and looked much better near the surface for Omaha, NE for Aug. 16, showing reduction in
warm dry bias
• For the spaghetti plots of a height contour, of 5 cases requested by WPC, GFSX did better for 3 cases, did the same for 1 case, and did worse for 1 case. The case the GFSX did worse on was the 180-h forecast from 00Z 12/7/14 valid on 12Z 12/14/14.
93
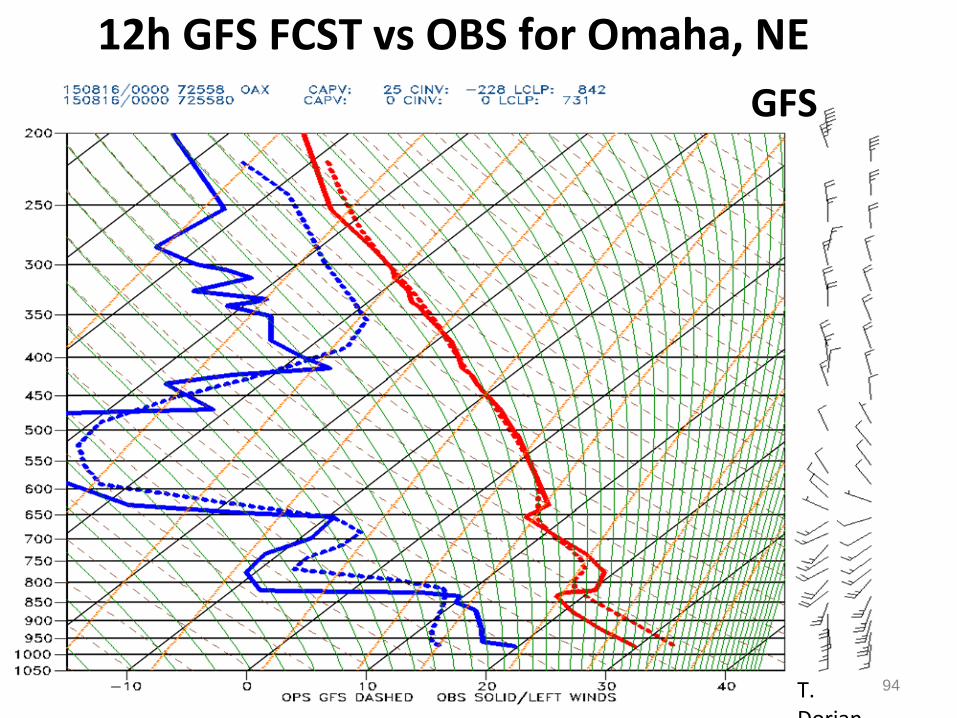
12h GFS FCST vs OBS for Omaha, NE
GFS
T. Dorian
94
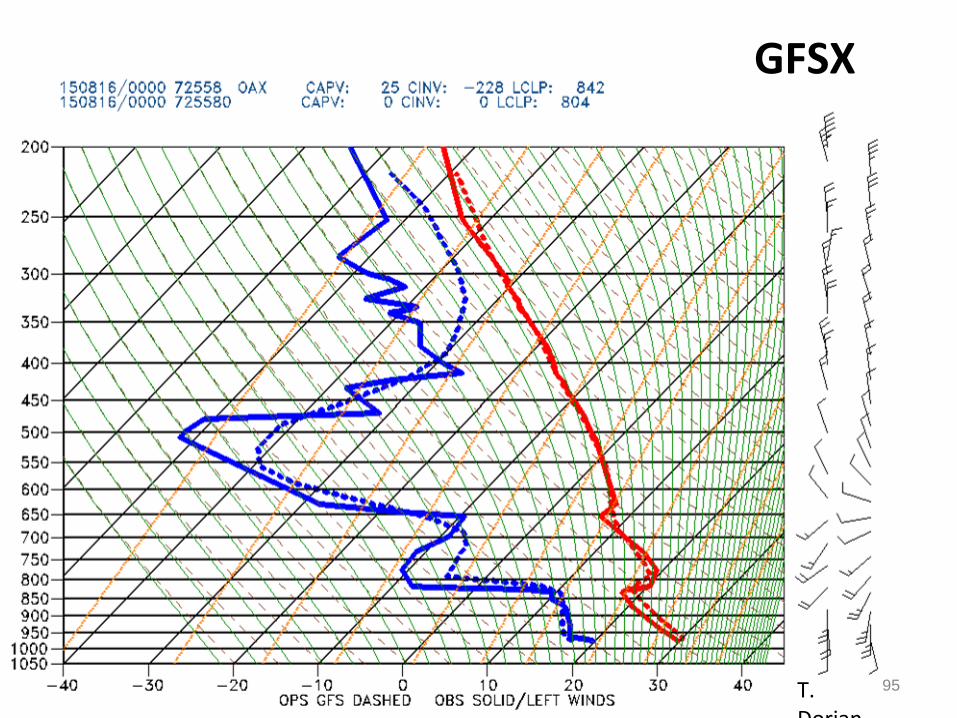
GFSX
T. Dorian
95
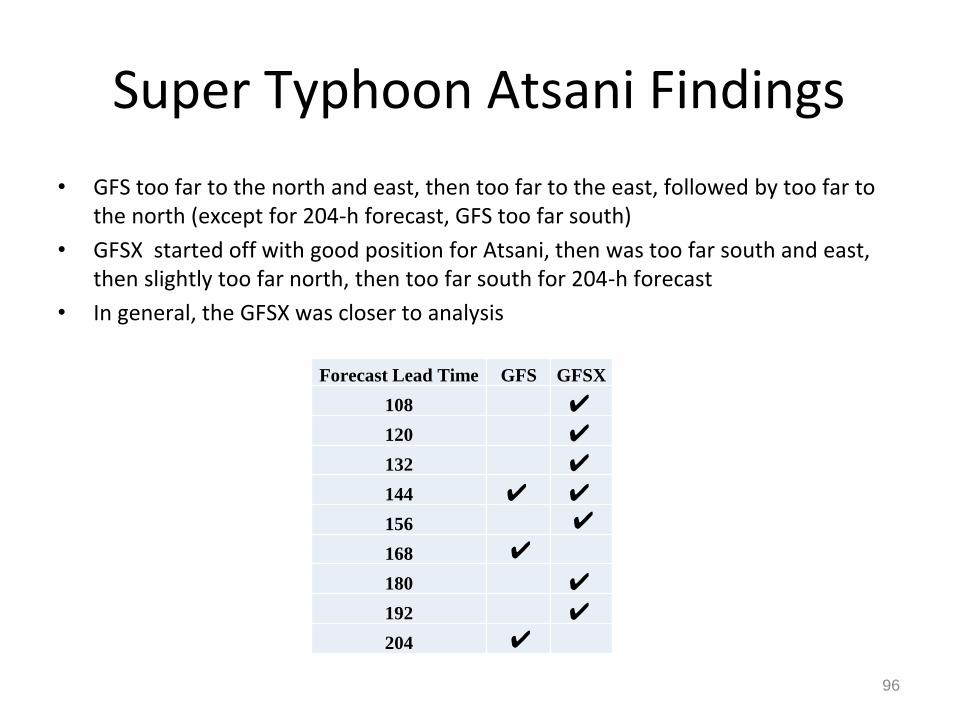
Super Typhoon Atsani Findings
• GFS too far to the north and east, then too far to the east, followed by too far to the north (except for 204-h forecast, GFS too far south)
• GFSX started off with good position for Atsani, then was too far south and east, then slightly too far north, then too far south for 204-h forecast
• In general, the GFSX was closer to analysis
Forecast Lead Time GFS GFSX
108 ✔
120 ✔
132 ✔
144 ✔ ✔
156 ✔
168 ✔
180 ✔
192 ✔
204 ✔
96
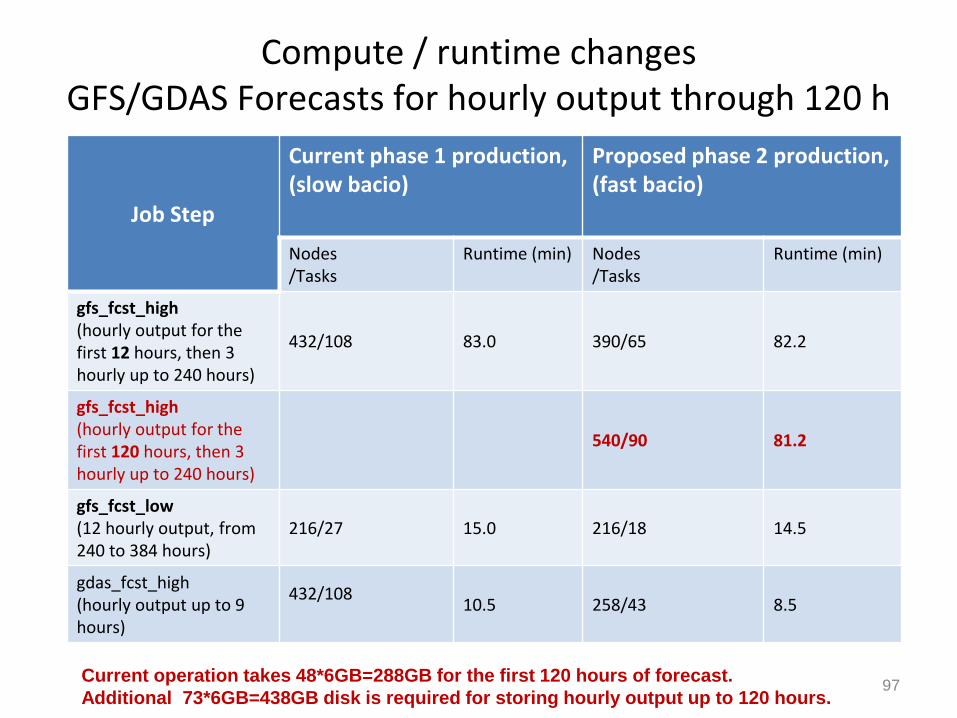
Compute / runtime changes GFS/GDAS Forecasts for hourly output through 120 h
Job Step
Current phase 1 production, (slow bacio)
Proposed phase 2 production, (fast bacio)
Nodes /Tasks
Runtime (min) Nodes /Tasks
Runtime (min)
gfs_fcst_high (hourly output for the first 12 hours, then 3 hourly up to 240 hours)
432/108 83.0 390/65 82.2
gfs_fcst_high (hourly output for the first 120 hours, then 3 hourly up to 240 hours)
540/90 81.2
gfs_fcst_low (12 hourly output, from 240 to 384 hours)
216/27 15.0 216/18 14.5
gdas_fcst_high (hourly output up to 9 hours)
432/108
10.5 258/43 8.5
97 Current operation takes 48*6GB=288GB for the first 120 hours of forecast.
Additional 73*6GB=438GB disk is required for storing hourly output up to 120 hours.
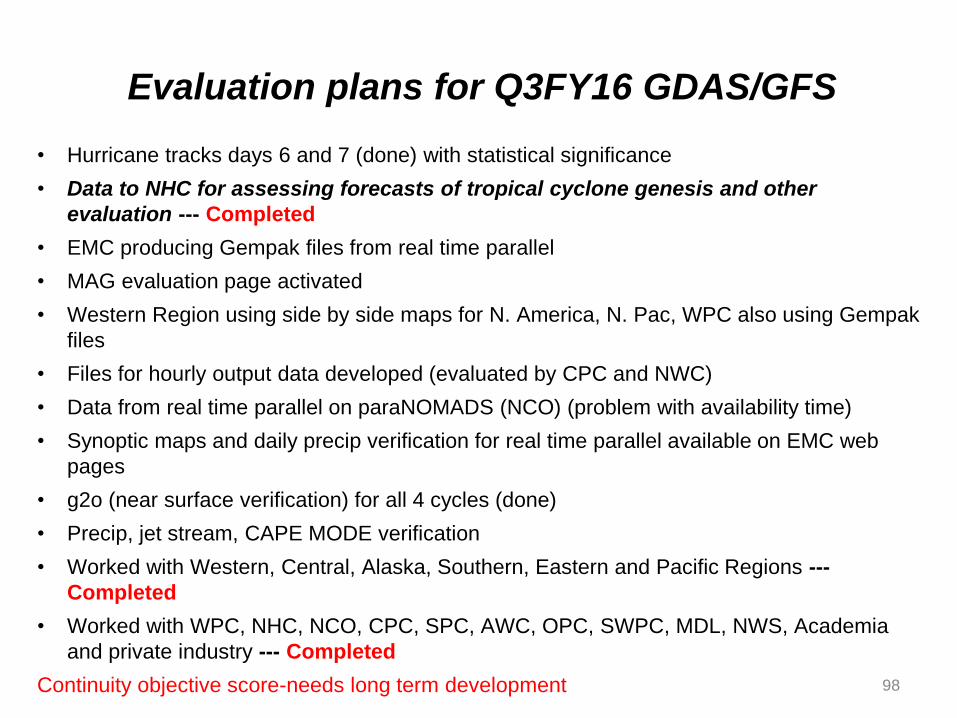
Evaluation plans for Q3FY16 GDAS/GFS
• Hurricane tracks days 6 and 7 (done) with statistical significance
• Data to NHC for assessing forecasts of tropical cyclone genesis and other
evaluation --- Completed
• EMC producing Gempak files from real time parallel
• MAG evaluation page activated
• Western Region using side by side maps for N. America, N. Pac, WPC also using Gempak
files
• Files for hourly output data developed (evaluated by CPC and NWC)
• Data from real time parallel on paraNOMADS (NCO) (problem with availability time)
• Synoptic maps and daily precip verification for real time parallel available on EMC web
pages
• g2o (near surface verification) for all 4 cycles (done)
• Precip, jet stream, CAPE MODE verification
• Worked with Western, Central, Alaska, Southern, Eastern and Pacific Regions ---
Completed
• Worked with WPC, NHC, NCO, CPC, SPC, AWC, OPC, SWPC, MDL, NWS, Academia
and private industry --- Completed
Continuity objective score-needs long term development 98
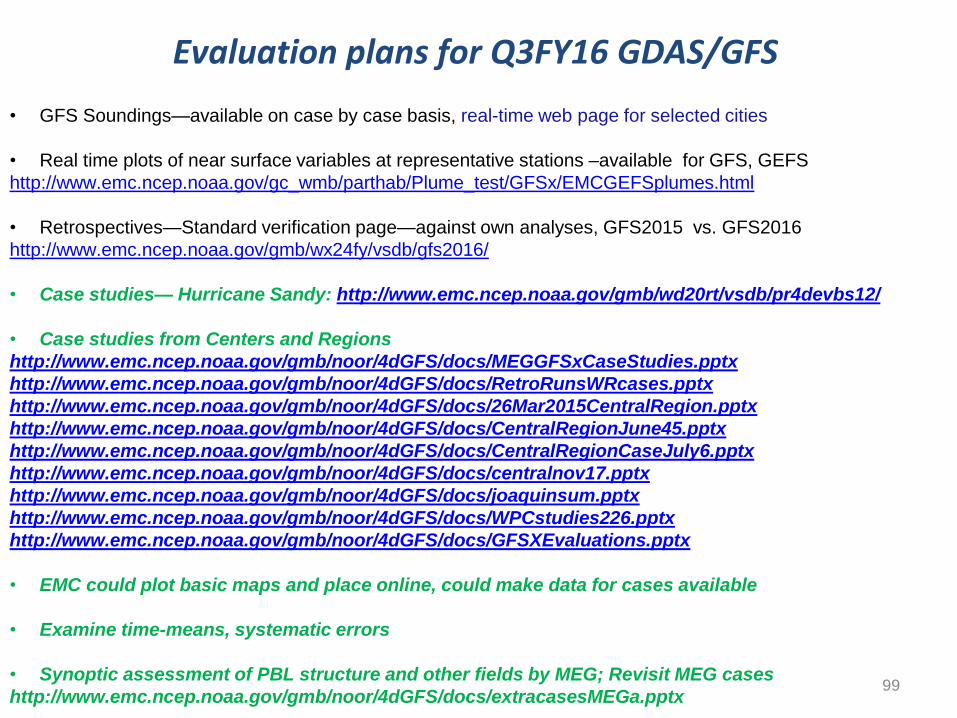
• GFS Soundings—available on case by case basis, real-time web page for selected cities
• Real time plots of near surface variables at representative stations –available for GFS, GEFS
http://www.emc.ncep.noaa.gov/gc_wmb/parthab/Plume_test/GFSx/EMCGEFSplumes.html
• Retrospectives—Standard verification page—against own analyses, GFS2015 vs. GFS2016
http://www.emc.ncep.noaa.gov/gmb/wx24fy/vsdb/gfs2016/
• Case studies— Hurricane Sandy: http://www.emc.ncep.noaa.gov/gmb/wd20rt/vsdb/pr4devbs12/
• Case studies from Centers and Regions
http://www.emc.ncep.noaa.gov/gmb/noor/4dGFS/docs/MEGGFSxCaseStudies.pptx
http://www.emc.ncep.noaa.gov/gmb/noor/4dGFS/docs/RetroRunsWRcases.pptx
http://www.emc.ncep.noaa.gov/gmb/noor/4dGFS/docs/26Mar2015CentralRegion.pptx
http://www.emc.ncep.noaa.gov/gmb/noor/4dGFS/docs/CentralRegionJune45.pptx
http://www.emc.ncep.noaa.gov/gmb/noor/4dGFS/docs/CentralRegionCaseJuly6.pptx
http://www.emc.ncep.noaa.gov/gmb/noor/4dGFS/docs/centralnov17.pptx
http://www.emc.ncep.noaa.gov/gmb/noor/4dGFS/docs/joaquinsum.pptx
http://www.emc.ncep.noaa.gov/gmb/noor/4dGFS/docs/WPCstudies226.pptx
http://www.emc.ncep.noaa.gov/gmb/noor/4dGFS/docs/GFSXEvaluations.pptx
• EMC could plot basic maps and place online, could make data for cases available
• Examine time-means, systematic errors
• Synoptic assessment of PBL structure and other fields by MEG; Revisit MEG cases
http://www.emc.ncep.noaa.gov/gmb/noor/4dGFS/docs/extracasesMEGa.pptx
Evaluation plans for Q3FY16 GDAS/GFS
99
--keep websites comparing GFS and GFSX up until implementation --start to plan next implementation procedure March 18 real time—experimental GFS in AWIPS ` retrospective—generate synoptic maps dprog/dt (Western Region program?) zoomable? Differences, errors? precipitation verification maps (Fanglin Yang) enable forecasters (SOOs?) to do case studies
100
Future work
Reduce “socialist rain”
Increase amount of moderate rain
Cold bias over snow
Improve upper stratospheric forecasts
Reduce near surface biases, improve diurnal cycle
Improve boundary layer
Reduce dry bias in southeast US
101