Embed Size (px)
Citation preview
ISPRS Journal of Photogrammetry and Remote Sensing 66 (2011) 38–45
Contents lists available at ScienceDirect
ISPRS Journal of Photogrammetry and Remote Sensing
journal homepage: www.elsevier.com/locate/isprsjprs
Generalization of DEM for terrain analysis using a compound methodQiming Zhou a,c,∗, Yumin Chen b,d
a Department of Geography and Centre for Geo-computation Studies, Hong Kong Baptist University, Kowloon Tong, Kowloon, Hong Kong, Chinab School of Resource and Environment Science, Wuhan University, 129 Luoyu Road, Wuhan, 430079, Chinac The State Key Laboratory for Information Engineering in Surveying, Mapping and Remote Sensing, Wuhan University, Chinad International Collaborative Centre for Geo-computation Studies, Wuhan University, China
a r t i c l e i n f o
Article history:Received 20 April 2010Received in revised form30 July 2010Accepted 13 August 2010Available online 9 September 2010
Keywords:DEM/DTMSurfaceGeneralizationTriangulationGeomorphology
a b s t r a c t
This paper reports an investigation into the generalization of a grid-based digital elevation model (DEM)for the purpose of terrain analysis. The focus is on the method of restructuring the grid-based surfaceelevation data to form a triangulated irregular network (TIN) that is optimized to keep the importantterrain features and slope morphology with the minimum number of sample points. The critical pointsof the terrain surface are extracted from the DEM based on their significance, measured not only by theirlocal relief, but also by their importance in identifying inherent geomorphological and drainage featuresin the DEM. A compound method is proposed by integrating the traditional point-additive and feature-pointmethods to construct a drainage-constrained TIN. The outcome is then comparedwith those derivedfrom other selected methods including filtering, point-additive or feature-point algorithms. The resultsshow that the compound approach is capable of taking advantage of both point-additive and feature-point algorithms to maximally keep the terrain features and to maintain RMSE at an acceptable level,while reducing the elevation data points by over 99%. The analytical result also shows that the proposedmethod outperforms the comparedmethodswith better control in retaining drainage features at the samelevel of RMSE.
© 2010 International Society for Photogrammetry and Remote Sensing, Inc. (ISPRS). Published byElsevier B.V. All rights reserved.
1. Introduction
With the widely available grid-based digital elevation models(DEM) and rapid development of state digital elevation databases,it is now critical to gain the ability to transform such fundamentalgeographical data into terrain parameters that can be moredirectly used by geo-spatial applications.Methods of digital terrainanalysis have been developed to extract terrain (hydrological ormorphological) parameters and features from digital elevationdata, including measurable terrain parameters such as elevation,surface area, slope, aspect, curvature, and catchment area;classifiable terrain features, such as peak, basin, saddle, riverjunctions, valley and ridge lines, channels, drainage divides,hills, and terraces; and the combination of them such as gullydensity (Wilson and Gallant, 2000; Hengl and Reuter, 2009). Ifa terrain parameter or feature of a land surface is accuratelymeasured or well identified or modelled, the other relevant
∗ Corresponding author at: Department of Geography and Centre for Geo-computation Studies, Hong Kong Baptist University, Kowloon Tong, Kowloon, HongKong, China. Tel.: +852 34115048; fax: +852 34115990.
E-mail address: [email protected] (Q. Zhou).
0924-2716/$ – see front matter© 2010 International Society for Photogrammetry anddoi:10.1016/j.isprsjprs.2010.08.005
terrain characteristics are more likely to be properly extracted andrepresented at the same time.
As a fundamental issue in geo-sciences, the effects of scale indata and data processing are well recognized as ‘‘one of the mostfundamental aspects of any research’’ (Quattrochi and Goodchild,1997). Terrain parameters and features are unexceptionallydependent upon the scale of applications. A small gently slopinghill in a flood plain may be ignored without much effect whendealing with problems in a large river valley. However, when thelocal drainage pattern is investigated, the presence of this small hillmight be critically important. The uncertainty of terrain analysis isalso very much controlled by the scale (Zhou and Liu, 2004). Whenthe spatial resolution of a DEM is coarsened, the derivatives such asslope, aspect, curvature, and drainage patterns may subsequentlyvary in different ways (Tang, 2000; Zhou and Liu, 2008).
When a coarser analytical scale is required, the original finer-resolution DEM needs to be generalized or simplified to reducedata redundancy. Meanwhile the general terrain features, orthe ‘‘metric quality’’ of the terrain (Li et al., 2005), need to beretained (Gesch, 1999). Numerous works have been reported onthe development of algorithms that retrieve significant terrainfeatures or the ‘skeleton’ from a grid-based DEM and then usethem to re-establish a DEM with a coarser resolution (i.e. grid-to-
Remote Sensing, Inc. (ISPRS). Published by Elsevier B.V. All rights reserved.
Q. Zhou, Y. Chen / ISPRS Journal of Photogrammetry and Remote Sensing 66 (2011) 38–45 39
grid DEM generalization) (Ai and Li, 2010; Zakšek and Podobnikar,2005).
An alternative common approach is to extract discrete 3Dpoints from the DEM and use them to reconstruct the terrain sur-face using a triangulated irregular network (TIN). Lee (1991) com-pared numerous methods and proposed four general approachesto the selection of ‘critical points’ as the skeleton, filter, hierarchy,and heuristic methods. Heckbert and Garland (1997) categorizedthe algorithms into six groups, namely, regular grid, hierarchicalsubdivision, feature, refinement, decimation, and optimal meth-ods. By considering their general approach and suitability for DEMderivatives, the existing algorithms can be grouped into five cat-egories, namely, 3D line generalization, filtering, point-additive,point-subtractive, and feature-point methods.
The 3D line generalization method is based on the Dou-glas–Peucker algorithm (Douglas and Peucker, 1973) that has beenwidely used in 2D cartographical generalization applications. Ituses perpendicular distance as a criterion to find the farthest pointfrom each line segment, so that the critical points can be detectedalong a curve. The principle has then been applied to 3D terrainsurface generalization to reduce the number of points that identifythe ridge and channel lines (Fowler and Little, 1979; Saalfeld, 1999;Fei and He, 2009). The filtering method employs a moving windowand evaluates the importance of each central point by calculatinghow well the point can be estimated by its neighbours. Chen andGuevara (1987) proposed the VIP algorithm, which measures the‘significance’ of each elevation point by the difference between theactual elevation and estimated elevation by the surroundings at thecentral point of the window. Weibel (1992) further fine-tuned themethod by improving the way that elevation estimation at eachpoint is derived using the global and selective filtering methods.The point-additivemethod is an iterativemethod,which can furtherbe categorized as a hierarchical subdivision (Lee, 1991; Weibel,1992; Heckbert and Garland, 1997) or refinement method (de Flo-riani, 1989; Heller, 1990; Chang, 2007) depending on whether thelocal or global re-triangulation is taken place at each iteration. Theprocess starts with the minimum initial approximation. On eachiteration, one or more points, which have the maximum variationto the surface defined by the TIN generated by the points selectedin the previous iterations, are added to form a new TIN, until thethreshold of desired error level is reached (de Floriani et al., 1984;DeHaemer and Zyda, 1991; Scarlatos and Pavlidis, 1992; Garlandand Heckbert, 1995). The point-subtractive method, also known asthe decimation or ‘‘drop heuristic’’ method (Lee, 1991), reversesthe point-additive process by starting a triangulation of all pointsand iteratively drops points from the triangulationuntil the thresh-old of simplification is reached (Lee and Schachter, 1980; Hugheset al., 1996). The feature-point method selects a set of importantterrain feature points, such as peaks, pits, ridges, valleys, and sad-dles, and uses them as the vertex set for triangulation (Southard,1991; Zakšek and Podobnikar, 2005; Vázquez and Pascual, 2008).Attempts were also made to combine these methods for particularapplication purposes. For example, Vivoni et al. (2004) reported theuse of the point-additive method embedded with the estimates ofthe steady-state hydrologic response to generate triangulated ter-rain models using the concept of ‘‘hydrological similarity’’. Basedon this concept, a TIN-based real-time integrated basin simulatorwas proposed (Ivanov et al., 2004).
From the point of view of terrain analysis, the above methodsshow some shortfalls that potentially limit their applicability. Thekey of the 3D line generalization method is to define 3D featurelines on which the linear generalization algorithms may apply.However, it is not always easy and consistent to extract the 3Dfeature lines from DEM, particularly when dealing with complexterrain in a large region. The filtering method only analyses thelocal relief and pays little attention to the overall morphological
shape of the landscape so that it may produce large distortions insurface representation. The point-additive and point-subtractivemethods represent the overall terrain surface morphology well,but ignore the shape and topological relationships of drainagefeatures, particularly in flatter areas. The feature-point methodretains large drainage features well, but it relies heavily onalgorithms that might not identify the feature points reliably andcould also badly miss the critical points on slopes, resulting inoverly simplified surface representation.
This study, therefore, investigates the method of restructuringthe grid-based surface elevation data to form a TIN that isoptimized to keep the important terrain features and slopemorphology with the minimum number of sample points. Criticalpoints (or the ‘turning points’) of a terrain surface are extractedfrom the grid-basedDEMbased on their significance,measured notonly by their local relief, but also by their importance in identifyinggeomorphological and drainage features. A compound method isproposed by combining the above point-additive and feature-pointmethods to extract critical points from the DEM for generating aconstrained TIN bounded by drainage lines. The outcome is thencompared with those derived from other methods based on thefilter, point-additive, or feature-point algorithms to analyse theeffectiveness and suitability of the approach.
2. Methodology
The method used for this study is composed of three parts,namely, surface critical point extraction, drainage-constrainedTIN generation, and statistical comparison and optimization.General programming tools were used to develop the above datageneralization algorithms, while some existing software such asSurfer1 and ArcGIS2 were used for data pre-processing and visualand statistical analysis.
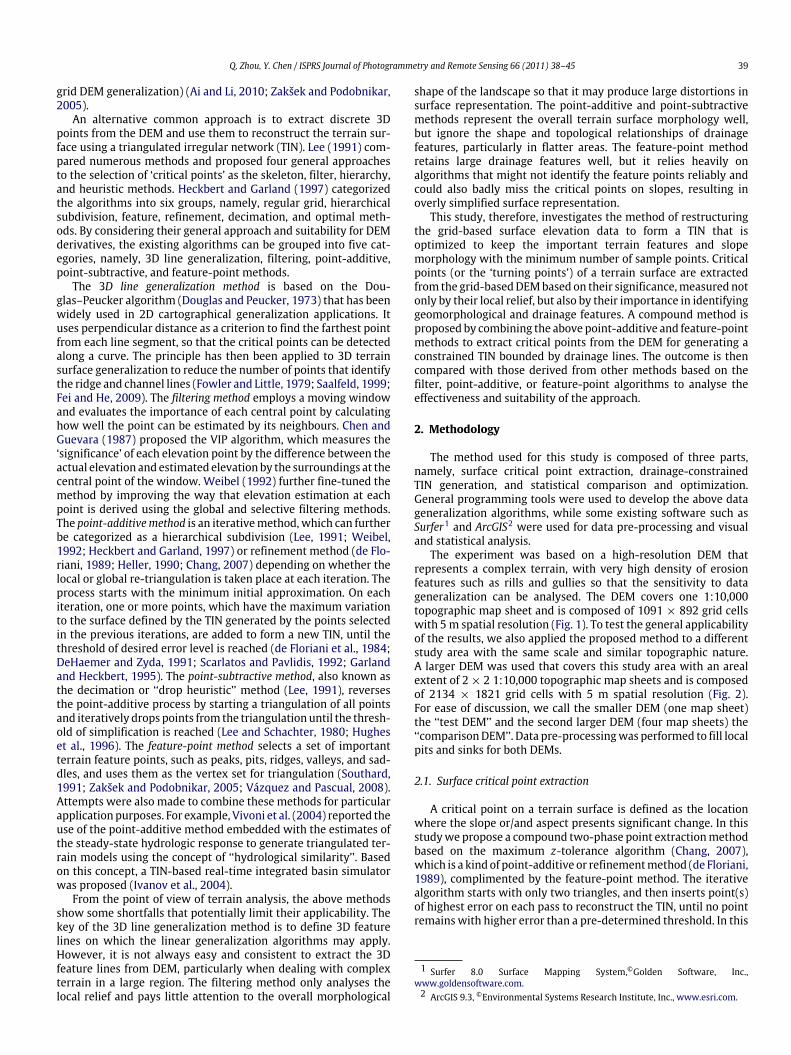
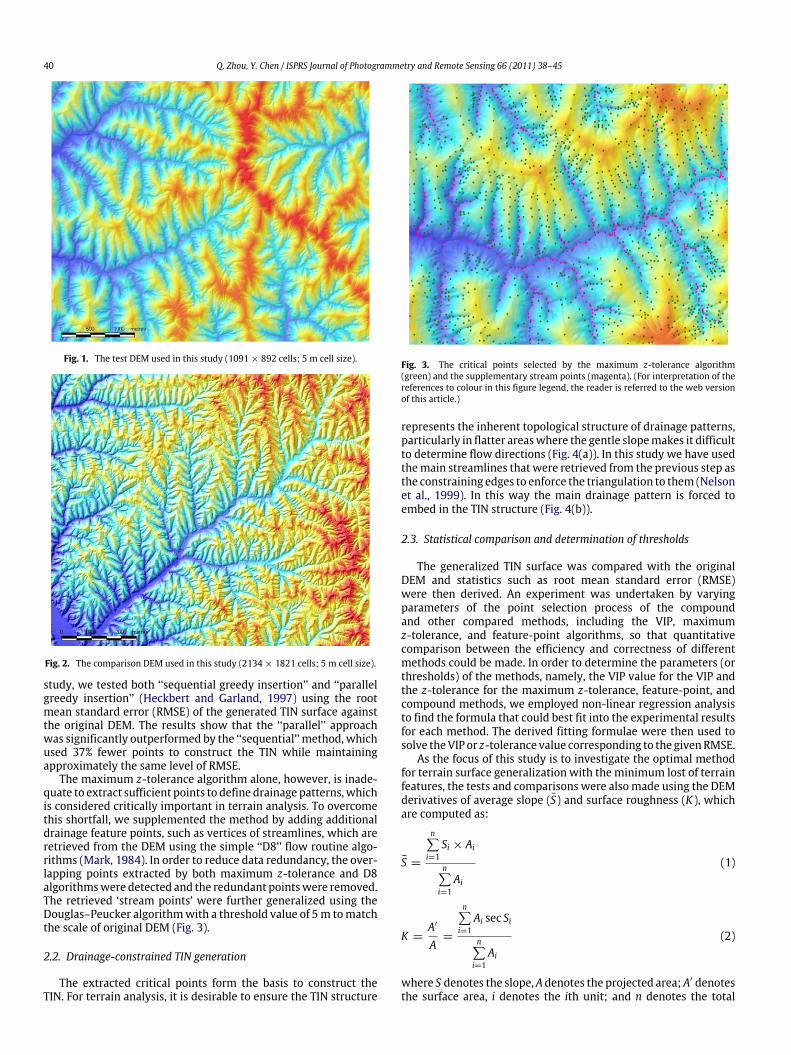
The experiment was based on a high-resolution DEM thatrepresents a complex terrain, with very high density of erosionfeatures such as rills and gullies so that the sensitivity to datageneralization can be analysed. The DEM covers one 1:10,000topographic map sheet and is composed of 1091 × 892 grid cellswith 5m spatial resolution (Fig. 1). To test the general applicabilityof the results, we also applied the proposed method to a differentstudy area with the same scale and similar topographic nature.A larger DEM was used that covers this study area with an arealextent of 2 × 2 1:10,000 topographic map sheets and is composedof 2134 × 1821 grid cells with 5 m spatial resolution (Fig. 2).For ease of discussion, we call the smaller DEM (one map sheet)the ‘‘test DEM’’ and the second larger DEM (four map sheets) the‘‘comparisonDEM’’. Data pre-processingwas performed to fill localpits and sinks for both DEMs.
2.1. Surface critical point extraction
A critical point on a terrain surface is defined as the locationwhere the slope or/and aspect presents significant change. In thisstudywe propose a compound two-phase point extractionmethodbased on the maximum z-tolerance algorithm (Chang, 2007),which is a kindof point-additive or refinementmethod (de Floriani,1989), complimented by the feature-point method. The iterativealgorithm starts with only two triangles, and then inserts point(s)of highest error on each pass to reconstruct the TIN, until no pointremains with higher error than a pre-determined threshold. In this
1 Surfer 8.0 Surface Mapping System,©Golden Software, Inc.,www.goldensoftware.com.2 ArcGIS 9.3, ©Environmental Systems Research Institute, Inc., www.esri.com.
40 Q. Zhou, Y. Chen / ISPRS Journal of Photogrammetry and Remote Sensing 66 (2011) 38–45
Fig. 1. The test DEM used in this study (1091 × 892 cells; 5 m cell size).
Fig. 2. The comparison DEM used in this study (2134 × 1821 cells; 5 m cell size).
study, we tested both ‘‘sequential greedy insertion’’ and ‘‘parallelgreedy insertion’’ (Heckbert and Garland, 1997) using the rootmean standard error (RMSE) of the generated TIN surface againstthe original DEM. The results show that the ‘‘parallel’’ approachwas significantly outperformed by the ‘‘sequential’’ method, whichused 37% fewer points to construct the TIN while maintainingapproximately the same level of RMSE.
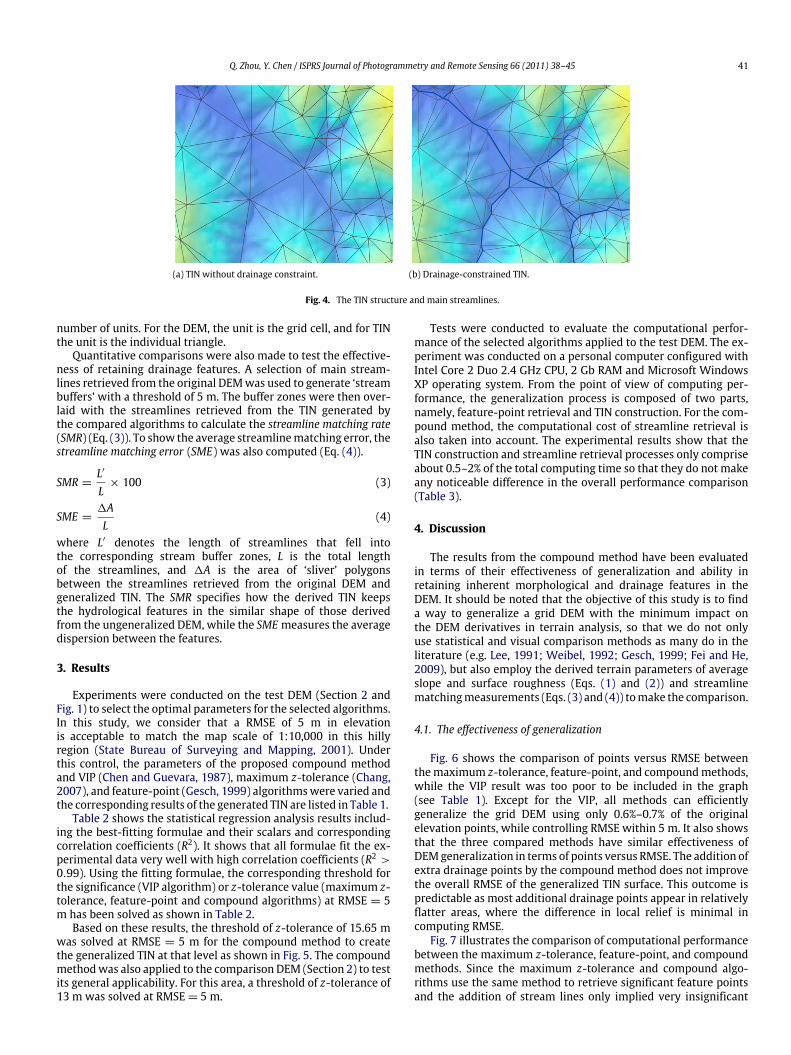
The maximum z-tolerance algorithm alone, however, is inade-quate to extract sufficient points to define drainage patterns,whichis considered critically important in terrain analysis. To overcomethis shortfall, we supplemented the method by adding additionaldrainage feature points, such as vertices of streamlines, which areretrieved from the DEM using the simple ‘‘D8’’ flow routine algo-rithms (Mark, 1984). In order to reduce data redundancy, the over-lapping points extracted by both maximum z-tolerance and D8algorithmswere detected and the redundant pointswere removed.The retrieved ‘stream points’ were further generalized using theDouglas–Peucker algorithmwith a threshold value of 5m tomatchthe scale of original DEM (Fig. 3).
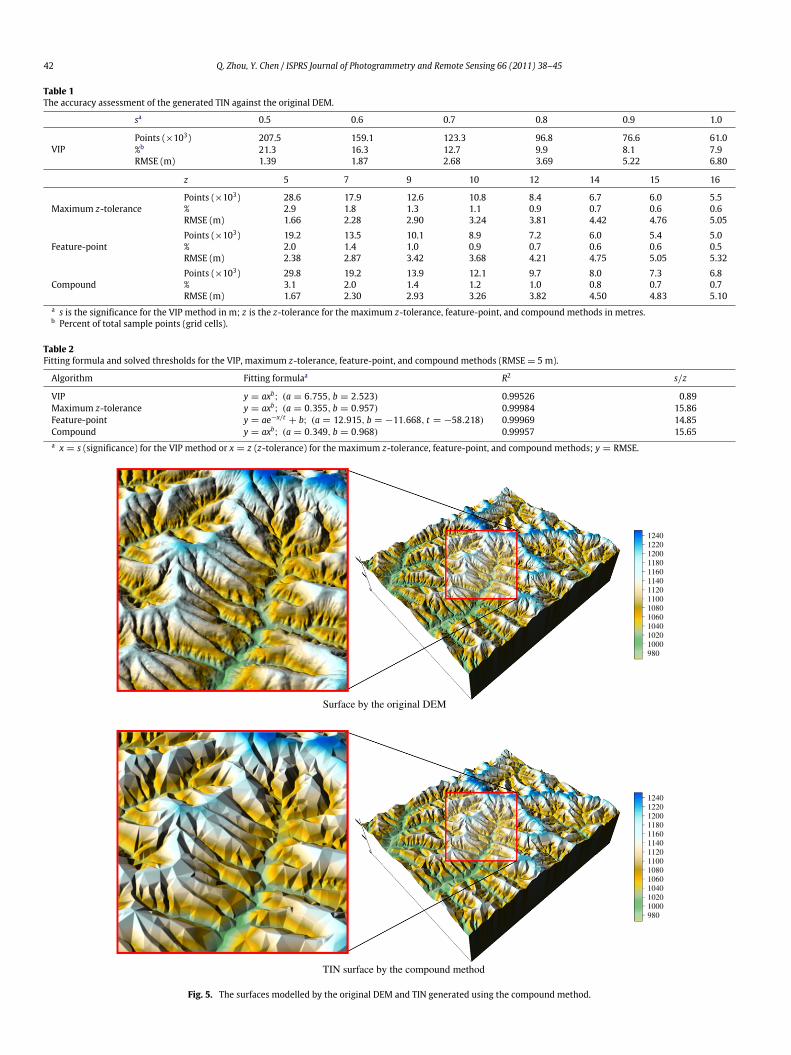
2.2. Drainage-constrained TIN generation
The extracted critical points form the basis to construct theTIN. For terrain analysis, it is desirable to ensure the TIN structure
Fig. 3. The critical points selected by the maximum z-tolerance algorithm(green) and the supplementary stream points (magenta). (For interpretation of thereferences to colour in this figure legend, the reader is referred to the web versionof this article.)
represents the inherent topological structure of drainage patterns,particularly in flatter areaswhere the gentle slopemakes it difficultto determine flow directions (Fig. 4(a)). In this study we have usedthemain streamlines that were retrieved from the previous step asthe constraining edges to enforce the triangulation to them (Nelsonet al., 1999). In this way the main drainage pattern is forced toembed in the TIN structure (Fig. 4(b)).
2.3. Statistical comparison and determination of thresholds
The generalized TIN surface was compared with the originalDEM and statistics such as root mean standard error (RMSE)were then derived. An experiment was undertaken by varyingparameters of the point selection process of the compoundand other compared methods, including the VIP, maximumz-tolerance, and feature-point algorithms, so that quantitativecomparison between the efficiency and correctness of differentmethods could be made. In order to determine the parameters (orthresholds) of the methods, namely, the VIP value for the VIP andthe z-tolerance for the maximum z-tolerance, feature-point, andcompound methods, we employed non-linear regression analysisto find the formula that could best fit into the experimental resultsfor each method. The derived fitting formulae were then used tosolve theVIP or z-tolerance value corresponding to the givenRMSE.
As the focus of this study is to investigate the optimal methodfor terrain surface generalization with the minimum lost of terrainfeatures, the tests and comparisons were alsomade using the DEMderivatives of average slope (S̄) and surface roughness (K ), whichare computed as:
S̄ =
n∑i=1
Si × Ai
n∑i=1
Ai
(1)
K =A′
A=
n∑i=1
Ai sec Si
n∑i=1
Ai
(2)
where S denotes the slope, A denotes the projected area; A′ denotesthe surface area, i denotes the ith unit; and n denotes the total
Q. Zhou, Y. Chen / ISPRS Journal of Photogrammetry and Remote Sensing 66 (2011) 38–45 41
(a) TIN without drainage constraint. (b) Drainage-constrained TIN.
Fig. 4. The TIN structure and main streamlines.
number of units. For the DEM, the unit is the grid cell, and for TINthe unit is the individual triangle.
Quantitative comparisons were also made to test the effective-ness of retaining drainage features. A selection of main stream-lines retrieved from the original DEMwas used to generate ‘streambuffers’ with a threshold of 5 m. The buffer zones were then over-laid with the streamlines retrieved from the TIN generated bythe compared algorithms to calculate the streamline matching rate(SMR) (Eq. (3)). To show the average streamlinematching error, thestreamline matching error (SME) was also computed (Eq. (4)).
SMR =L′
L× 100 (3)
SME =1AL
(4)
where L′ denotes the length of streamlines that fell intothe corresponding stream buffer zones, L is the total lengthof the streamlines, and 1A is the area of ‘sliver’ polygonsbetween the streamlines retrieved from the original DEM andgeneralized TIN. The SMR specifies how the derived TIN keepsthe hydrological features in the similar shape of those derivedfrom the ungeneralized DEM, while the SME measures the averagedispersion between the features.
3. Results
Experiments were conducted on the test DEM (Section 2 andFig. 1) to select the optimal parameters for the selected algorithms.In this study, we consider that a RMSE of 5 m in elevationis acceptable to match the map scale of 1:10,000 in this hillyregion (State Bureau of Surveying and Mapping, 2001). Underthis control, the parameters of the proposed compound methodand VIP (Chen and Guevara, 1987), maximum z-tolerance (Chang,2007), and feature-point (Gesch, 1999) algorithmswere varied andthe corresponding results of the generated TIN are listed in Table 1.
Table 2 shows the statistical regression analysis results includ-ing the best-fitting formulae and their scalars and correspondingcorrelation coefficients (R2). It shows that all formulae fit the ex-perimental data very well with high correlation coefficients (R2 >0.99). Using the fitting formulae, the corresponding threshold forthe significance (VIP algorithm) or z-tolerance value (maximum z-tolerance, feature-point and compound algorithms) at RMSE = 5m has been solved as shown in Table 2.
Based on these results, the threshold of z-tolerance of 15.65 mwas solved at RMSE = 5 m for the compound method to createthe generalized TIN at that level as shown in Fig. 5. The compoundmethodwas also applied to the comparison DEM (Section 2) to testits general applicability. For this area, a threshold of z-tolerance of13 m was solved at RMSE = 5 m.
Tests were conducted to evaluate the computational perfor-mance of the selected algorithms applied to the test DEM. The ex-periment was conducted on a personal computer configured withIntel Core 2 Duo 2.4 GHz CPU, 2 Gb RAM and Microsoft WindowsXP operating system. From the point of view of computing per-formance, the generalization process is composed of two parts,namely, feature-point retrieval and TIN construction. For the com-pound method, the computational cost of streamline retrieval isalso taken into account. The experimental results show that theTIN construction and streamline retrieval processes only compriseabout 0.5–2% of the total computing time so that they do not makeany noticeable difference in the overall performance comparison(Table 3).
4. Discussion
The results from the compound method have been evaluatedin terms of their effectiveness of generalization and ability inretaining inherent morphological and drainage features in theDEM. It should be noted that the objective of this study is to finda way to generalize a grid DEM with the minimum impact onthe DEM derivatives in terrain analysis, so that we do not onlyuse statistical and visual comparison methods as many do in theliterature (e.g. Lee, 1991; Weibel, 1992; Gesch, 1999; Fei and He,2009), but also employ the derived terrain parameters of averageslope and surface roughness (Eqs. (1) and (2)) and streamlinematchingmeasurements (Eqs. (3) and (4)) tomake the comparison.
4.1. The effectiveness of generalization
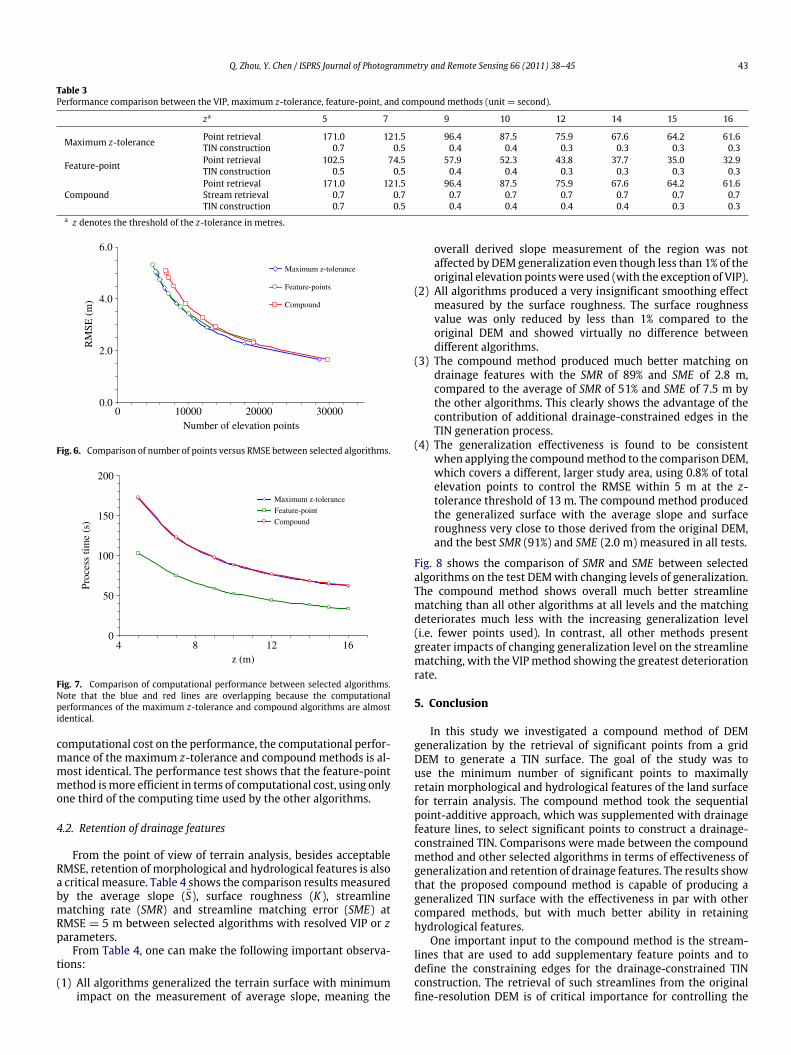
Fig. 6 shows the comparison of points versus RMSE betweenthemaximum z-tolerance, feature-point, and compoundmethods,while the VIP result was too poor to be included in the graph(see Table 1). Except for the VIP, all methods can efficientlygeneralize the grid DEM using only 0.6%–0.7% of the originalelevation points, while controlling RMSE within 5 m. It also showsthat the three compared methods have similar effectiveness ofDEMgeneralization in terms of points versus RMSE. The addition ofextra drainage points by the compound method does not improvethe overall RMSE of the generalized TIN surface. This outcome ispredictable as most additional drainage points appear in relativelyflatter areas, where the difference in local relief is minimal incomputing RMSE.
Fig. 7 illustrates the comparison of computational performancebetween the maximum z-tolerance, feature-point, and compoundmethods. Since the maximum z-tolerance and compound algo-rithms use the same method to retrieve significant feature pointsand the addition of stream lines only implied very insignificant
42 Q. Zhou, Y. Chen / ISPRS Journal of Photogrammetry and Remote Sensing 66 (2011) 38–45
Table 1The accuracy assessment of the generated TIN against the original DEM.
sa 0.5 0.6 0.7 0.8 0.9 1.0
VIPPoints (×103) 207.5 159.1 123.3 96.8 76.6 61.0%b 21.3 16.3 12.7 9.9 8.1 7.9RMSE (m) 1.39 1.87 2.68 3.69 5.22 6.80
z 5 7 9 10 12 14 15 16
Maximum z-tolerancePoints (×103) 28.6 17.9 12.6 10.8 8.4 6.7 6.0 5.5% 2.9 1.8 1.3 1.1 0.9 0.7 0.6 0.6RMSE (m) 1.66 2.28 2.90 3.24 3.81 4.42 4.76 5.05
Feature-pointPoints (×103) 19.2 13.5 10.1 8.9 7.2 6.0 5.4 5.0% 2.0 1.4 1.0 0.9 0.7 0.6 0.6 0.5RMSE (m) 2.38 2.87 3.42 3.68 4.21 4.75 5.05 5.32
CompoundPoints (×103) 29.8 19.2 13.9 12.1 9.7 8.0 7.3 6.8% 3.1 2.0 1.4 1.2 1.0 0.8 0.7 0.7RMSE (m) 1.67 2.30 2.93 3.26 3.82 4.50 4.83 5.10
a s is the significance for the VIP method in m; z is the z-tolerance for the maximum z-tolerance, feature-point, and compound methods in metres.b Percent of total sample points (grid cells).
Table 2Fitting formula and solved thresholds for the VIP, maximum z-tolerance, feature-point, and compound methods (RMSE = 5 m).
Algorithm Fitting formulaa R2 s/z
VIP y = axb; (a = 6.755, b = 2.523) 0.99526 0.89Maximum z-tolerance y = axb; (a = 0.355, b = 0.957) 0.99984 15.86Feature-point y = ae−x/t
+ b; (a = 12.915, b = −11.668, t = −58.218) 0.99969 14.85Compound y = axb; (a = 0.349, b = 0.968) 0.99957 15.65a x = s (significance) for the VIP method or x = z (z-tolerance) for the maximum z-tolerance, feature-point, and compound methods; y = RMSE.
Surface by the original DEM
TIN surface by the compound method
1240122012001180116011401120110010801060104010201000980
1240122012001180116011401120110010801060104010201000980
Fig. 5. The surfaces modelled by the original DEM and TIN generated using the compound method.
Q. Zhou, Y. Chen / ISPRS Journal of Photogrammetry and Remote Sensing 66 (2011) 38–45 43
Table 3Performance comparison between the VIP, maximum z-tolerance, feature-point, and compound methods (unit = second).
za 5 7 9 10 12 14 15 16
Maximum z-tolerance Point retrieval 171.0 121.5 96.4 87.5 75.9 67.6 64.2 61.6TIN construction 0.7 0.5 0.4 0.4 0.3 0.3 0.3 0.3
Feature-point Point retrieval 102.5 74.5 57.9 52.3 43.8 37.7 35.0 32.9TIN construction 0.5 0.5 0.4 0.4 0.3 0.3 0.3 0.3
CompoundPoint retrieval 171.0 121.5 96.4 87.5 75.9 67.6 64.2 61.6Stream retrieval 0.7 0.7 0.7 0.7 0.7 0.7 0.7 0.7TIN construction 0.7 0.5 0.4 0.4 0.4 0.4 0.3 0.3
a z denotes the threshold of the z-tolerance in metres.
RM
SE (
m)
0.0
2.0
4.0
6.0
Number of elevation points0 10000 20000 30000
Maximum z-tolerance
Feature-points
Compound
Fig. 6. Comparison of number of points versus RMSE between selected algorithms.
Proc
ess
time
(s)
0
50
100
150
200
4 12 168z (m)
Maximum z-tolerance
Feature-point
Compound
Fig. 7. Comparison of computational performance between selected algorithms.Note that the blue and red lines are overlapping because the computationalperformances of the maximum z-tolerance and compound algorithms are almostidentical.
computational cost on the performance, the computational perfor-mance of the maximum z-tolerance and compound methods is al-most identical. The performance test shows that the feature-pointmethod ismore efficient in terms of computational cost, using onlyone third of the computing time used by the other algorithms.
4.2. Retention of drainage features
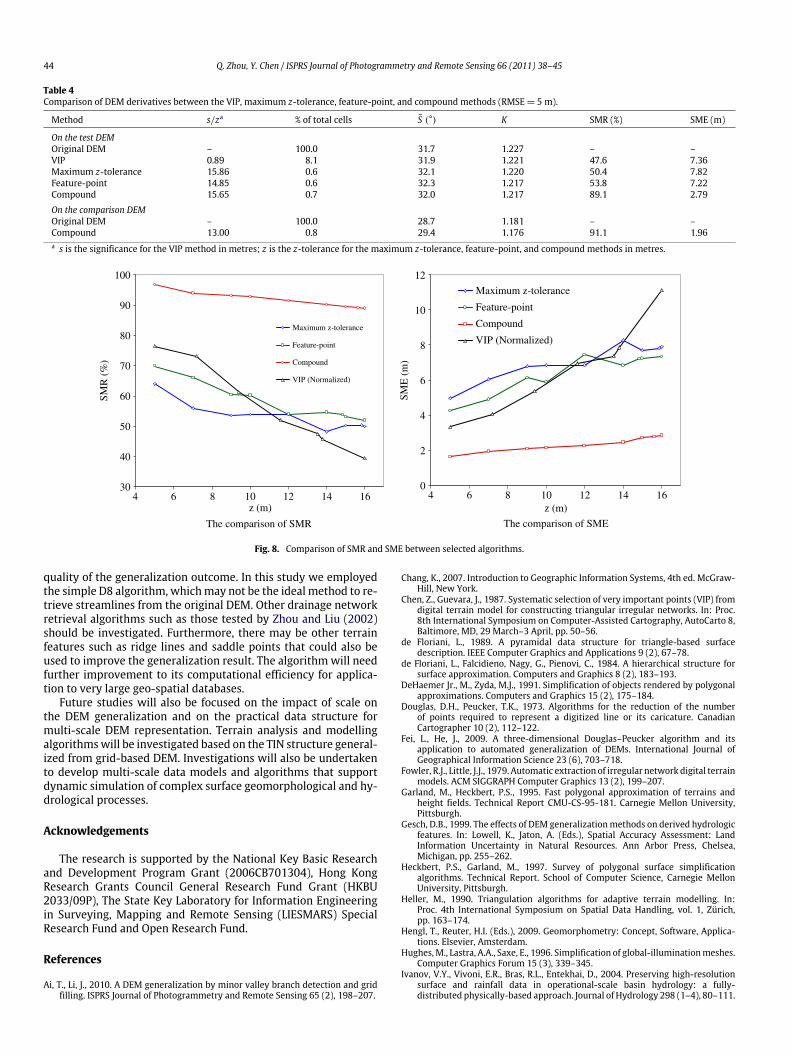
From the point of view of terrain analysis, besides acceptableRMSE, retention of morphological and hydrological features is alsoa critical measure. Table 4 shows the comparison results measuredby the average slope (S̄), surface roughness (K ), streamlinematching rate (SMR) and streamline matching error (SME) atRMSE = 5 m between selected algorithms with resolved VIP or zparameters.
From Table 4, one can make the following important observa-tions:(1) All algorithms generalized the terrain surface with minimum
impact on the measurement of average slope, meaning the
overall derived slope measurement of the region was notaffected by DEMgeneralization even though less than 1% of theoriginal elevation pointswere used (with the exception of VIP).
(2) All algorithms produced a very insignificant smoothing effectmeasured by the surface roughness. The surface roughnessvalue was only reduced by less than 1% compared to theoriginal DEM and showed virtually no difference betweendifferent algorithms.
(3) The compound method produced much better matching ondrainage features with the SMR of 89% and SME of 2.8 m,compared to the average of SMR of 51% and SME of 7.5 m bythe other algorithms. This clearly shows the advantage of thecontribution of additional drainage-constrained edges in theTIN generation process.
(4) The generalization effectiveness is found to be consistentwhen applying the compoundmethod to the comparison DEM,which covers a different, larger study area, using 0.8% of totalelevation points to control the RMSE within 5 m at the z-tolerance threshold of 13 m. The compound method producedthe generalized surface with the average slope and surfaceroughness very close to those derived from the original DEM,and the best SMR (91%) and SME (2.0 m) measured in all tests.
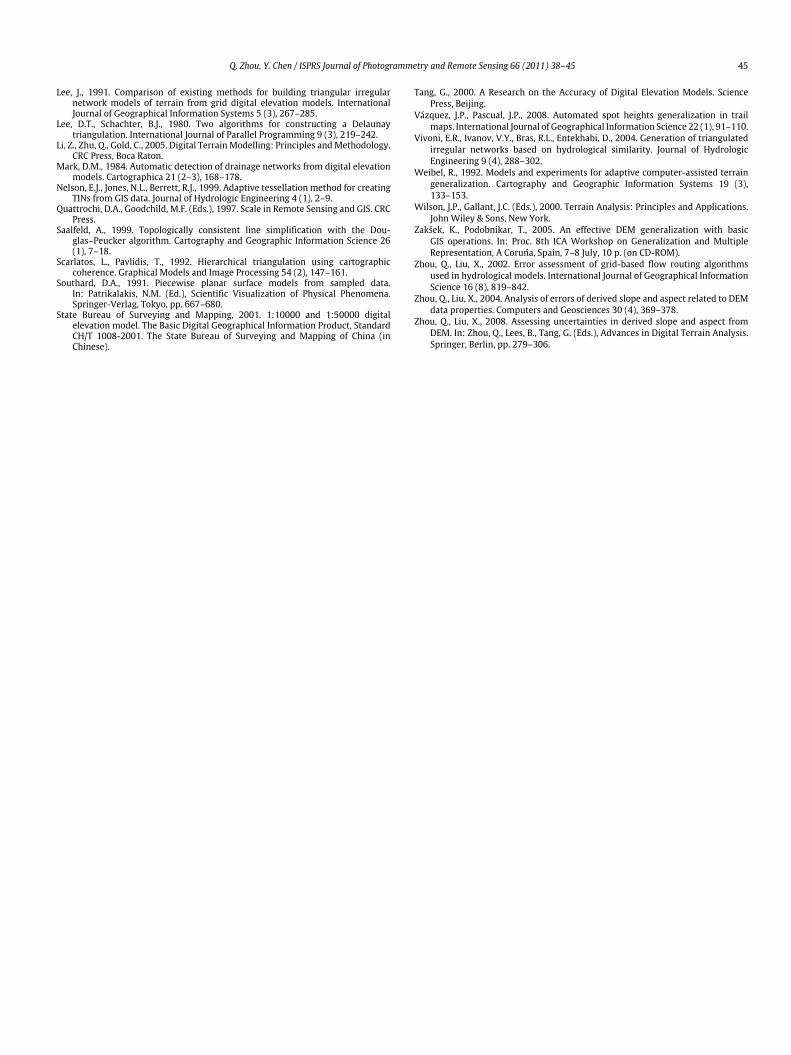
Fig. 8 shows the comparison of SMR and SME between selectedalgorithms on the test DEMwith changing levels of generalization.The compound method shows overall much better streamlinematching than all other algorithms at all levels and the matchingdeteriorates much less with the increasing generalization level(i.e. fewer points used). In contrast, all other methods presentgreater impacts of changing generalization level on the streamlinematching, with the VIPmethod showing the greatest deteriorationrate.
5. Conclusion
In this study we investigated a compound method of DEMgeneralization by the retrieval of significant points from a gridDEM to generate a TIN surface. The goal of the study was touse the minimum number of significant points to maximallyretain morphological and hydrological features of the land surfacefor terrain analysis. The compound method took the sequentialpoint-additive approach, which was supplemented with drainagefeature lines, to select significant points to construct a drainage-constrained TIN. Comparisons were made between the compoundmethod and other selected algorithms in terms of effectiveness ofgeneralization and retention of drainage features. The results showthat the proposed compound method is capable of producing ageneralized TIN surface with the effectiveness in par with othercompared methods, but with much better ability in retaininghydrological features.
One important input to the compound method is the stream-lines that are used to add supplementary feature points and todefine the constraining edges for the drainage-constrained TINconstruction. The retrieval of such streamlines from the originalfine-resolution DEM is of critical importance for controlling the
44 Q. Zhou, Y. Chen / ISPRS Journal of Photogrammetry and Remote Sensing 66 (2011) 38–45
Table 4Comparison of DEM derivatives between the VIP, maximum z-tolerance, feature-point, and compound methods (RMSE = 5 m).
Method s/za % of total cells S̄ (°) K SMR (%) SME (m)
On the test DEMOriginal DEM – 100.0 31.7 1.227 – –VIP 0.89 8.1 31.9 1.221 47.6 7.36Maximum z-tolerance 15.86 0.6 32.1 1.220 50.4 7.82Feature-point 14.85 0.6 32.3 1.217 53.8 7.22Compound 15.65 0.7 32.0 1.217 89.1 2.79
On the comparison DEMOriginal DEM – 100.0 28.7 1.181 – –Compound 13.00 0.8 29.4 1.176 91.1 1.96a s is the significance for the VIP method in metres; z is the z-tolerance for the maximum z-tolerance, feature-point, and compound methods in metres.
The comparison of SMR The comparison of SME
SMR
(%
)
30
40
50
60
70
80
90
100
z (m)4 10 12 14 166 8
Maximum z-tolerance
Feature-point
Compound
VIP (Normalized)
SME
(m
)
0
2
4
6
8
10
12
Maximum z-tolerance
Feature-point
Compound
VIP (Normalized)
z (m)4 8 10 12 14 166
Fig. 8. Comparison of SMR and SME between selected algorithms.
quality of the generalization outcome. In this study we employedthe simple D8 algorithm, whichmay not be the ideal method to re-trieve streamlines from the original DEM. Other drainage networkretrieval algorithms such as those tested by Zhou and Liu (2002)should be investigated. Furthermore, there may be other terrainfeatures such as ridge lines and saddle points that could also beused to improve the generalization result. The algorithmwill needfurther improvement to its computational efficiency for applica-tion to very large geo-spatial databases.
Future studies will also be focused on the impact of scale onthe DEM generalization and on the practical data structure formulti-scale DEM representation. Terrain analysis and modellingalgorithmswill be investigated based on the TIN structure general-ized from grid-based DEM. Investigations will also be undertakento develop multi-scale data models and algorithms that supportdynamic simulation of complex surface geomorphological and hy-drological processes.
Acknowledgements
The research is supported by the National Key Basic Researchand Development Program Grant (2006CB701304), Hong KongResearch Grants Council General Research Fund Grant (HKBU2033/09P), The State Key Laboratory for Information Engineeringin Surveying, Mapping and Remote Sensing (LIESMARS) SpecialResearch Fund and Open Research Fund.
References
Ai, T., Li, J., 2010. A DEM generalization by minor valley branch detection and gridfilling. ISPRS Journal of Photogrammetry and Remote Sensing 65 (2), 198–207.
Chang, K., 2007. Introduction to Geographic Information Systems, 4th ed. McGraw-Hill, New York.
Chen, Z., Guevara, J., 1987. Systematic selection of very important points (VIP) fromdigital terrain model for constructing triangular irregular networks. In: Proc.8th International Symposium on Computer-Assisted Cartography, AutoCarto 8,Baltimore, MD, 29 March–3 April, pp. 50–56.
de Floriani, L., 1989. A pyramidal data structure for triangle-based surfacedescription. IEEE Computer Graphics and Applications 9 (2), 67–78.
de Floriani, L., Falcidieno, Nagy, G., Pienovi, C., 1984. A hierarchical structure forsurface approximation. Computers and Graphics 8 (2), 183–193.
DeHaemer Jr., M., Zyda, M.J., 1991. Simplification of objects rendered by polygonalapproximations. Computers and Graphics 15 (2), 175–184.
Douglas, D.H., Peucker, T.K., 1973. Algorithms for the reduction of the numberof points required to represent a digitized line or its caricature. CanadianCartographer 10 (2), 112–122.
Fei, L., He, J., 2009. A three-dimensional Douglas–Peucker algorithm and itsapplication to automated generalization of DEMs. International Journal ofGeographical Information Science 23 (6), 703–718.
Fowler, R.J., Little, J.J., 1979. Automatic extraction of irregular network digital terrainmodels. ACM SIGGRAPH Computer Graphics 13 (2), 199–207.
Garland, M., Heckbert, P.S., 1995. Fast polygonal approximation of terrains andheight fields. Technical Report CMU-CS-95-181. Carnegie Mellon University,Pittsburgh.
Gesch, D.B., 1999. The effects of DEM generalizationmethods on derived hydrologicfeatures. In: Lowell, K., Jaton, A. (Eds.), Spatial Accuracy Assessment: LandInformation Uncertainty in Natural Resources. Ann Arbor Press, Chelsea,Michigan, pp. 255–262.
Heckbert, P.S., Garland, M., 1997. Survey of polygonal surface simplificationalgorithms. Technical Report. School of Computer Science, Carnegie MellonUniversity, Pittsburgh.
Heller, M., 1990. Triangulation algorithms for adaptive terrain modelling. In:Proc. 4th International Symposium on Spatial Data Handling, vol. 1, Zürich,pp. 163–174.
Hengl, T., Reuter, H.I. (Eds.), 2009. Geomorphometry: Concept, Software, Applica-tions. Elsevier, Amsterdam.
Hughes,M., Lastra, A.A., Saxe, E., 1996. Simplification of global-illuminationmeshes.Computer Graphics Forum 15 (3), 339–345.
Ivanov, V.Y., Vivoni, E.R., Bras, R.L., Entekhai, D., 2004. Preserving high-resolutionsurface and rainfall data in operational-scale basin hydrology: a fully-distributed physically-based approach. Journal of Hydrology 298 (1–4), 80–111.
Q. Zhou, Y. Chen / ISPRS Journal of Photogrammetry and Remote Sensing 66 (2011) 38–45 45
Lee, J., 1991. Comparison of existing methods for building triangular irregularnetwork models of terrain from grid digital elevation models. InternationalJournal of Geographical Information Systems 5 (3), 267–285.
Lee, D.T., Schachter, B.J., 1980. Two algorithms for constructing a Delaunaytriangulation. International Journal of Parallel Programming 9 (3), 219–242.
Li, Z., Zhu, Q., Gold, C., 2005. Digital Terrain Modelling: Principles andMethodology.CRC Press, Boca Raton.
Mark, D.M., 1984. Automatic detection of drainage networks from digital elevationmodels. Cartographica 21 (2–3), 168–178.
Nelson, E.J., Jones, N.L., Berrett, R.J., 1999. Adaptive tessellation method for creatingTINs from GIS data. Journal of Hydrologic Engineering 4 (1), 2–9.
Quattrochi, D.A., Goodchild, M.F. (Eds.), 1997. Scale in Remote Sensing and GIS. CRCPress.
Saalfeld, A., 1999. Topologically consistent line simplification with the Dou-glas–Peucker algorithm. Cartography and Geographic Information Science 26(1), 7–18.
Scarlatos, L., Pavlidis, T., 1992. Hierarchical triangulation using cartographiccoherence. Graphical Models and Image Processing 54 (2), 147–161.
Southard, D.A., 1991. Piecewise planar surface models from sampled data.In: Patrikalakis, N.M. (Ed.), Scientific Visualization of Physical Phenomena.Springer-Verlag, Tokyo, pp. 667–680.
State Bureau of Surveying and Mapping, 2001. 1:10000 and 1:50000 digitalelevation model. The Basic Digital Geographical Information Product, StandardCH/T 1008-2001. The State Bureau of Surveying and Mapping of China (inChinese).
Tang, G., 2000. A Research on the Accuracy of Digital Elevation Models. SciencePress, Beijing.
Vázquez, J.P., Pascual, J.P., 2008. Automated spot heights generalization in trailmaps. International Journal of Geographical Information Science 22 (1), 91–110.
Vivoni, E.R., Ivanov, V.Y., Bras, R.L., Entekhabi, D., 2004. Generation of triangulatedirregular networks based on hydrological similarity. Journal of HydrologicEngineering 9 (4), 288–302.
Weibel, R., 1992. Models and experiments for adaptive computer-assisted terraingeneralization. Cartography and Geographic Information Systems 19 (3),133–153.
Wilson, J.P., Gallant, J.C. (Eds.), 2000. Terrain Analysis: Principles and Applications.John Wiley & Sons, New York.
Zakšek, K., Podobnikar, T., 2005. An effective DEM generalization with basicGIS operations. In: Proc. 8th ICA Workshop on Generalization and MultipleRepresentation, A Coruńa, Spain, 7–8 July, 10 p. (on CD-ROM).
Zhou, Q., Liu, X., 2002. Error assessment of grid-based flow routing algorithmsused in hydrological models. International Journal of Geographical InformationScience 16 (8), 819–842.
Zhou, Q., Liu, X., 2004. Analysis of errors of derived slope and aspect related to DEMdata properties. Computers and Geosciences 30 (4), 369–378.
Zhou, Q., Liu, X., 2008. Assessing uncertainties in derived slope and aspect fromDEM. In: Zhou, Q., Lees, B., Tang, G. (Eds.), Advances in Digital Terrain Analysis.Springer, Berlin, pp. 279–306.