Embed Size (px)
Citation preview
Copyright UCT
Generational Differences in Motivation Drivers: A Case Study at Telecom Namibia
MBA Research Report December 2009
1
Generational Differences in Motivation Drivers: A Case Study at Telecom Namibia
A Research Report
presented to
In partial fulfilment
of the requirements for the
Masters of Business Administration Degree
Prepared by
Hiwilepo Laban Hiwilepo (MOD 737)
December 2009
Supervisor: Dr Linda Ronnie
Copyright UCT
Generational Differences in Motivation Drivers: A Case Study at Telecom Namibia
MBA Research Report December 2009 2
Acknowledgements
I express my gratitude and sincere thanks to Dr Linda Ronnie for accepting to be my
supervisor. I am very thankful for her support and guidance during the entire process of
my research. I thank her for guiding and giving me helpful suggestions that shaped my
thesis.
I would also like to thank fellow MBA students for the fun and experiences on the MBA
studies.
I thank my family for having faith in me and for all the support they gave me during the
studies.

Copyright UCT
Generational Differences in Motivation Drivers: A Case Study at Telecom Namibia
MBA Research Report December 2009 3
Declaration
I certify that I have prepared this report on my own without any inadmissible outside help.
All references used are reported in the report.
Signed: Hiwilepo Laban Hiwilepo
2009/12/10
Copyright UCT
Generational Differences in Motivation Drivers: A Case Study at Telecom Namibia
MBA Research Report December 2009 4
Abstract
The purpose of this study is to explore whether motivational drivers differences exist
across the three generations (Baby Boomers, Generation-X and Generation-Y) of
workers at Telecom Namibia.
What is fundamentally paramount in an organisation today is that employees are not only
able to work but must also be willing to work. The ability to work is characterised by
having the necessary skills and knowledge to function in one’s work. The employee
willingness to work is influenced by the individual but equally dependent upon how that
person is managed in the work environment. Motivation is about what makes people act
or behave in the way they do.
It is often said that the key to success in an organisation is its people. Motivating and
retaining knowledge workers have become important in a knowledge-based and tight
labour market, where changing knowledge management practices and global
convergence of technology has redefined the nature of work. Horwitz (2003)
KEY WORDS: age groups, Generation-Y, Generation-X, Baby Boomers, employee motivation, talent management,
employee engagement
Copyright UCT
Generational Differences in Motivation Drivers: A Case Study at Telecom Namibia
MBA Research Report December 2009 5
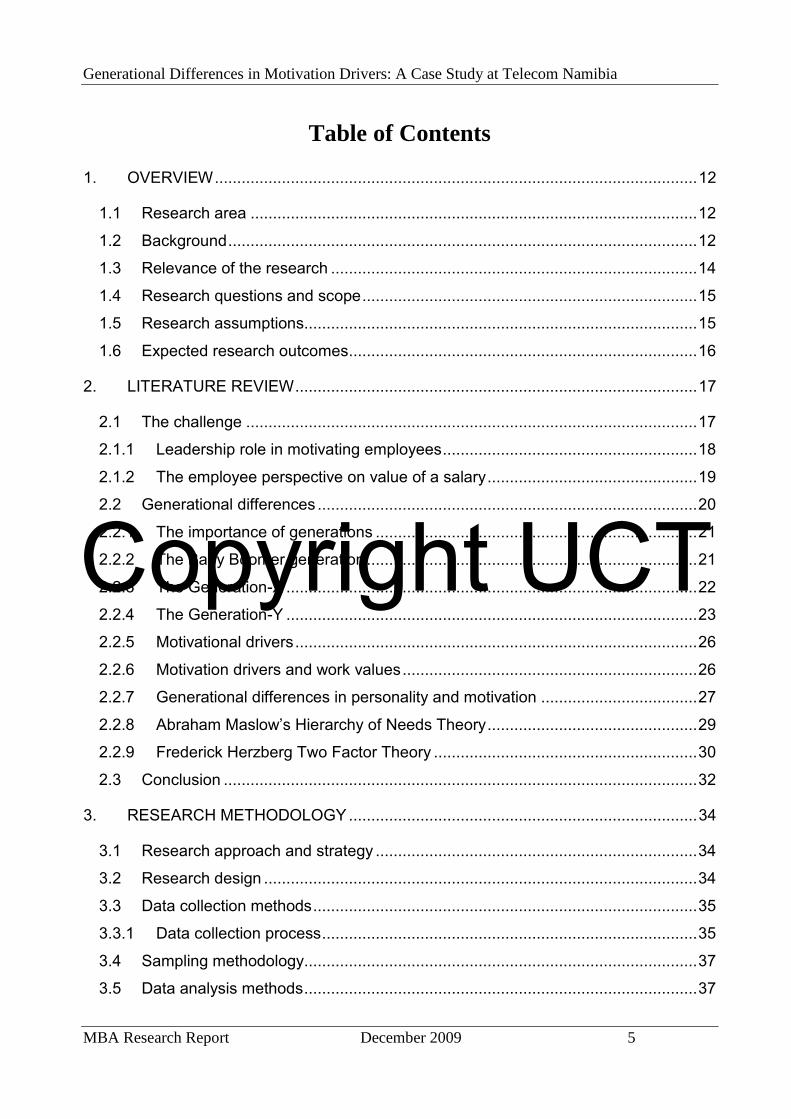
Table of Contents
1. OVERVIEW ............................................................................................................ 12
1.1 Research area .................................................................................................... 12
1.2 Background ......................................................................................................... 12
1.3 Relevance of the research .................................................................................. 14
1.4 Research questions and scope ........................................................................... 15
1.5 Research assumptions........................................................................................ 15
1.6 Expected research outcomes .............................................................................. 16
2. LITERATURE REVIEW .......................................................................................... 17
2.1 The challenge ..................................................................................................... 17
2.1.1 Leadership role in motivating employees ......................................................... 18
2.1.2 The employee perspective on value of a salary ............................................... 19
2.2 Generational differences ..................................................................................... 20
2.2.1 The importance of generations ........................................................................ 21
2.2.2 The Baby Boomer generation .......................................................................... 21
2.2.3 The Generation-X ............................................................................................ 22
2.2.4 The Generation-Y ............................................................................................ 23
2.2.5 Motivational drivers .......................................................................................... 26
2.2.6 Motivation drivers and work values .................................................................. 26
2.2.7 Generational differences in personality and motivation ................................... 27
2.2.8 Abraham Maslow’s Hierarchy of Needs Theory ............................................... 29
2.2.9 Frederick Herzberg Two Factor Theory ........................................................... 30
2.3 Conclusion .......................................................................................................... 32
3. RESEARCH METHODOLOGY .............................................................................. 34
3.1 Research approach and strategy ........................................................................ 34
3.2 Research design ................................................................................................. 34
3.3 Data collection methods ...................................................................................... 35
3.3.1 Data collection process .................................................................................... 35
3.4 Sampling methodology........................................................................................ 37
3.5 Data analysis methods ........................................................................................ 37
Copyright UCT
Generational Differences in Motivation Drivers: A Case Study at Telecom Namibia
MBA Research Report December 2009 6
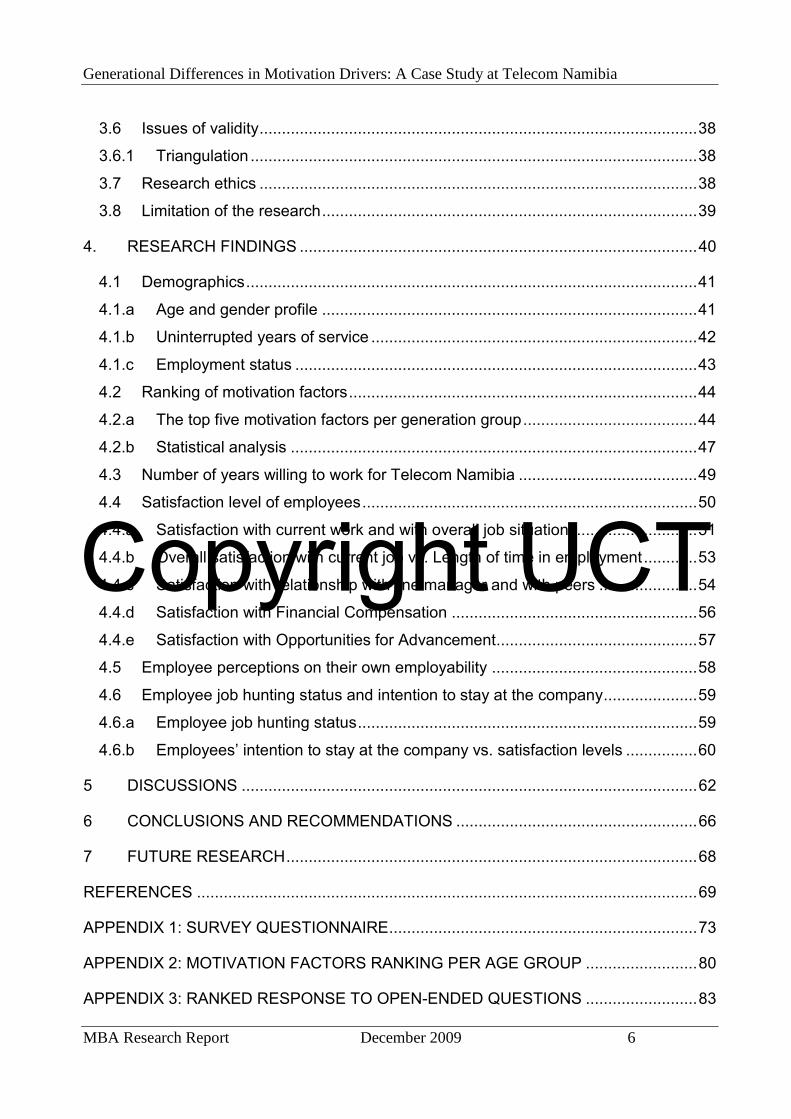
3.6 Issues of validity .................................................................................................. 38
3.6.1 Triangulation .................................................................................................... 38
3.7 Research ethics .................................................................................................. 38
3.8 Limitation of the research .................................................................................... 39
4. RESEARCH FINDINGS ......................................................................................... 40
4.1 Demographics ..................................................................................................... 41
4.1.a Age and gender profile .................................................................................... 41
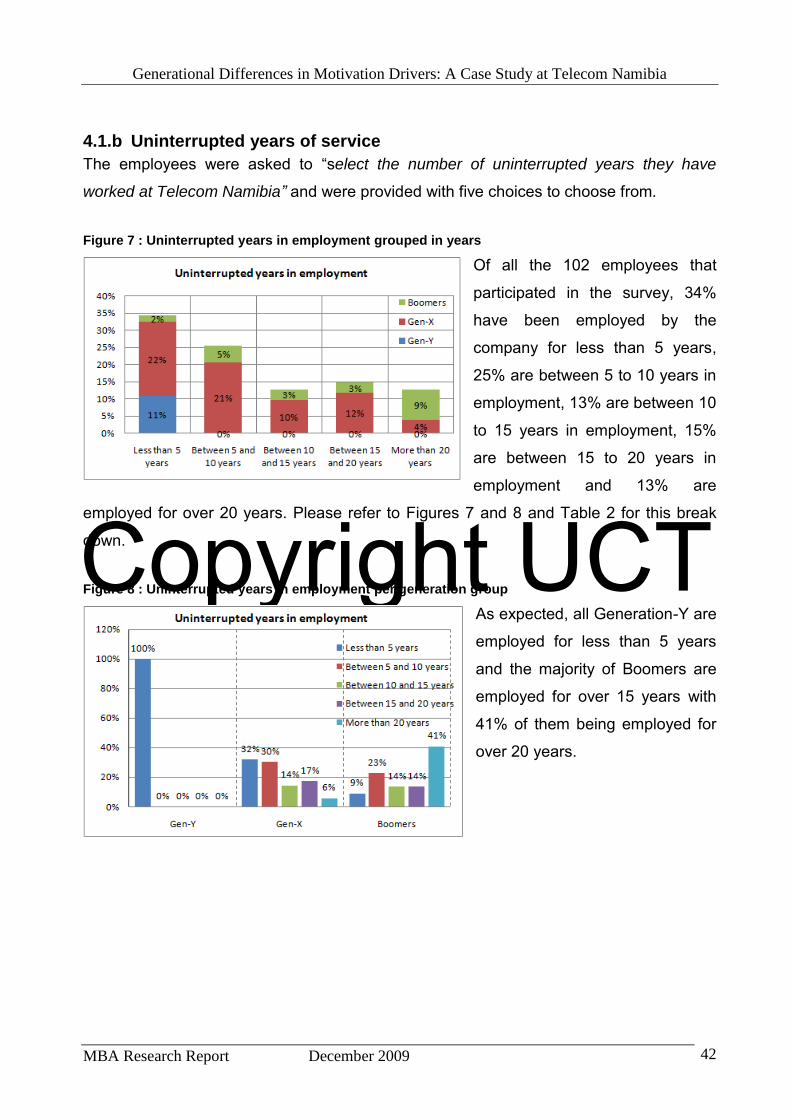
4.1.b Uninterrupted years of service ......................................................................... 42
4.1.c Employment status .......................................................................................... 43
4.2 Ranking of motivation factors .............................................................................. 44
4.2.a The top five motivation factors per generation group ....................................... 44
4.2.b Statistical analysis ........................................................................................... 47
4.3 Number of years willing to work for Telecom Namibia ........................................ 49
4.4 Satisfaction level of employees ........................................................................... 50
4.4.a Satisfaction with current work and with overall job situation ............................ 51
4.4.b Overall satisfaction with current job vs. Length of time in employment ............ 53
4.4.c Satisfaction with relationship with line manager and with peers ...................... 54
4.4.d Satisfaction with Financial Compensation ....................................................... 56
4.4.e Satisfaction with Opportunities for Advancement ............................................. 57
4.5 Employee perceptions on their own employability .............................................. 58
4.6 Employee job hunting status and intention to stay at the company ..................... 59
4.6.a Employee job hunting status ............................................................................ 59
4.6.b Employees’ intention to stay at the company vs. satisfaction levels ................ 60
5 DISCUSSIONS ...................................................................................................... 62
6 CONCLUSIONS AND RECOMMENDATIONS ...................................................... 66
7 FUTURE RESEARCH ............................................................................................ 68
REFERENCES ................................................................................................................ 69
APPENDIX 1: SURVEY QUESTIONNAIRE ..................................................................... 73
APPENDIX 2: MOTIVATION FACTORS RANKING PER AGE GROUP ......................... 80
APPENDIX 3: RANKED RESPONSE TO OPEN-ENDED QUESTIONS ......................... 83

Copyright UCT
Generational Differences in Motivation Drivers: A Case Study at Telecom Namibia
MBA Research Report December 2009 7
APPENDIX 4: GENERIC FACTORS FOR DECISIONS TO LEAVE THE COMPANY ..... 86
Copyright UCT
Generational Differences in Motivation Drivers: A Case Study at Telecom Namibia
MBA Research Report December 2009 8
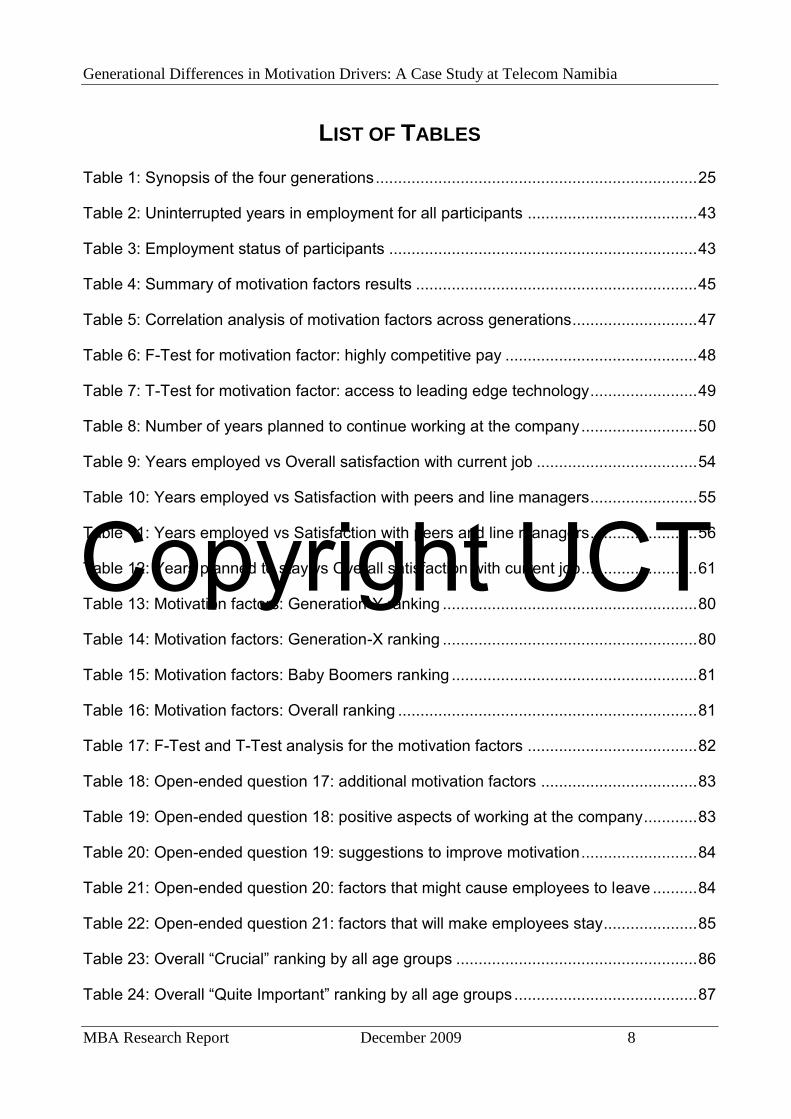
LIST OF TABLES
Table 1: Synopsis of the four generations ........................................................................ 25
Table 2: Uninterrupted years in employment for all participants ...................................... 43
Table 3: Employment status of participants ..................................................................... 43
Table 4: Summary of motivation factors results ............................................................... 45
Table 5: Correlation analysis of motivation factors across generations ............................ 47
Table 6: F-Test for motivation factor: highly competitive pay ........................................... 48
Table 7: T-Test for motivation factor: access to leading edge technology ........................ 49
Table 8: Number of years planned to continue working at the company .......................... 50
Table 9: Years employed vs Overall satisfaction with current job .................................... 54
Table 10: Years employed vs Satisfaction with peers and line managers ........................ 55
Table 11: Years employed vs Satisfaction with peers and line managers ........................ 56
Table 12: Years planned to stay vs Overall satisfaction with current job .......................... 61
Table 13: Motivation factors: Generation-Y ranking ......................................................... 80
Table 14: Motivation factors: Generation-X ranking ......................................................... 80
Table 15: Motivation factors: Baby Boomers ranking ....................................................... 81
Table 16: Motivation factors: Overall ranking ................................................................... 81
Table 17: F-Test and T-Test analysis for the motivation factors ...................................... 82
Table 18: Open-ended question 17: additional motivation factors ................................... 83
Table 19: Open-ended question 18: positive aspects of working at the company ............ 83
Table 20: Open-ended question 19: suggestions to improve motivation .......................... 84
Table 21: Open-ended question 20: factors that might cause employees to leave .......... 84
Table 22: Open-ended question 21: factors that will make employees stay ..................... 85
Table 23: Overall “Crucial” ranking by all age groups ...................................................... 86
Table 24: Overall “Quite Important” ranking by all age groups ......................................... 87
Copyright UCT
Generational Differences in Motivation Drivers: A Case Study at Telecom Namibia
MBA Research Report December 2009 9
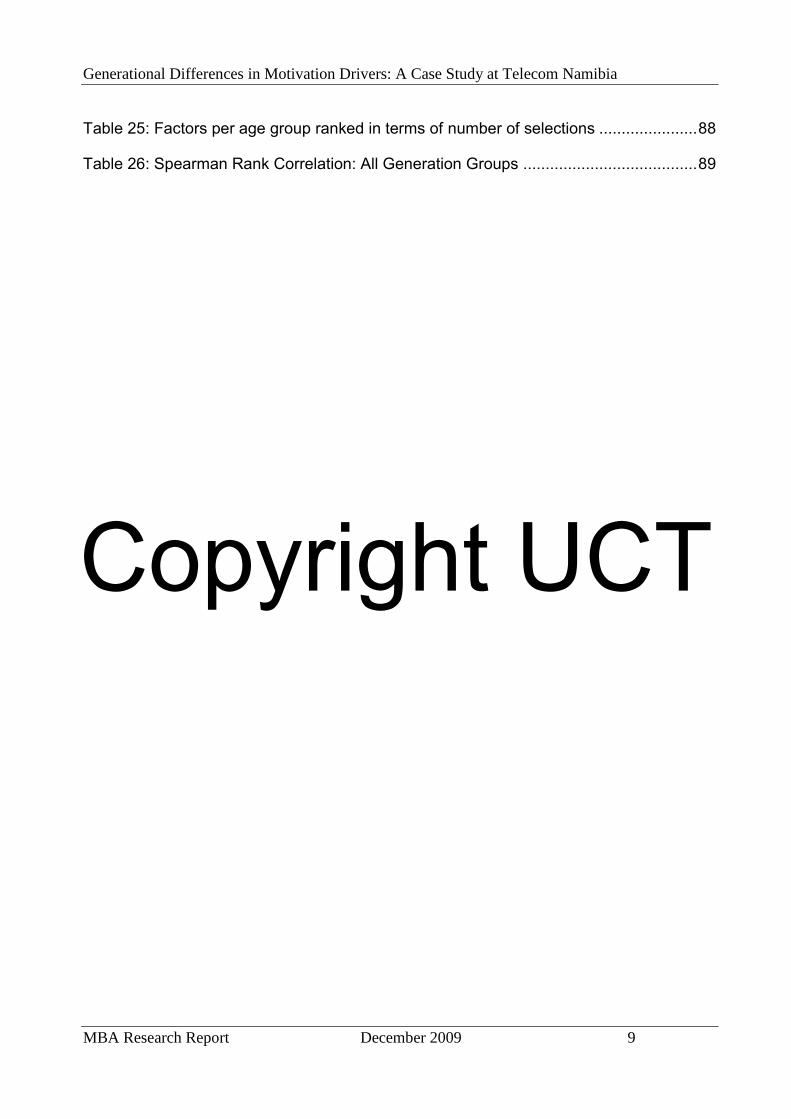
Table 25: Factors per age group ranked in terms of number of selections ...................... 88
Table 26: Spearman Rank Correlation: All Generation Groups ....................................... 89

Copyright UCT
Generational Differences in Motivation Drivers: A Case Study at Telecom Namibia
MBA Research Report December 2009 10
List of Figures
Figure 1 : Model of Business Strategy Alignment............................................................. 18
Figure 2 : Representation of what companies pay employees for .................................... 20
Figure 3 : Maslow Hierarchy of Needs Theory Representation ........................................ 29
Figure 4 : Sources of Dissatisfaction and Satisfaction in Herzberg’s Two factor Theory .. 31
Figure 5 : Age and gender profiles of all participants ....................................................... 41
Figure 6 : Generation groupings for all participants.......................................................... 41
Figure 7 : Uninterrupted years in employment grouped in years ...................................... 42
Figure 8 : Uninterrupted years in employment per generation group ............................... 42
Figure 9 : Employment status of all participants ............................................................... 43
Figure 10 : Years planned to work at the company per generation group ........................ 49
Figure 11 : Years planned to work at the company grouped per time .............................. 50
Figure 12 : Satisfaction level with the current work .......................................................... 51
Figure 13 : Satisfaction level with the current work per generation group ........................ 51
Figure 14 : Overall satisfaction level with your work ......................................................... 52
Figure 15 : Overall satisfaction level with work per generation group .............................. 52
Figure 16 : Years employed vs Overall satisfaction with current job grouped by time ..... 53
Figure 17 : Years employed vs Overall satisfaction with current job ................................ 53
Figure 18 : Satisfaction level with line managers and peers ............................................ 54
Figure 19 : Satisfaction with line managers ...................................................................... 55
Figure 20 : Satisfaction with peers ................................................................................... 55
Figure 21 : Pay competitiveness in the market ................................................................ 56
Figure 22 : Satisfaction with pay package ........................................................................ 57
Figure 23 : Satisfaction with advancement opportunities ................................................. 57
Figure 24 : Satisfaction with advancement opportunities ................................................. 58
Copyright UCT
Generational Differences in Motivation Drivers: A Case Study at Telecom Namibia
MBA Research Report December 2009 11
Figure 25 : Easiness to find a new job in the next six months .......................................... 58
Figure 26 : Easiness to find a new job in the next six months per generation group ........ 59
Figure 27 : Job hunting status of all participants .............................................................. 59
Figure 28 : Job hunting status vs Satisfaction with current job ......................................... 60
Figure 29 : Plan to stay at company vs Overall satisfaction with the job - 1 ..................... 60
Figure 30 : Plan to stay at company vs Overall satisfaction with the job - 2 ..................... 61
Copyright UCT
Generational Differences in Motivation Drivers: A Case Study at Telecom Namibia
MBA Research Report December 2009 12
"Ability is what you're capable of doing. Motivation determines what you do. Attitude
determines how well you do it." Raymond Chandler (Chandler, R, n.d.).
1. Overview
The study focuses on the factors that motivate employees of different age groups in a
telecommunication company. The study is exploratory in approach and studies the cross-
sectional differences in motivation drivers across the three generational groups. This
section sets the scene to this study and contains the research question, the scope and its
contextual background. The relevance of the study to practitioners within the organisation
being studied and to the academia, although to a lesser extent because of the visible lack
of literature of similar studies in Namibia, is highlighted. The research assumptions that
cover the things that might impact on the success of the research and have a potential to
influence the outcomes are also described in this section.
1.1 Research area
The research question central to this paper is “What are the factors that motivate various
generational groups at Telecom Namibia?” The purpose of the study is to explore and
explain the factors that motivate employees of different age groups also referred to as
generational groups (Baby Boomers, Generation-X and Generation-Y) in a single
organisation. To define and examine the overall cross-sectional differences in motivation
drivers across the three generations, the author focussed on three of the four commonly
measured workplace indicators of motivation: engagement, satisfaction and intention to
quit (Nohria et al, 2008, p.80), excluding and with less focus on commitment . The author
will not formulate hypothesis to be tested but would rather seek to explain his findings
with the available theory, to understand the research situation and to discover the theory
implicit in the data (Glaser, 1992). This has many advantages, it will create possibilities
for flexibility to challenge the existing theory, provide a source for possible new
interpretation and the possibility for the author to shift the focus as the data is collected.
1.2 Background
Our societies are made up of individuals of different age groups. Organisations are
inextricably linked to the societies in which they operate and their workforce should reflect
Copyright UCT
Generational Differences in Motivation Drivers: A Case Study at Telecom Namibia
MBA Research Report December 2009 13
that society’s dimensions of diversities including age. The current workforce at Telecom
Namibia is composed of individuals of various age groups (Baby Boomers, Generation-X
and Generation-Y) that may not be motivated by the same factors to work well as a team.
To a large extent, our value system and belief are linked to the era in which we are born
as Codrington & Grant-Marshall (2008) claim that nearly everyone has an attitude, values
and expectations that are based on what life was like when they grew up.
The fast changing telecommunication sector, driven by the ever changing customer
needs and increasing competition, requires frequent adaptation and adoption of new
technologies to enable organisations to attract and satisfy the diverse customer needs
(Telecom Namibia 2013 Strategic Blueprint, 2006). The sustained competitive capability
of any organisation is not only linked to the attraction and retention of key employees but
to the motivation and commitment levels of the workers to execute the tasks with a
sustained efficiency (Grobler & Wärnich, 2006). The organisation’s ability to effectively
motivate and manage its diverse workforce effectively will therefore play a key role in
determining its competitive advantage and sustainability in the global market.
Telecom Namibia, like many telecommunication operators around the globe, is at the
cross road of redefining its business model to provide a range of converged services and
exciting products that can satisfy the ever changing demands of their customers. It is
going through a technological transformation phase to build resilient next generation
networks and align their organisations to develop, operate and provision next generation
networks and services. This transition has created disruptive imbalances in the
organisation’s practices with regard to attraction, retention and motivation of the required
skill mix. The current drive in the organisation, fuelled by the global economic crisis, to
make the organisation leaner and meaner, exposed the challenges related to age
diversity in the workplace. This has highlighted the need for an intervention that should be
based on a better understanding of the factors that motivate employees.
At individual levels, the workforce at Telecom Namibia has a wealth of experience and
skills that if put to good use can serve as a competitive advantage for the organisation in
the long term. In the past, generational mixing within the organisation was relatively rare
even though multiple generations have always existed and worked in the same
Copyright UCT
Generational Differences in Motivation Drivers: A Case Study at Telecom Namibia
MBA Research Report December 2009 14
organisation. The generations, as pointed out by Filipczak et al (1999), were usually
separated from each other by their job descriptions and a system of hierarchy that was
significantly structured by formality and protocol. Today, social and physical separations
are minimized and barriers to generational mixing have gone down. This is accelerated
by the nature of the industry in which we operate and the company being an integrated
ICT services provider.
Multiple generations have complementary skills, younger people understand and
consume ICT services, older generations have a wealth of experience that the company
needs. Grobler & Wärnich (2006) suggested that today’s organisations’ human resource
programmes to attract, retain and motivate today’s diverse employees can be regarded
as appropriate and relevant if the organisation first seeks to understand and become
aware of the dimension of diversity of its existing and potential employees. The purpose
of this study is to identify factors that motivate age diverse employees within the
environment described.
1.3 Relevance of the research
Diversity is transforming day-to-day activities in the workplace. However, too much of
diversity talks and attention tends to focus on race, religion and gender, while it appears
that the most powerful dimension of diversity is age. The organisation being studied has
employees from predominantly three generational groups with presumed differences in
experiences, values and expectations.
The author wishes to develop a deeper understanding regarding the factors that motivate
different generational groups in the company and the factors that need to be managed to
ensure the success of individuals and that of the organisation. The author is keen to
become aware of how best to motivate and manage each generation group. This
understanding can assist in developing strategies to motivate and manage all workers
efficiently. It can also aid in the creation of the desired culture that not only focuses on
what needs to get done but also accommodates the various ways in which people
approach work. The study will also contribute to the subject knowledge and it will both be
useful to academics and practitioners.
Copyright UCT
Generational Differences in Motivation Drivers: A Case Study at Telecom Namibia
MBA Research Report December 2009 15
1.4 Research questions and scope
The current situation at Telecom Namibia is briefly outlined under the background section
and one of the emergent problems from this context forms the research question of this
paper. The research question central to this paper is “what are the factors that
motivate various generational groups at Telecom Namibia?”
The research explores and explains the factors that motivate workers of different age
groups (Baby Boomers, Generation-X and Generation-Y) in a single organisation,
Telecom Namibia. To form a logical basis for constructing the answer to the central
question a number of sub-questions will be answered:
a. What factors will make employees of different age groups provide discretionary
efforts at the work place?
b. What are the levels of motivation and job satisfaction in the organisation across the
various age groups and do these correlate with
i. Intention to stay or leave the organisation in the next 6 months
ii. Implications for the workplace culture
1.5 Research assumptions
The following assumptions are considered important to the overall success of the study:
Accessibility of participants. The researcher, being employed by this organisation
is well aware of the busy schedules of many people in the company and the
process of completing the structured interviews session of approximately 20 senior
managers might be prolonged. This will be mitigated by starting earlier and
explaining the benefit to top management to get the necessary buy in and support
right from the beginning. The rationale and benefit of the survey will also be
explained to employees and the people will be given sufficient time to complete the
survey.
Honesty of participants. In general, completing survey is often the last thing
employees are interested to do and some might rush through the questionnaire
just to get them done.
Copyright UCT
Generational Differences in Motivation Drivers: A Case Study at Telecom Namibia
MBA Research Report December 2009 16
Response rate. There is a possibility that a significant number of employee might
not participate in the survey. The author wishes to get a response rate that is
representative of the whole organisation.
Researcher’s own bias. This is always present and will be acknowledged as such.
1.6 Expected research outcomes
a. Understanding the key factors that motivate employees of different age groups at
Telecom Namibia.
b. Understanding the current motivation and job satisfaction levels for various
generational groups and how it correlates to the various generational groups’
intention to leave or stay in the organisation and the impact on the workplace
culture
c. Understanding the themes from literature and drawing conclusions with the
research findings.
d. Formulating a framework to explain the motivation factors across various
generational groups in the organisation.
e. Making recommendations to the organisation regarding the possible strategies that
can be developed to motivate all employees
Copyright UCT
Generational Differences in Motivation Drivers: A Case Study at Telecom Namibia
MBA Research Report December 2009 17
2. Literature Review
The aim of this research is to explore, describe and understand the different variables
that motivate various generational groups at Telecom Namibia. It will be done using
empirical data evaluation and build on previous research into generational differences.
The study will examine whether the cross-sectional differences in motivational drivers
truly exist in the workplace across generations, what their dimensions are and how best
to manage this dimension of diversity in the workplace.
2.1 The challenge
The study done by Cennamo and Gardner (2008) suggests that increasingly, human
resource specialists, managers and researchers are becoming keen in how to manage,
motivate and work with people from different generations in the workplace. Much of this
interest is based on the assumption that generations differ significantly in their goals,
motivation drivers, expectations and work values and while this assumption is widely
reflected in most available literature, Cennamo and Gardner (2008) argued that it has
been subjected to relatively little empirical evaluation in general.
From the available literature to date, most research into generational differences is
conducted and focussed on the United States of America (USA), United Kingdom (UK)
and Canada as well as on Australia and New Zealand on a smaller scale. However,
Southern Africa and South Africa in particular has historically followed and has been
subjected to similar demographic patterns as in those countries, including participation in
World War II and the social and economic changes of this era, and increasing levels of
technological change especially the continuing rapid growth of information and
communications technology. Kupperschmidt (2000) suggested that employees from
different generations are believed to have different value systems and react differently to
common life events
Copyright UCT
Generational Differences in Motivation Drivers: A Case Study at Telecom Namibia
MBA Research Report December 2009 18
2.1.1 Leadership role in motivating employees
Kaliprasad (2006) points out that motivation is about what makes people behave or act in
the way they do and suggests further that, just as an employee has certain wants that he
requires the organisation to supply or fulfil, the company has certain types of behaviour
and expectations of that employee. The managerial responsibility for getting that
behaviour from staff is usually called directing or motivating and this study aims at
identifying and explaining the key factors that motivate employees.
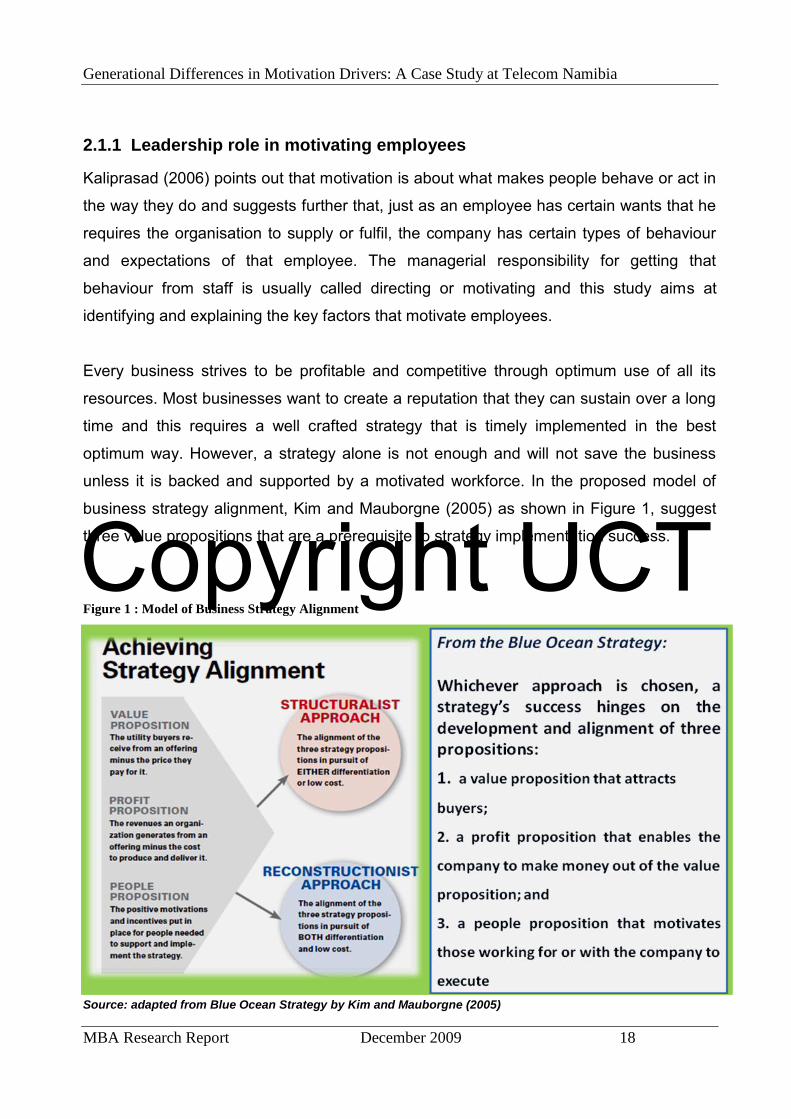
Every business strives to be profitable and competitive through optimum use of all its
resources. Most businesses want to create a reputation that they can sustain over a long
time and this requires a well crafted strategy that is timely implemented in the best
optimum way. However, a strategy alone is not enough and will not save the business
unless it is backed and supported by a motivated workforce. In the proposed model of
business strategy alignment, Kim and Mauborgne (2005) as shown in Figure 1, suggest
three value propositions that are a prerequisite to strategy implementation success.
Figure 1 : Model of Business Strategy Alignment
Source: adapted from Blue Ocean Strategy by Kim and Mauborgne (2005)
Copyright UCT
Generational Differences in Motivation Drivers: A Case Study at Telecom Namibia
MBA Research Report December 2009 19
John Kotter in his article “what leaders really do”, points out the distinction of
complimentary roles of management and leadership. Kotter (2001) posited that
management is about coping with complexity and it brings order and predictability to a
situation. However, that is no longer enough and to succeed, companies must be able to
adapt to change. The roles of leadership is then about learning how to cope with rapid
change. Kotter (2001) draws the distinction between management and leadership in the
following ways:
Management involves planning and budgeting. Leadership involves setting
direction
Management involves organising and staffing. Leadership involves aligning
people.
Management provides control and solves problems. Leadership provides
motivation.
2.1.2 The employee perspective on value of a salary
The people proposition mentioned in the previous section encompasses the motivation of
the people to give discretional efforts. To get the most out of the workforce, we need to
build engagement. “Engagement is not simply a question of working longer or harder;
rather, an engaged employee is one who demonstrates commitment, initiative and a
holistic understanding of the company’s needs” (Johnson, 2006, p.3).
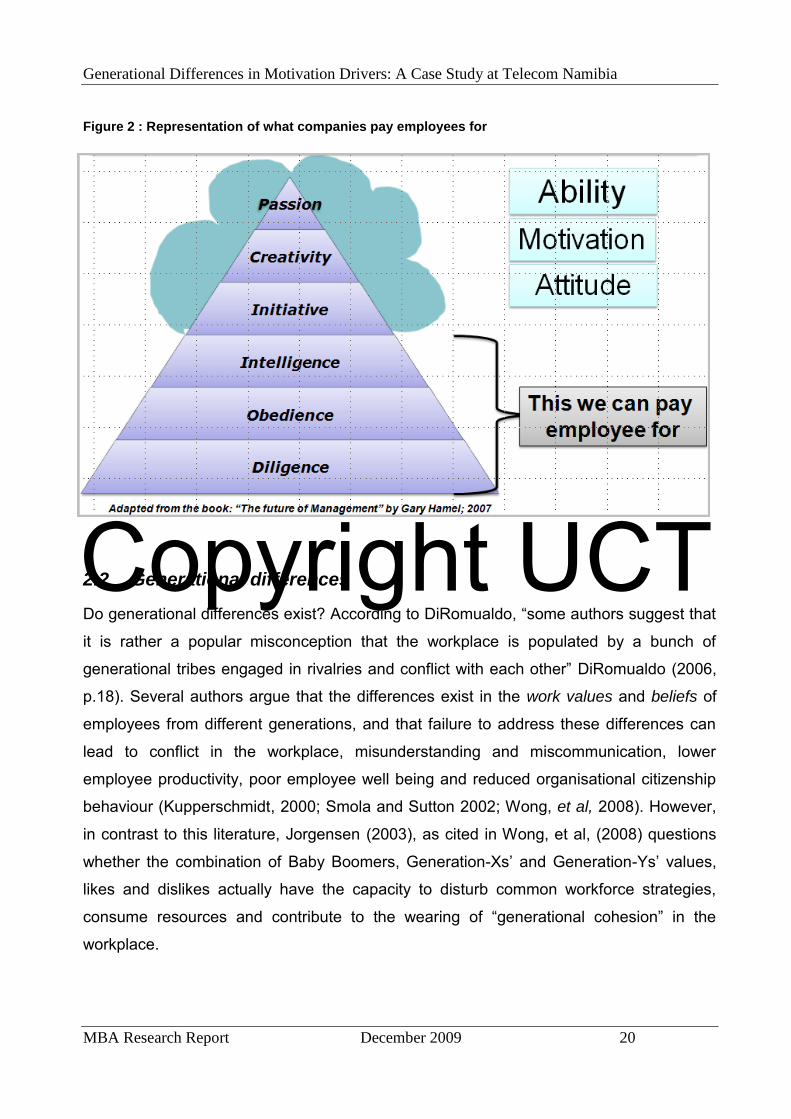
Figure 2 is adapted from Gary Hamel’s book “The Future of Management” and
summarises the notion that an employer is able to pay an employees for diligence,
obedience and intelligence. However, to get a job well done, an employee need to have
passion and come up with appropriate initiatives through a creative process to get the
work done. These three attributes, the employer is not able to pay for and they have to be
accessed differently through a careful assessment and match of an employee’s ability,
motivation and attitude towards the job that need to be performed.
Copyright UCT
Generational Differences in Motivation Drivers: A Case Study at Telecom Namibia
MBA Research Report December 2009 20
Figure 2 : Representation of what companies pay employees for
2.2 Generational differences
Do generational differences exist? According to DiRomualdo, “some authors suggest that
it is rather a popular misconception that the workplace is populated by a bunch of
generational tribes engaged in rivalries and conflict with each other” DiRomualdo (2006,
p.18). Several authors argue that the differences exist in the work values and beliefs of
employees from different generations, and that failure to address these differences can
lead to conflict in the workplace, misunderstanding and miscommunication, lower
employee productivity, poor employee well being and reduced organisational citizenship
behaviour (Kupperschmidt, 2000; Smola and Sutton 2002; Wong, et al, 2008). However,
in contrast to this literature, Jorgensen (2003), as cited in Wong, et al, (2008) questions
whether the combination of Baby Boomers, Generation-Xs’ and Generation-Ys’ values,
likes and dislikes actually have the capacity to disturb common workforce strategies,
consume resources and contribute to the wearing of “generational cohesion” in the
workplace.
Copyright UCT
Generational Differences in Motivation Drivers: A Case Study at Telecom Namibia
MBA Research Report December 2009 21
2.2.1 The importance of generations
A generation’s identity is a state of mind shaped by family life, gender roles, politics, and
view of the future, religion, culture, lifestyle and experiences (Zemke, Raines & Filipczak,
2000). A generation can be defined as an “identifiable group (cohorts) that shares birth
years, age location, and significant life events at critical developmental stages (times)”
(Kupperschmidt, 2000, p. 66). A generational group includes those who share historical
or social life experiences, the effects of which are relatively stable over their lives. These
experiences as suggested by Jurkiewicz and Brown (1998) can influence a person’s
feelings toward authority and organizations, what a person values from work.
Furthermore, “differences between generations are theorised to occur because of major
influences in the environment within which early human socialization occurs; influences
that impact on the development of personality, values, beliefs and expectations that,
once formed, are stable into adulthood” (Macky, Gardner & Forsyth, 2008, p. 858).
It is cited in Westerman and Yamamura (2006) that the existence of generational
differences was illustrated by Smola and Sutton in their research on the subject in 2002
examining differences in value sets between generations. In their research Smola and
Sutton (2002) concluded that work values are more influenced by generational
experiences than by age and maturation. Generational characteristics refer to “world-
view, values and attitudes commonly shared by or descriptive of cohorts (often referred to
as peer or generational personality)” (Kupperschmidt, 2000, p. 66). Generational
perspective is defined by Kupperschmidt (2000), to refer to knowledge, recognition and
appreciation of each other’s times and generational characteristics (values, attitudes and
behaviours).
2.2.2 The Baby Boomer generation
A review of existing literature (e.g. Kupperschmidt, 2000; Smola and Sutton, 2002; Hart,
2006; Westerman and Yamamura, 2006; Cennamo and Gardner, 2008 and Wong et al,
2008), suggest that employee in this group value:
Optimism
On-job security
Loyalty
Copyright UCT
Generational Differences in Motivation Drivers: A Case Study at Telecom Namibia
MBA Research Report December 2009 22
Respect the organisational hierarchy
Generally wait for their turn for advancement
Stable working environment
Work as a self-actualisation
Personal growth and self improvement
Health and wellness
Involvement
Most likely to remain loyal and attached to an organisation
Are idealistic
Diligence on the job
High degree of power within an organisation
More likely to focus on consensus building and are excellent mentors
They are driven
They work ethics is driven and are regarded as diligent and optimistic (Zemke, Raines &
Filipczak, 2000). This is a generation that for most part grew up in a two-parent
households, safe schools, and post world war prosperity (Zemke, Raines & Filipczak,
2000). They are best motivated by recognition for their contributions, feeling needed,
being a member of a team, reward for work ethic and long hours and participative
management (Zemke, Raines & Filipczak, 2000). Jurkiewicz (2000) points out that in a
recent study performed in New Zealand, Baby Boomers have been found to rate chance
to learn new skills, personal improvements and creativity at work as important. A strong
focus on hard work and achievement may mean that this group values status and
extrinsic rewards as recognition for loyalty and commitment and may have difficulty in
balancing work and family (Smola and Sutton, 2002).
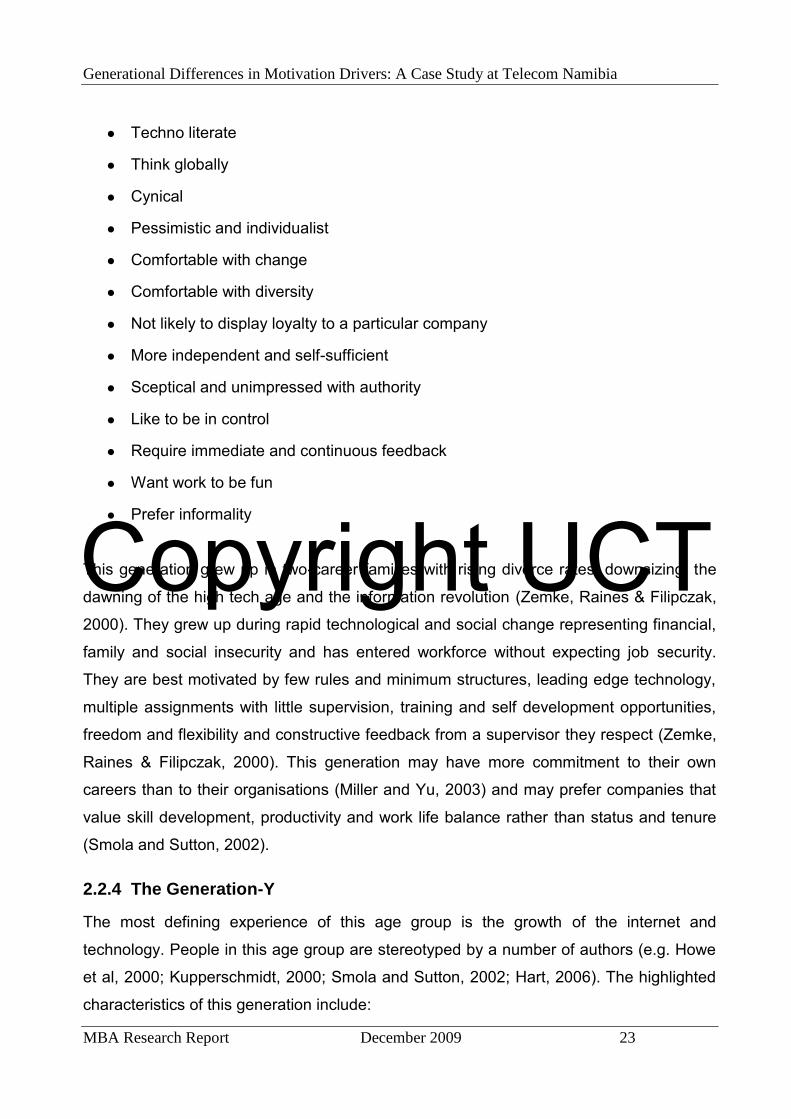
2.2.3 The Generation-X
People in this age group are stereotyped by a number of authors (e.g. Howe et al, 2000;
Kupperschmidt, 2000; Smola and Sutton, 2002; Hart, 2006). The highlighted
characteristics of this generation include:
Value strong work-life-balance
Copyright UCT
Generational Differences in Motivation Drivers: A Case Study at Telecom Namibia
MBA Research Report December 2009 23
Techno literate
Think globally
Cynical
Pessimistic and individualist
Comfortable with change
Comfortable with diversity
Not likely to display loyalty to a particular company
More independent and self-sufficient
Sceptical and unimpressed with authority
Like to be in control
Require immediate and continuous feedback
Want work to be fun
Prefer informality
This generation grew up in two-career families with rising divorce rates, downsizing, the
dawning of the high tech age and the information revolution (Zemke, Raines & Filipczak,
2000). They grew up during rapid technological and social change representing financial,
family and social insecurity and has entered workforce without expecting job security.
They are best motivated by few rules and minimum structures, leading edge technology,
multiple assignments with little supervision, training and self development opportunities,
freedom and flexibility and constructive feedback from a supervisor they respect (Zemke,
Raines & Filipczak, 2000). This generation may have more commitment to their own
careers than to their organisations (Miller and Yu, 2003) and may prefer companies that
value skill development, productivity and work life balance rather than status and tenure
(Smola and Sutton, 2002).
2.2.4 The Generation-Y
The most defining experience of this age group is the growth of the internet and
technology. People in this age group are stereotyped by a number of authors (e.g. Howe
et al, 2000; Kupperschmidt, 2000; Smola and Sutton, 2002; Hart, 2006). The highlighted
characteristics of this generation include:

Copyright UCT
Generational Differences in Motivation Drivers: A Case Study at Telecom Namibia
MBA Research Report December 2009 24
Dedicated to the job
Comfortable with change
Don’t regard job security as an important factor in the work place
Value skill development
Enjoy the challenge of new opportunities
They are driven
Optimistic
Display a high level of confidence
Enjoy collective action and are highly social
Value having responsibilities
Value having input into decision making and actions
Are fast learners
Tend to be impatient
They are motivated by working in high energy teams, working with bright creative people,
believing they can make a difference, continuous training and self development,
supervision and structure (Zemke, Raines & Filipczak, 2000). They value work-life
balance, lifestyles, career development and overseas travel more than other generations
(Zemke, Raines & Filipczak, 2000). It is suggested by Smola and Sutton (2002) that this
generation may be the most adaptable yet in terms of technological skills and is regarded
to value intrinsic aspects of work such as mentoring and training in order to remain
marketable.
Copyright UCT
Generational Differences in Motivation Drivers: A Case Study at Telecom Namibia
MBA Research Report December 2009
25
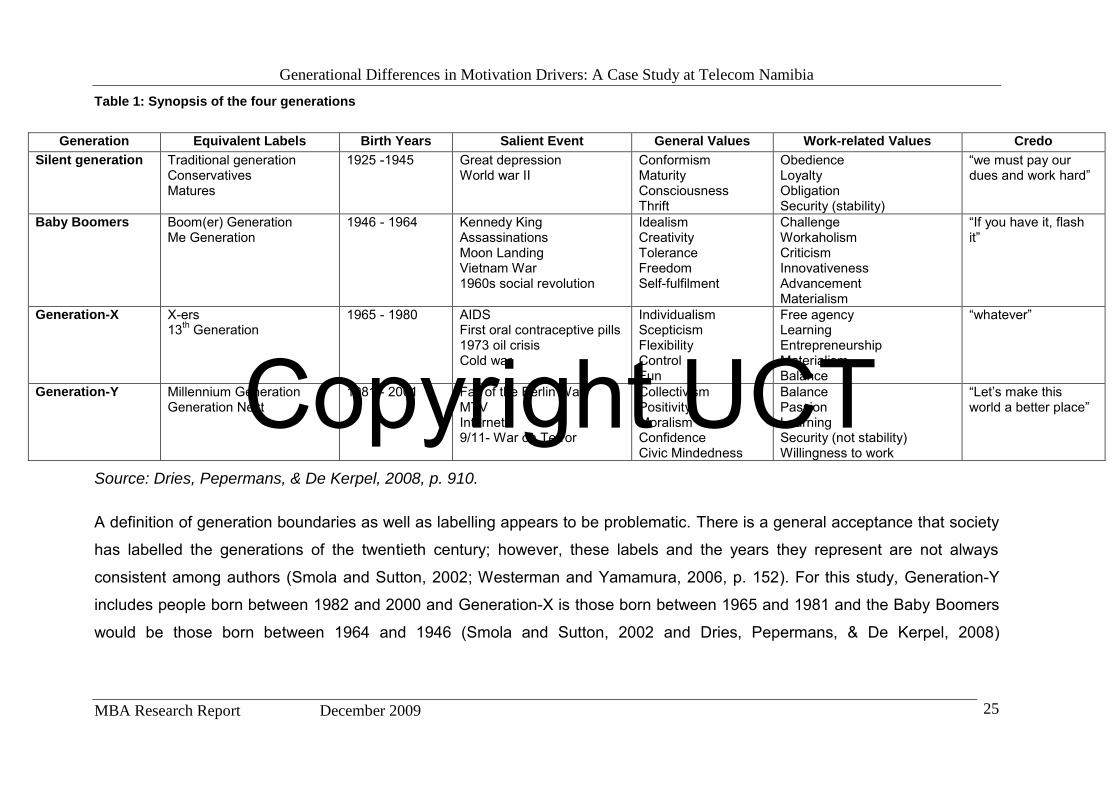
Table 1: Synopsis of the four generations
Generation Equivalent Labels Birth Years Salient Event General Values Work-related Values Credo
Silent generation Traditional generation Conservatives Matures
1925 -1945 Great depression World war II
Conformism Maturity Consciousness Thrift
Obedience Loyalty Obligation Security (stability)
“we must pay our dues and work hard”
Baby Boomers Boom(er) Generation Me Generation
1946 - 1964 Kennedy King Assassinations Moon Landing Vietnam War 1960s social revolution
Idealism Creativity Tolerance Freedom Self-fulfilment
Challenge Workaholism Criticism Innovativeness Advancement Materialism
“If you have it, flash it”
Generation-X X-ers 13th Generation
1965 - 1980 AIDS First oral contraceptive pills 1973 oil crisis Cold war
Individualism Scepticism Flexibility Control Fun
Free agency Learning Entrepreneurship Materialism Balance
“whatever”
Generation-Y Millennium Generation Generation Next
1981 - 2001 Fall of the Berlin Wall MTV Internet 9/11- War on Terror
Collectivism Positivity Moralism Confidence Civic Mindedness
Balance Passion Learning Security (not stability) Willingness to work
“Let’s make this world a better place”
Source: Dries, Pepermans, & De Kerpel, 2008, p. 910.
A definition of generation boundaries as well as labelling appears to be problematic. There is a general acceptance that society
has labelled the generations of the twentieth century; however, these labels and the years they represent are not always
consistent among authors (Smola and Sutton, 2002; Westerman and Yamamura, 2006, p. 152). For this study, Generation-Y
includes people born between 1982 and 2000 and Generation-X is those born between 1965 and 1981 and the Baby Boomers
would be those born between 1964 and 1946 (Smola and Sutton, 2002 and Dries, Pepermans, & De Kerpel, 2008)
Copyright UCT
Generational Differences in Motivation Drivers: A Case Study at Telecom Namibia
MBA Research Report December 2009
26
2.2.5 Motivational drivers
What is primarily vital in organisations today is that employees are not only able to work,
but must be willing to work. Kaliprasad (2006) suggested that the ability to work is
characterised by having the necessary skills and knowledge to function in one’s work.
Kaliprasad (2006) argues that the employee’s willingness to work is influenced by the
individual but equally dependent upon how that person is managed in the work
environment.
Motivation is about what makes people act or behave in the way they do. Goleman
(1998) defines motivation as “passion to work for reasons that go beyond money or
status, a propensity to pursue goals with energy and persistence.” He suggest that its
hallmarks includes a “strong drive to achieve; optimism, even in the face of failure and
organisational commitment”.
2.2.6 Motivation drivers and work values
Motivational drivers refer to the factors that energise, direct and sustain behaviour in the
individual. While very closely linked to values (Brown, 1976; as cited in Wong et al.,
2008), motivation is more specific to the factors that drive actual performance. Amar
suggests that motivation is a term associated with the forces acting on a person causing
him to act in a certain way. It is inferred in terms of behavioural changes brought in by
internal or external stimuli.
Additionally, an individual’s motivation may change based upon certain factors. These
factors are identified as the drivers of motivation and can be used to understand what
drives motivation among workers in the knowledge-based work environment (Amar,
2004). Therefore, understanding dynamics of motivation is a requisite for identifying what
drives people to act in certain ways and Amar (2004) refers to five category of motivation
drivers: sociological, psychological, generational, work, and cultural. Referring to
knowledge workers, Amar notes that typically, motivating behaviour drivers of knowledge
workers are the work itself, the assignments or projects they get: “In their perception, how
important is the work that they would be doing? Is it exciting? Is it challenging? Would
they succeed at it? This assignment will result in working with whom? For example, would
Copyright UCT
Generational Differences in Motivation Drivers: A Case Study at Telecom Namibia
MBA Research Report December 2009 27
it result in being surrounded by the best of the best? Would the assignment be in an
organization where there is respect, trust, fairness, and good management? And, what
would the experience bring as outcomes, such as rewards, recognition, career
advancement, learning, and satisfaction?” (Amar, 2004, p. 91).
Work values refer to an employee’s attitudes regarding what are “right”, as well as
attitudes about what an individual should expect in the workplace (Brown, 1976; George
and Jones, 1999; as cited in Wong et al., 2008). Wong et al (2008) highlighted that while
an individual’s personality preferences and motivational drivers are likely to be related to
and influenced by the work values, it is important to maintain a distinction between these
concepts.
Cennamo & Gardner (2008) posited that generational differences in work values have
been linked to changes in the meaning of work, to increasing numbers of dual-career and
single parent families’ expectations for work/life balance and to the increased use of
electronic media and continuous learning of new skills.
Clearly, understanding what motivates us as human beings is a centuries-old puzzle
(Nohria et al, 2008) and cannot be explained by inference. The purpose of this study is to
identify factors that motivate employees of different age groups in a single organisation.
2.2.7 Generational differences in personality and motivation
As noted earlier, a review of the existing literature suggests that while previous research
has examined differences in work values across generations (Smola and Sutton, 2002;
Wong et al., 2008), research examining generational differences in personality and
motivational drivers in the workplace have been limited. Instead, the research on
generational differences at work has tended to focus on work values. Work values as
described by Wong et al (2008), refer to an employee’s attitudes regarding what is “right”,
as well as attitudes about what an individual should expect in the workplace. While an
individual’s personality preferences and motivational drivers are by Wong et al (2008) to
likely to be related to and influenced by his/her work values, it is important to maintain a
distinction between these concepts.
Copyright UCT
Generational Differences in Motivation Drivers: A Case Study at Telecom Namibia
MBA Research Report December 2009 28
Yu and Miller (2005) points out that one significant difference between individuals in their
20s and individuals in their 40s is their value system. Numerous approaches to classifying
work values exist. One of the most widely used distinguishes between work values that
are:
Extrinsic, or a consequence of work (e.g. job security, salary) or
Intrinsic, occurring through the process of work (e.g. intellectual simulation,
challenge) (Elizur, 1984; as cited in Cennamo & Gardner, 2008).
Altruistic values (e.g. making a contribution to society) was added by subsequent
research (Borg, 1990; as cited in Cennamo & Gardner, 2008, p. 892),
Status-related values (e.g. influence, recognition, advancement) (Ros et al., as
cited in Cennamo & Gardner, 2008),
Freedom-related values (e.g. work-life balance, working hours) and
Social values (e.g. good relationships with supervisors or peers) (Lyons, 2004; as
cited in Cennamo & Gardner, 2008).
Bandura, as cited in Jones and Lloyd (2005) posited that employee needs are a function
of personality: “Behaviour emerges as a result of the operation of cognitive processes in
interaction with the environment. The environment generates external social stimuli to
which individuals respond. People are goal-seeking, and search for positive
reinforcement. Thus, if the organisation provides such reinforcement through the crafting
of appropriate rewards, a good match is achieved and high motivation results” (Jones and
Lloyd, 2005, p. 931). Personality is defined as an individual’s preferred or typical way of
behaving, thinking and feeling (Saville et al., 1984; as cited in Wong et al., 2008). Hence,
while an individual’s values are likely to influence behaviour in the workplace, personality
is likely to be more direct measure of actual behaviour.
The importance of understanding personality differences across generations in the
workplace is highlighted by research indicating that individual differences in personality
affect job performance (Barrick et al., 2002; Tett and Burnett, 2003; as cited in Wong et
al., 2008) and job satisfaction (Avery et al., 1989; as cited in Wong et al., 2008). This
suggests that, to maintain a high-performing and satisfied workforce across all three
Copyright UCT
Generational Differences in Motivation Drivers: A Case Study at Telecom Namibia
MBA Research Report December 2009 29
generations of employees, organisations need to understand the key generational
differences across the personality preferences.
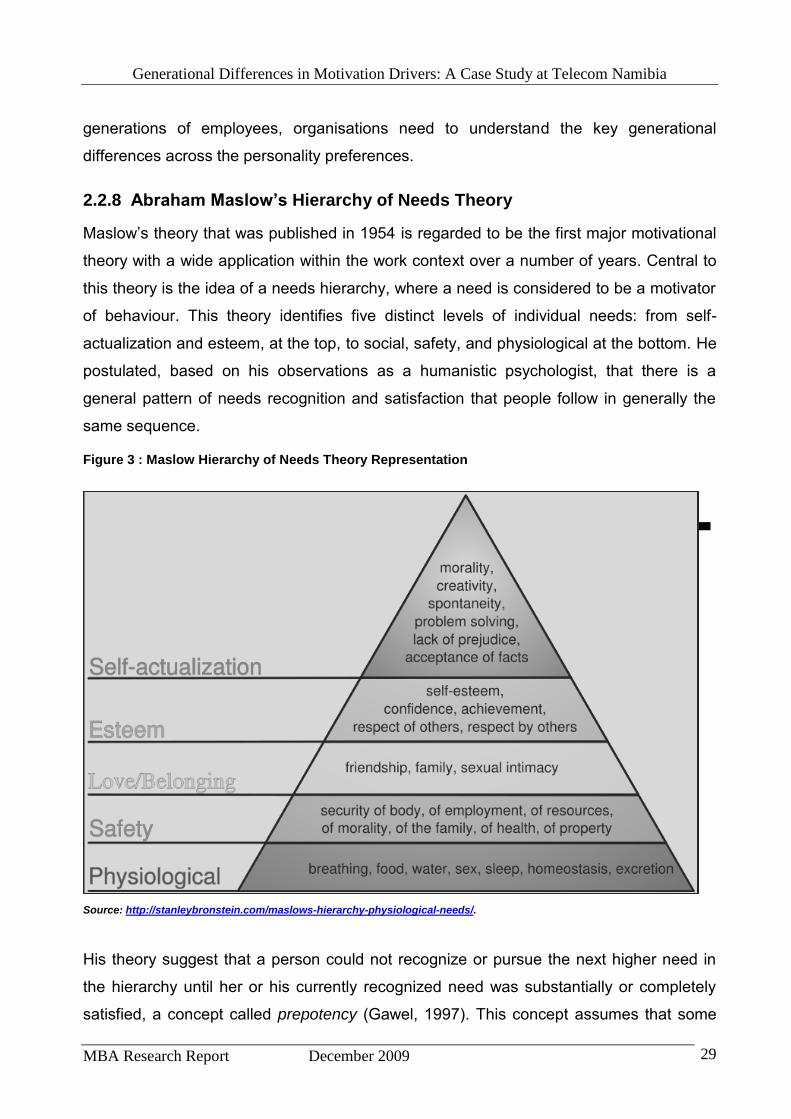
2.2.8 Abraham Maslow’s Hierarchy of Needs Theory
Maslow’s theory that was published in 1954 is regarded to be the first major motivational
theory with a wide application within the work context over a number of years. Central to
this theory is the idea of a needs hierarchy, where a need is considered to be a motivator
of behaviour. This theory identifies five distinct levels of individual needs: from self-
actualization and esteem, at the top, to social, safety, and physiological at the bottom. He
postulated, based on his observations as a humanistic psychologist, that there is a
general pattern of needs recognition and satisfaction that people follow in generally the
same sequence.
Figure 3 : Maslow Hierarchy of Needs Theory Representation
Source: http://stanleybronstein.com/maslows-hierarchy-physiological-needs/.
His theory suggest that a person could not recognize or pursue the next higher need in
the hierarchy until her or his currently recognized need was substantially or completely
satisfied, a concept called prepotency (Gawel, 1997). This concept assumes that some
Copyright UCT
Generational Differences in Motivation Drivers: A Case Study at Telecom Namibia
MBA Research Report December 2009 30
needs are more important than others and must be satisfied before the other needs can
serve as motivators. For example, physiological needs must be satisfied before safety
needs are activated, safety needs must be satisfied before social needs are activated,
and so on (Schermerhorn, et al., 2002). In essence, this model serves to highlight that
human beings are motivated by unsatisfied needs and not by those that have been
achieved or fulfilled. Furthermore, people are never completely satisfied on any given
need level, (Kaliprasad, 2006)
As depicted in Figure 3, Maslow’s theory is often illustrated as a pyramid with the survival
need at the broad-based bottom and the self-actualization need at the narrow top. The
top two needs are termed the higher order needs and the bottoms three needs are
termed the lower order needs, (Kaliprasad, 2006).
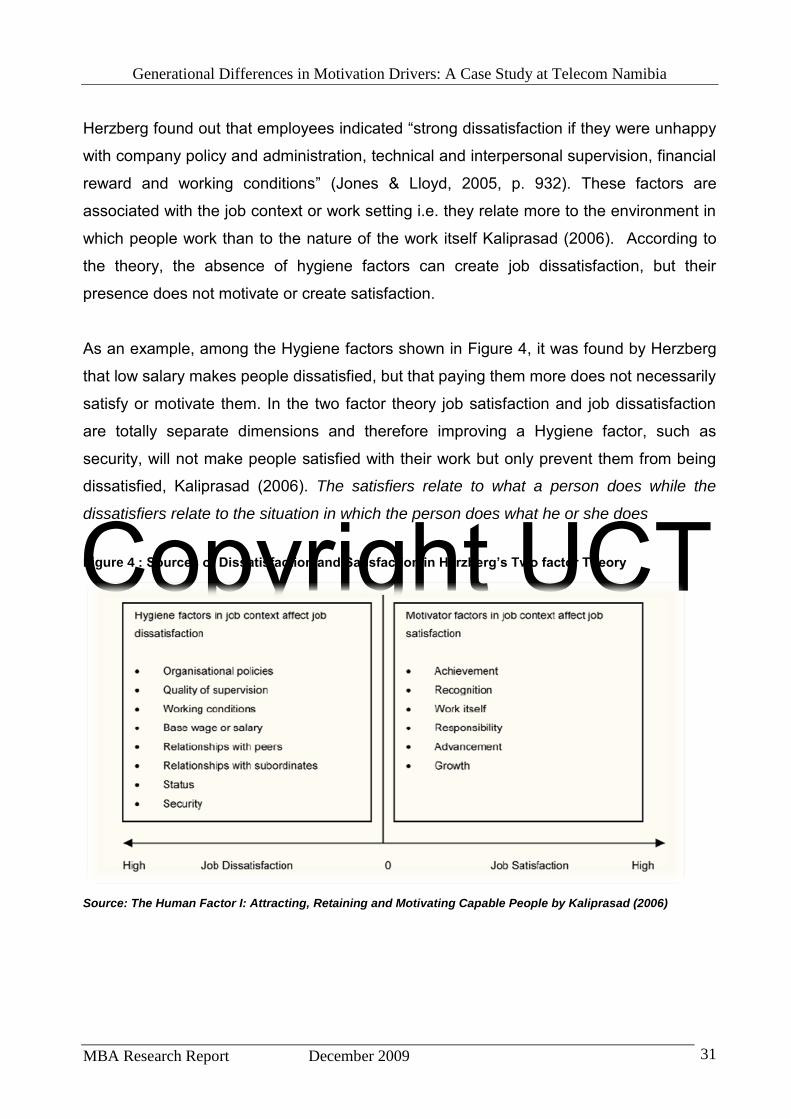
2.2.9 Frederick Herzberg Two Factor Theory
Frederick Herzberg took a different approach to examining motivation. He simply asked
workers to report the times they felt exceptionally good about their jobs and the times
they felt exceptionally bad about them. Herzberg constructed a two-dimensional
paradigm of factors affecting people's attitudes about work as pointed out by Kaliprasad
(2006) that this theory portrays different factors as primary causes of job satisfaction and
job dissatisfaction. Hygiene factors are sources of job dissatisfaction while motivator
factors are sources of job satisfaction. Satisfaction reflects the extent to which employee
feel that the company meets their expectations at work and satisfies its implicit and
explicit contracts with them (Kaliprasad, 2006, p.22)
Sources of satisfaction (motivator factors) included a sense of achievement, recognition,
the work itself, the opportunity to take responsibility and prospects for advancement.
These factors are related to the job content and enriched a person’s job, i.e., what people
actually do in their work. These motivators (satisfiers) were associated with long-term
positive effects in job performance while the hygiene factors (dissatisfiers) consistently
produced only short-term changes in job attitudes and performance, which quickly fell
back to its previous level.
Copyright UCT
Generational Differences in Motivation Drivers: A Case Study at Telecom Namibia
MBA Research Report December 2009 31
Herzberg found out that employees indicated “strong dissatisfaction if they were unhappy
with company policy and administration, technical and interpersonal supervision, financial
reward and working conditions” (Jones & Lloyd, 2005, p. 932). These factors are
associated with the job context or work setting i.e. they relate more to the environment in
which people work than to the nature of the work itself Kaliprasad (2006). According to
the theory, the absence of hygiene factors can create job dissatisfaction, but their
presence does not motivate or create satisfaction.
As an example, among the Hygiene factors shown in Figure 4, it was found by Herzberg
that low salary makes people dissatisfied, but that paying them more does not necessarily
satisfy or motivate them. In the two factor theory job satisfaction and job dissatisfaction
are totally separate dimensions and therefore improving a Hygiene factor, such as
security, will not make people satisfied with their work but only prevent them from being
dissatisfied, Kaliprasad (2006). The satisfiers relate to what a person does while the
dissatisfiers relate to the situation in which the person does what he or she does
Figure 4 : Sources of Dissatisfaction and Satisfaction in Herzberg’s Two factor Theory
Source: The Human Factor I: Attracting, Retaining and Motivating Capable People by Kaliprasad (2006)
Copyright UCT
Generational Differences in Motivation Drivers: A Case Study at Telecom Namibia
MBA Research Report December 2009 32
2.3 Conclusion
The search for a better understanding of what motivates us as human beings is a
centuries-old puzzle. A number of earlier studies suggest that differences in generations
exist and also that these generations are not motivated by the same factors. Motivation is
defined by Goleman as a passion to work for reasons that go beyond money or status,
pursuing goals with energy and persistence.
The changing nature of the economy and the evolution of the workforce has become a
significant source of interest especially in South Africa and Namibia in recent years. In
particular, the addition of Generation-Y employees into the workforce and the changing
focus of the career path towards unpredictable and boundary-less career orientations
(Briscoe, Hall & DeMuth, 2006) has called for organisations to adapt to the “era-shaped
needs” of their employees..
It can be concluded from the reviewed literature that employees from different
generations have different value systems and react differently to common life events. The
number of factors that motivate people cited by a number of authors are consistent and
comparable to Maslow’s “Hierarchy of Needs Theory” and Frederick Herzberg’s “Two
Factor Theory”. However, in contrast to most reviewed literature, Smola and Sutton
concluded that work values are more influenced by generational experiences than by age
and maturation.
The three generation groups studied in this research are Baby Boomers, Generation-X
and Generation-Y. A number of similarities and contrasts between generations have been
pointed out. The younger workforce, which is Generation-X and Generation-Y are for
instance more technologically literate than any previous generation. They are more group
oriented than Boomers, have short attention span and are adept to multitasking.
The Baby Boomers are so called because of the boom in their births between the years
of 1946 and 1964. This generation are said to have grown up embracing the psychology
of entitlement and expecting the best from life. They witnessed the shortcomings of
political, religious and business leaders and this is said to have resulted in a lack of
Copyright UCT
Generational Differences in Motivation Drivers: A Case Study at Telecom Namibia
MBA Research Report December 2009 33
respect for and loyalty to authority and social institutions. Kupperschmidt (2000)
highlighted that they also feel the pressure of caring for ageing parents and their own
children. Boomers strengths are said to include consensus building, mentoring, and
effecting change.
In contrast, Smola & Sutton (2000) points out that Generation-X, who were born between
the years of 1965 and 1981, are said to have grown up with financial and societal
insecurity, rapid change, great diversity, and a lack of solid traditions. Jurkiewicz & Brown
(1998) posited that this led to a sense of individualism over collectivism. The values most
important for Generation-X are a sense of belonging/teamwork, ability to learn new
things, autonomy and entrepreneurship, security, flexibility, feedback and short-term
rewards. They are said to crave mentors (Jurkievicz & Brown, 1998) and value a stable
family. Influenced greatly by seeing their parents being laid off, Kupperschmidt (2000)
suggests that they are cynical and untrusting They bring to the workplace well-honed,
practical approaches to problem solving, and they are said to be technically competent
and very comfortable with diversity, change and competition.
Generation-Y represents the youngest cohort of employees to finish their education, and
enter the workforce. As a recent addition to the workforce, they represent a currently
under researched group of workers and there is a need to investigate the work-related
characteristics, work needs, requirements and individual attitudes which motivate them in
their work.
From an employer perspective, generational differences operate to classify the overall
trend and values of employees, while offering insights into the most appropriate and
significant methods to understand and manage these differences. In determining how
different generations perceive the workplace and their motivation factors, different
strategies can be developed and implemented to improve the quality of life for all
workers. Furthermore, identifying generational differences will reduce
“misunderstandings, miscommunications and mixed signals” (Smola & Sutton, 2002, p.
363).
Copyright UCT
Generational Differences in Motivation Drivers: A Case Study at Telecom Namibia
MBA Research Report December 2009 34
3. Research Methodology
This section explains the type of research that was conducted and describes the research
approach, strategy and design that was followed. It also describes the data collection
methods and data analysis methods used and highlight the limitations of this study.
3.1 Research approach and strategy
This study aims to identify the main factors of motivating employees of different age
groups in a single organisation through an exploratory study of the cross-sectional
differences in motivation drivers across the three generational groups. The study was
conducted following an exploratory, case study approach focusing on a single
organisation. The set of assumptions for this study are more subjective and interpretative
in nature and therefore, the research methodology has to be inductive and exploratory.
Exploratory research is a method of “finding out what is happening and to seek new
insights” (Lewis et al, 2003, p. 96). The case study method is one of many exploratory
research techniques that can be used to obtain information and knowledge from one
particular situation. This approach is beneficial as pointed out by Zikmund (1997) and can
be of assistance in avoiding dangerous generalizations. The basic case study entails the
detailed and intensive analysis of a single case where a case as explained by Bryman
and Bell (2007) can be a single organisation, a single location, a person or a single event.
A case study is described by Yin (2002) as a strategy for doing research which involves
an empirical investigation of a particular contemporary phenomenon within its real life
context using multiple sources of evidence.
3.2 Research design
Bryman & Bell (2007) explain the concept of a research design as providing a framework
for the collection and analysis of data. The nature of the research question determines
the research methodology that would be appropriate. A case study is an empirical inquiry
that investigates a contemporary phenomenon within its real-life context, especially when
the boundaries between phenomenon and context are not clearly evident (Yin, 2003 p.
7). This means that one would use a case study method because one wants to cover a
contextual condition which is the case in this study. A case study research design is
appropriate because it is focussed on one company and survey data collection technique
Copyright UCT
Generational Differences in Motivation Drivers: A Case Study at Telecom Namibia
MBA Research Report December 2009 35
is preferred to enumerate the “what” questions central to this study because it is suited for
the “what” question (Yin, 2003, p. 6).
3.3 Data collection methods
3.3.1 Data collection process
The research made use of a self-administered survey as the primary method to collect
data from employees. The data was quantitatively analysed to arrive at the findings that
are summarised under section 4 of this report. The main steps of the data collection
process are summarised below:
Step 1: Identify key motivational drivers across generational groups from the
relevant literature.
Step 2: Design the questionnaire based on motivation drivers
Step 3: Pilot the questionnaire
Step 4: Administer the survey to get quantitative data
Step 5: Analyse the data and finalise the report
Step 1: Literature review
This process happened at the early phase of the study and involved researching various
sources for relevant academic references that relates to the research topic. Emphasis
was put on literature that covered cross-sectional studies on generational differences in
motivation drivers to identify the relevant themes that was used to draft the
questionnaires.
Step 2: Design of questionnaires
A standard questionnaire designed by Sutherland & Jordaan (2004) was used and
adapted with input from the work of Horwitz, Teng Heng, and Quazi (2003); Kaliprasad
(2006); Cennamo and Gardner (2008); Wong, Lang; Coulon (2008), and Montana & Petit
(2008).

Copyright UCT
Generational Differences in Motivation Drivers: A Case Study at Telecom Namibia
MBA Research Report December 2009 36
The questionnaire contained a set of structured questions and five open-ended
questions. The questionnaire was designed using the GSB online questionnaire tool
available to MBA students and it covered four main areas:
Structured questions on demographics, satisfaction, employee perception on
employability, planned stay at the company
A table of ten generic motivation factors that are drawn and adapted from the
mentioned literature sources. These factors are ranked in the perceived
importance from 1 to 10.
A table of 47 non company-specific variables that are rated in terms of importance
when deciding to leave or stay at the company
A number of open-ended questions that focussed specifically on Telecom Namibia,
the company being studied.
The self-administered questionnaire was used to collect responses from individuals. The
survey was forwarded to 540 employees made up of approximately 70% of each
generational group within the company’s workforce, i.e. 134 Baby Boomers, 334
Generation-X and 72 Generation-Y with a grade of C1 and upwards on the Patterson
grading system. These represent the entire population of all skilled workforces meeting
the criteria to participate in the survey. The survey was specifically targeted at this group
of workforce and it was only forwarded to those employees because they have achieved
a certain level of education and can thus understand the rationale and contextual
background of the study when completing the questionnaire. In terms of generational
grouping, the company’s workforce is made up of 25% Boomers, 62% Generation X and
13% Generation Y. The company has a total of 1260 staff compliments of which 1102 are
permanently appointed, 78 are on fixed term contracts and 80 are trainees. The full
Questionnaire used is attached as Appendix 1.
Step 3: Piloting the questionnaire
The study approach was presented to the CEO and a team of 10 Top Management of the
company on the 23rd September 2009 and some recommendations were received from
the General Manager of Human Resources and Strategic Training. The question on the
length of stay at the company with intervals of 5 years was specifically requested by him
Copyright UCT
Generational Differences in Motivation Drivers: A Case Study at Telecom Namibia
MBA Research Report December 2009 37
to be incorporated and was done. The questions where subsequently submitted to the
supervisor and slightly shortened, reduced by two questions before they were finalised.
This process assisted to identify short comings and get them addressed before the actual
survey was carried out.
Step 4: Administer the survey to get quantitative data
The questionnaire was online and self-administered and the participants were given up to
30 days to complete the survey.
3.4 Sampling methodology
The sample consisted of approximately 70% of all employees with a grade of C1 and
upwards on the Patterson grading system. It is assumed that these employees can
understand the rationale and contextual background of the study when completing the
questionnaire because of the level of education they have achieved. This group of
employees was first filtered from all employees, sorted in terms of age groups and the
70% from each group was randomly selected using excel before the survey was send out
to them. In this case, stratified random sampling was used because the approach
entailed breaking down the sample to a precise proportional of each age group (Bryman
& Bell, 2007). This group of 540 people has employees in various sections and
departments of the organisation and includes the whole top management team.
3.5 Data analysis methods
This study aims to understand and gain insight into the main motivation drivers across
various generations in a single Telecommunication / ICT organisation. Exploratory studies
are generally informal and qualitative in nature; however this study uses both the
quantitative and qualitative data analysis approach. The structured results from the
survey was quantitatively analysed and the focus group interview was planned to be
qualitatively analysed in line with Saunders, Lewis and Thornhill (2003) suggestion. This
appraoch is beneficial as it helps to clarify the author’s understanding and interpretation
of the survey findings
Microsoft Excel 2007 and its statistical tools and formula were used to produce
descriptive statistics from the structured data and present the findings using familiar
Copyright UCT
Generational Differences in Motivation Drivers: A Case Study at Telecom Namibia
MBA Research Report December 2009 38
methods. The analysis of the qualitative data focused on the interpretation of the findings
and compares it to the themes from literature.
The following statistical methods were used for the analysis of the quantitative data:
Descriptive statistics and Spearman’s Rank Correlation were used to determine the
interrelatedness between variables. As pointed out by Zar (1972), Spearman's rank
correlation coefficient method is one of the oldest and well known non-parametric
measure of correlation that could be used to describe the relationship between two
variables, without making any other assumptions about the particular nature of the
relationship between the variables.
The formula used is as follows:
3.6 Issues of validity
3.6.1 Triangulation
Yin (2003) suggests that the major strength of case study research design lies in the
opportunity to use many different sources of data. Triangulation refers to the use of
different data collection methods within one study in order to ensure that the data are
telling what you think they are telling. It is a useful attempt to cancel out the limitations of
one method by the use of the other in order to cross-check the findings (Bryman & Bell,
2007, p. 59). This has both epistemological and ontological importance on the research
outcome.
The study used two different data collection techniques, a self-administered online survey
and a focus group interview.
3.7 Research ethics
The specific and relevant ethical considerations suggested Bryman & Bell (2007) was
considered throughout the research. These included taking care to prevent any harm to
participants, privacy invasion and the use of appropriate technique to protect anonymity
Copyright UCT
Generational Differences in Motivation Drivers: A Case Study at Telecom Namibia
MBA Research Report December 2009 39
of participants. The participants will also be properly briefed about the background of the
study and their confidentiality ensured.
3.8 Limitation of the research
The research is a case study and it will focus only on one company and not on the entire
telecommunication sector in Namibia, region or the world. The sample is limited to one
company in Namibia. Due to the research taking place in a single organisation, the result
will specifically be more useful to this particular organisation. Case studies, like
experiments, are generalisable to theoretical propositions and not to populations or
universes (Yin, 2003, p. 10). The study was cross-sectional and based on cross-sectional
data. It is recommended to undertake a longitudinal study to asses’ motivational drivers of
different generations, when the participants are at the same age or the same point in their
career (Cennamo and Gardner, 2008).
Copyright UCT
Generational Differences in Motivation Drivers: A Case Study at Telecom Namibia
MBA Research Report December 2009 40
"Discovery consists of looking at the same thing as everyone else does and thinking
something different." Albert Szent-Gyorgyi (Szen-Gyorgyi, A, n.d)
4. Research Findings
This section summarises the main findings from both the survey and the focus group
research sessions.
The self-administered questionnaire that was used to collect responses from individuals
was forwarded to 540 employees and a total of 102 (19%) employees responded. The
respondents consist of 11 (11%) Generation-Y, 69 (68%) Generation-X and 22 (21%)
Baby Boomers. The 11% of the Generation-Y that participated in the survey represent
15% of the skilled Generation-Y population and the 68% of the Generation-X that
participated in the survey represent 20% of the skilled Generation-X population. Similarly,
the 21% Boomers that participated in the survey represent 16% of the skilled Baby
Boomers population of the workforce.
The proportions responses for Generation-Y and Baby Boomers are relatively low
although, as pointed out by Bryman & Bell (2007), that the absolute sample size is more
important than the relative size due to the way it can influence the precision of the sample
and sampling error. The author preferred a minimum of 30 responses per age group to
make statistical sense (Utts & Heckard, 2007) and be comfortable to generalise the
findings. The basic idea of confidence interval and sample error will be observed to see if
the data can be considered to be representative with regard to the question of interest
before it can be used to make inferences and generalisation about the population (Utts &
Heckard, 2007, p.404). This approach as suggested by Bryman & Bell (2007) is
necessary to fulfil replication, validity and reliability criteria of the research evaluation. The
analysis of the results in the following sections will take this into account because the low
response rate can lead to systematically overestimating or underestimating the truth
about the population of these age groups. This is despite the fact that the overall
percentage per age group of the respondents is consistent with the percentage age group
breakdown of the entire workforce.
Copyright UCT
Generational Differences in Motivation Drivers: A Case Study at Telecom Namibia
MBA Research Report December 2009 41
4.1 Demographics
4.1.a Age and gender profile
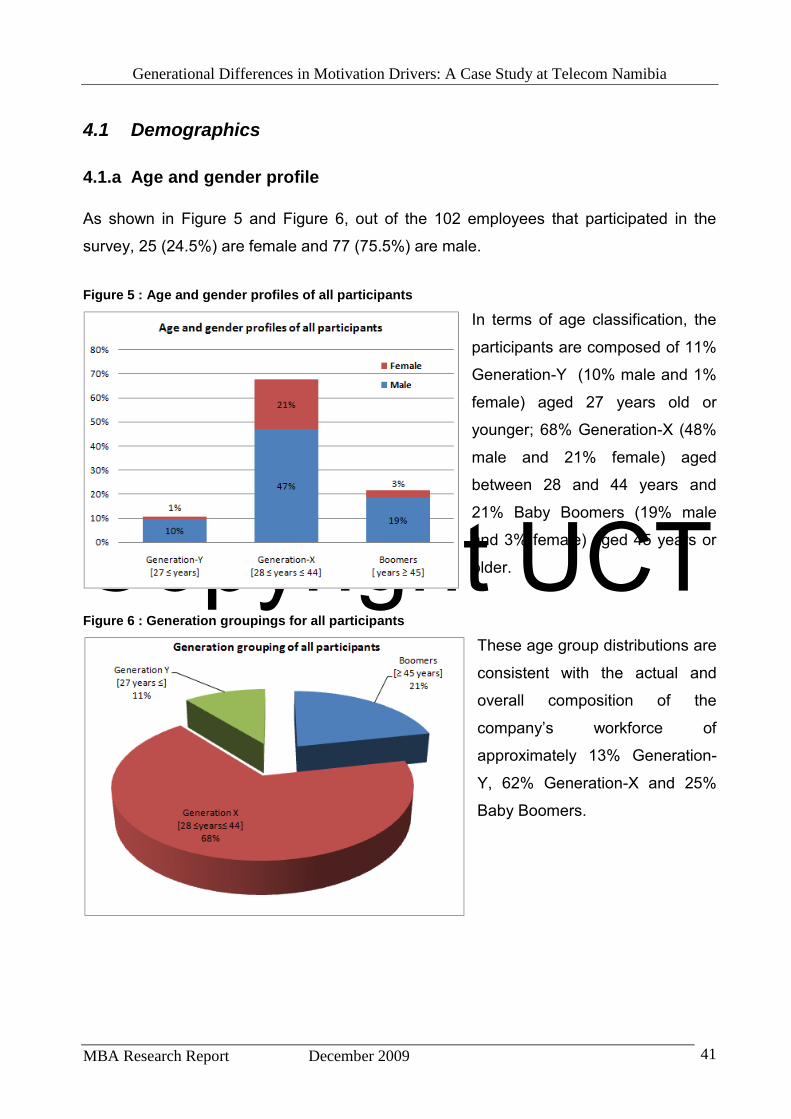
As shown in Figure 5 and Figure 6, out of the 102 employees that participated in the
survey, 25 (24.5%) are female and 77 (75.5%) are male.
Figure 5 : Age and gender profiles of all participants
In terms of age classification, the
participants are composed of 11%
Generation-Y (10% male and 1%
female) aged 27 years old or
younger; 68% Generation-X (48%
male and 21% female) aged
between 28 and 44 years and
21% Baby Boomers (19% male
and 3% female) aged 45 years or
older.
Figure 6 : Generation groupings for all participants
These age group distributions are
consistent with the actual and
overall composition of the
company’s workforce of
approximately 13% Generation-
Y, 62% Generation-X and 25%
Baby Boomers.
Copyright UCT
Generational Differences in Motivation Drivers: A Case Study at Telecom Namibia
MBA Research Report December 2009 42
4.1.b Uninterrupted years of service
The employees were asked to “select the number of uninterrupted years they have
worked at Telecom Namibia” and were provided with five choices to choose from.
Figure 7 : Uninterrupted years in employment grouped in years
Of all the 102 employees that
participated in the survey, 34%
have been employed by the
company for less than 5 years,
25% are between 5 to 10 years in
employment, 13% are between 10
to 15 years in employment, 15%
are between 15 to 20 years in
employment and 13% are
employed for over 20 years. Please refer to Figures 7 and 8 and Table 2 for this break
down.
Figure 8 : Uninterrupted years in employment per generation group
As expected, all Generation-Y are
employed for less than 5 years
and the majority of Boomers are
employed for over 15 years with
41% of them being employed for
over 20 years.
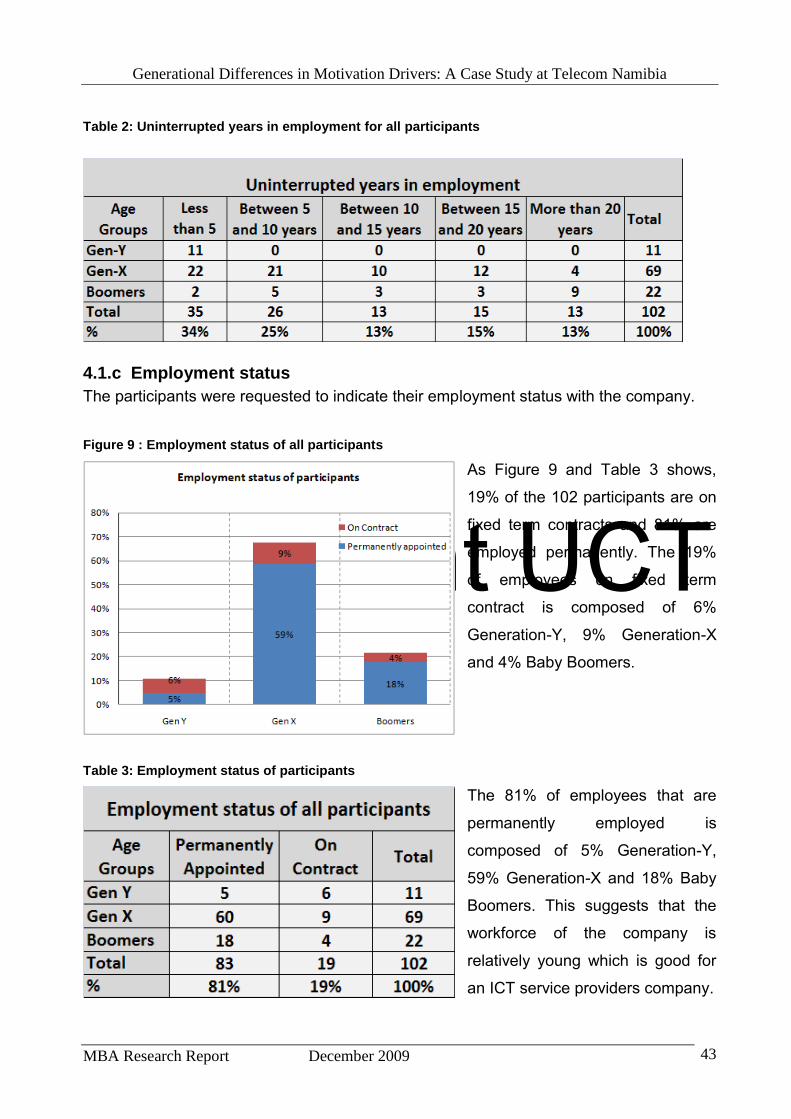
Copyright UCT
Generational Differences in Motivation Drivers: A Case Study at Telecom Namibia
MBA Research Report December 2009 43
Table 2: Uninterrupted years in employment for all participants
4.1.c Employment status
The participants were requested to indicate their employment status with the company.
Figure 9 : Employment status of all participants As Figure 9 and Table 3 shows,
19% of the 102 participants are on
fixed term contracts and 81% are
employed permanently. The 19%
of employees on fixed term
contract is composed of 6%
Generation-Y, 9% Generation-X
and 4% Baby Boomers.
Table 3: Employment status of participants
The 81% of employees that are
permanently employed is
composed of 5% Generation-Y,
59% Generation-X and 18% Baby
Boomers. This suggests that the
workforce of the company is
relatively young which is good for
an ICT service providers company.

Copyright UCT
Generational Differences in Motivation Drivers: A Case Study at Telecom Namibia
MBA Research Report December 2009 44
4.2 Ranking of motivation factors
4.2.a The top five motivation factors per generation group
One of the survey questions requested participants to rank the ten motivation factors that
were used in a number of recent studies not only to study the motivation levels but also
the retention of knowledge workers (Horwitz et al, 2003). The participants were asked to
rank these ten factors in order of importance in terms of what motivates them in their
current jobs. The results from the survey is summarised in Table 4 and it reveals that
there is a difference in how employees of different age groups ranked the factors that
motivate them.
The Generation-Y ranked the five most ranked important motivation factors as follows:
“career development and learning opportunities”,
“highly competitive pay package”
“performance incentives, performance based pay, bonuses”
“fun work environment, collaboration, openness, friendship and team work”
”access to leading technology”
Among the Generation-X, the five most important motivation factors are:
“career development & learning opportunities”,
“challenging, meaningful, interesting, fulfilling work” and
“access to leading edge technology”
“freedom to plan work and work independently”
“fun work environment, collaboration, openness, friendship and team work”
The Baby Boomers ranked the five most important motivation factors as follows:
“challenging, meaningful, interesting, fulfilling work”,
“freedom to plan work and work independently” and
“fun work environment, collaboration, openness, friendship and team work”
“highly competitive pay package”
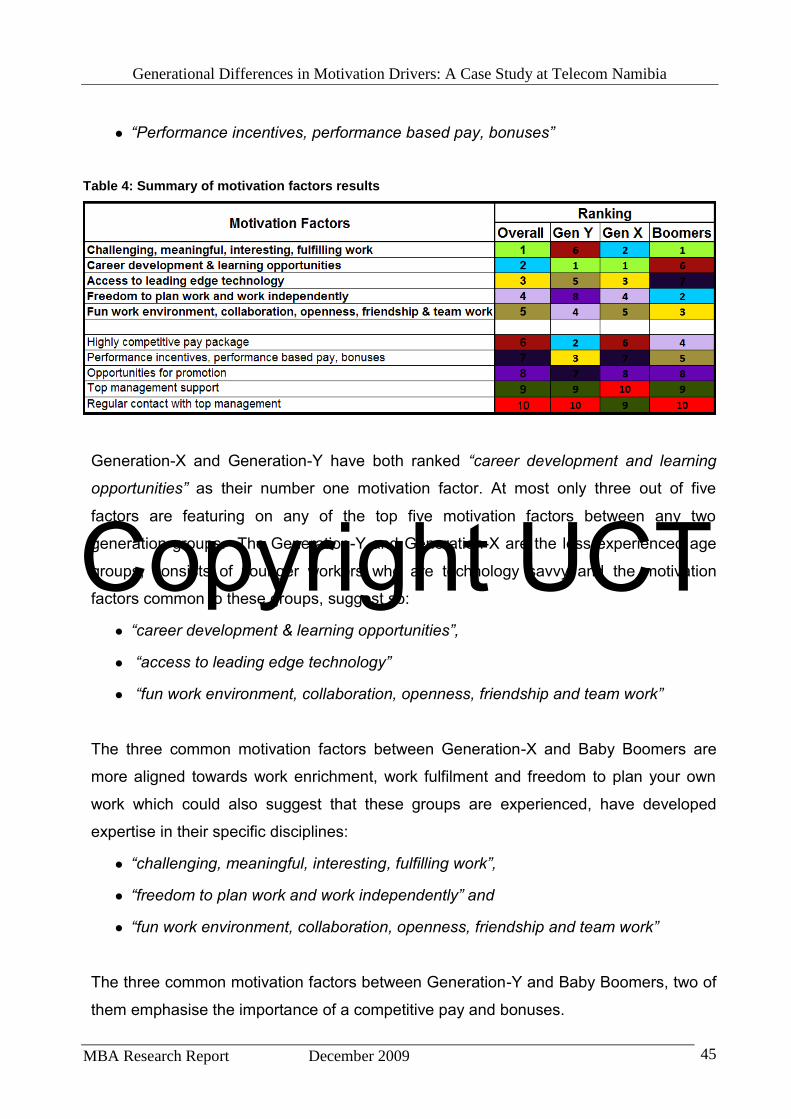
Copyright UCT
Generational Differences in Motivation Drivers: A Case Study at Telecom Namibia
MBA Research Report December 2009 45
“Performance incentives, performance based pay, bonuses”
Table 4: Summary of motivation factors results
Generation-X and Generation-Y have both ranked “career development and learning
opportunities” as their number one motivation factor. At most only three out of five
factors are featuring on any of the top five motivation factors between any two
generation groups. The Generation-Y and Generation-X are the less experienced age
groups, consists of younger workers who are technology savvy and the motivation
factors common to these groups, suggest so:
“career development & learning opportunities”,
“access to leading edge technology”
“fun work environment, collaboration, openness, friendship and team work”
The three common motivation factors between Generation-X and Baby Boomers are
more aligned towards work enrichment, work fulfilment and freedom to plan your own
work which could also suggest that these groups are experienced, have developed
expertise in their specific disciplines:
“challenging, meaningful, interesting, fulfilling work”,
“freedom to plan work and work independently” and
“fun work environment, collaboration, openness, friendship and team work”
The three common motivation factors between Generation-Y and Baby Boomers, two of
them emphasise the importance of a competitive pay and bonuses.
Copyright UCT
Generational Differences in Motivation Drivers: A Case Study at Telecom Namibia
MBA Research Report December 2009 46
“highly competitive pay package”
“performance incentives, performance based pay, bonuses”
“fun work environment, collaboration, openness, friendship and team work”
There are also some similarities in the ranking of the bottom two factors (nine and ten)
which are “top management support” and “regular contact with top management”.
When compared to the suggestions from the open ended questions, when employees
were requested to list additional aspects that they regard important with regard to
motivation, one notice common themes and similarities in meaning on a number of top
ranked factors:
The company is in an exciting industry
Exposure to new and different technologies
I am learning and gaining good experience
I am working on my own and I know what I am doing
Good salary and benefits
Team work and cooperation among all employees
Overall, Boomers and Generation-Y ranked social work values (“fun work environment,
collaboration, openness, friendship and team work”; “top management support” and
“regular contact with top management”) higher than Generation-X. Boomers and
Generation-Y also ranked intrinsic values (“challenging, meaningful, interesting, fulfilling
work”; “career development and learning opportunities”) and extrinsic values (“highly
competitive pay package” and “performance incentives, performance based pay and
bonuses”) higher than the Generation-X. However, Generation-Y and Generation-X
ranked status values (“opportunity for promotion” and access to leading technology)
higher than the Boomers. The Boomers and Generation-X ranked the freedom values
(“freedom to plan work and work independently”) higher than the Generation-Y.
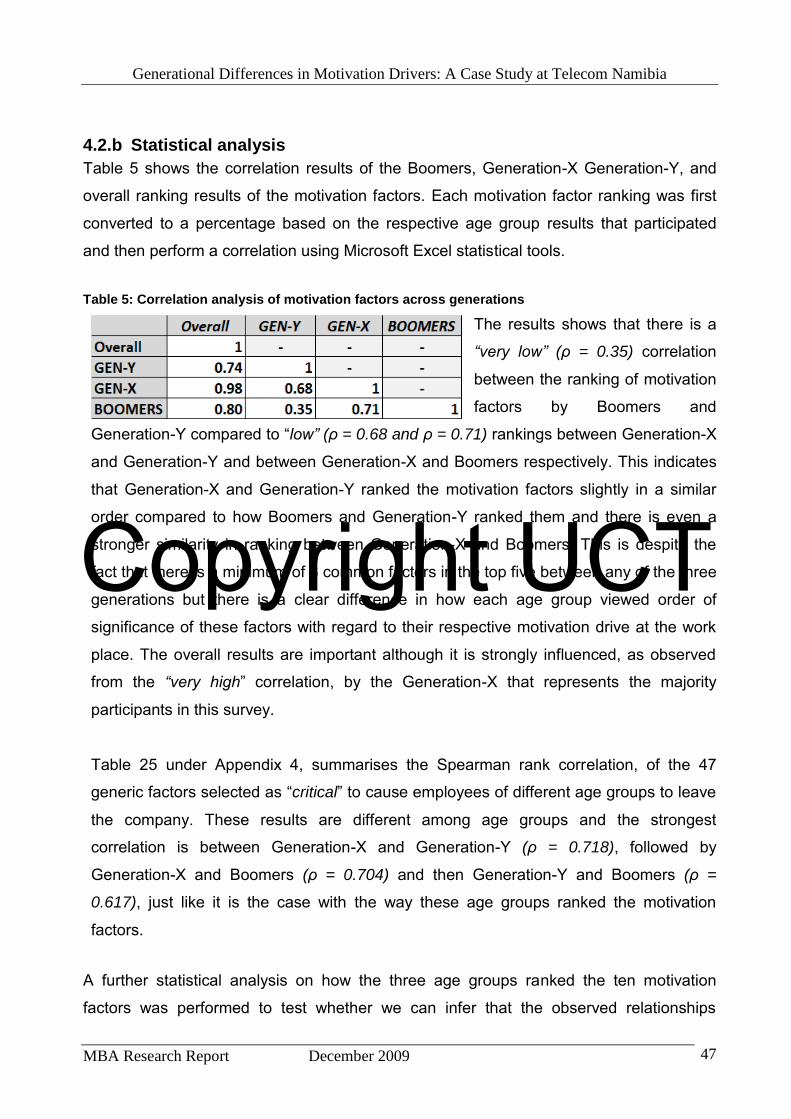
Copyright UCT
Generational Differences in Motivation Drivers: A Case Study at Telecom Namibia
MBA Research Report December 2009 47
4.2.b Statistical analysis
Table 5 shows the correlation results of the Boomers, Generation-X Generation-Y, and
overall ranking results of the motivation factors. Each motivation factor ranking was first
converted to a percentage based on the respective age group results that participated
and then perform a correlation using Microsoft Excel statistical tools.
Table 5: Correlation analysis of motivation factors across generations
The results shows that there is a
“very low” (ρ = 0.35) correlation
between the ranking of motivation
factors by Boomers and
Generation-Y compared to “low” (ρ = 0.68 and ρ = 0.71) rankings between Generation-X
and Generation-Y and between Generation-X and Boomers respectively. This indicates
that Generation-X and Generation-Y ranked the motivation factors slightly in a similar
order compared to how Boomers and Generation-Y ranked them and there is even a
stronger similarity in ranking between Generation-X and Boomers. This is despite the
fact that there is a minimum of 3 common factors in the top five between any of the three
generations but there is a clear difference in how each age group viewed order of
significance of these factors with regard to their respective motivation drive at the work
place. The overall results are important although it is strongly influenced, as observed
from the “very high” correlation, by the Generation-X that represents the majority
participants in this survey.
Table 25 under Appendix 4, summarises the Spearman rank correlation, of the 47
generic factors selected as “critical” to cause employees of different age groups to leave
the company. These results are different among age groups and the strongest
correlation is between Generation-X and Generation-Y (ρ = 0.718), followed by
Generation-X and Boomers (ρ = 0.704) and then Generation-Y and Boomers (ρ =
0.617), just like it is the case with the way these age groups ranked the motivation
factors.
A further statistical analysis on how the three age groups ranked the ten motivation
factors was performed to test whether we can infer that the observed relationships
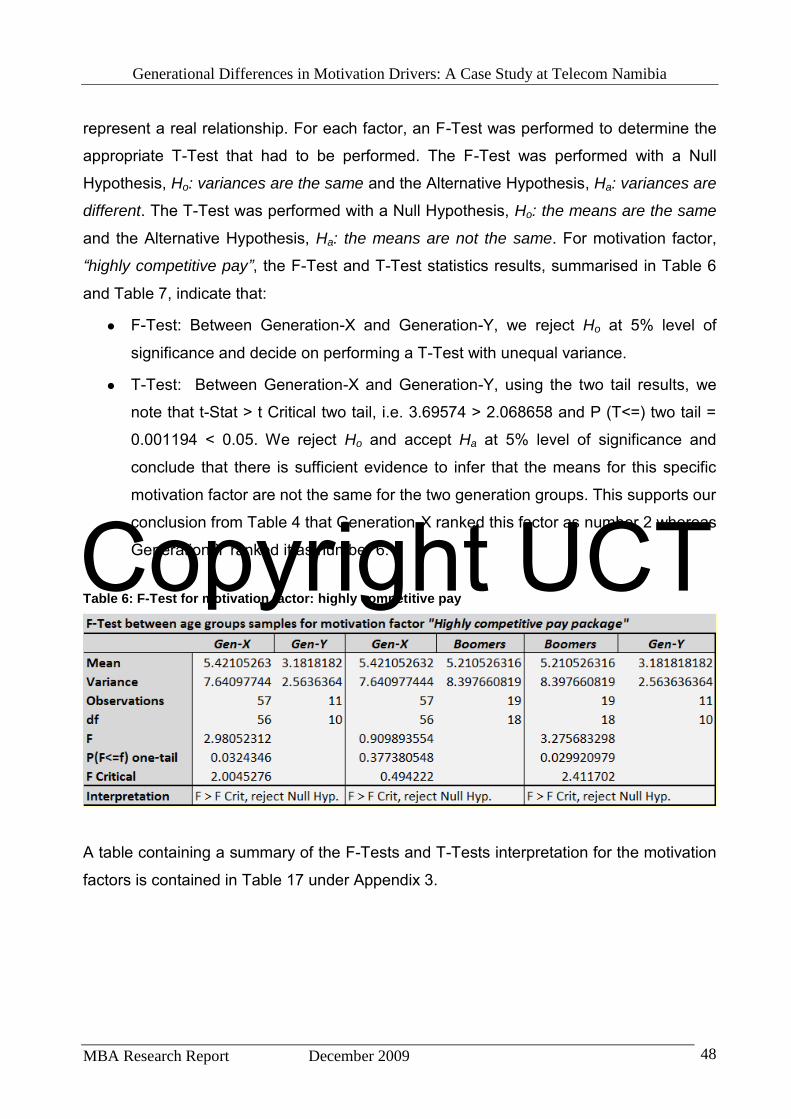
Copyright UCT
Generational Differences in Motivation Drivers: A Case Study at Telecom Namibia
MBA Research Report December 2009 48
represent a real relationship. For each factor, an F-Test was performed to determine the
appropriate T-Test that had to be performed. The F-Test was performed with a Null
Hypothesis, Ho: variances are the same and the Alternative Hypothesis, Ha: variances are
different. The T-Test was performed with a Null Hypothesis, Ho: the means are the same
and the Alternative Hypothesis, Ha: the means are not the same. For motivation factor,
“highly competitive pay”, the F-Test and T-Test statistics results, summarised in Table 6
and Table 7, indicate that:
F-Test: Between Generation-X and Generation-Y, we reject Ho at 5% level of
significance and decide on performing a T-Test with unequal variance.
T-Test: Between Generation-X and Generation-Y, using the two tail results, we
note that t-Stat > t Critical two tail, i.e. 3.69574 > 2.068658 and P (T<=) two tail =
0.001194 < 0.05. We reject Ho and accept Ha at 5% level of significance and
conclude that there is sufficient evidence to infer that the means for this specific
motivation factor are not the same for the two generation groups. This supports our
conclusion from Table 4 that Generation-X ranked this factor as number 2 whereas
Generation-Y ranked it as number 6.
Table 6: F-Test for motivation factor: highly competitive pay
A table containing a summary of the F-Tests and T-Tests interpretation for the motivation
factors is contained in Table 17 under Appendix 3.
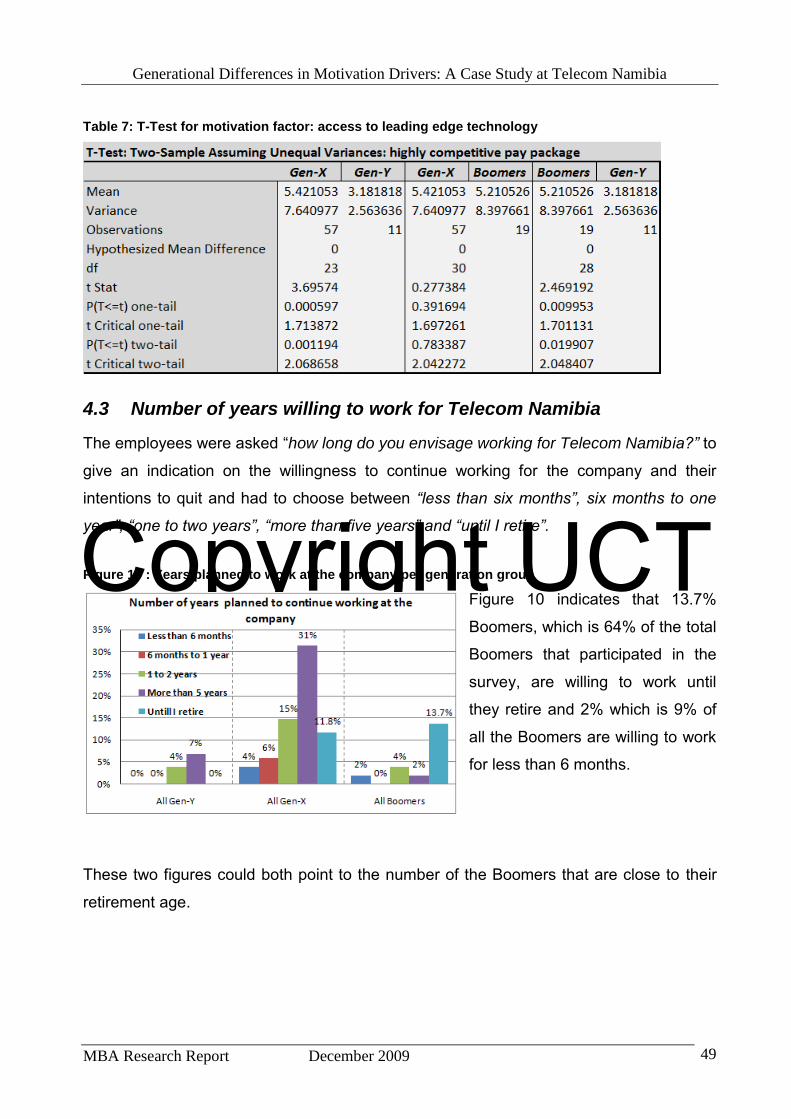
Copyright UCT
Generational Differences in Motivation Drivers: A Case Study at Telecom Namibia
MBA Research Report December 2009 49
Table 7: T-Test for motivation factor: access to leading edge technology
4.3 Number of years willing to work for Telecom Namibia
The employees were asked “how long do you envisage working for Telecom Namibia?” to
give an indication on the willingness to continue working for the company and their
intentions to quit and had to choose between “less than six months”, six months to one
year”, “one to two years”, “more than five years” and “until I retire”.
Figure 10 : Years planned to work at the company per generation group
Figure 10 indicates that 13.7%
Boomers, which is 64% of the total
Boomers that participated in the
survey, are willing to work until
they retire and 2% which is 9% of
all the Boomers are willing to work
for less than 6 months.
These two figures could both point to the number of the Boomers that are close to their
retirement age.
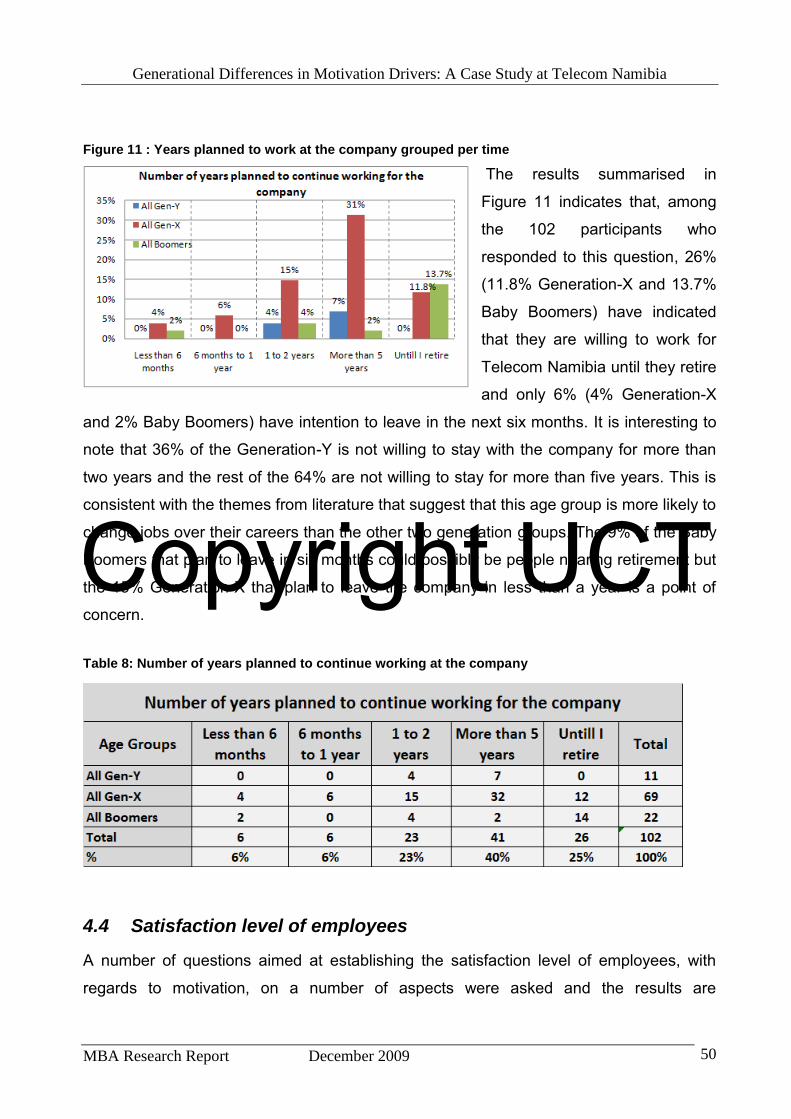
Copyright UCT
Generational Differences in Motivation Drivers: A Case Study at Telecom Namibia
MBA Research Report December 2009 50
Figure 11 : Years planned to work at the company grouped per time
The results summarised in
Figure 11 indicates that, among
the 102 participants who
responded to this question, 26%
(11.8% Generation-X and 13.7%
Baby Boomers) have indicated
that they are willing to work for
Telecom Namibia until they retire
and only 6% (4% Generation-X
and 2% Baby Boomers) have intention to leave in the next six months. It is interesting to
note that 36% of the Generation-Y is not willing to stay with the company for more than
two years and the rest of the 64% are not willing to stay for more than five years. This is
consistent with the themes from literature that suggest that this age group is more likely to
change jobs over their careers than the other two generation groups. The 9% of the Baby
Boomers that plan to leave in six months could possibly be people nearing retirement but
the 15% Generation-X that plan to leave the company in less than a year is a point of
concern.
Table 8: Number of years planned to continue working at the company
4.4 Satisfaction level of employees
A number of questions aimed at establishing the satisfaction level of employees, with
regards to motivation, on a number of aspects were asked and the results are
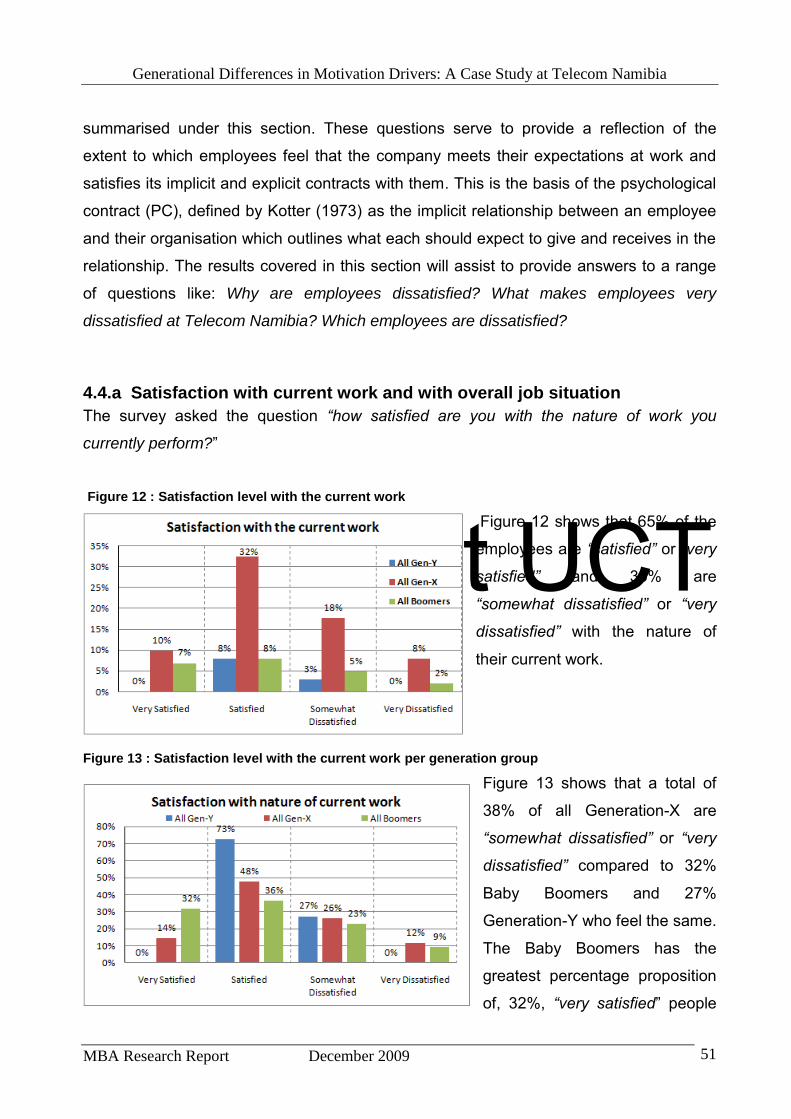
Copyright UCT
Generational Differences in Motivation Drivers: A Case Study at Telecom Namibia
MBA Research Report December 2009 51
summarised under this section. These questions serve to provide a reflection of the
extent to which employees feel that the company meets their expectations at work and
satisfies its implicit and explicit contracts with them. This is the basis of the psychological
contract (PC), defined by Kotter (1973) as the implicit relationship between an employee
and their organisation which outlines what each should expect to give and receives in the
relationship. The results covered in this section will assist to provide answers to a range
of questions like: Why are employees dissatisfied? What makes employees very
dissatisfied at Telecom Namibia? Which employees are dissatisfied?
4.4.a Satisfaction with current work and with overall job situation
The survey asked the question “how satisfied are you with the nature of work you
currently perform?”
Figure 12 : Satisfaction level with the current work
Figure 12 shows that 65% of the
employees are “satisfied” or “very
satisfied” and 35% are
“somewhat dissatisfied” or “very
dissatisfied” with the nature of
their current work.
Figure 13 : Satisfaction level with the current work per generation group
Figure 13 shows that a total of
38% of all Generation-X are
“somewhat dissatisfied” or “very
dissatisfied” compared to 32%
Baby Boomers and 27%
Generation-Y who feel the same.
The Baby Boomers has the
greatest percentage proposition
of, 32%, “very satisfied” people
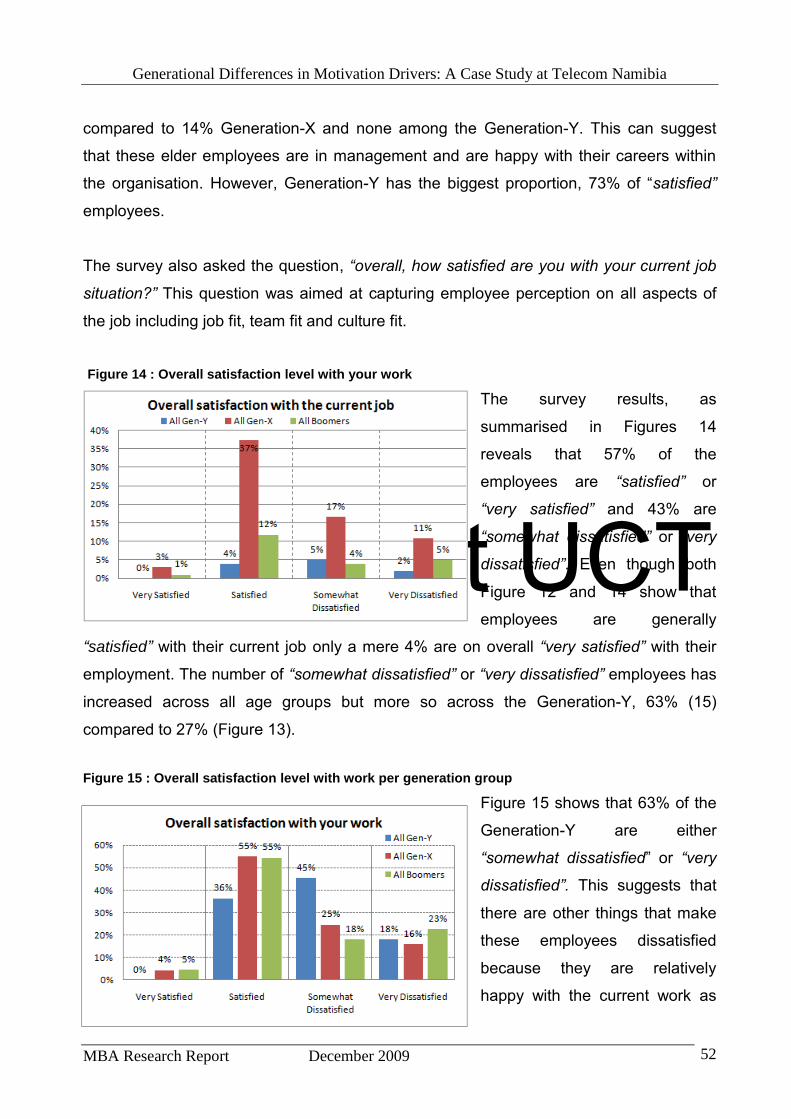
Copyright UCT
Generational Differences in Motivation Drivers: A Case Study at Telecom Namibia
MBA Research Report December 2009 52
compared to 14% Generation-X and none among the Generation-Y. This can suggest
that these elder employees are in management and are happy with their careers within
the organisation. However, Generation-Y has the biggest proportion, 73% of “satisfied”
employees.
The survey also asked the question, “overall, how satisfied are you with your current job
situation?” This question was aimed at capturing employee perception on all aspects of
the job including job fit, team fit and culture fit.
Figure 14 : Overall satisfaction level with your work
The survey results, as
summarised in Figures 14
reveals that 57% of the
employees are “satisfied” or
“very satisfied” and 43% are
“somewhat dissatisfied” or “very
dissatisfied”. Even though both
Figure 12 and 14 show that
employees are generally
“satisfied” with their current job only a mere 4% are on overall “very satisfied” with their
employment. The number of “somewhat dissatisfied” or “very dissatisfied” employees has
increased across all age groups but more so across the Generation-Y, 63% (15)
compared to 27% (Figure 13).
Figure 15 : Overall satisfaction level with work per generation group Figure 15 shows that 63% of the
Generation-Y are either
“somewhat dissatisfied” or “very
dissatisfied”. This suggests that
there are other things that make
these employees dissatisfied
because they are relatively
happy with the current work as
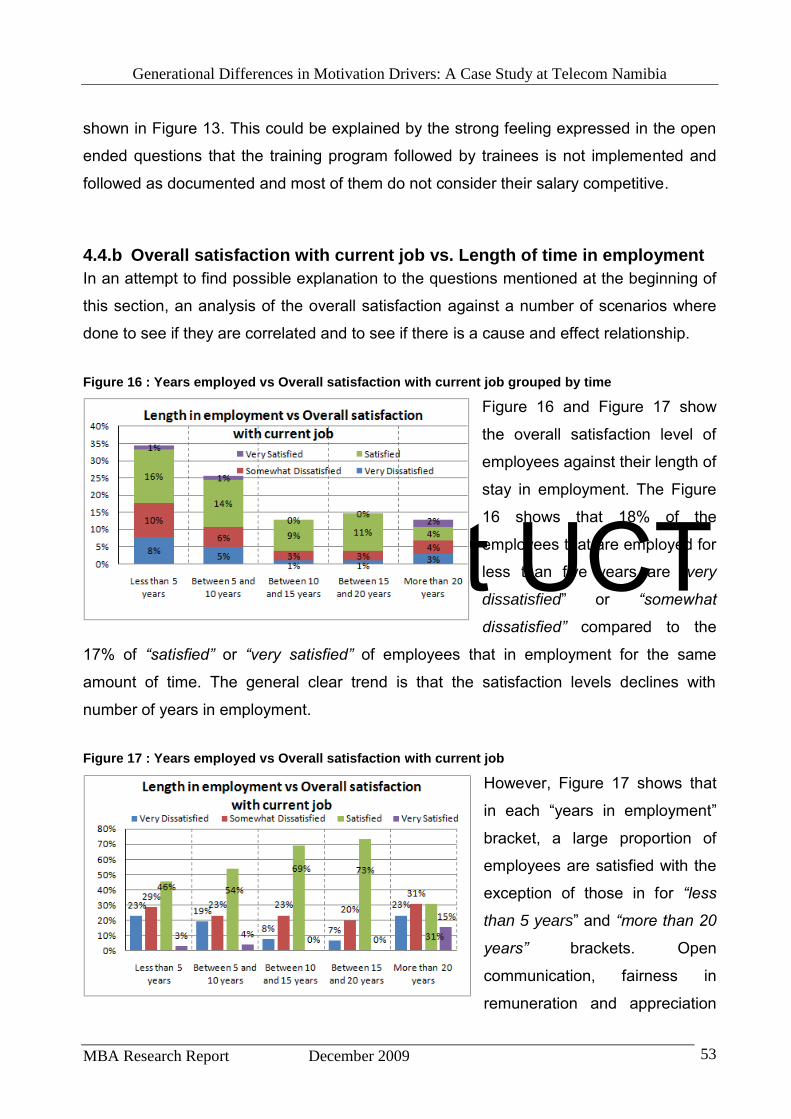
Copyright UCT
Generational Differences in Motivation Drivers: A Case Study at Telecom Namibia
MBA Research Report December 2009 53
shown in Figure 13. This could be explained by the strong feeling expressed in the open
ended questions that the training program followed by trainees is not implemented and
followed as documented and most of them do not consider their salary competitive.
4.4.b Overall satisfaction with current job vs. Length of time in employment
In an attempt to find possible explanation to the questions mentioned at the beginning of
this section, an analysis of the overall satisfaction against a number of scenarios where
done to see if they are correlated and to see if there is a cause and effect relationship.
Figure 16 : Years employed vs Overall satisfaction with current job grouped by time
Figure 16 and Figure 17 show
the overall satisfaction level of
employees against their length of
stay in employment. The Figure
16 shows that 18% of the
employees that are employed for
less than five years are “very
dissatisfied” or “somewhat
dissatisfied” compared to the
17% of “satisfied” or “very satisfied” of employees that in employment for the same
amount of time. The general clear trend is that the satisfaction levels declines with
number of years in employment.
Figure 17 : Years employed vs Overall satisfaction with current job However, Figure 17 shows that
in each “years in employment”
bracket, a large proportion of
employees are satisfied with the
exception of those in for “less
than 5 years” and “more than 20
years” brackets. Open
communication, fairness in
remuneration and appreciation
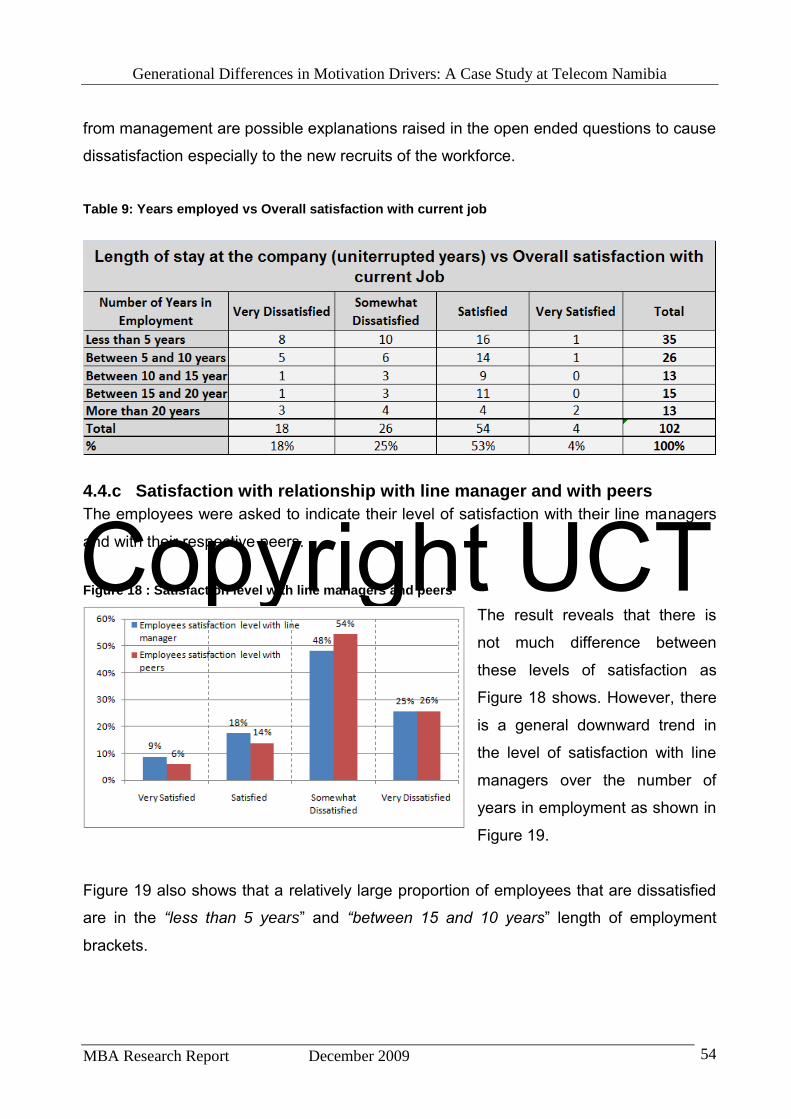
Copyright UCT
Generational Differences in Motivation Drivers: A Case Study at Telecom Namibia
MBA Research Report December 2009 54
from management are possible explanations raised in the open ended questions to cause
dissatisfaction especially to the new recruits of the workforce.
Table 9: Years employed vs Overall satisfaction with current job
4.4.c Satisfaction with relationship with line manager and with peers
The employees were asked to indicate their level of satisfaction with their line managers
and with their respective peers.
Figure 18 : Satisfaction level with line managers and peers The result reveals that there is
not much difference between
these levels of satisfaction as
Figure 18 shows. However, there
is a general downward trend in
the level of satisfaction with line
managers over the number of
years in employment as shown in
Figure 19.
Figure 19 also shows that a relatively large proportion of employees that are dissatisfied
are in the “less than 5 years” and “between 15 and 10 years” length of employment
brackets.
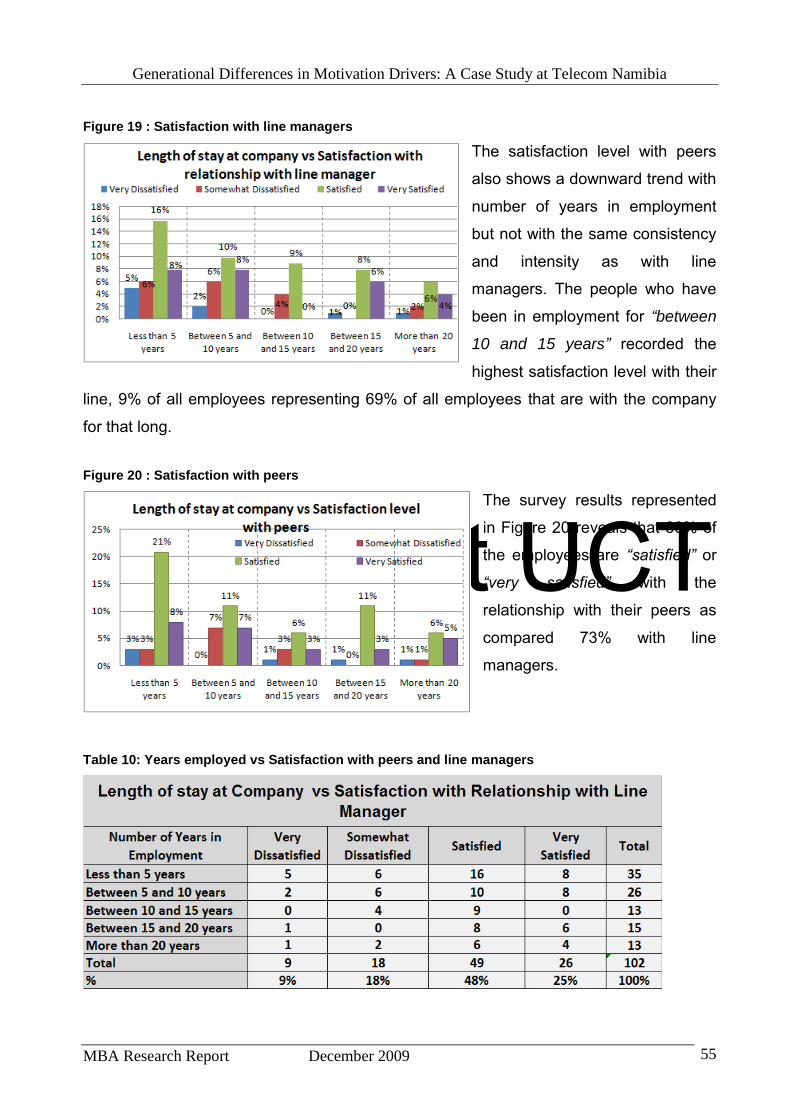
Copyright UCT
Generational Differences in Motivation Drivers: A Case Study at Telecom Namibia
MBA Research Report December 2009 55
Figure 19 : Satisfaction with line managers
The satisfaction level with peers
also shows a downward trend with
number of years in employment
but not with the same consistency
and intensity as with line
managers. The people who have
been in employment for “between
10 and 15 years” recorded the
highest satisfaction level with their
line, 9% of all employees representing 69% of all employees that are with the company
for that long.
Figure 20 : Satisfaction with peers
The survey results represented
in Figure 20 reveals that 80% of
the employees are “satisfied” or
“very satisfied” with the
relationship with their peers as
compared 73% with line
managers.
Table 10: Years employed vs Satisfaction with peers and line managers
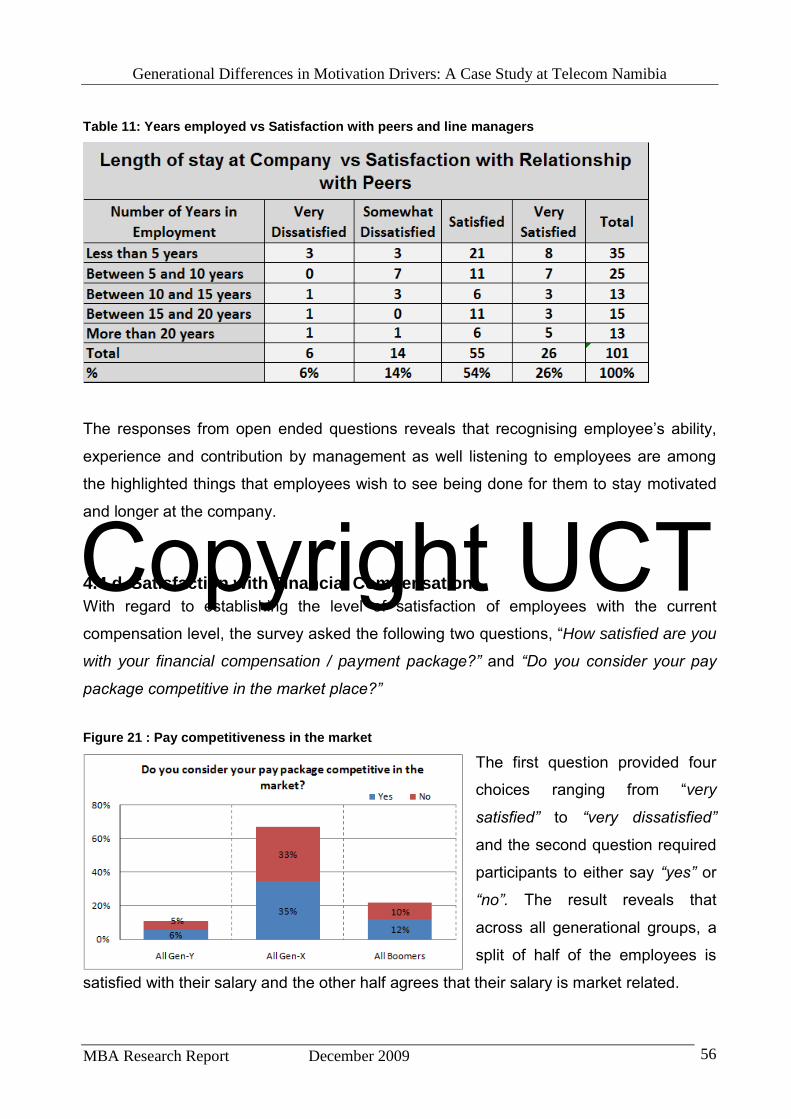
Copyright UCT
Generational Differences in Motivation Drivers: A Case Study at Telecom Namibia
MBA Research Report December 2009 56
Table 11: Years employed vs Satisfaction with peers and line managers
The responses from open ended questions reveals that recognising employee’s ability,
experience and contribution by management as well listening to employees are among
the highlighted things that employees wish to see being done for them to stay motivated
and longer at the company.
4.4.d Satisfaction with Financial Compensation
With regard to establishing the level of satisfaction of employees with the current
compensation level, the survey asked the following two questions, “How satisfied are you
with your financial compensation / payment package?” and “Do you consider your pay
package competitive in the market place?”
Figure 21 : Pay competitiveness in the market
The first question provided four
choices ranging from “very
satisfied” to “very dissatisfied”
and the second question required
participants to either say “yes” or
“no”. The result reveals that
across all generational groups, a
split of half of the employees is
satisfied with their salary and the other half agrees that their salary is market related.
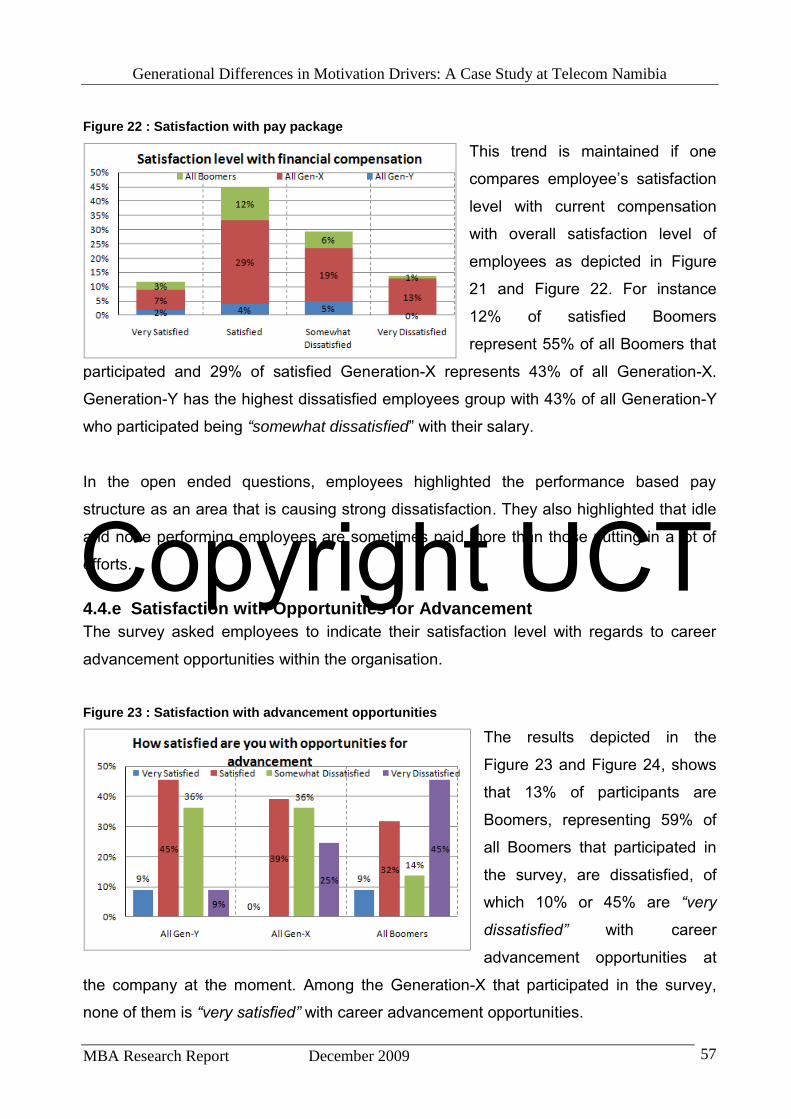
Copyright UCT
Generational Differences in Motivation Drivers: A Case Study at Telecom Namibia
MBA Research Report December 2009 57
Figure 22 : Satisfaction with pay package
This trend is maintained if one
compares employee’s satisfaction
level with current compensation
with overall satisfaction level of
employees as depicted in Figure
21 and Figure 22. For instance
12% of satisfied Boomers
represent 55% of all Boomers that
participated and 29% of satisfied Generation-X represents 43% of all Generation-X.
Generation-Y has the highest dissatisfied employees group with 43% of all Generation-Y
who participated being “somewhat dissatisfied” with their salary.
In the open ended questions, employees highlighted the performance based pay
structure as an area that is causing strong dissatisfaction. They also highlighted that idle
and none performing employees are sometimes paid more than those putting in a lot of
efforts.
4.4.e Satisfaction with Opportunities for Advancement
The survey asked employees to indicate their satisfaction level with regards to career
advancement opportunities within the organisation.
Figure 23 : Satisfaction with advancement opportunities
The results depicted in the
Figure 23 and Figure 24, shows
that 13% of participants are
Boomers, representing 59% of
all Boomers that participated in
the survey, are dissatisfied, of
which 10% or 45% are “very
dissatisfied” with career
advancement opportunities at
the company at the moment. Among the Generation-X that participated in the survey,
none of them is “very satisfied” with career advancement opportunities.
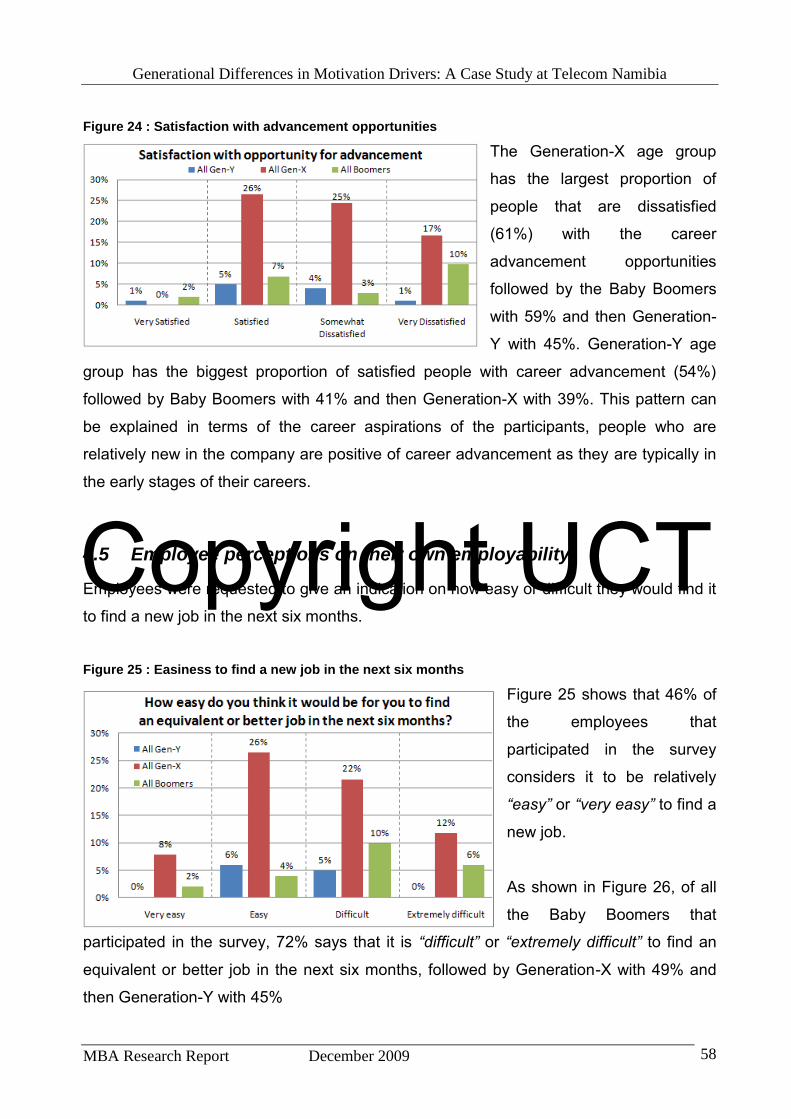
Copyright UCT
Generational Differences in Motivation Drivers: A Case Study at Telecom Namibia
MBA Research Report December 2009 58
Figure 24 : Satisfaction with advancement opportunities The Generation-X age group
has the largest proportion of
people that are dissatisfied
(61%) with the career
advancement opportunities
followed by the Baby Boomers
with 59% and then Generation-
Y with 45%. Generation-Y age
group has the biggest proportion of satisfied people with career advancement (54%)
followed by Baby Boomers with 41% and then Generation-X with 39%. This pattern can
be explained in terms of the career aspirations of the participants, people who are
relatively new in the company are positive of career advancement as they are typically in
the early stages of their careers.
4.5 Employee perceptions on their own employability
Employees were requested to give an indication on how easy or difficult they would find it
to find a new job in the next six months.
Figure 25 : Easiness to find a new job in the next six months
Figure 25 shows that 46% of
the employees that
participated in the survey
considers it to be relatively
“easy” or “very easy” to find a
new job.
As shown in Figure 26, of all
the Baby Boomers that
participated in the survey, 72% says that it is “difficult” or “extremely difficult” to find an
equivalent or better job in the next six months, followed by Generation-X with 49% and
then Generation-Y with 45%
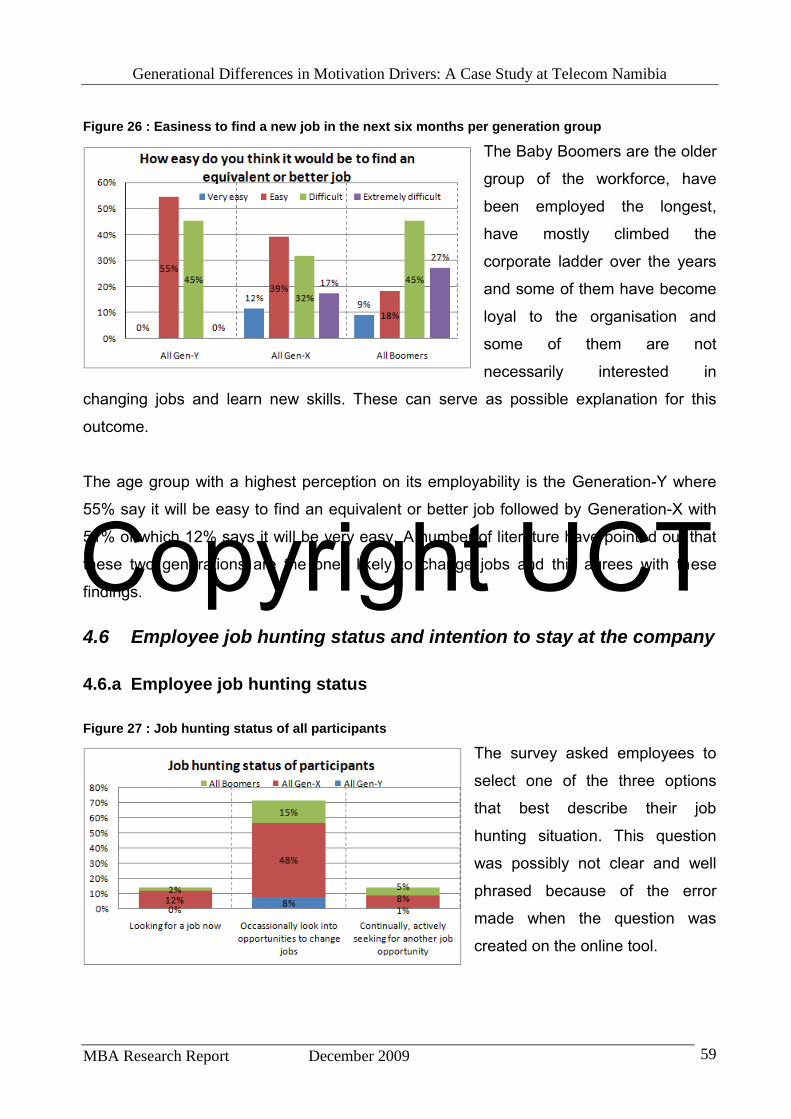
Copyright UCT
Generational Differences in Motivation Drivers: A Case Study at Telecom Namibia
MBA Research Report December 2009 59
Figure 26 : Easiness to find a new job in the next six months per generation group The Baby Boomers are the older
group of the workforce, have
been employed the longest,
have mostly climbed the
corporate ladder over the years
and some of them have become
loyal to the organisation and
some of them are not
necessarily interested in
changing jobs and learn new skills. These can serve as possible explanation for this
outcome.
The age group with a highest perception on its employability is the Generation-Y where
55% say it will be easy to find an equivalent or better job followed by Generation-X with
51% of which 12% says it will be very easy. A number of literature have pointed out that
these two generations are the ones likely to change jobs and this agrees with these
findings.
4.6 Employee job hunting status and intention to stay at the company
4.6.a Employee job hunting status
Figure 27 : Job hunting status of all participants The survey asked employees to
select one of the three options
that best describe their job
hunting situation. This question
was possibly not clear and well
phrased because of the error
made when the question was
created on the online tool.
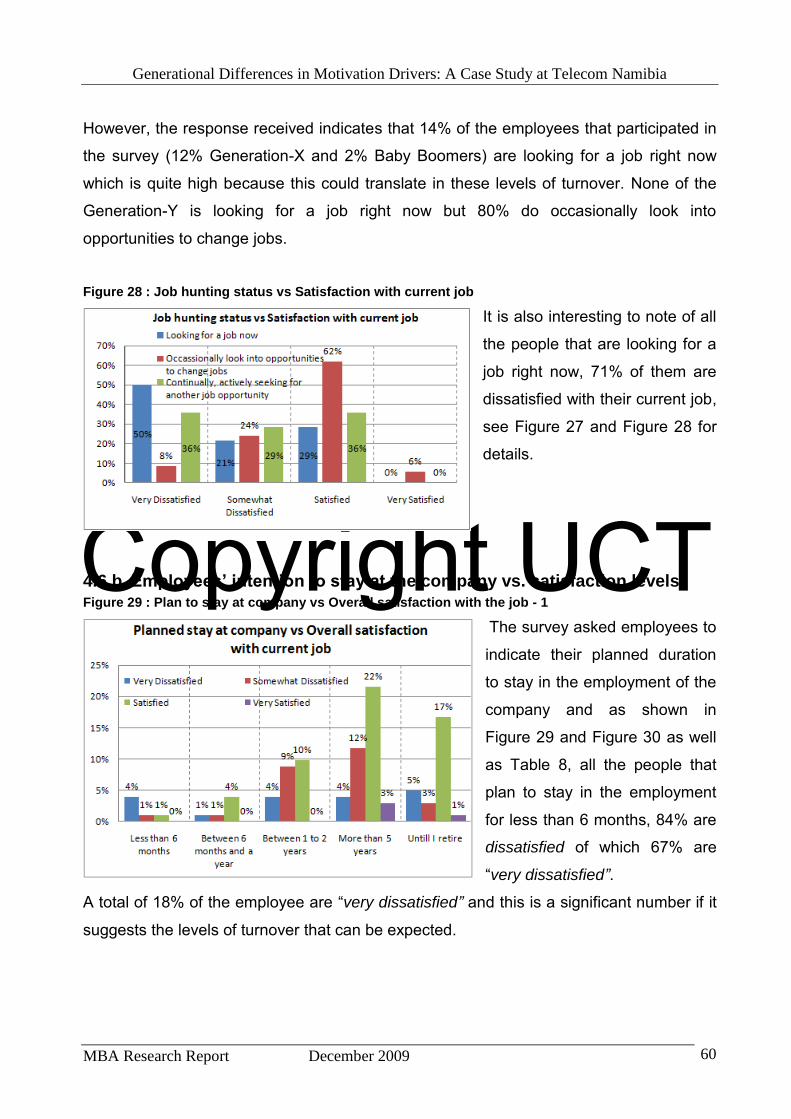
Copyright UCT
Generational Differences in Motivation Drivers: A Case Study at Telecom Namibia
MBA Research Report December 2009 60
However, the response received indicates that 14% of the employees that participated in
the survey (12% Generation-X and 2% Baby Boomers) are looking for a job right now
which is quite high because this could translate in these levels of turnover. None of the
Generation-Y is looking for a job right now but 80% do occasionally look into
opportunities to change jobs.
Figure 28 : Job hunting status vs Satisfaction with current job
It is also interesting to note of all
the people that are looking for a
job right now, 71% of them are
dissatisfied with their current job,
see Figure 27 and Figure 28 for
details.
4.6.b Employees’ intention to stay at the company vs. satisfaction levels Figure 29 : Plan to stay at company vs Overall satisfaction with the job - 1
The survey asked employees to
indicate their planned duration
to stay in the employment of the
company and as shown in
Figure 29 and Figure 30 as well
as Table 8, all the people that
plan to stay in the employment
for less than 6 months, 84% are
dissatisfied of which 67% are
“very dissatisfied”.
A total of 18% of the employee are “very dissatisfied” and this is a significant number if it
suggests the levels of turnover that can be expected.

Copyright UCT
Generational Differences in Motivation Drivers: A Case Study at Telecom Namibia
MBA Research Report December 2009 61
Figure 30 : Plan to stay at company vs Overall satisfaction with the job - 2
From the open-ended questions,
employees mentioned corporate
politics, indecisiveness of
management, ongoing blame
culture, unreasonable work load
and burn out, interference from
everyone in their respective
work, and lack of recognition as
some of the issues that will
cause them to leave the company.
Table 12: Years planned to stay vs Overall satisfaction with current job
Employees also suggested and listed the following as possible things that the company
could do to make them stay:
Do away with red tapes and improve speed of decision making
Improve management support to the employees that are doing the work
Learn to listen more to employees
Recognise employees experience and not only academic qualifications
Recognise employees ability and get the best out of employees
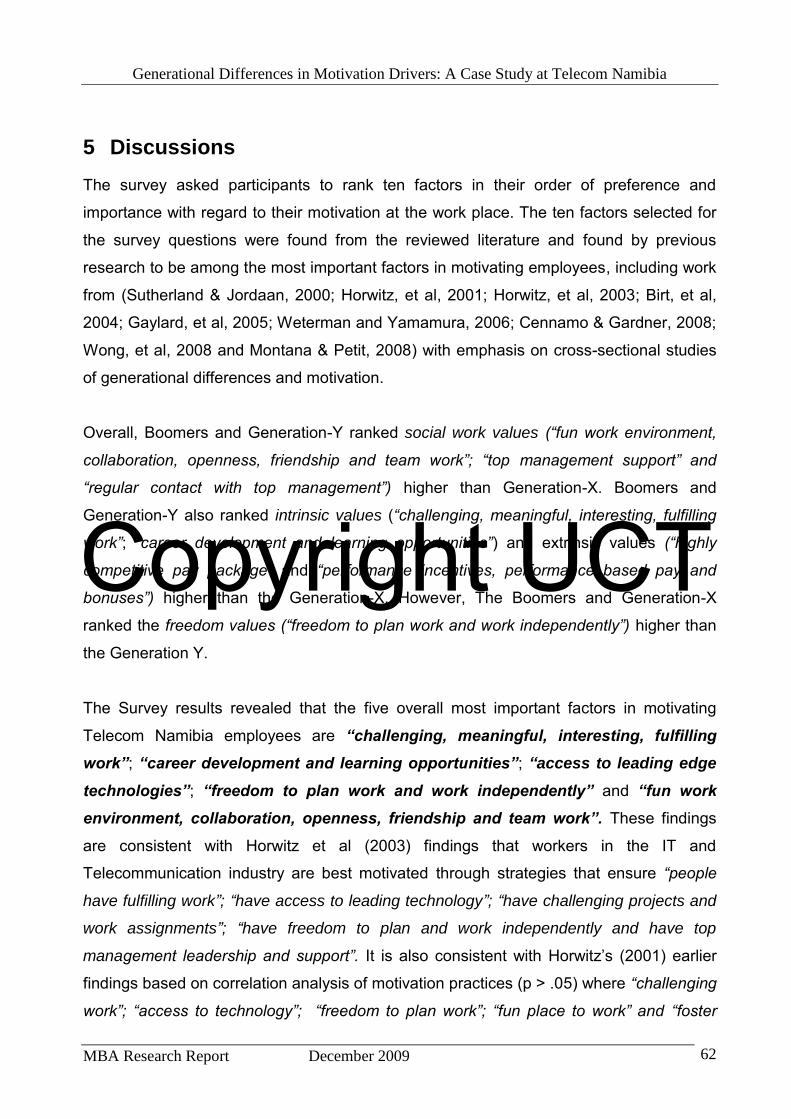
Copyright UCT
Generational Differences in Motivation Drivers: A Case Study at Telecom Namibia
MBA Research Report December 2009 62
5 Discussions
The survey asked participants to rank ten factors in their order of preference and
importance with regard to their motivation at the work place. The ten factors selected for
the survey questions were found from the reviewed literature and found by previous
research to be among the most important factors in motivating employees, including work
from (Sutherland & Jordaan, 2000; Horwitz, et al, 2001; Horwitz, et al, 2003; Birt, et al,
2004; Gaylard, et al, 2005; Weterman and Yamamura, 2006; Cennamo & Gardner, 2008;
Wong, et al, 2008 and Montana & Petit, 2008) with emphasis on cross-sectional studies
of generational differences and motivation.
Overall, Boomers and Generation-Y ranked social work values (“fun work environment,
collaboration, openness, friendship and team work”; “top management support” and
“regular contact with top management”) higher than Generation-X. Boomers and
Generation-Y also ranked intrinsic values (“challenging, meaningful, interesting, fulfilling
work”; “career development and learning opportunities”) and extrinsic values (“highly
competitive pay package” and “performance incentives, performance based pay and
bonuses”) higher than the Generation-X. However, The Boomers and Generation-X
ranked the freedom values (“freedom to plan work and work independently”) higher than
the Generation Y.
The Survey results revealed that the five overall most important factors in motivating
Telecom Namibia employees are “challenging, meaningful, interesting, fulfilling
work”; “career development and learning opportunities”; “access to leading edge
technologies”; “freedom to plan work and work independently” and “fun work
environment, collaboration, openness, friendship and team work”. These findings
are consistent with Horwitz et al (2003) findings that workers in the IT and
Telecommunication industry are best motivated through strategies that ensure “people
have fulfilling work”; “have access to leading technology”; “have challenging projects and
work assignments”; “have freedom to plan and work independently and have top
management leadership and support”. It is also consistent with Horwitz’s (2001) earlier
findings based on correlation analysis of motivation practices (p > .05) where “challenging
work”; “access to technology”; “freedom to plan work”; “fun place to work” and “foster
Copyright UCT
Generational Differences in Motivation Drivers: A Case Study at Telecom Namibia
MBA Research Report December 2009 63
collaboration and team” emerged as the top motivation strategies. The only factor that is
different between Horwitz and this report’s findings is the top management leadership
and support which is ranked ninth overall on the findings of this study.
The findings also showed that there is a difference in the way the three generations
ranked the motivation factors. The Baby Boomers showed lower levels ranking (ranked
6th) of “career development & learning opportunities” than the younger generation who
both ranked this as their number one motivator. This is consistent with Herzberg theory
and findings that people are motivated by intrinsic factors that answer people’s deep-
seated need for growth and achievement. It is also possible, as Cennamo and Gardner
(2008) points out that, employees who are longer years in employment, the Boomers in
this case, may be in a position whereby the requirement of career development has been
met and is no longer the most important need to them. Overall, one can conclude that the
younger employees appears to focus on career security and older employees tend to
focus on job security as revealed through the survey including the number years each
age group is willing to continue working for the organisation.
The results also revealed that younger generations placed more importance on status
values as revealed by the survey results, Generation-Y and Generation-X ranked
“opportunity for promotion” and “access to leading technology” higher than the Boomers
which is consistent with Cennamo and Gardner’s results that suggest that younger
respondents are still striving for status and freedom.
Boomers and Generation-X showed lower values for freedom than Generation-Y. It is
possible that higher status and longer tenure mean that these requirements have been
met and these work values are no longer as salient for older groups, whereas younger
respondents are still striving for status and autonomy at work.
Proportionally, Boomers are the most satisfied with their current jobs and current pay
package, 60% and 69% respectively as compared to 59% and 53% for the Generation-X
and 36% and 54% for the Generation-Y. This could be explained by the fact that,
currently the generation holding the majority of senior positions are the older groups,
introducing the potential younger employees to experience less fit and unhappiness in
Copyright UCT
Generational Differences in Motivation Drivers: A Case Study at Telecom Namibia
MBA Research Report December 2009 64
their job if they hold different values. This information was confirmed through the
discussion with a selection of colleagues in the organisation.
Given their career stage and number of years in employment, the older generation could
be receiving higher salaries and enjoying higher status already compared to young
employees. They have thus a better fit with extrinsic work values and status values which
is also consistent with Cennamo and Gardner’s results.
The analysis of the 47 generic factors that may cause an employee to leave the
organisation indicates that the “lack of communication” and “feedback”, “recognition”,
“good pay and fair treatment”, “self development and improvement”, “freedom”, “new
opportunities and challenges”, “opportunity to do interesting and quality work” are among
the top reasons why Generation-X might leave the organisation. Many of the highly
ranked factors can be grouped under achievement, recognition, advancement and growth
that according to Herzberg’s theory are motivator factors that can lead to job satisfaction.
A Spearman Rank correlation was performed on these factors across all three
generations and although slightly different, it showed positive correlation that suggests
that in general, the people across all age groups are likely to leave the organisation due
to a range of common factors. The strongest correlation is between Generation-X and
Generation-Y (rho = 0.718), followed by Generation-X and Boomers (ρ = 0.704) and
then Generation-Y and Boomers (ρ = 0.617), and this order is consistent with the way
these age groups ranked the motivation factors. The Spearman Rank correlation table is
attached under Annex 4, Table 22. The overall ranking of the factors produced results
that match the suggestions of the open ended questions on why employees would want
to leave the organisation. However, due to the low response for the Generation-Y and
Baby Boomer, these results are observed bearing in mind the sampling error and non-
response error and further generalisation on these two age groups cannot be
emphasised.
Generations-X recorded the lowest dissatisfaction with “salary”, “career advancement”
(61% dissatisfied); “plan to leave the company in one year” (15%) and “dissatisfaction
with the current job” (38%). They have also listed and suggested that “rewards and
competitive pay” are consideration that can make them want to stay longer with the
Copyright UCT
Generational Differences in Motivation Drivers: A Case Study at Telecom Namibia
MBA Research Report December 2009 65
company. Competitive compensation should however not be the only focus because it
buys temporary compliance and does not create a lasting commitment. This is explained
by Kohn who (1993) wrote about the redemptive power of rewards and that the
connection between incentive program and problem with workplace productivity and
morale is not linear. In his analysis, punishment and rewards are actually two sides of the
same coin and both have punitive effect because they are manipulative. The focus of
program to motivate employees should therefore focus on job enrichment in line with
Herzberg theory.
A discussion with the General Manager for Human Resources and Strategic Training on
the study findings highlighted that the morale of employees is unsurprisingly at its lowest
this year due to a number of reasons most of which were mentioned by employees in the
survey. He mentioned the structural re-alignment that is taking too long, perceived salary
inequality in some sections of the company and the company decision not to pay
performance bonuses this year due to financial performance targets that are not met. All
these issues can be addressed in the short to medium term and require a consistent and
clear communication plan. Their impact on overall staff motivation can therefore be
managed.
Copyright UCT
Generational Differences in Motivation Drivers: A Case Study at Telecom Namibia
MBA Research Report December 2009 66
6 Conclusions and Recommendations
The findings of the study on the motivation factors that are widely and generally
considered to motivate workers showed similarities with reviewed literature. The
similarities were observed on both overall ranking, by all employees, of these factors and
also for the cross-sectional analysis across the three generational groups. Similarities
were further observed with literature that analysed motivation in the specific industry. The
analysis of the survey outcome showed that younger generation are more concerned with
career security while older employees are more concerned with job security. These
suggest that employees at Telecom Namibia are motivated and driven by the same
factors as those identified by earlier research in other parts of the world. The author
would recommend that future studies could include additional diversity characteristics that
were not included in this research like ethnicity and race given these dimensions of
diversity exist in the company studied.
The company is going through a structural re-alignment to better manage its NGN
network but currently there are less focussed initiatives and concerted efforts across the
organisation to motivate employees and manage talent within the organisation. This is
one of the recommendations that will be made to the organisation, to better manage their
talented employees through the implementation of an appropriate motivation strategy.
The study revealed a number of areas that employees are currently not satisfied with.
Some of the listed issues can be handled and solved as projects, with a start and end
date and some would require the introduction or amendment of existing policies,
strategies and a new approach to manage people. For instance, to finish the structural re-
alignment can be handled as a project and get it done in a specified time frame that is
well communicated. To introduce a way of embracing ideas from employees and giving
employees timely appreciation and recognition requires a change in how and what is
communicated with regard to work and a change in management approach and
communication with employees when discussing achievements and difficulties related to
work. The author recommends and is interested to be part of a team to write a booklet,
that could be called “The Telecom Namibia Way” that will be available to all employees,
as a hard copy and online, as a quick reference and a guide to new recruits.

Copyright UCT
Generational Differences in Motivation Drivers: A Case Study at Telecom Namibia
MBA Research Report December 2009 67
The Generations-X, which responded well to the survey, has recorded the highest
dissatisfaction with salary, with career advancement; plan to leave the company in one
year and dissatisfaction with the current job. They have also listed and suggested
rewards and competitive pay as possible reasons that can make them stay with the
company and this suggest that the introduction of a meaningful incentive scheme would
contribute to the improvement of motivation together with a performance bonuses.
The study also revealed a number of motivation enhancing initiatives that can be
implemented including service pride awards for milestones achieved, awarded to
employees that are caught in the act of providing exceptional service, recognising people
and making them feel special is the best way to boost morale and quality at the same
time. Also personally thanking employees for doing a good job, one on one, verbally, in
writing or both in a timely manner, often and sincerely will go a long way in improving and
maintaining a high motivation level among employees. Recognition, rewarding and
promoting people based on their performance should be the only way and management
has to deal with low and marginal performers so that they either improve or leave. The
combination of these, addressed in a transparent and equitable way will motivate
employees on a sustained basis.
The design of work should be such that it provides employees with a sense of ownership
in their work and work environment and management should strive to create a work
environment that is open, trusting and fun and encourage new ideas and initiatives. The
focus on job enrichment that gives people a chance to grow and learn new skills is critical
in motivating employees.
Strong suggestions from employees themselves indicated that management need to be
willing to take time to meet and listen to employees and provide specific feedback about
performance of the person, the department and the organisation. Employees also
preferred that they be provided with information on how the company makes and loses
money, upcoming products and strategies for competing in the market place and were
possible; get them involved in decisions making, especially when these decisions affect
them. Overall HR programs should be tailored to needs of employees taking into account
the generational diversity, needs of its workforce and the era in which we find ourselves.
Copyright UCT
Generational Differences in Motivation Drivers: A Case Study at Telecom Namibia
MBA Research Report December 2009 68
7 Future Research The cross-sectional design did not make it possible to determine whether differences
between groups were linked to career stage, life stage or genuine generational
differences. Those born earlier not only belong to a different generation to those born
later, but have been living (and working) for longer, with all the associated changes that
may results from experience. It is recommended to do further studies with a focus on
work needs for each generational group and a focus on longitudinal research to separate
the effect of generation, age and other variables. It is believed also from available
literature and pointed out by Cennamo and Gardner (2008) that true generational
differences can only be identified by studying groups over time.
Copyright UCT
Generational Differences in Motivation Drivers: A Case Study at Telecom Namibia
MBA Research Report December 2009 69
References
Amar, A. D. (2004). Motivating knowledge workers to innovate: a model integrating
motivation dynamics and antecedents. European Journal of Innovation Management,
7(2), 89-101.
Bronstein, S. (2009). Maslow's hierarchy of physiological needs. Retrieved November,
3oth, 2009 from http://stanleybronstein.com/maslows-hierarchy-physiological-needs/.
Bryman, A., Bell, E. (2007). Business research methods. Second Edition. Oxford New
York: Oxford University Press.
Cennamo, L., & Gardner, D. (2008). Generational Differences in work values, outcomes
and person-organisation values fit. Journal of Management Psychology, 23(8), 891-906.
Codrington, G., & Grant-Marshall, S. (2008), Mind the gap, Penguin Books: South Africa.
Chandler, R. (n.d.). Raymond Chandler Quotes. Retrieved August 26, 2009, from
http://www.brainyquote.com/quotes/authors/r/raymond_chandler.html
DiRomualdo, T. (2006). Viewpoint: Geezers, Grungers, GenXers, and Geeks: A look at
Workplace Generational Conflict. Journal of Financial Planning, 18-21.
Dries, N., Pepermans, R., De Kerpel, E. (2008). Exploring four generations’ beliefs about
career: Is “satisfied” the new “successful”? Journal of Management Psychology, 23(8),
907 - 928
Gawel, J. E. (1997). Herzberg's theory of motivation and maslow's hierarchy of needs.
Practical Assessment, Research & Evaluation, 5(11). Retrieved December 4, 2009, from
http://PAREonline.net/getvn.asp?v=5&n=11
Glaser, B.G., (1992), Basics of grounded theory analysis: emergence vs forcing, Mill
Valley : Sociology Press.
Copyright UCT
Generational Differences in Motivation Drivers: A Case Study at Telecom Namibia
MBA Research Report December 2009 70
Goleman, D. (1998). What makes a leader? Harvard Business Review, January, 2004,
p.2 – 12.
Herzberg, F., Mausner, B., & Snyderman, B. B. (1959). The Motivation to Work (2nd ed.).
New York: John Wiley & Sons.
Horwitz, F. M., Heng, T. C., & Quazi, H. A. (2003). Finders, keepers? Attracting,
motivating and retaining knowledge workers, Human resource Management Journal,
13(4), 23 – 44.
Johnson, P. (2006). Knowledge for Science and Practice. Academy of Management
Review, 31(4), 802 – 821.
Jurkiewicz, C.E., Brown, R.G. (1998). GenXers vs boomers vs matures: generational
comparisons of public employee motivation. Review of Public Personnel Administration,
18, 18-37.
Jurkiewicz, C.E. (2000). Generation X and the public employee. Public Personnel
Management, 29, .55-74.
Kim, W.C. & Mauborgne, R. (2005). Blue Ocean Strategy. Harvard Business School
Publishing Corporation
Kupperschmidt, B. R. (2000). Multigeneration employees: Strategies for effective
management. Health Care Manager 19(1), 65-76.
Macky, K., Gardner, D., & Forsyth, S. (2008). Generational differences at work:
introduction and overview. Journal of Managerial Psychology, 23(8), 857-861.
Maslow, A. H. (1970). Motivation and Personality (2nd ed.). New York: Harper and Row.
Montana, P. J., & Petit, F. (2008). Motivating and Managing Generation-X and Y on the
Job While Preparing for Z: A market oriented approach. Journal of business & economics
Research, 6(8), 35 – 40.
Copyright UCT
Generational Differences in Motivation Drivers: A Case Study at Telecom Namibia
MBA Research Report December 2009 71
Nelson, B. (2003). Rewarding Employees: The Top 10 Ways to motivate Your
Employees. ABA Bank Marketing. January and February, 10 -11.
Nohria, N., Groysberg, B. & Lee, L. (2008). Employee Motivation: A Powerful New Model.
Harvard Business Review, July-August 2008, 78 – 84.
Rossi, J., (2007), What generation gap? Are generational differences in the workplace a
myth? T+D; November 2007; page 10 to 11.
Saunders, M., Lewis, P., Thornhill, A. (1997) Research Methods for Business Students.
Harlow, Essex: Prentice-Hall, Inc
Schermerhorn, J. R.; Hunt, G. J., & Osborn, N. R. (2002). Organisational Behaviour (7th
ed.). Wiley: University of Phoenix
Smola, K.W., Sutton, C.D. (2002). Generational differences: revisiting generational work
values for the new millennium. Journal of Organizational Behaviour, 23(1), 363-82.
Westerman, J. W., & Yamamura J. H. (2007). Generational preferences for work
environment fit: effects on employee outcomes. Career Development International, 12(2),
150-161
Wegner, T. (2000). Quantitative methods for marketing decisions. Cape Town: Juta 27,
86 – 87, 108.
Wong, M., Gardiner, E., Lang, W. & Coulon, L. (2008). Generational differences in
personality and motivation: Do they exist and what are the implications for the workplace?
Journal of Management Psychology, 23(8), 878-890.
Yin, R. K. (2002) Case Study Research Design and Methods,Third Edition. California:
Sage Publications Inc.
Copyright UCT
Generational Differences in Motivation Drivers: A Case Study at Telecom Namibia
MBA Research Report December 2009 72
Yu, H. C., & Miller, P. (2005). Leadership style: The X generation and Baby Boomers
compared in different cultural contexts. Leadership and Organisation Development
Journal, 26(1), 35-50.
Zemke, R., Raines, C. and Filipczak, B. (2000), Generations at Work: Managing the
Clash of Veterans, Boomers, Xers, and Nexters in Your Workplace, AMACOM, New
York, NY.
Zar, J., H. (1972), Significance Testing of the Spearman Rank Correlation Coefficient.
Journal of the American Statistical Association, 67(339), 578-580.
Zikmund, W.G. (1997). Business Research Methods. Fort Worth: Harcourt Brace College
Publishers.
Copyright UCT
Generational Differences in Motivation Drivers: A Case Study at Telecom Namibia
MBA Research Report December 2009 73
Appendix 1: Survey Questionnaire
Questionnaire Dear Participants,
Thank you for completing the survey below. All responses are anonymous and will remain
completely confidential. Your honesty is appreciated.
1. Gender
2. Select your age range
3. Select your job grading range
4. Select your employment status with Telecom Namibia
5. Select the range of uninterrupted years you have worked at Telecom Namibia
Male Female
27 years old and below Between 28 and 44 years 45 years old and above
A and B band C-band D-band E or higher band
Permanently employed On contract
Less than 5
years
Between 5 and
10 years
Between 10 and
15 years
Between 15 and
20 years
More than 20
years
Copyright UCT
Generational Differences in Motivation Drivers: A Case Study at Telecom Namibia
MBA Research Report December 2009 74
6. How long do you envisage working for Telecom Namibia?
7. How satisfied are you with the nature of work you currently perform?
8. How satisfied are you with your relationship with your direct line manager / supervisor?
9. How satisfied are you with relationship with your team / your co-workers or peers?
10. How satisfied are you with your financial compensation / payment package?
11. Do you consider your pay package competitive in the market place?
12. How satisfied are you with opportunities for advancement at Telecom Namibia?
Less than 6
months
6 months to a
year
1 to 2 years More than 5
years
Until I retire
Very dissatisfied Somewhat
dissatisfied
Satisfied Very satisfied
Very dissatisfied
Somewhat
dissatisfied
Satisfied
Very satisfied
Very dissatisfied Somewhat
dissatisfied
Satisfied Very satisfied
Very dissatisfied Somewhat
dissatisfied
Satisfied Very satisfied
Yes No
Copyright UCT
Generational Differences in Motivation Drivers: A Case Study at Telecom Namibia
MBA Research Report December 2009 75
13. Overall, how satisfied are you with your current job situation?
14. How easy do you think it would be for you to find an equivalent or better job in the next
six months?
15. Which one of the following statements best describe your current situation:
Very dissatisfied
Somewhat
dissatisfied
Satisfied
Very satisfied
Very dissatisfied
Somewhat
dissatisfied
Satisfied
Very satisfied
Extremely
difficult
Difficult
Easy
Very Easy
I am looking for another job 1
I occasionally look into opportunities for changing jobs 2
I am not looking for another job 3
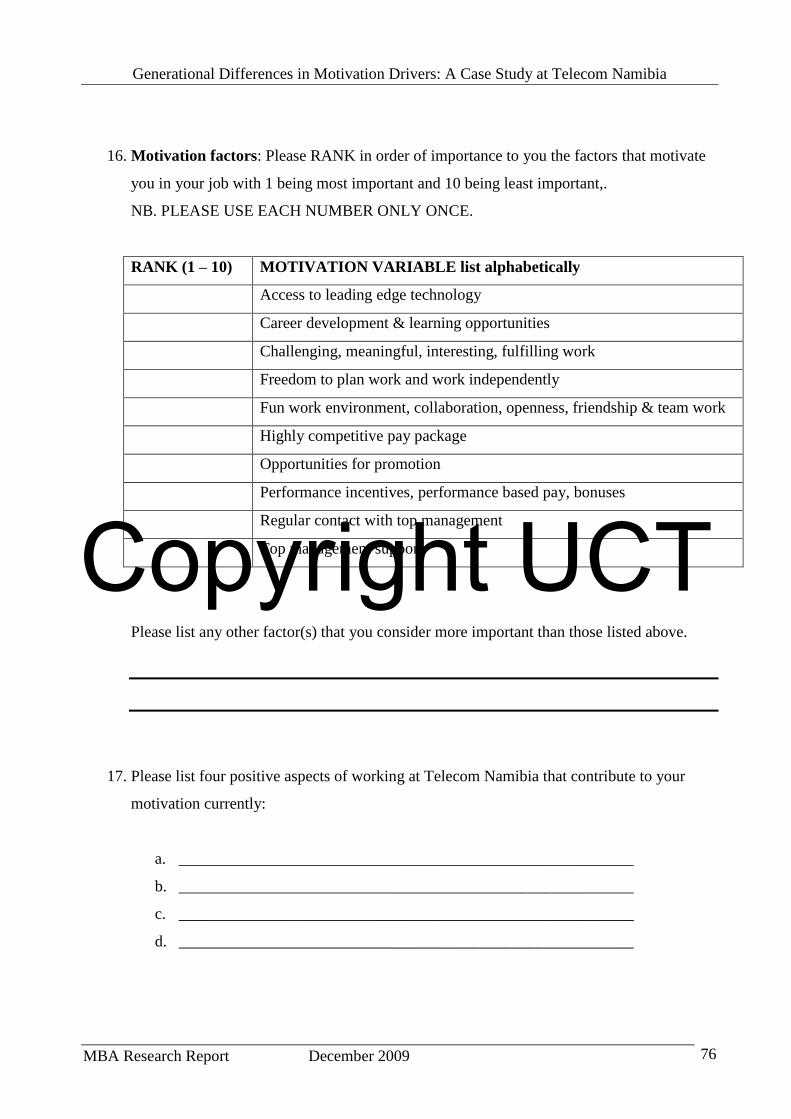
Copyright UCT
Generational Differences in Motivation Drivers: A Case Study at Telecom Namibia
MBA Research Report December 2009 76
16. Motivation factors: Please RANK in order of importance to you the factors that motivate
you in your job with 1 being most important and 10 being least important,.
NB. PLEASE USE EACH NUMBER ONLY ONCE.
RANK (1 – 10) MOTIVATION VARIABLE list alphabetically
Access to leading edge technology
Career development & learning opportunities
Challenging, meaningful, interesting, fulfilling work
Freedom to plan work and work independently
Fun work environment, collaboration, openness, friendship & team work
Highly competitive pay package
Opportunities for promotion
Performance incentives, performance based pay, bonuses
Regular contact with top management
Top management support
Please list any other factor(s) that you consider more important than those listed above.
17. Please list four positive aspects of working at Telecom Namibia that contribute to your
motivation currently:
a. _________________________________________________________
b. _________________________________________________________
c. _________________________________________________________
d. _________________________________________________________
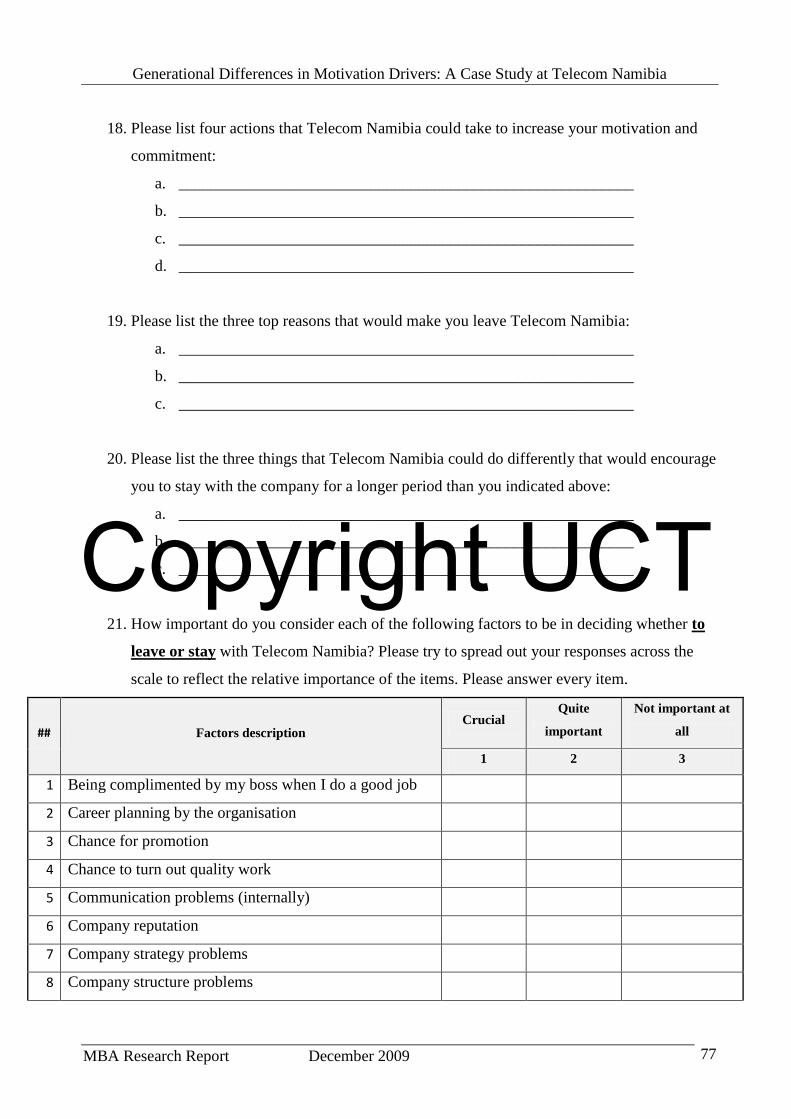
Copyright UCT
Generational Differences in Motivation Drivers: A Case Study at Telecom Namibia
MBA Research Report December 2009 77
18. Please list four actions that Telecom Namibia could take to increase your motivation and
commitment:
a. _________________________________________________________
b. _________________________________________________________
c. _________________________________________________________
d. _________________________________________________________
19. Please list the three top reasons that would make you leave Telecom Namibia:
a. _________________________________________________________
b. _________________________________________________________
c. _________________________________________________________
20. Please list the three things that Telecom Namibia could do differently that would encourage
you to stay with the company for a longer period than you indicated above:
a. _________________________________________________________
b. _________________________________________________________
c. _________________________________________________________
21. How important do you consider each of the following factors to be in deciding whether to
leave or stay with Telecom Namibia? Please try to spread out your responses across the
scale to reflect the relative importance of the items. Please answer every item.
## Factors description Crucial
Quite
important
Not important at
all
1 2 3
1 Being complimented by my boss when I do a good job
2 Career planning by the organisation
3 Chance for promotion
4 Chance to turn out quality work
5 Communication problems (internally)
6 Company reputation
7 Company strategy problems
8 Company structure problems
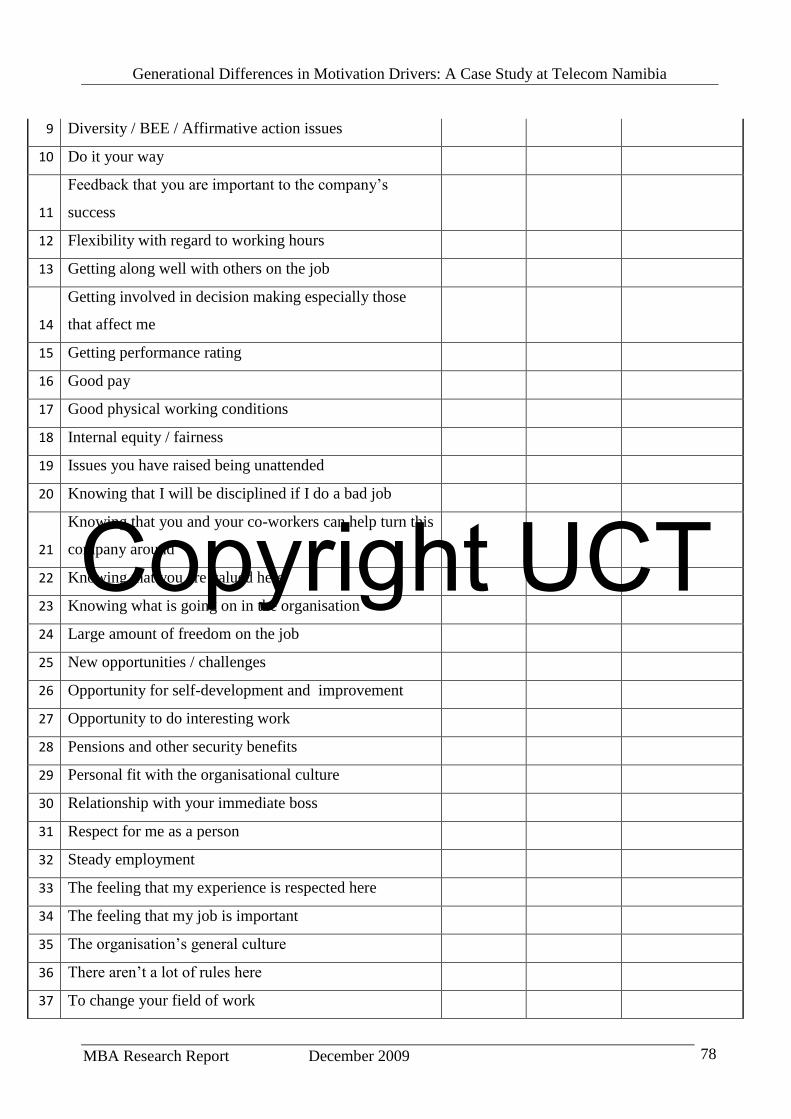
Copyright UCT
Generational Differences in Motivation Drivers: A Case Study at Telecom Namibia
MBA Research Report December 2009 78
9 Diversity / BEE / Affirmative action issues
10 Do it your way
11
Feedback that you are important to the company’s
success
12 Flexibility with regard to working hours
13 Getting along well with others on the job
14
Getting involved in decision making especially those
that affect me
15 Getting performance rating
16 Good pay
17 Good physical working conditions
18 Internal equity / fairness
19 Issues you have raised being unattended
20 Knowing that I will be disciplined if I do a bad job
21
Knowing that you and your co-workers can help turn this
company around
22 Knowing that you are valued here
23 Knowing what is going on in the organisation
24 Large amount of freedom on the job
25 New opportunities / challenges
26 Opportunity for self-development and improvement
27 Opportunity to do interesting work
28 Pensions and other security benefits
29 Personal fit with the organisational culture
30 Relationship with your immediate boss
31 Respect for me as a person
32 Steady employment
33 The feeling that my experience is respected here
34 The feeling that my job is important
35 The organisation’s general culture
36 There aren’t a lot of rules here
37 To change your field of work
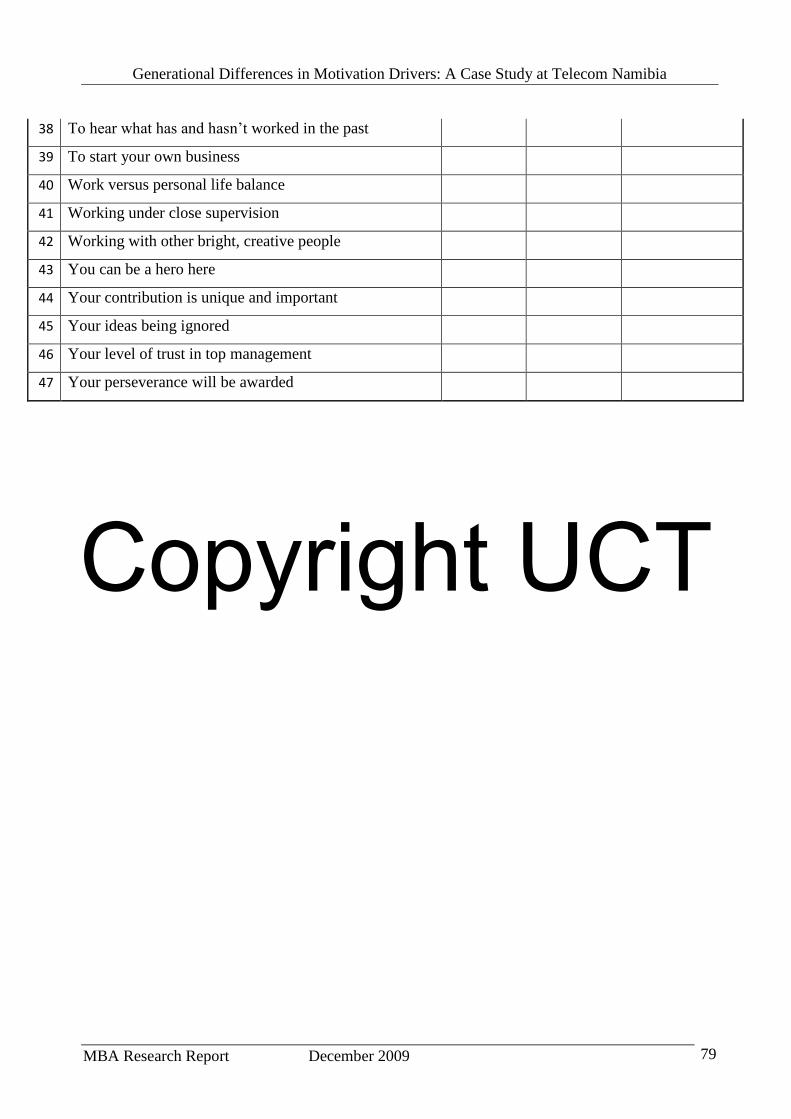
Copyright UCT
Generational Differences in Motivation Drivers: A Case Study at Telecom Namibia
MBA Research Report December 2009 79
38 To hear what has and hasn’t worked in the past
39 To start your own business
40 Work versus personal life balance
41 Working under close supervision
42 Working with other bright, creative people
43 You can be a hero here
44 Your contribution is unique and important
45 Your ideas being ignored
46 Your level of trust in top management
47 Your perseverance will be awarded
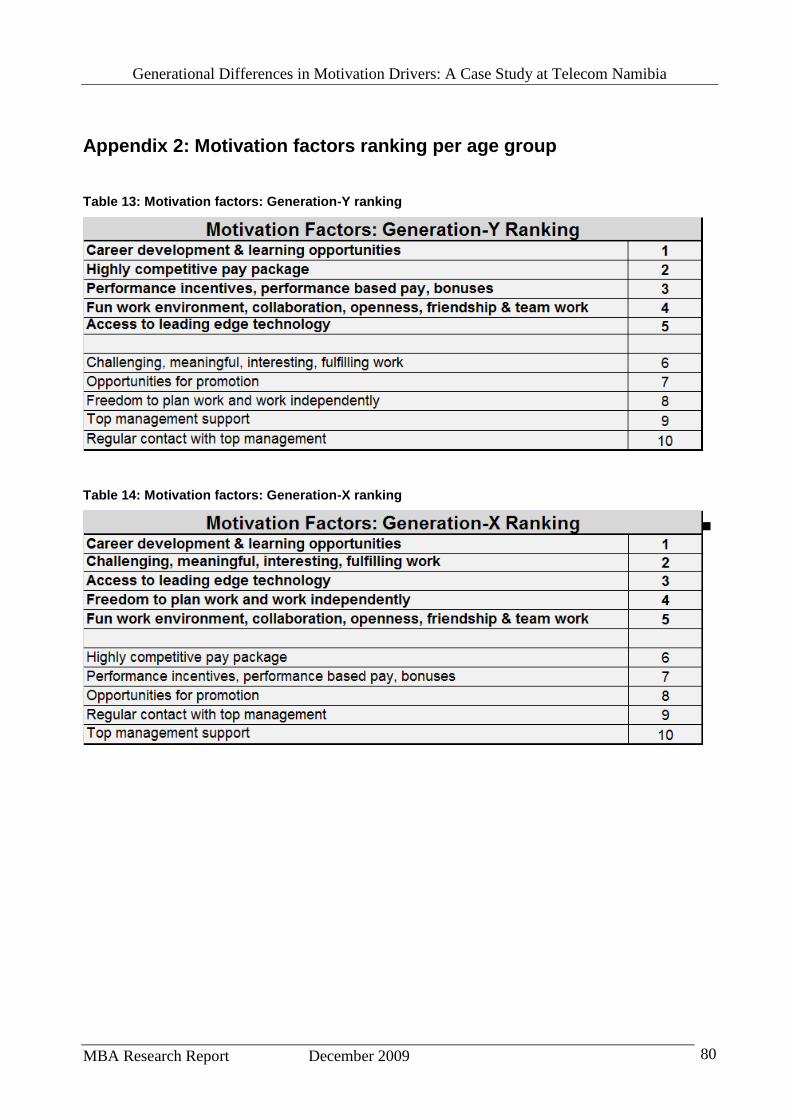
Copyright UCT
Generational Differences in Motivation Drivers: A Case Study at Telecom Namibia
MBA Research Report December 2009 80
Appendix 2: Motivation factors ranking per age group
Table 13: Motivation factors: Generation-Y ranking
Table 14: Motivation factors: Generation-X ranking
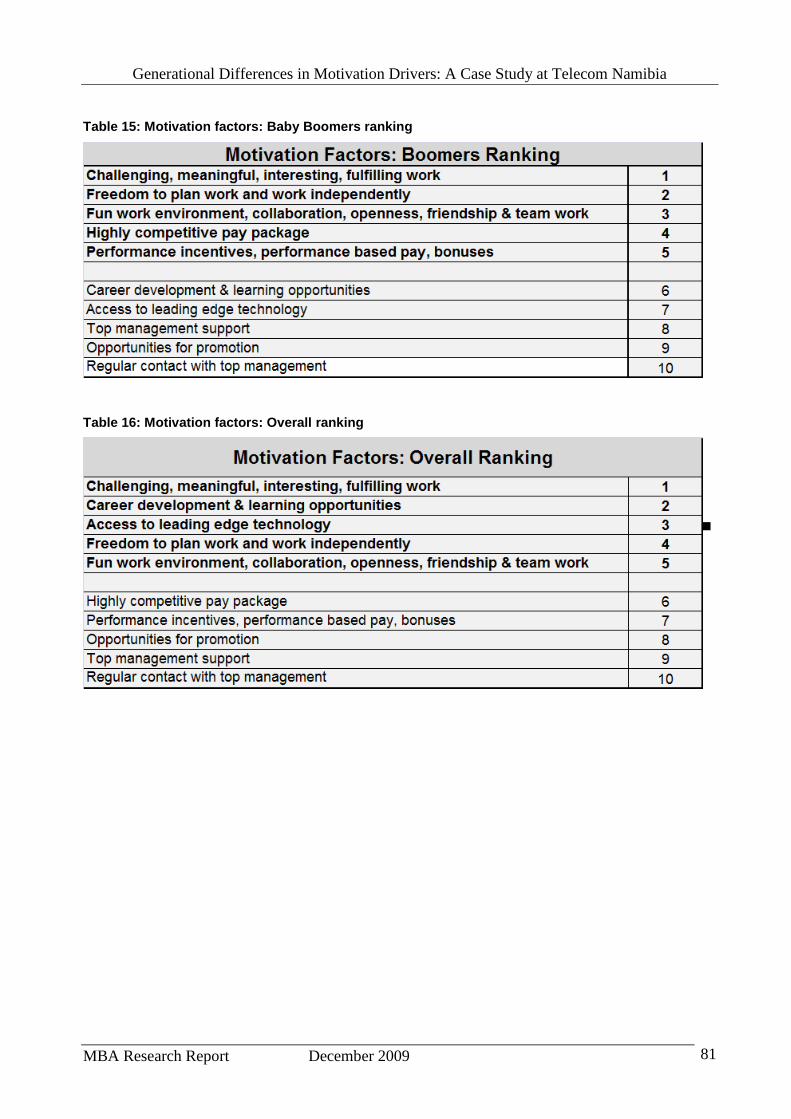
Copyright UCT
Generational Differences in Motivation Drivers: A Case Study at Telecom Namibia
MBA Research Report December 2009 81
Table 15: Motivation factors: Baby Boomers ranking
Table 16: Motivation factors: Overall ranking

Copyright UCT
Generational Differences in Motivation Drivers: A Case Study at Telecom Namibia
MBA Research Report December 2009 82
Table 17: F-Test and T-Test analysis for the motivation factors
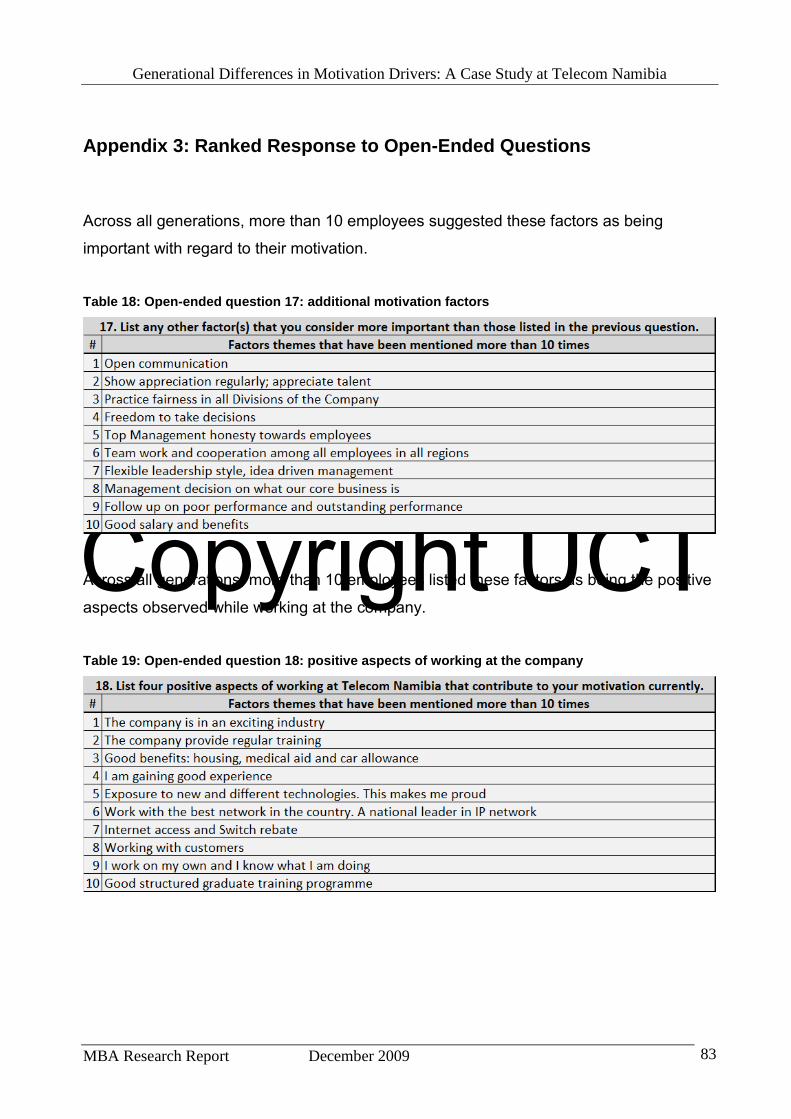
Copyright UCT
Generational Differences in Motivation Drivers: A Case Study at Telecom Namibia
MBA Research Report December 2009 83
Appendix 3: Ranked Response to Open-Ended Questions
Across all generations, more than 10 employees suggested these factors as being
important with regard to their motivation.
Table 18: Open-ended question 17: additional motivation factors
Across all generations, more than 10 employees listed these factors as being the positive
aspects observed while working at the company.
Table 19: Open-ended question 18: positive aspects of working at the company
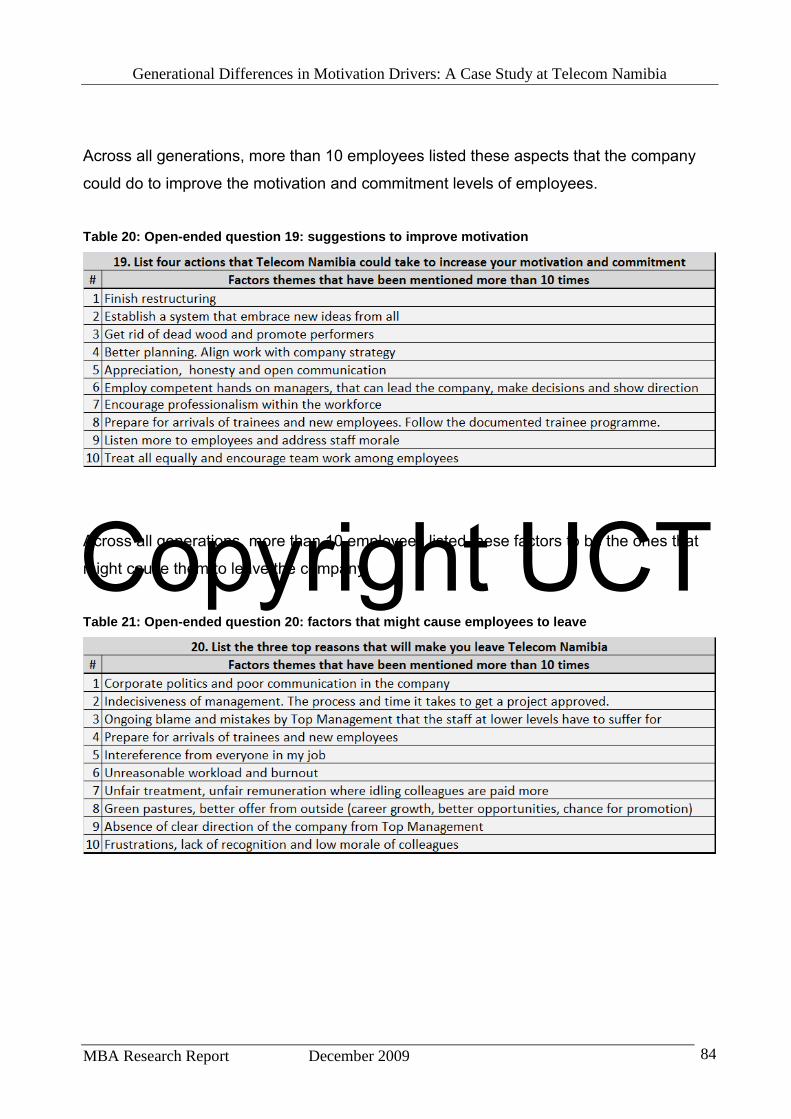
Copyright UCT
Generational Differences in Motivation Drivers: A Case Study at Telecom Namibia
MBA Research Report December 2009 84
Across all generations, more than 10 employees listed these aspects that the company
could do to improve the motivation and commitment levels of employees.
Table 20: Open-ended question 19: suggestions to improve motivation
Across all generations, more than 10 employees listed these factors to be the ones that
might cause them to leave the company.
Table 21: Open-ended question 20: factors that might cause employees to leave
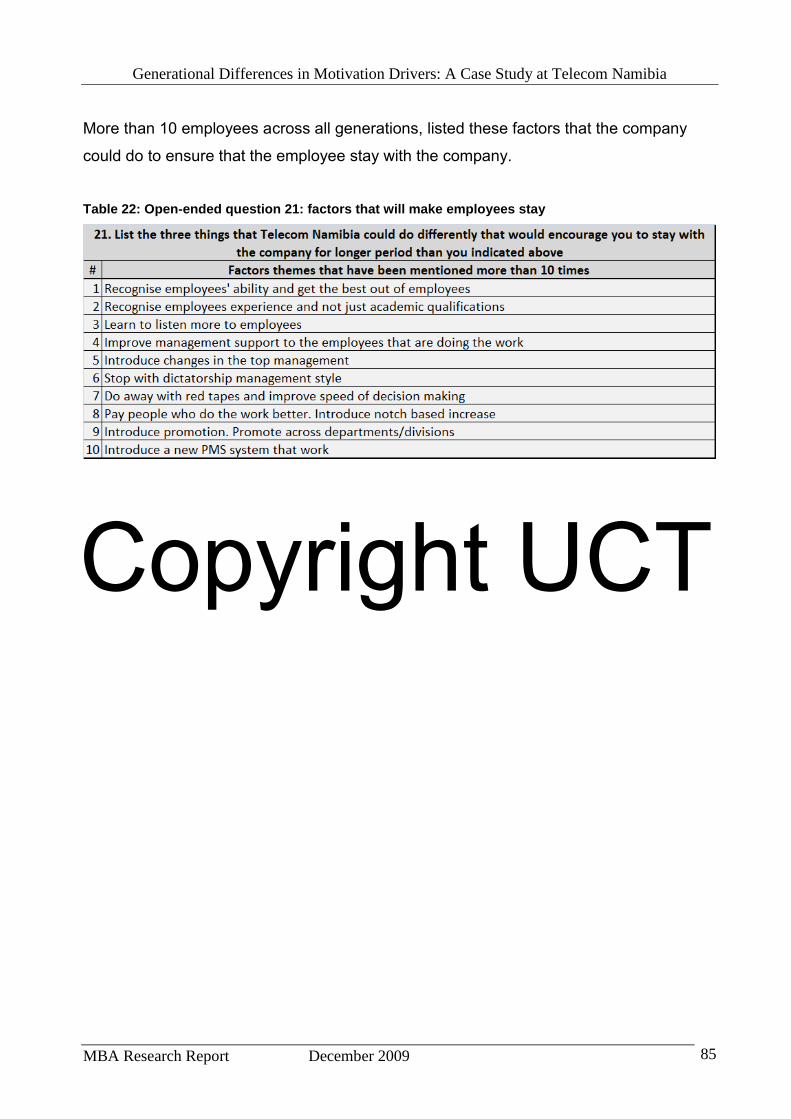
Copyright UCT
Generational Differences in Motivation Drivers: A Case Study at Telecom Namibia
MBA Research Report December 2009 85
More than 10 employees across all generations, listed these factors that the company
could do to ensure that the employee stay with the company.
Table 22: Open-ended question 21: factors that will make employees stay

Copyright UCT
Generational Differences in Motivation Drivers: A Case Study at Telecom Namibia
MBA Research Report December 2009 86
Appendix 4: Generic Factors for Decisions to Leave the Company
Table 23: Overall “Crucial” ranking by all age groups
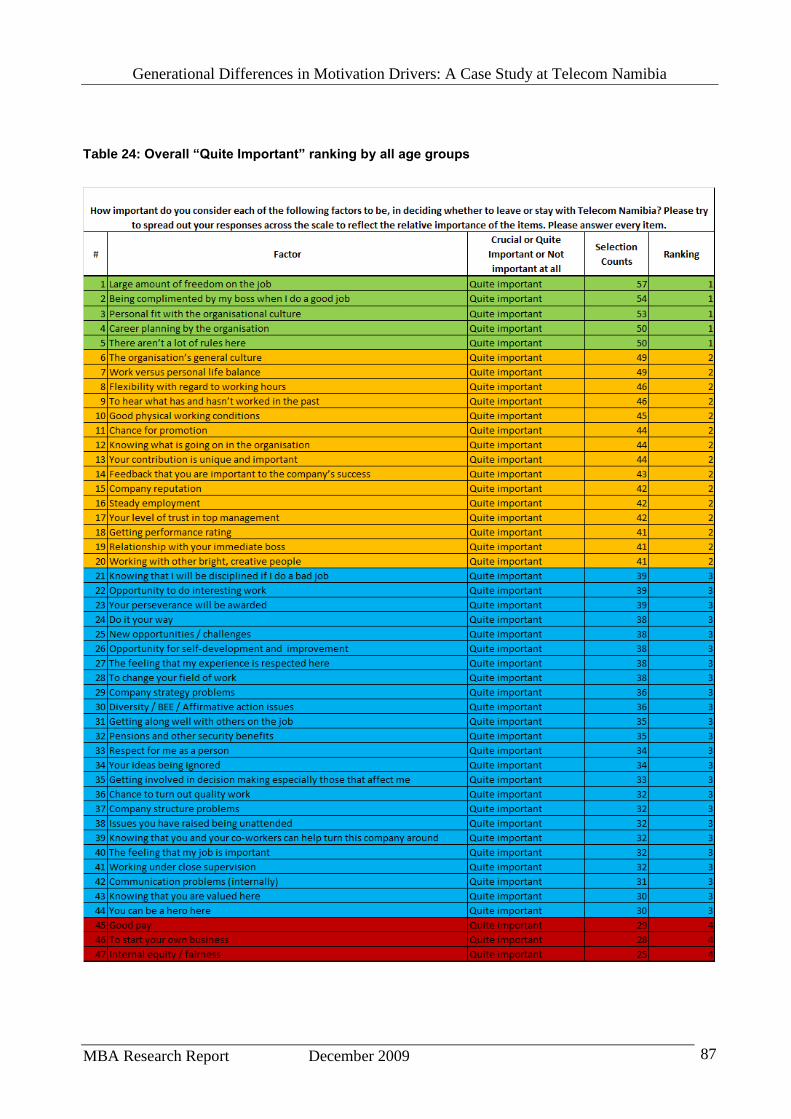
Copyright UCT
Generational Differences in Motivation Drivers: A Case Study at Telecom Namibia
MBA Research Report December 2009 87
Table 24: Overall “Quite Important” ranking by all age groups
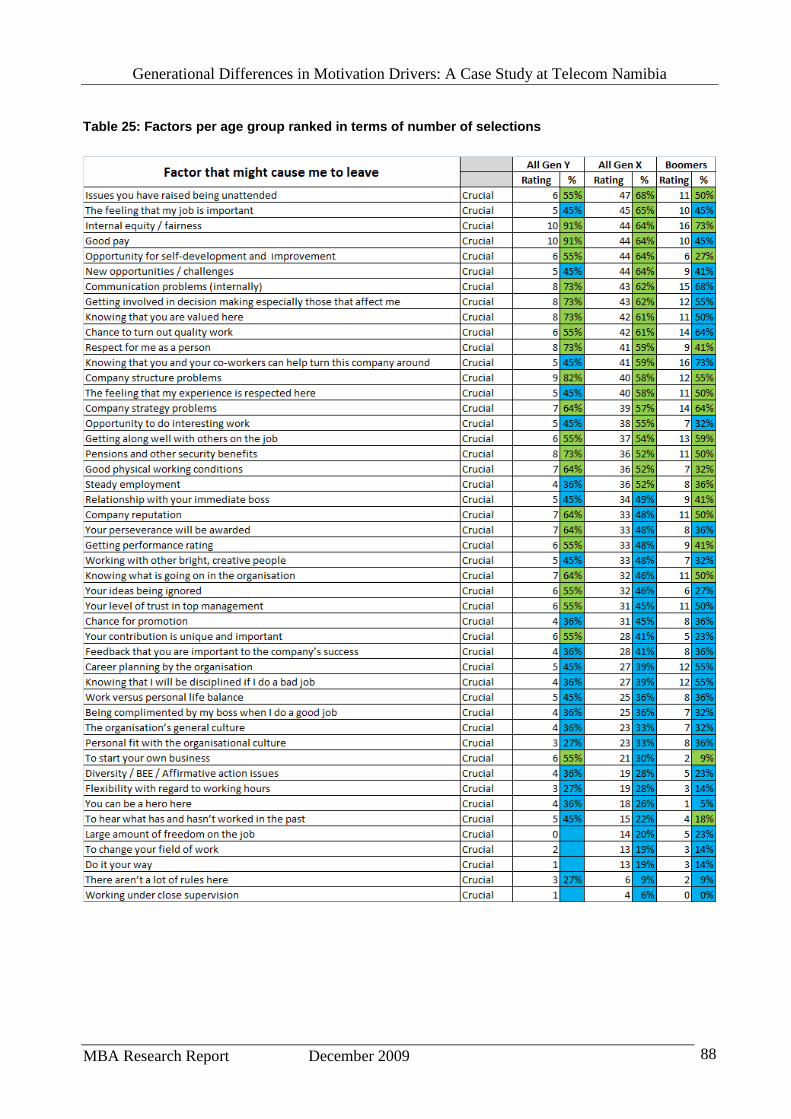
Copyright UCT
Generational Differences in Motivation Drivers: A Case Study at Telecom Namibia
MBA Research Report December 2009 88
Table 25: Factors per age group ranked in terms of number of selections
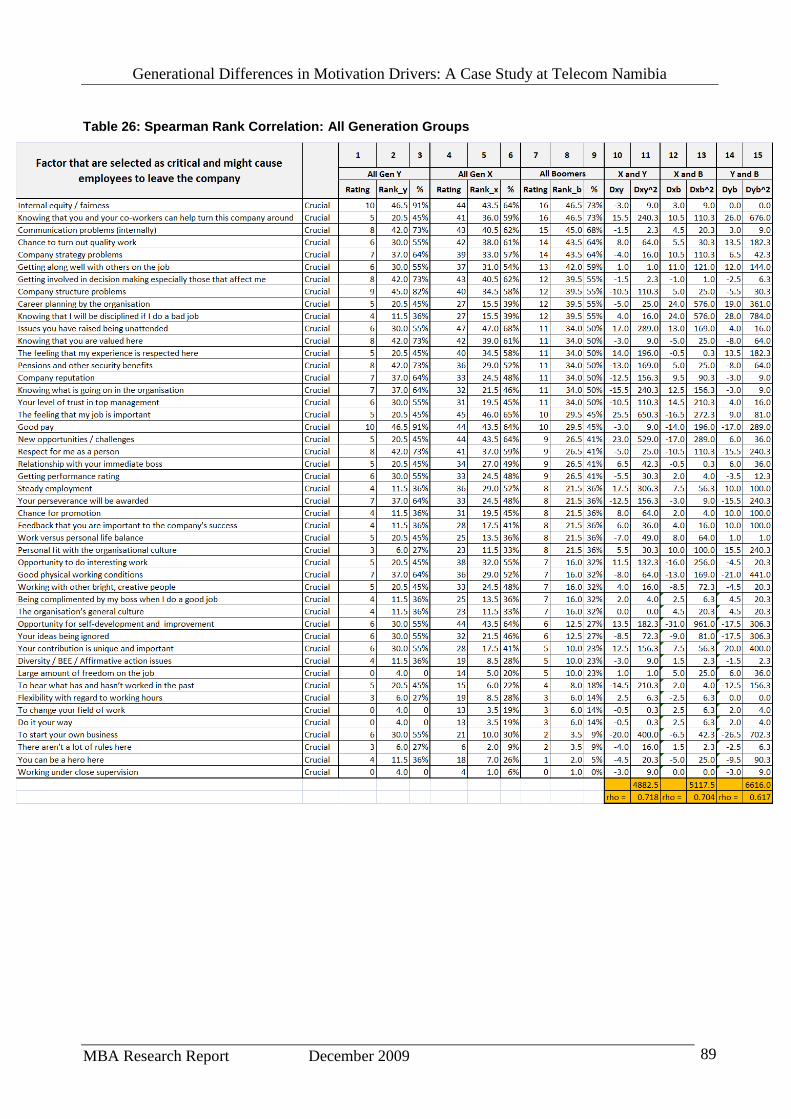
Copyright UCT
Generational Differences in Motivation Drivers: A Case Study at Telecom Namibia
MBA Research Report December 2009 89
Table 26: Spearman Rank Correlation: All Generation Groups