Embed Size (px)
Citation preview
1 3
Theor Appl Genet (2014) 127:535–547DOI 10.1007/s00122-013-2232-4
ORIGINAL PAPER
Genetic analyses of bolting in bulb onion (Allium cepa L.)
Samantha Baldwin · Roopashree Revanna · Meeghan Pither‑Joyce · Martin Shaw · Kathryn Wright · Susan Thomson · Leire Moya · Robyn Lee · Richard Macknight · John McCallum
Received: 27 May 2013 / Accepted: 31 October 2013 / Published online: 19 November 2013 © Springer-Verlag Berlin Heidelberg 2014
purifying selection. Significant population differentia-tion was observed only in AcFT2 and AcSOC1. Selective genotyping in a large ‘Nasik Red × CUDH2150’ F2 family revealed genome regions on chromosomes 1, 3 and 6 asso-ciated (LOD > 3) with bolting. Validation genotyping of two F2 families grown in two environments confirmed that a QTL on chromosome 1, which we designate AcBlt1, con-sistently conditions bolting susceptibility in this cross. The chromosome 3 region, which coincides with a functionally characterised acid invertase, was not associated with bolt-ing in other environments, but showed significant associa-tion with bulb sucrose content in this and other mapping pedigrees. These putative QTL and candidate genes were placed on the onion map, enabling future comparative stud-ies of adaptive traits.
AbbreviationsSD Short-dayLD Long-dayDH Doubled-haploidCAPS Cleaved amplified polymorphic sequenceAMAL Alien monosomic addition line
Introduction
Onion and shallot (Allium cepa L.) are staple functional foods central to most diets, grown from tropical regions to high latitudes. Economic production of dry bulb onion and shallot requires cultivars to be biennial. They must be adapted to local photoperiod and temperature such that a sufficiently large bulb is formed in the growing season without premature transition to flowering (‘bolt-ing’; Kamenetsky and Rabinowitch 2002). Bulb onions are broadly classified into ‘short-day’ (SD) and ‘long-day’
Abstract Key message We present the first evidence for a QTL conditioning an adaptive trait in bulb onion, and the first linkage and population genetics analyses of can‑didate genes involved in photoperiod and vernalization physiology.Abstract Economic production of bulb onion (Allium cepa L.) requires adaptation to photoperiod and tempera-ture such that a bulb is formed in the first year and a flow-ering umbel in the second. ‘Bolting’, or premature flower-ing before bulb maturation, is an undesirable trait strongly selected against by breeders during adaptation of germ-plasm. To identify genome regions associated with adap-tive traits we conducted linkage mapping and population genetic analyses of candidate genes, and QTL analysis of bolting using a low-density linkage map. We performed tagged amplicon sequencing of ten candidate genes, includ-ing the FT-like gene family, in eight diverse populations to identify polymorphisms and seek evidence of differen-tiation. Low nucleotide diversity and negative estimates of Tajima’s D were observed for most genes, consistent with
Communicated by A. E. Melchinger.
Electronic supplementary material The online version of this article (doi:10.1007/s00122-013-2232-4) contains supplementary material, which is available to authorized users.
S. Baldwin · R. Revanna · M. Pither-Joyce · M. Shaw · K. Wright · S. Thomson · L. Moya · J. McCallum (*) New Zealand Institute for Plant and Food Research, Private Bag, 4704 Christchurch, New Zealande-mail: [email protected]
R. Lee · R. Macknight Biochemistry Department, University of Otago, Dunedin, New Zealand
536 Theor Appl Genet (2014) 127:535–547
1 3
(LD) types depending on the length of day required to ini-tiate bulb formation. In terms of flowering adaptation, all onions produce flowers in the spring. True shallot of spe-cies A. cepa is a horticultural type displaying a partial to complete tendency toward asexual reproduction. It is pre-sumed that the shallot phenotype has been selected for practicality of production in tropical regions where flori-genesis is compromised by want of vernalization and fun-gal disease pressure on floral structures (Rabinowitch and Kamenetsky 2002).
There is an extensive literature concerning the physi-ology of flowering in onion, reviewed most recently by Brewster (2008). Once onion plants reach a critical weight or leaf number, they can be induced to initiate inflores-cences by exposure to low temperatures. The critical size and temperature requirements for this vernalization exhibit wide genetic variation. Depending on the conditions and genetic background, there may be ‘competition’ between bulb and inflorescence development (Van Kampen 1970), such that inflorescence development may be suppressed. It has been demonstrated that a vernalization period is all that is required to initiate flowering from onion bulbs, but that temperature and photoperiod affect the time taken for even-tual inflorescence appearance and floret opening (Khokhar et al. 2007). De-vernalization in onion is commercially exploited by high-temperature (>25 °C) treatment of cold-stored onion ‘sets’ prior to transplanting in springtime.
The stringent requirement for adaptation of onion culti-vars to environment for producing marketable crop places major constraints on breeding and exploitation of germ-plasm. A deeper understanding of the genetics of tempera-ture and photoperiod adaptation could inform strategies for genetic resource exploitation and development, and provide insights into domestication and dissemination of onion over the past millennia. Most importantly, functional markers to major genes conditioning adaptation could enable more efficient introgression of desirable traits such as disease resistance from wide crosses, as well as enabling seed lot quality control.
Physiological and genetic studies have implicated numerous genes and pathways in control of flowering in Arabidopsis and other species (Matsoukas et al. 2012). Components of the photoperiodic floral induction pathway are conserved between dicots and monocots (e.g. cereals such as rice and barley): for example, the circadian clock is needed to measure day length and downstream components such as Constans (CO; known as Heading date 1/HD1 in rice) play important roles in the photoperiodic flowering of Arabidopsis and rice (Tsuji et al. 2011). The vernaliza-tion pathway is less well-conserved and is believed to have evolved separately in grasses and dicots (Greenup et al. 2009). The photoperiodic and vernalization pathways con-verge on a small number of floral pathway integrators in all
plants, including Suppressor of overexpression of constans 1 (SOC1) (Hepworth et al. 2002), and Flowering locus T (FT) genes (HD3a and Rice FT-LIKE1/RFT1 in rice and FT1 in wheat and barley).
Although the extensive genetic and physiological studies of grasses are often assumed to generalise to all monocots, studies of adaptive trait genetics in other monocot clades are very limited. Onion is in the order Asparagales, which diverged 122 m years ago from the monocot grasses (Jans-sen and Bremer 2004). Therefore, the genetic mechanisms controlling cereal flowering may differ in the Asparagales. Although physiological and genomic studies of flowering are very limited in Asparagales, several recent studies have described transcriptional and functional studies in orchid genera (Chang et al. 2011; Ding et al. 2013; Liang et al. 2012; Xiang et al. 2012). In onion, a period of vernaliza-tion was found to be all that was required to initiate flower-ing from onion bulbs, but that temperature and photoperiod affected the time taken for eventual inflorescence appear-ance and floret opening (Khokhar et al. 2007). Taylor et al. (2010) hypothesised that components of the photoperiodic pathway might be involved in the induction of onion bul-bing. While they found that circadian clock genes appear to have a conserved function based on their expression, whether they are involved in onion bulbing was not estab-lished. We recently reported functional characterisation of the FT-like gene family in onion (Lee et al. 2013), iden-tifying three members with distinctive expression patterns associated with bulbing and floral initiation. This work indicated that two antagonistically acting FT-like genes (AcFT1 and AcFT4) are involved in the photoperiodic induction of onion bulbing, while another FT (AcFT2) is involved in the vernalization responsive initiation of flow-ering (Lee et al. 2013).
Genetic analysis in numerous species has frequently revealed associations between allelic variation in conserved components of these pathways and integrators with flower-ing time. Natural variation in FT-like genes has been asso-ciated with flowering time in dicots such as sunflower and Arabidopsis (Blackman et al. 2010; Laurie et al. 2011), and monocot grasses such as ryegrass (Skøt et al. 2011) and rice (Kojima et al. 2002). Similar associations have been reported for components of the well-conserved photoperiodic path-way such as CO/HD1 in rice (Takahashi et al. 2009).
In this study, we have taken a genetic approach as the first step in understanding the genetic architecture of pre-mature bolting (flowering) in onion. The only reported genetic analysis of onion bolting is that of Hyun et al. (2009) who examined an F2 family segregating for time to flowering using proteomic methods. This revealed that in the family examined, late flowering segregated as a dominant character, and although they identified prot-eomic differences among the parents they did not examine
537Theor Appl Genet (2014) 127:535–547
1 3
segregation of these with bolting phenotype. Physiologi-cal and genomic studies in onion have been complicated by a lack of freely available reference lines, combined with very limited genomics resources. Recent transcrip-tome sequencing and mapping studies based on homozy-gous doubled haploid (DH) lines and RNASEQ have greatly expanded scope for reproducible and comparative approaches (Baldwin et al. 2012b; Duangjit et al. 2013) as well as enabling global searches for candidate genes. We recently functionally characterised members of the FT-like gene family in onion (Lee et al. 2013). In the current study, we sought to place these and other candidate genes on the onion genetic map and to search for QTL condition-ing bolting in a wide onion cross (Baldwin et al. 2012b). This revealed that a QTL located on onion chromosome one plays a major role in conditioning bolting in this cross.
Materials and methods
Plant materials
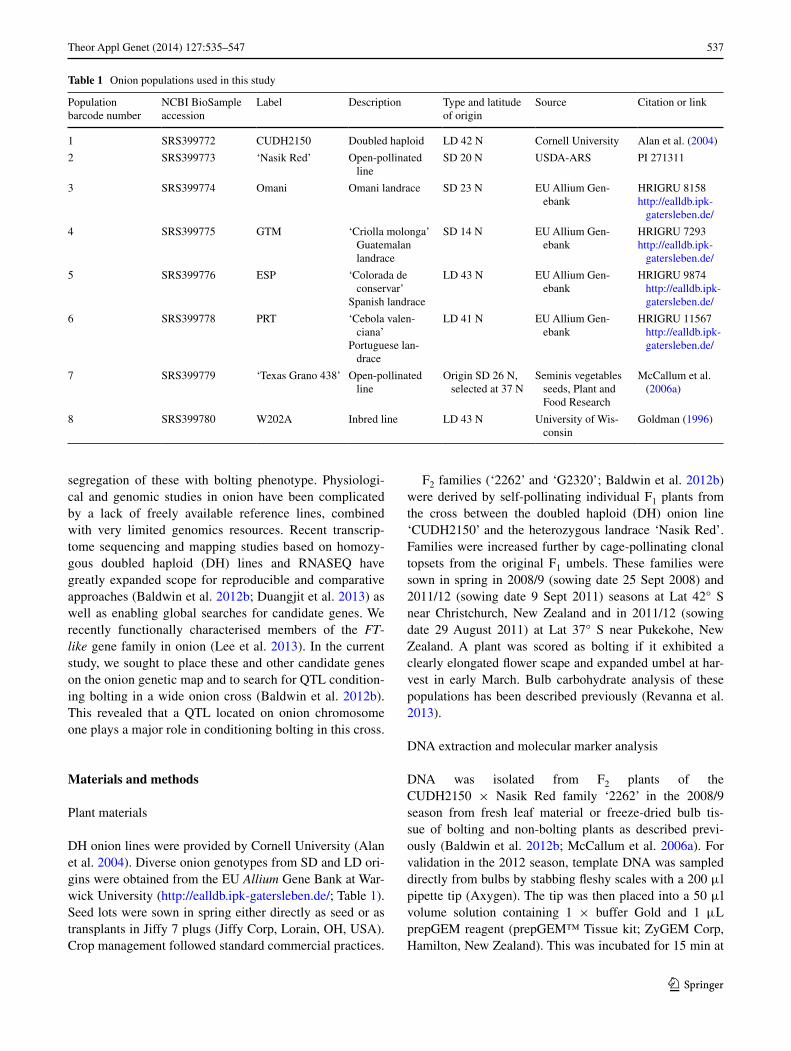
DH onion lines were provided by Cornell University (Alan et al. 2004). Diverse onion genotypes from SD and LD ori-gins were obtained from the EU Allium Gene Bank at War-wick University (http://ealldb.ipk-gatersleben.de/; Table 1). Seed lots were sown in spring either directly as seed or as transplants in Jiffy 7 plugs (Jiffy Corp, Lorain, OH, USA). Crop management followed standard commercial practices.
F2 families (‘2262’ and ‘G2320’; Baldwin et al. 2012b) were derived by self-pollinating individual F1 plants from the cross between the doubled haploid (DH) onion line ‘CUDH2150’ and the heterozygous landrace ‘Nasik Red’. Families were increased further by cage-pollinating clonal topsets from the original F1 umbels. These families were sown in spring in 2008/9 (sowing date 25 Sept 2008) and 2011/12 (sowing date 9 Sept 2011) seasons at Lat 42° S near Christchurch, New Zealand and in 2011/12 (sowing date 29 August 2011) at Lat 37° S near Pukekohe, New Zealand. A plant was scored as bolting if it exhibited a clearly elongated flower scape and expanded umbel at har-vest in early March. Bulb carbohydrate analysis of these populations has been described previously (Revanna et al. 2013).
DNA extraction and molecular marker analysis
DNA was isolated from F2 plants of the CUDH2150 × Nasik Red family ‘2262’ in the 2008/9 season from fresh leaf material or freeze-dried bulb tis-sue of bolting and non-bolting plants as described previ-ously (Baldwin et al. 2012b; McCallum et al. 2006a). For validation in the 2012 season, template DNA was sampled directly from bulbs by stabbing fleshy scales with a 200 μl pipette tip (Axygen). The tip was then placed into a 50 μl volume solution containing 1 × buffer Gold and 1 μL prepGEM reagent (prepGEM™ Tissue kit; ZyGEM Corp, Hamilton, New Zealand). This was incubated for 15 min at
Table 1 Onion populations used in this study
Population barcode number
NCBI BioSample accession
Label Description Type and latitude of origin
Source Citation or link
1 SRS399772 CUDH2150 Doubled haploid LD 42 N Cornell University Alan et al. (2004)
2 SRS399773 ‘Nasik Red’ Open-pollinated line
SD 20 N USDA-ARS PI 271311
3 SRS399774 Omani Omani landrace SD 23 N EU Allium Gen-ebank
HRIGRU 8158http://ealldb.ipk-
gatersleben.de/
4 SRS399775 GTM ‘Criolla molonga’ Guatemalan landrace
SD 14 N EU Allium Gen-ebank
HRIGRU 7293http://ealldb.ipk-
gatersleben.de/
5 SRS399776 ESP ‘Colorada de conservar’
Spanish landrace
LD 43 N EU Allium Gen-ebank
HRIGRU 9874 http://ealldb.ipk-gatersleben.de/
6 SRS399778 PRT ‘Cebola valen-ciana’
Portuguese lan-drace
LD 41 N EU Allium Gen-ebank
HRIGRU 11567 http://ealldb.ipk-gatersleben.de/
7 SRS399779 ‘Texas Grano 438’ Open-pollinated line
Origin SD 26 N, selected at 37 N
Seminis vegetables seeds, Plant and Food Research
McCallum et al. (2006a)
8 SRS399780 W202A Inbred line LD 43 N University of Wis-consin
Goldman (1996)
538 Theor Appl Genet (2014) 127:535–547
1 3
75 °C with a 5 min hold at 95 °C. An aliquot of the solu-tion was then diluted in half with TE buffer (10 mM Tris and 0.1 mM EDTA) and the remainder stored at −20 °C. SSR, CAPS and HRM marker analyses were carried out as described previously (Baldwin et al. 2012b) but the HRM amplification conditions were modified to include a touchdown PCR. The modified conditions were: 95 °C for 15 min followed by seven cycles of 94 °C for 30 s, 62 °C for 30 s (reducing by 1 °C per cycle), and 72 °C for 15 s. Another 45 cycles were carried out at 94 °C for 30 s, 55 °C for 30 s and 72 °C for 15 s. Then, a final hold temperature of 25 °C for 2 min.
Parallel-tagged sequencing
Template genomic DNA was prepared from the homozy-gous doubled-haploid reference ‘CUDH2150’ and from pooled DNA bulks of at least 25 plants from seven diverse populations adapted to short- to long-day environments (Table 1). Long-range PCR was performed according to the Expand Long Template PCR System (Roche Applied Sci-ence) protocol with Expand Long Template buffer 1 and primers (Table 2). Genomic DNA (100 ng) was amplified in a volume of 50 μl by touchdown PCR using the follow-ing conditions: 94 °C, 2 min, followed by 8 cycles of 94 °C for 10 s, 65 °C for 30 s (reducing 1 °C per cycle), and 68 °C for 2 min. Another 40 cycles were carried out at 94 °C for 15 s, 57 °C for 30 s and 68 °C for 3 min (increasing by 20 s per cycle), with a final extension at 68 °C for 7 min. PCR products were purified with AMPure XP (Agencourt), and then subjected to Fragmentase treatment to generate sizes in the range of 300–600 bp according to the NEBNext dsDNA Fragmentase (NEB) protocol. The fragmented PCR products were purified as previously, and blunt end repair, adapter ligation and fill-in were carried out according to Meyer et al. (2007) using NEBNext End Repair Module (NEB) and bar-coding adapters from Meyer et al. (2008). Fragmented PCR products were barcoded by genotype (Table 1) then quantified on a Victor3 plate reader (Perkin
Elmer) with the Quant-iT™ PicoGreen® dsDNA Assay Kit (Invitrogen). Pooling, dephosphorylation and restriction digestion were carried out according to Meyer et al. (2008). Normalised tagged fragmented PCR products were pooled by amplicon into two libraries for 454 sequencing on sepa-rate 1/16 regions of a GS-FLX plate.
Sequence reads were separated into populations based on barcodes using the sff_extract tool (https://github.com/JoseBlanca/seq_crumbs.git). A reference assembly was gen-erated for the CUDH2150 homozygous control using New-bler 2.7 (Roche) with default settings. Reference assem-blies from CUDH2150 were submitted to Genbank as Accessions KC677631–KC677640 (Table 3). Gene models were obtained by mapping reference cDNA sequences onto these using gmap (Wu and Watanabe 2005). Experimental data was deposited as NCBI SRA study SRP018027.
Reads from the seven heterozygous populations were mapped onto the CUDH2150 assemblies using BWA_SW (Li and Durbin 2010; http://www.ncbi.nlm.nih.gov/pubmed/19451168). SNPs were called using samtools mpileup (Li et al. 2009), patterns of nucleo-tide diversity were determined using PoPoolation (Kofler et al. 2011a) and allele frequencies were compared among genes and populations using PoPoolation2 (Kofler et al. 2011b). A reproducible workflow containing scripts and all settings for read mapping, analysis and visualisation can be accessed at GitHub in the repository https://github.com/cfljam/onion_PTS_workflow. Variant effects were determined using snpEff (Cingolani et al. 2012). Primer sets for indel, HRM or CAPS markers were designed to variants of interest as described previously (Baldwin et al. 2012b).
Candidate gene mapping
Candidate genes that were not segregating in the F2 popu-lation ‘2262’ were tested on the ‘W202A × Texas Grano 438’ mapping population (McCallum et al. 2006a, b) or on sets of A. fistulosum–A. cepa alien monosomic addition
Table 2 Primer pairs used for amplicon re-sequencing of flowering candidate genes
Primer set Forward primer Reverse primer
ACR036 GCGAAAACTGAAGGACTGAAA TTAAAGGAAGGTTCGCCAAA
ACR043 CATTTTCTGAGACGCATTGCT CGGCAAAATTTGAGAGGAAA
ACR045 GGCGTATACCTCTAAGGGTTATGT GAGAAACAATCGAACTAAACAGCA
ACR047 TCATTTTGTTTCTTCTGCTTCC CCCATCATCTCCATTTGCTT
ACR048 CATGGCAAGAGAAAGTGACC TCATCATCAACTTCAACCCAAA
ACR049 ACAATGTTGCTGCTGCTTGA GGATGGTGACTGATATACCAGAAG
ACR051 AGGGGCGTTATTTGTGAGTA CCCTGGTGCATACACAGTTT
ACR054 GCAAAAGGCGGTTGTACATT AAGGTTGCTCATCCAGTGCT
ACR055 TTGTGATTGTCCGAAGTAGCC TCCGCAGTTTCATTCTTCAA
ACR056 GCAGAGCAGACACAGCAAAG CCACATGCTAGATTTCGATCC
539Theor Appl Genet (2014) 127:535–547
1 3
lines (AMALs) developed by Shigyo and colleagues (1996). Linkage maps were produced using JoinMap v4 (Van Ooijen 2006) as described previously (Baldwin et al. 2012b).
QTL analysis
A subset of 43 non-bolting and 50 bolting progeny from the F2 population ‘2262’ from season 2008/9 was tested with molecular markers for both flowering candidate
genes and random markers at regular intervals across the genetic map reported previously (Baldwin et al. 2012b) (Table 4). Single marker and interval analysis using a binary model were used to identify genome regions asso-ciated with bolting for the ‘Nasik Red × CUDH2150’ mapping populations using R/QTL (Broman et al. 2003). Significantly associated markers were then tested in 2011/12 on large samples of bolting and non-bolting progeny from populations ‘2262’ and ‘G2320’ grown at Lincoln and Pukekohe.
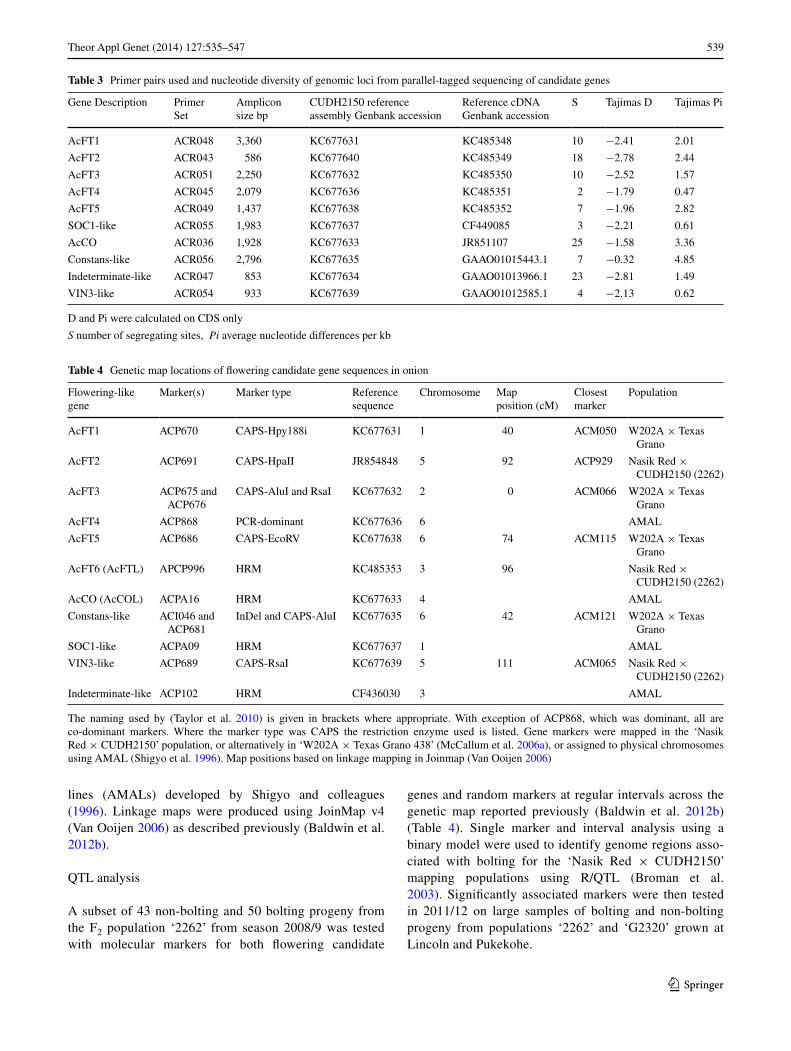
Table 3 Primer pairs used and nucleotide diversity of genomic loci from parallel-tagged sequencing of candidate genes
D and Pi were calculated on CDS only
S number of segregating sites, Pi average nucleotide differences per kb
Gene Description Primer Set
Amplicon size bp
CUDH2150 reference assembly Genbank accession
Reference cDNA Genbank accession
S Tajimas D Tajimas Pi
AcFT1 ACR048 3,360 KC677631 KC485348 10 −2.41 2.01
AcFT2 ACR043 586 KC677640 KC485349 18 −2.78 2.44
AcFT3 ACR051 2,250 KC677632 KC485350 10 −2.52 1.57
AcFT4 ACR045 2,079 KC677636 KC485351 2 −1.79 0.47
AcFT5 ACR049 1,437 KC677638 KC485352 7 −1.96 2.82
SOC1-like ACR055 1,983 KC677637 CF449085 3 −2.21 0.61
AcCO ACR036 1,928 KC677633 JR851107 25 −1.58 3.36
Constans-like ACR056 2,796 KC677635 GAAO01015443.1 7 −0.32 4.85
Indeterminate-like ACR047 853 KC677634 GAAO01013966.1 23 −2.81 1.49
VIN3-like ACR054 933 KC677639 GAAO01012585.1 4 −2.13 0.62
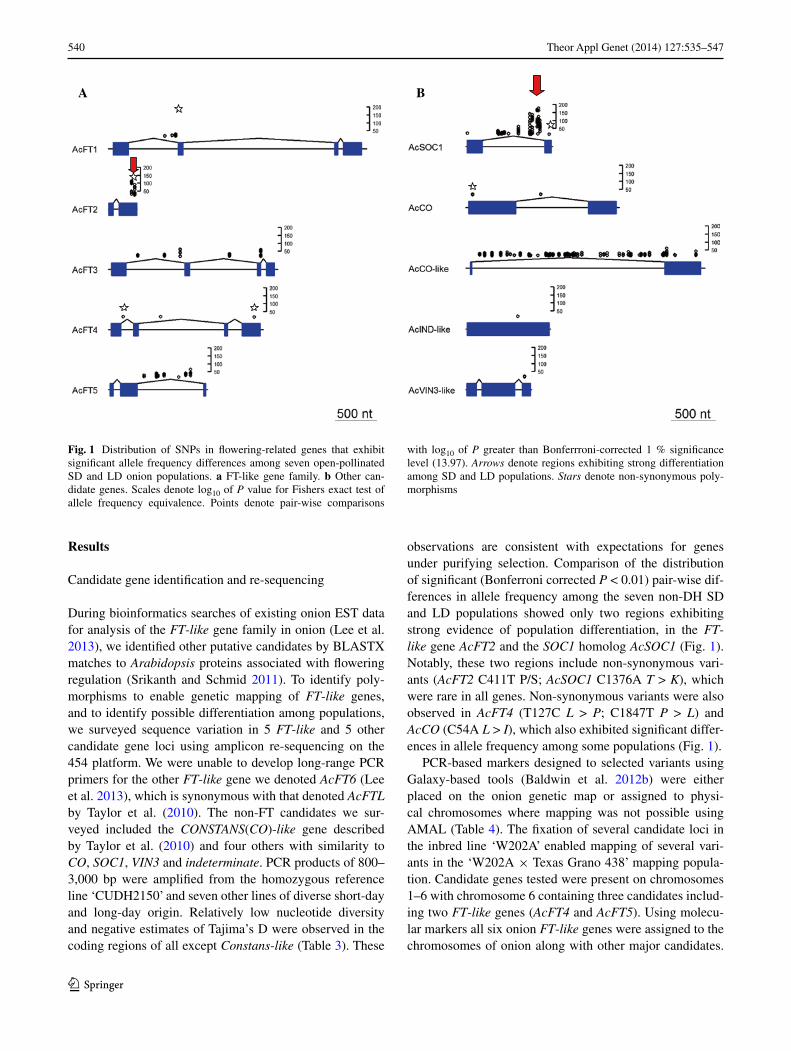
Table 4 Genetic map locations of flowering candidate gene sequences in onion
The naming used by (Taylor et al. 2010) is given in brackets where appropriate. With exception of ACP868, which was dominant, all are co-dominant markers. Where the marker type was CAPS the restriction enzyme used is listed. Gene markers were mapped in the ‘Nasik Red × CUDH2150’ population, or alternatively in ‘W202A × Texas Grano 438’ (McCallum et al. 2006a), or assigned to physical chromosomes using AMAL (Shigyo et al. 1996). Map positions based on linkage mapping in Joinmap (Van Ooijen 2006)
Flowering-like gene
Marker(s) Marker type Reference sequence
Chromosome Map position (cM)
Closest marker
Population
AcFT1 ACP670 CAPS-Hpy188i KC677631 1 40 ACM050 W202A × Texas Grano
AcFT2 ACP691 CAPS-HpaII JR854848 5 92 ACP929 Nasik Red × CUDH2150 (2262)
AcFT3 ACP675 and ACP676
CAPS-AluI and RsaI KC677632 2 0 ACM066 W202A × Texas Grano
AcFT4 ACP868 PCR-dominant KC677636 6 AMAL
AcFT5 ACP686 CAPS-EcoRV KC677638 6 74 ACM115 W202A × Texas Grano
AcFT6 (AcFTL) APCP996 HRM KC485353 3 96 Nasik Red × CUDH2150 (2262)
AcCO (AcCOL) ACPA16 HRM KC677633 4 AMAL
Constans-like ACI046 and ACP681
InDel and CAPS-AluI KC677635 6 42 ACM121 W202A × Texas Grano
SOC1-like ACPA09 HRM KC677637 1 AMAL
VIN3-like ACP689 CAPS-RsaI KC677639 5 111 ACM065 Nasik Red × CUDH2150 (2262)
Indeterminate-like ACP102 HRM CF436030 3 AMAL
540 Theor Appl Genet (2014) 127:535–547
1 3
Results
Candidate gene identification and re-sequencing
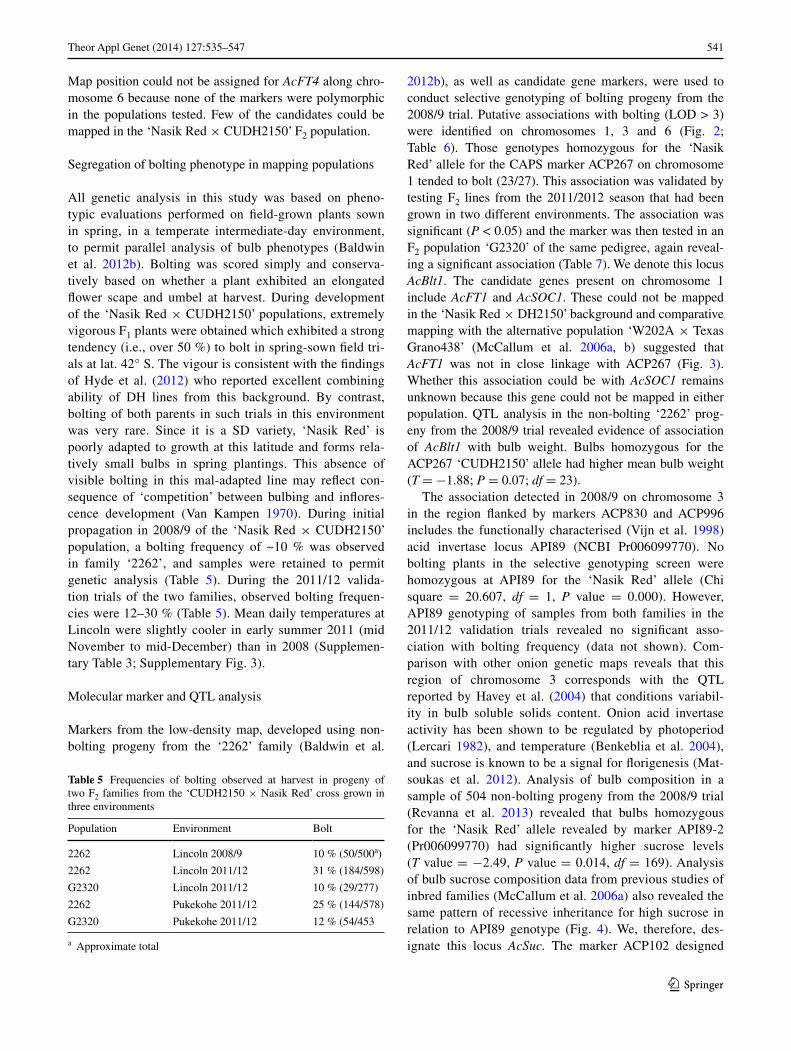
During bioinformatics searches of existing onion EST data for analysis of the FT-like gene family in onion (Lee et al. 2013), we identified other putative candidates by BLASTX matches to Arabidopsis proteins associated with flowering regulation (Srikanth and Schmid 2011). To identify poly-morphisms to enable genetic mapping of FT-like genes, and to identify possible differentiation among populations, we surveyed sequence variation in 5 FT-like and 5 other candidate gene loci using amplicon re-sequencing on the 454 platform. We were unable to develop long-range PCR primers for the other FT-like gene we denoted AcFT6 (Lee et al. 2013), which is synonymous with that denoted AcFTL by Taylor et al. (2010). The non-FT candidates we sur-veyed included the CONSTANS(CO)-like gene described by Taylor et al. (2010) and four others with similarity to CO, SOC1, VIN3 and indeterminate. PCR products of 800–3,000 bp were amplified from the homozygous reference line ‘CUDH2150’ and seven other lines of diverse short-day and long-day origin. Relatively low nucleotide diversity and negative estimates of Tajima’s D were observed in the coding regions of all except Constans-like (Table 3). These
observations are consistent with expectations for genes under purifying selection. Comparison of the distribution of significant (Bonferroni corrected P < 0.01) pair-wise dif-ferences in allele frequency among the seven non-DH SD and LD populations showed only two regions exhibiting strong evidence of population differentiation, in the FT-like gene AcFT2 and the SOC1 homolog AcSOC1 (Fig. 1). Notably, these two regions include non-synonymous vari-ants (AcFT2 C411T P/S; AcSOC1 C1376A T > K), which were rare in all genes. Non-synonymous variants were also observed in AcFT4 (T127C L > P; C1847T P > L) and AcCO (C54A L > I), which also exhibited significant differ-ences in allele frequency among some populations (Fig. 1).
PCR-based markers designed to selected variants using Galaxy-based tools (Baldwin et al. 2012b) were either placed on the onion genetic map or assigned to physi-cal chromosomes where mapping was not possible using AMAL (Table 4). The fixation of several candidate loci in the inbred line ‘W202A’ enabled mapping of several vari-ants in the ‘W202A × Texas Grano 438’ mapping popula-tion. Candidate genes tested were present on chromosomes 1–6 with chromosome 6 containing three candidates includ-ing two FT-like genes (AcFT4 and AcFT5). Using molecu-lar markers all six onion FT-like genes were assigned to the chromosomes of onion along with other major candidates.
A B
Fig. 1 Distribution of SNPs in flowering-related genes that exhibit significant allele frequency differences among seven open-pollinated SD and LD onion populations. a FT-like gene family. b Other can-didate genes. Scales denote log10 of P value for Fishers exact test of allele frequency equivalence. Points denote pair-wise comparisons
with log10 of P greater than Bonferrroni-corrected 1 % significance level (13.97). Arrows denote regions exhibiting strong differentiation among SD and LD populations. Stars denote non-synonymous poly-morphisms
541Theor Appl Genet (2014) 127:535–547
1 3
Map position could not be assigned for AcFT4 along chro-mosome 6 because none of the markers were polymorphic in the populations tested. Few of the candidates could be mapped in the ‘Nasik Red × CUDH2150’ F2 population.
Segregation of bolting phenotype in mapping populations
All genetic analysis in this study was based on pheno-typic evaluations performed on field-grown plants sown in spring, in a temperate intermediate-day environment, to permit parallel analysis of bulb phenotypes (Baldwin et al. 2012b). Bolting was scored simply and conserva-tively based on whether a plant exhibited an elongated flower scape and umbel at harvest. During development of the ‘Nasik Red × CUDH2150’ populations, extremely vigorous F1 plants were obtained which exhibited a strong tendency (i.e., over 50 %) to bolt in spring-sown field tri-als at lat. 42° S. The vigour is consistent with the findings of Hyde et al. (2012) who reported excellent combining ability of DH lines from this background. By contrast, bolting of both parents in such trials in this environment was very rare. Since it is a SD variety, ‘Nasik Red’ is poorly adapted to growth at this latitude and forms rela-tively small bulbs in spring plantings. This absence of visible bolting in this mal-adapted line may reflect con-sequence of ‘competition’ between bulbing and inflores-cence development (Van Kampen 1970). During initial propagation in 2008/9 of the ‘Nasik Red × CUDH2150’ population, a bolting frequency of ~10 % was observed in family ‘2262’, and samples were retained to permit genetic analysis (Table 5). During the 2011/12 valida-tion trials of the two families, observed bolting frequen-cies were 12–30 % (Table 5). Mean daily temperatures at Lincoln were slightly cooler in early summer 2011 (mid November to mid-December) than in 2008 (Supplemen-tary Table 3; Supplementary Fig. 3).
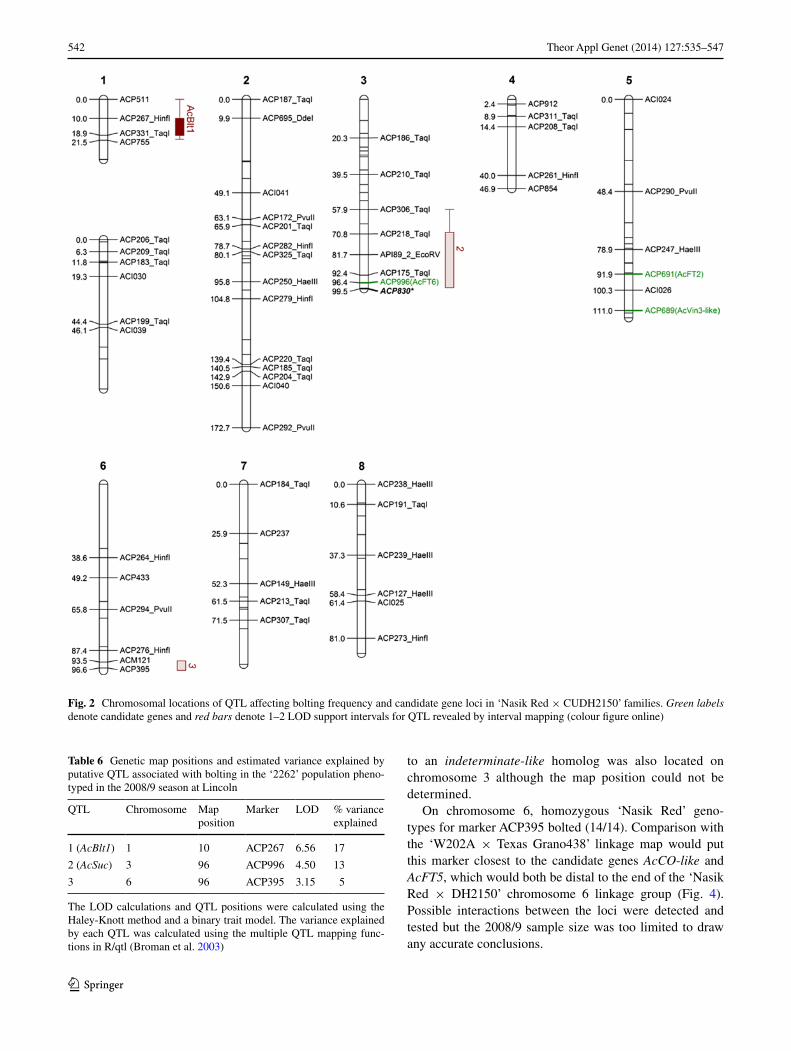
Molecular marker and QTL analysis
Markers from the low-density map, developed using non-bolting progeny from the ‘2262’ family (Baldwin et al.
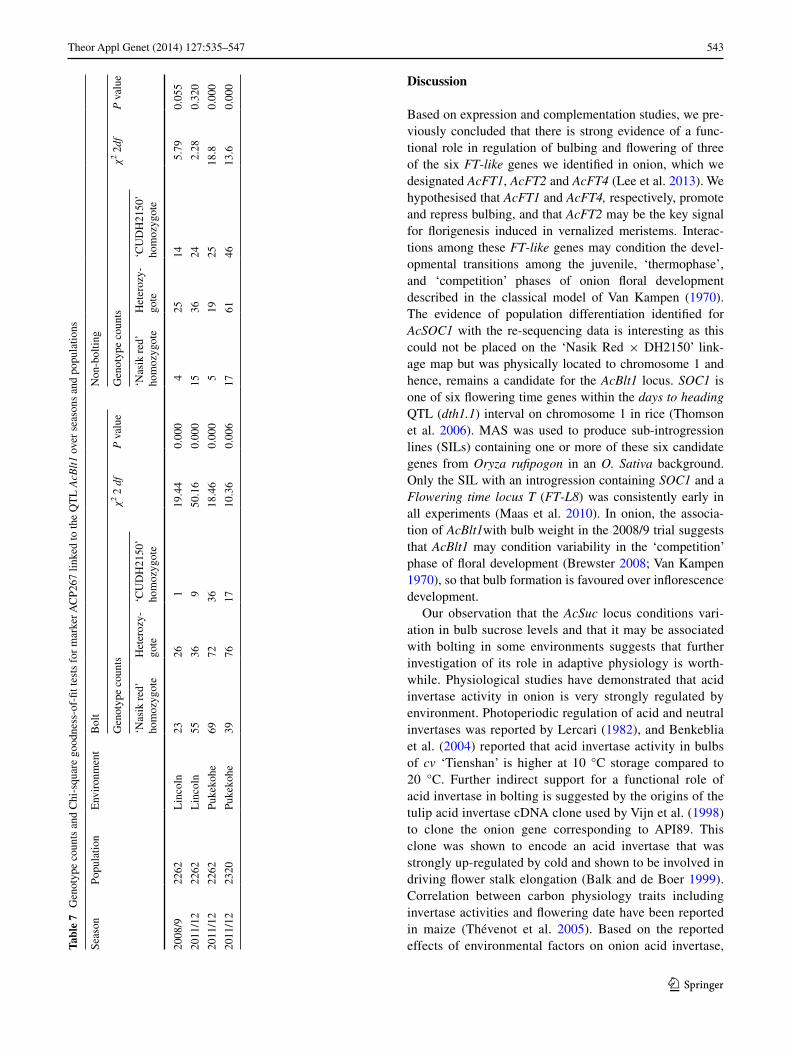
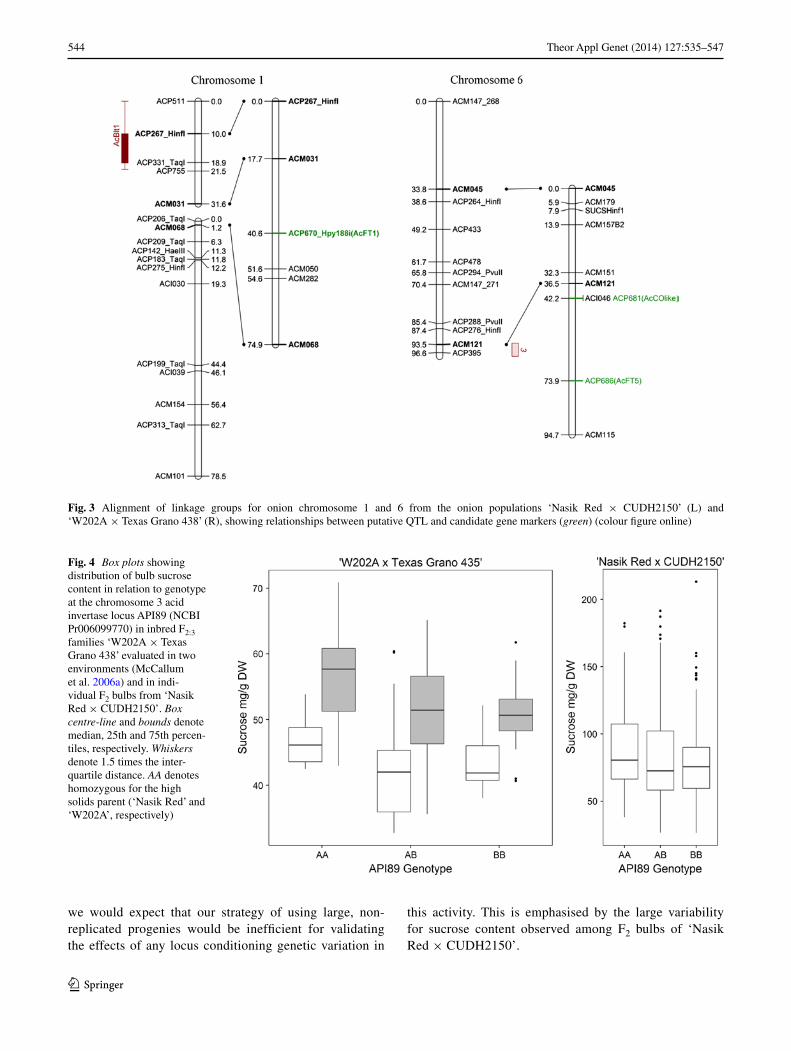
2012b), as well as candidate gene markers, were used to conduct selective genotyping of bolting progeny from the 2008/9 trial. Putative associations with bolting (LOD > 3) were identified on chromosomes 1, 3 and 6 (Fig. 2; Table 6). Those genotypes homozygous for the ‘Nasik Red’ allele for the CAPS marker ACP267 on chromosome 1 tended to bolt (23/27). This association was validated by testing F2 lines from the 2011/2012 season that had been grown in two different environments. The association was significant (P < 0.05) and the marker was then tested in an F2 population ‘G2320’ of the same pedigree, again reveal-ing a significant association (Table 7). We denote this locus AcBlt1. The candidate genes present on chromosome 1 include AcFT1 and AcSOC1. These could not be mapped in the ‘Nasik Red × DH2150’ background and comparative mapping with the alternative population ‘W202A × Texas Grano438’ (McCallum et al. 2006a, b) suggested that AcFT1 was not in close linkage with ACP267 (Fig. 3). Whether this association could be with AcSOC1 remains unknown because this gene could not be mapped in either population. QTL analysis in the non-bolting ‘2262’ prog-eny from the 2008/9 trial revealed evidence of association of AcBlt1 with bulb weight. Bulbs homozygous for the ACP267 ‘CUDH2150’ allele had higher mean bulb weight (T = −1.88; P = 0.07; df = 23).
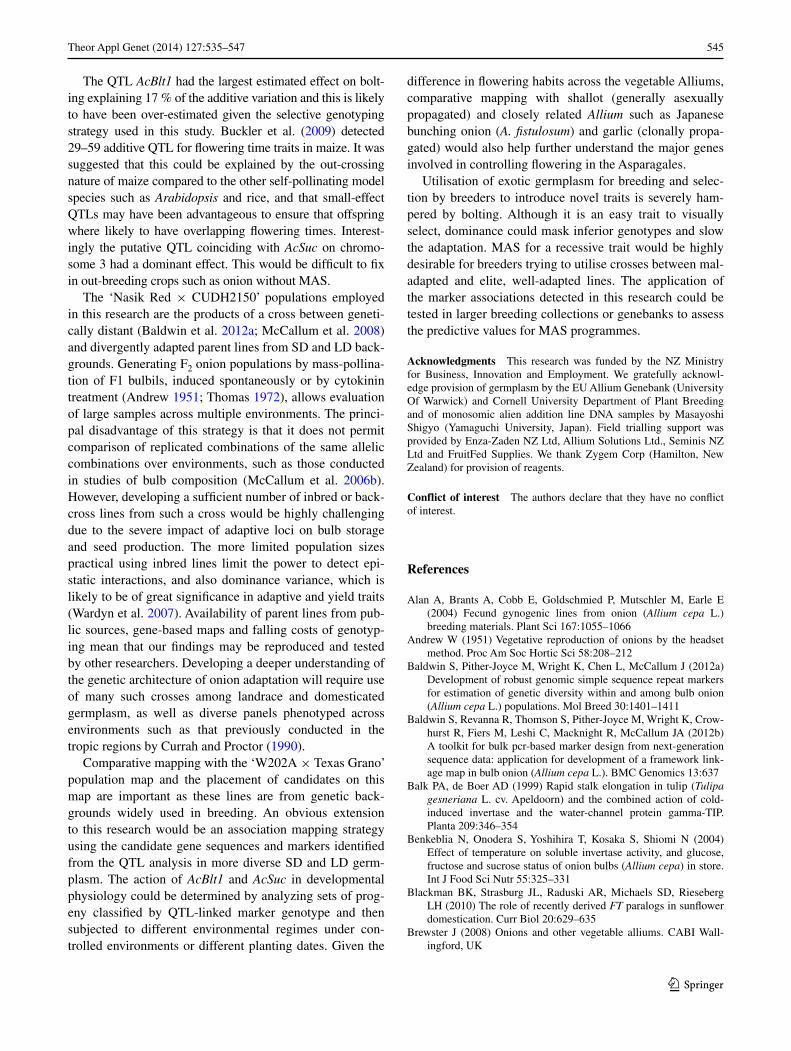
The association detected in 2008/9 on chromosome 3 in the region flanked by markers ACP830 and ACP996 includes the functionally characterised (Vijn et al. 1998) acid invertase locus API89 (NCBI Pr006099770). No bolting plants in the selective genotyping screen were homozygous at API89 for the ‘Nasik Red’ allele (Chi square = 20.607, df = 1, P value = 0.000). However, API89 genotyping of samples from both families in the 2011/12 validation trials revealed no significant asso-ciation with bolting frequency (data not shown). Com-parison with other onion genetic maps reveals that this region of chromosome 3 corresponds with the QTL reported by Havey et al. (2004) that conditions variabil-ity in bulb soluble solids content. Onion acid invertase activity has been shown to be regulated by photoperiod (Lercari 1982), and temperature (Benkeblia et al. 2004), and sucrose is known to be a signal for florigenesis (Mat-soukas et al. 2012). Analysis of bulb composition in a sample of 504 non-bolting progeny from the 2008/9 trial (Revanna et al. 2013) revealed that bulbs homozygous for the ‘Nasik Red’ allele revealed by marker API89-2 (Pr006099770) had significantly higher sucrose levels (T value = −2.49, P value = 0.014, df = 169). Analysis of bulb sucrose composition data from previous studies of inbred families (McCallum et al. 2006a) also revealed the same pattern of recessive inheritance for high sucrose in relation to API89 genotype (Fig. 4). We, therefore, des-ignate this locus AcSuc. The marker ACP102 designed
Table 5 Frequencies of bolting observed at harvest in progeny of two F2 families from the ‘CUDH2150 × Nasik Red’ cross grown in three environments
a Approximate total
Population Environment Bolt
2262 Lincoln 2008/9 10 % (50/500a)
2262 Lincoln 2011/12 31 % (184/598)
G2320 Lincoln 2011/12 10 % (29/277)
2262 Pukekohe 2011/12 25 % (144/578)
G2320 Pukekohe 2011/12 12 % (54/453
542 Theor Appl Genet (2014) 127:535–547
1 3
to an indeterminate-like homolog was also located on chromosome 3 although the map position could not be determined.
On chromosome 6, homozygous ‘Nasik Red’ geno-types for marker ACP395 bolted (14/14). Comparison with the ‘W202A × Texas Grano438’ linkage map would put this marker closest to the candidate genes AcCO-like and AcFT5, which would both be distal to the end of the ‘Nasik Red × DH2150’ chromosome 6 linkage group (Fig. 4). Possible interactions between the loci were detected and tested but the 2008/9 sample size was too limited to draw any accurate conclusions.
Fig. 2 Chromosomal locations of QTL affecting bolting frequency and candidate gene loci in ‘Nasik Red × CUDH2150’ families. Green labels denote candidate genes and red bars denote 1–2 LOD support intervals for QTL revealed by interval mapping (colour figure online)
Table 6 Genetic map positions and estimated variance explained by putative QTL associated with bolting in the ‘2262’ population pheno-typed in the 2008/9 season at Lincoln
The LOD calculations and QTL positions were calculated using the Haley-Knott method and a binary trait model. The variance explained by each QTL was calculated using the multiple QTL mapping func-tions in R/qtl (Broman et al. 2003)
QTL Chromosome Map position
Marker LOD % variance explained
1 (AcBlt1) 1 10 ACP267 6.56 17
2 (AcSuc) 3 96 ACP996 4.50 13
3 6 96 ACP395 3.15 5
543Theor Appl Genet (2014) 127:535–547
1 3
Discussion
Based on expression and complementation studies, we pre-viously concluded that there is strong evidence of a func-tional role in regulation of bulbing and flowering of three of the six FT-like genes we identified in onion, which we designated AcFT1, AcFT2 and AcFT4 (Lee et al. 2013). We hypothesised that AcFT1 and AcFT4, respectively, promote and repress bulbing, and that AcFT2 may be the key signal for florigenesis induced in vernalized meristems. Interac-tions among these FT-like genes may condition the devel-opmental transitions among the juvenile, ‘thermophase’, and ‘competition’ phases of onion floral development described in the classical model of Van Kampen (1970). The evidence of population differentiation identified for AcSOC1 with the re-sequencing data is interesting as this could not be placed on the ‘Nasik Red × DH2150’ link-age map but was physically located to chromosome 1 and hence, remains a candidate for the AcBlt1 locus. SOC1 is one of six flowering time genes within the days to heading QTL (dth1.1) interval on chromosome 1 in rice (Thomson et al. 2006). MAS was used to produce sub-introgression lines (SILs) containing one or more of these six candidate genes from Oryza rufipogon in an O. Sativa background. Only the SIL with an introgression containing SOC1 and a Flowering time locus T (FT-L8) was consistently early in all experiments (Maas et al. 2010). In onion, the associa-tion of AcBlt1with bulb weight in the 2008/9 trial suggests that AcBlt1 may condition variability in the ‘competition’ phase of floral development (Brewster 2008; Van Kampen 1970), so that bulb formation is favoured over inflorescence development.
Our observation that the AcSuc locus conditions vari-ation in bulb sucrose levels and that it may be associated with bolting in some environments suggests that further investigation of its role in adaptive physiology is worth-while. Physiological studies have demonstrated that acid invertase activity in onion is very strongly regulated by environment. Photoperiodic regulation of acid and neutral invertases was reported by Lercari (1982), and Benkeblia et al. (2004) reported that acid invertase activity in bulbs of cv ‘Tienshan’ is higher at 10 °C storage compared to 20 °C. Further indirect support for a functional role of acid invertase in bolting is suggested by the origins of the tulip acid invertase cDNA clone used by Vijn et al. (1998) to clone the onion gene corresponding to API89. This clone was shown to encode an acid invertase that was strongly up-regulated by cold and shown to be involved in driving flower stalk elongation (Balk and de Boer 1999). Correlation between carbon physiology traits including invertase activities and flowering date have been reported in maize (Thévenot et al. 2005). Based on the reported effects of environmental factors on onion acid invertase, Ta
ble
7 G
enot
ype
coun
ts a
nd C
hi-s
quar
e go
odne
ss-o
f-fit
test
s fo
r m
arke
r AC
P267
link
ed to
the
QT
L A
cBlt
1 ov
er s
easo
ns a
nd p
opul
atio
ns
Seas
onPo
pula
tion
Env
iron
men
tB
olt
Non
-bol
ting
Gen
otyp
e co
unts
χ2 2
df
P v
alue
Gen
otyp
e co
unts
χ2 2
dfP
val
ue
‘Nas
ik r
ed’
hom
ozyg
ote
Het
eroz
y-go
te‘C
UD
H21
50’
hom
ozyg
ote
‘Nas
ik r
ed’
hom
ozyg
ote
Het
eroz
y-go
te‘C
UD
H21
50’
hom
ozyg
ote
2008
/922
62L
inco
ln23
261
19.4
40.
000
425
145.
790.
055
2011
/12
2262
Lin
coln
5536
950
.16
0.00
015
3624
2.28
0.32
0
2011
/12
2262
Puke
kohe
6972
3618
.46
0.00
05
1925
18.8
0.00
0
2011
/12
2320
Puke
kohe
3976
1710
.36
0.00
617
6146
13.6
0.00
0
544 Theor Appl Genet (2014) 127:535–547
1 3
we would expect that our strategy of using large, non-replicated progenies would be inefficient for validating the effects of any locus conditioning genetic variation in
this activity. This is emphasised by the large variability for sucrose content observed among F2 bulbs of ‘Nasik Red × CUDH2150’.
Fig. 3 Alignment of linkage groups for onion chromosome 1 and 6 from the onion populations ‘Nasik Red × CUDH2150’ (L) and ‘W202A × Texas Grano 438’ (R), showing relationships between putative QTL and candidate gene markers (green) (colour figure online)
Fig. 4 Box plots showing distribution of bulb sucrose content in relation to genotype at the chromosome 3 acid invertase locus API89 (NCBI Pr006099770) in inbred F2:3 families ‘W202A × Texas Grano 438’ evaluated in two environments (McCallum et al. 2006a) and in indi-vidual F2 bulbs from ‘Nasik Red × CUDH2150’. Box centre-line and bounds denote median, 25th and 75th percen-tiles, respectively. Whiskers denote 1.5 times the inter-quartile distance. AA denotes homozygous for the high solids parent (‘Nasik Red’ and ‘W202A’, respectively)
545Theor Appl Genet (2014) 127:535–547
1 3
The QTL AcBlt1 had the largest estimated effect on bolt-ing explaining 17 % of the additive variation and this is likely to have been over-estimated given the selective genotyping strategy used in this study. Buckler et al. (2009) detected 29–59 additive QTL for flowering time traits in maize. It was suggested that this could be explained by the out-crossing nature of maize compared to the other self-pollinating model species such as Arabidopsis and rice, and that small-effect QTLs may have been advantageous to ensure that offspring where likely to have overlapping flowering times. Interest-ingly the putative QTL coinciding with AcSuc on chromo-some 3 had a dominant effect. This would be difficult to fix in out-breeding crops such as onion without MAS.
The ‘Nasik Red × CUDH2150’ populations employed in this research are the products of a cross between geneti-cally distant (Baldwin et al. 2012a; McCallum et al. 2008) and divergently adapted parent lines from SD and LD back-grounds. Generating F2 onion populations by mass-pollina-tion of F1 bulbils, induced spontaneously or by cytokinin treatment (Andrew 1951; Thomas 1972), allows evaluation of large samples across multiple environments. The princi-pal disadvantage of this strategy is that it does not permit comparison of replicated combinations of the same allelic combinations over environments, such as those conducted in studies of bulb composition (McCallum et al. 2006b). However, developing a sufficient number of inbred or back-cross lines from such a cross would be highly challenging due to the severe impact of adaptive loci on bulb storage and seed production. The more limited population sizes practical using inbred lines limit the power to detect epi-static interactions, and also dominance variance, which is likely to be of great significance in adaptive and yield traits (Wardyn et al. 2007). Availability of parent lines from pub-lic sources, gene-based maps and falling costs of genotyp-ing mean that our findings may be reproduced and tested by other researchers. Developing a deeper understanding of the genetic architecture of onion adaptation will require use of many such crosses among landrace and domesticated germplasm, as well as diverse panels phenotyped across environments such as that previously conducted in the tropic regions by Currah and Proctor (1990).
Comparative mapping with the ‘W202A × Texas Grano’ population map and the placement of candidates on this map are important as these lines are from genetic back-grounds widely used in breeding. An obvious extension to this research would be an association mapping strategy using the candidate gene sequences and markers identified from the QTL analysis in more diverse SD and LD germ-plasm. The action of AcBlt1 and AcSuc in developmental physiology could be determined by analyzing sets of prog-eny classified by QTL-linked marker genotype and then subjected to different environmental regimes under con-trolled environments or different planting dates. Given the
difference in flowering habits across the vegetable Alliums, comparative mapping with shallot (generally asexually propagated) and closely related Allium such as Japanese bunching onion (A. fistulosum) and garlic (clonally propa-gated) would also help further understand the major genes involved in controlling flowering in the Asparagales.
Utilisation of exotic germplasm for breeding and selec-tion by breeders to introduce novel traits is severely ham-pered by bolting. Although it is an easy trait to visually select, dominance could mask inferior genotypes and slow the adaptation. MAS for a recessive trait would be highly desirable for breeders trying to utilise crosses between mal-adapted and elite, well-adapted lines. The application of the marker associations detected in this research could be tested in larger breeding collections or genebanks to assess the predictive values for MAS programmes.
Acknowledgments This research was funded by the NZ Ministry for Business, Innovation and Employment. We gratefully acknowl-edge provision of germplasm by the EU Allium Genebank (University Of Warwick) and Cornell University Department of Plant Breeding and of monosomic alien addition line DNA samples by Masayoshi Shigyo (Yamaguchi University, Japan). Field trialling support was provided by Enza-Zaden NZ Ltd, Allium Solutions Ltd., Seminis NZ Ltd and FruitFed Supplies. We thank Zygem Corp (Hamilton, New Zealand) for provision of reagents.
Conflict of interest The authors declare that they have no conflict of interest.
References
Alan A, Brants A, Cobb E, Goldschmied P, Mutschler M, Earle E (2004) Fecund gynogenic lines from onion (Allium cepa L.) breeding materials. Plant Sci 167:1055–1066
Andrew W (1951) Vegetative reproduction of onions by the headset method. Proc Am Soc Hortic Sci 58:208–212
Baldwin S, Pither-Joyce M, Wright K, Chen L, McCallum J (2012a) Development of robust genomic simple sequence repeat markers for estimation of genetic diversity within and among bulb onion (Allium cepa L.) populations. Mol Breed 30:1401–1411
Baldwin S, Revanna R, Thomson S, Pither-Joyce M, Wright K, Crow-hurst R, Fiers M, Leshi C, Macknight R, McCallum JA (2012b) A toolkit for bulk pcr-based marker design from next-generation sequence data: application for development of a framework link-age map in bulb onion (Allium cepa L.). BMC Genomics 13:637
Balk PA, de Boer AD (1999) Rapid stalk elongation in tulip (Tulipa gesneriana L. cv. Apeldoorn) and the combined action of cold-induced invertase and the water-channel protein gamma-TIP. Planta 209:346–354
Benkeblia N, Onodera S, Yoshihira T, Kosaka S, Shiomi N (2004) Effect of temperature on soluble invertase activity, and glucose, fructose and sucrose status of onion bulbs (Allium cepa) in store. Int J Food Sci Nutr 55:325–331
Blackman BK, Strasburg JL, Raduski AR, Michaels SD, Rieseberg LH (2010) The role of recently derived FT paralogs in sunflower domestication. Curr Biol 20:629–635
Brewster J (2008) Onions and other vegetable alliums. CABI Wall-ingford, UK
546 Theor Appl Genet (2014) 127:535–547
1 3
Broman KW, Wu H, Sen S, Churchill GA (2003) R/qtl: QTL mapping in experimental crosses. Bioinformatics 19:889–890
Buckler ES, Holland JB, Bradbury PJ, Acharya CB, Brown PJ, Browne C, Ersoz E, Flint-Garcia S, Garcia A, Glaubitz JC (2009) The genetic architecture of maize flowering time. Science 325:714–718
Chang Y-Y, Chu Y-W, Chen C-W, Leu W-M, Hsu H-F, Yang C-H (2011) Characterization of Oncidium ‘Gower Ramsey’ Transcrip-tomes using 454 GS-FLX Pyrosequencing and their application to the identification of genes associated with flowering time. Plant Cell Physiol 52:1532–1545
Cingolani P, Platts A, Coon M, Nguyen T, Wang L, Land SJ, Lu X, Ruden DM (2012) A program for annotating and predicting the effects of single nucleotide polymorphisms, SnpEff: SNPs in the genome of Drosophila melanogaster strain w1118; iso-2; iso-3. Fly 6:0–1
Currah L, Proctor FJ (1990) Onions in tropical regions. Natural Resources Institute, UK
Ding L, Wang Y, Yu H (2013) Overexpression of DOSOC1, an ortholog of arabidopsis SOC1, promotes flowering in the orchid Dendrobium chao parya smile. Plant Cell Physiol 54:595–608
Duangjit J, Bohanec B, Chan AP, Town CD, Havey MJ (2013) Tran-scriptome sequencing to produce SNP-based genetic maps of onion. Theor Appl Genet 126(8):2093–2101
Goldman IL (1996) A list of germplasm releases from the University of Wisconsin Onion Breeding Program, 1957–1993. HortScience 31:878–879
Greenup A, Peacock WJ, Dennis ES, Trevaskis B (2009) The molecu-lar biology of seasonal flowering-responses in Arabidopsis and the cereals. Ann Bot 103:1165–1172
Havey MJ, Galmarini CR, Gokce AF, Henson C (2004) QTL affect-ing soluble carbohydrate concentrations in stored onion bulbs and their association with flavor and health-enhancing attributes. Genome 47:463–468
Hepworth SR, Valverde F, Ravenscroft D, Mouradov A, Coupland G (2002) Antagonistic regulation of flowering-time gene SOC1 by CONSTANS and FLC via separate promoter motifs. EMBO J 21:4327–4337
Hyde PT, Earle ED, Mutschler MA (2012) Doubled haploid onion (Allium cepa L.) Lines and their impact on hybrid performance. HortScience 47:1690–1695
Hyun DY, Kim O-T, Bang K-H, Kim Y-C, Yoo NH, Kim CW, Lee JH (2009) Genetic and molecular studies for regulation of bolting time of onion (Allium cepa L.). J Plant Biol 52:602–608
Janssen T, Bremer K (2004) The age of major monocot groups inferred from 800 + rbcL sequences. Bot J Linn Soc 146:385–398
Kamenetsky R, Rabinowitch H (2002) Florogenesis. In: Rabinowitch HD, Currah L (eds) Allium crop science: recent advances CAB international. Wallingford, UK, pp 31–58
Khokhar KM, Hadley P, Pearson S (2007) Effect of reciprocal trans-fers of onion sets between inductive and non-inductive tempera-tures on the incidence of bolting and bulbing and seed yield. Sci Hortic 112:245–250
Kofler R, Orozco-terWengel P, De Maio N, Pandey RV, Nolte V, Futs-chik A, Kosiol C, Schlotterer C (2011a) PoPoolation: a toolbox for population genetic analysis of next generation sequencing data from pooled individuals. PLoS One 6:e15925
Kofler R, Pandey RV, Schlötterer C (2011b) PoPoolation2: identifying differentiation between populations using sequencing of pooled DNA samples (Pool-Seq). Bioinformatics 27:3435–3436
Kojima S, Takahashi Y, Kobayashi Y, Monna L, Sasaki T, Araki T, Yano M (2002) Hd3a, a rice ortholog of the Arabidopsis FT gene, promotes transition to flowering downstream of Hd1 under short-day conditions. Plant Cell Physiol 43:1096–1105
Laurie RE, Diwadkar P, Jaudal M, Zhang L, Hecht V, Wen J, Tadege M, Mysore KS, Putterill J, Weller JL (2011) The medicago
FLOWERING LOCUS T homolog, MtFTa1, is a key regulator of flowering time. Plant Physiol 156:2207–2224
Lee R, Baldwin S, Pither-Joyce M, McCallum J, Macknight R (2013) Onion bulb formation and flowering in response to seasonal cues involves FT homologs. Nat Commun (in press)
Lercari B (1982) Changes in invertase activities during the photo-periodically induced bulb formation of onion (Allium cepa L.). Physiol Plant 54:480–484
Li H, Handsaker B, Wysoker A, Fennell T, Ruan J, Homer N, Marth G, Abecasis G, Durbin R (2009) The sequence alignment/map format and SAMtools. Bioinformatics 25:2078–2079
Li H, Durbin R (2010) Fast and accurate long-read alignment with Burrows–Wheeler transform. Bioinformatics 26(5):589–595
Liang S, Ye Q-S, Li R-H, Leng J-Y, Li M-R, Wang X-J, Li H-Q (2012) Transcriptional regulations on the low-temperature-induced flo-ral transition in an Orchidaceae species, Dendrobium nobile: an expressed sequence tags analysis. Comp Funct Genomics 2012, Article ID 757801, p 14
Maas LF, McClung A, McCouch S (2010) Dissection of a QTL reveals an adaptive, interacting gene complex associated with transgressive variation for flowering time in rice. Theor Appl Genet 120:895–908
Matsoukas IG, Massiah AJ, Thomas B (2012) Florigenic and Antiflo-rigenic Signaling in Plants. Plant Cell Physiol 53:1827–1842
McCallum J, Clarke A, Pither-Joyce M, Shaw M, Butler R, Brash D, Scheffer J, Sims I, van Heusden S, Shigyo M, Havey M (2006a) Genetic mapping of a major gene affecting onion bulb fructan content. Theor Appl Genet 112:958–967
McCallum J, Pither-Joyce M, Shaw M, Kenel F, Davis S, Butler R, Scheffer J, Jakse J, Havey MJ (2006b) Genetic mapping of sulfur assimilation genes reveals a QTL for onion bulb pungency. Theor Appl Genet 114:815–822
McCallum J, Thomson S, Pither-Joyce M, Kenel F, Clarke A, Havey M (2008) Genetic diversity analysis and single-nucleotide poly-morphism marker development in cultivated bulb onion based on expressed sequence tag simple sequence repeat markers. J Am Soc Hort Sci 133:810–818
Meyer M, Stenzel U, Myles S, Prufer K, Hofreiter M (2007) Targeted high-throughput sequencing of tagged nucleic acid samples. Nucleic Acids Res 35:e97
Meyer M, Stenzel U, Hofreiter M (2008) Parallel tagged sequencing on the 454 platform. Nat Protoc 3:267–278
Rabinowitch HD, Kamenetsky R (2002) Shallot (Allium cepa, Aggregatum Group). In: Rabinowitch HD, Currah L (eds) Allium crop science: recent advances. CABI Publishing, New York, pp 409–430
Revanna R, Turnbull MH, Shaw ML, Wright KM, Butler RC, Jame-son PE, McCallum JA (2013) Measurement of the distribution of non-structural carbohydrate composition in onion populations by a high-throughput microplate enzymatic assay. J Sci Food Agric epub 16/03/2013
Shigyo M, Tashiro Y, Isshiki S, Miyazaki S (1996) Establishment of a series of alien monosomic addition lines of Japanese bunching onion (Allium fistulosum L.) with extra chromosomes from shal-lot (A-cepa L Aggregatum group). Genes Genet Syst 71:363–371
Skøt L, Sanderson R, Thomas A, Skøt K, Thorogood D, Latypova G, Asp T, Armstead I (2011) Allelic variation in the perennial ryegrass Flowering Locus T gene is associated with changes in flowering time across a range of populations. Plant Physiol 155:1013–1022
Srikanth A, Schmid M (2011) Regulation of flowering time: all roads lead to Rome. Cell Mol Life Sci 68:2012–2037
Takahashi Y, Teshima KM, Yokoi S, Innan H, Shimamoto K (2009) Variations in Hd1 proteins, Hd3a promoters, and Ehd1 expression levels contribute to diversity of flowering time in cultivated rice. Proc Natl Acad Sci USA 106:4555–4560
547Theor Appl Genet (2014) 127:535–547
1 3
Taylor A, Massiah AJ, Thomas B (2010) Conservation of Arabidop-sis thaliana photoperiodic flowering time genes in onion (Allium cepa L.). Plant Cell Physiol 51:1638–1647
Thévenot C, Simond-Côte E, Reyss A, Manicacci D, Trouverie J, Le Guilloux M, Ginhoux V, Sidicina F, Prioul J-L (2005) QTLs for enzyme activities and soluble carbohydrates involved in starch accumulation during grain filling in maize. J Exp Bot 56:945–958
Thomas T (1972) Stimulation of onion bulblet production by N6-ben-zyladenine. Hort Res 12:77–79
Thomson MJ, Edwards JD, Septiningsih EM, Harrington SE, McCouch SR (2006) Substitution mapping of dth1. 1, a flow-ering-time quantitative trait locus (QTL) associated with trans-gressive variation in rice, reveals multiple sub-QTL. Genetics 172:2501–2514
Tsuji H, Taoka K-i, Shimamoto K (2011) Regulation of flowering in rice: two florigen genes, a complex gene network, and natural variation. Curr Opin Plant Biol 14:45–52
Van Kampen J (1970) Shortening the breeding cycle in onions. Med-edeling Proefstation voor de Groenteteelt in de Vollegrond, Alk-maar, p 51
Van Ooijen J (2006) JoinMap 4. Software for the calculation of genetic linkage maps in experimental populations
Vijn I, Vandijken A, Luscher M, Bos A, Smeets E, Weisbeek P, Wiem-ken A, Smeekens S (1998) Cloning of sucrose—sucrose 1-fruc-tosyltransferase from onion and synthesis of structurally defined fructan molecules from sucrose. Plant Physiol 117:1507–1513
Wardyn BM, Edwards JW, Lamkey KR (2007) The genetic struc-ture of a maize population: the role of dominance. Crop Sci 47:467–474
Wu TD, Watanabe CK (2005) GMAP: a genomic mapping and align-ment program for mRNA and EST sequences. Bioinformatics 21:1859–1875
Xiang L, Li X, Qin D, Guo F, Wu C, Miao L, Sun C (2012) Func-tional analysis of FLOWERING LOCUS T orthologs from spring orchid (Cymbidium goeringii Rchb. f.) that regulates the vegeta-tive to reproductive transition. Plant Physiol Biochem 58:98–105