Embed Size (px)
Citation preview
©FUNPEC-RP www.funpecrp.com.brGenetics and Molecular Research 11 (1): 556-571 (2012)
Genetic diversity of Brazilian and introduced olive germplasms based on microsatellite markers
A.D.B. do Val1, J.L. Ferreira2, J. Vieira Neto3, M. Pasqual1,A.F. de Oliveira2, A. Borém4 and G.M.A. Cançado2
1Departamento de Agricultura, Universidade Federal de Lavras,Lavras, MG, Brasil2Laboratório de Biotecnologia Vegetal,Empresa de Pesquisa Agropecuária de Minas Gerais, Caldas, MG, Brasil
3Estação Experimental de Ituporanga,Empresa de Pesquisa Agropecuária e Extensão Rural de Santa Catarina, Ituporanga, SC, Brasil4Departamento de Fitotecnia, Universidade Federal de Viçosa,Viçosa, MG, Brasil
Corresponding author: G.M.A. CançadoE-mail: [email protected]
Genet. Mol. Res. 11 (1): 556-571 (2012)Received August 19, 2011Accepted January 11, 2012Published March 8, 2012DOI http://dx.doi.org/10.4238/2012.March.8.4
ABSTRACT. Olive trees have been grown since the beginning of civilization, and the consumption of olives and olive products is increasing worldwide, due to their health benefits and organoleptic qualities. To meet the growing market for olives, commercial cultivation of this species is expanding from traditional areas to new regions. Although the Brazilian olive industry has just begun to be established, breeding programs are already developing cultivars that are more adapted to local conditions. We used 12 microsatellite markers to evaluate 60 olive accessions, including several cultivars that were developed in Brazil. The analyses identified 72 distinct alleles; the largest number of alleles per locus were at the markers
557
©FUNPEC-RP www.funpecrp.com.brGenetics and Molecular Research 11 (1): 556-571 (2012)
Genetic diversity in olive germplasms
GAPU 101 and GAPU 71B, which contained 10 and 9 alleles, respectively. The largest allelic diversity and polymorphic information contents were also found at the GAPU 101 and GAPU 71B markers, with values of 0.8399/0.8203 and 0.8117/0.7863, respectively. Additionally, the 12 microsatellite markers generated a cumulative identity probability of 1.51 x 10⁻¹⁰, indicating a high level of accuracy of accession identification. The set of markers that we used allowed the identification of 52 of the 60 olive genotypes, in addition to the recognition of several varietal synonyms. The components of a two-dimensional principal coordinate analysis explained 48.6% of the total genetic variation. The results obtained from the microsatellite markers showed a substantial degree of genetic diversity in the olive tree accessions used in Brazil.
Key words: Olea europaea L.; Molecular markers; Genetic resources;Oliviculture; Genetic variability
INTRODUCTION
The olive tree (Olea europaea L.) is a diploid species (2N = 46) with frequent cross-pollination (Alba et al., 2009) and gametophytic self-incompatibility (Besnard et al., 2009). The olive tree has a large number of commercial cultivars with different levels of self-incompatibility (Grati-Kamoun et al., 2006). The phenological and reproductive biology of this species has been the focus of several studies aimed at identifying self-compatible cultivars and assessing rates of self-sterility (Albertini et al., 2011). Most modern olive cultivars are believed to have been obtained from the crossing of wild plants followed by focused human selection (Cordeiro et al., 2008), resulting in the generation of hundreds of cultivars over a period of centuries. Because of the large number of olive cultivars and their narrow genetic diversity, which is a function of geographic proximity, varietal synonyms and homonyms frequently occur, which raise several problems for germplasm management and preservation (Hakim et al., 2010).
Germplasm characterization and knowledge is a key first step in starting the pre-breed-ing process, and molecular markers are a valuable tool for identifying and characterizing olive genotypes. Molecular markers are proving to be an important way to increase selection effi-ciency; compared to conventional, morphologically based methods, they provide an easy and accurate way to access the genetic variability of a germplasm collection because they determine polymorphisms at the DNA level without environmental interference. Additionally, molecular markers can theoretically be applied at any developmental stage and to any plant tissue.
Microsatellite markers, which are also known as simple sequence repeats, are co-dominant-ly inherited. Therefore, they are considered to be ideal genetic markers (Cadalen et al., 2010) and are widely used to study the germplasm. Microsatellite markers also have advantages over many other markers because they are highly polymorphic, extraordinarily abundant, analytically simple, and readily transferable (Weber, 1990). Microsatellite markers have been used in olives for a variety of purposes, including the evaluation of genetic diversity (Martins Lopes et al., 2009), germplasm characterization (Rony et al., 2009), intracultivar genetic variation (Noormohammadi et al., 2009), DNA fingerprinting of cultivars (Sarri et al., 2006; Muzzalupo et al., 2009), origin certification of olive oil (Pasqualone et al., 2007), and evaluation of gene flow (Mookerjee et al. 2005).
558
©FUNPEC-RP www.funpecrp.com.brGenetics and Molecular Research 11 (1): 556-571 (2012)
A.D.B. do Val et al.
Olive trees have been cultivated for thousands of years in the Mediterranean basin, which remains the chief region of olive production; however, the commercial cultivation of olives has been introduced and successfully managed in subtropical and warm temperate climates, such as South Africa, Australia, New Zealand, Palestine, the United States (California), Chile, Argentina (Spennemann and Allen, 2000) and, most recently, Brazil. Germplasm collections of plant species, such as olives, are generally maintained ex situ in gene banks. In many cases, this method of conser-vation is the only one possible owing to social and economical impediments; however, ex situ collec-tions may contain a considerable percentage of duplicate accessions in addition to misclassified en-tries (erroneous identification or accidental mixing) that create difficulty for effective management of conservation and use during breeding (Gorji and Zolnoori, 2011). These problems are frequently observed in olive germplasms. We used 12 microsatellite markers that were previously validated for olives to characterize the genetic diversity and evaluate the genetic identity of 60 olive accessions, including several new cultivars that were developed by a breeding program carried out in Brazil.
MATERIAL AND METHODS
Plant material
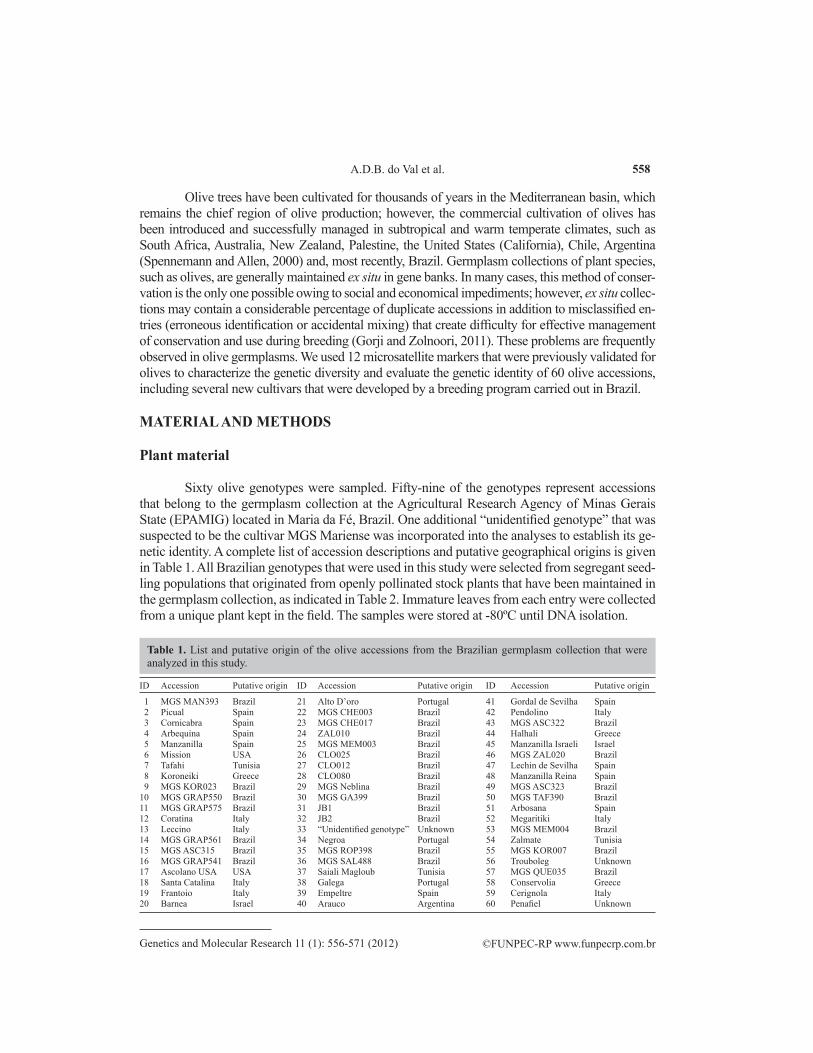
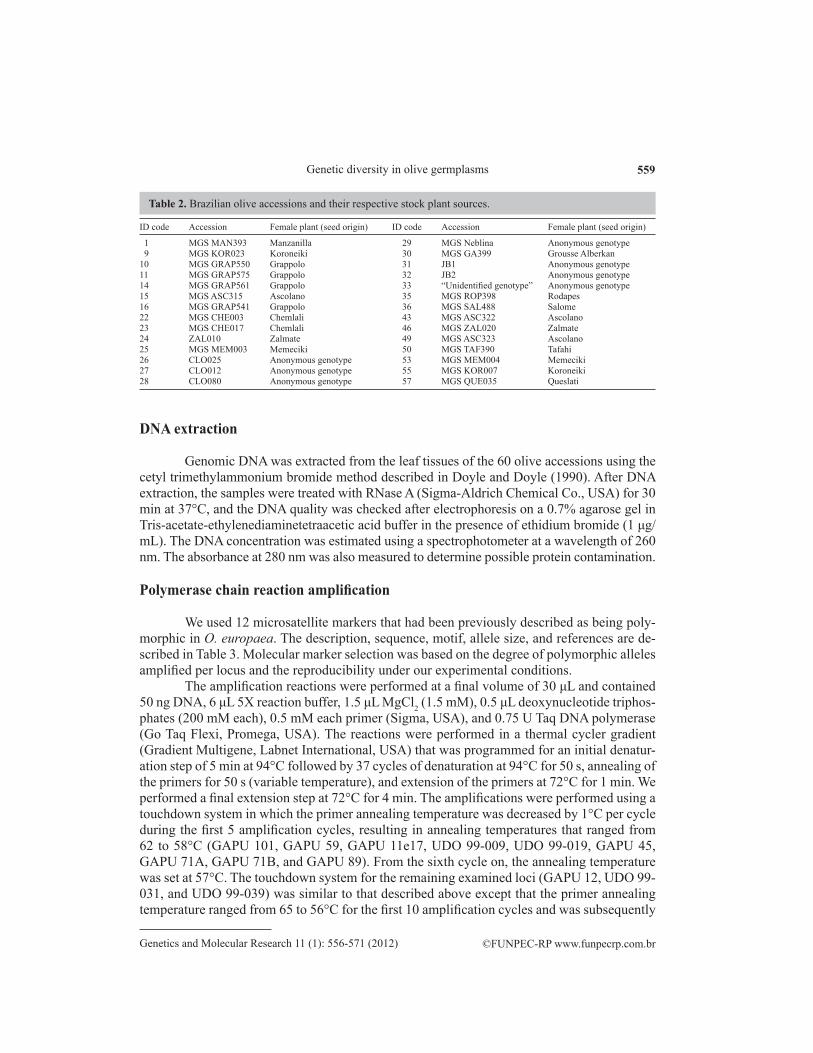
Sixty olive genotypes were sampled. Fifty-nine of the genotypes represent accessions that belong to the germplasm collection at the Agricultural Research Agency of Minas Gerais State (EPAMIG) located in Maria da Fé, Brazil. One additional “unidentified genotype” that was suspected to be the cultivar MGS Mariense was incorporated into the analyses to establish its ge-netic identity. A complete list of accession descriptions and putative geographical origins is given in Table 1. All Brazilian genotypes that were used in this study were selected from segregant seed-ling populations that originated from openly pollinated stock plants that have been maintained in the germplasm collection, as indicated in Table 2. Immature leaves from each entry were collected from a unique plant kept in the field. The samples were stored at -80ºC until DNA isolation.
ID Accession Putative origin ID Accession Putative origin ID Accession Putative origin
1 MGS MAN393 Brazil 21 Alto D’oro Portugal 41 Gordal de Sevilha Spain 2 Picual Spain 22 MGS CHE003 Brazil 42 Pendolino Italy 3 Cornicabra Spain 23 MGS CHE017 Brazil 43 MGS ASC322 Brazil 4 Arbequina Spain 24 ZAL010 Brazil 44 Halhali Greece 5 Manzanilla Spain 25 MGS MEM003 Brazil 45 Manzanilla Israeli Israel 6 Mission USA 26 CLO025 Brazil 46 MGS ZAL020 Brazil 7 Tafahi Tunisia 27 CLO012 Brazil 47 Lechin de Sevilha Spain 8 Koroneiki Greece 28 CLO080 Brazil 48 Manzanilla Reina Spain 9 MGS KOR023 Brazil 29 MGS Neblina Brazil 49 MGS ASC323 Brazil10 MGS GRAP550 Brazil 30 MGS GA399 Brazil 50 MGS TAF390 Brazil11 MGS GRAP575 Brazil 31 JB1 Brazil 51 Arbosana Spain12 Coratina Italy 32 JB2 Brazil 52 Megaritiki Italy13 Leccino Italy 33 “Unidentified genotype” Unknown 53 MGS MEM004 Brazil14 MGS GRAP561 Brazil 34 Negroa Portugal 54 Zalmate Tunisia15 MGS ASC315 Brazil 35 MGS ROP398 Brazil 55 MGS KOR007 Brazil16 MGS GRAP541 Brazil 36 MGS SAL488 Brazil 56 Trouboleg Unknown17 Ascolano USA USA 37 Saiali Magloub Tunisia 57 MGS QUE035 Brazil18 Santa Catalina Italy 38 Galega Portugal 58 Conservolia Greece19 Frantoio Italy 39 Empeltre Spain 59 Cerignola Italy20 Barnea Israel 40 Arauco Argentina 60 Penafiel Unknown
Table 1. List and putative origin of the olive accessions from the Brazilian germplasm collection that were analyzed in this study.
559
©FUNPEC-RP www.funpecrp.com.brGenetics and Molecular Research 11 (1): 556-571 (2012)
Genetic diversity in olive germplasms
DNA extraction
Genomic DNA was extracted from the leaf tissues of the 60 olive accessions using the cetyl trimethylammonium bromide method described in Doyle and Doyle (1990). After DNA extraction, the samples were treated with RNase A (Sigma-Aldrich Chemical Co., USA) for 30 min at 37°C, and the DNA quality was checked after electrophoresis on a 0.7% agarose gel in Tris-acetate-ethylenediaminetetraacetic acid buffer in the presence of ethidium bromide (1 μg/mL). The DNA concentration was estimated using a spectrophotometer at a wavelength of 260 nm. The absorbance at 280 nm was also measured to determine possible protein contamination.
Polymerase chain reaction amplification
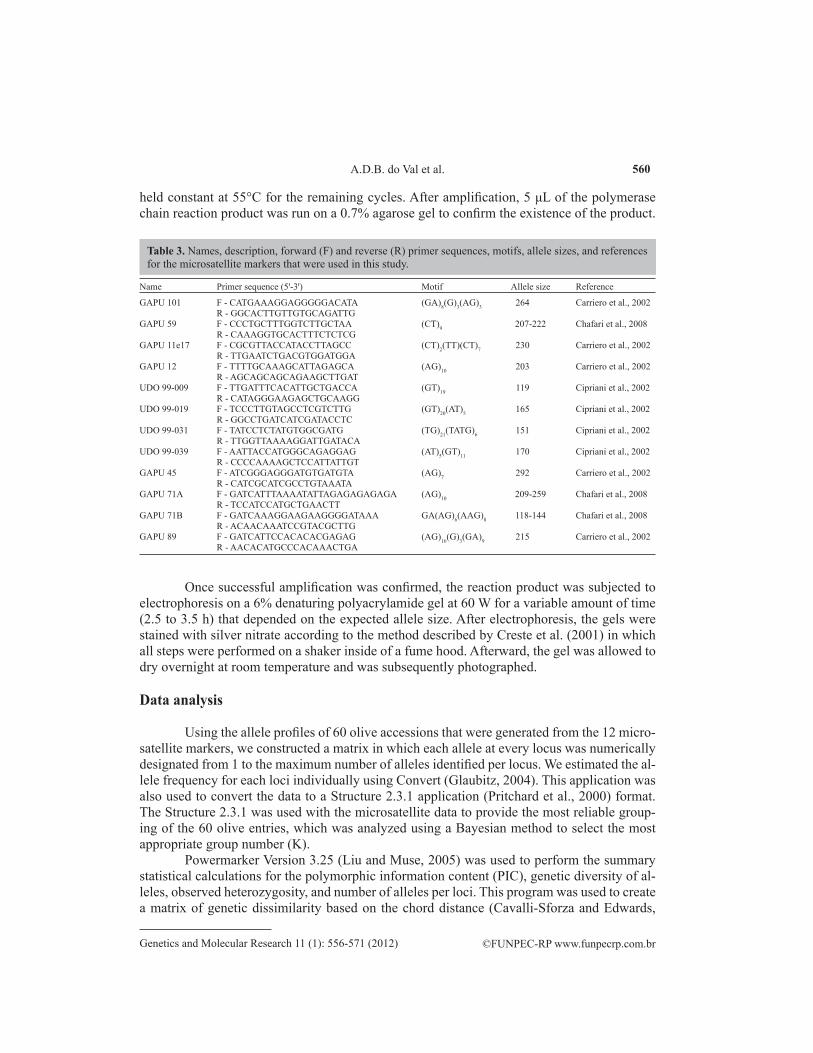
We used 12 microsatellite markers that had been previously described as being poly-morphic in O. europaea. The description, sequence, motif, allele size, and references are de-scribed in Table 3. Molecular marker selection was based on the degree of polymorphic alleles amplified per locus and the reproducibility under our experimental conditions.
The amplification reactions were performed at a final volume of 30 μL and contained 50 ng DNA, 6 μL 5X reaction buffer, 1.5 μL MgCl2 (1.5 mM), 0.5 μL deoxynucleotide triphos-phates (200 mM each), 0.5 mM each primer (Sigma, USA), and 0.75 U Taq DNA polymerase (Go Taq Flexi, Promega, USA). The reactions were performed in a thermal cycler gradient (Gradient Multigene, Labnet International, USA) that was programmed for an initial denatur-ation step of 5 min at 94°C followed by 37 cycles of denaturation at 94°C for 50 s, annealing of the primers for 50 s (variable temperature), and extension of the primers at 72°C for 1 min. We performed a final extension step at 72°C for 4 min. The amplifications were performed using a touchdown system in which the primer annealing temperature was decreased by 1°C per cycle during the first 5 amplification cycles, resulting in annealing temperatures that ranged from 62 to 58°C (GAPU 101, GAPU 59, GAPU 11e17, UDO 99-009, UDO 99-019, GAPU 45, GAPU 71A, GAPU 71B, and GAPU 89). From the sixth cycle on, the annealing temperature was set at 57°C. The touchdown system for the remaining examined loci (GAPU 12, UDO 99-031, and UDO 99-039) was similar to that described above except that the primer annealing temperature ranged from 65 to 56°C for the first 10 amplification cycles and was subsequently
ID code Accession Female plant (seed origin) ID code Accession Female plant (seed origin)
1 MGS MAN393 Manzanilla 29 MGS Neblina Anonymous genotype 9 MGS KOR023 Koroneiki 30 MGS GA399 Grousse Alberkan10 MGS GRAP550 Grappolo 31 JB1 Anonymous genotype11 MGS GRAP575 Grappolo 32 JB2 Anonymous genotype14 MGS GRAP561 Grappolo 33 “Unidentified genotype” Anonymous genotype15 MGS ASC315 Ascolano 35 MGS ROP398 Rodapes16 MGS GRAP541 Grappolo 36 MGS SAL488 Salome22 MGS CHE003 Chemlali 43 MGS ASC322 Ascolano23 MGS CHE017 Chemlali 46 MGS ZAL020 Zalmate24 ZAL010 Zalmate 49 MGS ASC323 Ascolano25 MGS MEM003 Memeciki 50 MGS TAF390 Tafahi26 CLO025 Anonymous genotype 53 MGS MEM004 Memeciki27 CLO012 Anonymous genotype 55 MGS KOR007 Koroneiki28 CLO080 Anonymous genotype 57 MGS QUE035 Queslati
Table 2. Brazilian olive accessions and their respective stock plant sources.
560
©FUNPEC-RP www.funpecrp.com.brGenetics and Molecular Research 11 (1): 556-571 (2012)
A.D.B. do Val et al.
held constant at 55°C for the remaining cycles. After amplification, 5 μL of the polymerase chain reaction product was run on a 0.7% agarose gel to confirm the existence of the product.
Name Primer sequence (5ꞌ-3ꞌ) Motif Allele size Reference
GAPU 101 F - CATGAAAGGAGGGGGACATA (GA)8(G)3(AG)3 264 Carriero et al., 2002 R - GGCACTTGTTGTGCAGATTGGAPU 59 F - CCCTGCTTTGGTCTTGCTAA (CT)9 207-222 Chafari et al., 2008 R - CAAAGGTGCACTTTCTCTCGGAPU 11e17 F - CGCGTTACCATACCTTAGCC (CT)2(TT)(CT)7 230 Carriero et al., 2002 R - TTGAATCTGACGTGGATGGAGAPU 12 F - TTTTGCAAAGCATTAGAGCA (AG)10 203 Carriero et al., 2002 R - AGCAGCAGCAGAAGCTTGATUDO 99-009 F - TTGATTTCACATTGCTGACCA (GT)19 119 Cipriani et al., 2002 R - CATAGGGAAGAGCTGCAAGGUDO 99-019 F - TCCCTTGTAGCCTCGTCTTG (GT)20(AT)5 165 Cipriani et al., 2002 R - GGCCTGATCATCGATACCTCUDO 99-031 F - TATCCTCTATGTGGCGATG (TG)21(TATG)6 151 Cipriani et al., 2002 R - TTGGTTAAAAGGATTGATACAUDO 99-039 F - AATTACCATGGGCAGAGGAG (AT)5(GT)11 170 Cipriani et al., 2002 R - CCCCAAAAGCTCCATTATTGTGAPU 45 F - ATCGGGAGGGATGTGATGTA (AG)7 292 Carriero et al., 2002 R - CATCGCATCGCCTGTAAATAGAPU 71A F - GATCATTTAAAATATTAGAGAGAGAGA (AG)10 209-259 Chafari et al., 2008 R - TCCATCCATGCTGAACTTGAPU 71B F - GATCAAAGGAAGAAGGGGATAAA GA(AG)6(AAG)8 118-144 Chafari et al., 2008 R - ACAACAAATCCGTACGCTTGGAPU 89 F - GATCATTCCACACACGAGAG (AG)16(G)3(GA)9 215 Carriero et al., 2002 R - AACACATGCCCACAAACTGA
Table 3. Names, description, forward (F) and reverse (R) primer sequences, motifs, allele sizes, and references for the microsatellite markers that were used in this study.
Once successful amplification was confirmed, the reaction product was subjected to electrophoresis on a 6% denaturing polyacrylamide gel at 60 W for a variable amount of time (2.5 to 3.5 h) that depended on the expected allele size. After electrophoresis, the gels were stained with silver nitrate according to the method described by Creste et al. (2001) in which all steps were performed on a shaker inside of a fume hood. Afterward, the gel was allowed to dry overnight at room temperature and was subsequently photographed.
Data analysis
Using the allele profiles of 60 olive accessions that were generated from the 12 micro-satellite markers, we constructed a matrix in which each allele at every locus was numerically designated from 1 to the maximum number of alleles identified per locus. We estimated the al-lele frequency for each loci individually using Convert (Glaubitz, 2004). This application was also used to convert the data to a Structure 2.3.1 application (Pritchard et al., 2000) format. The Structure 2.3.1 was used with the microsatellite data to provide the most reliable group-ing of the 60 olive entries, which was analyzed using a Bayesian method to select the most appropriate group number (K).
Powermarker Version 3.25 (Liu and Muse, 2005) was used to perform the summary statistical calculations for the polymorphic information content (PIC), genetic diversity of al-leles, observed heterozygosity, and number of alleles per loci. This program was used to create a matrix of genetic dissimilarity based on the chord distance (Cavalli-Sforza and Edwards,
561
©FUNPEC-RP www.funpecrp.com.brGenetics and Molecular Research 11 (1): 556-571 (2012)
Genetic diversity in olive germplasms
1967), and a phenotypic tree was generated using the neighbor-joining clustering method (Saitou and Nei, 1987).
We estimated the following parameters using the GenAlex 6 program (Peakall and Smouse, 2006): the probability of identity (PI) per locus and cumulative PI for all loci (Waits et al., 2001), the probability of exclusion, and the graphic dispersion via the principal coordinates analysis (PCoA) method. We also used a program to analyze the genetic variability within and between groups via analysis of the molecular variance (AMOVA; Excoffier et al., 2005).
RESULTS AND DISCUSSION
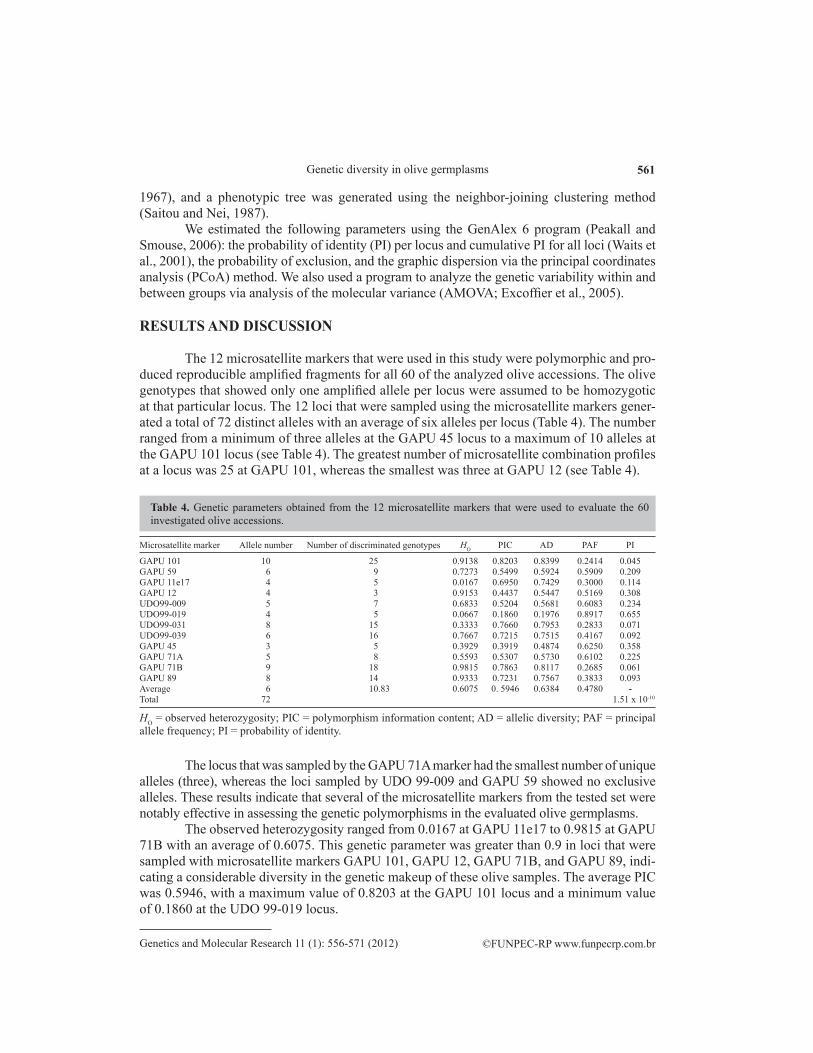
The 12 microsatellite markers that were used in this study were polymorphic and pro-duced reproducible amplified fragments for all 60 of the analyzed olive accessions. The olive genotypes that showed only one amplified allele per locus were assumed to be homozygotic at that particular locus. The 12 loci that were sampled using the microsatellite markers gener-ated a total of 72 distinct alleles with an average of six alleles per locus (Table 4). The number ranged from a minimum of three alleles at the GAPU 45 locus to a maximum of 10 alleles at the GAPU 101 locus (see Table 4). The greatest number of microsatellite combination profiles at a locus was 25 at GAPU 101, whereas the smallest was three at GAPU 12 (see Table 4).
Microsatellite marker Allele number Number of discriminated genotypes HO PIC AD PAF PI
GAPU 101 10 25 0.9138 0.8203 0.8399 0.2414 0.045GAPU 59 6 9 0.7273 0.5499 0.5924 0.5909 0.209GAPU 11e17 4 5 0.0167 0.6950 0.7429 0.3000 0.114GAPU 12 4 3 0.9153 0.4437 0.5447 0.5169 0.308UDO99-009 5 7 0.6833 0.5204 0.5681 0.6083 0.234UDO99-019 4 5 0.0667 0.1860 0.1976 0.8917 0.655UDO99-031 8 15 0.3333 0.7660 0.7953 0.2833 0.071UDO99-039 6 16 0.7667 0.7215 0.7515 0.4167 0.092GAPU 45 3 5 0.3929 0.3919 0.4874 0.6250 0.358GAPU 71A 5 8 0.5593 0.5307 0.5730 0.6102 0.225GAPU 71B 9 18 0.9815 0.7863 0.8117 0.2685 0.061GAPU 89 8 14 0.9333 0.7231 0.7567 0.3833 0.093Average 6 10.83 0.6075 0. 5946 0.6384 0.4780 -Total 72 1.51 x 10⁻¹⁰
Table 4. Genetic parameters obtained from the 12 microsatellite markers that were used to evaluate the 60 investigated olive accessions.
The locus that was sampled by the GAPU 71A marker had the smallest number of unique alleles (three), whereas the loci sampled by UDO 99-009 and GAPU 59 showed no exclusive alleles. These results indicate that several of the microsatellite markers from the tested set were notably effective in assessing the genetic polymorphisms in the evaluated olive germplasms.
The observed heterozygosity ranged from 0.0167 at GAPU 11e17 to 0.9815 at GAPU 71B with an average of 0.6075. This genetic parameter was greater than 0.9 in loci that were sampled with microsatellite markers GAPU 101, GAPU 12, GAPU 71B, and GAPU 89, indi-cating a considerable diversity in the genetic makeup of these olive samples. The average PIC was 0.5946, with a maximum value of 0.8203 at the GAPU 101 locus and a minimum value of 0.1860 at the UDO 99-019 locus.
HO = observed heterozygosity; PIC = polymorphism information content; AD = allelic diversity; PAF = principal allele frequency; PI = probability of identity.
562
©FUNPEC-RP www.funpecrp.com.brGenetics and Molecular Research 11 (1): 556-571 (2012)
A.D.B. do Val et al.
The PIC results indicated which of the 10 loci could be classified as highly informative (PIC > 0.5). Specifically, five of the loci could be classified as useful for genetic mapping (PIC > 0.7), as indicated by Roubos et al. (2010). The allelic diversity (AD) data suggested a posi-tive relationship with the PIC data. The average AD was 0.6384, and similar to the PIC values, the highest AD (0.8399) was found at the locus that was sampled with GAPU 101, whereas the lowest AD (0.1976) was obtained at the locus that was sampled with UDO 99-019.
The highest principal allele frequency (PAF) was 0.8917 at the UDO 99-019 locus. Interestingly, this same microsatellite marker had the lowest PIC and AD values (see Table 4). Conversely, the locus sampled by the GAPU 45 marker, which showed the lowest number of alleles present, displayed PAF, PIC, and AD results that were quite similar to those observed for UDO 99-019. The lowest observed PAF was at the locus sampled by GAPU 101, which had the highest allele number, PIC, and AD.
The magnitudes of the PI ranged from 0.045 to 0.655, which were observed at the GAPU 101 and UDO99-019 loci, respectively. Because a low PI value indicates high marker efficiency, the best markers according to PI were GAPU 101 (0.045), GAPU71B (0.061), and UDO99-031 (0.071). The total PI from the 12 microsatellite markers was 1.51 × 10⁻¹⁰
, indicat-ing that the set of markers that was tested in this study was notably effective at genotyping the sampled population.
The results described herein agree with other reports describing the use of microsatel-lite markers to study the genetic diversity of this species. Poljuha et al. (2008) evaluated 27 Croatian olive accessions with 12 microsatellite markers and detected 81 distinct alleles with an average of 6.75 alleles per locus. Their numbers are close to those observed in this study (see Table 4). These authors also observed that the UDO 99-019 locus contained four alleles, which was the same number observed in this study (see Table 4).
Chafari et al. (2008) genetically characterized 128 olive genotypes using 15 microsat-ellite markers. These authors detected 70 distinct alleles with a maximum allele number per locus of 10 at GAPU 101, which is similar to the results found here. Additional results that agree with our findings have been reported by Carriero et al. (2002), who obtained 10, 8, and 5 alleles per locus at the GAPU 101, GAPU 89, and GAPU 71A markers, respectively. This high level of agreement between several independent studies that were carried out in different places using different genotypes is an advantage of using microsatellite markers and also testi-fies to the accuracy of the results obtained in this study.
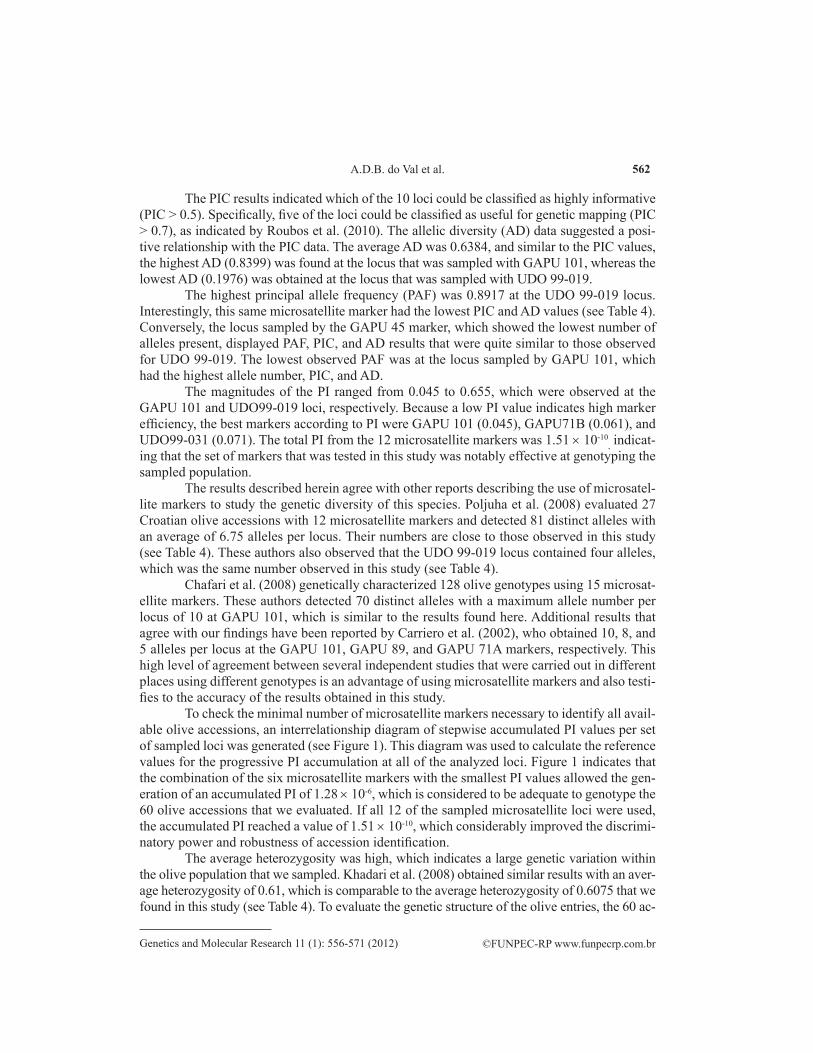
To check the minimal number of microsatellite markers necessary to identify all avail-able olive accessions, an interrelationship diagram of stepwise accumulated PI values per set of sampled loci was generated (see Figure 1). This diagram was used to calculate the reference values for the progressive PI accumulation at all of the analyzed loci. Figure 1 indicates that the combination of the six microsatellite markers with the smallest PI values allowed the gen-eration of an accumulated PI of 1.28 × 10⁻⁶, which is considered to be adequate to genotype the 60 olive accessions that we evaluated. If all 12 of the sampled microsatellite loci were used, the accumulated PI reached a value of 1.51 × 10⁻¹⁰, which considerably improved the discrimi-natory power and robustness of accession identification.
The average heterozygosity was high, which indicates a large genetic variation within the olive population that we sampled. Khadari et al. (2008) obtained similar results with an aver-age heterozygosity of 0.61, which is comparable to the average heterozygosity of 0.6075 that we found in this study (see Table 4). To evaluate the genetic structure of the olive entries, the 60 ac-
563
©FUNPEC-RP www.funpecrp.com.brGenetics and Molecular Research 11 (1): 556-571 (2012)
Genetic diversity in olive germplasms
cessions were grouped using the computer application Structure 2.3.1. This approach facilitated the elimination of the ancestral type by identifying the allele origin, which therefore provided the most likely genotype grouping based on the similarity of their allelic makeup (Erre et al., 2010).
Figure 1. The probability of identity (PI) based on the accumulated PI value of each locus evaluated.
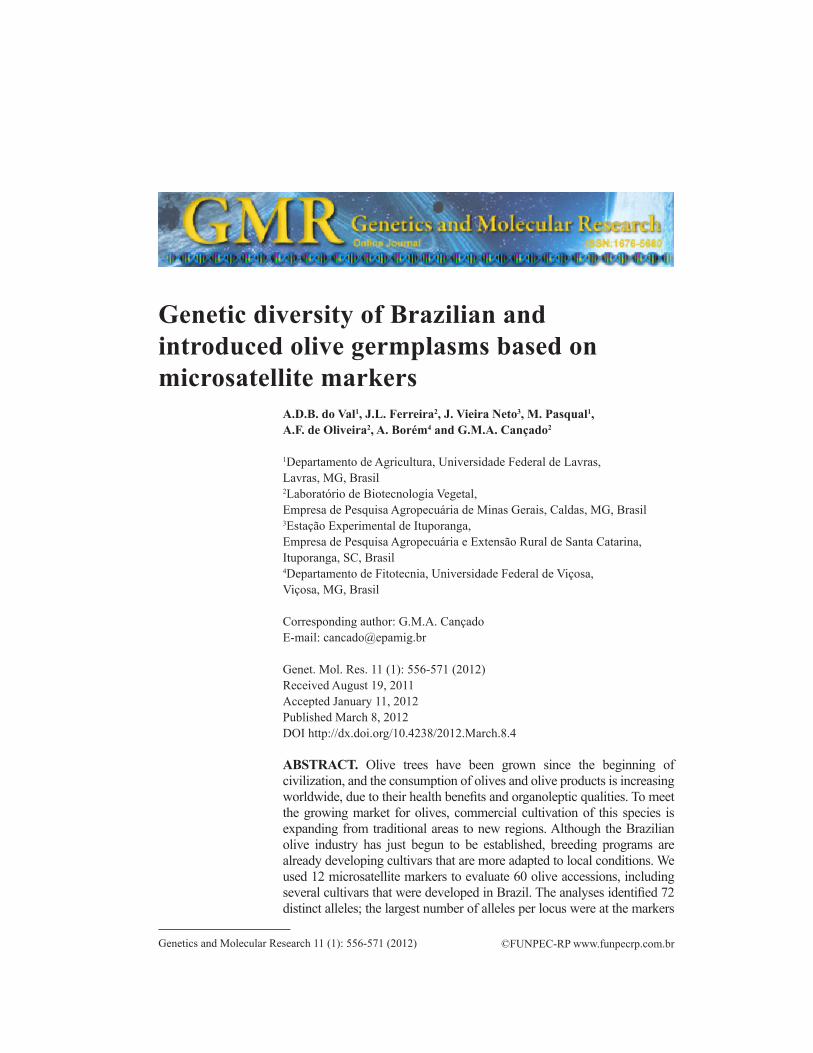
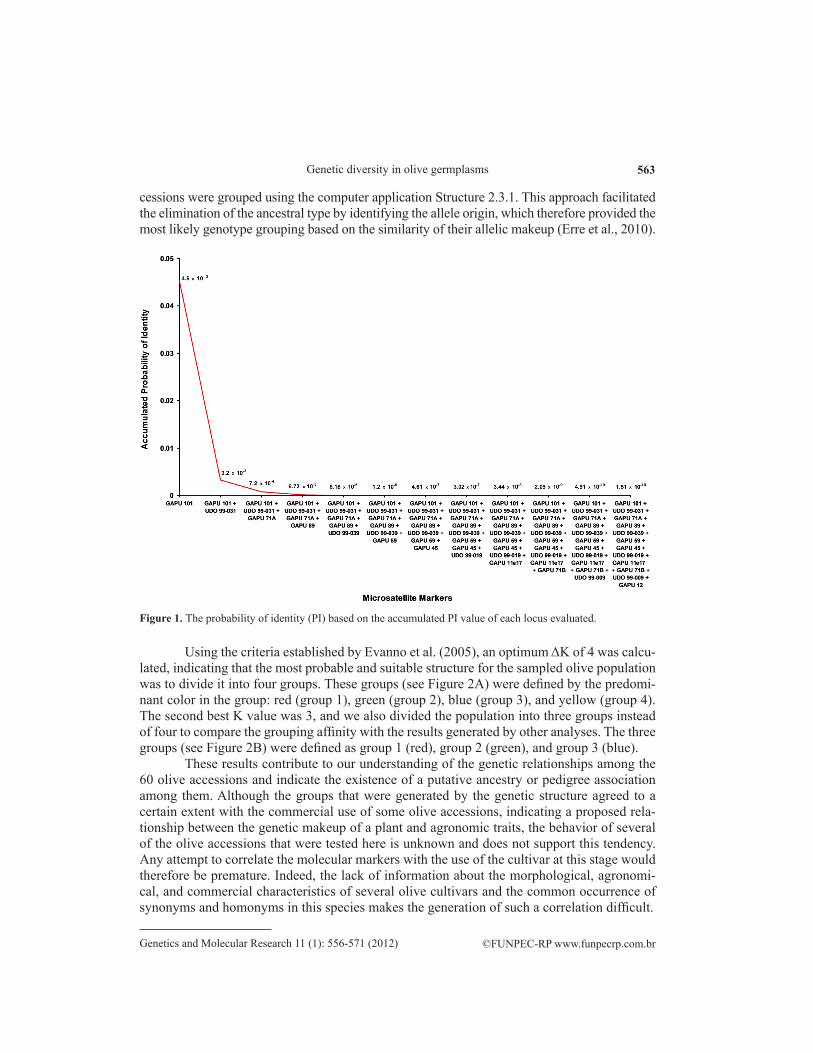
Using the criteria established by Evanno et al. (2005), an optimum ΔK of 4 was calcu-lated, indicating that the most probable and suitable structure for the sampled olive population was to divide it into four groups. These groups (see Figure 2A) were defined by the predomi-nant color in the group: red (group 1), green (group 2), blue (group 3), and yellow (group 4). The second best K value was 3, and we also divided the population into three groups instead of four to compare the grouping affinity with the results generated by other analyses. The three groups (see Figure 2B) were defined as group 1 (red), group 2 (green), and group 3 (blue).
These results contribute to our understanding of the genetic relationships among the 60 olive accessions and indicate the existence of a putative ancestry or pedigree association among them. Although the groups that were generated by the genetic structure agreed to a certain extent with the commercial use of some olive accessions, indicating a proposed rela-tionship between the genetic makeup of a plant and agronomic traits, the behavior of several of the olive accessions that were tested here is unknown and does not support this tendency. Any attempt to correlate the molecular markers with the use of the cultivar at this stage would therefore be premature. Indeed, the lack of information about the morphological, agronomi-cal, and commercial characteristics of several olive cultivars and the common occurrence of synonyms and homonyms in this species makes the generation of such a correlation difficult.
564
©FUNPEC-RP www.funpecrp.com.brGenetics and Molecular Research 11 (1): 556-571 (2012)
A.D.B. do Val et al.
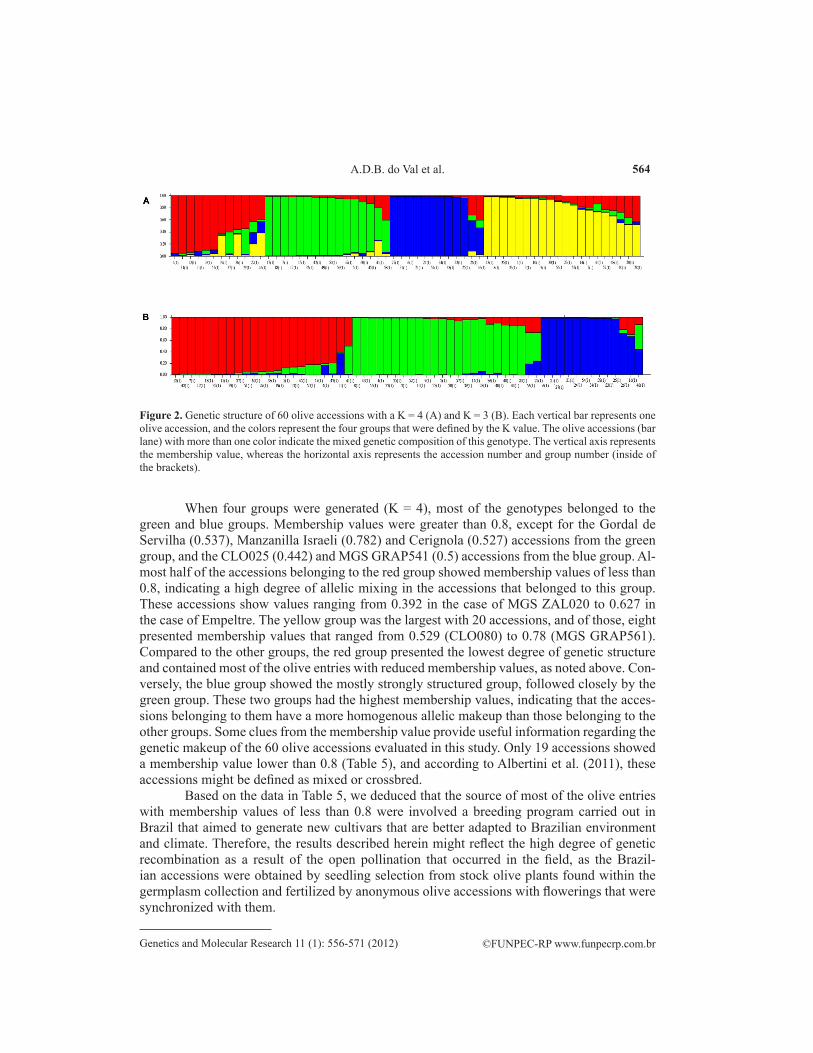
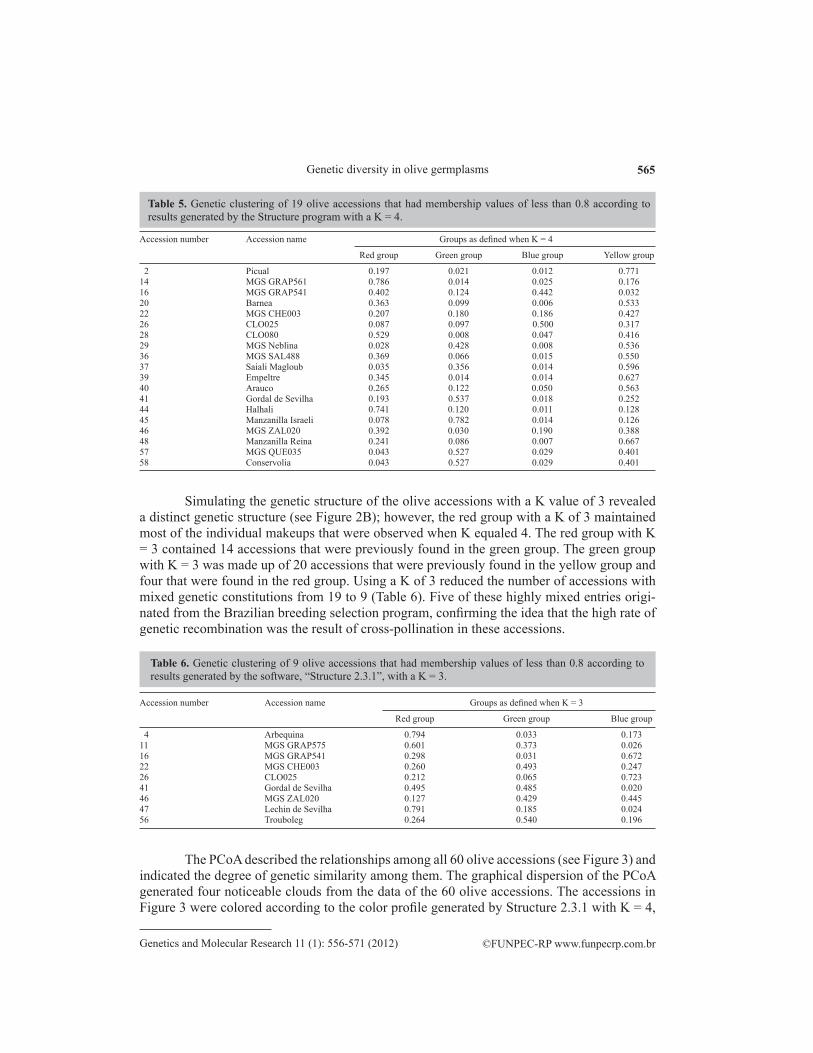
When four groups were generated (K = 4), most of the genotypes belonged to the green and blue groups. Membership values were greater than 0.8, except for the Gordal de Servilha (0.537), Manzanilla Israeli (0.782) and Cerignola (0.527) accessions from the green group, and the CLO025 (0.442) and MGS GRAP541 (0.5) accessions from the blue group. Al-most half of the accessions belonging to the red group showed membership values of less than 0.8, indicating a high degree of allelic mixing in the accessions that belonged to this group. These accessions show values ranging from 0.392 in the case of MGS ZAL020 to 0.627 in the case of Empeltre. The yellow group was the largest with 20 accessions, and of those, eight presented membership values that ranged from 0.529 (CLO080) to 0.78 (MGS GRAP561). Compared to the other groups, the red group presented the lowest degree of genetic structure and contained most of the olive entries with reduced membership values, as noted above. Con-versely, the blue group showed the mostly strongly structured group, followed closely by the green group. These two groups had the highest membership values, indicating that the acces-sions belonging to them have a more homogenous allelic makeup than those belonging to the other groups. Some clues from the membership value provide useful information regarding the genetic makeup of the 60 olive accessions evaluated in this study. Only 19 accessions showed a membership value lower than 0.8 (Table 5), and according to Albertini et al. (2011), these accessions might be defined as mixed or crossbred.
Based on the data in Table 5, we deduced that the source of most of the olive entries with membership values of less than 0.8 were involved a breeding program carried out in Brazil that aimed to generate new cultivars that are better adapted to Brazilian environment and climate. Therefore, the results described herein might reflect the high degree of genetic recombination as a result of the open pollination that occurred in the field, as the Brazil-ian accessions were obtained by seedling selection from stock olive plants found within the germplasm collection and fertilized by anonymous olive accessions with flowerings that were synchronized with them.
Figure 2. Genetic structure of 60 olive accessions with a K = 4 (A) and K = 3 (B). Each vertical bar represents one olive accession, and the colors represent the four groups that were defined by the K value. The olive accessions (bar lane) with more than one color indicate the mixed genetic composition of this genotype. The vertical axis represents the membership value, whereas the horizontal axis represents the accession number and group number (inside of the brackets).
565
©FUNPEC-RP www.funpecrp.com.brGenetics and Molecular Research 11 (1): 556-571 (2012)
Genetic diversity in olive germplasms
Simulating the genetic structure of the olive accessions with a K value of 3 revealed a distinct genetic structure (see Figure 2B); however, the red group with a K of 3 maintained most of the individual makeups that were observed when K equaled 4. The red group with K = 3 contained 14 accessions that were previously found in the green group. The green group with K = 3 was made up of 20 accessions that were previously found in the yellow group and four that were found in the red group. Using a K of 3 reduced the number of accessions with mixed genetic constitutions from 19 to 9 (Table 6). Five of these highly mixed entries origi-nated from the Brazilian breeding selection program, confirming the idea that the high rate of genetic recombination was the result of cross-pollination in these accessions.
Accession number Accession name Groups as defined when K = 4
Red group Green group Blue group Yellow group
2 Picual 0.197 0.021 0.012 0.77114 MGS GRAP561 0.786 0.014 0.025 0.17616 MGS GRAP541 0.402 0.124 0.442 0.03220 Barnea 0.363 0.099 0.006 0.53322 MGS CHE003 0.207 0.180 0.186 0.42726 CLO025 0.087 0.097 0.500 0.31728 CLO080 0.529 0.008 0.047 0.41629 MGS Neblina 0.028 0.428 0.008 0.53636 MGS SAL488 0.369 0.066 0.015 0.55037 Saiali Magloub 0.035 0.356 0.014 0.59639 Empeltre 0.345 0.014 0.014 0.62740 Arauco 0.265 0.122 0.050 0.56341 Gordal de Sevilha 0.193 0.537 0.018 0.25244 Halhali 0.741 0.120 0.011 0.12845 Manzanilla Israeli 0.078 0.782 0.014 0.12646 MGS ZAL020 0.392 0.030 0.190 0.38848 Manzanilla Reina 0.241 0.086 0.007 0.66757 MGS QUE035 0.043 0.527 0.029 0.40158 Conservolia 0.043 0.527 0.029 0.401
Table 5. Genetic clustering of 19 olive accessions that had membership values of less than 0.8 according to results generated by the Structure program with a K = 4.
Accession number Accession name Groups as defined when K = 3
Red group Green group Blue group
4 Arbequina 0.794 0.033 0.17311 MGS GRAP575 0.601 0.373 0.02616 MGS GRAP541 0.298 0.031 0.67222 MGS CHE003 0.260 0.493 0.24726 CLO025 0.212 0.065 0.72341 Gordal de Sevilha 0.495 0.485 0.02046 MGS ZAL020 0.127 0.429 0.44547 Lechin de Sevilha 0.791 0.185 0.02456 Trouboleg 0.264 0.540 0.196
Table 6. Genetic clustering of 9 olive accessions that had membership values of less than 0.8 according to results generated by the software, “Structure 2.3.1”, with a K = 3.
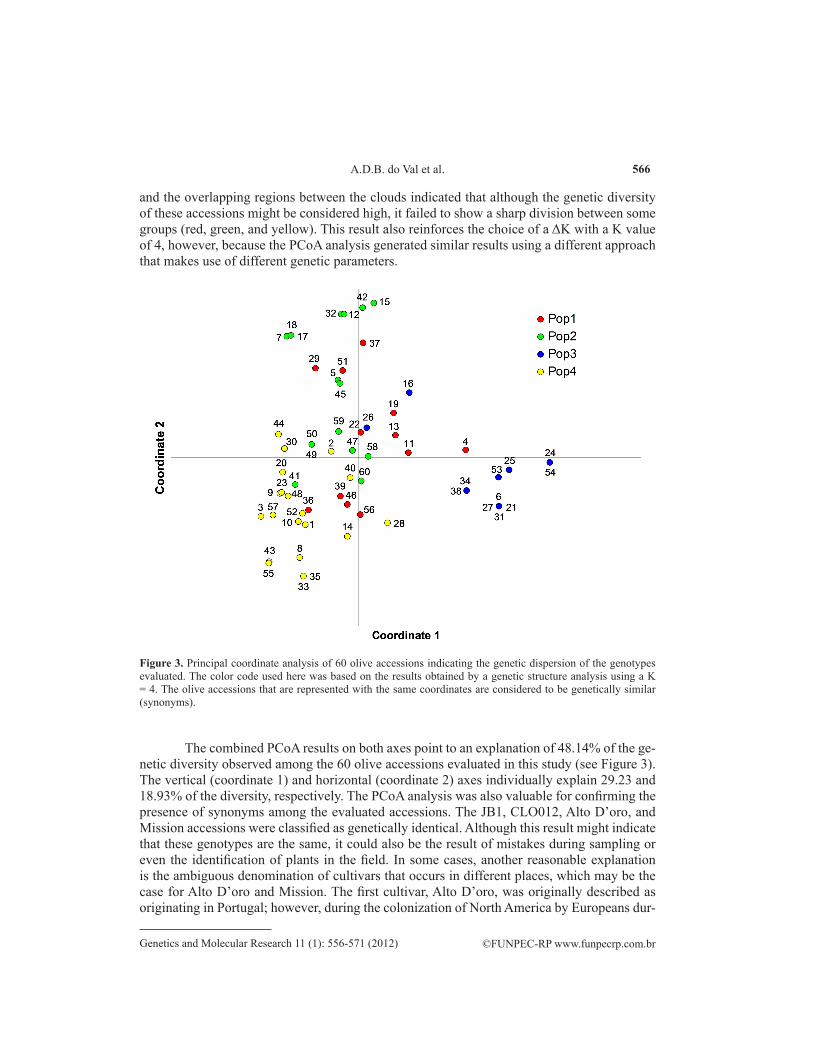
The PCoA described the relationships among all 60 olive accessions (see Figure 3) and indicated the degree of genetic similarity among them. The graphical dispersion of the PCoA generated four noticeable clouds from the data of the 60 olive accessions. The accessions in Figure 3 were colored according to the color profile generated by Structure 2.3.1 with K = 4,
566
©FUNPEC-RP www.funpecrp.com.brGenetics and Molecular Research 11 (1): 556-571 (2012)
A.D.B. do Val et al.
and the overlapping regions between the clouds indicated that although the genetic diversity of these accessions might be considered high, it failed to show a sharp division between some groups (red, green, and yellow). This result also reinforces the choice of a ΔK with a K value of 4, however, because the PCoA analysis generated similar results using a different approach that makes use of different genetic parameters.
Figure 3. Principal coordinate analysis of 60 olive accessions indicating the genetic dispersion of the genotypes evaluated. The color code used here was based on the results obtained by a genetic structure analysis using a K = 4. The olive accessions that are represented with the same coordinates are considered to be genetically similar (synonyms).
The combined PCoA results on both axes point to an explanation of 48.14% of the ge-netic diversity observed among the 60 olive accessions evaluated in this study (see Figure 3). The vertical (coordinate 1) and horizontal (coordinate 2) axes individually explain 29.23 and 18.93% of the diversity, respectively. The PCoA analysis was also valuable for confirming the presence of synonyms among the evaluated accessions. The JB1, CLO012, Alto D’oro, and Mission accessions were classified as genetically identical. Although this result might indicate that these genotypes are the same, it could also be the result of mistakes during sampling or even the identification of plants in the field. In some cases, another reasonable explanation is the ambiguous denomination of cultivars that occurs in different places, which may be the case for Alto D’oro and Mission. The first cultivar, Alto D’oro, was originally described as originating in Portugal; however, during the colonization of North America by Europeans dur-
567
©FUNPEC-RP www.funpecrp.com.brGenetics and Molecular Research 11 (1): 556-571 (2012)
Genetic diversity in olive germplasms
ing the 1500s and 1600s, Jesuit missionaries from Spain introduced this cultivar to the USA under a second name, Mission. The Alto D’oro cultivar was originally created in the region of the Alto d’Oro river near the northern portion of the border of Spain and Portugal. Therefore, Alto D’oro and Mission have the same olive genotype. The sources of the JB1 and CLO012 accessions are unknown, which may explain their coincidence with other genotypes. These re-sults confirm the high accuracy of the set of microsatellite markers used in this study and their ability to detect the presence of synonyms among the investigated olive accessions.
The occurrence of additional synonyms was detected after data analysis, including MGS TAF390, which was identified as being similar to MGS ASC323; ZAL010, which was identified as being similar to Zalmate; Negroa, which was identified as being similar to Galega, Ascolano USA, Santa Catalina, MGS ROP398, and the “unidentified genotype”, all of which were classified as having the same genotype. According to Gouveia (2008), the denominations Negroa and Galega are common names that refer to the same genotype, the point of origin of which is believed to have been Portugal.
Synonymy in olives is a frequently reported problem (Carriero et al., 2002; Cipriani et al., 2002; Chafari et al., 2008; Khadari et al., 2008; Poljuha et al., 2008; Baldoni et al., 2009; Bracci et al., 2011). Indeed, the lack of an international organization responsible for standard-izing names and cultivars and the limited centralization and availability of information about this species, which is associated with the global diffusion of olive plantlets and seedlings, makes the occurrence of synonymy and homonymy even more common now.
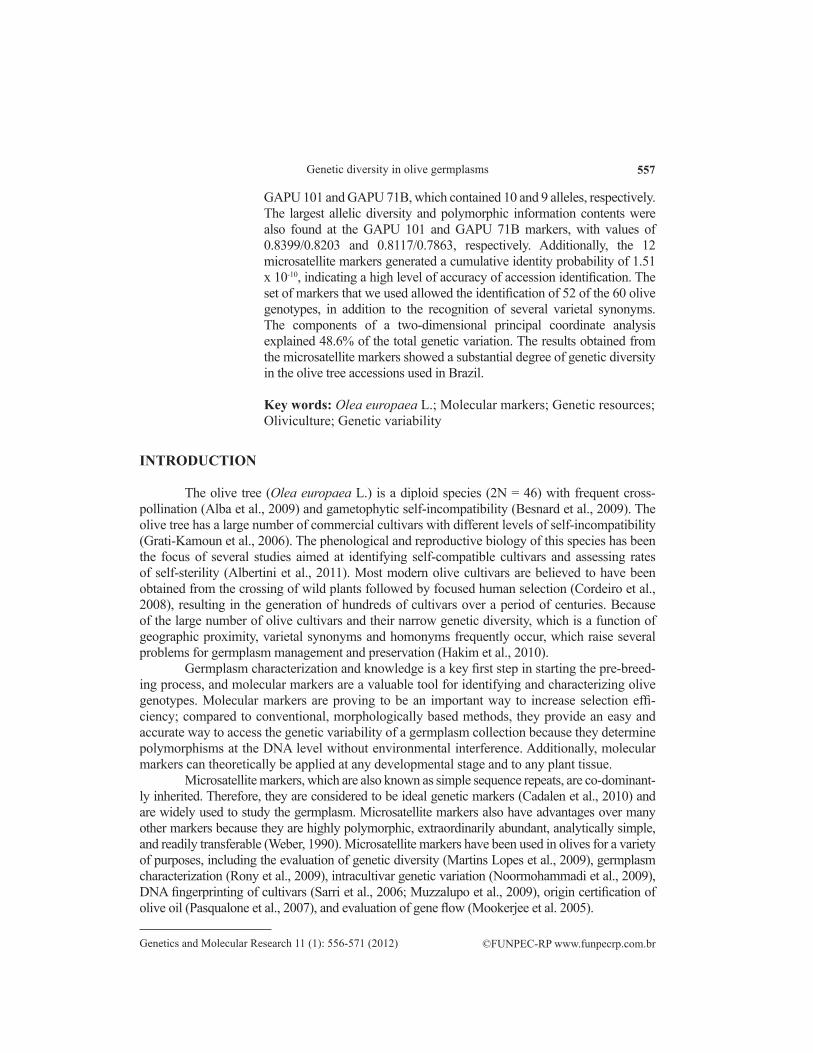
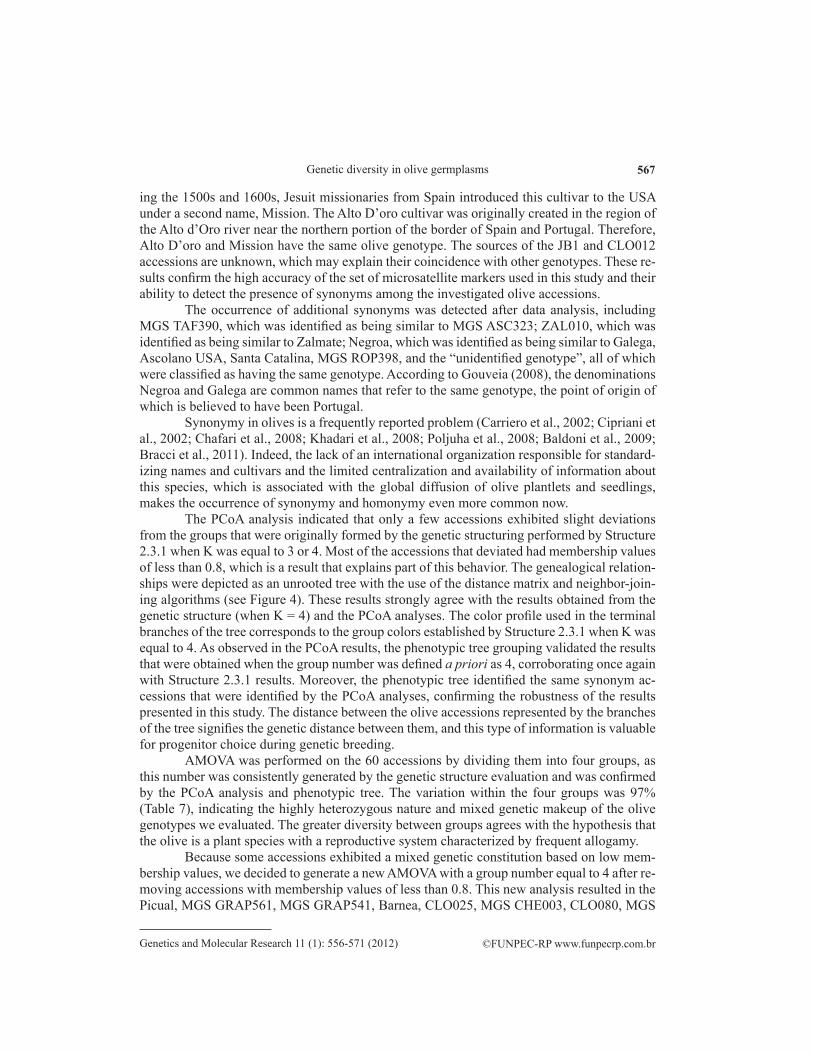
The PCoA analysis indicated that only a few accessions exhibited slight deviations from the groups that were originally formed by the genetic structuring performed by Structure 2.3.1 when K was equal to 3 or 4. Most of the accessions that deviated had membership values of less than 0.8, which is a result that explains part of this behavior. The genealogical relation-ships were depicted as an unrooted tree with the use of the distance matrix and neighbor-join-ing algorithms (see Figure 4). These results strongly agree with the results obtained from the genetic structure (when K = 4) and the PCoA analyses. The color profile used in the terminal branches of the tree corresponds to the group colors established by Structure 2.3.1 when K was equal to 4. As observed in the PCoA results, the phenotypic tree grouping validated the results that were obtained when the group number was defined a priori as 4, corroborating once again with Structure 2.3.1 results. Moreover, the phenotypic tree identified the same synonym ac-cessions that were identified by the PCoA analyses, confirming the robustness of the results presented in this study. The distance between the olive accessions represented by the branches of the tree signifies the genetic distance between them, and this type of information is valuable for progenitor choice during genetic breeding.
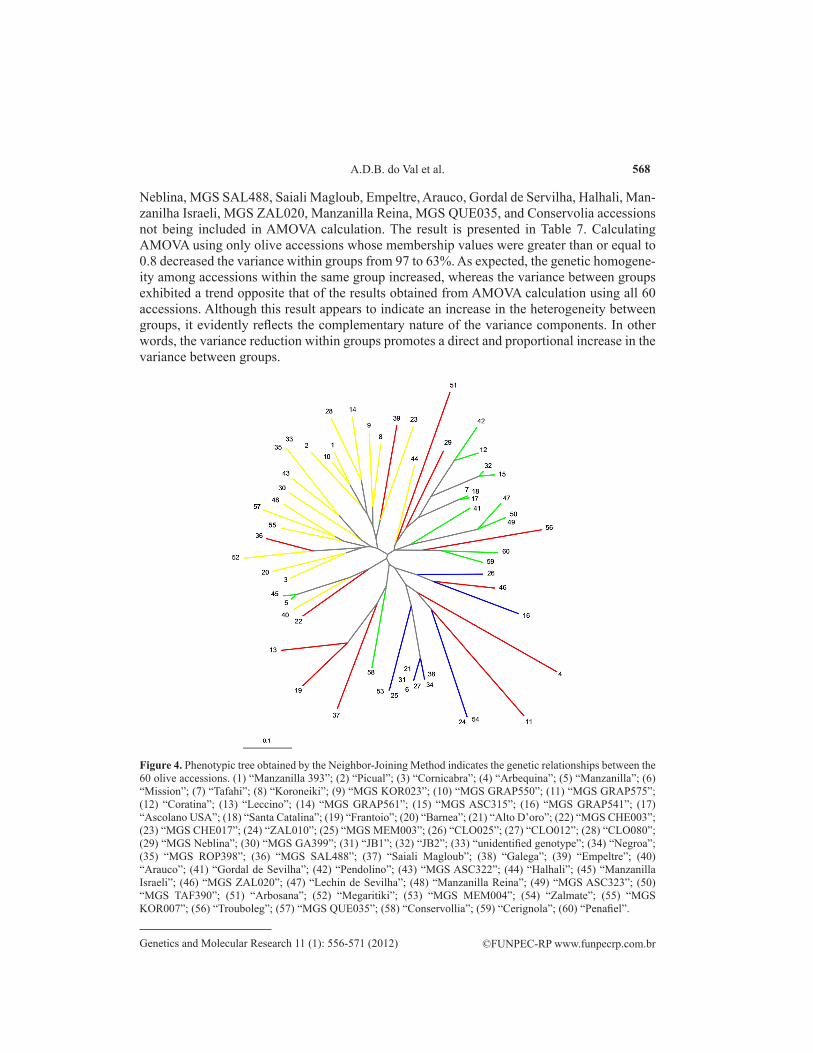
AMOVA was performed on the 60 accessions by dividing them into four groups, as this number was consistently generated by the genetic structure evaluation and was confirmed by the PCoA analysis and phenotypic tree. The variation within the four groups was 97% (Table 7), indicating the highly heterozygous nature and mixed genetic makeup of the olive genotypes we evaluated. The greater diversity between groups agrees with the hypothesis that the olive is a plant species with a reproductive system characterized by frequent allogamy.
Because some accessions exhibited a mixed genetic constitution based on low mem-bership values, we decided to generate a new AMOVA with a group number equal to 4 after re-moving accessions with membership values of less than 0.8. This new analysis resulted in the Picual, MGS GRAP561, MGS GRAP541, Barnea, CLO025, MGS CHE003, CLO080, MGS
568
©FUNPEC-RP www.funpecrp.com.brGenetics and Molecular Research 11 (1): 556-571 (2012)
A.D.B. do Val et al.
Neblina, MGS SAL488, Saiali Magloub, Empeltre, Arauco, Gordal de Servilha, Halhali, Man-zanilha Israeli, MGS ZAL020, Manzanilla Reina, MGS QUE035, and Conservolia accessions not being included in AMOVA calculation. The result is presented in Table 7. Calculating AMOVA using only olive accessions whose membership values were greater than or equal to 0.8 decreased the variance within groups from 97 to 63%. As expected, the genetic homogene-ity among accessions within the same group increased, whereas the variance between groups exhibited a trend opposite that of the results obtained from AMOVA calculation using all 60 accessions. Although this result appears to indicate an increase in the heterogeneity between groups, it evidently reflects the complementary nature of the variance components. In other words, the variance reduction within groups promotes a direct and proportional increase in the variance between groups.
Figure 4. Phenotypic tree obtained by the Neighbor-Joining Method indicates the genetic relationships between the 60 olive accessions. (1) “Manzanilla 393”; (2) “Picual”; (3) “Cornicabra”; (4) “Arbequina”; (5) “Manzanilla”; (6) “Mission”; (7) “Tafahi”; (8) “Koroneiki”; (9) “MGS KOR023”; (10) “MGS GRAP550”; (11) “MGS GRAP575”; (12) “Coratina”; (13) “Leccino”; (14) “MGS GRAP561”; (15) “MGS ASC315”; (16) “MGS GRAP541”; (17) “Ascolano USA”; (18) “Santa Catalina”; (19) “Frantoio”; (20) “Barnea”; (21) “Alto D’oro”; (22) “MGS CHE003”; (23) “MGS CHE017”; (24) “ZAL010”; (25) “MGS MEM003”; (26) “CLO025”; (27) “CLO012”; (28) “CLO080”; (29) “MGS Neblina”; (30) “MGS GA399”; (31) “JB1”; (32) “JB2”; (33) “unidentified genotype”; (34) “Negroa”; (35) “MGS ROP398”; (36) “MGS SAL488”; (37) “Saiali Magloub”; (38) “Galega”; (39) “Empeltre”; (40) “Arauco”; (41) “Gordal de Sevilha”; (42) “Pendolino”; (43) “MGS ASC322”; (44) “Halhali”; (45) “Manzanilla Israeli”; (46) “MGS ZAL020”; (47) “Lechin de Sevilha”; (48) “Manzanilla Reina”; (49) “MGS ASC323”; (50) “MGS TAF390”; (51) “Arbosana”; (52) “Megaritiki”; (53) “MGS MEM004”; (54) “Zalmate”; (55) “MGS KOR007”; (56) “Trouboleg”; (57) “MGS QUE035”; (58) “Conservollia”; (59) “Cerignola”; (60) “Penafiel”.
569
©FUNPEC-RP www.funpecrp.com.brGenetics and Molecular Research 11 (1): 556-571 (2012)
Genetic diversity in olive germplasms
In olive trees, the identification of synonymy and homonymy is common. In some cases, cultivars with similar genotypes have multiple names, whereas in other cases, cultivars with the same name have different genetic constitutions. We identified several occurrences of synonymy using the same set of microsatellite markers that were applied to evaluate the population; however, only one suspected case of homonymy was detected. The identity of a tissue sample collected from an entry labeled MGS Mariense could not be confirmed because the genetic profile of the sample was 100% identical to the genetic profile of MGS ROD 398 (data not shown). Afterward, a new sample collected from other accession plants of MGS Mariense confirmed that an erroneous labeling of the genotype in the field was responsible for the mistake. Conversely, we detected 12 cases of synonymy in the 60 evaluated accessions based on the allelic profile that was generated by the 12 microsatellite markers. These cases are listed in Table 8.
Source of variation 60 olive accessions
d.f. SSD MSD Estimated variance % of variance
Between groups 3 37.088 12.363 0.267 3Within groups 56 471.279 8.416 8.416 97Total 59 508.367 8.683 100
Source of Variation 41 olive accessions
d.f. SSD MSD Estimated variance % of variance
Between groups 3 121.603 40.534 3.469 37Within groups 37 214.275 5.791 5.791 63Total 40 335.877 9.574 100
Table 7. Analysis of the molecular variance results based on 12 microsatellite markers that were observed in a population of 60 and 41 olive accessions.
Synonymy Common names
01 Mission, Alto D’oro, CLO012, JB102 Ascolano USA and Santa Catalina03 ZAL010 and Zalmate04 MGS ASC323 and MGS TAF39005 Negroa and Galega
Table 8. Olive genotypes identified as synonyms after analyses of the 12 microsatellite loci and their respective common names.
A probability of exclusion of 0.999995032337924 was calculated for the 12 microsat-ellite markers, which means that the chance of any accession having been incorrectly charac-terized as synonymous when it was not was only 0.000005%. In fact, these results support the idea that the 12 cases of synonymy contained only five distinct genotypes instead of 12, as is suggested by the different names. Nevertheless, the results from the microsatellite markers do not rule out the possibility of a mistake in the field with regard to the labeling of some of the olive accessions or even the sampling of the wrong plant.
The olive accessions studied in this study constitute a population with a broad and varied genetic basis that contains genotypes with distinct genetic profiles. Interestingly, most of the putative Brazilian olive genotypes (12 of the 28) described in Table 2 were grouped in
d.f. = degrees of freedom; SSD = sums of squared deviations; MSD = mean square deviations.
570
©FUNPEC-RP www.funpecrp.com.brGenetics and Molecular Research 11 (1): 556-571 (2012)
A.D.B. do Val et al.
the yellow group (K = 4), as showed in Figures 2A and 3, whereas the accession Arbequina, which is assumed to have originated in Spain, could not be grouped well with the other acces-sions (see Figures 3 and 4), indicating the variability of this population.
The membership values obtained herein strongly suggest the existence of common ancestors in the genetic backgrounds of many of the accessions we evaluated. The genetic recombination rates that were observed in seedlings obtained from seeds generated by open pollination promote genetic variation and were confirmed by the relatively large number of groups defined by Structure 2.3.1 (K = 4).
We conclude that microsatellite markers such as GAPU 101, GAPU 71B, UDO99-039, UDO99-031, GAPU 89, and GAPU 59 may be efficiently and routinely used as molecu-lar descriptors of cultivars for the DNA fingerprint segregation of olive populations as well as to address patent issues. Additionally, the results presented herein are valuable to breeding programs because they indicate the existence of substantial genetic variability in the sampled olive population.
ACKNOWLEDGMENTS
The authors thank the Minas Gerais Research Foundation (FAPEMIG), the Coordina-tion for the Improvement of Higher Education Personnel (CAPES), the Funding Agency of Studies and Projects (FINEP), the National Council for Scientific and Technological Develop-ment (CNPq), and the Brazilian Agricultural Research Corporation (EMBRAPA) for financial support and scholarships.
REFERENCES
Alba V, Montemurro C, Sabetta W, Pasqualone A, et al. (2009). SSR-based identification key of cultivars of Olea europaea L. diffused in Southern-Italy. Sci. Horticult. 123: 11-16.
Albertini E, Torricelli R, Bitocchi E, Raggi L, et al. (2011). Structure of genetic diversity in Olea europaea L. cultivars from central Italy. Mol. Breed. 27: 533-547.
Baldoni L, Cultrera NG, Mariotti R, Ricciolini C, et al. (2009). A consensus list of microsatellite markers for olive genotyping. Mol. Breed. 24: 213-231.
Besnard G, Baali-Cherif D, Bettinelli-Riccardi S, Parietti D, et al. (2009). Pollen-mediated gene flow in a highly fragmented landscape: consequences for defining a conservation strategy of the relict Laperrine’s olive. C R Biol. 332: 662-672.
Bracci T, Busconi M, Fogher C and Sebastiani L (2011). Molecular studies in olive (Olea europaea L.): overview on DNA markers applications and recent advances in genome analysis. Plant Cell Rep. 30: 449-462.
Cadalen T, Mörchen M, Blassiau C, Clabaut A, et al. (2010). Development of SSR markers and construction of a consensus genetic map for chicory (Cichorium intybus L.). Mol. Breed. 25: 699-722.
Carriero F, Fontanazza G, Cellini F and Giorio G (2002). Identification of simple sequence repeats (SSRs) in olive (Olea europaea L.). Theor. Appl. Genet. 104: 301-307.
Cavalli-Sforza LL and Edwards AW (1967). Phylogenetic analysis. Models and estimation procedures. Am. J. Hum. Genet. 19: 233-257.
Chafari J, Meziane AE, Moukhli A, Boulouha B, et al. (2008). Menara gardens: a Moroccan olive germplasm collection identified by a SSR locus-based genetic study. Genet. Resour. Crop Evol. 55: 893-900.
Cipriani G, Marrazzo MT, Marconi R, Cimato A, et al. (2002). Microsatellite markers isolated in olive (Olea europaea L.) are suitable for individual fingerprinting and reveal polymorphism within ancient cultivars. Theor. Appl. Genet. 104: 223-228.
Cordeiro AI, Sanchez-Sevilla JF, Alvarez-Tinaut MC and Gomez-Jimenez MC (2008). Genetic diversity assessment in Portugal accessions of Olea europaea by RAPD markers. Bio. Plant 52: 642-647.
Creste S, Tulmann-Neto A and Figueira A (2001). Detection of single sequence repeat polymorphisms in denaturing polyacrylamide sequencing gels by silver staining. Plant Mol. Biol. Rep. 4: 299-306.
571
©FUNPEC-RP www.funpecrp.com.brGenetics and Molecular Research 11 (1): 556-571 (2012)
Genetic diversity in olive germplasms
Doyle JJ and Doyle JL (1990). Isolation of plant DNA from fresh tissue. Focus 12: 13-15.Erre P, Chessa I, Umñoz-Diez C, Belaj A, et al. (2010). Genetic diversity and relationships between wild and cultivated
olives (Olea europaea L.) in Sardinia as assessed by SSR markers. Genet. Resour. Crop Evol. 57: 41-54.Evanno G, Regnaut S and Goudet J (2005). Detecting the number of clusters of individuals using the software
STRUCTURE: a simulation study. Mol. Ecol. 14: 2611-2620.Excoffier L, Laval G and Schneider S (2005). Arlequin (version 3.0): an integrated software package for population
genetics data analysis. Evol. Bioinform. Online 1: 47-50.Glaubitz JC (2004). Convert: a user-friendly program to reformat diploid genotypic data for commonly used population
genetic software packages. Mol. Ecol. Not 4: 309-310.Gorji AH and Zolnoori M (2011). Genetic diversity in hexaploid wheat genotypes using microsatellite markers. Asian J.l
Biotechnol. 3: 368-377.Gouveia JMNB (2008). O Azeite da “Galega Vulgar”, Patrimônio Nacional. Available at [http://www.esa.ipsantarem.pt/
newsletter/N6Marco2008/index_ficheiros/JoseGouveia.pdf]. Accessed June 9, 2011. Grati-Kamoun N, Mahmoud FL, Rebaï A, Gargouri A, et al. (2006). Genetic diversity of Tunisian olive tree (Olea
europaea L.) cultivars assessed by AFLP markers. Genet. Resour. Crop Evol. 53: 265-275.Hakim IR, Kammoun NG, Makhloufi E and Rebaï A (2010). Discovery and potential of snp markers in characterization
of tunisian olive germplasm. Diversity 2: 17-27.Khadari B, Charafi J, Moukhli A and Ater M (2008). Substantial genetic diversity in cultivated Moroccan olive despite a
single major cultivar: a paradoxical situation evidenced by the use of SSR loci. Tree Gen. Gen. 4: 213-221.Liu K and Muse SV (2005). PowerMarker: an integrated analysis environment for genetic marker analysis. Bioinformatics
21: 2128-2129.Martins-Lopes P, Gomes S, Lima-Brito J, Lopes J, et al. (2009). Assessment of clonal genetic variability in Olea europaea
L. “Cobrançosa” by molecular markers. Sci. Horticult. 123: 82-89.Mookerjee S, Guerin J, Collins G, Ford C, et al. (2005). Paternity analysis using microsatellite markers to identify pollen
donors in an olive grove. Theor. Appl. Genet. 111: 1174-1182.Muzzalupo I, Stefanizzi F, Salimonti A, Falabella R, et al. (2009). Microsatellite markers for identification of a group of
italian olive accessions. Sci. Agric. 66: 685-690.Noormohammadi Z, Hosseini-Mazinani M, Trujillo I and Angjelina B (2009). Study of intracultivar variation among main
Iranian olive cultivars using SSR markers. Acta Biol. Szegediensis 53: 27-32.Pasqualone A, Montemurro C, Summo C, Sabetta W, et al. (2007). Effectiveness of microsatellite DNA markers in
checking the identity of protected designation of origin extra virgin olive oil. J. Agric. Food Chem. 55: 3857-3862.Peakall R and Smouse PE (2006). Genalex 6: genetic analysis in Excel. Population genetic software for teaching and
research. Mol. Ecol. Not 6: 288-295.Poljuha D, Sladonja B, Šetić E, Milotić A, et al. (2008). DNA fingerprinting of olive varieties in Istria (Croatia) by
microsatellite markers. Sci. Horticult. 115: 223-230.Pritchard JK, Stephens M and Donnelly P (2000). Inference of population structure using multilocus genotype data.
Genetics 155: 945-959.Rony C, Baalbaki R, Kalaitzis P and Talhouk SN (2009). Molecular characterization of Lebanese olive germplasm. Tree
Gen. Gen. 5: 109-115.Roubos K, Moustakas M and Aravanopoulos FA (2010). Molecular identification of Greek olive (Olea europaea) cultivars
based on microsatellite loci. Genet. Mol. Res. 9: 1865-1876.Saitou N and Nei M (1987). The neighbor-joining method: a new method for reconstructing phylogenetic trees. Mol. Biol.
Evol. 4: 406-425.Sarri V, Baldoni L, Porceddu A, Cultrera NG, et al. (2006). Microsatellite markers are powerful tools for discriminating
among olive cultivars and assigning them to geographically defined populations. Genome 49: 1606-1615.Spennemann DHR and Allen LR (2000). Feral olives (Olea europaea) as future woody weeds in Australia: A review. Aust.
J. Exp. Agricult. 40: 889-901.Waits LP, Luikart G and Taberlet P (2001). Estimating the probability of identity among genotypes in natural populations:
cautions and guidelines. Mol. Ecol. 10: 249-256.Weber JL (1990). Informativeness of human (dC-dA)n.(dG-dT)n polymorphisms. Genomics 7: 524-530.