Embed Size (px)
Citation preview
Genetic Loci Associated with Plasma Phospholipid n-3Fatty Acids: A Meta-Analysis of Genome-WideAssociation Studies from the CHARGE ConsortiumRozenn N. Lemaitre1.*, Toshiko Tanaka2., Weihong Tang3., Ani Manichaikul4., Millennia Foy5.,
Edmond K. Kabagambe6, Jennifer A. Nettleton7, Irena B. King8, Lu-Chen Weng3, Sayanti Bhattacharya9,
Stefania Bandinelli10, Joshua C. Bis1, Stephen S. Rich11, David R. Jacobs, Jr.3, Antonio Cherubini12,
Barbara McKnight13, Shuang Liang14, Xiangjun Gu5, Kenneth Rice13, Cathy C. Laurie13, Thomas
Lumley15, Brian L. Browning16, Bruce M. Psaty1,17,18, Yii-Der I. Chen19, Yechiel Friedlander20, Luc
Djousse21,22, Jason H. Y. Wu23,24, David S. Siscovick1,25, Andre G. Uitterlinden26, Donna K. Arnett6, Luigi
Ferrucci2", Myriam Fornage5,7", Michael Y. Tsai14", Dariush Mozaffarian23,27", Lyn M. Steffen3"
1 Cardiovascular Health Research Unit, Department of Medicine, University of Washington, Seattle, Washington, United States of America, 2 Clinical Research Branch,
National Institute on Aging, National Institutes of Health, Baltimore, Maryland, United States of America, 3 Division of Epidemiology and Community Health, School of
Public Health, University of Minnesota, Minneapolis, Minnesota, United States of America, 4 Center for Public Health Genomics, Division of Biostatistics and Epidemiology,
University of Virginia, Charlottesville, Virginia, United States of America, 5 Institute of Molecular Medicine, University of Texas Health Science Center at Houston, Houston,
Texas, United States of America, 6 Department of Epidemiology, University of Alabama at Birmingham, Birmingham, Alabama, United States of America, 7 Division of
Epidemiology, Human Genetics, and Environmental Sciences, University of Texas Health Science Center at Houston, Houston, Texas, United States of America,
8 Department of Internal Medicine, University of New Mexico, Albuquerque, New Mexico, United States of America, 9 Duke Global Health Institute, Duke University,
Durham, North Carolina, United States of America, 10 Geriatric Unit, Azienda Sanitaria Firenze (ASF), Florence, Italy, 11 Center for Public Health Genomics, University of
Virginia, Charlottesville, Virginia, United States of America, 12 Institute of Gerontology and Geriatrics, Department of Clinical and Experimental Medicine, University of
Perugia, Perugia, Italy, 13 Department of Biostatistics, School of Public Health, University of Washington, Seattle, Washington, United States of America, 14 Laboratory
Medicine and Pathology, University of Minnesota, Minneapolis, Minnesota, United States of America, 15 Department of Statistics, University of Auckland, Auckland, New
Zealand, 16 Department of Medicine, Division of Medical Genetics, University of Washington, Seattle, Washington, United States of America, 17 Departments of
Epidemiology and Health Services, University of Washington, Seattle, Washington, United States of America, 18 Group Health Research Institute, Group Health
Cooperative, Seattle, Washington, United States of America, 19 Medical Genetics Research Institute, Cedars-Sinai Medical Center, Los Angeles, California, United States of
America, 20 Unit of Epidemiology, School of Public Health, Hebrew University-Hadassah, Jerusalem, Israel, 21 Division of Aging, Department of Medicine, Brigham and
Women’s Hospital, Harvard Medical School, Boston, Massachusetts, United States of America, 22 Boston VA Healthcare System, Boston, Massachusetts, United States of
America, 23 Department of Epidemiology and Nutrition, Harvard School of Public Health, Boston, Massachusetts, United States of America, 24 School of Medicine and
Pharmacology, University of Western Australia, Perth, Australia, 25 Department of Epidemiology, School of Public Health, University of Washington, Seattle, Washington,
United States of America, 26 Department of Internal Medicine, Erasmus MC, Rotterdam, The Netherlands, 27 Division of Cardiovascular Medicine, Brigham and Women’s
Hospital, Harvard Medical School, Boston, Massachusetts, United States of America
Abstract
Long-chain n-3 polyunsaturated fatty acids (PUFAs) can derive from diet or from a-linolenic acid (ALA) by elongation anddesaturation. We investigated the association of common genetic variation with plasma phospholipid levels of the fourmajor n-3 PUFAs by performing genome-wide association studies in five population-based cohorts comprising 8,866subjects of European ancestry. Minor alleles of SNPs in FADS1 and FADS2 (desaturases) were associated with higher levels ofALA (p = 3610264) and lower levels of eicosapentaenoic acid (EPA, p = 5610258) and docosapentaenoic acid (DPA,p = 46102154). Minor alleles of SNPs in ELOVL2 (elongase) were associated with higher EPA (p = 2610212) and DPA(p = 1610243) and lower docosahexaenoic acid (DHA, p = 1610215). In addition to genes in the n-3 pathway, we identified anovel association of DPA with several SNPs in GCKR (glucokinase regulator, p = 161028). We observed a weaker associationbetween ALA and EPA among carriers of the minor allele of a representative SNP in FADS2 (rs1535), suggesting a lower rateof ALA-to-EPA conversion in these subjects. In samples of African, Chinese, and Hispanic ancestry, associations of n-3 PUFAswere similar with a representative SNP in FADS1 but less consistent with a representative SNP in ELOVL2. Our findings showthat common variation in n-3 metabolic pathway genes and in GCKR influences plasma phospholipid levels of n-3 PUFAs inpopulations of European ancestry and, for FADS1, in other ancestries.
Citation: Lemaitre RN, Tanaka T, Tang W, Manichaikul A, Foy M, et al. (2011) Genetic Loci Associated with Plasma Phospholipid n-3 Fatty Acids: A Meta-Analysis ofGenome-Wide Association Studies from the CHARGE Consortium. PLoS Genet 7(7): e1002193. doi:10.1371/journal.pgen.1002193
Editor: Mark I. McCarthy, University of Oxford, United Kingdom
Received March 4, 2011; Accepted June 6, 2011; Published July 28, 2011
This is an open-access article, free of all copyright, and may be freely reproduced, distributed, transmitted, modified, built upon, or otherwise used by anyone forany lawful purpose. The work is made available under the Creative Commons CC0 public domain dedication.
Funding: The Atherosclerosis Risk in Communities Study is carried out as a collaborative study supported by National Heart, Lung, and Blood Institute contractsHHSN268201100005C, HHSN268201100006C, HHSN268201100007C, HHSN268201100008C, HHSN268201100009C, HHSN268201100010C, HHSN268201100011C,HHSN268201100012C, R01HL087641, R01HL59367, and R01HL086694; National Human Genome Research Institute contract U01HG004402; and National Institutes ofHealth contract HSN268200625226C. Infrastructure was partly supported by Grant Number UL1RR025005, a component of the National Institutes of Health and NIHRoadmap for Medical Research. The Cardiovascular Health Study research reported in this article was supported by the National Heart, Lung, and Blood Institutecontract N01-HC-85079 through N01-HC-85086, N01-HC-35129, N01 HC-15103, N01 HC-55222, N01-HC-75150, N01-HC-45133 and grants HL075366,
PLoS Genetics | www.plosgenetics.org 1 July 2011 | Volume 7 | Issue 7 | e1002193
HL080295, HL087652, HL105756, and HL085251 with additional contribution from the National Institute of Neurological Disorders and Stroke. Additional supportfrom the National Institute on Aging was provided through AG-023269, AG-15928, AG-20098, and AG-027058. DNA handling and genotyping was supported inpart by the National Center for Research Resources grant M01RR00425 to the Cedars-Sinai General Clinical Research Center Genotyping core and the NationalInstitute of Diabetes and Digestive and Kidney Diseases grant DK063491 to the Southern California Diabetes Endocrinology Research Center. The Coronary ArteryRisk Development in Young Adults (CARDIA) study is funded by contracts N01-HC-95095, N01-HC-48047, N01-HC-48048, N01-HC-48049, N01-HC-48050, N01-HC-45134, N01-HC-05187, N01-HC-45205, and N01-HC-45204 from the National Heart, Lung, and Blood Institute to the CARDIA investigators. Genotyping of theCARDIA participants was supported by grants U01-HG-004729, U01-HG-004446, and U01-HG-004424 from the National Human Genome Research Institute andR01-HL-084099 from the National Heart, Lung, and Blood Institute to MF. The InCHIANTI Study baseline (1998-2000) was supported as a ‘‘targeted project’’(ICS110.1/RF97.71) by the Italian Ministry of Health and in part by the U.S. National Institute on Aging (Contracts: 263 MD 9164 and 263 MD 821336) and wassupported in part by the Intramural research program of the National Institute on Aging, National Institutes of Health, Baltimore, Maryland. The Multi-Ethnic Studyof Atherosclerosis (MESA) and MESA SHARe were supported by contracts N01-HC-95159 through N01-HC-95169 and RR-024156 from the National Heart, Lung,and Blood Institute. Funding for MESA SHARe genotyping was provided by NHLBI Contract N02HL64278. MESA Family is conducted and supported incollaboration with MESA investigators; support is provided by grants and contracts R01HL071051, R01HL071205, R01HL071250, R01HL071251, R01HL071252,R01HL071258, R01HL071259. The authors thank the other investigators, the staff, and the participants of the MESA study for their valuable contributions. A full listof participating MESA investigators and institutions can be found at http://www.mesa-nhlbi.org. JA Nettleton is supported by a K01 from the National Institutes ofHealth, National Institute of Diabetes and Digestive and Kidney Diseases (5K01DK082729-02). The funders had no role in study design, data collection andanalysis, decision to publish, or preparation of the manuscript.
Competing Interests: The authors have declared that no competing interests exist.
* E-mail: [email protected]
. These authors contributed equally to this work.
" These authors also contributed equally to this work.
Introduction
High levels of n-3 polyunsaturated fatty acids (PUFA) in plasma
phospholipids, cell membranes, and whole blood have been
associated with lower risk of multiple diseases, including sudden
cardiac death [1], fatal coronary heart disease [2], non-fatal
myocardial infarction [3], heart failure [4], thickening of the
carotid arteries [5], metabolic syndrome [6], breast cancer [7],
chronic obstructive pulmonary disease [8], depression [9,10] and
dementia [11,12].
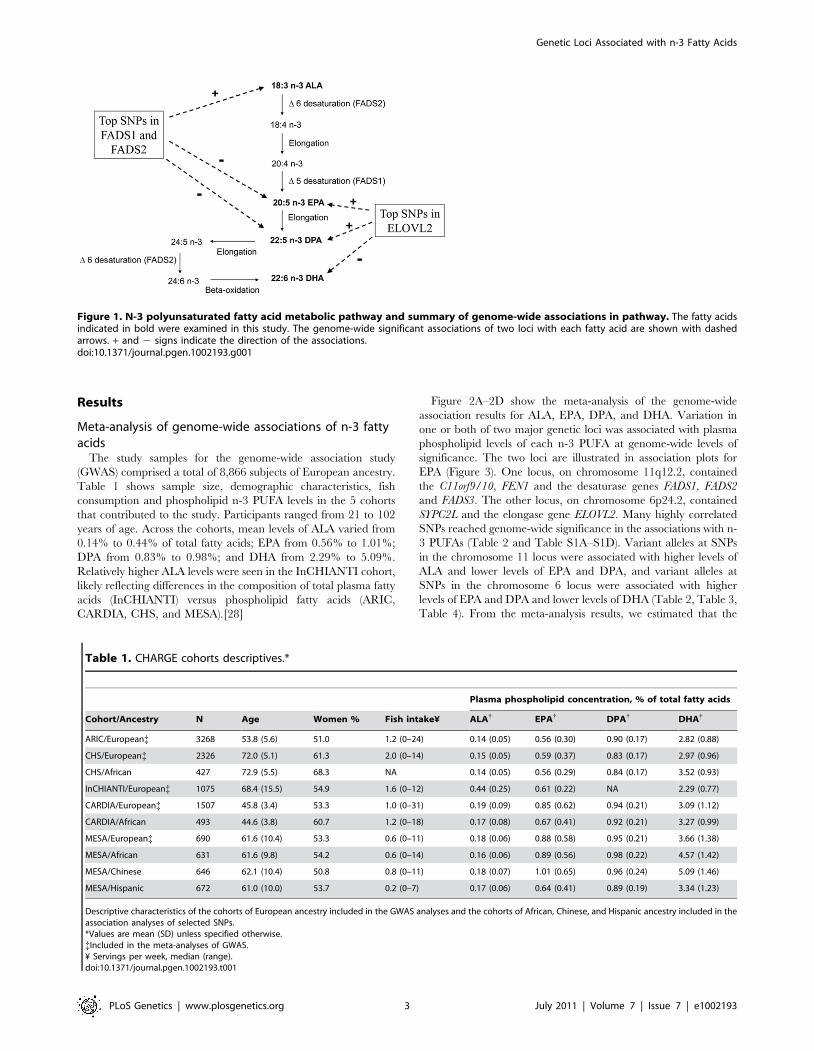
N-3 PUFAs are derived directly from the diet, including the
plant-derived essential fatty acid a-linolenic acid (ALA, 18:3n3)
and the seafood-derived long-chain n-3 PUFAs eicosapentaenoic
acid (EPA, 20:5n3) and docosahexaenoic acid (DHA, 22:6n3)
[13,14]. Long-chain n-3 PUFAs can also be produced from ALA
by the series of desaturation and elongation steps in the pathway
shown in Figure 1; docosapentaenoic acid (DPA, 22:5n-3) can be
produced from EPA. The pathway enzymes may be a major
source of circulating long-chain n-3 PUFAs in people who
consume very little or no seafood. However, the conversion of
ALA to EPA and DHA has been shown to be generally low [15–
17], and it is not known whether common genetic variation in the
pathway affects this conversion. The n-6 essential fatty acid linoleic
acid (LA) is elongated to long-chain n-6 PUFAs by the same
pathway enzymes and could also compete with the conversion of
ALA to EPA; it is not known whether genetic variation affects such
competition.
There is evidence of co-heritability of EPA and DHA levels in
erythrocyte membrane phospholipids [18]. Investigation of genetic
factors influencing PUFA levels has largely focused on candidate
genes, such as the desaturase genes FADS1 and FADS2, among
participants of European ancestry [19–25]. Only one prior study
reported a genome-wide association of n-3 PUFA levels evaluating
total plasma n-3 PUFAs which includes triacylglycerols, phospho-
lipids and free fatty acids, among 1075 participants [26]. The
study found an association of EPA with variants in the FADS1
gene that reached genome-wide significance level; independent
follow-up investigation showed associations of a selected FADS1
variant with erythrocyte membrane levels of EPA, ALA and DPA
and of an ELOVL2 variant with DPA and DHA. These findings
confirm an influence of FADS1 and ELOVL2 on selected n-3
PUFAs. However, statistical power may have been limited to
confirm an influence of these genes on all four major n-3 PUFAs,
of other genes in these pathways (e.g., FADS2), or of additional
genes in other unknown biologic pathways. Prior studies have also
not had adequate power to evaluate potential interaction between
variation in these genes, EPA and DHA, and: (a) diet, (b) ALA
levels, and (c) LA levels. In addition, there is limited information
on genetic variation and n-3 PUFA levels in subjects of non-
European ancestry.
To understand how common genetic variation affects n-3
PUFA phospholipid levels and potentially uncover novel associ-
ations, we conducted a meta-analysis of pre-planned genome-wide
association analyses of plasma phospholipid n-3 PUFAs in 8,866
participants of European ancestry in five population-based studies,
as part of the Cohorts for Heart and Aging Research in Genomic
Epidemiology (CHARGE) Consortium [27]. We evaluated the
four main n-3 PUFAs of the metabolic pathway, (ALA, EPA,
DPA, and DHA) separately and accounted for the intercorrela-
tions between these fatty acids. In addition, we investigated
whether consumption of fatty fish or phospholipid levels of ALA
and LA influenced the association of the identified genetic markers
with EPA and DHA levels. Finally, we studied the most highly
associated SNPs from the meta-analyses among samples of
European ancestry in additional samples from African, Chinese
and Hispanic ancestry.
Author Summary
Circulating long-chain n-3 polyunsaturated fatty acids(PUFAs) derive from fatty fish or from the conversion ofthe plant n-3 PUFA by elongation and desaturation. Welooked for common genetic markers throughout thegenome that might influence plasma phospholipid levelsof the four major n-3 PUFAs in five large studies andpooled the results. We found that levels of all four n-3PUFAs were associated with genetic markers in knowndesaturation and elongation genes. We also foundevidence that conversion of the plant n-3 PUFA to longerchain n-3 PUFAs is less effective in people with certaindesaturation-gene markers, which could be important forpeople who do not eat fish. We also found a marker in agene involved in glucose metabolism, called the glucoki-nase regulator, to be associated with one intermediate n-3PUFA. Some of these findings were seen across multiplerace/ethnicities. Overall, these results have implications forhow genes and the environment interact to influencecirculating levels of fatty acids.
Genetic Loci Associated with n-3 Fatty Acids
PLoS Genetics | www.plosgenetics.org 2 July 2011 | Volume 7 | Issue 7 | e1002193
Results
Meta-analysis of genome-wide associations of n-3 fattyacids
The study samples for the genome-wide association study
(GWAS) comprised a total of 8,866 subjects of European ancestry.
Table 1 shows sample size, demographic characteristics, fish
consumption and phospholipid n-3 PUFA levels in the 5 cohorts
that contributed to the study. Participants ranged from 21 to 102
years of age. Across the cohorts, mean levels of ALA varied from
0.14% to 0.44% of total fatty acids; EPA from 0.56% to 1.01%;
DPA from 0.83% to 0.98%; and DHA from 2.29% to 5.09%.
Relatively higher ALA levels were seen in the InCHIANTI cohort,
likely reflecting differences in the composition of total plasma fatty
acids (InCHIANTI) versus phospholipid fatty acids (ARIC,
CARDIA, CHS, and MESA).[28]
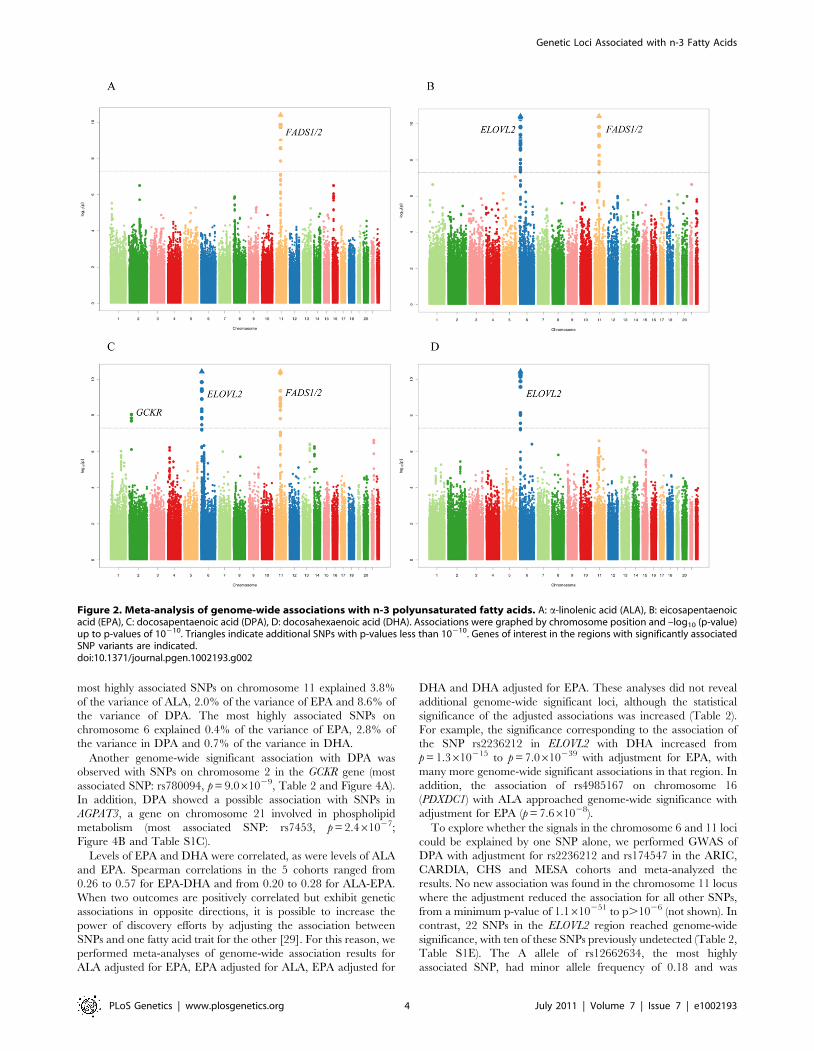
Figure 2A–2D show the meta-analysis of the genome-wide
association results for ALA, EPA, DPA, and DHA. Variation in
one or both of two major genetic loci was associated with plasma
phospholipid levels of each n-3 PUFA at genome-wide levels of
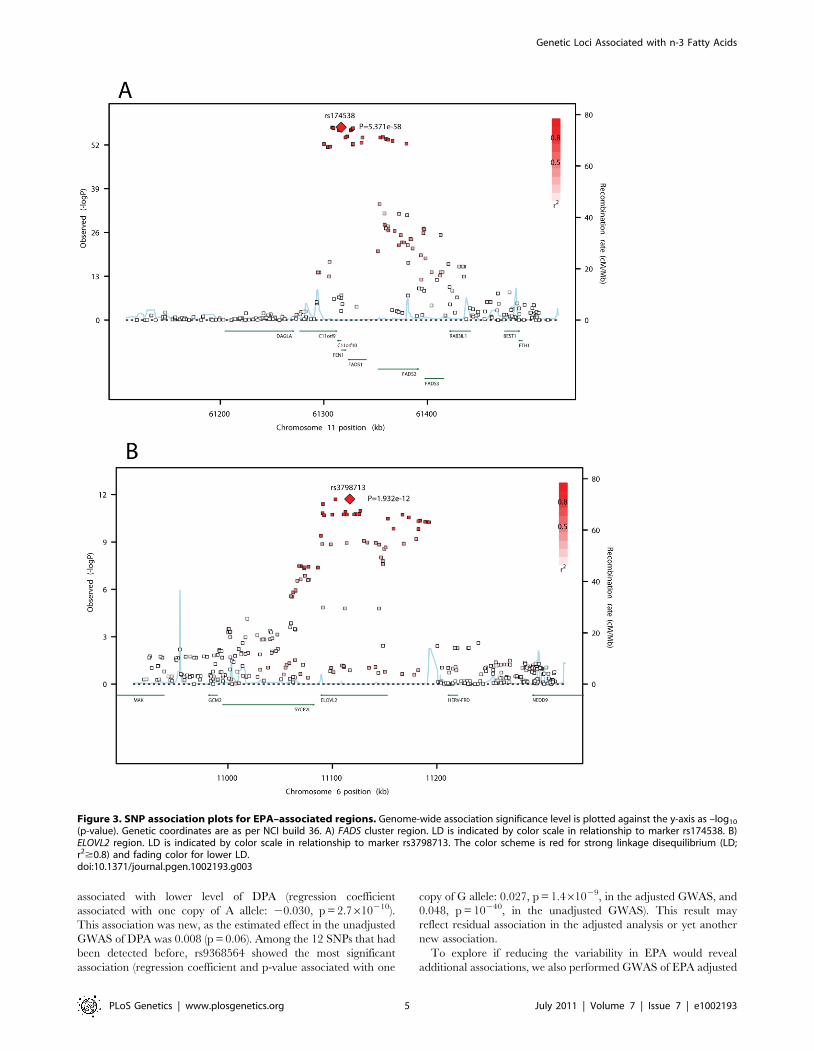
significance. The two loci are illustrated in association plots for
EPA (Figure 3). One locus, on chromosome 11q12.2, contained
the C11orf9/10, FEN1 and the desaturase genes FADS1, FADS2
and FADS3. The other locus, on chromosome 6p24.2, contained
SYPC2L and the elongase gene ELOVL2. Many highly correlated
SNPs reached genome-wide significance in the associations with n-
3 PUFAs (Table 2 and Table S1A–S1D). Variant alleles at SNPs
in the chromosome 11 locus were associated with higher levels of
ALA and lower levels of EPA and DPA, and variant alleles at
SNPs in the chromosome 6 locus were associated with higher
levels of EPA and DPA and lower levels of DHA (Table 2, Table 3,
Table 4). From the meta-analysis results, we estimated that the
Figure 1. N-3 polyunsaturated fatty acid metabolic pathway and summary of genome-wide associations in pathway. The fatty acidsindicated in bold were examined in this study. The genome-wide significant associations of two loci with each fatty acid are shown with dashedarrows. + and 2 signs indicate the direction of the associations.doi:10.1371/journal.pgen.1002193.g001
Table 1. CHARGE cohorts descriptives.*
Plasma phospholipid concentration, % of total fatty acids
Cohort/Ancestry N Age Women % Fish intake¥ ALA{ EPA{ DPA{ DHA{
ARIC/European{ 3268 53.8 (5.6) 51.0 1.2 (0–24) 0.14 (0.05) 0.56 (0.30) 0.90 (0.17) 2.82 (0.88)
CHS/European{ 2326 72.0 (5.1) 61.3 2.0 (0–14) 0.15 (0.05) 0.59 (0.37) 0.83 (0.17) 2.97 (0.96)
CHS/African 427 72.9 (5.5) 68.3 NA 0.14 (0.05) 0.56 (0.29) 0.84 (0.17) 3.52 (0.93)
InCHIANTI/European{ 1075 68.4 (15.5) 54.9 1.6 (0–12) 0.44 (0.25) 0.61 (0.22) NA 2.29 (0.77)
CARDIA/European{ 1507 45.8 (3.4) 53.3 1.0 (0–31) 0.19 (0.09) 0.85 (0.62) 0.94 (0.21) 3.09 (1.12)
CARDIA/African 493 44.6 (3.8) 60.7 1.2 (0–18) 0.17 (0.08) 0.67 (0.41) 0.92 (0.21) 3.27 (0.99)
MESA/European{ 690 61.6 (10.4) 53.3 0.6 (0–11) 0.18 (0.06) 0.88 (0.58) 0.95 (0.21) 3.66 (1.38)
MESA/African 631 61.6 (9.8) 54.2 0.6 (0–14) 0.16 (0.06) 0.89 (0.56) 0.98 (0.22) 4.57 (1.42)
MESA/Chinese 646 62.1 (10.4) 50.8 0.8 (0–11) 0.18 (0.07) 1.01 (0.65) 0.96 (0.24) 5.09 (1.46)
MESA/Hispanic 672 61.0 (10.0) 53.7 0.2 (0–7) 0.17 (0.06) 0.64 (0.41) 0.89 (0.19) 3.34 (1.23)
Descriptive characteristics of the cohorts of European ancestry included in the GWAS analyses and the cohorts of African, Chinese, and Hispanic ancestry included in theassociation analyses of selected SNPs.*Values are mean (SD) unless specified otherwise.{Included in the meta-analyses of GWAS.¥ Servings per week, median (range).doi:10.1371/journal.pgen.1002193.t001
Genetic Loci Associated with n-3 Fatty Acids
PLoS Genetics | www.plosgenetics.org 3 July 2011 | Volume 7 | Issue 7 | e1002193
most highly associated SNPs on chromosome 11 explained 3.8%
of the variance of ALA, 2.0% of the variance of EPA and 8.6% of
the variance of DPA. The most highly associated SNPs on
chromosome 6 explained 0.4% of the variance of EPA, 2.8% of
the variance in DPA and 0.7% of the variance in DHA.
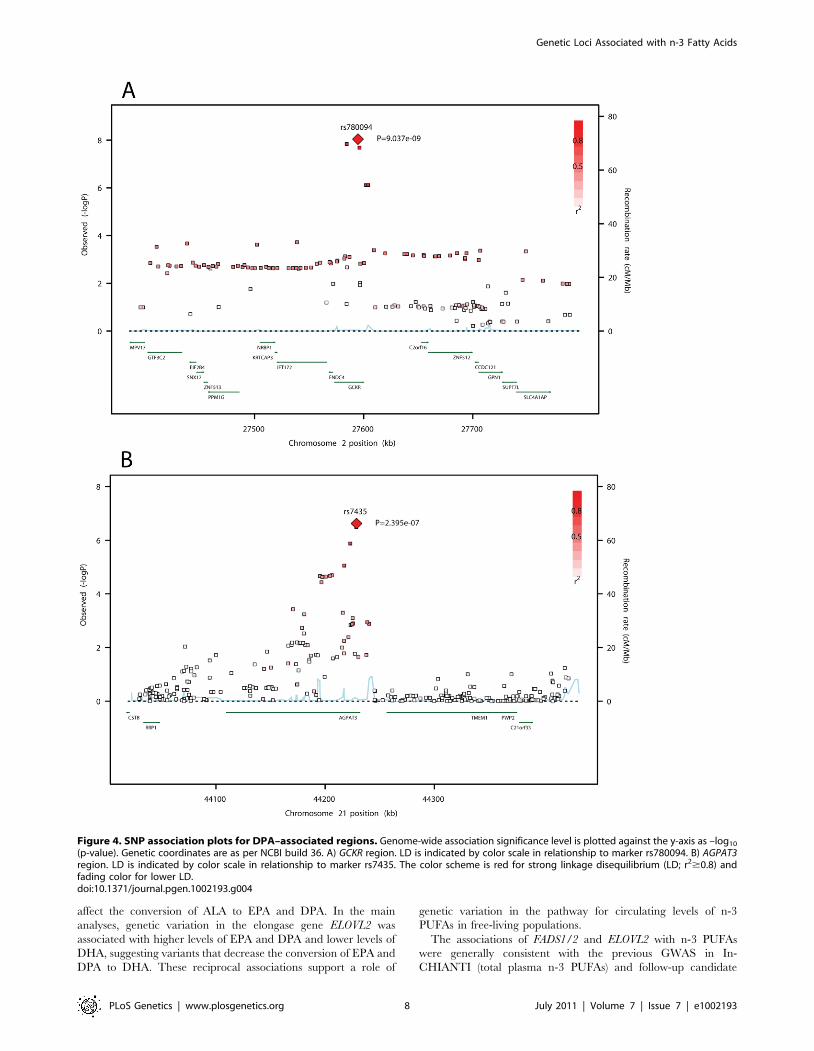
Another genome-wide significant association with DPA was
observed with SNPs on chromosome 2 in the GCKR gene (most
associated SNP: rs780094, p = 9.061029, Table 2 and Figure 4A).
In addition, DPA showed a possible association with SNPs in
AGPAT3, a gene on chromosome 21 involved in phospholipid
metabolism (most associated SNP: rs7453, p = 2.461027;
Figure 4B and Table S1C).
Levels of EPA and DHA were correlated, as were levels of ALA
and EPA. Spearman correlations in the 5 cohorts ranged from
0.26 to 0.57 for EPA-DHA and from 0.20 to 0.28 for ALA-EPA.
When two outcomes are positively correlated but exhibit genetic
associations in opposite directions, it is possible to increase the
power of discovery efforts by adjusting the association between
SNPs and one fatty acid trait for the other [29]. For this reason, we
performed meta-analyses of genome-wide association results for
ALA adjusted for EPA, EPA adjusted for ALA, EPA adjusted for
DHA and DHA adjusted for EPA. These analyses did not reveal
additional genome-wide significant loci, although the statistical
significance of the adjusted associations was increased (Table 2).
For example, the significance corresponding to the association of
the SNP rs2236212 in ELOVL2 with DHA increased from
p = 1.3610215 to p = 7.0610239 with adjustment for EPA, with
many more genome-wide significant associations in that region. In
addition, the association of rs4985167 on chromosome 16
(PDXDC1) with ALA approached genome-wide significance with
adjustment for EPA (p = 7.661028).
To explore whether the signals in the chromosome 6 and 11 loci
could be explained by one SNP alone, we performed GWAS of
DPA with adjustment for rs2236212 and rs174547 in the ARIC,
CARDIA, CHS and MESA cohorts and meta-analyzed the
results. No new association was found in the chromosome 11 locus
where the adjustment reduced the association for all other SNPs,
from a minimum p-value of 1.1610251 to p.1026 (not shown). In
contrast, 22 SNPs in the ELOVL2 region reached genome-wide
significance, with ten of these SNPs previously undetected (Table 2,
Table S1E). The A allele of rs12662634, the most highly
associated SNP, had minor allele frequency of 0.18 and was
Figure 2. Meta-analysis of genome-wide associations with n-3 polyunsaturated fatty acids. A: a-linolenic acid (ALA), B: eicosapentaenoicacid (EPA), C: docosapentaenoic acid (DPA), D: docosahexaenoic acid (DHA). Associations were graphed by chromosome position and –log10 (p-value)up to p-values of 10210. Triangles indicate additional SNPs with p-values less than 10210. Genes of interest in the regions with significantly associatedSNP variants are indicated.doi:10.1371/journal.pgen.1002193.g002
Genetic Loci Associated with n-3 Fatty Acids
PLoS Genetics | www.plosgenetics.org 4 July 2011 | Volume 7 | Issue 7 | e1002193
associated with lower level of DPA (regression coefficient
associated with one copy of A allele: 20.030, p = 2.7610210).
This association was new, as the estimated effect in the unadjusted
GWAS of DPA was 0.008 (p = 0.06). Among the 12 SNPs that had
been detected before, rs9368564 showed the most significant
association (regression coefficient and p-value associated with one
copy of G allele: 0.027, p = 1.461029, in the adjusted GWAS, and
0.048, p = 10240, in the unadjusted GWAS). This result may
reflect residual association in the adjusted analysis or yet another
new association.
To explore if reducing the variability in EPA would reveal
additional associations, we also performed GWAS of EPA adjusted
Figure 3. SNP association plots for EPA–associated regions. Genome-wide association significance level is plotted against the y-axis as –log10
(p-value). Genetic coordinates are as per NCI build 36. A) FADS cluster region. LD is indicated by color scale in relationship to marker rs174538. B)ELOVL2 region. LD is indicated by color scale in relationship to marker rs3798713. The color scheme is red for strong linkage disequilibrium (LD;r2$0.8) and fading color for lower LD.doi:10.1371/journal.pgen.1002193.g003
Genetic Loci Associated with n-3 Fatty Acids
PLoS Genetics | www.plosgenetics.org 5 July 2011 | Volume 7 | Issue 7 | e1002193
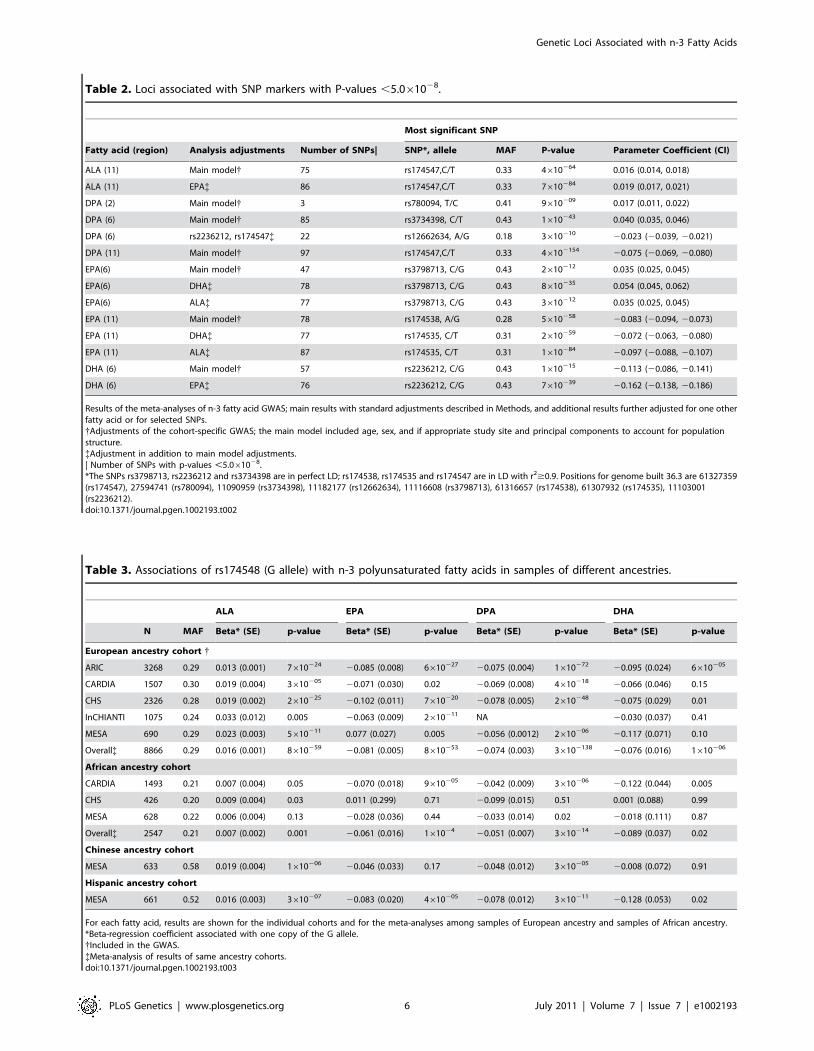
Table 2. Loci associated with SNP markers with P-values ,5.061028.
Most significant SNP
Fatty acid (region) Analysis adjustments Number of SNPs| SNP*, allele MAF P-value Parameter Coefficient (CI)
ALA (11) Main model{ 75 rs174547,C/T 0.33 4610264 0.016 (0.014, 0.018)
ALA (11) EPA{ 86 rs174547,C/T 0.33 7610284 0.019 (0.017, 0.021)
DPA (2) Main model{ 3 rs780094, T/C 0.41 9610209 0.017 (0.011, 0.022)
DPA (6) Main model{ 85 rs3734398, C/T 0.43 1610243 0.040 (0.035, 0.046)
DPA (6) rs2236212, rs174547{ 22 rs12662634, A/G 0.18 3610210 20.023 (20.039, 20.021)
DPA (11) Main model{ 97 rs174547,C/T 0.33 46102154 20.075 (20.069, 20.080)
EPA(6) Main model{ 47 rs3798713, C/G 0.43 2610212 0.035 (0.025, 0.045)
EPA(6) DHA{ 78 rs3798713, C/G 0.43 8610235 0.054 (0.045, 0.062)
EPA(6) ALA{ 77 rs3798713, C/G 0.43 3610212 0.035 (0.025, 0.045)
EPA (11) Main model{ 78 rs174538, A/G 0.28 5610258 20.083 (20.094, 20.073)
EPA (11) DHA{ 77 rs174535, C/T 0.31 2610259 20.072 (20.063, 20.080)
EPA (11) ALA{ 87 rs174535, C/T 0.31 1610284 20.097 (20.088, 20.107)
DHA (6) Main model{ 57 rs2236212, C/G 0.43 1610215 20.113 (20.086, 20.141)
DHA (6) EPA{ 76 rs2236212, C/G 0.43 7610239 20.162 (20.138, 20.186)
Results of the meta-analyses of n-3 fatty acid GWAS; main results with standard adjustments described in Methods, and additional results further adjusted for one otherfatty acid or for selected SNPs.{Adjustments of the cohort-specific GWAS; the main model included age, sex, and if appropriate study site and principal components to account for populationstructure.{Adjustment in addition to main model adjustments.| Number of SNPs with p-values ,5.061028.*The SNPs rs3798713, rs2236212 and rs3734398 are in perfect LD; rs174538, rs174535 and rs174547 are in LD with r2$0.9. Positions for genome built 36.3 are 61327359(rs174547), 27594741 (rs780094), 11090959 (rs3734398), 11182177 (rs12662634), 11116608 (rs3798713), 61316657 (rs174538), 61307932 (rs174535), 11103001(rs2236212).doi:10.1371/journal.pgen.1002193.t002
Table 3. Associations of rs174548 (G allele) with n-3 polyunsaturated fatty acids in samples of different ancestries.
ALA EPA DPA DHA
N MAF Beta* (SE) p-value Beta* (SE) p-value Beta* (SE) p-value Beta* (SE) p-value
European ancestry cohort {
ARIC 3268 0.29 0.013 (0.001) 7610224 20.085 (0.008) 6610227 20.075 (0.004) 1610272 20.095 (0.024) 6610205
CARDIA 1507 0.30 0.019 (0.004) 3610205 20.071 (0.030) 0.02 20.069 (0.008) 4610218 20.066 (0.046) 0.15
CHS 2326 0.28 0.019 (0.002) 2610225 20.102 (0.011) 7610220 20.078 (0.005) 2610248 20.075 (0.029) 0.01
InCHIANTI 1075 0.24 0.033 (0.012) 0.005 20.063 (0.009) 2610211 NA 20.030 (0.037) 0.41
MESA 690 0.29 0.023 (0.003) 5610211 0.077 (0.027) 0.005 20.056 (0.0012) 2610206 20.117 (0.071) 0.10
Overall{ 8866 0.29 0.016 (0.001) 8610259 20.081 (0.005) 8610253 20.074 (0.003) 36102138 20.076 (0.016) 1610206
African ancestry cohort
CARDIA 1493 0.21 0.007 (0.004) 0.05 20.070 (0.018) 9610205 20.042 (0.009) 3610206 20.122 (0.044) 0.005
CHS 426 0.20 0.009 (0.004) 0.03 0.011 (0.299) 0.71 20.099 (0.015) 0.51 0.001 (0.088) 0.99
MESA 628 0.22 0.006 (0.004) 0.13 20.028 (0.036) 0.44 20.033 (0.014) 0.02 20.018 (0.111) 0.87
Overall{ 2547 0.21 0.007 (0.002) 0.001 20.061 (0.016) 161024 20.051 (0.007) 3610214 20.089 (0.037) 0.02
Chinese ancestry cohort
MESA 633 0.58 0.019 (0.004) 1610206 20.046 (0.033) 0.17 20.048 (0.012) 3610205 20.008 (0.072) 0.91
Hispanic ancestry cohort
MESA 661 0.52 0.016 (0.003) 3610207 20.083 (0.020) 4610205 20.078 (0.012) 3610211 20.128 (0.053) 0.02
For each fatty acid, results are shown for the individual cohorts and for the meta-analyses among samples of European ancestry and samples of African ancestry.*Beta-regression coefficient associated with one copy of the G allele.{Included in the GWAS.{Meta-analysis of results of same ancestry cohorts.doi:10.1371/journal.pgen.1002193.t003
Genetic Loci Associated with n-3 Fatty Acids
PLoS Genetics | www.plosgenetics.org 6 July 2011 | Volume 7 | Issue 7 | e1002193
for estimated fish intake. No additional associations beyond those
previously seen for SNP in FADS1/2 and ELOVL2 were observed
in these analyses (not shown). Finally, adjustment of the GWAS of
the four n-3 PUFAs for levels of triglycerides, high density
lipoprotein and low density lipoprotein did not materially change
the results (not shown). For example, in the GWAS of DPA, the
estimated effect of one copy of the T allele of rs780094 (GCKR)
went from 0.0157 (p = 1.1561028) without adjustment to 0.0175
(p = 2.5261029) with adjustment, in meta-analyses that included
7663 participants.
Association of top SNPs with n-3 PUFAs in samples fromparticipants of African, Chinese, and Hispanic ancestry
To determine whether the gene-fatty acid associations were
consistent across different ethnicities, we examined the associations
of genotype at two representative SNPs with phospholipid n-3
PUFA levels, in samples of African, Chinese and Hispanic
ancestry. Results of these analyses for the selected SNPs are
shown in Table 3 and Table 4, together with meta-analysis and
cohort-specific results among the samples of European ancestry.
Frequency of the G allele of rs174548 (FADS1) was 0.29, 0.21,
0.58, 0.52 and frequency of the C allele of rs3734398 (ELOVL2)
was 0.43, 0.25, 0.92, 0.57 in samples of European, African,
Chinese and Hispanic ancestry respectively. Associations of
rs174548 with n-3 PUFA were generally similar across all
ancestries, with the G allele associated with higher ALA and
lower long-chain n-3 PUFA levels, although associations did not
always reach statistical significance, perhaps due to limited sample
sizes (Table 3). The associations of rs3734398 with EPA, DPA and
DHA were similar for samples of African ancestry versus
European ancestry (Table 4). Among samples of Chinese ancestry,
SNP rs3734398 was not highly polymorphic (C allele frequency of
92%) and no significant associations were detected. In samples of
Hispanic ancestry, the C allele of rs3734398 was associated with
higher DPA and lower DHA, but it was not associated with EPA.
InteractionsWe evaluated several potential interactions in the samples of
European ancestry, with statistical significance defined at
alpha = 0.004 (0.05 divided by 13 tested interactions). We found
little evidence that fatty fish consumption ($vs. ,0.6 servings/
week) modified the associations of rs1535 (FADS2) or rs3734398
(ELOVL2) with levels of DHA or EPA. We also did not observe any
interaction between plasma phospholipid levels of LA (continuous
linear) and genotype at these two SNPs on the levels of DHA or
EPA. Plasma phospholipid levels of ALA (continuous linear) also
did not modify the association of genotype at these two SNPs with
levels of DHA, or of genotype at rs3734398 with levels of EPA.
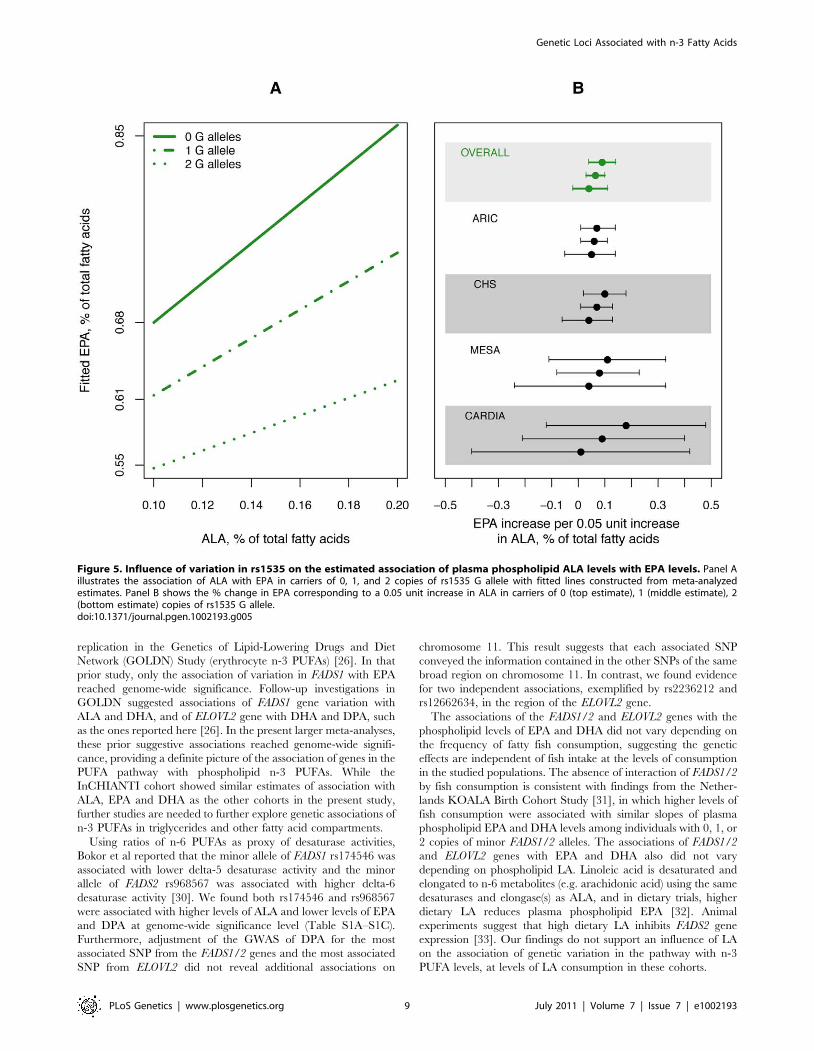
However, there was a significant interaction of ALA with rs1535
genotype and EPA levels (meta-analyzed interaction coefficient
p = 9.361027), illustrated in Figure 5. Per one SD unit (0.05% of
total fatty acids) increase in ALA, EPA levels increased by 0.086%
of total fatty acids (23% of one SD) in the absence of the minor
allele (G); by 0.063% (17% of one SD) in the presence of one copy
(G-); and by 0.036% (10% of one SD) in the presence of two copies
(GG).
Discussion
We report here the results of the largest GWAS of plasma
phospholipid n-3 PUFAs to date, with 8,866 participants of
European ancestry. The associations of the two top hits on
chromosomes 6 and 11 are shown in context of the n-3 PUFA
pathway in Figure 1. Genetic variation in the desaturase genes
FADS1 and FADS2 was associated with higher levels of ALA and
lower levels of EPA and DPA suggesting genetic variants that
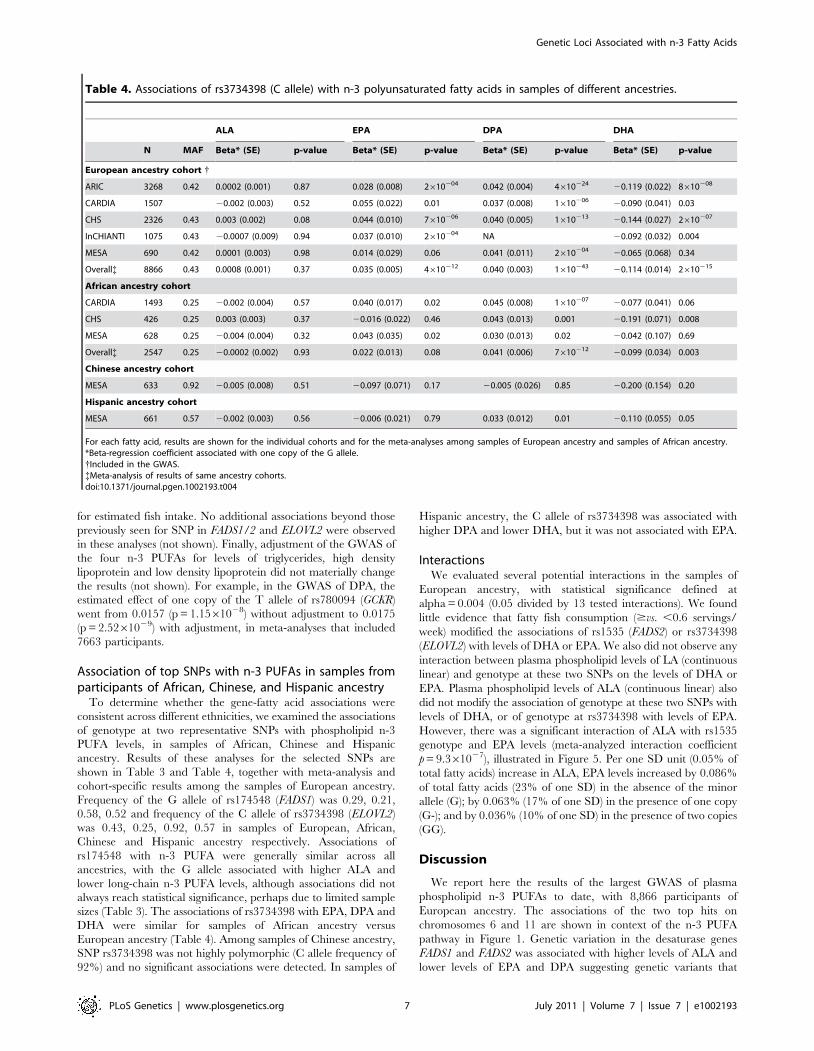
Table 4. Associations of rs3734398 (C allele) with n-3 polyunsaturated fatty acids in samples of different ancestries.
ALA EPA DPA DHA
N MAF Beta* (SE) p-value Beta* (SE) p-value Beta* (SE) p-value Beta* (SE) p-value
European ancestry cohort {
ARIC 3268 0.42 0.0002 (0.001) 0.87 0.028 (0.008) 2610204 0.042 (0.004) 4610224 20.119 (0.022) 8610208
CARDIA 1507 20.002 (0.003) 0.52 0.055 (0.022) 0.01 0.037 (0.008) 1610206 20.090 (0.041) 0.03
CHS 2326 0.43 0.003 (0.002) 0.08 0.044 (0.010) 7610206 0.040 (0.005) 1610213 20.144 (0.027) 2610207
InCHIANTI 1075 0.43 20.0007 (0.009) 0.94 0.037 (0.010) 2610204 NA 20.092 (0.032) 0.004
MESA 690 0.42 0.0001 (0.003) 0.98 0.014 (0.029) 0.06 0.041 (0.011) 2610204 20.065 (0.068) 0.34
Overall{ 8866 0.43 0.0008 (0.001) 0.37 0.035 (0.005) 4610212 0.040 (0.003) 1610243 20.114 (0.014) 2610215
African ancestry cohort
CARDIA 1493 0.25 20.002 (0.004) 0.57 0.040 (0.017) 0.02 0.045 (0.008) 1610207 20.077 (0.041) 0.06
CHS 426 0.25 0.003 (0.003) 0.37 20.016 (0.022) 0.46 0.043 (0.013) 0.001 20.191 (0.071) 0.008
MESA 628 0.25 20.004 (0.004) 0.32 0.043 (0.035) 0.02 0.030 (0.013) 0.02 20.042 (0.107) 0.69
Overall{ 2547 0.25 20.0002 (0.002) 0.93 0.022 (0.013) 0.08 0.041 (0.006) 7610212 20.099 (0.034) 0.003
Chinese ancestry cohort
MESA 633 0.92 20.005 (0.008) 0.51 20.097 (0.071) 0.17 20.005 (0.026) 0.85 20.200 (0.154) 0.20
Hispanic ancestry cohort
MESA 661 0.57 20.002 (0.003) 0.56 20.006 (0.021) 0.79 0.033 (0.012) 0.01 20.110 (0.055) 0.05
For each fatty acid, results are shown for the individual cohorts and for the meta-analyses among samples of European ancestry and samples of African ancestry.*Beta-regression coefficient associated with one copy of the G allele.{Included in the GWAS.{Meta-analysis of results of same ancestry cohorts.doi:10.1371/journal.pgen.1002193.t004
Genetic Loci Associated with n-3 Fatty Acids
PLoS Genetics | www.plosgenetics.org 7 July 2011 | Volume 7 | Issue 7 | e1002193
affect the conversion of ALA to EPA and DPA. In the main
analyses, genetic variation in the elongase gene ELOVL2 was
associated with higher levels of EPA and DPA and lower levels of
DHA, suggesting variants that decrease the conversion of EPA and
DPA to DHA. These reciprocal associations support a role of
genetic variation in the pathway for circulating levels of n-3
PUFAs in free-living populations.
The associations of FADS1/2 and ELOVL2 with n-3 PUFAs
were generally consistent with the previous GWAS in In-
CHIANTI (total plasma n-3 PUFAs) and follow-up candidate
Figure 4. SNP association plots for DPA–associated regions. Genome-wide association significance level is plotted against the y-axis as –log10
(p-value). Genetic coordinates are as per NCBI build 36. A) GCKR region. LD is indicated by color scale in relationship to marker rs780094. B) AGPAT3region. LD is indicated by color scale in relationship to marker rs7435. The color scheme is red for strong linkage disequilibrium (LD; r2$0.8) andfading color for lower LD.doi:10.1371/journal.pgen.1002193.g004
Genetic Loci Associated with n-3 Fatty Acids
PLoS Genetics | www.plosgenetics.org 8 July 2011 | Volume 7 | Issue 7 | e1002193
replication in the Genetics of Lipid-Lowering Drugs and Diet
Network (GOLDN) Study (erythrocyte n-3 PUFAs) [26]. In that
prior study, only the association of variation in FADS1 with EPA
reached genome-wide significance. Follow-up investigations in
GOLDN suggested associations of FADS1 gene variation with
ALA and DHA, and of ELOVL2 gene with DHA and DPA, such
as the ones reported here [26]. In the present larger meta-analyses,
these prior suggestive associations reached genome-wide signifi-
cance, providing a definite picture of the association of genes in the
PUFA pathway with phospholipid n-3 PUFAs. While the
InCHIANTI cohort showed similar estimates of association with
ALA, EPA and DHA as the other cohorts in the present study,
further studies are needed to further explore genetic associations of
n-3 PUFAs in triglycerides and other fatty acid compartments.
Using ratios of n-6 PUFAs as proxy of desaturase activities,
Bokor et al reported that the minor allele of FADS1 rs174546 was
associated with lower delta-5 desaturase activity and the minor
allele of FADS2 rs968567 was associated with higher delta-6
desaturase activity [30]. We found both rs174546 and rs968567
were associated with higher levels of ALA and lower levels of EPA
and DPA at genome-wide significance level (Table S1A–S1C).
Furthermore, adjustment of the GWAS of DPA for the most
associated SNP from the FADS1/2 genes and the most associated
SNP from ELOVL2 did not reveal additional associations on
chromosome 11. This result suggests that each associated SNP
conveyed the information contained in the other SNPs of the same
broad region on chromosome 11. In contrast, we found evidence
for two independent associations, exemplified by rs2236212 and
rs12662634, in the region of the ELOVL2 gene.
The associations of the FADS1/2 and ELOVL2 genes with the
phospholipid levels of EPA and DHA did not vary depending on
the frequency of fatty fish consumption, suggesting the genetic
effects are independent of fish intake at the levels of consumption
in the studied populations. The absence of interaction of FADS1/2
by fish consumption is consistent with findings from the Nether-
lands KOALA Birth Cohort Study [31], in which higher levels of
fish consumption were associated with similar slopes of plasma
phospholipid EPA and DHA levels among individuals with 0, 1, or
2 copies of minor FADS1/2 alleles. The associations of FADS1/2
and ELOVL2 genes with EPA and DHA also did not vary
depending on phospholipid LA. Linoleic acid is desaturated and
elongated to n-6 metabolites (e.g. arachidonic acid) using the same
desaturases and elongase(s) as ALA, and in dietary trials, higher
dietary LA reduces plasma phospholipid EPA [32]. Animal
experiments suggest that high dietary LA inhibits FADS2 gene
expression [33]. Our findings do not support an influence of LA
on the association of genetic variation in the pathway with n-3
PUFA levels, at levels of LA consumption in these cohorts.
Figure 5. Influence of variation in rs1535 on the estimated association of plasma phospholipid ALA levels with EPA levels. Panel Aillustrates the association of ALA with EPA in carriers of 0, 1, and 2 copies of rs1535 G allele with fitted lines constructed from meta-analyzedestimates. Panel B shows the % change in EPA corresponding to a 0.05 unit increase in ALA in carriers of 0 (top estimate), 1 (middle estimate), 2(bottom estimate) copies of rs1535 G allele.doi:10.1371/journal.pgen.1002193.g005
Genetic Loci Associated with n-3 Fatty Acids
PLoS Genetics | www.plosgenetics.org 9 July 2011 | Volume 7 | Issue 7 | e1002193
We report for the first time a GWAS of DPA, a central
intermediate in the n-3 fatty acid pathway (Figure 1). While
present in small quantities in fatty fish, DPA plasma levels appear
unrelated to dietary intake [3], suggesting a primarily metabolic
origin. Supporting this, we found that DPA exhibited stronger
genetic associations than the other n-3 PUFAs.
In addition to its association with variants of desaturase and
elongase genes, DPA was associated with variation in the
glucokinase regulator gene GCKR, a pleiotropic gene associated
with multiple outcomes in GWAS [34]. The T allele of rs780094 is
associated with lower fasting glucose and insulin [35] and with
higher triglycerides [36–38]; this allele was associated with higher
DPA levels in the present study, and the association was
independent of triglyceride levels. Given the known influence of
long-chain n-3 PUFAs on hepatic triglyceride production [39] and
possibly glucose-insulin homeostasis [40], the mechanism of
potential pleiotropic effects of this allele on both DPA and these
pathways merit further attention.
We found a potential association of DPA with AGPAT3, a gene
encoding 1-acylglycerol-3-phosphate O-acyltransferase 3. DPA is
a known substrate for the AGPAT3 protein, which transfers a fatty
acid in sn-2 position of lysophosphatic acid, a step in the
phospholipid biosynthesis pathway. A possible association of
DPA with AGPAT3 variation supports an origin of phospholipid
DPA from de novo phospholipid synthesis. In contrast, phospholipid
EPA and DHA often originate to a greater extent from diet and
are predominantly integrated into phospholipids by the process of
acyl-chain remodelling [41]. The genetic associations reported
here together with growing evidence of the association of DPA
with lower risk of coronary heart disease [3,42,43] should
stimulate further work on factors regulating this fatty acid.
The GWAS of ALA adjusted with EPA revealed a possible new
association of phospholipid ALA with variation in PDXDC1. The
PDXDC1 protein, a vitamin B6-dependent decarboxylase, is
expressed preferentially in the intestine [44], but its function is
not known. Animal studies support an influence of dietary vitamin
B6 (pyridoxal) on serum and liver levels of ALA and other PUFAs
[45,46], which has been interpreted as an effect on desaturase
enzymes activity. The association of PDXDC1 with ALA, if
confirmed in other studies, raises the possibility of another vitamin
B6-dependent protein affecting ALA, for example through
involvement in intestinal ALA absorption.
In addition to an overall association of FADS1/2 variation with
less ALA and more EPA, we found that the minor G allele of
rs1535 was associated with a reduction of the magnitude of the
association between ALA and EPA. In persons with two copies of
the G allele, the association of ALA with EPA was less than half
the association observed in persons with two copies of the A allele.
These results suggest an influence of variation in FADS1/2 on the
rate of conversion of ALA into EPA. This conversion is of great
clinical and public health interest, given the evidence for
importance of long-chain n-3 PUFAs (such as EPA) in many
chronic diseases, their limited dietary supply worldwide, and the
much greater potential supply of plant-derived ALA. On average,
the conversion of ALA to EPA is quite low [47]. Prior tracer
studies in humans have shown that the majority of dietary ALA is
beta-oxidized for energy or directed into long-term storage as
triglycerides, with less than 5% being incorporated into phospho-
lipids where ALA is more readily converted to EPA [16,17,47].
Genetic variation that increases or decreases the rate of conversion
of ALA to EPA could have implications for individual-based
recommendations for consumption of plant- versus seafood-
derived n-3 PUFA. The genetic variation may also indicate novel
targets for drugs that may increase this conversion.
The associations of a representative SNP in the FADS1/2
genes observed in the meta-analyses of samples of European
ancestry were generally similar in samples of African, Chinese,
and Hispanic ancestry. Associations of ELOVL2 were less
consistent in different ancestries. However, the frequency of the
ELOVL2 rs3734398 G allele varied substantially with ancestry,
from 25% in African samples to 92% in Chinese samples. Lack of
association may be due to inadequate statistical power, chance,
different background diet [14], or possible race/ethnic differ-
ences in the activity of elongases from the ELOVL2 and ELOVL5
genes.
Our study, the largest GWAS to-date of fatty acid biomarkers,
demonstrates key associations of genetic variation with phospho-
lipid n-3 PUFA levels, including genes in the n-3 PUFA metabolic
pathway and, for DPA, novel pathways including the pleiotropic
gene GCKR. Our results also imply that common variation may
result in less efficient conversion of ALA to EPA.
Materials and Methods
Ethics statementAll cohort participants gave written informed consent, including
consent to participate in genetic studies. All studies received
approval from local ethical oversight committees.
Study samplesThe data were obtained from 2 cohort studies in the CHARGE
Consortium, the Atherosclerosis Risk in Communities (ARIC)
Study and the Cardiovascular Health Study (CHS), and 3
additional cohort studies, the Coronary Artery Risk Development
in Young Adults (CARDIA) Study, the Invecchiare in Chianti
(InCHIANTI) Study, and the Multi-Ethnic Study of Atheroscle-
rosis (MESA).
Fatty acid measurementsIn all cohorts but InCHIANTI, plasma phospholipids were first
isolated by thin layer chromatography; fatty acids were then
separated by gas chromatography. In InCHIANTI, total plasma
fatty acids were measured using a similar gas chromatography
technique. Details of fatty acid measurements are provided in Text
S1. Levels of EPA, DHA, ALA and DPA were expressed as % of
total fatty acids.
Imputation and statistical analysisGenotyping was done in each cohort separately using high-
density SNP marker platforms (ARIC, CARDIA and MESA -
Affymetrix 6.0, CHS - Illumina 370, InCHIANTI - Illumina 550).
Samples with call rates below 95% (ARIC, CARDIA, MESA), or
97% (CHS, InCHIANTI) at genotyped markers were excluded.
Genotypes were imputed to approximately 2.5 million HapMap
SNPs by using either MACH [48] (ARIC, InCHIANTI),
BIMBAM [49] (CHS), BEAGLE [50] (CARDIA) or IMPUTE
[51] (MESA). SNPs for which testing Hardy Weinberg equilibrium
resulted in p,1025 (CHS) or p,1026 (ARIC) were excluded from
imputation. SNPs with minor allele frequency (MAF) #1% were
excluded from the meta-analyses. Additional details on genotyping
and imputation per cohort are provided in Text S1.
Association analysis between genotype and each fatty acid was
done separately within each study cohort according to a pre-
specified plan. All studies conducted linear regression analysis
using an additive genetic model, i.e. regression of phenotype on
the number of reference alleles, or equivalently the imputed
dosage for imputed genotypes. All analyses were adjusted for age,
sex, and site of recruitment where appropriate, and used robust
Genetic Loci Associated with n-3 Fatty Acids
PLoS Genetics | www.plosgenetics.org 10 July 2011 | Volume 7 | Issue 7 | e1002193
standard errors. In addition, CARDIA, CHS and MESA analyses
were adjusted for principal components to account for possible
population genetic substructure. The results in InCHIANTI
included in the present study have been previously published [26].
Meta-analysis of main effectsFor each SNP and fatty acid, GWAS-specific results were
combined using inverse-variance weighted meta-analysis in
METAL (www.sph.umich.edu/csg/abecasis/metal). Genomic
control correction was applied to each study prior to the meta-
analysis. Genomic control correction factors ranged from 1.00 to
1.07 (ALA), 1.00–1.08 (EPA), 1.00–1.03 (DPA) and 1.01–1.13
(DHA). P-values less than 561028 were considered significant.
Because total plasma levels of ALA (measured in InCHIANTI) are
higher than plasma phospholipid levels of ALA (measured in the
other cohorts), we performed a z-score based meta-analysis of
ALA with the 5 cohorts as a sensitivity analysis. Results did not
differ from that of inverse-variance weighted meta-analysis, i.e.
from those presented. The proportion of fatty acid variance
explained by a particular variant allele was calculated from the
formula.
(b2*2*MAF(1-MAF))/Var(Y), where b is the regression coeffi-
cient for one copy of the allele, MAF is the minor allele frequency
and Var(Y) is the variance of the fatty acid.
Interaction analysesWe tested 13 interactions using cross-products in the linear
regression models. Two of the most associated SNPs available in
all cohorts (rs1535 in FADS2 and rs3734398 in ELOVL2) were
chosen for investigation of interactions with a) fatty fish intake
(dichotomized at 0.6 servings/week, a cut-point around the 25th
percentile of fish consumption in the CHS and ARIC cohorts), b)
plasma phospholipid ALA levels (continuous linear) and c) plasma
phospholipid LA levels (continuous linear) on the outcomes of EPA
and DHA. Additionally, we tested the interaction between rs1535
and plasma phospholipid EPA with DHA levels as the outcome.
Interaction coefficients from cohort-specific analyses were meta-
analyzed. For interactions of SNPs with ALA on the outcomes of
EPA and DHA, we performed z-score meta-analysis with all the
cohorts to assess statistical significance, and inverse-variance
weighted meta-analysis excluding InCHIANTI to estimate the
magnitude of the interaction. P-values less than 0.004 (0.05/13
tests) were considered significant for the interactions.
Analyses of selected SNPs in cohorts of African, Chinese,and Hispanic ancestry
We investigated the association of two selected SNPs which had
been directly genotyped as part of candidate gene studies in the
African American cohort in CARDIA and the African, Chinese
and Hispanic American cohort in MESA, and which were
available from genome-wide scans on African Americans in the
CHS cohort. We used linear regression and additive models as
described above. Results in the 3 African American cohorts were
meta-analyzed using inverse-variance weighted meta-analysis.
Supporting Information
Text S1 Details of participating cohorts.
(DOC)
Table S1 Supplementary results from the CHARGE consor-
tium. A. Comprehensive results for ALA with p,5*1026. B.
Comprehensive results for EPA with p,5*1026. C. Comprehen-
sive results for DPA with p,5*1026. D. Comprehensive results for
DHA with p,5*1026. E. Results for DPA adjusted for rs2236212
and rs174547 with p,5*1028.
(DOC)
Acknowledgments
The authors thank the other investigators, the staff and the participants of
the ARIC study, the CARDIA study, the CHS study, the MESA study,
and the InCHIANTI study for their important contributions. A full list of
principal CHS investigators and institutions can be found at http://www.
chs-nhlbi.org/pi.htm. A full list of principal CARDIA investigators and
institutions can be found at http://www.cardia.dopm.uab.edu/o_pain.
htm. A full list of participating MESA investigators and institutions can be
found at http://www.mesa-nhlbi.org. The authors acknowledge the
essential role of the CHARGE (Cohorts for Heart and Aging Research
in Genomic Epidemiology) Consortium in development and support of
this. CHARGE members include NHLBI’s Atherosclerosis Risk in
Communities (ARIC) Study, NIA’s Iceland Age Gene/Environment
Susceptibility Study, NHLBI’s Cardiovascular Health Study (CHS) and
Framingham Heart Study, and the Netherland’s Rotterdam Study. The
authors acknowledge the use of the SNAP server from the Broad Institute
(http://www.broadinstitute.org/mpg/snap/) to construct regional associ-
ation plots.
Author Contributions
Conceived and designed the experiments: RN Lemaitre, T Tanaka, BM
Psaty, DS Siscovick, D Mozaffarian. Analyzed the data: RN Lemaitre, T
Tanaka, W Tang, A Manichaikul, M Foy, S Bhattacharya, JC Bis, B
McKnight, K Rice, CC Laurie, T Lumley. Contributed reagents/
materials/analysis tools: IB King, L-C Weng, S Bandinelli, SS Rich, DR
Jacobs Jr, A Cherubini, S Liang, X Gu, BL Browning, BM Psaty, Y-DI
Chen, DS Siscovick, AG Uitterlinden, L Ferrucci, M Fornage, MY Tsai, D
Mozaffarian, LM Steffen. Wrote the paper: RN Lemaitre, T Tanaka, W
Tang, A Manichaikul, M Foy, EK Kabagambe, JA Nettleton, Y
Friedlander, L Djousse, JHY Wu, DK Arnett.
References
1. Siscovick DS, Raghunathan TE, King I, Weinmann S, Wicklund KG, et al.
(1995) Dietary intake and cell membrane levels of long-chain n-3
polyunsaturated fatty acids and the risk of primary cardiac arrest. Jama
274: 1363–1367.
2. Lemaitre RN, King IB, Mozaffarian D, Sotoodehnia N, Rea TD, et al. (2006)
Plasma phospholipid trans fatty acids, fatal ischemic heart disease, and sudden
cardiac death in older adults: the cardiovascular health study. Circulation 114:
209–215.
3. Sun Q, Ma J, Campos H, Rexrode KM, Albert CM, et al. (2008) Blood
concentrations of individual long-chain n-3 fatty acids and risk of nonfatal
myocardial infarction. Am J Clin Nutr 88: 216–223.
4. Yamagishi K, Nettleton JA, Folsom AR (2008) Plasma fatty acid composition
and incident heart failure in middle-aged adults: the Atherosclerosis Risk in
Communities (ARIC) Study. Am Heart J 156: 965–974.
5. Sala-Vila A, Cofan M, Perez-Heras A, Nunez I, Gilabert R, et al. (2010) Fatty
acids in serum phospholipids and carotid intima-media thickness in Spanish
subjects with primary dyslipidemia. Am J Clin Nutr 92: 186–193.
6. Warensjo E, Sundstrom J, Lind L, Vessby B (2006) Factor analysis of fatty acids
in serum lipids as a measure of dietary fat quality in relation to the metabolic
syndrome in men. Am J Clin Nutr 84: 442–448.
7. Shannon J, King IB, Moshofsky R, Lampe JW, Gao DL, et al. (2007)
Erythrocyte fatty acids and breast cancer risk: a case-control study in Shanghai,
China. Am J Clin Nutr 85: 1090–1097.
8. Shahar E, Boland LL, Folsom AR, Tockman MS, McGovern PG, et al. (1999)
Docosahexaenoic acid and smoking-related chronic obstructive pulmonary
disease. The Atherosclerosis Risk in Communities Study Investigators.
Am J Respir Crit Care Med 159: 1780–1785.
9. Tiemeier H, van Tuijl HR, Hofman A, Kiliaan AJ, Breteler MM (2003) Plasma
fatty acid composition and depression are associated in the elderly: the
Rotterdam Study. Am J Clin Nutr 78: 40–46.
10. Feart C, Peuchant E, Letenneur L, Samieri C, Montagnier D, et al. (2008)
Plasma eicosapentaenoic acid is inversely associated with severity of depressive
symptomatology in the elderly: data from the Bordeaux sample of the Three-
City Study. Am J Clin Nutr 87: 1156–1162.
Genetic Loci Associated with n-3 Fatty Acids
PLoS Genetics | www.plosgenetics.org 11 July 2011 | Volume 7 | Issue 7 | e1002193
11. Samieri C, Feart C, Letenneur L, Dartigues JF, Peres K, et al. (2008) Low
plasma eicosapentaenoic acid and depressive symptomatology are independent
predictors of dementia risk. Am J Clin Nutr 88: 714–721.
12. Schaefer EJ, Bongard V, Beiser AS, Lamon-Fava S, Robins SJ, et al. (2006)
Plasma phosphatidylcholine docosahexaenoic acid content and risk of dementiaand Alzheimer disease: the Framingham Heart Study. Arch Neurol 63:
1545–1550.
13. Sun Q, Ma J, Campos H, Hankinson SE, Hu FB (2007) Comparison between
plasma and erythrocyte fatty acid content as biomarkers of fatty acid intake in
US women. Am J Clin Nutr 86: 74–81.
14. Chung H, Nettleton JA, Lemaitre RN, Barr RG, Tsai MY, et al. (2008)
Frequency and type of seafood consumed influence plasma (n-3) fatty acid
concentrations. J Nutr 138: 2422–2427.
15. Burdge GC, Wootton SA (2003) Conversion of alpha-linolenic acid to palmitic,
palmitoleic, stearic and oleic acids in men and women. Prostaglandins LeukotEssent Fatty Acids 69: 283–290.
16. Goyens PL, Spilker ME, Zock PL, Katan MB, Mensink RP (2006) Conversion of
alpha-linolenic acid in humans is influenced by the absolute amounts of alpha-
linolenic acid and linoleic acid in the diet and not by their ratio. Am J Clin Nutr
84: 44–53.
17. Goyens PL, Spilker ME, Zock PL, Katan MB, Mensink RP (2005)
Compartmental modeling to quantify alpha-linolenic acid conversion after
longer term intake of multiple tracer boluses. J Lipid Res 46: 1474–1483.
18. Lemaitre RN, Siscovick DS, Berry EM, Kark JD, Friedlander Y (2008) Familial
aggregation of red blood cell membrane fatty acid composition: the KibbutzimFamily Study. Metabolism 57: 662–668.
19. Schaeffer L, Gohlke H, Muller M, Heid IM, Palmer LJ, et al. (2006) Common
genetic variants of the FADS1 FADS2 gene cluster and their reconstructed
haplotypes are associated with the fatty acid composition in phospholipids. Hum
Mol Genet 15: 1745–1756.
20. Rzehak P, Heinrich J, Klopp N, Schaeffer L, Hoff S, et al. (2009) Evidence for
an association between genetic variants of the fatty acid desaturase 1 fatty acid
desaturase 2 (FADS1 FADS2) gene cluster and the fatty acid composition of
erythrocyte membranes. Br J Nutr 101: 20–26.
21. Xie L, Innis SM (2008) Genetic variants of the FADS1 FADS2 gene cluster areassociated with altered (n-6) and (n-3) essential fatty acids in plasma and
erythrocyte phospholipids in women during pregnancy and in breast milk during
lactation. J Nutr 138: 2222–2228.
22. Malerba G, Schaeffer L, Xumerle L, Klopp N, Trabetti E, et al. (2008) SNPs of
the FADS gene cluster are associated with polyunsaturated fatty acids in a cohort
of patients with cardiovascular disease. Lipids 43: 289–299.
23. Bokor S, Dumont J, Spinneker A, Gonzalez-Gross M, Nova E, et al. (2010)
Single nucleotide polymorphisms in the FADS gene cluster are associated with
delta-5 and delta-6 desaturase activities estimated by serum fatty acid ratios.
J Lipid Res 51: 2325–2333.
24. Zietemann V, Kroger J, Enzenbach C, Jansen E, Fritsche A, et al. (2010)
Genetic variation of the FADS1 FADS2 gene cluster and n-6 PUFA composition
in erythrocyte membranes in the European Prospective Investigation into
Cancer and Nutrition-Potsdam study. Br J Nutr. pp 1–12.
25. Okada T, Sato NF, Kuromori Y, Miyashita M, Iwata F, et al. (2006) Thr-
encoding allele homozygosity at codon 54 of FABP 2 gene be associated withimpaired delta 6 desatruase activity and reduced plasma arachidonic acid in
obese children. J Atheroscler Thromb 13: 192–196.
26. Tanaka T, Shen J, Abecasis GR, Kisialiou A, Ordovas JM, et al. (2009) Genome-
wide association study of plasma polyunsaturated fatty acids in the InCHIANTI
Study. PLoS Genet 5: e1000338. doi:10.1371/journal.pgen.1000338.
27. Psaty BM, O’Donnell CJ, Gudnason V, Lunetta KL, Folsom AR, et al. (2009)
Cohorts for Heart and Aging Research in Genomic Epidemiology (CHARGE)
Consortium: Design of prospective meta-analyses of genome-wide association
studies from 5 cohorts. Circ Cardiovasc Genet 2: 73–80.
28. Hodson L, Skeaff CM, Fielding BA (2008) Fatty acid composition of adiposetissue and blood in humans and its use as a biomarker of dietary intake. Prog
Lipid Res 47: 348–380.
29. Vittinghoff E, Glidden D, Shiboski S, McCulloch C (2005) Regression Methods
in Biostatistics: Linear Logistic, Survival and Repeated Measures Models. New
York: Springer.
30. Bokor S, Dumont J, Spinneker A, Gonzalez-Gross M, Nova E, et al. (2010)
Single nucleotide polymorphisms in the FADS gene cluster are associated withdelta-5 and delta-6 desaturase activities estimated by serum fatty acid ratios. J
Lipid Res.
31. Molto-Puigmarti C, Plat J, Mensink RP, Muller A, Jansen E, et al. (2010)FADS1 FADS2 gene variants modify the association between fish intake and the
docosahexaenoic acid proportions in human milk. Am J Clin Nutr 91:1368–1376.
32. Liou YA, King DJ, Zibrik D, Innis SM (2007) Decreasing linoleic acid with
constant alpha-linolenic acid in dietary fats increases (n-3) eicosapentaenoic acidin plasma phospholipids in healthy men. J Nutr 137: 945–952.
33. Tang C, Cho HP, Nakamura MT, Clarke SD (2003) Regulation of humandelta-6 desaturase gene transcription: identification of a functional direct repeat-
1 element. J Lipid Res 44: 686–695.34. Hindorff L, Junkins H, Hall P, Mehta J, Manolio T A Catalog of Published
Genome-Wide Association Studies. Available at: www.genome.gov/gwastudies.
35. Dupuis J, Langenberg C, Prokopenko I, Saxena R, Soranzo N, et al. (2010) Newgenetic loci implicated in fasting glucose homeostasis and their impact on type 2
diabetes risk. Nat Genet 42: 105–116.36. Willer CJ, Sanna S, Jackson AU, Scuteri A, Bonnycastle LL, et al. (2008) Newly
identified loci that influence lipid concentrations and risk of coronary artery
disease. Nat Genet 40: 161–169.37. Kathiresan S, Willer CJ, Peloso GM, Demissie S, Musunuru K, et al. (2009)
Common variants at 30 loci contribute to polygenic dyslipidemia. Nat Genet 41:56–65.
38. Aulchenko YS, Ripatti S, Lindqvist I, Boomsma D, Heid IM, et al. (2009) Lociinfluencing lipid levels and coronary heart disease risk in 16 European
population cohorts. Nat Genet 41: 47–55.
39. Harris WS, Bulchandani D (2006) Why do omega-3 fatty acids lower serumtriglycerides? Curr Opin Lipidol 17: 387–393.
40. Friedberg CE, Janssen MJ, Heine RJ, Grobbee DE (1998) Fish oil and glycemiccontrol in diabetes. A meta-analysis. Diabetes Care 21: 494–500.
41. Lands WE (1958) Metabolism of glycerolipides; a comparison of lecithin and
triglyceride synthesis. J Biol Chem 231: 883–888.42. Rissanen T, Voutilainen S, Nyyssonen K, Lakka TA, Salonen JT (2000) Fish oil-
derived fatty acids, docosahexaenoic acid and docosapentaenoic acid, and therisk of acute coronary events: the Kuopio ischaemic heart disease risk factor
study. Circulation 102: 2677–2679.43. Oda E, Hatada K, Katoh K, Kodama M, Nakamura Y, et al. (2005) A case-
control pilot study on n-3 polyunsaturated fatty acid as a negative risk factor for
myocardial infarction. Int Heart J 46: 583–591.44. Wu C, Orozco C, Boyer J, Leglise M, Goodale J, et al. (2009) BioGPS: an
extensible and customizable portal for querying and organizing gene annotationresources. Genome Biol 10: R130.
45. Bertrandt J, Klos A, Debski B (2004) Influence of vitamin B6 supplementation
on polyunsaturated fatty acids concentration in serum and liver of rats fed a dietrestricted in protein. Nahrung 48: 99–103.
46. Bordoni A, Hrelia S, Lorenzini A, Bergami R, Cabrini L, et al. (1998) Dualinfluence of aging and vitamin B6 deficiency on delta-6-desaturation of essential
fatty acids in rat liver microsomes. Prostaglandins Leukot Essent Fatty Acids 58:417–420.
47. Burdge GC, Finnegan YE, Minihane AM, Williams CM, Wootton SA (2003)
Effect of altered dietary n-3 fatty acid intake upon plasma lipid fatty acidcomposition, conversion of [13C]alpha-linolenic acid to longer-chain fatty acids
and partitioning towards beta-oxidation in older men. Br J Nutr 90: 311–321.48. Li Y, Willer CJ, Ding J, Scheet P, Abecasis GR (2010) MaCH: using sequence
and genotype data to estimate haplotypes and unobserved genotypes. Genet
Epidemiol 34: 816–834.49. Servin B, Stephens M (2007) Imputation-based analysis of association studies:
candidate regions and quantitative traits. PLoS Genet 3: e114. doi:10.1371/journal.pgen.0030114.
50. Browning BL, Browning SR (2009) A unified approach to genotype imputation
and haplotype-phase inference for large data sets of trios and unrelatedindividuals. Am J Hum Genet 84: 210–223.
51. Marchini J, Howie B, Myers S, McVean G, Donnelly P (2007) A new multipointmethod for genome-wide association studies by imputation of genotypes. Nat
Genet 39: 906–913.
Genetic Loci Associated with n-3 Fatty Acids
PLoS Genetics | www.plosgenetics.org 12 July 2011 | Volume 7 | Issue 7 | e1002193