Embed Size (px)
Citation preview
SOFTWARE Open Access
Genomics Portals: integrative web-platform formining genomics dataKaustubh Shinde1†, Mukta Phatak1†, Freudenberg M Johannes1, Jing Chen1, Qian Li1, Joshi K Vineet1, Zhen Hu1,Krishnendu Ghosh1, Jaroslaw Meller2, Mario Medvedovic1*
Abstract
Background: A large amount of experimental data generated by modern high-throughput technologies isavailable through various public repositories. Our knowledge about molecular interaction networks, functionalbiological pathways and transcriptional regulatory modules is rapidly expanding, and is being organized in lists offunctionally related genes. Jointly, these two sources of information hold a tremendous potential for gaining newinsights into functioning of living systems.
Results: Genomics Portals platform integrates access to an extensive knowledge base and a large database ofhuman, mouse, and rat genomics data with basic analytical visualization tools. It provides the context for analyzingand interpreting new experimental data and the tool for effective mining of a large number of publicly availablegenomics datasets stored in the back-end databases. The uniqueness of this platform lies in the volume and thediversity of genomics data that can be accessed and analyzed (gene expression, ChIP-chip, ChIP-seq, epigenomics,computationally predicted binding sites, etc), and the integration with an extensive knowledge base that can beused in such analysis.
Conclusion: The integrated access to primary genomics data, functional knowledge and analytical tools makesGenomics Portals platform a unique tool for interpreting results of new genomics experiments and for mining thevast amount of data stored in the Genomics Portals backend databases. Genomics Portals can be accessed andused freely at http://GenomicsPortals.org.
BackgroundA large amount of experimental data generated by mod-ern high-throughput technologies is available throughpublic repositories such as GEO [1] and ArrayExpress[2]. Our knowledge about molecular interaction net-works and functional biological pathways is rapidlyexpanding and is being systematically organized intofunctionally related gene lists [3,4]. Jointly these twosources of information hold a tremendous potential forenhancing the interpretation of experimental results andgaining new insights into function of living systems.Mining such data has been a productive avenue in gen-erating new hypothesis as well as validating experimen-tal results [5]. Unfortunately, repositories currently
housing much of the primary genomics data lackmechanisms for effective querying and analysis.Inadequacies of the major data repositories to serve as
access points to genomics data have resulted in numer-ous fragmented projects providing access to data from asingle dataset [6,7], a set of thematically related datasets[8-10], or the results of genomics data analyses [11-15].Except for the GeneChaser server [11], which providesaccess to results of differential expression analysis for allGEO DataSets, most of these resources are relativelysmall scale. Furthermore, they are generally focused ona single data type (mostly gene expression) and none ofthem facilitate the use of a functional knowledge base toconstruct query gene lists.On the other end of the spectrum, several prominent
efforts are directed towards constructing lists of func-tionally related gene lists [3,4], but they do not offer thecapacity for querying genomics data based on these lists.The small exception is the capability of MSigDB server
* Correspondence: [email protected]† Contributed equally1Laboratory for Statistical Genomics and Systems Biology, Department ofEnvironmental Health, University of Cincinnati College of Medicine, 3223Eden Av. ML 56, Cincinnati OH 45267-0056, USA
Shinde et al. BMC Genomics 2010, 11:27http://www.biomedcentral.com/1471-2164/11/27
© 2010 Shinde et al; licensee BioMed Central Ltd. This is an Open Access article distributed under the terms of the Creative CommonsAttribution License (http://creativecommons.org/licenses/by/2.0), which permits unrestricted use, distribution, and reproduction inany medium, provided the original work is properly cited.
[4] to submit directly list of genes to the Gene Atlas ser-ver providing access to two microarray datasets [7].The power of integrative analyses utilizing genomics
data and functional knowledge has been demonstratedin the analysis of individual datasets [16] and systematicefforts to expand our understanding of gene functions[17-20]. In some cases, mining of new functional rela-tionships predicted by integrative analysis of functionalknowledge and genomics data is facilitated through pre-dictive web servers [17]. Despite all these efforts, theintegrated resources for accessing and analysis of bothfunctional knowledge and the primary genomics data ona large scale are still lacking. Genomics Portals platformwas designed to fill this gap.The access to gene expression regulatory data such
ChIP-chip and ChIP-seq transcription factor bindingand epigenomics data is even more difficult and fewerresources are available. Most of the datasets are stilldeposited to the main genomics repositories. However,the only meaningful way to access this data is throughUCSC and ENSEMBL Genome Browsers [21,22]. Bothof these browsers are genomic feature - centric and donot provide meaningful analysis options and graphicaldisplays for multiple gene promoters at the same time.On the other hand, presenting such data using heatmapsof many genes at a time has been commonly used inpublications and is an effective way of exposing patternsin such data [23]. In the spirit of “group of genesqueries” used throughout Genomics Portals, we facilitatethe analysis and graphical presentation of this data inthe form of heatmaps for a fixed window around thetranscription start site and the whole list of genes at atime. We are unaware of any server other than Geno-mics Portals that offers similar functionality for acces-sing and analyzing this kind of data.Genomics Portals platform was designed around the
three conceptual problems faced daily by biomedicalscientists:1. Characterizing experimentally derived gene lists
in the context of relevant publicly accessible geno-mics data (>82,000 genome scale data vectors; morethan 1.8 billion data points). By simply pasting theexperimentally derived gene list (e.g. differentiallyexpressed genes, co-expressed genes, transcription factorregulated genes, epigenetically modified genes, etc) intothe query box and then selecting the relevant datasets,one is able to download the primary data, perform basicanalysis and generate publication-quality graphicsdepicting the expression patterns of the genes queried.The whole process can take less than one minute.2. Functional analysis of newly generated data. By
depositing newly generated data into Genomics Portalsdatabases, one can leverage extensive knowledge base(>20,000 gene lists specific to biological pathways,
diseases, transcriptional factor regulatory domains, etc),or browse our collection of analytical results to con-struct meaningful gene lists for querying their own data.3. Integrative mining of public genomics data.
Researchers can simply use the knowledge base andtheir own imagination to construct query gene lists andselect genomics datasets to mine.The conceptual structure of Genomics Portals is
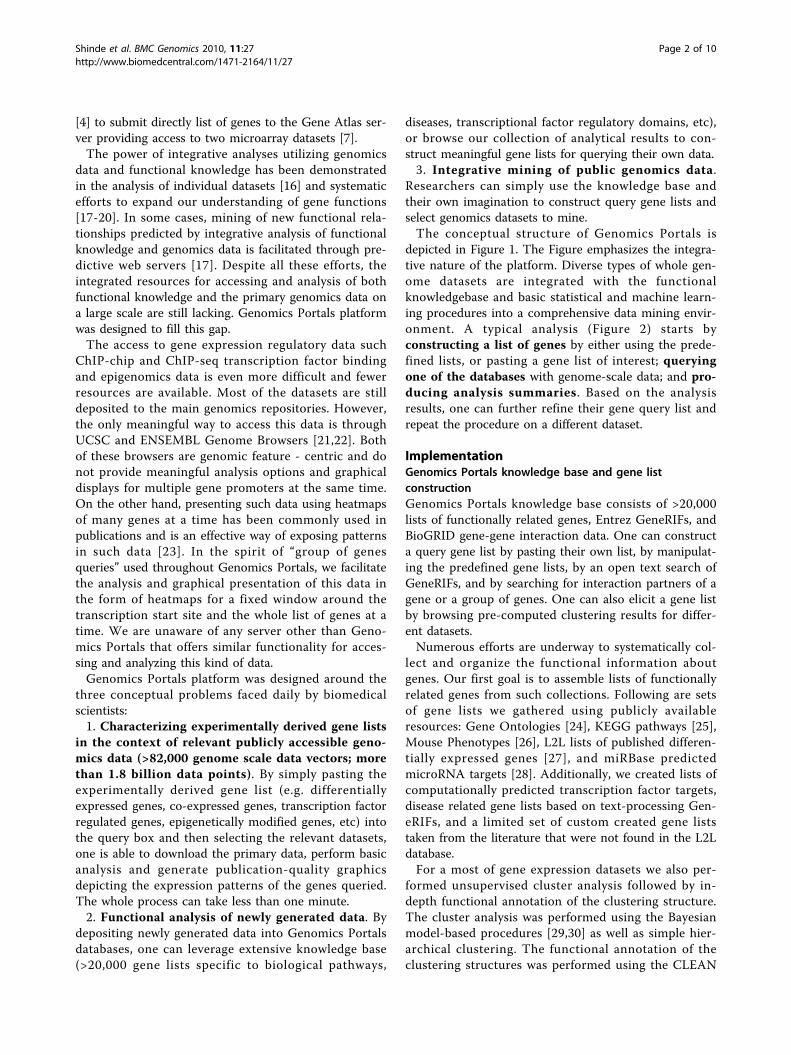
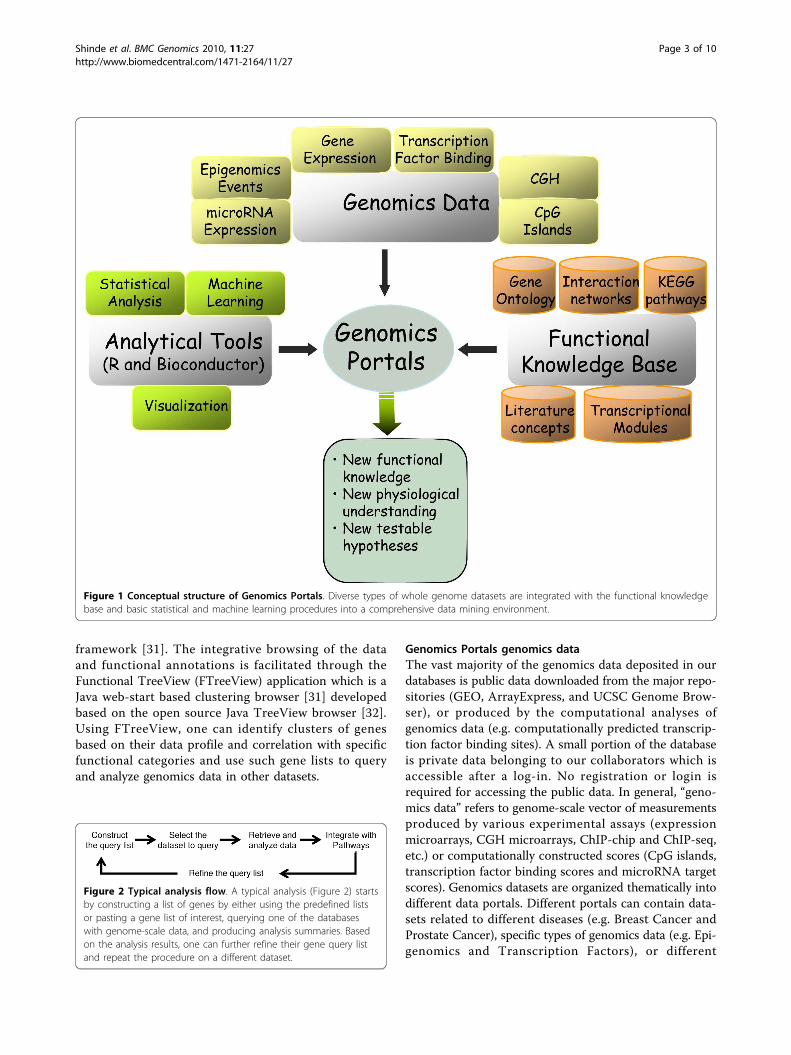
depicted in Figure 1. The Figure emphasizes the integra-tive nature of the platform. Diverse types of whole gen-ome datasets are integrated with the functionalknowledgebase and basic statistical and machine learn-ing procedures into a comprehensive data mining envir-onment. A typical analysis (Figure 2) starts byconstructing a list of genes by either using the prede-fined lists, or pasting a gene list of interest; queryingone of the databases with genome-scale data; and pro-ducing analysis summaries. Based on the analysisresults, one can further refine their gene query list andrepeat the procedure on a different dataset.
ImplementationGenomics Portals knowledge base and gene listconstructionGenomics Portals knowledge base consists of >20,000lists of functionally related genes, Entrez GeneRIFs, andBioGRID gene-gene interaction data. One can constructa query gene list by pasting their own list, by manipulat-ing the predefined gene lists, by an open text search ofGeneRIFs, and by searching for interaction partners of agene or a group of genes. One can also elicit a gene listby browsing pre-computed clustering results for differ-ent datasets.Numerous efforts are underway to systematically col-
lect and organize the functional information aboutgenes. Our first goal is to assemble lists of functionallyrelated genes from such collections. Following are setsof gene lists we gathered using publicly availableresources: Gene Ontologies [24], KEGG pathways [25],Mouse Phenotypes [26], L2L lists of published differen-tially expressed genes [27], and miRBase predictedmicroRNA targets [28]. Additionally, we created lists ofcomputationally predicted transcription factor targets,disease related gene lists based on text-processing Gen-eRIFs, and a limited set of custom created gene liststaken from the literature that were not found in the L2Ldatabase.For a most of gene expression datasets we also per-
formed unsupervised cluster analysis followed by in-depth functional annotation of the clustering structure.The cluster analysis was performed using the Bayesianmodel-based procedures [29,30] as well as simple hier-archical clustering. The functional annotation of theclustering structures was performed using the CLEAN
Shinde et al. BMC Genomics 2010, 11:27http://www.biomedcentral.com/1471-2164/11/27
Page 2 of 10
framework [31]. The integrative browsing of the dataand functional annotations is facilitated through theFunctional TreeView (FTreeView) application which is aJava web-start based clustering browser [31] developedbased on the open source Java TreeView browser [32].Using FTreeView, one can identify clusters of genesbased on their data profile and correlation with specificfunctional categories and use such gene lists to queryand analyze genomics data in other datasets.
Genomics Portals genomics dataThe vast majority of the genomics data deposited in ourdatabases is public data downloaded from the major repo-sitories (GEO, ArrayExpress, and UCSC Genome Brow-ser), or produced by the computational analyses ofgenomics data (e.g. computationally predicted transcrip-tion factor binding sites). A small portion of the databaseis private data belonging to our collaborators which isaccessible after a log-in. No registration or login isrequired for accessing the public data. In general, “geno-mics data” refers to genome-scale vector of measurementsproduced by various experimental assays (expressionmicroarrays, CGH microarrays, ChIP-chip and ChIP-seq,etc.) or computationally constructed scores (CpG islands,transcription factor binding scores and microRNA targetscores). Genomics datasets are organized thematically intodifferent data portals. Different portals can contain data-sets related to different diseases (e.g. Breast Cancer andProstate Cancer), specific types of genomics data (e.g. Epi-genomics and Transcription Factors), or different
Figure 1 Conceptual structure of Genomics Portals. Diverse types of whole genome datasets are integrated with the functional knowledgebase and basic statistical and machine learning procedures into a comprehensive data mining environment.
Figure 2 Typical analysis flow. A typical analysis (Figure 2) startsby constructing a list of genes by either using the predefined listsor pasting a gene list of interest, querying one of the databaseswith genome-scale data, and producing analysis summaries. Basedon the analysis results, one can further refine their gene query listand repeat the procedure on a different dataset.
Shinde et al. BMC Genomics 2010, 11:27http://www.biomedcentral.com/1471-2164/11/27
Page 3 of 10

biological processes (e.g. Development). The same datasetcan be assigned to different portals.Gene expression dataGene expression data in our databases consists of thecomplete collection of human, mouse and rat GEODataSets (>1,500), and close to 100 manually curatedGEO series of particular interest. The majority of themanually curated datasets are not available as GDSDataSets. For some of the manually curated datasets wehave re-processed the raw outputs (e.g. CEL and GPRfiles).ChIP-chip and ChIP-seq dataMost of these datasets have been manually curated andre-processed. The data is summarized as the averagemeasurement intensities within non-overlapping 50 bpwindows for the -4 kb to +1 kb regulatory regionaround each RefSeq sequence for the given genomebuild. This representation provides for a straightforwardmanipulation and graphical representation of such datafor gene lists. The definition of “measurement intensi-ties” depends on the primary data that was downloadedfrom the repository and it can range from typical log2-scaled fluorescence intensities for hybridization-basedexperiments to sequence read counts and variousapproaches to identifying and quantifying “peaks” forhigh-throughput sequencing technologies.Computationally constructed scoresMost of this type of data is derived from computationalassessments of DNA features within the genomic regula-tory regions such the existence of transcription factor(TF) binding motifs and CpG islands. Computationallypredicted transcription factor binding scores are pro-vided as whole gene (i.e. Refseq) scores that assess theoverall likelihood of a transcription factor binding withinthe gene’s promoter and high resolution datasets thatprovide locations of putative TF binding sites at thesame resolution used for ChIP-chip and ChIP-seq data.All scores were calculated using in-house developedscoring algorithms and TRANSFAC transcription factorbinding motif definitions [33].Genomics Portals analysis toolsIn designing Genomics Portals we sought to strike a bal-ance between the key limiting factors such as the com-plexity of query interfaces and the computationalcomplexity of the analyses performed on the data, andthe usefulness of the results produced. The portal isdesigned so that a basic output of the genomics dataqueries can be obtained in less than one minute withonly a few clicks of the mouse. This includes query ofour knowledge base or pasting one’s own gene list,selecting the genomics data to query, and retrieving thedata in the form of a spreadsheet or an R ExpressionSet.At this point, the user can either use their own dataanalytical tools or perform basic manipulation and
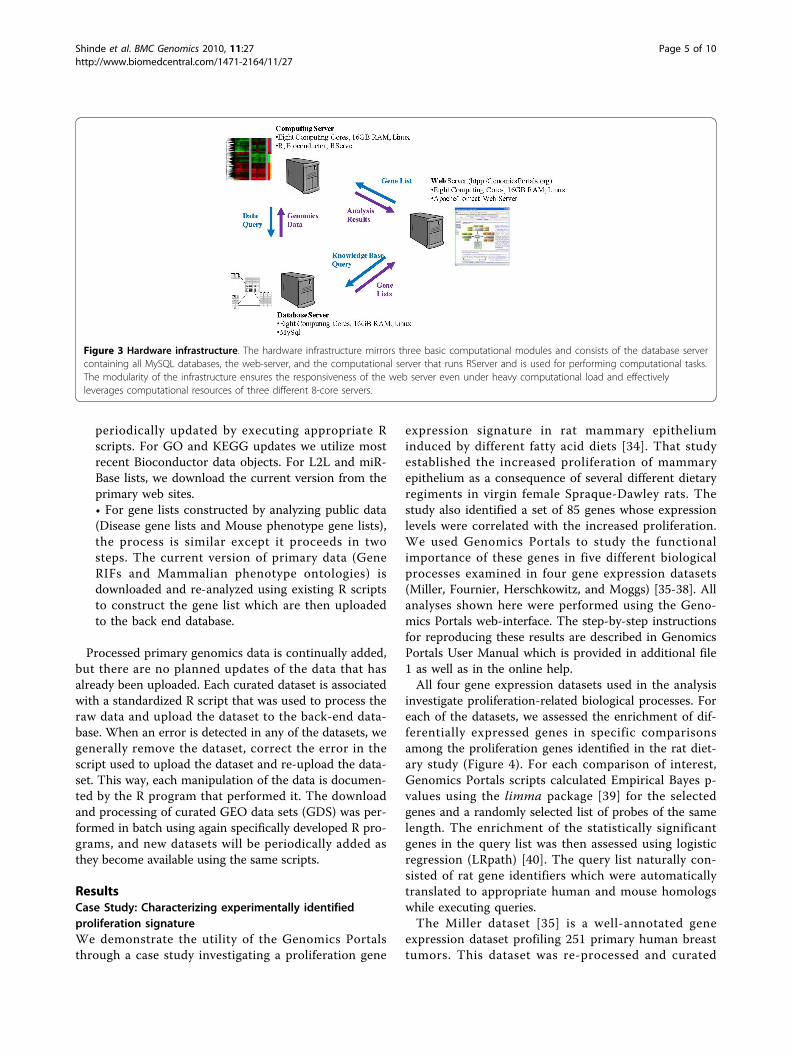
analysis of the retrieved data within the portal. Subse-quent analyses are performed using the retrieved dataand the simple interface that deploys R and Bioconduc-tor procedures using the Rserver infrastructure. Thebasic manipulations consist of sub-setting the data,selecting grouping variables for the samples in the data-sets, identifying differentially expressed genes, clusteranalysis, assessing enrichment of differentially expressedgenes within the query list, etc. The results of such ana-lyses are provided as static annotated heatmaps, or canbe browsed using our FTreeView browser. Analyses ofresults can also be incorporated within the images ofKEGG pathways.Genomics Portals computational infrastructureThe basic computational infrastructure behind Geno-mics Portals consist of Java-based web interfaces anddata viewers, MySQL databases for organizing knowl-edge base and genomics data, and R scripts for perform-ing analysis of retrieved data using the RServerinfrastructure to connect Java with R. The relationaldatabases storing genomics data are loosely based onthe MySQL version of ArrayExpress, MaxD http://www.bioinf.man.ac.uk. Query gene lists are constructed andgenomics datasets selected using Java-based interfaces.Java programs then call appropriate R scripts that querygenomics databases (using RMySQL) and perform theanalysis using various Bioconductor packages. The hard-ware infrastructure mirrors these three basic computa-tional modules (Figure 3) and consists of the databaseserver containing all MySQL databases, the web-server,and the computational server that runs RServer and isused for performing computational tasks. The modular-ity of the infrastructure ensures the responsiveness ofthe web server even under heavy computational loadand effectively leverages computational resources ofthree different 8-core servers.Maintenance and UpdatesProcessing and uploading of all data in back-end data-bases are performed by executing standardized R scriptsutilizing RMySQL package. All scripts performing anykind of operation on the back-end databases are docu-mented and archived. In principle, we are able to re-cre-ate all databases from raw data by re-running archivedR scripts. All updates to the data housed in the back-end databases are semi-automated, meaning that stan-dardized R scripts performing updates are manually exe-cuted. Three aspects of the portal are periodicallyupdated:
• The gene annotation table which is constructed bycombining gene_info and homologene.data tablesdownloaded from respective NCBI ftp sites.• Gene lists constructed from public annotationefforts (GO, KEGG, L2L and miRBase) are
Shinde et al. BMC Genomics 2010, 11:27http://www.biomedcentral.com/1471-2164/11/27
Page 4 of 10
periodically updated by executing appropriate Rscripts. For GO and KEGG updates we utilize mostrecent Bioconductor data objects. For L2L and miR-Base lists, we download the current version from theprimary web sites.• For gene lists constructed by analyzing public data(Disease gene lists and Mouse phenotype gene lists),the process is similar except it proceeds in twosteps. The current version of primary data (GeneRIFs and Mammalian phenotype ontologies) isdownloaded and re-analyzed using existing R scriptsto construct the gene list which are then uploadedto the back end database.
Processed primary genomics data is continually added,but there are no planned updates of the data that hasalready been uploaded. Each curated dataset is associatedwith a standardized R script that was used to process theraw data and upload the dataset to the back-end data-base. When an error is detected in any of the datasets, wegenerally remove the dataset, correct the error in thescript used to upload the dataset and re-upload the data-set. This way, each manipulation of the data is documen-ted by the R program that performed it. The downloadand processing of curated GEO data sets (GDS) was per-formed in batch using again specifically developed R pro-grams, and new datasets will be periodically added asthey become available using the same scripts.
ResultsCase Study: Characterizing experimentally identifiedproliferation signatureWe demonstrate the utility of the Genomics Portalsthrough a case study investigating a proliferation gene
expression signature in rat mammary epitheliuminduced by different fatty acid diets [34]. That studyestablished the increased proliferation of mammaryepithelium as a consequence of several different dietaryregiments in virgin female Spraque-Dawley rats. Thestudy also identified a set of 85 genes whose expressionlevels were correlated with the increased proliferation.We used Genomics Portals to study the functionalimportance of these genes in five different biologicalprocesses examined in four gene expression datasets(Miller, Fournier, Herschkowitz, and Moggs) [35-38]. Allanalyses shown here were performed using the Geno-mics Portals web-interface. The step-by-step instructionsfor reproducing these results are described in GenomicsPortals User Manual which is provided in additional file1 as well as in the online help.All four gene expression datasets used in the analysis
investigate proliferation-related biological processes. Foreach of the datasets, we assessed the enrichment of dif-ferentially expressed genes in specific comparisonsamong the proliferation genes identified in the rat diet-ary study (Figure 4). For each comparison of interest,Genomics Portals scripts calculated Empirical Bayes p-values using the limma package [39] for the selectedgenes and a randomly selected list of probes of the samelength. The enrichment of the statistically significantgenes in the query list was then assessed using logisticregression (LRpath) [40]. The query list naturally con-sisted of rat gene identifiers which were automaticallytranslated to appropriate human and mouse homologswhile executing queries.The Miller dataset [35] is a well-annotated gene
expression dataset profiling 251 primary human breasttumors. This dataset was re-processed and curated
Figure 3 Hardware infrastructure. The hardware infrastructure mirrors three basic computational modules and consists of the database servercontaining all MySQL databases, the web-server, and the computational server that runs RServer and is used for performing computational tasks.The modularity of the infrastructure ensures the responsiveness of the web server even under heavy computational load and effectivelyleverages computational resources of three different 8-core servers.
Shinde et al. BMC Genomics 2010, 11:27http://www.biomedcentral.com/1471-2164/11/27
Page 5 of 10
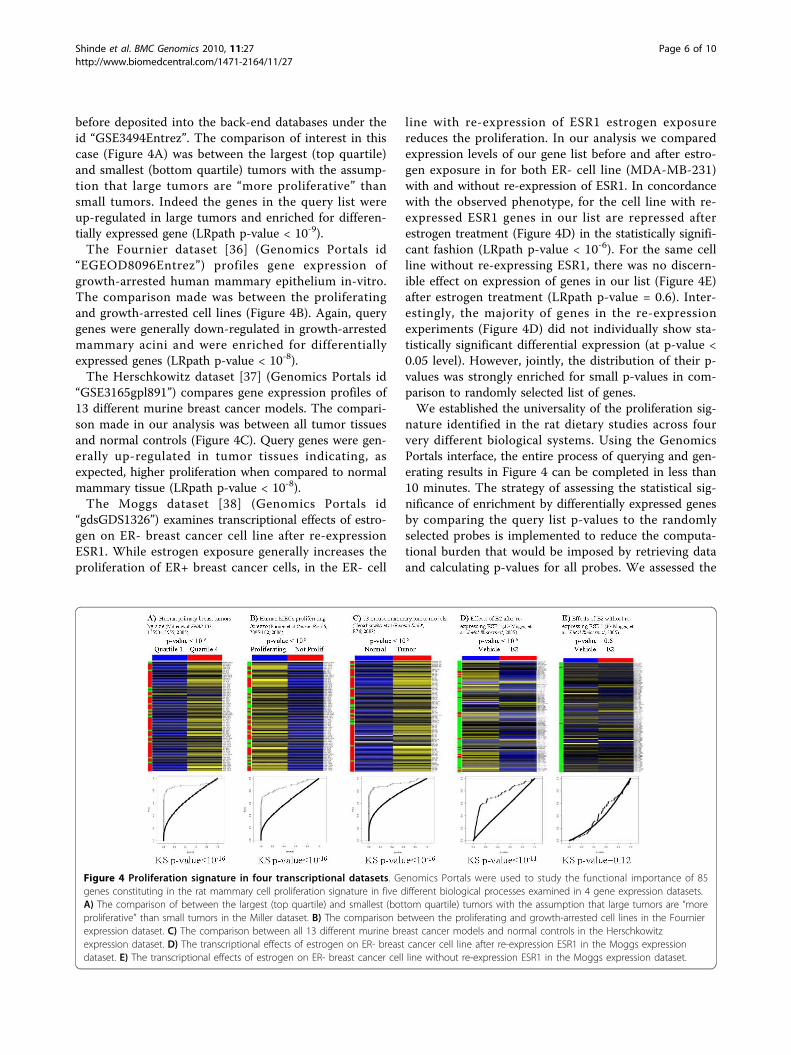
before deposited into the back-end databases under theid “GSE3494Entrez”. The comparison of interest in thiscase (Figure 4A) was between the largest (top quartile)and smallest (bottom quartile) tumors with the assump-tion that large tumors are “more proliferative” thansmall tumors. Indeed the genes in the query list wereup-regulated in large tumors and enriched for differen-tially expressed gene (LRpath p-value < 10-9).The Fournier dataset [36] (Genomics Portals id
“EGEOD8096Entrez”) profiles gene expression ofgrowth-arrested human mammary epithelium in-vitro.The comparison made was between the proliferatingand growth-arrested cell lines (Figure 4B). Again, querygenes were generally down-regulated in growth-arrestedmammary acini and were enriched for differentiallyexpressed genes (LRpath p-value < 10-8).The Herschkowitz dataset [37] (Genomics Portals id
“GSE3165gpl891”) compares gene expression profiles of13 different murine breast cancer models. The compari-son made in our analysis was between all tumor tissuesand normal controls (Figure 4C). Query genes were gen-erally up-regulated in tumor tissues indicating, asexpected, higher proliferation when compared to normalmammary tissue (LRpath p-value < 10-8).The Moggs dataset [38] (Genomics Portals id
“gdsGDS1326”) examines transcriptional effects of estro-gen on ER- breast cancer cell line after re-expressionESR1. While estrogen exposure generally increases theproliferation of ER+ breast cancer cells, in the ER- cell
line with re-expression of ESR1 estrogen exposurereduces the proliferation. In our analysis we comparedexpression levels of our gene list before and after estro-gen exposure in for both ER- cell line (MDA-MB-231)with and without re-expression of ESR1. In concordancewith the observed phenotype, for the cell line with re-expressed ESR1 genes in our list are repressed afterestrogen treatment (Figure 4D) in the statistically signifi-cant fashion (LRpath p-value < 10-6). For the same cellline without re-expressing ESR1, there was no discern-ible effect on expression of genes in our list (Figure 4E)after estrogen treatment (LRpath p-value = 0.6). Inter-estingly, the majority of genes in the re-expressionexperiments (Figure 4D) did not individually show sta-tistically significant differential expression (at p-value <0.05 level). However, jointly, the distribution of their p-values was strongly enriched for small p-values in com-parison to randomly selected list of genes.We established the universality of the proliferation sig-
nature identified in the rat dietary studies across fourvery different biological systems. Using the GenomicsPortals interface, the entire process of querying and gen-erating results in Figure 4 can be completed in less than10 minutes. The strategy of assessing the statistical sig-nificance of enrichment by differentially expressed genesby comparing the query list p-values to the randomlyselected probes is implemented to reduce the computa-tional burden that would be imposed by retrieving dataand calculating p-values for all probes. We assessed the
Figure 4 Proliferation signature in four transcriptional datasets. Genomics Portals were used to study the functional importance of 85genes constituting in the rat mammary cell proliferation signature in five different biological processes examined in 4 gene expression datasets.A) The comparison of between the largest (top quartile) and smallest (bottom quartile) tumors with the assumption that large tumors are “moreproliferative” than small tumors in the Miller dataset. B) The comparison between the proliferating and growth-arrested cell lines in the Fournierexpression dataset. C) The comparison between all 13 different murine breast cancer models and normal controls in the Herschkowitzexpression dataset. D) The transcriptional effects of estrogen on ER- breast cancer cell line after re-expression ESR1 in the Moggs expressiondataset. E) The transcriptional effects of estrogen on ER- breast cancer cell line without re-expression ESR1 in the Moggs expression dataset.
Shinde et al. BMC Genomics 2010, 11:27http://www.biomedcentral.com/1471-2164/11/27
Page 6 of 10
validity of this strategy for the four datasets at hand byexamining off-line the empirical cumulative distributionfunctions of p-values for genes in the query list (opencircles) and genes probes not associated with genes inthe query list (solid line) (Figure 4). For all four situa-tions yielding statistically significant LRpath tests, thequery list was obviously enriched for differentiallyexpressed genes, which was also confirmed by the Kolo-mogorov-Smirnov test for differences between the twodistributions. For the non-statistically significant com-parison (Figure 4E), there was no difference between theempirical distributions functions for all probes (Figure4E).In addition to using gene expression data, we further
characterized our proliferation signature using ChIP-seqdata for E2F1 transcription factor (TF) [41] and by com-paring histone modification marks between differen-tiated mouse embryonic fibroblasts (MEF) and a stem-cell “like” cell line [42]. In the original paper, anextended set of genes identified through cluster analysiswas linked to regulatory domain of E2F transcriptionfactors by examining the overlap with E2F targets estab-lished in ChIP-chip [43] and global expression profiling
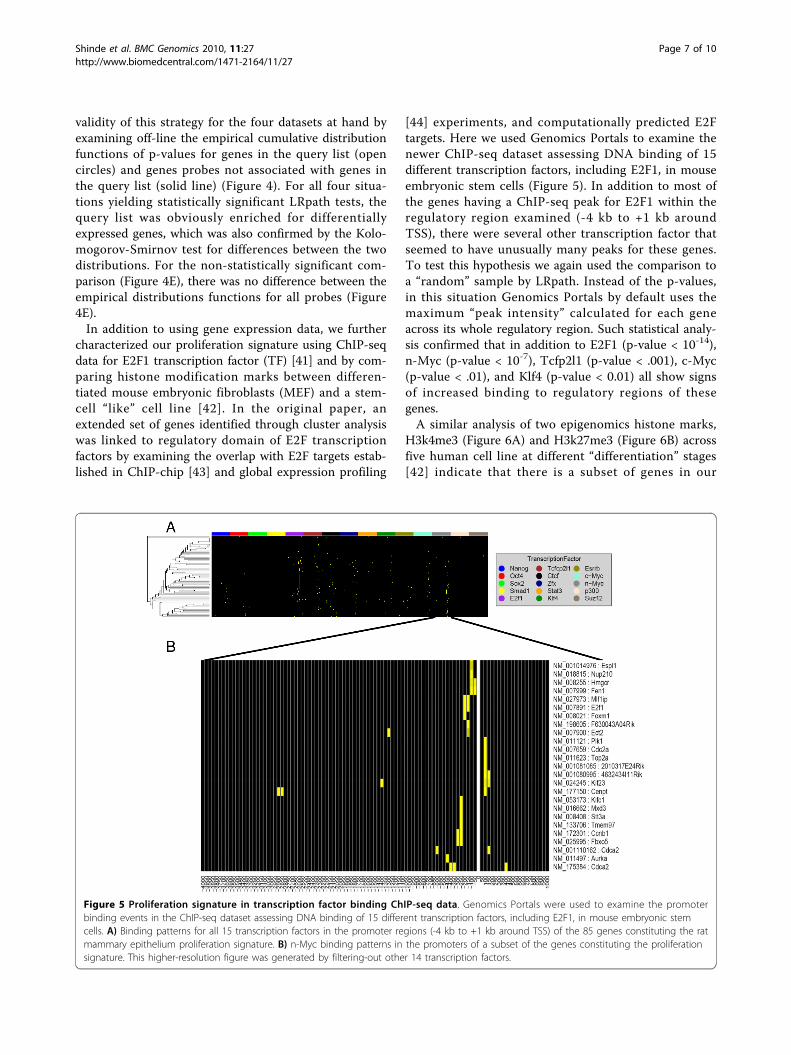
[44] experiments, and computationally predicted E2Ftargets. Here we used Genomics Portals to examine thenewer ChIP-seq dataset assessing DNA binding of 15different transcription factors, including E2F1, in mouseembryonic stem cells (Figure 5). In addition to most ofthe genes having a ChIP-seq peak for E2F1 within theregulatory region examined (-4 kb to +1 kb aroundTSS), there were several other transcription factor thatseemed to have unusually many peaks for these genes.To test this hypothesis we again used the comparison toa “random” sample by LRpath. Instead of the p-values,in this situation Genomics Portals by default uses themaximum “peak intensity” calculated for each geneacross its whole regulatory region. Such statistical analy-sis confirmed that in addition to E2F1 (p-value < 10-14),n-Myc (p-value < 10-7), Tcfp2l1 (p-value < .001), c-Myc(p-value < .01), and Klf4 (p-value < 0.01) all show signsof increased binding to regulatory regions of thesegenes.A similar analysis of two epigenomics histone marks,
H3k4me3 (Figure 6A) and H3k27me3 (Figure 6B) acrossfive human cell line at different “differentiation” stages[42] indicate that there is a subset of genes in our
Figure 5 Proliferation signature in transcription factor binding ChIP-seq data. Genomics Portals were used to examine the promoterbinding events in the ChIP-seq dataset assessing DNA binding of 15 different transcription factors, including E2F1, in mouse embryonic stemcells. A) Binding patterns for all 15 transcription factors in the promoter regions (-4 kb to +1 kb around TSS) of the 85 genes constituting the ratmammary epithelium proliferation signature. B) n-Myc binding patterns in the promoters of a subset of the genes constituting the proliferationsignature. This higher-resolution figure was generated by filtering-out other 14 transcription factors.
Shinde et al. BMC Genomics 2010, 11:27http://www.biomedcentral.com/1471-2164/11/27
Page 7 of 10
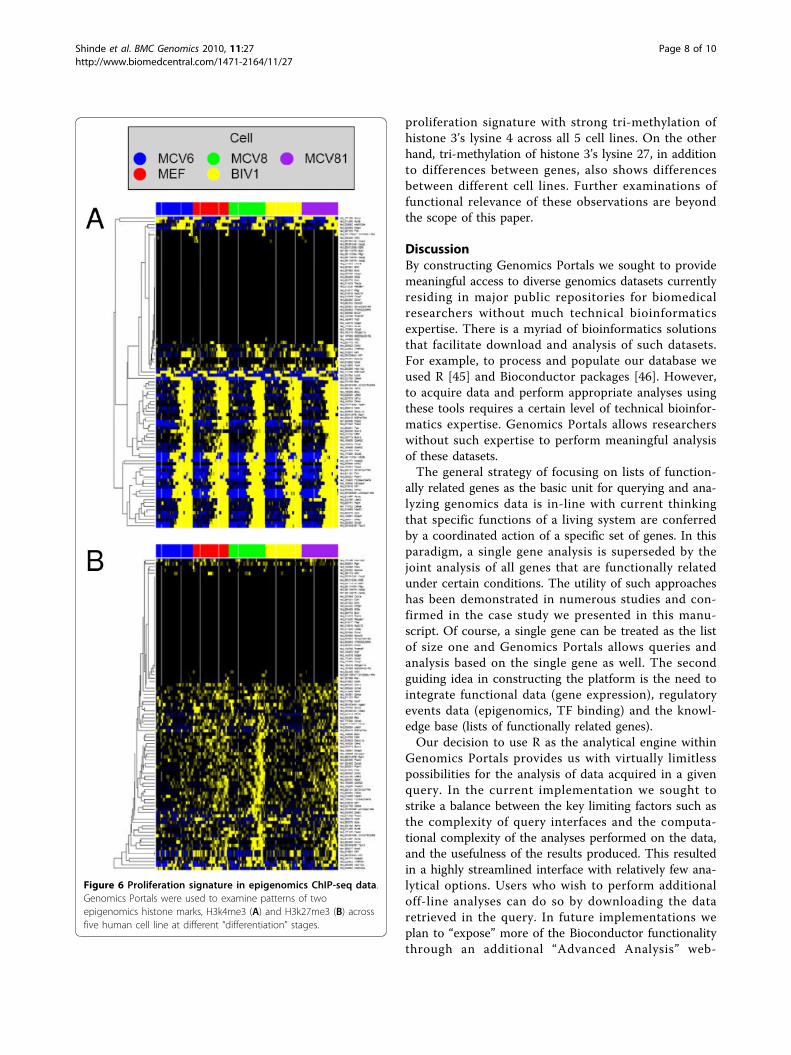
proliferation signature with strong tri-methylation ofhistone 3’s lysine 4 across all 5 cell lines. On the otherhand, tri-methylation of histone 3’s lysine 27, in additionto differences between genes, also shows differencesbetween different cell lines. Further examinations offunctional relevance of these observations are beyondthe scope of this paper.
DiscussionBy constructing Genomics Portals we sought to providemeaningful access to diverse genomics datasets currentlyresiding in major public repositories for biomedicalresearchers without much technical bioinformaticsexpertise. There is a myriad of bioinformatics solutionsthat facilitate download and analysis of such datasets.For example, to process and populate our database weused R [45] and Bioconductor packages [46]. However,to acquire data and perform appropriate analyses usingthese tools requires a certain level of technical bioinfor-matics expertise. Genomics Portals allows researcherswithout such expertise to perform meaningful analysisof these datasets.The general strategy of focusing on lists of function-
ally related genes as the basic unit for querying and ana-lyzing genomics data is in-line with current thinkingthat specific functions of a living system are conferredby a coordinated action of a specific set of genes. In thisparadigm, a single gene analysis is superseded by thejoint analysis of all genes that are functionally relatedunder certain conditions. The utility of such approacheshas been demonstrated in numerous studies and con-firmed in the case study we presented in this manu-script. Of course, a single gene can be treated as the listof size one and Genomics Portals allows queries andanalysis based on the single gene as well. The secondguiding idea in constructing the platform is the need tointegrate functional data (gene expression), regulatoryevents data (epigenomics, TF binding) and the knowl-edge base (lists of functionally related genes).Our decision to use R as the analytical engine within
Genomics Portals provides us with virtually limitlesspossibilities for the analysis of data acquired in a givenquery. In the current implementation we sought tostrike a balance between the key limiting factors such asthe complexity of query interfaces and the computa-tional complexity of the analyses performed on the data,and the usefulness of the results produced. This resultedin a highly streamlined interface with relatively few ana-lytical options. Users who wish to perform additionaloff-line analyses can do so by downloading the dataretrieved in the query. In future implementations weplan to “expose” more of the Bioconductor functionalitythrough an additional “Advanced Analysis” web-
Figure 6 Proliferation signature in epigenomics ChIP-seq data.Genomics Portals were used to examine patterns of twoepigenomics histone marks, H3k4me3 (A) and H3k27me3 (B) acrossfive human cell line at different “differentiation” stages.
Shinde et al. BMC Genomics 2010, 11:27http://www.biomedcentral.com/1471-2164/11/27
Page 8 of 10
interface while still keeping the current simple interfaceas the main option.Other natural extensions of current infrastructure will
be allowing for simultaneous queries of multiple datasetsand addition of data from other organisms. The imple-mentation of simultaneous queries of multiple datasetswill be straightforward. However, query times and com-putational resources required to perform such querieswill be additive in the number of datasets queried. Thisoption will be included once we ascertain that our com-putational infrastructure is sufficiently robust to providethe current level of interactivity at such increased levelof functionality. Expanding the data coverage to anyother organism covered by Entrez Gene identifiers willalso be rather straightforward. Since genomics data fordifferent species always reside in different databases,adding such data will almost certainly not affect the per-formance of the portal.The case study presented here is demonstrating the
usage of only a small portion of the platform. Compre-hensive online documentation is provided for completedescription of the data and analytical options availablethrough Genomics Portals.
ConclusionsGenomics Portals represents a powerful new tool forgaining knowledge from results of new genomics experi-ments as well as for mining a large collection of primarygenome-scale datasets.
Availability and requirementsProject name: Genomics PortalsProject home page: http://GenomicsPortals.orgOperating system: platform independentProgramming language: Java, MySQL, ROther requirements: NoneLicense: The tool is available online free of chargeAny restrictions to use by non-academics: None
Additional file 1: Genomics Portals User Manual. The online help filecontaining screenshots and step-by-step instructions on how to useGenomics Portals.Click here for file[ http://www.biomedcentral.com/content/supplementary/1471-2164-11-27-S1.PDF ]
AcknowledgementsThis research was supported by grants from the National Human GenomeResearch Institute (R01 HG003749), National Library of Medicine (R21LM009662) and NIEHS Center for Environmental Genetics grant (P30ES06096).
Author details1Laboratory for Statistical Genomics and Systems Biology, Department ofEnvironmental Health, University of Cincinnati College of Medicine, 3223Eden Av. ML 56, Cincinnati OH 45267-0056, USA. 2Department of
Environmental Health, University of Cincinnati College of Medicine, 3223Eden Av. ML 56, Cincinnati OH 45267-0056, USA.
Authors’ contributionsKS developed the database infrastructure, tools for populating databases andweb-interfaces for querying databases, MP participated in the overall design,developed the protocols and wrote R scripts for performing the analysesand producing graphical displays, MM conceived the portal, developedinitial scripts for processing and uploading data and guided thedevelopment of all aspects of the portal, JF processed and analyzed asignificant number of public datasets, JC developed protocols for processingand uploading, and processed most of the ChIP-chip and ChIP-seq data, QLprocessed and analyzed a significant portion of curated datasets, ZHcomputed the predicted transcription factor binding sites, VJ developed andintegrated the FTreeView browser, KG assisted with scoring computationallythe likelihood of transcription factors binding, JM provided importantfeedback through incorporating the use of the portal in several graduatecourses he is teaching. All authors read and approved the final manuscript
Received: 10 September 2009Accepted: 13 January 2010 Published: 13 January 2010
References1. Barrett T, Suzek TO, Troup DB, Wilhite SE, Ngau WC, Ledoux P, Rudnev D,
Lash AE, Fujibuchi W, Edgar R: NCBI GEO: mining millions of expressionprofiles–database and tools. Nucleic Acids Res 2005, , 33 Database: D562-D566.
2. Parkinson H, Sarkans U, Shojatalab M, Abeygunawardena N, Contrino S,Coulson R, Farne A, Lara GG, Holloway E, Kapushesky M, et al: ArrayExpress- a public repository for microarray gene expression data at the EBI.Nucleic Acids Res 2005, D553-D555.
3. Sherman B, Huang D, Tan Q, Guo Y, Bour S, Liu D, Stephens R, Baseler M,Lane HC, Lempicki R: DAVID Knowledgebase: a gene-centered databaseintegrating heterogeneous gene annotation resources to facilitate high-throughput gene functional analysis. BMC Bioinformatics 2007, 8:426.
4. Subramanian A, Tamayo P, Mootha VK, Mukherjee S, Ebert BL, Gillette MA,Paulovich A, Pomeroy SL, Golub TR, Lander ES, et al: Gene set enrichmentanalysis: a knowledge-based approach for interpreting genome-wideexpression profiles. Proc Natl Acad Sci USA 2005, 102:15545-15550.
5. Tomlins SA, Rubin MA, Chinnaiyan AM: Integrative biology of prostatecancer progression 2. Annu Rev Pathol 2006, 1:243-271.
6. Rakyan VK, Down TA, Thorne NP, Flicek P, Kulesha E, Graf S, Tomazou EM,Backdahl L, Johnson N, Herberth M, et al: An integrated resource forgenome-wide identification and analysis of human tissue-specificdifferentially methylated regions (tDMRs) 9. Genome Res 2008, 18:1518-1529.
7. Su AI, Wiltshire T, Batalov S, Lapp H, Ching KA, Block D, Zhang J, Soden R,Hayakawa M, Kreiman G, et al: A gene atlas of the mouse and humanprotein-encoding transcriptomes. Proc Natl Acad Sci USA 2004, 101:6062-6067.
8. Faith JJ, Driscoll ME, Fusaro VA, Cosgrove EJ, Hayete B, Juhn FS,Schneider SJ, Gardner TS: Many Microbe Microarrays Database: uniformlynormalized Affymetrix compendia with structured experimentalmetadata. Nucl Acids Res 2008, 36:D866-D870.
9. Hayes KR, Vollrath AL, Zastrow GM, McMillan BJ, Craven M, Jovanovich S,Rank DR, Penn S, Walisser JA, Reddy JK, et al: EDGE: a centralized resourcefor the comparison, analysis, and distribution of toxicogenomicinformation. Mol Pharmacol 2005, 67:1360-1368.
10. Porter CJ, Palidwor GA, Sandie R, Krzyzanowski PM, Muro EM, Perez-Iratxeta C, ndrade-Navarro MA: StemBase: a resource for the analysis ofstem cell gene expression data 1. Methods Mol Biol 2007, 407:137-148.
11. Chen R, Mallelwar R, Thosar A, Venkatasubrahmanyam S, Butte A:GeneChaser: Identifying all biological and clinical conditions in whichgenes of interest are differentially expressed. BMC Bioinformatics 2008,9:548.
12. Kilpinen S, Autio R, Ojala K, Iljin K, Bucher E, Sara H, Pisto T, Saarela M,Skotheim R, Bjorkman M, et al: Systematic bioinformatic analysis ofexpression levels of 17,330 human genes across 9,783 samples from 175types of healthy and pathological tissues. Genome Biology 2008, 9:R139.
Shinde et al. BMC Genomics 2010, 11:27http://www.biomedcentral.com/1471-2164/11/27
Page 9 of 10
13. Kutalik Z, Beckmann JS, Bergmann S: A modular approach for integrativeanalysis of large-scale gene-expression and drug-response data. NatBiotechnol 2008, 26:531-539.
14. Lopez F, Textoris J, Bergon Al, Didier G, Remy E, Granjeaud S, Imbert J,Nguyen C, Puthier D: TranscriptomeBrowser: A Powerful and FlexibleToolbox to Explore Productively the Transcriptional Landscape of theGene Expression Omnibus Database. PLoS ONE 2008, 3:e4001.
15. Segal E, Friedman N, Koller D, Regev A: A module map showingconditional activity of expression modules in cancer. Nat Genet 2004,36:1090-1098.
16. Sartor MA, Schnekenburger M, Marlow JL, Reichard JF, Wang Y, Fan Y,Ma C, Karyala S, Halbleib D, Liu X, et al: Genomewide Analysis of ArylHydrocarbon Receptor Binding Targets Reveals an Extensive Array ofGene Clusters that Control Morphogenic and Developmental Programs.Environ Health Perspect 2009, 117:1139-1146.
17. Guan Y, Myers CL, Lu R, Lemischka IR, Bult CJ, Troyanskaya OG: AGenomewide Functional Network for the Laboratory Mouse. PLoSComput Biol 2008, 4:e1000165.
18. Pena-Castillo L, Tasan M, Myers C, Lee H, Joshi T, Zhang C, Guan Y,Leone M, Pagnani A, Kim W, et al: A critical assessment of Mus musculusgene function prediction using integrated genomic evidence. GenomeBiology 2008, 9:S2.
19. Tasan M, Tian W, Hill D, Gibbons F, Blake J, Roth F: An en massephenotype and function prediction system for Mus musculus. GenomeBiology 2008, 9:S8.
20. Tian W, Zhang L, Tasan M, Gibbons F, King O, Park J, Wunderlich Z,Cherry JM, Roth F: Combining guilt-by-association and guilt-by-profilingto predict Saccharomyces cerevisiae gene function. Genome Biology 2008,9:S7.
21. Hubbard TJP, Aken BL, Ayling S, Ballester B, Beal K, Bragin E, Brent S,Chen Y, Clapham P, Clarke L, et al: Ensembl 2009. Nucl Acids Res 2009, 37:D690-D697.
22. Kuhn RM, Karolchik D, Zweig AS, Wang T, Smith KE, Rosenbloom KR,Rhead B, Raney BJ, Pohl A, Pheasant M, et al: The UCSC Genome BrowserDatabase: update 2009. Nucl Acids Res 2009, 37:D755-D761.
23. Barrera LO, Li Z, Smith AD, Arden KC, Cavenee WK, Zhang MQ, Green RD,Ren B: Genome-wide mapping and analysis of active promoters inmouse embryonic stem cells and adult organs. Genome Res 2008, 18:46-59.
24. Ashburner M, Ball CA, Blake JA, Botstein D, Butler H, Cherry JM, Davis AP,Dolinski K, Dwight SS, Eppig JT, et al: Gene ontology: tool for theunification of biology. The Gene Ontology Consortium. Nat Genet 2000,25:25-29.
25. Kanehisa M, Araki M, Goto S, Hattori M, Hirakawa M, Itoh M, Katayama T,Kawashima S, Okuda S, Tokimatsu T, et al: KEGG for linking genomes tolife and the environment. Nucleic Acids Res 2008, 36:D480-D484.
26. Blake JA, Bult CJ, Eppig JT, Kadin JA, Richardson JE, the Mouse GenomeDatabase Group: The Mouse Genome Database genotypes::phenotypes.Nucl Acids Res 2009, 37:D712-D719.
27. Newman JC, Weiner AM: L2L: a simple tool for discovering the hiddensignificance in microarray expression data. Genome Biol 2005, 6:R81.
28. Griffiths-Jones S, Saini HK, van DS, Enright AJ: miRBase: tools for microRNAgenomics. Nucleic Acids Res 2008, 36:D154-D158.
29. Liu X, Sivaganesan S, Yeung KY, Guo J, Bumgarner RE, Medvedovic M:Context-specific infinite mixtures for clustering gene expression profilesacross diverse microarray dataset. Bioinformatics 2006, 22:1737-1744.
30. Medvedovic M, Sivaganesan S: Bayesian infinite mixture model basedclustering of gene expression profiles. Bioinformatics 2002, 18:1194-1206.
31. Freudenberg JM, Joshi VK, Hu Z, Medvedovic M: CLEAN: CLusteringEnrichment ANalysis. BMC Bioinformatics 2009, 10:234.
32. Saldanha AJ: Java Treeview–extensible visualization of microarray data.Bioinformatics 2004, 20:3246-3248.
33. Wingender E, Dietze P, Karas H, Knuppel R: TRANSFAC: a database ontranscription factors and their DNA binding sites. Nucleic Acids Res 1996,24:238-241.
34. Medvedovic M, Gear R, Freudenberg JM, Schneider J, Bornschein R, Yan M,Mistry MJ, Hendrix H, Karyala S, Halbleib D, et al: Influence of Fatty AcidDiets on Gene Expression in Rat Mammary Epithelial Cells. PhysiolGenomics 2009, 10;38(1):80-8.
35. Miller LD, Smeds J, George J, Vega VB, Vergara L, Ploner A, Pawitan Y,Hall P, Klaar S, Liu ET, et al: From The Cover: An expression signature for
p53 status in human breast cancer predicts mutation status,transcriptional effects, and patient survival. PNAS 2005, 102:13550-13555.
36. Fournier MV, Martin KJ, Kenny PA, Xhaja K, Bosch I, Yaswen P, Bissell MJ:Gene Expression Signature in Organized and Growth-Arrested MammaryAcini Predicts Good Outcome in Breast Cancer. Cancer Res 2006, 66:7095-7102.
37. Herschkowitz J, Simin K, Weigman V, Mikaelian I, Usary J, Hu Z,Rasmussen K, Jones L, Assefnia S, Chandrasekharan S, et al: Identification ofconserved gene expression features between murine mammarycarcinoma models and human breast tumors. Genome Biology 2007, 8:R76.
38. Moggs JG, Murphy TC, Lim FL, Moore DJ, Stuckey R, Antrobus K, Kimber I,Orphanides G: Anti-proliferative effect of estrogen in breast cancer cellsthat re-express ER{alpha} is mediated by aberrant regulation of cell cyclegenes. J Mol Endocrinol 2005, 34:535-551.
39. Smyth GK: Limma: linear models for microarray data. Bioinformatics andComputational Biology Solutions using R and Bioconductor New York:SpringerGentleman R, Carey V, Dudoit S, Irizarry R, Huber W 2005, 397-420.
40. Sartor MA, Leikauf GD, Medvedovic M: LRpath: a logistic regressionapproach for identifying enriched biological groups in gene expressiondata. Bioinformatics 2009, 25:211-217.
41. Chen X, Xu H, Yuan P, Fang F, Huss M, Vega VB, Wong E, Orlov YL,Zhang W, Jiang J, et al: Integration of External Signaling Pathways withthe Core Transcriptional Network in Embryonic Stem Cells. Cell 2008,133:1106-1117.
42. Mikkelsen TS, Hanna J, Zhang X, Ku M, Wernig M, Schorderet P,Bernstein BE, Jaenisch R, Lander ES, Meissner A: Dissecting directreprogramming through integrative genomic analysis 2. Nature 2008,454:49-55.
43. Xu X, Bieda M, Jin VX, Rabinovich A, Oberley MJ, Green R, Farnham PJ: Acomprehensive ChIPGCochip analysis of E2F1, E2F4, and E2F6 in normaland tumor cells reveals interchangeable roles of E2F family members.Genome Res 2007, 17:1550-1561.
44. Kalma Y, Marash L, Lamed Y, Ginsberg D: Expression analysis using DNAmicroarrays demonstrates that E2F-1 up-regulates expression of DNAreplication genes including replication protein A2 3. Oncogene 2001,20:1379-1387.
45. Ihaka R, Gentleman R: R: A language for data analysis and graphics.Journal of Computational and Graphical Statistics 1996, 5:299-314.
46. Gentleman RC, Carey VJ, Bates DM, Bolstad B, Dettling M, Dudoit S, Ellis B,Gautier L, Ge Y, Gentry J, et al: Bioconductor: open software developmentfor computational biology and bioinformatics. Genome Biol 2004, 5:R80.
doi:10.1186/1471-2164-11-27Cite this article as: Shinde et al.: Genomics Portals: integrative web-platform for mining genomics data. BMC Genomics 2010 11:27.
Publish with BioMed Central and every scientist can read your work free of charge
"BioMed Central will be the most significant development for disseminating the results of biomedical research in our lifetime."
Sir Paul Nurse, Cancer Research UK
Your research papers will be:
available free of charge to the entire biomedical community
peer reviewed and published immediately upon acceptance
cited in PubMed and archived on PubMed Central
yours — you keep the copyright
Submit your manuscript here:http://www.biomedcentral.com/info/publishing_adv.asp
BioMedcentral
Shinde et al. BMC Genomics 2010, 11:27http://www.biomedcentral.com/1471-2164/11/27
Page 10 of 10