Embed Size (px)
Citation preview
FLINDERS MINES LIMITED
Geochemical Characterisation of Mine Waste and Tailings Implications for Mine Waste Management
201012-00322-0000-EN-REP-0011
31 July 2012
Level 7, QV1 Building, 250 St. Georges Terrace Perth WA 6000 Australia Telephone: +61 8 9278 8111 Facsimile: +61 8 9278 8110 www.worleyparsons.com ABN 61 001 279 812
© Copyright 2012 WorleyParsons
FLINDERS MINES LIMITED
GEOCHEMICAL CHARACTERISATION OF MINE WASTE AND TAILINGS
IMPLICATIONS FOR MINE WASTE MANAGEMENT
i:\projects\201012-00322 fms vip\2.0 reports\geochem report\201012-00322 fms waste rock management_rev0..doc Page iii 201012-00322 : 0000-EN-REP-0011 Rev 0 : 20 July 2012
CONTENTS
1. INTRODUCTION ................................................................................................. 1
2. ABBREVIATIONS AND DEFINITIONS ..................................................................... 2
3. METHODOLOGY ................................................................................................. 4
3.1 Waste rock assessment ...................................................................................... 4
3.1.1 Static testing .......................................................................................... 5
3.1.2 Kinetic testing ........................................................................................ 6
3.1.3 Sulfur content: Basement materials ......................................................... 6
3.2 Tailings material ................................................................................................ 6
4. RESULTS ............................................................................................................ 7
4.1 Waste rock assessment ...................................................................................... 7
4.1.1 Static test results .................................................................................... 7
Delta pit ............................................................................................................ 7
Eagle pit ............................................................................................................ 7
Champion pit .................................................................................................... 8
4.1.2 Kinetic test results .................................................................................. 8
Delta pit ............................................................................................................ 8
Waste regolith ................................................................................................... 8
Waste bedrock ................................................................................................... 9
4.1.3 In-situ sulfur concentrations ................................................................... 9
4.2 Tailings material .............................................................................................. 10
5. DISCUSSION AND CONCLUSIONS ...................................................................... 11
5.1 Waste rock ...................................................................................................... 11
5.1.1 Waste regolith ...................................................................................... 11
5.1.2 Waste bedrock ...................................................................................... 11
5.1.3 In-situ sulfur concentrations ................................................................. 12
5.2 Tailings ........................................................................................................... 12
**PLEASE DO NOT DELETE APPENDICES BELOW, IT WILL NOT PRINT**
FLINDERS MINES LIMITED
GEOCHEMICAL CHARACTERISATION OF MINE WASTE AND TAILINGS
IMPLICATIONS FOR MINE WASTE MANAGEMENT
i:\projects\201012-00322 fms vip\2.0 reports\geochem report\201012-00322 fms waste rock management_rev0..doc Page iv 201012-00322 : 0000-EN-REP-0011 Rev 0 : 20 July 2012
Appendices
APPENDIX A Geochemical characterisation of mine-waste samples from Delta, Eagle, and Champion pits - implications for mine-waste management
APPENDIX B Geochemical characterisation of process-tailings-solids sample and management implications
APPENDIX C Total sulfur levels–all pits
Tables
TABLE 1 Guidelines for assessing ARD from materials < & > 0.3% sulfide-S
TABLE 2 Resource assessment drillholes with total sulfur values >0.3%
FLINDERS MINES LIMITED
GEOCHEMICAL CHARACTERISATION OF MINE WASTE AND TAILINGS
IMPLICATIONS FOR MINE WASTE MANAGEMENT
i:\projects\201012-00322 fms vip\2.0 reports\geochem report\201012-00322 fms waste rock management_rev0..doc Page 1 201012-00322 :0000-EN-REP-0011Rev 0 : 20 July 2012
1. INTRODUCTION
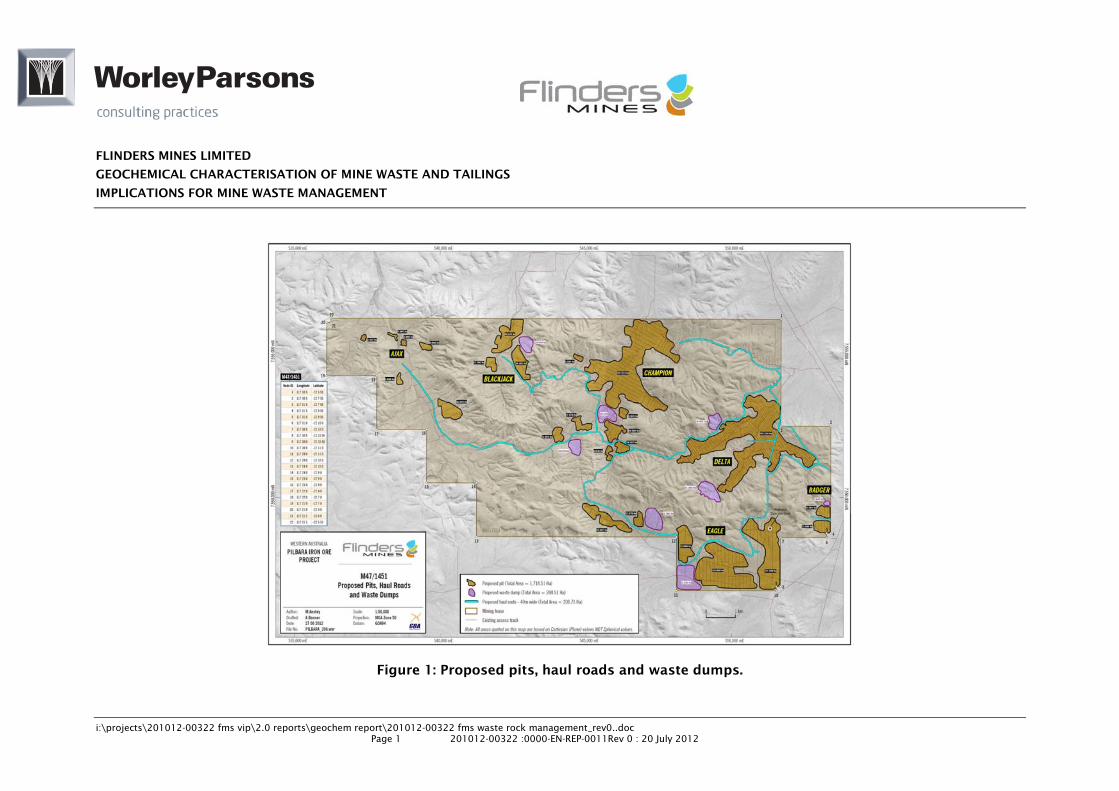
Flinders Mines Limited (FMS) proposes to develop an iron ore mining project on the Blacksmith tenement in the Hamersley Range, in the West Pilbara Region of Western Australia (the PIOP). The project includes the development and mining of six deposits. It is proposed that these deposits would be mined separately, with some associated infrastructure within the tenement. Annual ore production would be 15 million tonne per annum (Mtpa).
FMS engaged Graeme Campbell & Associates Pty Ltd (GCA) to geochemically characterise the proposed waste rock from three of the deposits: Delta, Eagle and Champion and the potential for release of harmful contaminants to downstream biodiversity assets. WorleyParsons understands that the geochemical characteristics of the material in the remaining pits are similar to those of the three pits assessed. This report takes the information from the GCA report (cited in Appendix A) and integrates it with additional information supplied by FMS on the oxidisable sulfur content from the deposits.
The geochemical properties of the material destined for the proposed Tailings Storage Facility (TSF) was also assessed by GCA with the full report and results shown in Appendix B.
The locations of the proposed pits and their associated waste rock dumps are shown on Figure 1.
FLINDERS MINES LIMITED
GEOCHEMICAL CHARACTERISATION OF MINE WASTE AND TAILINGS
IMPLICATIONS FOR MINE WASTE MANAGEMENT
i:\projects\201012-00322 fms vip\2.0 reports\geochem report\201012-00322 fms waste rock management_rev0..doc Page 1 201012-00322 :0000-EN-REP-0011Rev 0 : 20 July 2012
Figure 1: Proposed pits, haul roads and waste dumps.
FLINDERS MINES LIMITED
GEOCHEMICAL CHARACTERISATION OF MINE WASTE AND TAILINGS
IMPLICATIONS FOR MINE WASTE MANAGEMENT
i:\projects\201012-00322 fms vip\2.0 reports\geochem report\201012-00322 fms waste rock management_rev0..doc Page 1 201012-00322 :0000-EN-REP-0011Rev 0 : 20 July 2012
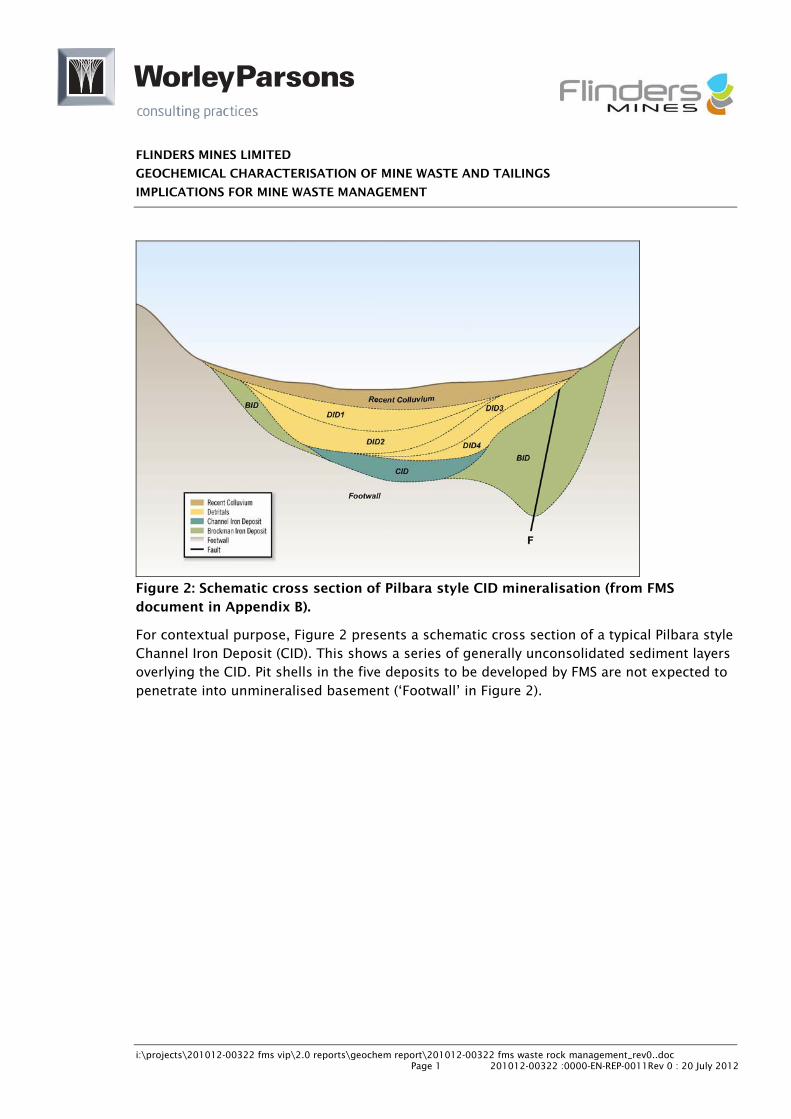
Figure 2: Schematic cross section of Pilbara style CID mineralisation (from FMS document in Appendix B).
For contextual purpose, Figure 2 presents a schematic cross section of a typical Pilbara style Channel Iron Deposit (CID). This shows a series of generally unconsolidated sediment layers overlying the CID. Pit shells in the five deposits to be developed by FMS are not expected to penetrate into unmineralised basement (‘Footwall’ in Figure 2).
FLINDERS MINES LIMITED
GEOCHEMICAL CHARACTERISATION OF MINE WASTE AND TAILINGS
IMPLICATIONS FOR MINE WASTE MANAGEMENT
i:\projects\201012-00322 fms vip\2.0 reports\geochem report\201012-00322 fms waste rock management_rev0..doc Page 2 201012-00322 :0000-EN-REP-0011Rev 0 : 20 July 2012
2. ABBREVIATIONS AND DEFINITIONS
To assist in understanding some of the technical terms used in this and the GCA report (Appendices A & B), the abbreviations are expanded and the terms defined below.
Acid Base Accounting (ABA)
ABA is a series of chemical analyses and calculated values that provide a preliminary evaluation of the amounts, and relative balance, of the acid generation potential and acid-neutralisation potential of a sample. The calculated values are used to make preliminary projections about whether a sample will produce acid drainage. ABA includes the most common static tests used in the prediction of Acid Rock Drainage (ARD). The potential acid production is commonly determined by analysis for sulfur species. ARD prediction and ABA data interpretation requires an understanding of the analytical procedures, the future physical and geochemical conditions and the identity, location and reactivity of the contributing minerals. Kinetic tests, mineral identification and detailed material characterisation are required to provide this information.
Acid Neutralisation Capacity (ANC)
ANC is a general term for a sample’s or a material’s capability to neutralise acidity. ANC can be measured using different laboratory acid neutralisation procedures. The objective of ANC analysis is usually to determine the ARD potential. The objective is to predict the capacity of minesite waste materials to maintain a pH 6.0 or above. Assessment of the best static-test ANC requires a knowledge of future physical and geochemical conditions, the rate of acid generation and the identity, exposure and reactivity of the minerals with ANC and an understanding of the various analytical procedures.
Acid Rock Drainage (ARD)
ARD is acidic water discharge (i.e. pH <5.0), usually rich in iron, sulfate and other metals/metalloids. ARD usually forms under natural conditions when geological materials containing oxidisable forms of sulfur (i.e. pyrite) are exposed to atmospheric conditions or oxidising environments. . ARD is produced when the neutralising potential is no longer capable of maintaining neutral pH conditions. In the context of mining, ARD may also be referred to as Acid Mine Drainage (AMD).
Base of oxidation (BoX)
The Box is the zone below which oxidation of (in this case) sulfur as sulfide species will not occur.
FLINDERS MINES LIMITED
GEOCHEMICAL CHARACTERISATION OF MINE WASTE AND TAILINGS
IMPLICATIONS FOR MINE WASTE MANAGEMENT
i:\projects\201012-00322 fms vip\2.0 reports\geochem report\201012-00322 fms waste rock management_rev0..doc Page 3 201012-00322 :0000-EN-REP-0011Rev 0 : 20 July 2012
Maximum Potential Acidity (MPA)
MPA refers to the maximum amount of sulfuric acid (H2SO
4) that is produced from
complete oxidation of sulfide minerals (namely pyrite and pyrrotite) present in the rock material. The MPA is given as kgH
2SO
4/tonne and determined by multiplying the
sulfide-S value (%) by 30.591 (or 623.7 moles/H+). This value is based on the stoichiometry of this chemical reaction which accounts for the maximum amount of acid that could be produced by material(s) containing 1% S.
Non-acid Forming (NAF)
NAF rock is material which is highly unlikely to produce acid when exposed to atmospheric oxygen and water and where the Acid Potential Ratio (APR) (defined as ANC/MPA) is ≥ 2.
Potentially Acid Forming (PAF)
PAF is defined as the potential for acid generation from a particular sample. The calculation of PAF is an integral part of ABA. Knowledge of sample chemistry (especially pH), sulfur mineralogy and sulfide mineral chemistry is required for an accurate assessment. Total sulfur may be substituted for sulfide sulfur if there is no sulfate or organic sulfur. Accurate data interpretation requires an understanding of the analytical procedures, the physical and geochemical conditions the material will be subjected to and the identity, location and reactivity of the contributing minerals. Sulfides differ in their PAF and a correction may be required to the PAF calculation where non-pyrite sulfide minerals occur in significant amounts. A mineralogical assessment will be required to determine the sulfide mineralogy. The concentration of common sulfide metals like copper, molybdenum, lead and zinc can be used to estimate the concentration of non-iron sulfides.
1 Dividing the S% by 30.59 converts this value to sulfuric acid (H2SO
4
-)
FLINDERS MINES LIMITED
GEOCHEMICAL CHARACTERISATION OF MINE WASTE AND TAILINGS
IMPLICATIONS FOR MINE WASTE MANAGEMENT
i:\projects\201012-00322 fms vip\2.0 reports\geochem report\201012-00322 fms waste rock management_rev0..doc Page 4 201012-00322 :0000-EN-REP-0011Rev 0 : 20 July 2012
3. METHODOLOGY
3.1 Waste rock assessment
This section provides an overview of geochemical testing undertaken on samples from three of the deposits associated with the proposed FMS development on its Blacksmith tenement.
Two geochemical tests were conducted by GCA on waste rock samples from the three deposits assessed; Delta, Eagle and Champion:
Static testing; and
Kinetic testing (Delta pit samples only).
Sample Locations
Samples were collected across the three main deposits of Delta, Eagle and Champion. They were selected on the basis of lithology and sulfur content with the aim of providing a good representation of the whole project area. A larger number of samples were collected from Delta as this currently represents the area to be mined first. A number of the high sulfur samples were also selected from basement rock.
Sample Collection
Samples were collected from 2m downhole intervals derived from Reverse Circulation (RC) drilling. Sample piles had been sitting on the surface for up to 3 years; however, most holes were less than 2 years old. The minimum amount of sample collected was 2-3kg with up to 5kg collected where possible. In each case the top few centimetres of material (defined as the “skin”) was removed and a grab sample from the ”core” of the pile was taken. For a small number of high sulfur samples the outer skin was also collected.
In total, 60 samples were collected for static test work (and 3 “skin” samples) and 18 (6 composites) for kinetic test work.
A total of 33 of the static samples were from above BoX and 27 were from basement units below BoX.
For a full explanation of sample locations and collection see Attachment 1 in the GCA report shown in Appendix A.
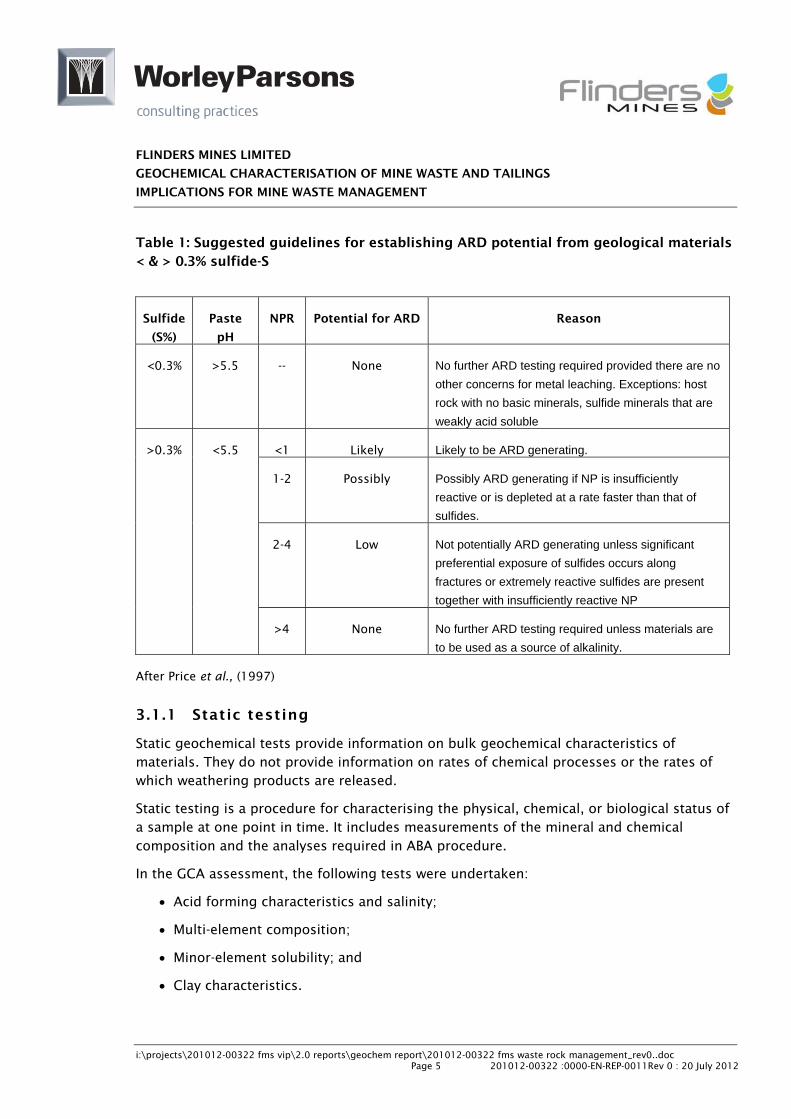
In addition, FMS has identified on pit cross-sections (Appendix C), where total sulfur concentrations are greater than 0.3% (analysis of samples obtained by RC drilling) for resource estimation. It is generally accepted that total sulfur concentrations >0.3% can result in acid generation, i.e. from PAF material. For example, Table 1 identifies the guidelines from Price et al., (1997) indicating the potential for ARD with regards to materials containing sulfides < & > 0.3% sulfide-S.
FLINDERS MINES LIMITED
GEOCHEMICAL CHARACTERISATION OF MINE WASTE AND TAILINGS
IMPLICATIONS FOR MINE WASTE MANAGEMENT
i:\projects\201012-00322 fms vip\2.0 reports\geochem report\201012-00322 fms waste rock management_rev0..doc Page 5 201012-00322 :0000-EN-REP-0011Rev 0 : 20 July 2012
Table 1: Suggested guidelines for establishing ARD potential from geological materials < & > 0.3% sulfide-S
Sulfide
(S%)
Paste
pH
NPR Potential for ARD Reason
<0.3% >5.5 -- None No further ARD testing required provided there are no
other concerns for metal leaching. Exceptions: host
rock with no basic minerals, sulfide minerals that are
weakly acid soluble
>0.3% <5.5 <1 Likely Likely to be ARD generating.
1-2 Possibly Possibly ARD generating if NP is insufficiently
reactive or is depleted at a rate faster than that of
sulfides.
2-4 Low Not potentially ARD generating unless significant
preferential exposure of sulfides occurs along
fractures or extremely reactive sulfides are present
together with insufficiently reactive NP
>4 None No further ARD testing required unless materials are
to be used as a source of alkalinity.
After Price et al., (1997)
3.1.1 Static testing
Static geochemical tests provide information on bulk geochemical characteristics of materials. They do not provide information on rates of chemical processes or the rates of which weathering products are released.
Static testing is a procedure for characterising the physical, chemical, or biological status of a sample at one point in time. It includes measurements of the mineral and chemical composition and the analyses required in ABA procedure.
In the GCA assessment, the following tests were undertaken:
Acid forming characteristics and salinity;
Multi-element composition;
Minor-element solubility; and
Clay characteristics.
FLINDERS MINES LIMITED
GEOCHEMICAL CHARACTERISATION OF MINE WASTE AND TAILINGS
IMPLICATIONS FOR MINE WASTE MANAGEMENT
i:\projects\201012-00322 fms vip\2.0 reports\geochem report\201012-00322 fms waste rock management_rev0..doc Page 6 201012-00322 :0000-EN-REP-0011Rev 0 : 20 July 2012
3.1.2 Kinetic testing
Kinetic testing is a procedure used to measure the magnitude and/or effects of dynamic processes, including rates of reaction, material alteration and drainage chemistry and loadings from waste material that results from weathering.
Unlike static tests, kinetic tests measure the performance of a sample over a prolonged period of time. Material composition and/or environmental conditions are often simplified or controlled to permit measurement of the physical, chemical, or biological characteristics, processes or relationships which are of interest.
Kinetic tests have many different forms and locations, including lysimeters, field test pads, leaching columns and humidity cells. In ARD studies, the most common form of kinetic tests are laboratory procedures designed to determine the quality of water and rates of reaction resulting from the interaction of water and the mine material.
Kinetic testing in the GCA assessment involved:
Waste regolith (the weathered surface material); and
Waste bedrock (unweathered or fresh basement rock).
For a detailed description of the methodology refer to the GCA report in Appendix A.
Kinetic testing was restricted to the Delta pit as it is intended to be mined first.
3.1.3 Sulfur content: Basement materials
A series of cross-sections (provided by FMS) through all five aforementioned deposits shows the total sulfur concentrations >0.3% in drillholes constructed for the purpose of resource definition. The cross-sections are presented in Appendix B and discussed in the results section.
3.2 Tailings material
The tailings material assessment carried out by GCA used similar methods as for the waste rock analyses (Sections 3.1.1, 3.1.2 and the GCA report in Appendix B (Attachment II)).
FLINDERS MINES LIMITED
GEOCHEMICAL CHARACTERISATION OF MINE WASTE AND TAILINGS
IMPLICATIONS FOR MINE WASTE MANAGEMENT
i:\projects\201012-00322 fms vip\2.0 reports\geochem report\201012-00322 fms waste rock management_rev0..doc Page 7 201012-00322 :0000-EN-REP-0011Rev 0 : 20 July 2012
4. RESULTS
4.1 Waste rock assessment
4.1.1 Static test results
Detailed results are provided in Appendix A with an overview provided in this Section.
The results are presented for each of the three deposits for which samples were obtained with a summary at the end of the Section.
In the following subsections, ‘waste regolith’ (oxidised) describes the material above the BoX and ‘waste bedrock’ (not oxidised) to that material below the BoX.
Delta Deposit
All samples above the BoX contained negligible sulfides and can be described as NAF. The samples were neutral to alkaline (pH 7 to 8) with low concentration of soluble salts.
The waste bedrock samples were classified as both PAF and NAF which indicated the tight spatial variability of pyrite abundance in the basement shale units.
All samples were analysed for their multi-element composition (e.g. arsenic (As), antimony (Sb), selenium (Se), molybdenum (Mo) and boron (B). All analyses correspond to detection limits relevant to environmental baseline assessments. The values cited in the GCA report indicate that the pyrite from the Delta deposit are relatively clean or void of these minor elements.
To assess the stability of the major/minor elements in the samples, a range of waste regolith samples was tested. The concentration of minor elements in the water extractions was either below or close to the respective detection limits consistent with results for mine wastes which are Fe-rich, weakly mineralised and devoid of sulfide and carbonate minerals.
Kaolinite, which has some capacity to buffer mineral acidity, was found to be the sole clay mineral detected in the waste regolith samples i.e. with sodic cation exchange characteristics.
Eagle Deposit
Testing in the Eagle deposit was restricted to static testing.
All waste regolith samples contained negligible sulfides and were classified as NAF and were neutral to alkaline (pH 7 to 8).
The waste bedrock samples were variously classified as PAF or NAF as for the Delta deposit.
FLINDERS MINES LIMITED
GEOCHEMICAL CHARACTERISATION OF MINE WASTE AND TAILINGS
IMPLICATIONS FOR MINE WASTE MANAGEMENT
i:\projects\201012-00322 fms vip\2.0 reports\geochem report\201012-00322 fms waste rock management_rev0..doc Page 8 201012-00322 :0000-EN-REP-0011Rev 0 : 20 July 2012
The multi-element composition of the Eagle deposit samples was similar to that of Delta deposit.
The waste regolith samples produced water extracts that were circum–neutral (pH 7) and with concentrations close to or below detection limits. The waste bedrock samples produced water extracts that were acidic and enriched in iron (Fe), aluminium (Al) and manganese (Mn).
As with the Delta deposit, kaolinite was the sole clay mineral and the samples were variously sodic.
Champion Deposit
Testing in the Champion deposit was restricted to static testing.
All waste regolith samples contained negligible sulfides and were classified as NAF and with a circum-neutral pH (pH 6 to 8) and low concentrations of soluble salts.
The waste bedrock samples were variously classified as PAF or NAF as for the Delta and Eagle deposits. Sample results indicated only a modest capacity for buffering (neutralising any acidity) by reactive carbonates.
The multi-element composition of the Champion deposit samples was similar to that of the Delta and Eagle deposits.
The waste bedrock samples produced water extracts that were acidic and enriched in iron (Fe), aluminium (Al), manganese (Mn), copper (Cu), nickel (Ni), zinc (Zn) and cobalt (Co).
As with the Delta and Eagle deposits kaolinite was the sole clay mineral and the samples were variously sodic.
4.1.2 Kinetic test results
Kinetic testing was undertaken on a total of 18 Delta deposit samples. No kinetic testing was undertaken on Eagle and Champion deposit samples. Given the high degree of geochemical homogeneity between the deposits, the results can be extrapolated with a high level of confidence.
Delta Deposit
The analyses can be separated into waste regolith and waste bedrock groups and are presented in that format below.
Waste regolith
A range of waste regolith samples were subjected to kinetic testing (weathering columns) to assess minor-element stability in rock types destined to be placed on the outermost
FLINDERS MINES LIMITED
GEOCHEMICAL CHARACTERISATION OF MINE WASTE AND TAILINGS
IMPLICATIONS FOR MINE WASTE MANAGEMENT
i:\projects\201012-00322 fms vip\2.0 reports\geochem report\201012-00322 fms waste rock management_rev0..doc Page 9 201012-00322 :0000-EN-REP-0011Rev 0 : 20 July 2012
sections of the waste landform at closure, i.e. likely to be subjected to the greatest exposure to weathering in the long term.
Prior to commencing the kinetic testing the bulk geochemistry and mineralogy of the samples were characterised and are consistent with the static testing outlined above.
Weathering of the waste regolith samples yielded negligible amounts of solutes during alternating cycles of desiccation (drying cycle) and inundation (wetting cycle), e.g. the leachate Electrical Conductivity (EC) was less than 100μS/cm. The concentration of minor-elements was either below or close to the respective detection limits of the analytical instrumentation.
Waste bedrock
Three composite waste bedrock samples were subjected to kinetic testing.
All composites were mildly acidic (pH 4 to 6) with moderate contents of soluble salts, mainly sulfate. Over the course of the six weekly weathering cycles performed, the leachate pH values were typically in the range 5 to 8. Sulfide oxidation rates indicate that the pyrite in the samples is not atypically reactive.
Manganese was the sole metal that exhibited appreciable solubility and reflects dissolution of the mineral siderite (FeCO
3 where the Fe ion is commonly replaced by Mn) during
weathering. Any iron released was effectively oxidised and precipitated.
4.1.3 In-situ sulfur concentrations
The cross-sections in Appendix C show the proposed pit shells, location of the cross-section relative to the deposit, RC drillhole locations and total sulfur concentrations >0.3% (as identified from analyses of drillhole cuttings). Table 2 provides data on the number of drillholes which intersected bedrock and intersected total sulfur values >0.3%.
FLINDERS MINES LIMITED
GEOCHEMICAL CHARACTERISATION OF MINE WASTE AND TAILINGS
IMPLICATIONS FOR MINE WASTE MANAGEMENT
i:\projects\201012-00322 fms vip\2.0 reports\geochem report\201012-00322 fms waste rock management_rev0..doc Page 10 201012-00322 :0000-EN-REP-0011Rev 0 : 20 July 2012
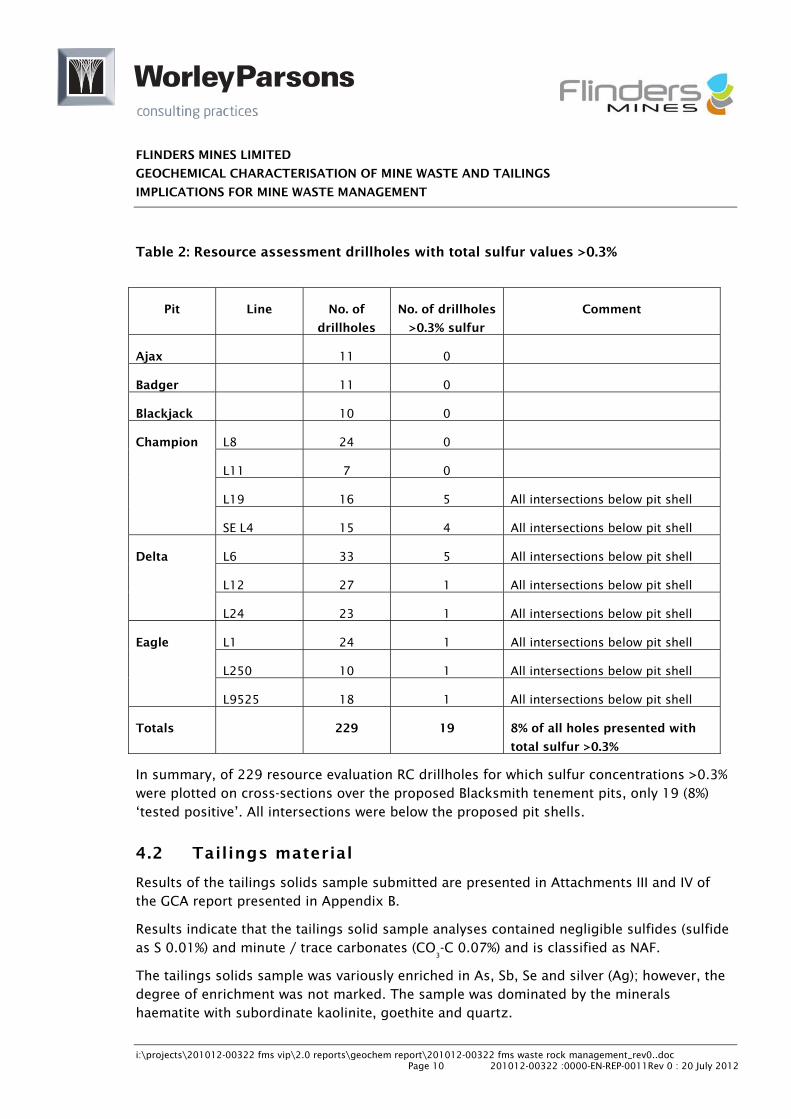
Table 2: Resource assessment drillholes with total sulfur values >0.3%
Pit Line No. of
drillholes
No. of drillholes
>0.3% sulfur
Comment
Ajax 11 0
Badger 11 0
Blackjack 10 0
Champion L8 24 0
L11 7 0
L19 16 5 All intersections below pit shell
SE L4 15 4 All intersections below pit shell
Delta L6 33 5 All intersections below pit shell
L12 27 1 All intersections below pit shell
L24 23 1 All intersections below pit shell
Eagle L1 24 1 All intersections below pit shell
L250 10 1 All intersections below pit shell
L9525 18 1 All intersections below pit shell
Totals 229 19 8% of all holes presented with
total sulfur >0.3%
In summary, of 229 resource evaluation RC drillholes for which sulfur concentrations >0.3% were plotted on cross-sections over the proposed Blacksmith tenement pits, only 19 (8%) ‘tested positive’. All intersections were below the proposed pit shells.
4.2 Tailings material
Results of the tailings solids sample submitted are presented in Attachments III and IV of the GCA report presented in Appendix B.
Results indicate that the tailings solid sample analyses contained negligible sulfides (sulfide as S 0.01%) and minute / trace carbonates (CO
3-C 0.07%) and is classified as NAF.
The tailings solids sample was variously enriched in As, Sb, Se and silver (Ag); however, the degree of enrichment was not marked. The sample was dominated by the minerals haematite with subordinate kaolinite, goethite and quartz.
FLINDERS MINES LIMITED
GEOCHEMICAL CHARACTERISATION OF MINE WASTE AND TAILINGS
IMPLICATIONS FOR MINE WASTE MANAGEMENT
i:\projects\201012-00322 fms vip\2.0 reports\geochem report\201012-00322 fms waste rock management_rev0..doc Page 11 201012-00322 :0000-EN-REP-0011Rev 0 : 20 July 2012
5. DISCUSSION AND CONCLUSIONS
5.1 Waste rock
The management implications presented in the GCA report reflect a working model of mine waste geochemistry for the Delta, Eagle and Champion deposits specifically but can be extrapolated with confidence to the other deposits given the high degree of geochemical homogeneity exhibited from one deposit to another. This statement is supported by similar results from other deposits in the Pilbara region which share related geology and style of mineralisation (channel iron deposits - CID).
5.1.1 Waste regolith
Geochemically, the various waste regolith units (rocks within the zone of oxidation / weathering) are predicted to be benign, i.e. extremes of pH and salinity should not place constraints on how the materials are managed. The ex-pit waste rock streams should be about neutral pH and of low salinity.
Minor element enrichments should pose no concerns to water quality or uptake by vegetation. The high concentrations of hydrated iron oxides should ensure that minor elements are retained by sorption reactions (i.e. absorption and adsorption).
The majority of waste rock produced during mining is durable and well suited to applications where exposure occurs (rock armouring, construction, bunding etc.). Together with topsoil, these rock types should be identified for use in construction the outermost sections of the waste landforms. Friable materials should be blended with the blocky material and topsoil to allow a rooting medium for vegetation growth.
In summary, waste landform design and rehabilitation should not be constrained by the physicochemical properties of the mine waste streams.
5.1.2 Waste bedrock
Under the current mining plan, the interbedded shales and Banded Iron Formation (BIF) from the unweathered (unoxidised) basement zone of the pits may or may not be disturbed.
If the bedrock is mined, it is expected that a proportion will contain PAF materials which may release circum-neutral sulfates and Mn when inundated by episodic rainfall events above 10-20mm. Waste stream management would need to take into account PAF rock types and isolate such material from the seasonal wetting-front on the waste dumps. NAF material where of suitable strength can be used as the ‘skin’ of the waste dumps with the PAF material within the core so as to minimise exposure of PAF waste rock to long term wetting and desiccation.
FLINDERS MINES LIMITED
GEOCHEMICAL CHARACTERISATION OF MINE WASTE AND TAILINGS
IMPLICATIONS FOR MINE WASTE MANAGEMENT
i:\projects\201012-00322 fms vip\2.0 reports\geochem report\201012-00322 fms waste rock management_rev0..doc Page 12 201012-00322 :0000-EN-REP-0011Rev 0 : 20 July 2012
5.1.3 In-situ sulfur concentrations
The in-situ sulfur concentrations obtained from resource definition drilling indicate that all intersections of total sulfur >0.3% occur below the proposed pit shells.
5.2 Tailings
From the test work results obtained in the GCA study (Appendix B), it is concluded that the process tailings to be produced should be geochemically benign because of the strongly weathered and leached condition of the ores in situ. As they are subjected to slow, ‘residual weathering’ under the episodic, pulsed rainfall regime of the Pilbara it is expected that nothing harmful to the environment will be released.
REFERENCE
Price, W.A., Errington, J. and Koyanagi, V. 1997. Guidelines for the Prediction of Acid Rock Drainage
and Metal Leaching for Mines in British Columbia: Part I - General Procedures and Information Requirements, Proc. 4th International Conference on Acid Rock Drainage, Vancouver, BC, p1-14.
FLINDERS MINES LIMITED
GEOCHEMICAL CHARACTERISATION OF MINE WASTE AND TAILINGS
IMPLICATIONS FOR MINE WASTE MANAGEMENT
i:\projects\201012-00322 fms vip\2.0 reports\geochem report\201012-00322 fms waste rock management_rev0..doc Page 13 201012-00322 :0000-EN-REP-0011Rev 0 : 20 July 2012
APPENDIX A
Graeme Campbell & Associates Pty Ltd
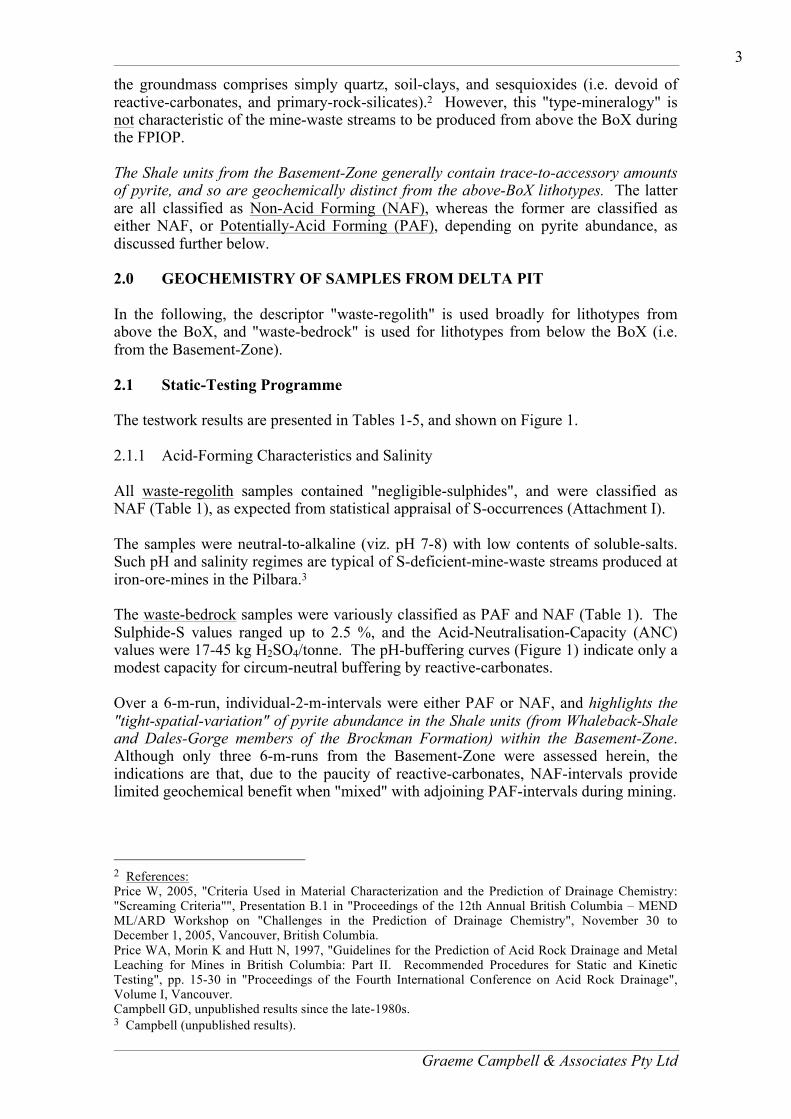
GRAEME CAMPBELL & ASSOCIATES PTY LTD Specialists in Mine-Waste Geochemistry,
& Soil-Moisture-Retention Testing
P.O. Box 247, Bridgetown, Western Australia 6255 Phone: (61 8) 9761 2829 Fax: (61 8) 9761 2830
E-mail: [email protected] 1112 COMPANY: Flinders Mines Limited ATTENTION: Mick Anstey FROM: Graeme Campbell SUBJECT: Flinders Pilbara Iron-Ore Project (FPIOP): Geochemical
Characterisation of Mine-Waste Samples from Delta, Eagle, and Champion Pits - Implications for Mine-Waste Management
NO. PAGES (including this page): 182 DATE: 15th November 2011 TABLE OF CONTENTS Page Nos.
1.0 ORE-BODY-WIDE APPRAISAL OF SULPHUR OCCURRENCES 2 2.0 GEOCHEMISTRY OF SAMPLES FROM DELTA PIT 3 2.1 Static-Testing Programme 3 2.1.1 Acid-Forming Characteristics and Salinity 3 2.1.2 Multi-Element Composition 4 2.1.3 Minor-Element Solubility 4 2.1.4 Clay-Mineralogy and Clay-Surface-Chemistry 6 2.2 Kinetic-Testing Programme 6
2.2.1 Waste-regoliths 6 2.2.2 Waste-bedrocks 7 3.0 GEOCHEMISTRY OF SAMPLES FROM EAGLE PIT 8 3.1 Acid-Forming Characteristics and Salinity 8 3.2 Multi-Element Composition 8 3.3 Minor-Element Solubility 8 3.4 Clay-Mineralogy and Clay-Surface-Chemistry 9 4.0 GEOCHEMISTRY OF SAMPLES FROM CHAMPION PIT 9 4.1 Acid-Forming Characteristics and Salinity 9 4.2 Multi-Element Composition 9 4.3 Minor-Element Solubility 10 3.4 Clay-Mineralogy and Clay-Surface-Chemistry 10
Graeme Campbell & Associates Pty Ltd
2
TABLE OF CONTENTS (Cont'd) Page Nos. 5.0 IMPLICATIONS FOR MINE-WASTE MANAGEMENT 11
5.1 Waste-regoliths 10 5.2 Waste-bedrocks 11 6.0 CLOSURE 11 Tables 1 to 23: At Back-of-Report-Text (with an Index-of-Table-Titles) Figure 1: pH-Buffering Curves for Waste-bedrock Samples from Delta Pit Figure 2: pH-Buffering Curves for Waste-bedrock Samples from Champion Pit Attachment I: Statistics of Sulphur-Occurrences and Details of Sampling Programme Attachment II: Testwork Methods Attachment III: Acid-Formation Potential (AFP): Calculated Parameters and Classification Criteria Attachment IV: Laboratory Reports
…………………… Mick, The occurrences of S, and associated univariate-statistics, for the waste-zones of the Delta, Eagle and Champion Pits, are presented in Attachment I. Details of the testwork methods employed are presented in Attachment II. Classification criteria in terms of Acid-Formation Potential (AFP) are summarised in Attachment III. Copies of the laboratory reports are presented in Attachment IV. 1.0 OREBODY-WIDE APPRAISAL OF SULPHUR-OCCURRENCES The Exploration-Database (for Delta, Eagle and Champion combined) from which the univariate-statistics of S-occurrences are derived, correspond to Total-S assays at 2-m intervals (Attachment I). The Exploration-Database therefore allows definition of S-occurrences at a "fine-spatial-resolution" within the pit-waste/ore-zones. This "metre-scale-resolution" of S-occurrences is small compared with the likely "mining-resolution" of c. 5 m, as controlled by the large equipment to be employed during open-pit mining. With the exception of the Shale units from within the Basement-Zone (i.e. broadly below the Base-of-Oxidation [BoX]), sulphide-mineral abundance in the various lithotypes is negligible (viz. Total-S values typically less than 0.1 %). This is a generic feature of lithotypes above the BoX at iron-ore mines in the Pilbara.1 In terms of assessing the potential for the formation of Acid-Rock Drainage (ARD), a "S-threshold/cutoff" of 0.3 % (as S) is employed herein. Although Sulphide-S values less than 0.3 % may result in acidification, this is restricted to specific assemblages of sulphide- and groundmass-minerals. In particular, it applies to lithotypes for which both the sulphide-minerals include hyper-reactive varieties (e.g. framboidal-pyrite), and 1 Campbell (unpublished results since the late -1980s).
Graeme Campbell & Associates Pty Ltd
3
the groundmass comprises simply quartz, soil-clays, and sesquioxides (i.e. devoid of reactive-carbonates, and primary-rock-silicates).2 However, this "type-mineralogy" is not characteristic of the mine-waste streams to be produced from above the BoX during the FPIOP. The Shale units from the Basement-Zone generally contain trace-to-accessory amounts of pyrite, and so are geochemically distinct from the above-BoX lithotypes. The latter are all classified as Non-Acid Forming (NAF), whereas the former are classified as either NAF, or Potentially-Acid Forming (PAF), depending on pyrite abundance, as discussed further below. 2.0 GEOCHEMISTRY OF SAMPLES FROM DELTA PIT In the following, the descriptor "waste-regolith" is used broadly for lithotypes from above the BoX, and "waste-bedrock" is used for lithotypes from below the BoX (i.e. from the Basement-Zone). 2.1 Static-Testing Programme The testwork results are presented in Tables 1-5, and shown on Figure 1. 2.1.1 Acid-Forming Characteristics and Salinity All waste-regolith samples contained "negligible-sulphides", and were classified as NAF (Table 1), as expected from statistical appraisal of S-occurrences (Attachment I). The samples were neutral-to-alkaline (viz. pH 7-8) with low contents of soluble-salts. Such pH and salinity regimes are typical of S-deficient-mine-waste streams produced at iron-ore-mines in the Pilbara.3 The waste-bedrock samples were variously classified as PAF and NAF (Table 1). The Sulphide-S values ranged up to 2.5 %, and the Acid-Neutralisation-Capacity (ANC) values were 17-45 kg H2SO4/tonne. The pH-buffering curves (Figure 1) indicate only a modest capacity for circum-neutral buffering by reactive-carbonates. Over a 6-m-run, individual-2-m-intervals were either PAF or NAF, and highlights the "tight-spatial-variation" of pyrite abundance in the Shale units (from Whaleback-Shale and Dales-Gorge members of the Brockman Formation) within the Basement-Zone. Although only three 6-m-runs from the Basement-Zone were assessed herein, the indications are that, due to the paucity of reactive-carbonates, NAF-intervals provide limited geochemical benefit when "mixed" with adjoining PAF-intervals during mining.
2 References: Price W, 2005, "Criteria Used in Material Characterization and the Prediction of Drainage Chemistry: "Screaming Criteria"", Presentation B.1 in "Proceedings of the 12th Annual British Columbia – MEND ML/ARD Workshop on "Challenges in the Prediction of Drainage Chemistry", November 30 to December 1, 2005, Vancouver, British Columbia. Price WA, Morin K and Hutt N, 1997, "Guidelines for the Prediction of Acid Rock Drainage and Metal Leaching for Mines in British Columbia: Part II. Recommended Procedures for Static and Kinetic Testing", pp. 15-30 in "Proceedings of the Fourth International Conference on Acid Rock Drainage", Volume I, Vancouver. Campbell GD, unpublished results since the late-1980s. 3 Campbell (unpublished results).
Graeme Campbell & Associates Pty Ltd
4
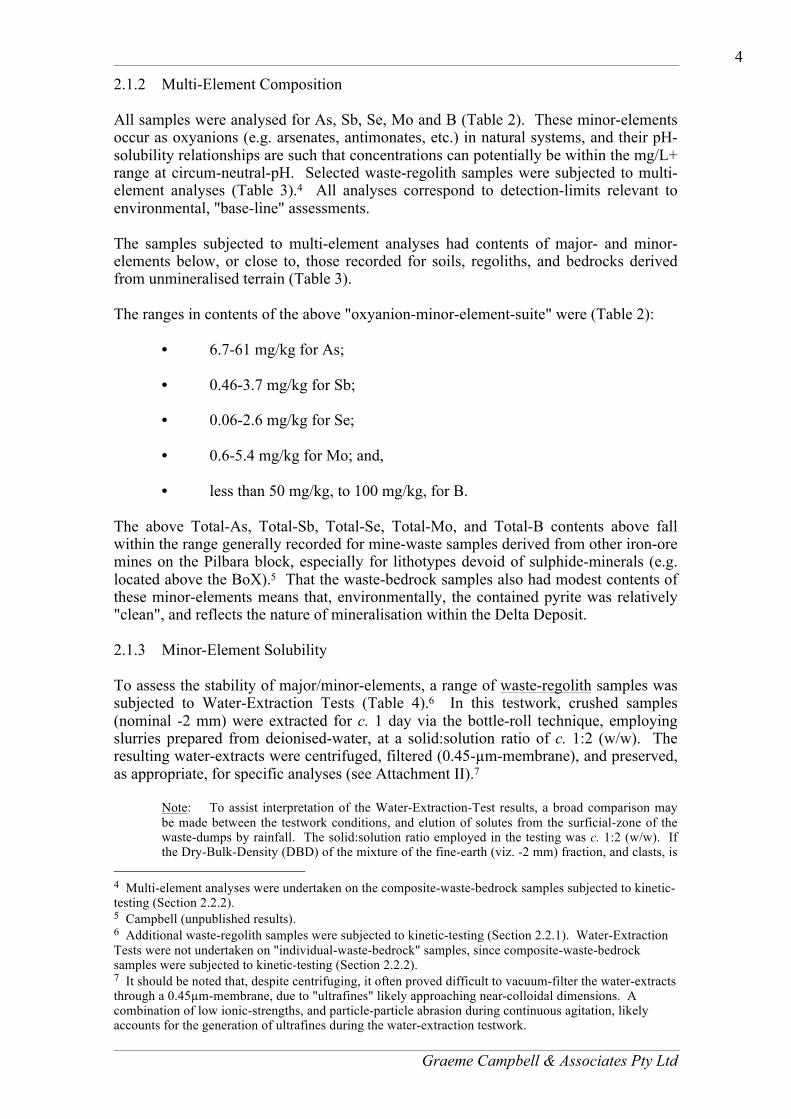
2.1.2 Multi-Element Composition All samples were analysed for As, Sb, Se, Mo and B (Table 2). These minor-elements occur as oxyanions (e.g. arsenates, antimonates, etc.) in natural systems, and their pH-solubility relationships are such that concentrations can potentially be within the mg/L+ range at circum-neutral-pH. Selected waste-regolith samples were subjected to multi-element analyses (Table 3).4 All analyses correspond to detection-limits relevant to environmental, "base-line" assessments. The samples subjected to multi-element analyses had contents of major- and minor-elements below, or close to, those recorded for soils, regoliths, and bedrocks derived from unmineralised terrain (Table 3). The ranges in contents of the above "oxyanion-minor-element-suite" were (Table 2): • 6.7-61 mg/kg for As; • 0.46-3.7 mg/kg for Sb; • 0.06-2.6 mg/kg for Se; • 0.6-5.4 mg/kg for Mo; and, • less than 50 mg/kg, to 100 mg/kg, for B. The above Total-As, Total-Sb, Total-Se, Total-Mo, and Total-B contents above fall within the range generally recorded for mine-waste samples derived from other iron-ore mines on the Pilbara block, especially for lithotypes devoid of sulphide-minerals (e.g. located above the BoX).5 That the waste-bedrock samples also had modest contents of these minor-elements means that, environmentally, the contained pyrite was relatively "clean", and reflects the nature of mineralisation within the Delta Deposit. 2.1.3 Minor-Element Solubility To assess the stability of major/minor-elements, a range of waste-regolith samples was subjected to Water-Extraction Tests (Table 4).6 In this testwork, crushed samples (nominal -2 mm) were extracted for c. 1 day via the bottle-roll technique, employing slurries prepared from deionised-water, at a solid:solution ratio of c. 1:2 (w/w). The resulting water-extracts were centrifuged, filtered (0.45-µm-membrane), and preserved, as appropriate, for specific analyses (see Attachment II).7
Note: To assist interpretation of the Water-Extraction-Test results, a broad comparison may be made between the testwork conditions, and elution of solutes from the surficial-zone of the waste-dumps by rainfall. The solid:solution ratio employed in the testing was c. 1:2 (w/w). If the Dry-Bulk-Density (DBD) of the mixture of the fine-earth (viz. -2 mm) fraction, and clasts, is
4 Multi-element analyses were undertaken on the composite-waste-bedrock samples subjected to kinetic-testing (Section 2.2.2). 5 Campbell (unpublished results). 6 Additional waste-regolith samples were subjected to kinetic-testing (Section 2.2.1). Water-Extraction Tests were not undertaken on "individual-waste-bedrock" samples, since composite-waste-bedrock samples were subjected to kinetic-testing (Section 2.2.2). 7 It should be noted that, despite centrifuging, it often proved difficult to vacuum-filter the water-extracts through a 0.45µm-membrane, due to "ultrafines" likely approaching near-colloidal dimensions. A combination of low ionic-strengths, and particle-particle abrasion during continuous agitation, likely accounts for the generation of ultrafines during the water-extraction testwork.
Graeme Campbell & Associates Pty Ltd
5 c. 2.0 t/m3, then for an annual rainfall of c. 300-400 mm, the "equivalent" solid:solution ratio experienced by the top 0.1 m may be taken as c. 1:2 (w/w). Therefore, the testwork results broadly correspond to the efficient leaching of the top decimetre of a mine-waste-profile by a year's worth of rainfall, and where all drainage-waters are collected in a dam without any mixing with runoff-waters derived from up-catchment areas. Although approximate, this comparison assists in placing the testwork results into broad perspective in terms of water-quality contexts for downstream environs. Nonetheless, sight must not be lost of the testwork conditions employed (viz. samples as powders in suspensions that were continuously agitated). The Water-Extraction Tests herein serves simply to identify any weakly-bound forms of solutes which are susceptible to release to solution upon contact with meteoric-waters.
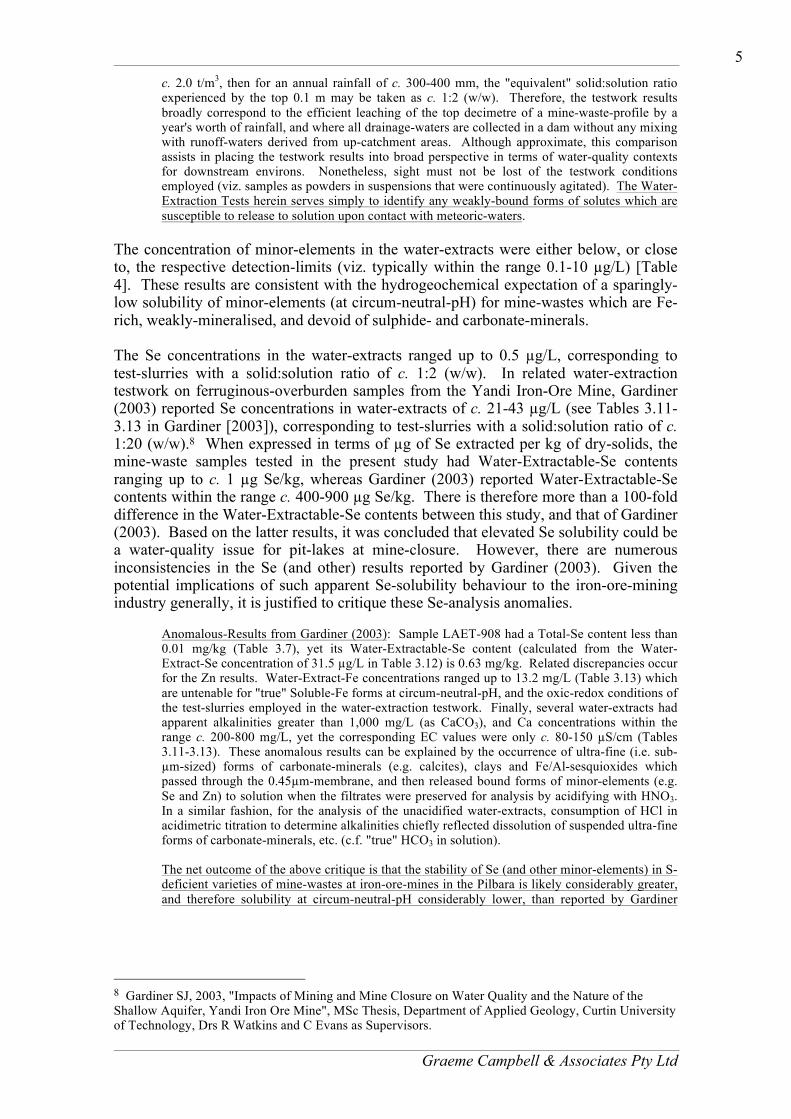
The concentration of minor-elements in the water-extracts were either below, or close to, the respective detection-limits (viz. typically within the range 0.1-10 µg/L) [Table 4]. These results are consistent with the hydrogeochemical expectation of a sparingly-low solubility of minor-elements (at circum-neutral-pH) for mine-wastes which are Fe-rich, weakly-mineralised, and devoid of sulphide- and carbonate-minerals. The Se concentrations in the water-extracts ranged up to 0.5 µg/L, corresponding to test-slurries with a solid:solution ratio of c. 1:2 (w/w). In related water-extraction testwork on ferruginous-overburden samples from the Yandi Iron-Ore Mine, Gardiner (2003) reported Se concentrations in water-extracts of c. 21-43 µg/L (see Tables 3.11-3.13 in Gardiner [2003]), corresponding to test-slurries with a solid:solution ratio of c. 1:20 (w/w).8 When expressed in terms of µg of Se extracted per kg of dry-solids, the mine-waste samples tested in the present study had Water-Extractable-Se contents ranging up to c. 1 µg Se/kg, whereas Gardiner (2003) reported Water-Extractable-Se contents within the range c. 400-900 µg Se/kg. There is therefore more than a 100-fold difference in the Water-Extractable-Se contents between this study, and that of Gardiner (2003). Based on the latter results, it was concluded that elevated Se solubility could be a water-quality issue for pit-lakes at mine-closure. However, there are numerous inconsistencies in the Se (and other) results reported by Gardiner (2003). Given the potential implications of such apparent Se-solubility behaviour to the iron-ore-mining industry generally, it is justified to critique these Se-analysis anomalies.
Anomalous-Results from Gardiner (2003): Sample LAET-908 had a Total-Se content less than 0.01 mg/kg (Table 3.7), yet its Water-Extractable-Se content (calculated from the Water-Extract-Se concentration of 31.5 µg/L in Table 3.12) is 0.63 mg/kg. Related discrepancies occur for the Zn results. Water-Extract-Fe concentrations ranged up to 13.2 mg/L (Table 3.13) which are untenable for "true" Soluble-Fe forms at circum-neutral-pH, and the oxic-redox conditions of the test-slurries employed in the water-extraction testwork. Finally, several water-extracts had apparent alkalinities greater than 1,000 mg/L (as CaCO3), and Ca concentrations within the range c. 200-800 mg/L, yet the corresponding EC values were only c. 80-150 µS/cm (Tables 3.11-3.13). These anomalous results can be explained by the occurrence of ultra-fine (i.e. sub-µm-sized) forms of carbonate-minerals (e.g. calcites), clays and Fe/Al-sesquioxides which passed through the 0.45µm-membrane, and then released bound forms of minor-elements (e.g. Se and Zn) to solution when the filtrates were preserved for analysis by acidifying with HNO3. In a similar fashion, for the analysis of the unacidified water-extracts, consumption of HCl in acidimetric titration to determine alkalinities chiefly reflected dissolution of suspended ultra-fine forms of carbonate-minerals, etc. (c.f. "true" HCO3 in solution). The net outcome of the above critique is that the stability of Se (and other minor-elements) in S-deficient varieties of mine-wastes at iron-ore-mines in the Pilbara is likely considerably greater, and therefore solubility at circum-neutral-pH considerably lower, than reported by Gardiner
8 Gardiner SJ, 2003, "Impacts of Mining and Mine Closure on Water Quality and the Nature of the Shallow Aquifer, Yandi Iron Ore Mine", MSc Thesis, Department of Applied Geology, Curtin University of Technology, Drs R Watkins and C Evans as Supervisors.
Graeme Campbell & Associates Pty Ltd
6
(2003).9 Selenium (and other minor-elements) certainly correspond to forms of high stability for the mine-waste samples tested herein.
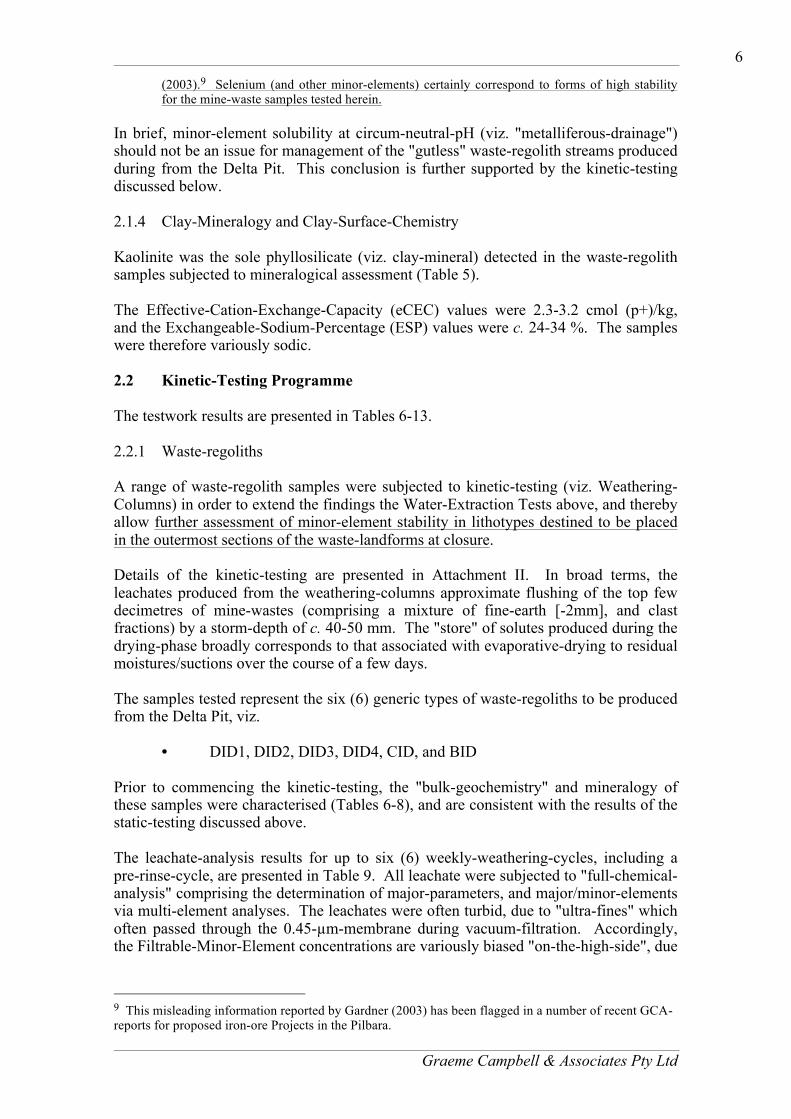
In brief, minor-element solubility at circum-neutral-pH (viz. "metalliferous-drainage") should not be an issue for management of the "gutless" waste-regolith streams produced during from the Delta Pit. This conclusion is further supported by the kinetic-testing discussed below. 2.1.4 Clay-Mineralogy and Clay-Surface-Chemistry Kaolinite was the sole phyllosilicate (viz. clay-mineral) detected in the waste-regolith samples subjected to mineralogical assessment (Table 5). The Effective-Cation-Exchange-Capacity (eCEC) values were 2.3-3.2 cmol (p+)/kg, and the Exchangeable-Sodium-Percentage (ESP) values were c. 24-34 %. The samples were therefore variously sodic. 2.2 Kinetic-Testing Programme The testwork results are presented in Tables 6-13. 2.2.1 Waste-regoliths A range of waste-regolith samples were subjected to kinetic-testing (viz. Weathering-Columns) in order to extend the findings the Water-Extraction Tests above, and thereby allow further assessment of minor-element stability in lithotypes destined to be placed in the outermost sections of the waste-landforms at closure. Details of the kinetic-testing are presented in Attachment II. In broad terms, the leachates produced from the weathering-columns approximate flushing of the top few decimetres of mine-wastes (comprising a mixture of fine-earth [-2mm], and clast fractions) by a storm-depth of c. 40-50 mm. The "store" of solutes produced during the drying-phase broadly corresponds to that associated with evaporative-drying to residual moistures/suctions over the course of a few days. The samples tested represent the six (6) generic types of waste-regoliths to be produced from the Delta Pit, viz. • DID1, DID2, DID3, DID4, CID, and BID Prior to commencing the kinetic-testing, the "bulk-geochemistry" and mineralogy of these samples were characterised (Tables 6-8), and are consistent with the results of the static-testing discussed above. The leachate-analysis results for up to six (6) weekly-weathering-cycles, including a pre-rinse-cycle, are presented in Table 9. All leachate were subjected to "full-chemical-analysis" comprising the determination of major-parameters, and major/minor-elements via multi-element analyses. The leachates were often turbid, due to "ultra-fines" which often passed through the 0.45-µm-membrane during vacuum-filtration. Accordingly, the Filtrable-Minor-Element concentrations are variously biased "on-the-high-side", due
9 This misleading information reported by Gardner (2003) has been flagged in a number of recent GCA-reports for proposed iron-ore Projects in the Pilbara.
Graeme Campbell & Associates Pty Ltd
7
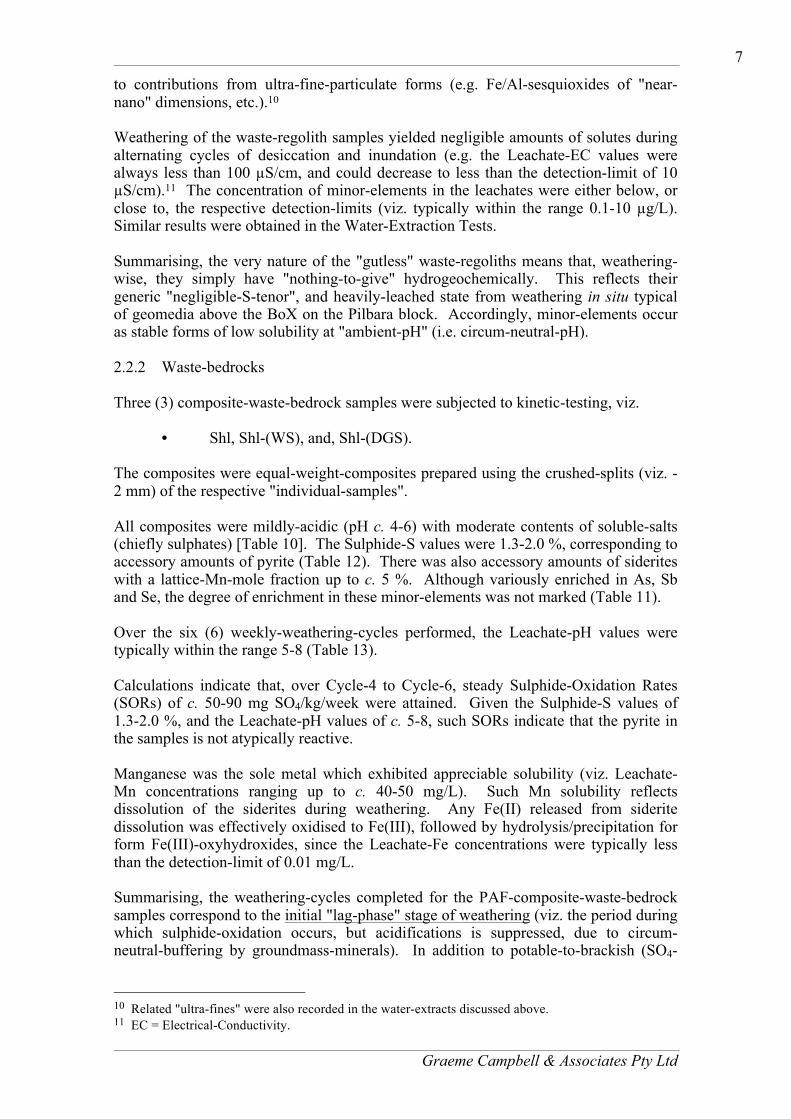
to contributions from ultra-fine-particulate forms (e.g. Fe/Al-sesquioxides of "near-nano" dimensions, etc.).10 Weathering of the waste-regolith samples yielded negligible amounts of solutes during alternating cycles of desiccation and inundation (e.g. the Leachate-EC values were always less than 100 µS/cm, and could decrease to less than the detection-limit of 10 µS/cm).11 The concentration of minor-elements in the leachates were either below, or close to, the respective detection-limits (viz. typically within the range 0.1-10 µg/L). Similar results were obtained in the Water-Extraction Tests. Summarising, the very nature of the "gutless" waste-regoliths means that, weathering-wise, they simply have "nothing-to-give" hydrogeochemically. This reflects their generic "negligible-S-tenor", and heavily-leached state from weathering in situ typical of geomedia above the BoX on the Pilbara block. Accordingly, minor-elements occur as stable forms of low solubility at "ambient-pH" (i.e. circum-neutral-pH). 2.2.2 Waste-bedrocks Three (3) composite-waste-bedrock samples were subjected to kinetic-testing, viz. • Shl, Shl-(WS), and, Shl-(DGS). The composites were equal-weight-composites prepared using the crushed-splits (viz. -2 mm) of the respective "individual-samples". All composites were mildly-acidic (pH c. 4-6) with moderate contents of soluble-salts (chiefly sulphates) [Table 10]. The Sulphide-S values were 1.3-2.0 %, corresponding to accessory amounts of pyrite (Table 12). There was also accessory amounts of siderites with a lattice-Mn-mole fraction up to c. 5 %. Although variously enriched in As, Sb and Se, the degree of enrichment in these minor-elements was not marked (Table 11). Over the six (6) weekly-weathering-cycles performed, the Leachate-pH values were typically within the range 5-8 (Table 13). Calculations indicate that, over Cycle-4 to Cycle-6, steady Sulphide-Oxidation Rates (SORs) of c. 50-90 mg SO4/kg/week were attained. Given the Sulphide-S values of 1.3-2.0 %, and the Leachate-pH values of c. 5-8, such SORs indicate that the pyrite in the samples is not atypically reactive. Manganese was the sole metal which exhibited appreciable solubility (viz. Leachate-Mn concentrations ranging up to c. 40-50 mg/L). Such Mn solubility reflects dissolution of the siderites during weathering. Any Fe(II) released from siderite dissolution was effectively oxidised to Fe(III), followed by hydrolysis/precipitation for form Fe(III)-oxyhydroxides, since the Leachate-Fe concentrations were typically less than the detection-limit of 0.01 mg/L. Summarising, the weathering-cycles completed for the PAF-composite-waste-bedrock samples correspond to the initial "lag-phase" stage of weathering (viz. the period during which sulphide-oxidation occurs, but acidifications is suppressed, due to circum-neutral-buffering by groundmass-minerals). In addition to potable-to-brackish (SO4-
10 Related "ultra-fines" were also recorded in the water-extracts discussed above. 11 EC = Electrical-Conductivity.
Graeme Campbell & Associates Pty Ltd
8
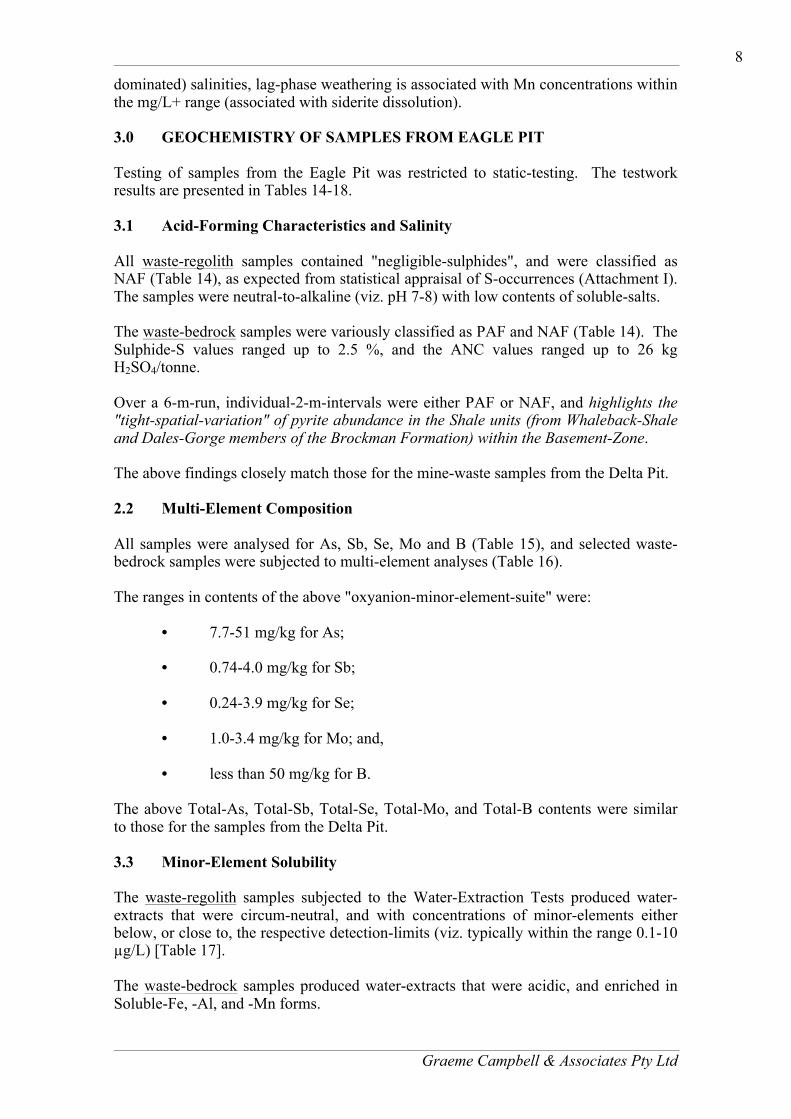
dominated) salinities, lag-phase weathering is associated with Mn concentrations within the mg/L+ range (associated with siderite dissolution). 3.0 GEOCHEMISTRY OF SAMPLES FROM EAGLE PIT Testing of samples from the Eagle Pit was restricted to static-testing. The testwork results are presented in Tables 14-18. 3.1 Acid-Forming Characteristics and Salinity All waste-regolith samples contained "negligible-sulphides", and were classified as NAF (Table 14), as expected from statistical appraisal of S-occurrences (Attachment I). The samples were neutral-to-alkaline (viz. pH 7-8) with low contents of soluble-salts. The waste-bedrock samples were variously classified as PAF and NAF (Table 14). The Sulphide-S values ranged up to 2.5 %, and the ANC values ranged up to 26 kg H2SO4/tonne. Over a 6-m-run, individual-2-m-intervals were either PAF or NAF, and highlights the "tight-spatial-variation" of pyrite abundance in the Shale units (from Whaleback-Shale and Dales-Gorge members of the Brockman Formation) within the Basement-Zone. The above findings closely match those for the mine-waste samples from the Delta Pit. 2.2 Multi-Element Composition All samples were analysed for As, Sb, Se, Mo and B (Table 15), and selected waste-bedrock samples were subjected to multi-element analyses (Table 16). The ranges in contents of the above "oxyanion-minor-element-suite" were: • 7.7-51 mg/kg for As; • 0.74-4.0 mg/kg for Sb; • 0.24-3.9 mg/kg for Se; • 1.0-3.4 mg/kg for Mo; and, • less than 50 mg/kg for B. The above Total-As, Total-Sb, Total-Se, Total-Mo, and Total-B contents were similar to those for the samples from the Delta Pit. 3.3 Minor-Element Solubility The waste-regolith samples subjected to the Water-Extraction Tests produced water-extracts that were circum-neutral, and with concentrations of minor-elements either below, or close to, the respective detection-limits (viz. typically within the range 0.1-10 µg/L) [Table 17]. The waste-bedrock samples produced water-extracts that were acidic, and enriched in Soluble-Fe, -Al, and -Mn forms.
Graeme Campbell & Associates Pty Ltd
9
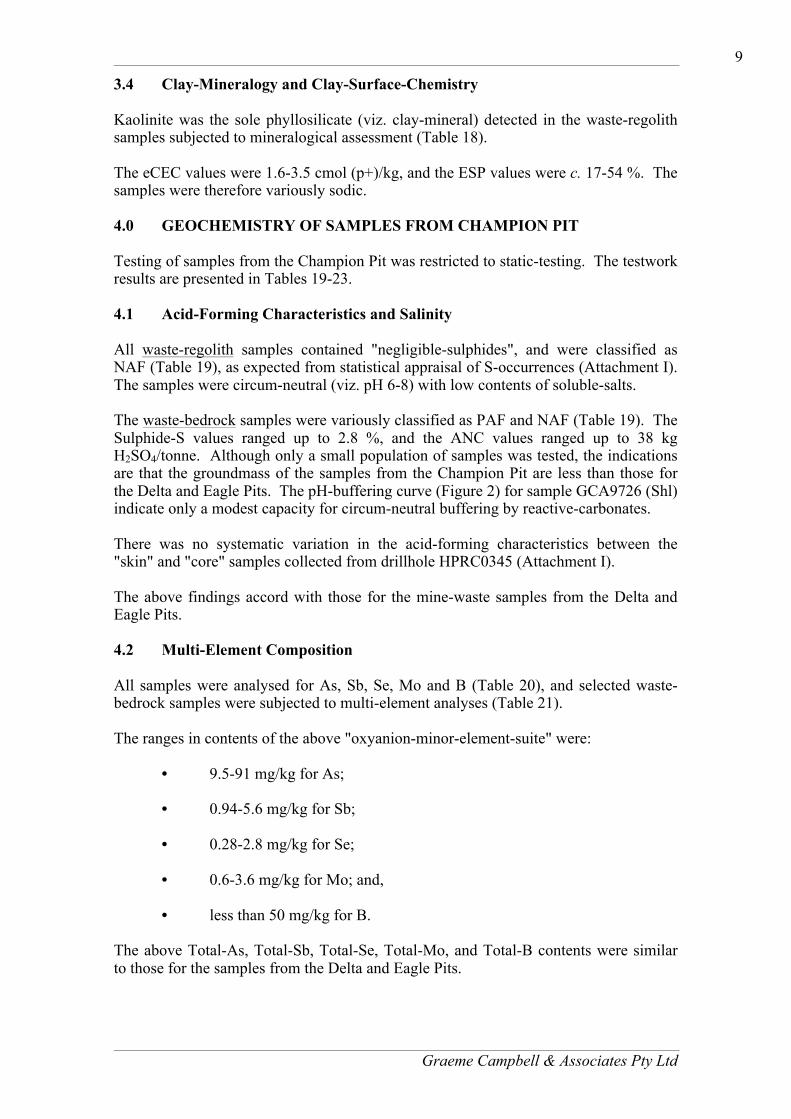
3.4 Clay-Mineralogy and Clay-Surface-Chemistry Kaolinite was the sole phyllosilicate (viz. clay-mineral) detected in the waste-regolith samples subjected to mineralogical assessment (Table 18). The eCEC values were 1.6-3.5 cmol (p+)/kg, and the ESP values were c. 17-54 %. The samples were therefore variously sodic. 4.0 GEOCHEMISTRY OF SAMPLES FROM CHAMPION PIT Testing of samples from the Champion Pit was restricted to static-testing. The testwork results are presented in Tables 19-23. 4.1 Acid-Forming Characteristics and Salinity All waste-regolith samples contained "negligible-sulphides", and were classified as NAF (Table 19), as expected from statistical appraisal of S-occurrences (Attachment I). The samples were circum-neutral (viz. pH 6-8) with low contents of soluble-salts. The waste-bedrock samples were variously classified as PAF and NAF (Table 19). The Sulphide-S values ranged up to 2.8 %, and the ANC values ranged up to 38 kg H2SO4/tonne. Although only a small population of samples was tested, the indications are that the groundmass of the samples from the Champion Pit are less than those for the Delta and Eagle Pits. The pH-buffering curve (Figure 2) for sample GCA9726 (Shl) indicate only a modest capacity for circum-neutral buffering by reactive-carbonates. There was no systematic variation in the acid-forming characteristics between the "skin" and "core" samples collected from drillhole HPRC0345 (Attachment I). The above findings accord with those for the mine-waste samples from the Delta and Eagle Pits. 4.2 Multi-Element Composition All samples were analysed for As, Sb, Se, Mo and B (Table 20), and selected waste-bedrock samples were subjected to multi-element analyses (Table 21). The ranges in contents of the above "oxyanion-minor-element-suite" were: • 9.5-91 mg/kg for As; • 0.94-5.6 mg/kg for Sb; • 0.28-2.8 mg/kg for Se; • 0.6-3.6 mg/kg for Mo; and, • less than 50 mg/kg for B. The above Total-As, Total-Sb, Total-Se, Total-Mo, and Total-B contents were similar to those for the samples from the Delta and Eagle Pits.
Graeme Campbell & Associates Pty Ltd
10
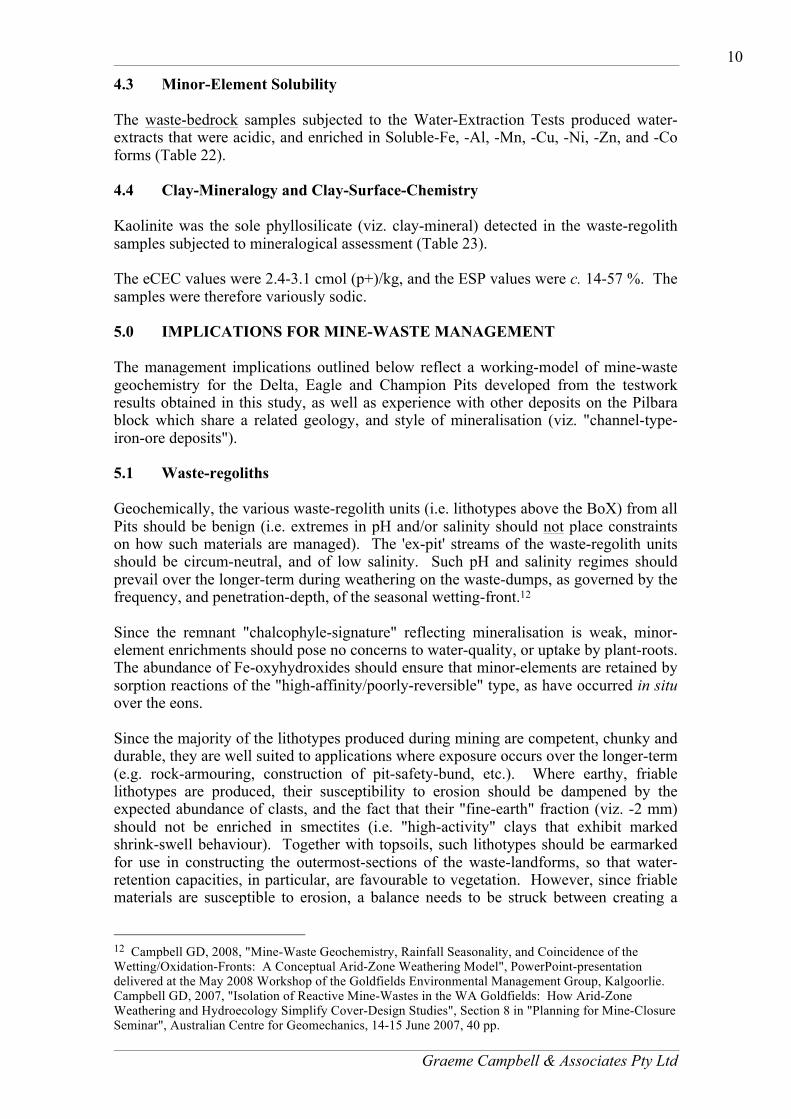
4.3 Minor-Element Solubility The waste-bedrock samples subjected to the Water-Extraction Tests produced water-extracts that were acidic, and enriched in Soluble-Fe, -Al, -Mn, -Cu, -Ni, -Zn, and -Co forms (Table 22). 4.4 Clay-Mineralogy and Clay-Surface-Chemistry Kaolinite was the sole phyllosilicate (viz. clay-mineral) detected in the waste-regolith samples subjected to mineralogical assessment (Table 23). The eCEC values were 2.4-3.1 cmol (p+)/kg, and the ESP values were c. 14-57 %. The samples were therefore variously sodic. 5.0 IMPLICATIONS FOR MINE-WASTE MANAGEMENT The management implications outlined below reflect a working-model of mine-waste geochemistry for the Delta, Eagle and Champion Pits developed from the testwork results obtained in this study, as well as experience with other deposits on the Pilbara block which share a related geology, and style of mineralisation (viz. "channel-type-iron-ore deposits"). 5.1 Waste-regoliths Geochemically, the various waste-regolith units (i.e. lithotypes above the BoX) from all Pits should be benign (i.e. extremes in pH and/or salinity should not place constraints on how such materials are managed). The 'ex-pit' streams of the waste-regolith units should be circum-neutral, and of low salinity. Such pH and salinity regimes should prevail over the longer-term during weathering on the waste-dumps, as governed by the frequency, and penetration-depth, of the seasonal wetting-front.12 Since the remnant "chalcophyle-signature" reflecting mineralisation is weak, minor-element enrichments should pose no concerns to water-quality, or uptake by plant-roots. The abundance of Fe-oxyhydroxides should ensure that minor-elements are retained by sorption reactions of the "high-affinity/poorly-reversible" type, as have occurred in situ over the eons. Since the majority of the lithotypes produced during mining are competent, chunky and durable, they are well suited to applications where exposure occurs over the longer-term (e.g. rock-armouring, construction of pit-safety-bund, etc.). Where earthy, friable lithotypes are produced, their susceptibility to erosion should be dampened by the expected abundance of clasts, and the fact that their "fine-earth" fraction (viz. -2 mm) should not be enriched in smectites (i.e. "high-activity" clays that exhibit marked shrink-swell behaviour). Together with topsoils, such lithotypes should be earmarked for use in constructing the outermost-sections of the waste-landforms, so that water-retention capacities, in particular, are favourable to vegetation. However, since friable materials are susceptible to erosion, a balance needs to be struck between creating a
12 Campbell GD, 2008, "Mine-Waste Geochemistry, Rainfall Seasonality, and Coincidence of the Wetting/Oxidation-Fronts: A Conceptual Arid-Zone Weathering Model", PowerPoint-presentation delivered at the May 2008 Workshop of the Goldfields Environmental Management Group, Kalgoorlie. Campbell GD, 2007, "Isolation of Reactive Mine-Wastes in the WA Goldfields: How Arid-Zone Weathering and Hydroecology Simplify Cover-Design Studies", Section 8 in "Planning for Mine-Closure Seminar", Australian Centre for Geomechanics, 14-15 June 2007, 40 pp.
Graeme Campbell & Associates Pty Ltd
11
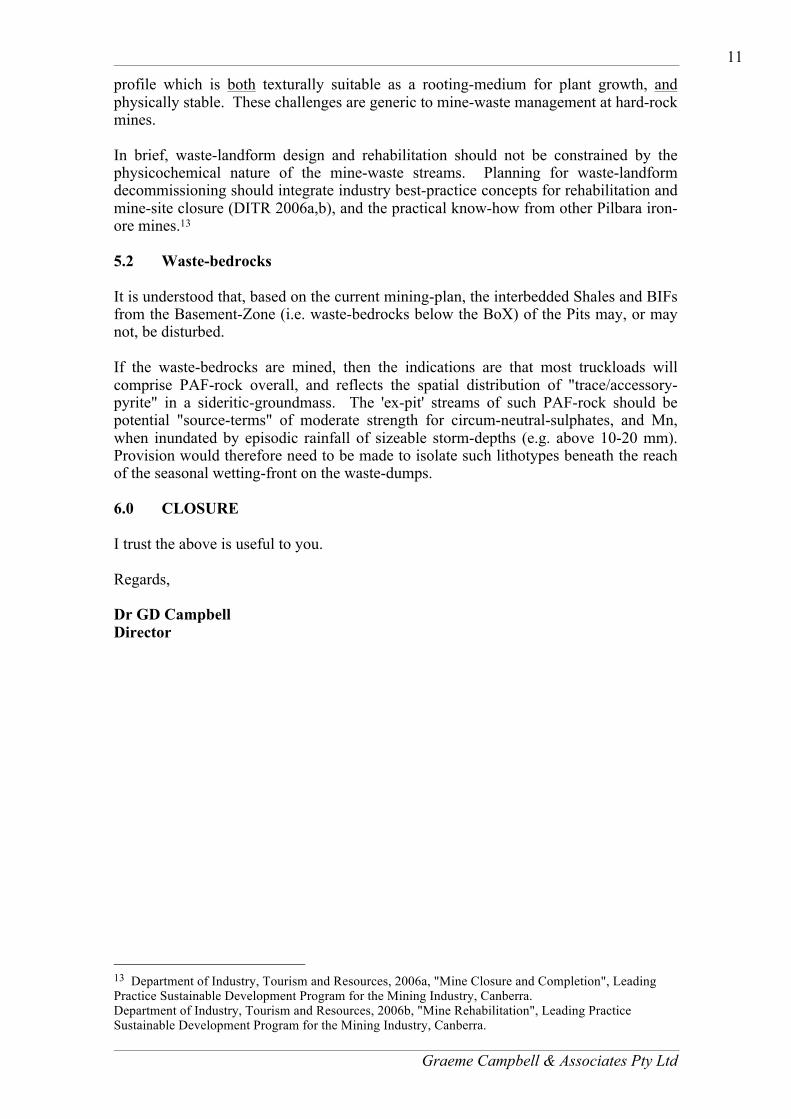
profile which is both texturally suitable as a rooting-medium for plant growth, and physically stable. These challenges are generic to mine-waste management at hard-rock mines. In brief, waste-landform design and rehabilitation should not be constrained by the physicochemical nature of the mine-waste streams. Planning for waste-landform decommissioning should integrate industry best-practice concepts for rehabilitation and mine-site closure (DITR 2006a,b), and the practical know-how from other Pilbara iron-ore mines.13 5.2 Waste-bedrocks It is understood that, based on the current mining-plan, the interbedded Shales and BIFs from the Basement-Zone (i.e. waste-bedrocks below the BoX) of the Pits may, or may not, be disturbed. If the waste-bedrocks are mined, then the indications are that most truckloads will comprise PAF-rock overall, and reflects the spatial distribution of "trace/accessory-pyrite" in a sideritic-groundmass. The 'ex-pit' streams of such PAF-rock should be potential "source-terms" of moderate strength for circum-neutral-sulphates, and Mn, when inundated by episodic rainfall of sizeable storm-depths (e.g. above 10-20 mm). Provision would therefore need to be made to isolate such lithotypes beneath the reach of the seasonal wetting-front on the waste-dumps. 6.0 CLOSURE I trust the above is useful to you. Regards, Dr GD Campbell Director
13 Department of Industry, Tourism and Resources, 2006a, "Mine Closure and Completion", Leading Practice Sustainable Development Program for the Mining Industry, Canberra. Department of Industry, Tourism and Resources, 2006b, "Mine Rehabilitation", Leading Practice Sustainable Development Program for the Mining Industry, Canberra.

Graeme Campbell & Associates Pty Ltd
TABLES
Graeme Campbell & Associates Pty Ltd
List of Tables
Delta
Table 1: Acid-Base-Analysis and Net-Acid-Generation Results for Mine-Waste Samples Table 2: Total-Contents of As, Sb, Se, Mo and B in Mine-Waste Samples Table 3: Multi-Element-Analysis Results for Mine-Waste Samples Table 4: Water-Extraction-Testwork Results for Mine-Waste Samples Table 5: Clay-Mineralogical and Clay-Surface-Chemistry Results for Mine-Waste Samples Table 6: Acid-Base-Analysis and Net-Acid-Generation Results for Waste-regolith Samples for
Kinetic-Testing Table 7: Multi-Element-Analysis Results for Waste-regolith Samples for Kinetic-Testing Table 8: Mineralogical Results for Waste-regolith Samples for Kinetic-Testing Table 9: Column-Leachate-Analysis Results for Waste-regolith Samples Table 10: Acid-Base-Analysis and Net-Acid-Generation Results for Waste-bedrock Samples for
Kinetic-Testing Table 11: Multi-Element-Analysis Results for Waste-bedrock Samples for Kinetic-Testing Table 12: Mineralogical Results for Waste-bedrock Samples for Kinetic-Testing Table 13: Column-Leachate-Analysis Results for Waste-bedrock Samples
Eagle
Table 14: Acid-Base-Analysis and Net-Acid-Generation Results for Mine-Waste Samples Table 15: Total-Contents of As, Sb, Se, Mo and B in Mine-Waste Samples Table 16: Multi-Element-Analysis Results for Mine-Waste Samples Table 17: Water-Extraction-Testwork Results for Mine-Waste Samples Table 18: Clay-Mineralogical and Clay-Surface-Chemistry Results for Mine-Waste Samples
Champion
Table 19: Acid-Base-Analysis and Net-Acid-Generation Results for Mine-Waste Samples Table 20: Total-Contents of As, Sb, Se, Mo and B in Mine-Waste Samples Table 21: Multi-Element-Analysis Results for Mine-Waste Samples Table 22: Water-Extraction-Testwork Results for Mine-Waste Samples Table 23: Clay-Mineralogical and Clay-Surface-Chemistry Results for Mine-Waste Samples
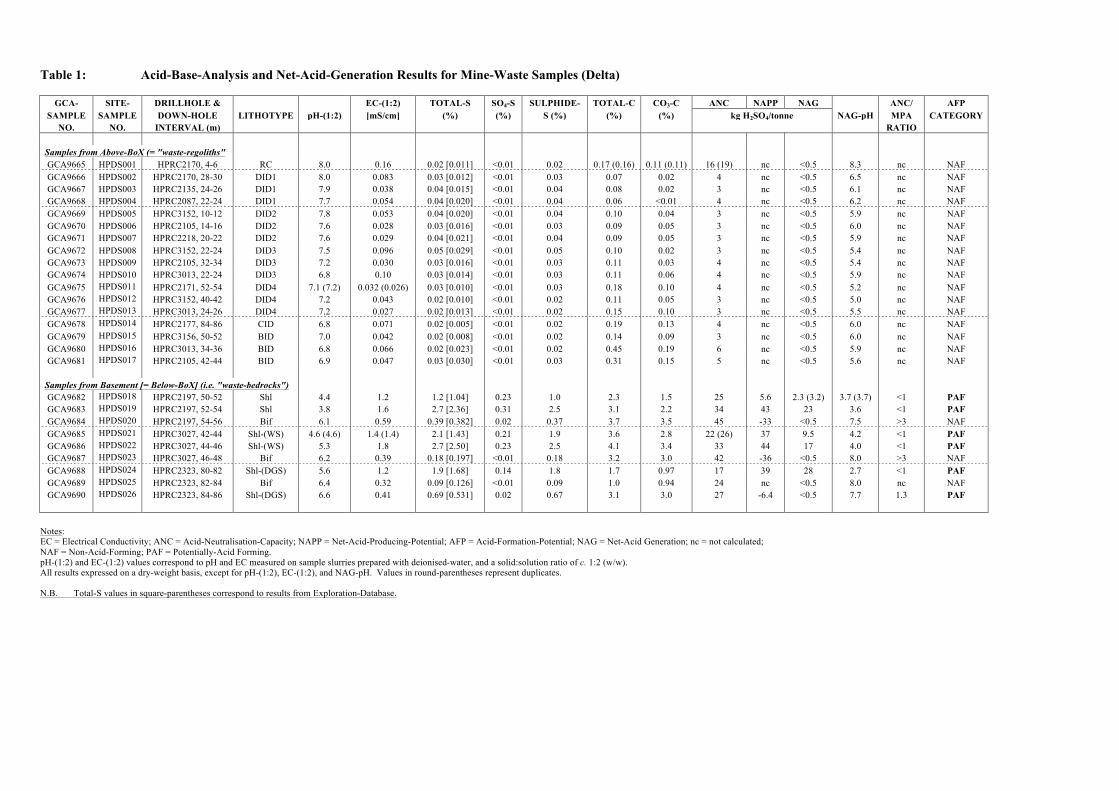
Table 1: Acid-Base-Analysis and Net-Acid-Generation Results for Mine-Waste Samples (Delta)
GCA- SITE- DRILLHOLE & EC-(1:2) TOTAL-S SO4-S SULPHIDE- TOTAL-C CO3-C ANC NAPP NAG ANC/ AFP SAMPLE SAMPLE DOWN-HOLE LITHOTYPE pH-(1:2) [mS/cm] (%) (%) S (%) (%) (%) kg H2SO4/tonne NAG-pH MPA CATEGORY
NO. NO. INTERVAL (m) RATIO
Samples from Above-BoX (= "waste-regoliths" GCA9665 HPDS001 HPRC2170, 4-6 RC 8.0 0.16 0.02 [0.011] <0.01 0.02 0.17 (0.16) 0.11 (0.11) 16 (19) nc <0.5 8.3 nc NAF GCA9666 HPDS002 HPRC2170, 28-30 DID1 8.0 0.083 0.03 [0.012] <0.01 0.03 0.07 0.02 4 nc <0.5 6.5 nc NAF GCA9667 HPDS003 HPRC2135, 24-26 DID1 7.9 0.038 0.04 [0.015] <0.01 0.04 0.08 0.02 3 nc <0.5 6.1 nc NAF GCA9668 HPDS004 HPRC2087, 22-24 DID1 7.7 0.054 0.04 [0.020] <0.01 0.04 0.06 <0.01 4 nc <0.5 6.2 nc NAF GCA9669 HPDS005 HPRC3152, 10-12 DID2 7.8 0.053 0.04 [0.020] <0.01 0.04 0.10 0.04 3 nc <0.5 5.9 nc NAF GCA9670 HPDS006 HPRC2105, 14-16 DID2 7.6 0.028 0.03 [0.016] <0.01 0.03 0.09 0.05 3 nc <0.5 6.0 nc NAF GCA9671 HPDS007 HPRC2218, 20-22 DID2 7.6 0.029 0.04 [0.021] <0.01 0.04 0.09 0.05 3 nc <0.5 5.9 nc NAF GCA9672 HPDS008 HPRC3152, 22-24 DID3 7.5 0.096 0.05 [0.029] <0.01 0.05 0.10 0.02 3 nc <0.5 5.4 nc NAF GCA9673 HPDS009 HPRC2105, 32-34 DID3 7.2 0.030 0.03 [0.016] <0.01 0.03 0.11 0.03 4 nc <0.5 5.4 nc NAF GCA9674 HPDS010 HPRC3013, 22-24 DID3 6.8 0.10 0.03 [0.014] <0.01 0.03 0.11 0.06 4 nc <0.5 5.9 nc NAF GCA9675 HPDS011 HPRC2171, 52-54 DID4 7.1 (7.2) 0.032 (0.026) 0.03 [0.010] <0.01 0.03 0.18 0.10 4 nc <0.5 5.2 nc NAF GCA9676 HPDS012 HPRC3152, 40-42 DID4 7.2 0.043 0.02 [0.010] <0.01 0.02 0.11 0.05 3 nc <0.5 5.0 nc NAF GCA9677 HPDS013 HPRC3013, 24-26 DID4 7.2 0.027 0.02 [0.013] <0.01 0.02 0.15 0.10 3 nc <0.5 5.5 nc NAF GCA9678 HPDS014 HPRC2177, 84-86 CID 6.8 0.071 0.02 [0.005] <0.01 0.02 0.19 0.13 4 nc <0.5 6.0 nc NAF GCA9679 HPDS015 HPRC3156, 50-52 BID 7.0 0.042 0.02 [0.008] <0.01 0.02 0.14 0.09 3 nc <0.5 6.0 nc NAF GCA9680 HPDS016 HPRC3013, 34-36 BID 6.8 0.066 0.02 [0.023] <0.01 0.02 0.45 0.19 6 nc <0.5 5.9 nc NAF GCA9681 HPDS017 HPRC2105, 42-44 BID 6.9 0.047 0.03 [0.030] <0.01 0.03 0.31 0.15 5 nc <0.5 5.6 nc NAF
Samples from Basement [= Below-BoX] (i.e. "waste-bedrocks") GCA9682 HPDS018 HPRC2197, 50-52 Shl 4.4 1.2 1.2 [1.04] 0.23 1.0 2.3 1.5 25 5.6 2.3 (3.2) 3.7 (3.7) <1 PAF GCA9683 HPDS019 HPRC2197, 52-54 Shl 3.8 1.6 2.7 [2.36] 0.31 2.5 3.1 2.2 34 43 23 3.6 <1 PAF GCA9684 HPDS020 HPRC2197, 54-56 Bif 6.1 0.59 0.39 [0.382] 0.02 0.37 3.7 3.5 45 -33 <0.5 7.5 >3 NAF GCA9685 HPDS021 HPRC3027, 42-44 Shl-(WS) 4.6 (4.6) 1.4 (1.4) 2.1 [1.43] 0.21 1.9 3.6 2.8 22 (26) 37 9.5 4.2 <1 PAF GCA9686 HPDS022 HPRC3027, 44-46 Shl-(WS) 5.3 1.8 2.7 [2.50] 0.23 2.5 4.1 3.4 33 44 17 4.0 <1 PAF GCA9687 HPDS023 HPRC3027, 46-48 Bif 6.2 0.39 0.18 [0.197] <0.01 0.18 3.2 3.0 42 -36 <0.5 8.0 >3 NAF GCA9688 HPDS024 HPRC2323, 80-82 Shl-(DGS) 5.6 1.2 1.9 [1.68] 0.14 1.8 1.7 0.97 17 39 28 2.7 <1 PAF GCA9689 HPDS025 HPRC2323, 82-84 Bif 6.4 0.32 0.09 [0.126] <0.01 0.09 1.0 0.94 24 nc <0.5 8.0 nc NAF GCA9690 HPDS026 HPRC2323, 84-86 Shl-(DGS) 6.6 0.41 0.69 [0.531] 0.02 0.67 3.1 3.0 27 -6.4 <0.5 7.7 1.3 PAF
Notes: EC = Electrical Conductivity; ANC = Acid-Neutralisation-Capacity; NAPP = Net-Acid-Producing-Potential; AFP = Acid-Formation-Potential; NAG = Net-Acid Generation; nc = not calculated; NAF = Non-Acid-Forming; PAF = Potentially-Acid Forming. pH-(1:2) and EC-(1:2) values correspond to pH and EC measured on sample slurries prepared with deionised-water, and a solid:solution ratio of c. 1:2 (w/w). All results expressed on a dry-weight basis, except for pH-(1:2), EC-(1:2), and NAG-pH. Values in round-parentheses represent duplicates. N.B. Total-S values in square-parentheses correspond to results from Exploration-Database.
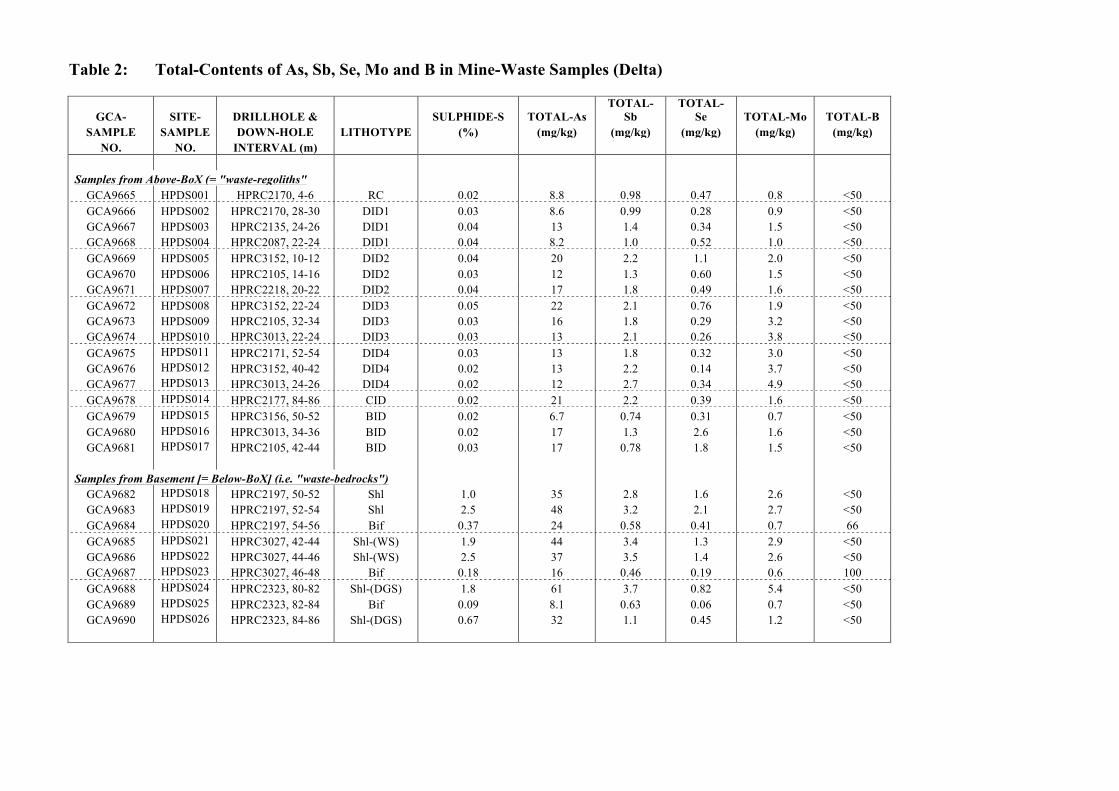
Table 2: Total-Contents of As, Sb, Se, Mo and B in Mine-Waste Samples (Delta)
GCA- SITE- DRILLHOLE & SULPHIDE-S TOTAL-As TOTAL-
Sb TOTAL-
Se TOTAL-Mo TOTAL-B SAMPLE SAMPLE DOWN-HOLE LITHOTYPE (%) (mg/kg) (mg/kg) (mg/kg) (mg/kg) (mg/kg)
NO. NO. INTERVAL (m)
Samples from Above-BoX (= "waste-regoliths" GCA9665 HPDS001 HPRC2170, 4-6 RC 0.02 8.8 0.98 0.47 0.8 <50 GCA9666 HPDS002 HPRC2170, 28-30 DID1 0.03 8.6 0.99 0.28 0.9 <50 GCA9667 HPDS003 HPRC2135, 24-26 DID1 0.04 13 1.4 0.34 1.5 <50 GCA9668 HPDS004 HPRC2087, 22-24 DID1 0.04 8.2 1.0 0.52 1.0 <50 GCA9669 HPDS005 HPRC3152, 10-12 DID2 0.04 20 2.2 1.1 2.0 <50 GCA9670 HPDS006 HPRC2105, 14-16 DID2 0.03 12 1.3 0.60 1.5 <50 GCA9671 HPDS007 HPRC2218, 20-22 DID2 0.04 17 1.8 0.49 1.6 <50 GCA9672 HPDS008 HPRC3152, 22-24 DID3 0.05 22 2.1 0.76 1.9 <50 GCA9673 HPDS009 HPRC2105, 32-34 DID3 0.03 16 1.8 0.29 3.2 <50 GCA9674 HPDS010 HPRC3013, 22-24 DID3 0.03 13 2.1 0.26 3.8 <50 GCA9675 HPDS011 HPRC2171, 52-54 DID4 0.03 13 1.8 0.32 3.0 <50 GCA9676 HPDS012 HPRC3152, 40-42 DID4 0.02 13 2.2 0.14 3.7 <50 GCA9677 HPDS013 HPRC3013, 24-26 DID4 0.02 12 2.7 0.34 4.9 <50 GCA9678 HPDS014 HPRC2177, 84-86 CID 0.02 21 2.2 0.39 1.6 <50 GCA9679 HPDS015 HPRC3156, 50-52 BID 0.02 6.7 0.74 0.31 0.7 <50 GCA9680 HPDS016 HPRC3013, 34-36 BID 0.02 17 1.3 2.6 1.6 <50 GCA9681 HPDS017 HPRC2105, 42-44 BID 0.03 17 0.78 1.8 1.5 <50
Samples from Basement [= Below-BoX] (i.e. "waste-bedrocks")
GCA9682 HPDS018 HPRC2197, 50-52 Shl 1.0 35 2.8 1.6 2.6 <50 GCA9683 HPDS019 HPRC2197, 52-54 Shl 2.5 48 3.2 2.1 2.7 <50 GCA9684 HPDS020 HPRC2197, 54-56 Bif 0.37 24 0.58 0.41 0.7 66 GCA9685 HPDS021 HPRC3027, 42-44 Shl-(WS) 1.9 44 3.4 1.3 2.9 <50 GCA9686 HPDS022 HPRC3027, 44-46 Shl-(WS) 2.5 37 3.5 1.4 2.6 <50 GCA9687 HPDS023 HPRC3027, 46-48 Bif 0.18 16 0.46 0.19 0.6 100 GCA9688 HPDS024 HPRC2323, 80-82 Shl-(DGS) 1.8 61 3.7 0.82 5.4 <50 GCA9689 HPDS025 HPRC2323, 82-84 Bif 0.09 8.1 0.63 0.06 0.7 <50 GCA9690 HPDS026 HPRC2323, 84-86 Shl-(DGS) 0.67 32 1.1 0.45 1.2 <50
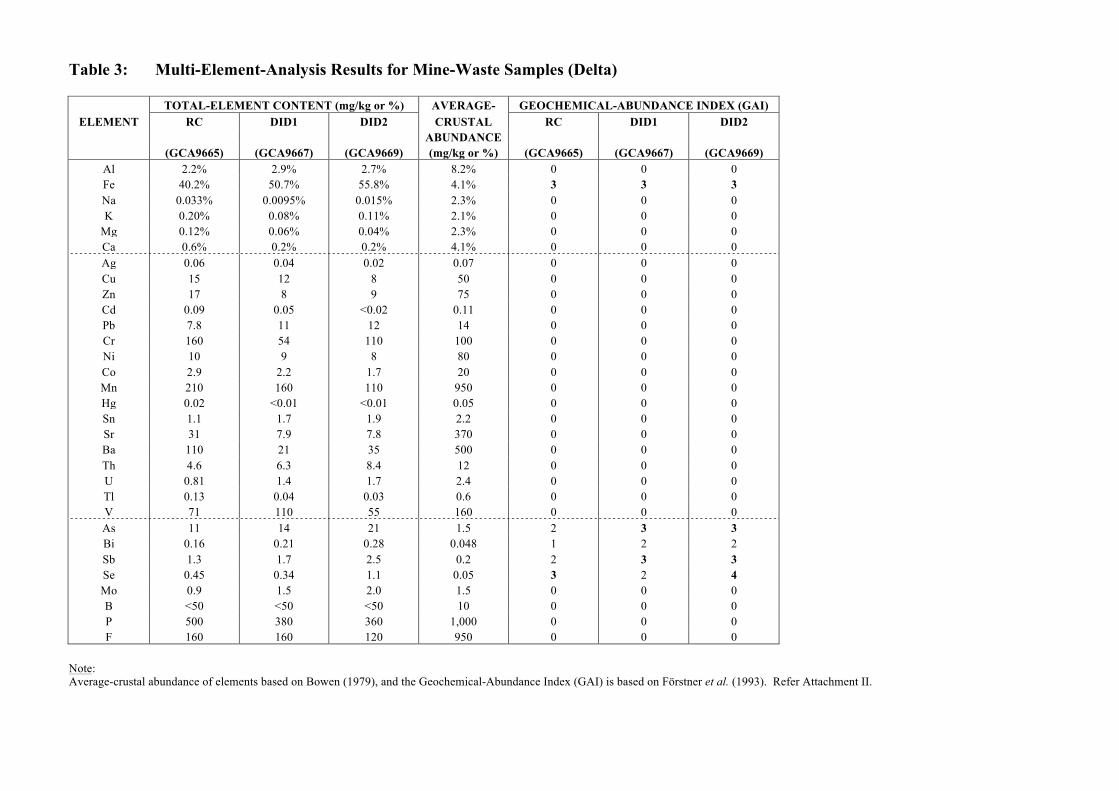
Table 3: Multi-Element-Analysis Results for Mine-Waste Samples (Delta) TOTAL-ELEMENT CONTENT (mg/kg or %) AVERAGE- GEOCHEMICAL-ABUNDANCE INDEX (GAI) ELEMENT RC DID1 DID2 CRUSTAL RC DID1 DID2
ABUNDANCE (GCA9665) (GCA9667) (GCA9669) (mg/kg or %) (GCA9665) (GCA9667) (GCA9669)
Al 2.2% 2.9% 2.7% 8.2% 0 0 0 Fe 40.2% 50.7% 55.8% 4.1% 3 3 3 Na 0.033% 0.0095% 0.015% 2.3% 0 0 0 K 0.20% 0.08% 0.11% 2.1% 0 0 0
Mg 0.12% 0.06% 0.04% 2.3% 0 0 0 Ca 0.6% 0.2% 0.2% 4.1% 0 0 0 Ag 0.06 0.04 0.02 0.07 0 0 0 Cu 15 12 8 50 0 0 0 Zn 17 8 9 75 0 0 0 Cd 0.09 0.05 <0.02 0.11 0 0 0 Pb 7.8 11 12 14 0 0 0 Cr 160 54 110 100 0 0 0 Ni 10 9 8 80 0 0 0 Co 2.9 2.2 1.7 20 0 0 0 Mn 210 160 110 950 0 0 0 Hg 0.02 <0.01 <0.01 0.05 0 0 0 Sn 1.1 1.7 1.9 2.2 0 0 0 Sr 31 7.9 7.8 370 0 0 0 Ba 110 21 35 500 0 0 0 Th 4.6 6.3 8.4 12 0 0 0 U 0.81 1.4 1.7 2.4 0 0 0 Tl 0.13 0.04 0.03 0.6 0 0 0 V 71 110 55 160 0 0 0 As 11 14 21 1.5 2 3 3 Bi 0.16 0.21 0.28 0.048 1 2 2 Sb 1.3 1.7 2.5 0.2 2 3 3 Se 0.45 0.34 1.1 0.05 3 2 4 Mo 0.9 1.5 2.0 1.5 0 0 0 B <50 <50 <50 10 0 0 0 P 500 380 360 1,000 0 0 0 F 160 160 120 950 0 0 0
Note: Average-crustal abundance of elements based on Bowen (1979), and the Geochemical-Abundance Index (GAI) is based on Förstner et al. (1993). Refer Attachment II.
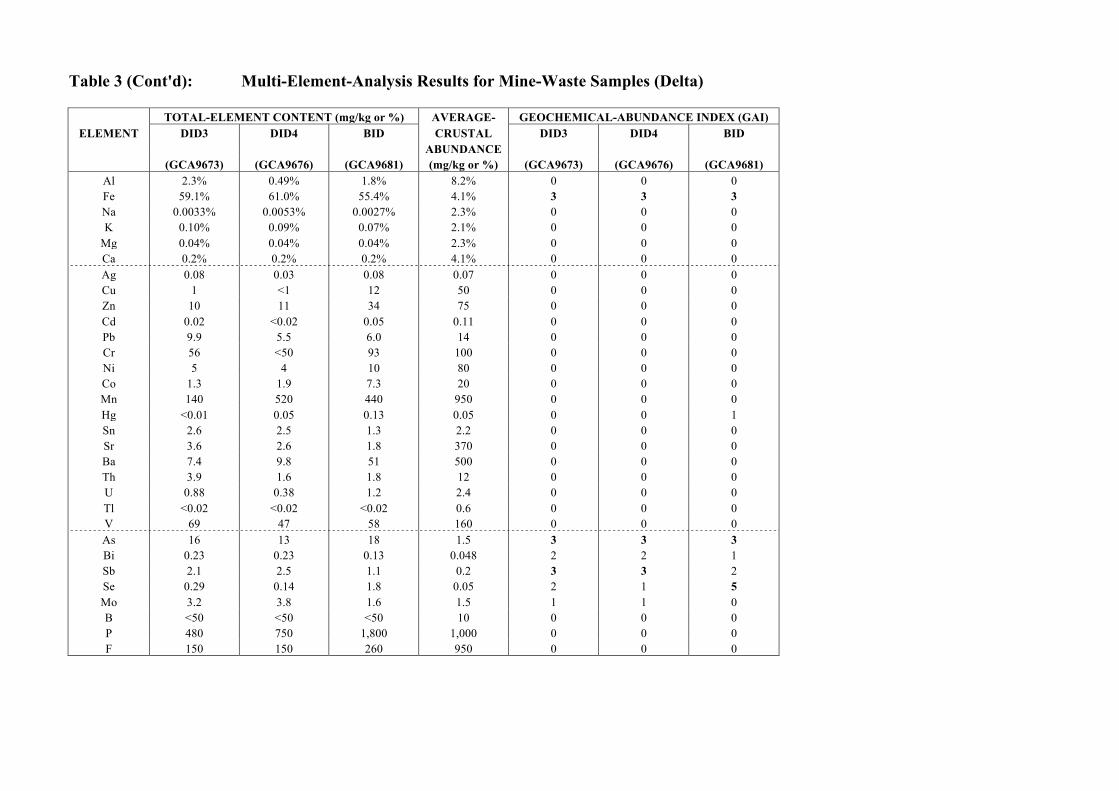
Table 3 (Cont'd): Multi-Element-Analysis Results for Mine-Waste Samples (Delta) TOTAL-ELEMENT CONTENT (mg/kg or %) AVERAGE- GEOCHEMICAL-ABUNDANCE INDEX (GAI) ELEMENT DID3 DID4 BID CRUSTAL DID3 DID4 BID
ABUNDANCE (GCA9673) (GCA9676) (GCA9681) (mg/kg or %) (GCA9673) (GCA9676) (GCA9681)
Al 2.3% 0.49% 1.8% 8.2% 0 0 0 Fe 59.1% 61.0% 55.4% 4.1% 3 3 3 Na 0.0033% 0.0053% 0.0027% 2.3% 0 0 0 K 0.10% 0.09% 0.07% 2.1% 0 0 0
Mg 0.04% 0.04% 0.04% 2.3% 0 0 0 Ca 0.2% 0.2% 0.2% 4.1% 0 0 0 Ag 0.08 0.03 0.08 0.07 0 0 0 Cu 1 <1 12 50 0 0 0 Zn 10 11 34 75 0 0 0 Cd 0.02 <0.02 0.05 0.11 0 0 0 Pb 9.9 5.5 6.0 14 0 0 0 Cr 56 <50 93 100 0 0 0 Ni 5 4 10 80 0 0 0 Co 1.3 1.9 7.3 20 0 0 0 Mn 140 520 440 950 0 0 0 Hg <0.01 0.05 0.13 0.05 0 0 1 Sn 2.6 2.5 1.3 2.2 0 0 0 Sr 3.6 2.6 1.8 370 0 0 0 Ba 7.4 9.8 51 500 0 0 0 Th 3.9 1.6 1.8 12 0 0 0 U 0.88 0.38 1.2 2.4 0 0 0 Tl <0.02 <0.02 <0.02 0.6 0 0 0 V 69 47 58 160 0 0 0 As 16 13 18 1.5 3 3 3 Bi 0.23 0.23 0.13 0.048 2 2 1 Sb 2.1 2.5 1.1 0.2 3 3 2 Se 0.29 0.14 1.8 0.05 2 1 5 Mo 3.2 3.8 1.6 1.5 1 1 0 B <50 <50 <50 10 0 0 0 P 480 750 1,800 1,000 0 0 0 F 150 150 260 950 0 0 0
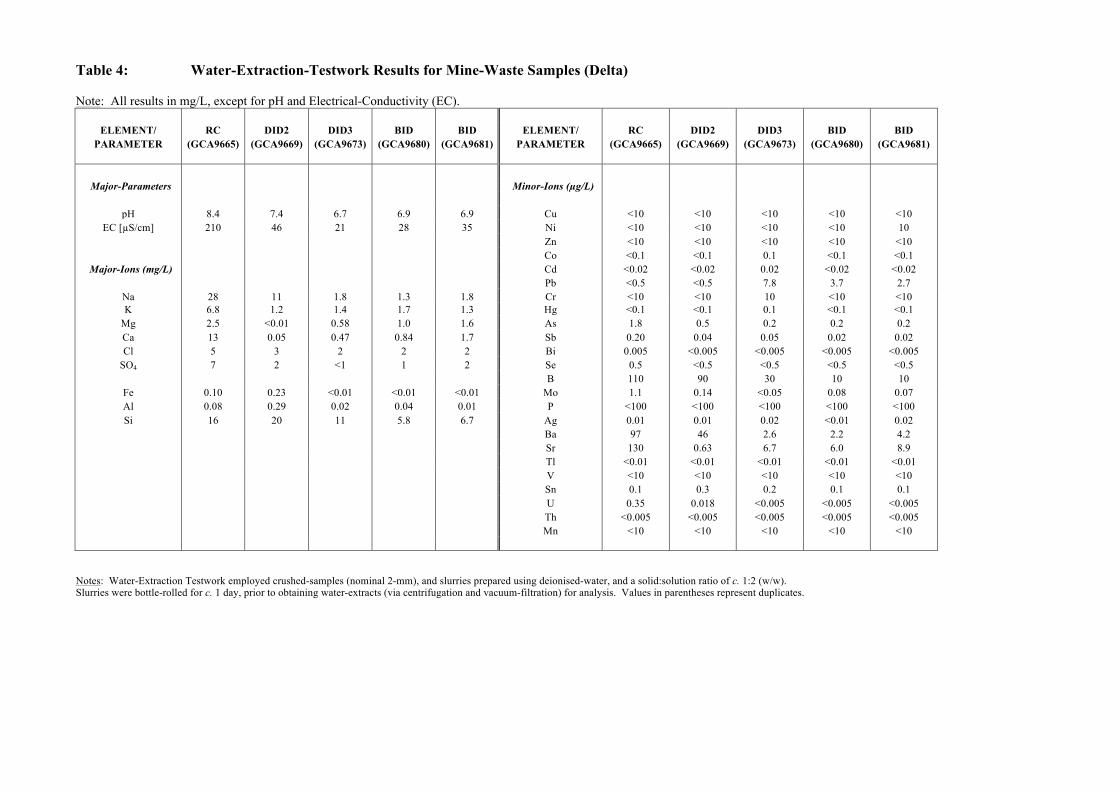
Table 4: Water-Extraction-Testwork Results for Mine-Waste Samples (Delta) Note: All results in mg/L, except for pH and Electrical-Conductivity (EC).
ELEMENT/ RC DID2 DID3 BID BID ELEMENT/ RC DID2 DID3 BID BID PARAMETER (GCA9665) (GCA9669) (GCA9673) (GCA9680) (GCA9681) PARAMETER (GCA9665) (GCA9669) (GCA9673) (GCA9680) (GCA9681)
Major-Parameters Minor-Ions (µg/L)
pH 8.4 7.4 6.7 6.9 6.9 Cu <10 <10 <10 <10 <10 EC [µS/cm] 210 46 21 28 35 Ni <10 <10 <10 <10 10
Zn <10 <10 <10 <10 <10 Co <0.1 <0.1 0.1 <0.1 <0.1
Major-Ions (mg/L) Cd <0.02 <0.02 0.02 <0.02 <0.02 Pb <0.5 <0.5 7.8 3.7 2.7
Na 28 11 1.8 1.3 1.8 Cr <10 <10 10 <10 <10 K 6.8 1.2 1.4 1.7 1.3 Hg <0.1 <0.1 0.1 <0.1 <0.1
Mg 2.5 <0.01 0.58 1.0 1.6 As 1.8 0.5 0.2 0.2 0.2 Ca 13 0.05 0.47 0.84 1.7 Sb 0.20 0.04 0.05 0.02 0.02 Cl 5 3 2 2 2 Bi 0.005 <0.005 <0.005 <0.005 <0.005
SO4 7 2 <1 1 2 Se 0.5 <0.5 <0.5 <0.5 <0.5 B 110 90 30 10 10
Fe 0.10 0.23 <0.01 <0.01 <0.01 Mo 1.1 0.14 <0.05 0.08 0.07 Al 0.08 0.29 0.02 0.04 0.01 P <100 <100 <100 <100 <100 Si 16 20 11 5.8 6.7 Ag 0.01 0.01 0.02 <0.01 0.02 Ba 97 46 2.6 2.2 4.2 Sr 130 0.63 6.7 6.0 8.9 Tl <0.01 <0.01 <0.01 <0.01 <0.01 V <10 <10 <10 <10 <10 Sn 0.1 0.3 0.2 0.1 0.1 U 0.35 0.018 <0.005 <0.005 <0.005 Th <0.005 <0.005 <0.005 <0.005 <0.005 Mn <10 <10 <10 <10 <10
Notes: Water-Extraction Testwork employed crushed-samples (nominal 2-mm), and slurries prepared using deionised-water, and a solid:solution ratio of c. 1:2 (w/w). Slurries were bottle-rolled for c. 1 day, prior to obtaining water-extracts (via centrifugation and vacuum-filtration) for analysis. Values in parentheses represent duplicates.
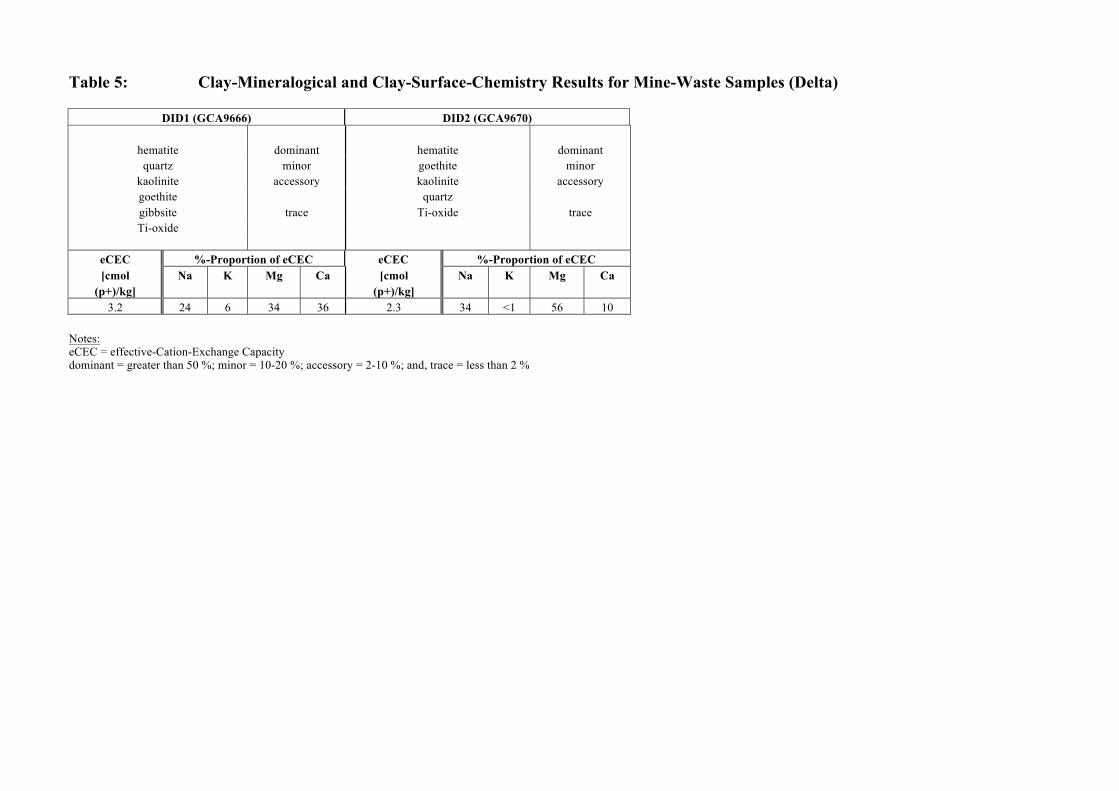
Table 5: Clay-Mineralogical and Clay-Surface-Chemistry Results for Mine-Waste Samples (Delta)
DID1 (GCA9666) DID2 (GCA9670)
hematite dominant hematite dominant quartz minor goethite minor
kaolinite accessory kaolinite accessory goethite quartz gibbsite trace Ti-oxide trace Ti-oxide
eCEC %-Proportion of eCEC eCEC %-Proportion of eCEC [cmol Na K Mg Ca [cmol Na K Mg Ca
(p+)/kg] (p+)/kg] 3.2 24 6 34 36 2.3 34 <1 56 10
Notes: eCEC = effective-Cation-Exchange Capacity dominant = greater than 50 %; minor = 10-20 %; accessory = 2-10 %; and, trace = less than 2 %
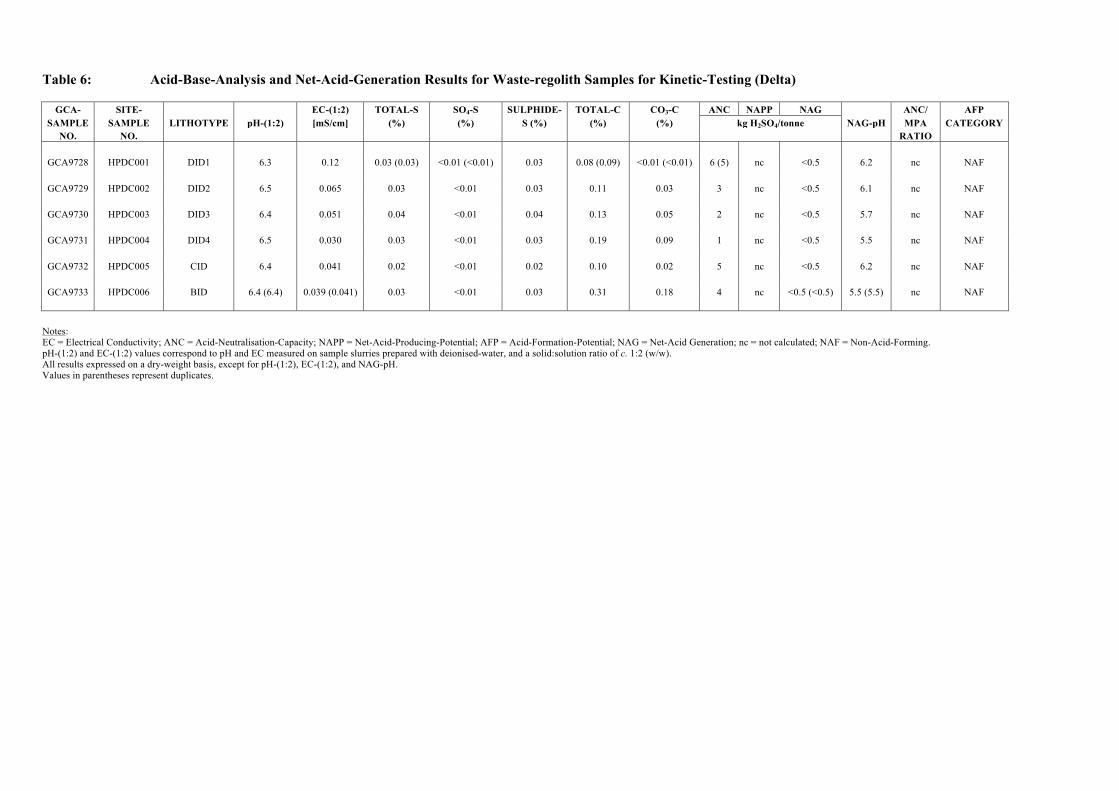
Table 6: Acid-Base-Analysis and Net-Acid-Generation Results for Waste-regolith Samples for Kinetic-Testing (Delta)
GCA- SITE- EC-(1:2) TOTAL-S SO4-S SULPHIDE- TOTAL-C CO3-C ANC NAPP NAG ANC/ AFP SAMPLE SAMPLE LITHOTYPE pH-(1:2) [mS/cm] (%) (%) S (%) (%) (%) kg H2SO4/tonne NAG-pH MPA CATEGORY
NO. NO. RATIO
GCA9728 HPDC001 DID1 6.3 0.12 0.03 (0.03) <0.01 (<0.01) 0.03 0.08 (0.09) <0.01 (<0.01) 6 (5) nc <0.5 6.2 nc NAF
GCA9729 HPDC002 DID2 6.5 0.065 0.03 <0.01 0.03 0.11 0.03 3 nc <0.5 6.1 nc NAF
GCA9730 HPDC003 DID3 6.4 0.051 0.04 <0.01 0.04 0.13 0.05 2 nc <0.5 5.7 nc NAF
GCA9731 HPDC004 DID4 6.5 0.030 0.03 <0.01 0.03 0.19 0.09 1 nc <0.5 5.5 nc NAF
GCA9732 HPDC005 CID 6.4 0.041 0.02 <0.01 0.02 0.10 0.02 5 nc <0.5 6.2 nc NAF
GCA9733 HPDC006 BID 6.4 (6.4) 0.039 (0.041) 0.03 <0.01 0.03 0.31 0.18 4 nc <0.5 (<0.5) 5.5 (5.5) nc NAF
Notes: EC = Electrical Conductivity; ANC = Acid-Neutralisation-Capacity; NAPP = Net-Acid-Producing-Potential; AFP = Acid-Formation-Potential; NAG = Net-Acid Generation; nc = not calculated; NAF = Non-Acid-Forming. pH-(1:2) and EC-(1:2) values correspond to pH and EC measured on sample slurries prepared with deionised-water, and a solid:solution ratio of c. 1:2 (w/w). All results expressed on a dry-weight basis, except for pH-(1:2), EC-(1:2), and NAG-pH. Values in parentheses represent duplicates.
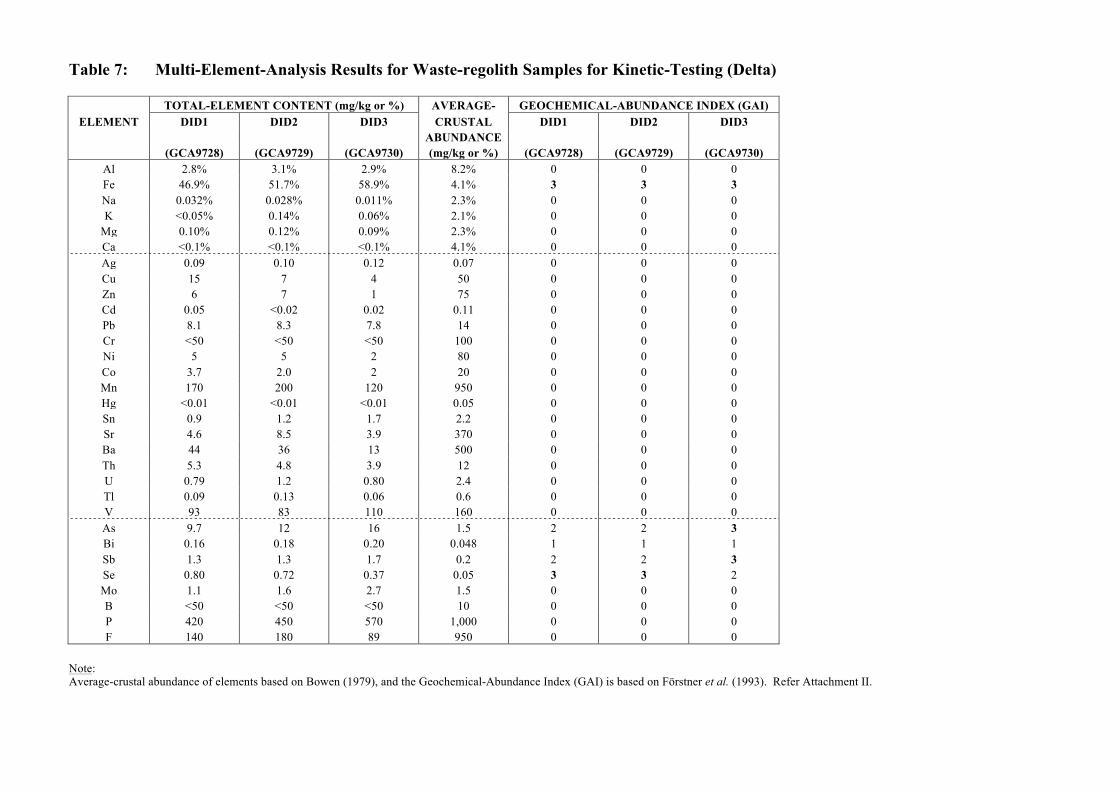
Table 7: Multi-Element-Analysis Results for Waste-regolith Samples for Kinetic-Testing (Delta) TOTAL-ELEMENT CONTENT (mg/kg or %) AVERAGE- GEOCHEMICAL-ABUNDANCE INDEX (GAI) ELEMENT DID1 DID2 DID3 CRUSTAL DID1 DID2 DID3
ABUNDANCE (GCA9728) (GCA9729) (GCA9730) (mg/kg or %) (GCA9728) (GCA9729) (GCA9730)
Al 2.8% 3.1% 2.9% 8.2% 0 0 0 Fe 46.9% 51.7% 58.9% 4.1% 3 3 3 Na 0.032% 0.028% 0.011% 2.3% 0 0 0 K <0.05% 0.14% 0.06% 2.1% 0 0 0
Mg 0.10% 0.12% 0.09% 2.3% 0 0 0 Ca <0.1% <0.1% <0.1% 4.1% 0 0 0 Ag 0.09 0.10 0.12 0.07 0 0 0 Cu 15 7 4 50 0 0 0 Zn 6 7 1 75 0 0 0 Cd 0.05 <0.02 0.02 0.11 0 0 0 Pb 8.1 8.3 7.8 14 0 0 0 Cr <50 <50 <50 100 0 0 0 Ni 5 5 2 80 0 0 0 Co 3.7 2.0 2 20 0 0 0 Mn 170 200 120 950 0 0 0 Hg <0.01 <0.01 <0.01 0.05 0 0 0 Sn 0.9 1.2 1.7 2.2 0 0 0 Sr 4.6 8.5 3.9 370 0 0 0 Ba 44 36 13 500 0 0 0 Th 5.3 4.8 3.9 12 0 0 0 U 0.79 1.2 0.80 2.4 0 0 0 Tl 0.09 0.13 0.06 0.6 0 0 0 V 93 83 110 160 0 0 0 As 9.7 12 16 1.5 2 2 3 Bi 0.16 0.18 0.20 0.048 1 1 1 Sb 1.3 1.3 1.7 0.2 2 2 3 Se 0.80 0.72 0.37 0.05 3 3 2 Mo 1.1 1.6 2.7 1.5 0 0 0 B <50 <50 <50 10 0 0 0 P 420 450 570 1,000 0 0 0 F 140 180 89 950 0 0 0
Note: Average-crustal abundance of elements based on Bowen (1979), and the Geochemical-Abundance Index (GAI) is based on Förstner et al. (1993). Refer Attachment II.
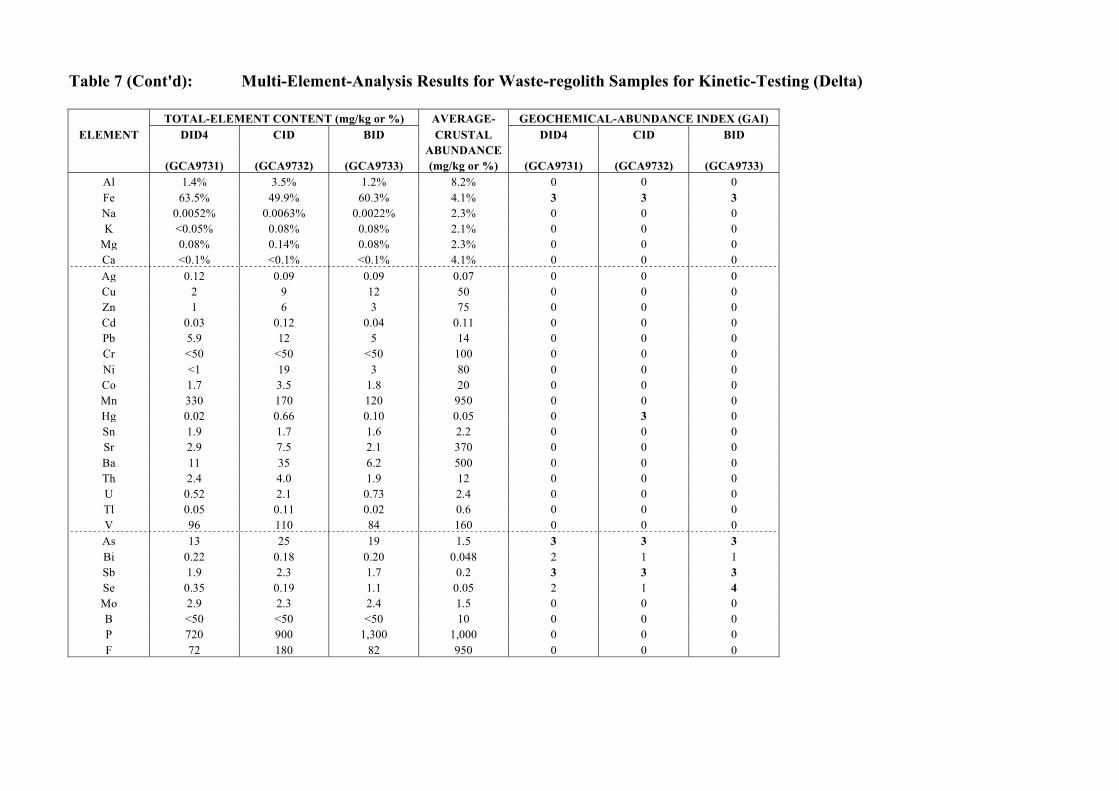
Table 7 (Cont'd): Multi-Element-Analysis Results for Waste-regolith Samples for Kinetic-Testing (Delta) TOTAL-ELEMENT CONTENT (mg/kg or %) AVERAGE- GEOCHEMICAL-ABUNDANCE INDEX (GAI) ELEMENT DID4 CID BID CRUSTAL DID4 CID BID
ABUNDANCE (GCA9731) (GCA9732) (GCA9733) (mg/kg or %) (GCA9731) (GCA9732) (GCA9733)
Al 1.4% 3.5% 1.2% 8.2% 0 0 0 Fe 63.5% 49.9% 60.3% 4.1% 3 3 3 Na 0.0052% 0.0063% 0.0022% 2.3% 0 0 0 K <0.05% 0.08% 0.08% 2.1% 0 0 0
Mg 0.08% 0.14% 0.08% 2.3% 0 0 0 Ca <0.1% <0.1% <0.1% 4.1% 0 0 0 Ag 0.12 0.09 0.09 0.07 0 0 0 Cu 2 9 12 50 0 0 0 Zn 1 6 3 75 0 0 0 Cd 0.03 0.12 0.04 0.11 0 0 0 Pb 5.9 12 5 14 0 0 0 Cr <50 <50 <50 100 0 0 0 Ni <1 19 3 80 0 0 0 Co 1.7 3.5 1.8 20 0 0 0 Mn 330 170 120 950 0 0 0 Hg 0.02 0.66 0.10 0.05 0 3 0 Sn 1.9 1.7 1.6 2.2 0 0 0 Sr 2.9 7.5 2.1 370 0 0 0 Ba 11 35 6.2 500 0 0 0 Th 2.4 4.0 1.9 12 0 0 0 U 0.52 2.1 0.73 2.4 0 0 0 Tl 0.05 0.11 0.02 0.6 0 0 0 V 96 110 84 160 0 0 0 As 13 25 19 1.5 3 3 3 Bi 0.22 0.18 0.20 0.048 2 1 1 Sb 1.9 2.3 1.7 0.2 3 3 3 Se 0.35 0.19 1.1 0.05 2 1 4 Mo 2.9 2.3 2.4 1.5 0 0 0 B <50 <50 <50 10 0 0 0 P 720 900 1,300 1,000 0 0 0 F 72 180 82 950 0 0 0
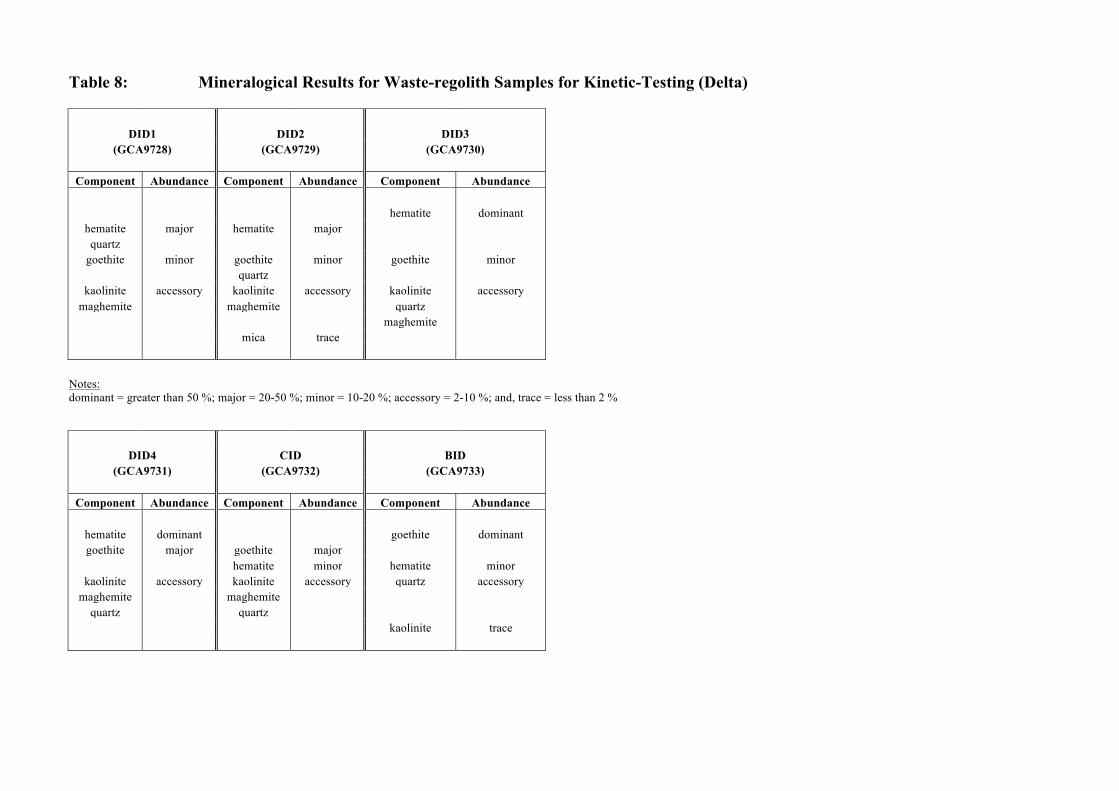
Table 8: Mineralogical Results for Waste-regolith Samples for Kinetic-Testing (Delta)
DID1 DID2 DID3 (GCA9728) (GCA9729) (GCA9730)
Component Abundance Component Abundance Component Abundance
hematite dominant
hematite major hematite major quartz
goethite minor goethite minor goethite minor quartz
kaolinite accessory kaolinite accessory kaolinite accessory maghemite maghemite quartz
maghemite mica trace
Notes: dominant = greater than 50 %; major = 20-50 %; minor = 10-20 %; accessory = 2-10 %; and, trace = less than 2 %
DID4 CID BID (GCA9731) (GCA9732) (GCA9733)
Component Abundance Component Abundance Component Abundance
hematite dominant goethite dominant goethite major goethite major
hematite minor hematite minor kaolinite accessory kaolinite accessory quartz accessory
maghemite maghemite quartz quartz
kaolinite trace
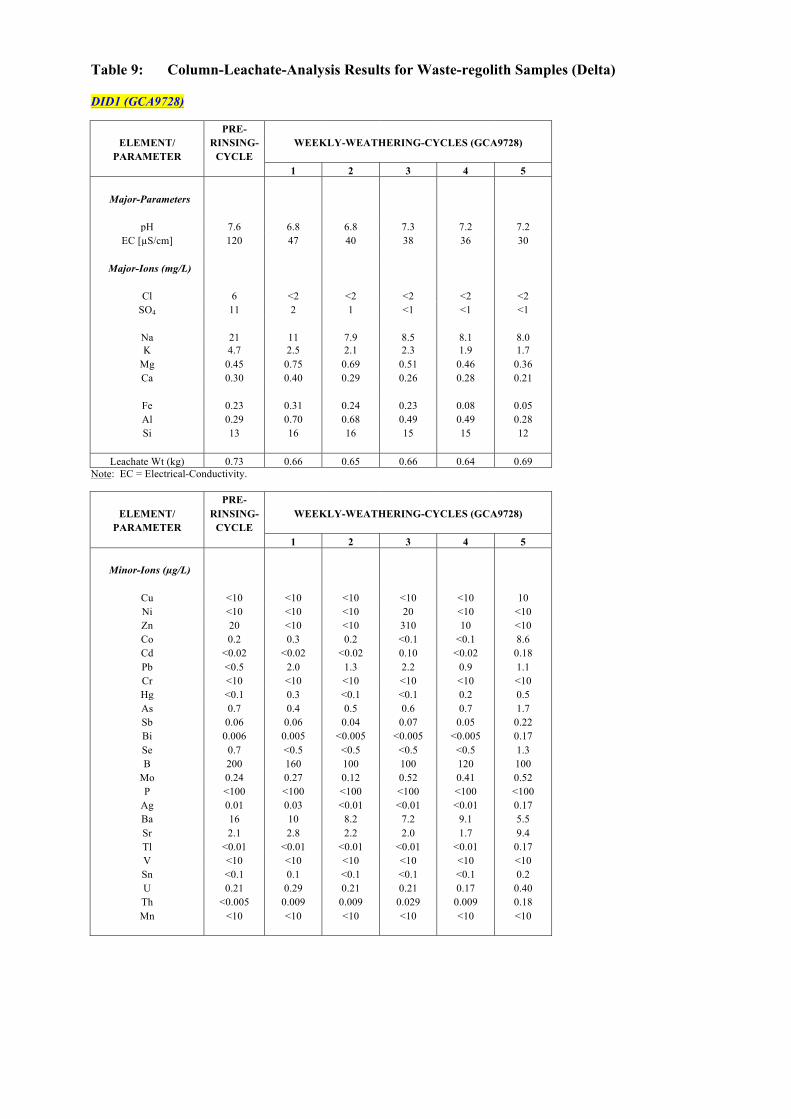
Table 9: Column-Leachate-Analysis Results for Waste-regolith Samples (Delta) DID1 (GCA9728) PRE-
ELEMENT/ RINSING- WEEKLY-WEATHERING-CYCLES (GCA9728) PARAMETER CYCLE
1 2 3 4 5
Major-Parameters
pH 7.6 6.8 6.8 7.3 7.2 7.2 EC [µS/cm] 120 47 40 38 36 30
Major-Ions (mg/L)
Cl 6 <2 <2 <2 <2 <2
SO4 11 2 1 <1 <1 <1
Na 21 11 7.9 8.5 8.1 8.0 K 4.7 2.5 2.1 2.3 1.9 1.7
Mg 0.45 0.75 0.69 0.51 0.46 0.36 Ca 0.30 0.40 0.29 0.26 0.28 0.21
Fe 0.23 0.31 0.24 0.23 0.08 0.05 Al 0.29 0.70 0.68 0.49 0.49 0.28 Si 13 16 16 15 15 12
Leachate Wt (kg) 0.73 0.66 0.65 0.66 0.64 0.69 Note: EC = Electrical-Conductivity. PRE-
ELEMENT/ RINSING- WEEKLY-WEATHERING-CYCLES (GCA9728) PARAMETER CYCLE
1 2 3 4 5
Minor-Ions (µg/L)
Cu <10 <10 <10 <10 <10 10 Ni <10 <10 <10 20 <10 <10 Zn 20 <10 <10 310 10 <10 Co 0.2 0.3 0.2 <0.1 <0.1 8.6 Cd <0.02 <0.02 <0.02 0.10 <0.02 0.18 Pb <0.5 2.0 1.3 2.2 0.9 1.1 Cr <10 <10 <10 <10 <10 <10 Hg <0.1 0.3 <0.1 <0.1 0.2 0.5 As 0.7 0.4 0.5 0.6 0.7 1.7 Sb 0.06 0.06 0.04 0.07 0.05 0.22 Bi 0.006 0.005 <0.005 <0.005 <0.005 0.17 Se 0.7 <0.5 <0.5 <0.5 <0.5 1.3 B 200 160 100 100 120 100
Mo 0.24 0.27 0.12 0.52 0.41 0.52 P <100 <100 <100 <100 <100 <100
Ag 0.01 0.03 <0.01 <0.01 <0.01 0.17 Ba 16 10 8.2 7.2 9.1 5.5 Sr 2.1 2.8 2.2 2.0 1.7 9.4 Tl <0.01 <0.01 <0.01 <0.01 <0.01 0.17 V <10 <10 <10 <10 <10 <10 Sn <0.1 0.1 <0.1 <0.1 <0.1 0.2 U 0.21 0.29 0.21 0.21 0.17 0.40 Th <0.005 0.009 0.009 0.029 0.009 0.18 Mn <10 <10 <10 <10 <10 <10
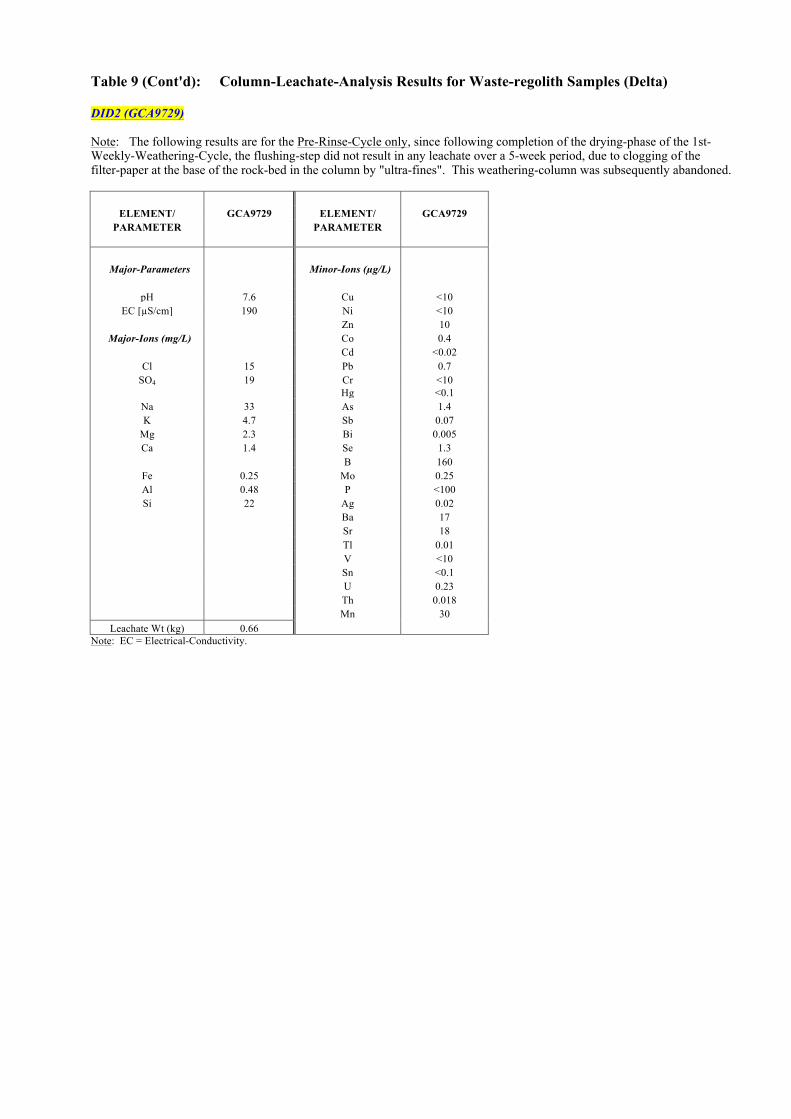
Table 9 (Cont'd): Column-Leachate-Analysis Results for Waste-regolith Samples (Delta) DID2 (GCA9729) Note: The following results are for the Pre-Rinse-Cycle only, since following completion of the drying-phase of the 1st-Weekly-Weathering-Cycle, the flushing-step did not result in any leachate over a 5-week period, due to clogging of the filter-paper at the base of the rock-bed in the column by "ultra-fines". This weathering-column was subsequently abandoned.
ELEMENT/ GCA9729 ELEMENT/ GCA9729
PARAMETER PARAMETER
Major-Parameters Minor-Ions (µg/L)
pH 7.6 Cu <10 EC [µS/cm] 190 Ni <10
Zn 10 Major-Ions (mg/L) Co 0.4
Cd <0.02 Cl 15 Pb 0.7
SO4 19 Cr <10 Hg <0.1
Na 33 As 1.4 K 4.7 Sb 0.07
Mg 2.3 Bi 0.005 Ca 1.4 Se 1.3 B 160
Fe 0.25 Mo 0.25 Al 0.48 P <100 Si 22 Ag 0.02 Ba 17 Sr 18 Tl 0.01 V <10 Sn <0.1 U 0.23 Th 0.018 Mn 30
Leachate Wt (kg) 0.66 Note: EC = Electrical-Conductivity.
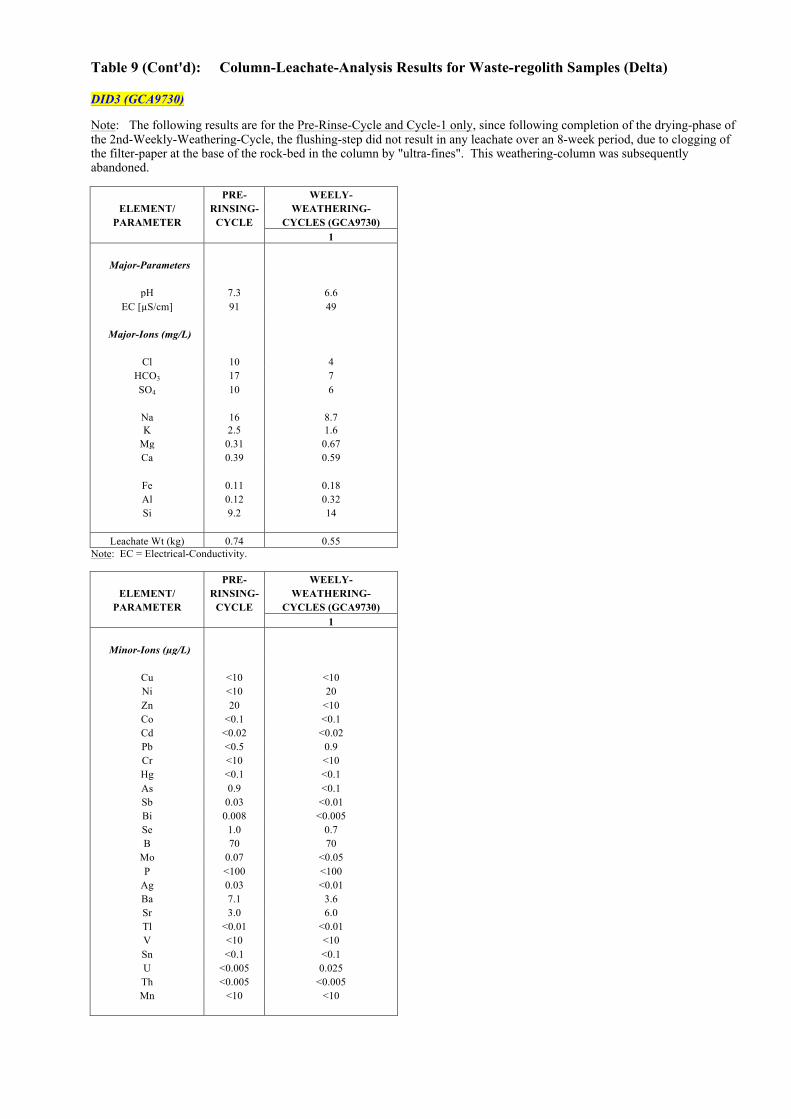
Table 9 (Cont'd): Column-Leachate-Analysis Results for Waste-regolith Samples (Delta) DID3 (GCA9730) Note: The following results are for the Pre-Rinse-Cycle and Cycle-1 only, since following completion of the drying-phase of the 2nd-Weekly-Weathering-Cycle, the flushing-step did not result in any leachate over an 8-week period, due to clogging of the filter-paper at the base of the rock-bed in the column by "ultra-fines". This weathering-column was subsequently abandoned. PRE- WEELY-
ELEMENT/ RINSING- WEATHERING- PARAMETER CYCLE CYCLES (GCA9730)
1
Major-Parameters
pH 7.3 6.6 EC [µS/cm] 91 49
Major-Ions (mg/L)
Cl 10 4
HCO3 17 7 SO4 10 6
Na 16 8.7 K 2.5 1.6
Mg 0.31 0.67 Ca 0.39 0.59
Fe 0.11 0.18 Al 0.12 0.32 Si 9.2 14
Leachate Wt (kg) 0.74 0.55 Note: EC = Electrical-Conductivity. PRE- WEELY-
ELEMENT/ RINSING- WEATHERING- PARAMETER CYCLE CYCLES (GCA9730)
1
Minor-Ions (µg/L)
Cu <10 <10 Ni <10 20 Zn 20 <10 Co <0.1 <0.1 Cd <0.02 <0.02 Pb <0.5 0.9 Cr <10 <10 Hg <0.1 <0.1 As 0.9 <0.1 Sb 0.03 <0.01 Bi 0.008 <0.005 Se 1.0 0.7 B 70 70
Mo 0.07 <0.05 P <100 <100
Ag 0.03 <0.01 Ba 7.1 3.6 Sr 3.0 6.0 Tl <0.01 <0.01 V <10 <10 Sn <0.1 <0.1 U <0.005 0.025 Th <0.005 <0.005 Mn <10 <10
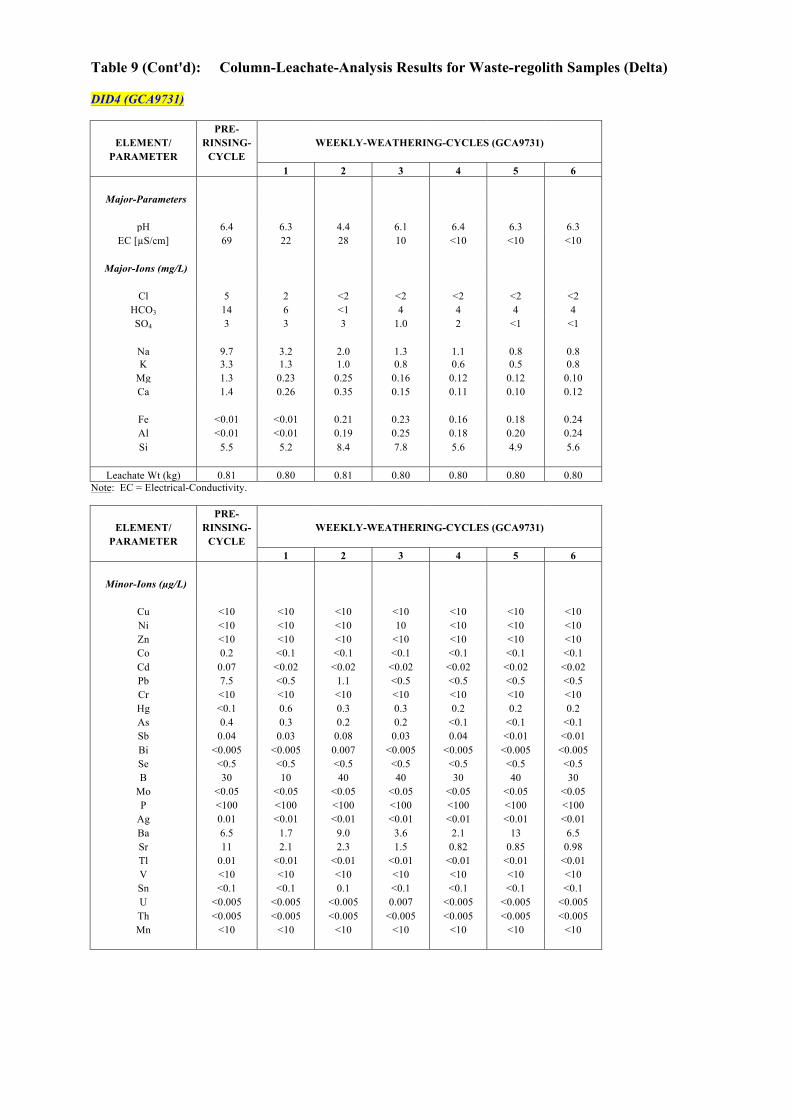
Table 9 (Cont'd): Column-Leachate-Analysis Results for Waste-regolith Samples (Delta) DID4 (GCA9731) PRE-
ELEMENT/ RINSING- WEEKLY-WEATHERING-CYCLES (GCA9731) PARAMETER CYCLE
1 2 3 4 5 6
Major-Parameters
pH 6.4 6.3 4.4 6.1 6.4 6.3 6.3 EC [µS/cm] 69 22 28 10 <10 <10 <10
Major-Ions (mg/L)
Cl 5 2 <2 <2 <2 <2 <2
HCO3 14 6 <1 4 4 4 4 SO4 3 3 3 1.0 2 <1 <1
Na 9.7 3.2 2.0 1.3 1.1 0.8 0.8 K 3.3 1.3 1.0 0.8 0.6 0.5 0.8
Mg 1.3 0.23 0.25 0.16 0.12 0.12 0.10 Ca 1.4 0.26 0.35 0.15 0.11 0.10 0.12
Fe <0.01 <0.01 0.21 0.23 0.16 0.18 0.24 Al <0.01 <0.01 0.19 0.25 0.18 0.20 0.24 Si 5.5 5.2 8.4 7.8 5.6 4.9 5.6
Leachate Wt (kg) 0.81 0.80 0.81 0.80 0.80 0.80 0.80 Note: EC = Electrical-Conductivity. PRE-
ELEMENT/ RINSING- WEEKLY-WEATHERING-CYCLES (GCA9731) PARAMETER CYCLE
1 2 3 4 5 6
Minor-Ions (µg/L)
Cu <10 <10 <10 <10 <10 <10 <10 Ni <10 <10 <10 10 <10 <10 <10 Zn <10 <10 <10 <10 <10 <10 <10 Co 0.2 <0.1 <0.1 <0.1 <0.1 <0.1 <0.1 Cd 0.07 <0.02 <0.02 <0.02 <0.02 <0.02 <0.02 Pb 7.5 <0.5 1.1 <0.5 <0.5 <0.5 <0.5 Cr <10 <10 <10 <10 <10 <10 <10 Hg <0.1 0.6 0.3 0.3 0.2 0.2 0.2 As 0.4 0.3 0.2 0.2 <0.1 <0.1 <0.1 Sb 0.04 0.03 0.08 0.03 0.04 <0.01 <0.01 Bi <0.005 <0.005 0.007 <0.005 <0.005 <0.005 <0.005 Se <0.5 <0.5 <0.5 <0.5 <0.5 <0.5 <0.5 B 30 10 40 40 30 40 30
Mo <0.05 <0.05 <0.05 <0.05 <0.05 <0.05 <0.05 P <100 <100 <100 <100 <100 <100 <100
Ag 0.01 <0.01 <0.01 <0.01 <0.01 <0.01 <0.01 Ba 6.5 1.7 9.0 3.6 2.1 13 6.5 Sr 11 2.1 2.3 1.5 0.82 0.85 0.98 Tl 0.01 <0.01 <0.01 <0.01 <0.01 <0.01 <0.01 V <10 <10 <10 <10 <10 <10 <10 Sn <0.1 <0.1 0.1 <0.1 <0.1 <0.1 <0.1 U <0.005 <0.005 <0.005 0.007 <0.005 <0.005 <0.005 Th <0.005 <0.005 <0.005 <0.005 <0.005 <0.005 <0.005 Mn <10 <10 <10 <10 <10 <10 <10
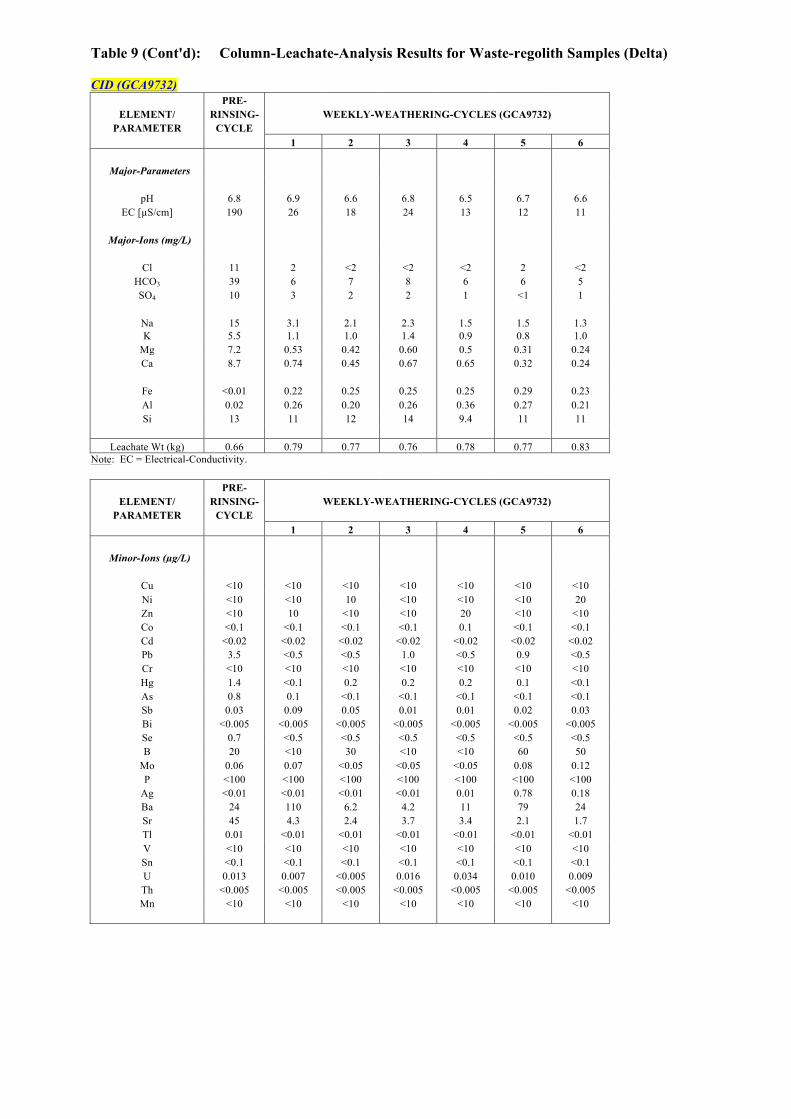
Table 9 (Cont'd): Column-Leachate-Analysis Results for Waste-regolith Samples (Delta) CID (GCA9732) PRE-
ELEMENT/ RINSING- WEEKLY-WEATHERING-CYCLES (GCA9732) PARAMETER CYCLE
1 2 3 4 5 6
Major-Parameters
pH 6.8 6.9 6.6 6.8 6.5 6.7 6.6 EC [µS/cm] 190 26 18 24 13 12 11
Major-Ions (mg/L)
Cl 11 2 <2 <2 <2 2 <2
HCO3 39 6 7 8 6 6 5 SO4 10 3 2 2 1 <1 1
Na 15 3.1 2.1 2.3 1.5 1.5 1.3 K 5.5 1.1 1.0 1.4 0.9 0.8 1.0
Mg 7.2 0.53 0.42 0.60 0.5 0.31 0.24 Ca 8.7 0.74 0.45 0.67 0.65 0.32 0.24
Fe <0.01 0.22 0.25 0.25 0.25 0.29 0.23 Al 0.02 0.26 0.20 0.26 0.36 0.27 0.21 Si 13 11 12 14 9.4 11 11
Leachate Wt (kg) 0.66 0.79 0.77 0.76 0.78 0.77 0.83 Note: EC = Electrical-Conductivity. PRE-
ELEMENT/ RINSING- WEEKLY-WEATHERING-CYCLES (GCA9732) PARAMETER CYCLE
1 2 3 4 5 6
Minor-Ions (µg/L)
Cu <10 <10 <10 <10 <10 <10 <10 Ni <10 <10 10 <10 <10 <10 20 Zn <10 10 <10 <10 20 <10 <10 Co <0.1 <0.1 <0.1 <0.1 0.1 <0.1 <0.1 Cd <0.02 <0.02 <0.02 <0.02 <0.02 <0.02 <0.02 Pb 3.5 <0.5 <0.5 1.0 <0.5 0.9 <0.5 Cr <10 <10 <10 <10 <10 <10 <10 Hg 1.4 <0.1 0.2 0.2 0.2 0.1 <0.1 As 0.8 0.1 <0.1 <0.1 <0.1 <0.1 <0.1 Sb 0.03 0.09 0.05 0.01 0.01 0.02 0.03 Bi <0.005 <0.005 <0.005 <0.005 <0.005 <0.005 <0.005 Se 0.7 <0.5 <0.5 <0.5 <0.5 <0.5 <0.5 B 20 <10 30 <10 <10 60 50
Mo 0.06 0.07 <0.05 <0.05 <0.05 0.08 0.12 P <100 <100 <100 <100 <100 <100 <100
Ag <0.01 <0.01 <0.01 <0.01 0.01 0.78 0.18 Ba 24 110 6.2 4.2 11 79 24 Sr 45 4.3 2.4 3.7 3.4 2.1 1.7 Tl 0.01 <0.01 <0.01 <0.01 <0.01 <0.01 <0.01 V <10 <10 <10 <10 <10 <10 <10 Sn <0.1 <0.1 <0.1 <0.1 <0.1 <0.1 <0.1 U 0.013 0.007 <0.005 0.016 0.034 0.010 0.009 Th <0.005 <0.005 <0.005 <0.005 <0.005 <0.005 <0.005 Mn <10 <10 <10 <10 <10 <10 <10
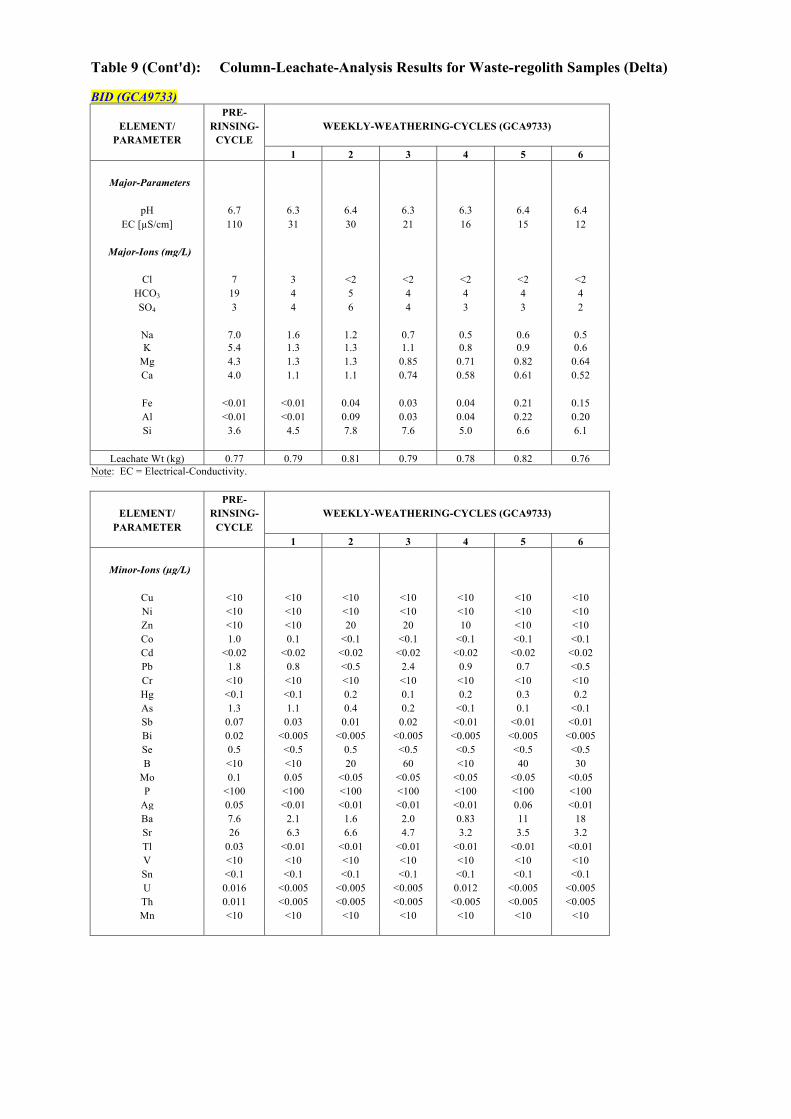
Table 9 (Cont'd): Column-Leachate-Analysis Results for Waste-regolith Samples (Delta) BID (GCA9733) PRE-
ELEMENT/ RINSING- WEEKLY-WEATHERING-CYCLES (GCA9733) PARAMETER CYCLE
1 2 3 4 5 6
Major-Parameters
pH 6.7 6.3 6.4 6.3 6.3 6.4 6.4 EC [µS/cm] 110 31 30 21 16 15 12
Major-Ions (mg/L)
Cl 7 3 <2 <2 <2 <2 <2
HCO3 19 4 5 4 4 4 4 SO4 3 4 6 4 3 3 2
Na 7.0 1.6 1.2 0.7 0.5 0.6 0.5 K 5.4 1.3 1.3 1.1 0.8 0.9 0.6
Mg 4.3 1.3 1.3 0.85 0.71 0.82 0.64 Ca 4.0 1.1 1.1 0.74 0.58 0.61 0.52
Fe <0.01 <0.01 0.04 0.03 0.04 0.21 0.15 Al <0.01 <0.01 0.09 0.03 0.04 0.22 0.20 Si 3.6 4.5 7.8 7.6 5.0 6.6 6.1
Leachate Wt (kg) 0.77 0.79 0.81 0.79 0.78 0.82 0.76 Note: EC = Electrical-Conductivity. PRE-
ELEMENT/ RINSING- WEEKLY-WEATHERING-CYCLES (GCA9733) PARAMETER CYCLE
1 2 3 4 5 6
Minor-Ions (µg/L)
Cu <10 <10 <10 <10 <10 <10 <10 Ni <10 <10 <10 <10 <10 <10 <10 Zn <10 <10 20 20 10 <10 <10 Co 1.0 0.1 <0.1 <0.1 <0.1 <0.1 <0.1 Cd <0.02 <0.02 <0.02 <0.02 <0.02 <0.02 <0.02 Pb 1.8 0.8 <0.5 2.4 0.9 0.7 <0.5 Cr <10 <10 <10 <10 <10 <10 <10 Hg <0.1 <0.1 0.2 0.1 0.2 0.3 0.2 As 1.3 1.1 0.4 0.2 <0.1 0.1 <0.1 Sb 0.07 0.03 0.01 0.02 <0.01 <0.01 <0.01 Bi 0.02 <0.005 <0.005 <0.005 <0.005 <0.005 <0.005 Se 0.5 <0.5 0.5 <0.5 <0.5 <0.5 <0.5 B <10 <10 20 60 <10 40 30
Mo 0.1 0.05 <0.05 <0.05 <0.05 <0.05 <0.05 P <100 <100 <100 <100 <100 <100 <100
Ag 0.05 <0.01 <0.01 <0.01 <0.01 0.06 <0.01 Ba 7.6 2.1 1.6 2.0 0.83 11 18 Sr 26 6.3 6.6 4.7 3.2 3.5 3.2 Tl 0.03 <0.01 <0.01 <0.01 <0.01 <0.01 <0.01 V <10 <10 <10 <10 <10 <10 <10 Sn <0.1 <0.1 <0.1 <0.1 <0.1 <0.1 <0.1 U 0.016 <0.005 <0.005 <0.005 0.012 <0.005 <0.005 Th 0.011 <0.005 <0.005 <0.005 <0.005 <0.005 <0.005 Mn <10 <10 <10 <10 <10 <10 <10
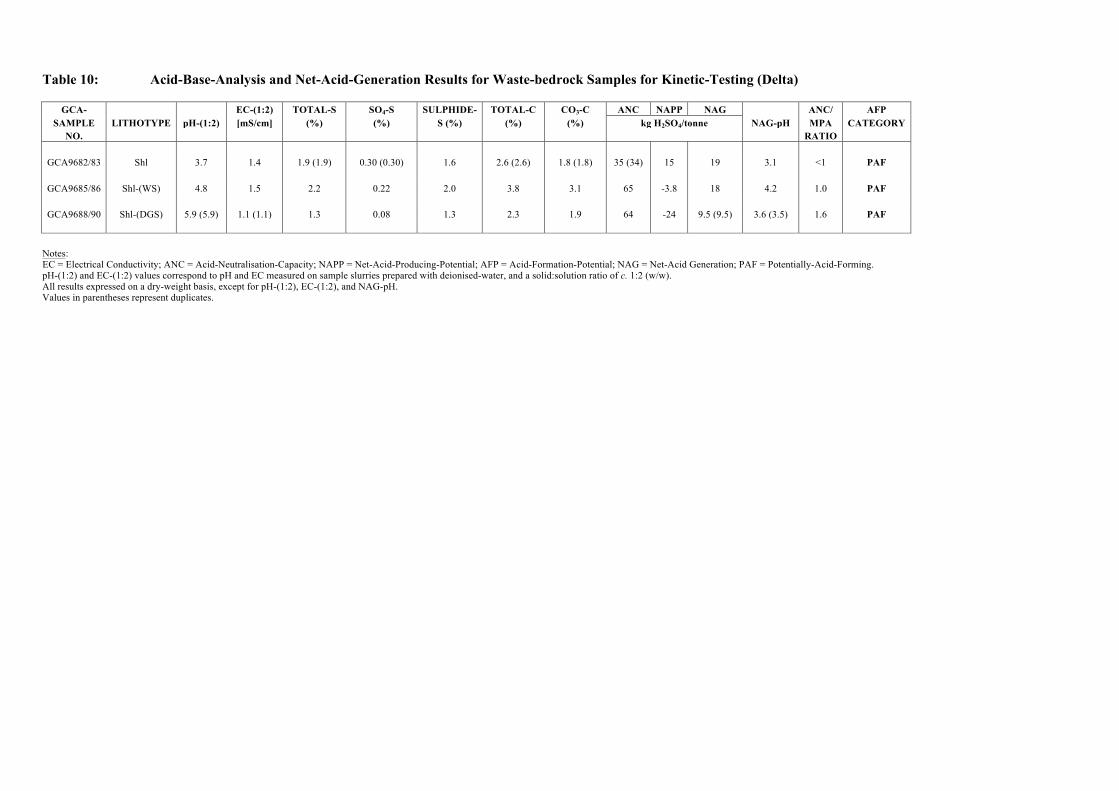
Table 10: Acid-Base-Analysis and Net-Acid-Generation Results for Waste-bedrock Samples for Kinetic-Testing (Delta)
GCA- EC-(1:2) TOTAL-S SO4-S SULPHIDE- TOTAL-C CO3-C ANC NAPP NAG ANC/ AFP SAMPLE LITHOTYPE pH-(1:2) [mS/cm] (%) (%) S (%) (%) (%) kg H2SO4/tonne NAG-pH MPA CATEGORY
NO. RATIO
GCA9682/83 Shl 3.7 1.4 1.9 (1.9) 0.30 (0.30) 1.6 2.6 (2.6) 1.8 (1.8) 35 (34) 15 19 3.1 <1 PAF
GCA9685/86 Shl-(WS) 4.8 1.5 2.2 0.22 2.0 3.8 3.1 65 -3.8 18 4.2 1.0 PAF
GCA9688/90 Shl-(DGS) 5.9 (5.9) 1.1 (1.1) 1.3 0.08 1.3 2.3 1.9 64 -24 9.5 (9.5) 3.6 (3.5) 1.6 PAF
Notes: EC = Electrical Conductivity; ANC = Acid-Neutralisation-Capacity; NAPP = Net-Acid-Producing-Potential; AFP = Acid-Formation-Potential; NAG = Net-Acid Generation; PAF = Potentially-Acid-Forming. pH-(1:2) and EC-(1:2) values correspond to pH and EC measured on sample slurries prepared with deionised-water, and a solid:solution ratio of c. 1:2 (w/w). All results expressed on a dry-weight basis, except for pH-(1:2), EC-(1:2), and NAG-pH. Values in parentheses represent duplicates.
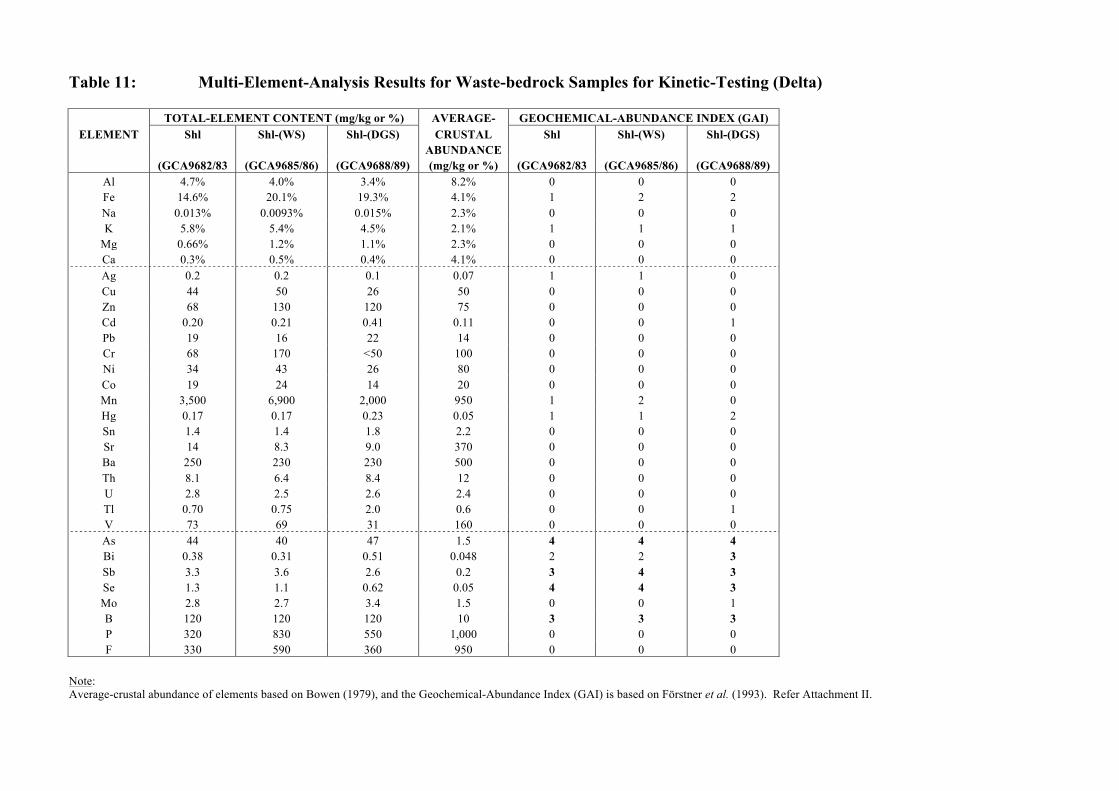
Table 11: Multi-Element-Analysis Results for Waste-bedrock Samples for Kinetic-Testing (Delta) TOTAL-ELEMENT CONTENT (mg/kg or %) AVERAGE- GEOCHEMICAL-ABUNDANCE INDEX (GAI) ELEMENT Shl Shl-(WS) Shl-(DGS) CRUSTAL Shl Shl-(WS) Shl-(DGS)
ABUNDANCE (GCA9682/83 (GCA9685/86) (GCA9688/89) (mg/kg or %) (GCA9682/83 (GCA9685/86) (GCA9688/89)
Al 4.7% 4.0% 3.4% 8.2% 0 0 0 Fe 14.6% 20.1% 19.3% 4.1% 1 2 2 Na 0.013% 0.0093% 0.015% 2.3% 0 0 0 K 5.8% 5.4% 4.5% 2.1% 1 1 1
Mg 0.66% 1.2% 1.1% 2.3% 0 0 0 Ca 0.3% 0.5% 0.4% 4.1% 0 0 0 Ag 0.2 0.2 0.1 0.07 1 1 0 Cu 44 50 26 50 0 0 0 Zn 68 130 120 75 0 0 0 Cd 0.20 0.21 0.41 0.11 0 0 1 Pb 19 16 22 14 0 0 0 Cr 68 170 <50 100 0 0 0 Ni 34 43 26 80 0 0 0 Co 19 24 14 20 0 0 0 Mn 3,500 6,900 2,000 950 1 2 0 Hg 0.17 0.17 0.23 0.05 1 1 2 Sn 1.4 1.4 1.8 2.2 0 0 0 Sr 14 8.3 9.0 370 0 0 0 Ba 250 230 230 500 0 0 0 Th 8.1 6.4 8.4 12 0 0 0 U 2.8 2.5 2.6 2.4 0 0 0 Tl 0.70 0.75 2.0 0.6 0 0 1 V 73 69 31 160 0 0 0 As 44 40 47 1.5 4 4 4 Bi 0.38 0.31 0.51 0.048 2 2 3 Sb 3.3 3.6 2.6 0.2 3 4 3 Se 1.3 1.1 0.62 0.05 4 4 3 Mo 2.8 2.7 3.4 1.5 0 0 1 B 120 120 120 10 3 3 3 P 320 830 550 1,000 0 0 0 F 330 590 360 950 0 0 0
Note: Average-crustal abundance of elements based on Bowen (1979), and the Geochemical-Abundance Index (GAI) is based on Förstner et al. (1993). Refer Attachment II.
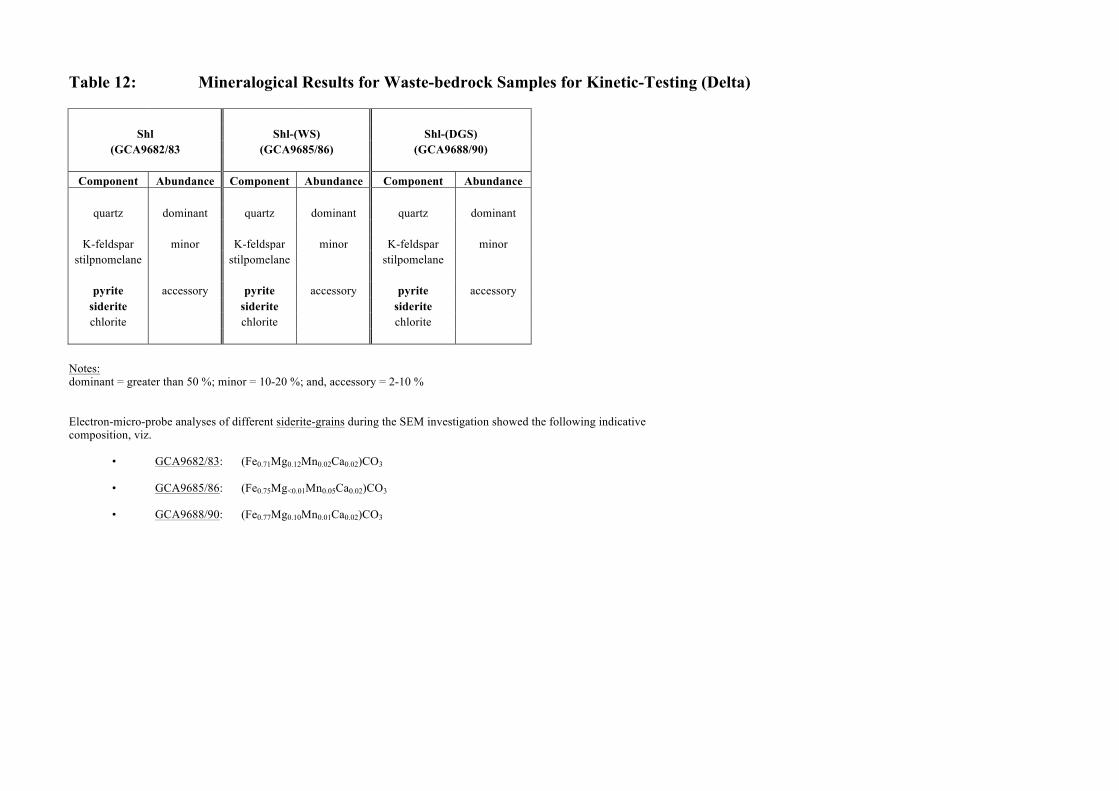
Table 12: Mineralogical Results for Waste-bedrock Samples for Kinetic-Testing (Delta)
Shl Shl-(WS) Shl-(DGS) (GCA9682/83 (GCA9685/86) (GCA9688/90)
Component Abundance Component Abundance Component Abundance
quartz dominant quartz dominant quartz dominant
K-feldspar minor K-feldspar minor K-feldspar minor
stilpnomelane stilpomelane stilpomelane
pyrite accessory pyrite accessory pyrite accessory siderite siderite siderite chlorite chlorite chlorite
Notes: dominant = greater than 50 %; minor = 10-20 %; and, accessory = 2-10 % Electron-micro-probe analyses of different siderite-grains during the SEM investigation showed the following indicative composition, viz. • GCA9682/83: (Fe0.71Mg0.12Mn0.02Ca0.02)CO3 • GCA9685/86: (Fe0.75Mg<0.01Mn0.05Ca0.02)CO3 • GCA9688/90: (Fe0.77Mg0.10Mn0.01Ca0.02)CO3
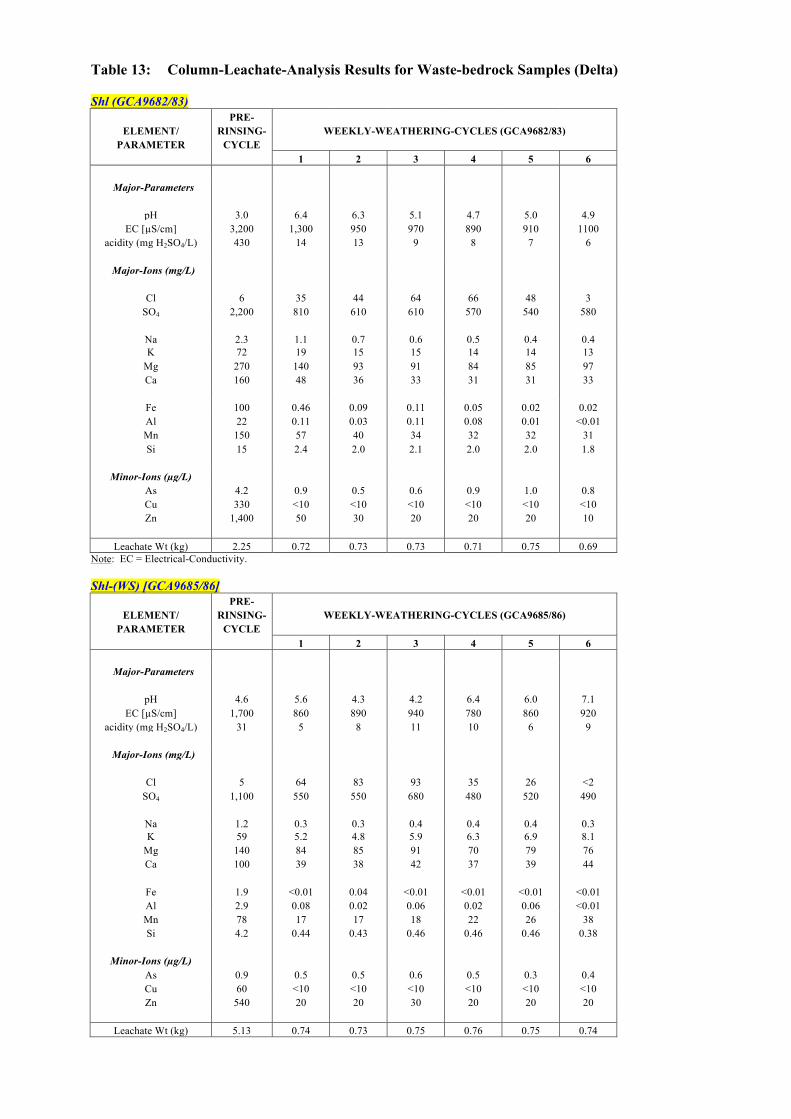
Table 13: Column-Leachate-Analysis Results for Waste-bedrock Samples (Delta) Shl (GCA9682/83) PRE-
ELEMENT/ RINSING- WEEKLY-WEATHERING-CYCLES (GCA9682/83) PARAMETER CYCLE
1 2 3 4 5 6
Major-Parameters
pH 3.0 6.4 6.3 5.1 4.7 5.0 4.9 EC [µS/cm] 3,200 1,300 950 970 890 910 1100
acidity (mg H2SO4/L) 430 14 13 9 8 7 6
Major-Ions (mg/L)
Cl 6 35 44 64 66 48 3 SO4 2,200 810 610 610 570 540 580
Na 2.3 1.1 0.7 0.6 0.5 0.4 0.4 K 72 19 15 15 14 14 13
Mg 270 140 93 91 84 85 97 Ca 160 48 36 33 31 31 33
Fe 100 0.46 0.09 0.11 0.05 0.02 0.02 Al 22 0.11 0.03 0.11 0.08 0.01 <0.01 Mn 150 57 40 34 32 32 31 Si 15 2.4 2.0 2.1 2.0 2.0 1.8
Minor-Ions (µg/L) As 4.2 0.9 0.5 0.6 0.9 1.0 0.8 Cu 330 <10 <10 <10 <10 <10 <10 Zn 1,400 50 30 20 20 20 10
Leachate Wt (kg) 2.25 0.72 0.73 0.73 0.71 0.75 0.69 Note: EC = Electrical-Conductivity. Shl-(WS) [GCA9685/86] PRE-
ELEMENT/ RINSING- WEEKLY-WEATHERING-CYCLES (GCA9685/86) PARAMETER CYCLE
1 2 3 4 5 6
Major-Parameters
pH 4.6 5.6 4.3 4.2 6.4 6.0 7.1 EC [µS/cm] 1,700 860 890 940 780 860 920
acidity (mg H2SO4/L) 31 5 8 11 10 6 9
Major-Ions (mg/L)
Cl 5 64 83 93 35 26 <2 SO4 1,100 550 550 680 480 520 490
Na 1.2 0.3 0.3 0.4 0.4 0.4 0.3 K 59 5.2 4.8 5.9 6.3 6.9 8.1
Mg 140 84 85 91 70 79 76 Ca 100 39 38 42 37 39 44
Fe 1.9 <0.01 0.04 <0.01 <0.01 <0.01 <0.01 Al 2.9 0.08 0.02 0.06 0.02 0.06 <0.01 Mn 78 17 17 18 22 26 38 Si 4.2 0.44 0.43 0.46 0.46 0.46 0.38
Minor-Ions (µg/L) As 0.9 0.5 0.5 0.6 0.5 0.3 0.4 Cu 60 <10 <10 <10 <10 <10 <10 Zn 540 20 20 30 20 20 20
Leachate Wt (kg) 5.13 0.74 0.73 0.75 0.76 0.75 0.74
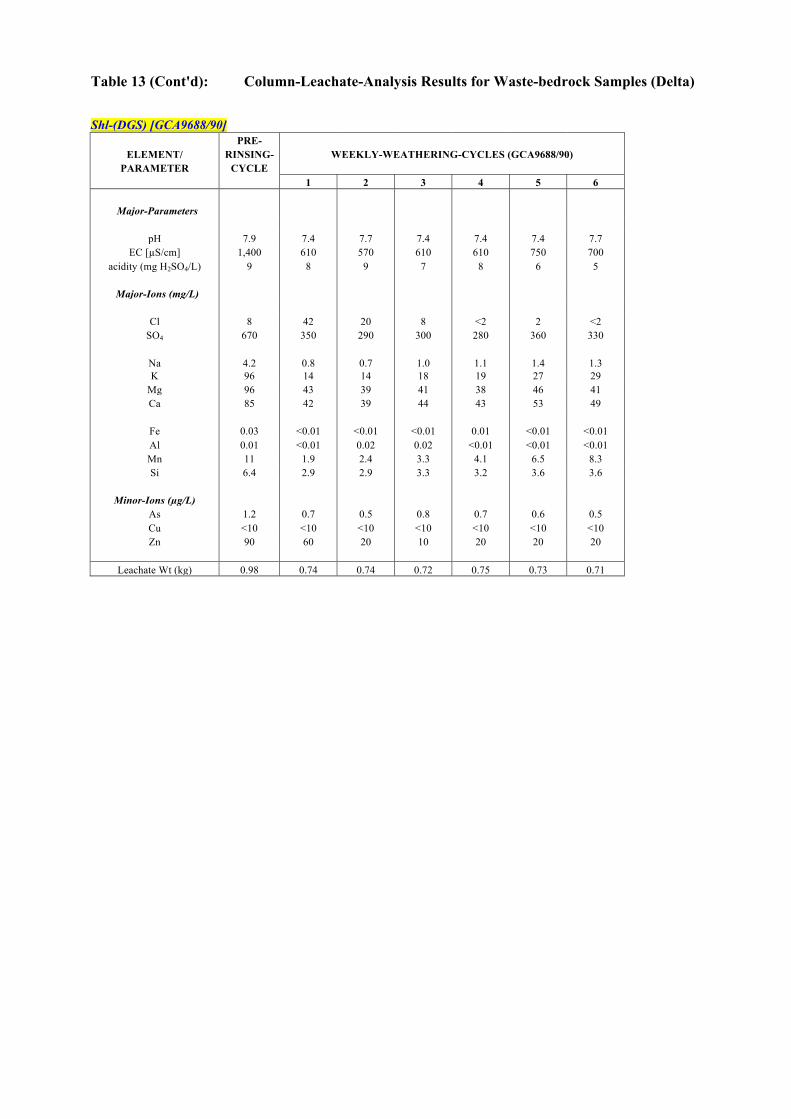
Table 13 (Cont'd): Column-Leachate-Analysis Results for Waste-bedrock Samples (Delta) Shl-(DGS) [GCA9688/90] PRE-
ELEMENT/ RINSING- WEEKLY-WEATHERING-CYCLES (GCA9688/90) PARAMETER CYCLE
1 2 3 4 5 6
Major-Parameters
pH 7.9 7.4 7.7 7.4 7.4 7.4 7.7 EC [µS/cm] 1,400 610 570 610 610 750 700
acidity (mg H2SO4/L) 9 8 9 7 8 6 5
Major-Ions (mg/L)
Cl 8 42 20 8 <2 2 <2 SO4 670 350 290 300 280 360 330
Na 4.2 0.8 0.7 1.0 1.1 1.4 1.3 K 96 14 14 18 19 27 29
Mg 96 43 39 41 38 46 41 Ca 85 42 39 44 43 53 49
Fe 0.03 <0.01 <0.01 <0.01 0.01 <0.01 <0.01 Al 0.01 <0.01 0.02 0.02 <0.01 <0.01 <0.01 Mn 11 1.9 2.4 3.3 4.1 6.5 8.3 Si 6.4 2.9 2.9 3.3 3.2 3.6 3.6
Minor-Ions (µg/L) As 1.2 0.7 0.5 0.8 0.7 0.6 0.5 Cu <10 <10 <10 <10 <10 <10 <10 Zn 90 60 20 10 20 20 20
Leachate Wt (kg) 0.98 0.74 0.74 0.72 0.75 0.73 0.71
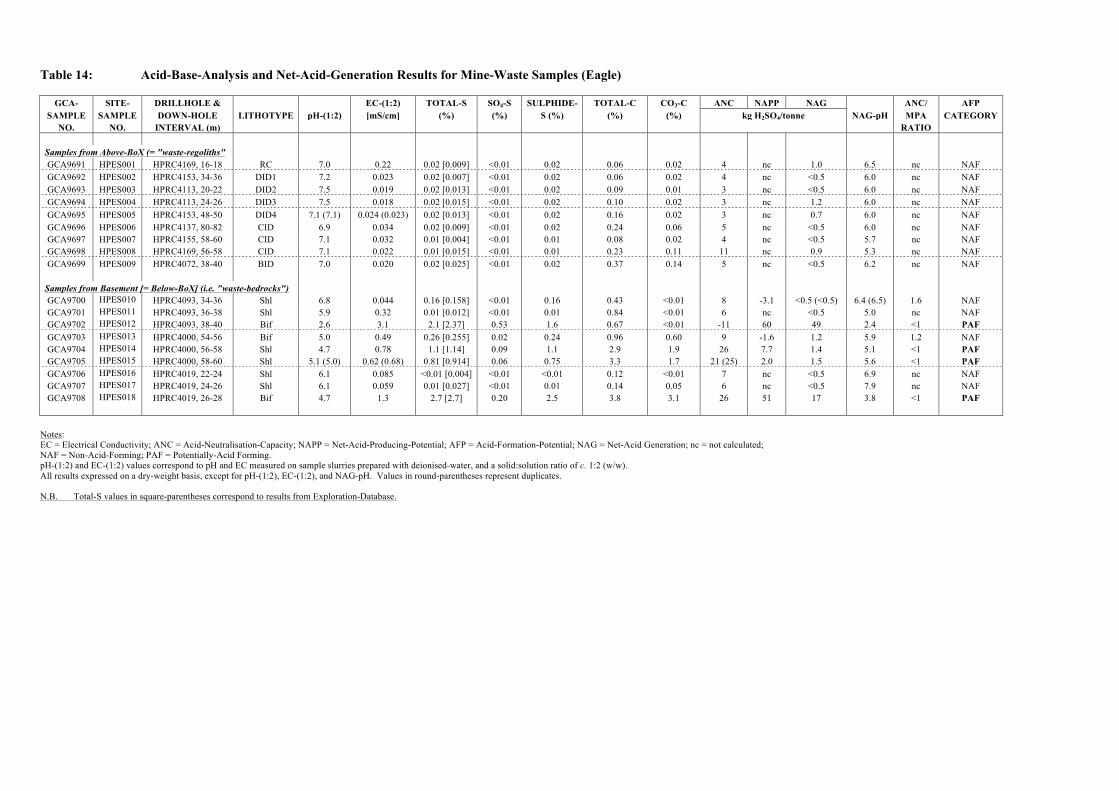
Table 14: Acid-Base-Analysis and Net-Acid-Generation Results for Mine-Waste Samples (Eagle)
GCA- SITE- DRILLHOLE & EC-(1:2) TOTAL-S SO4-S SULPHIDE- TOTAL-C CO3-C ANC NAPP NAG ANC/ AFP SAMPLE SAMPLE DOWN-HOLE LITHOTYPE pH-(1:2) [mS/cm] (%) (%) S (%) (%) (%) kg H2SO4/tonne NAG-pH MPA CATEGORY
NO. NO. INTERVAL (m) RATIO
Samples from Above-BoX (= "waste-regoliths" GCA9691 HPES001 HPRC4169, 16-18 RC 7.0 0.22 0.02 [0.009] <0.01 0.02 0.06 0.02 4 nc 1.0 6.5 nc NAF GCA9692 HPES002 HPRC4153, 34-36 DID1 7.2 0.023 0.02 [0.007] <0.01 0.02 0.06 0.02 4 nc <0.5 6.0 nc NAF GCA9693 HPES003 HPRC4113, 20-22 DID2 7.5 0.019 0.02 [0.013] <0.01 0.02 0.09 0.01 3 nc <0.5 6.0 nc NAF GCA9694 HPES004 HPRC4113, 24-26 DID3 7.5 0.018 0.02 [0.015] <0.01 0.02 0.10 0.02 3 nc 1.2 6.0 nc NAF GCA9695 HPES005 HPRC4153, 48-50 DID4 7.1 (7.1) 0.024 (0.023) 0.02 [0.013] <0.01 0.02 0.16 0.02 3 nc 0.7 6.0 nc NAF GCA9696 HPES006 HPRC4137, 80-82 CID 6.9 0.034 0.02 [0.009] <0.01 0.02 0.24 0.06 5 nc <0.5 6.0 nc NAF GCA9697 HPES007 HPRC4155, 58-60 CID 7.1 0.032 0.01 [0.004] <0.01 0.01 0.08 0.02 4 nc <0.5 5.7 nc NAF GCA9698 HPES008 HPRC4169, 56-58 CID 7.1 0.022 0.01 [0.015] <0.01 0.01 0.23 0.11 11 nc 0.9 5.3 nc NAF GCA9699 HPES009 HPRC4072, 38-40 BID 7.0 0.020 0.02 [0.025] <0.01 0.02 0.37 0.14 5 nc <0.5 6.2 nc NAF
Samples from Basement [= Below-BoX] (i.e. "waste-bedrocks") GCA9700 HPES010 HPRC4093, 34-36 Shl 6.8 0.044 0.16 [0.158] <0.01 0.16 0.43 <0.01 8 -3.1 <0.5 (<0.5) 6.4 (6.5) 1.6 NAF GCA9701 HPES011 HPRC4093, 36-38 Shl 5.9 0.32 0.01 [0.012] <0.01 0.01 0.84 <0.01 6 nc <0.5 5.0 nc NAF GCA9702 HPES012 HPRC4093, 38-40 Bif 2.6 3.1 2.1 [2.37] 0.53 1.6 0.67 <0.01 -11 60 49 2.4 <1 PAF GCA9703 HPES013 HPRC4000, 54-56 Bif 5.0 0.49 0.26 [0.255] 0.02 0.24 0.96 0.60 9 -1.6 1.2 5.9 1.2 NAF GCA9704 HPES014 HPRC4000, 56-58 Shl 4.7 0.78 1.1 [1.14] 0.09 1.1 2.9 1.9 26 7.7 1.4 5.1 <1 PAF GCA9705 HPES015 HPRC4000, 58-60 Shl 5.1 (5.0) 0.62 (0.68) 0.81 [0.914] 0.06 0.75 3.3 1.7 21 (25) 2.0 1.5 5.6 <1 PAF GCA9706 HPES016 HPRC4019, 22-24 Shl 6.1 0.085 <0.01 [0.004] <0.01 <0.01 0.12 <0.01 7 nc <0.5 6.9 nc NAF GCA9707 HPES017 HPRC4019, 24-26 Shl 6.1 0.059 0.01 [0.027] <0.01 0.01 0.14 0.05 6 nc <0.5 7.9 nc NAF GCA9708 HPES018 HPRC4019, 26-28 Bif 4.7 1.3 2.7 [2.7] 0.20 2.5 3.8 3.1 26 51 17 3.8 <1 PAF
Notes: EC = Electrical Conductivity; ANC = Acid-Neutralisation-Capacity; NAPP = Net-Acid-Producing-Potential; AFP = Acid-Formation-Potential; NAG = Net-Acid Generation; nc = not calculated; NAF = Non-Acid-Forming; PAF = Potentially-Acid Forming. pH-(1:2) and EC-(1:2) values correspond to pH and EC measured on sample slurries prepared with deionised-water, and a solid:solution ratio of c. 1:2 (w/w). All results expressed on a dry-weight basis, except for pH-(1:2), EC-(1:2), and NAG-pH. Values in round-parentheses represent duplicates. N.B. Total-S values in square-parentheses correspond to results from Exploration-Database.
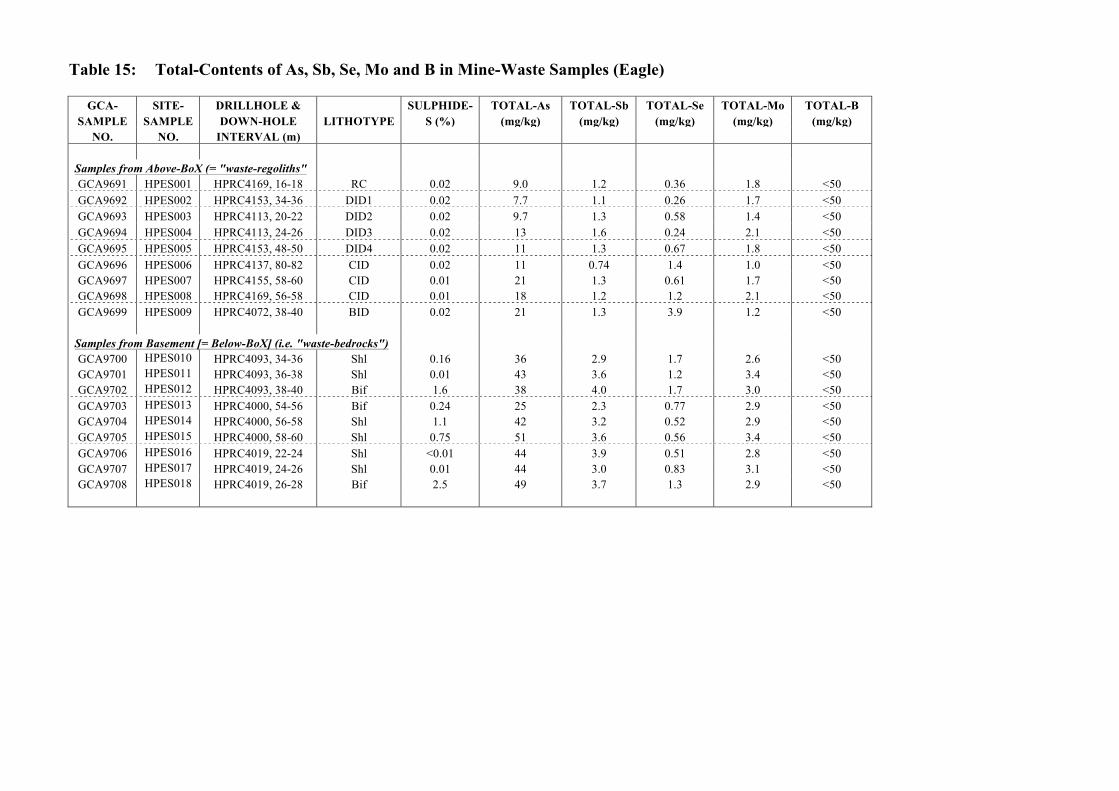
Table 15: Total-Contents of As, Sb, Se, Mo and B in Mine-Waste Samples (Eagle)
GCA- SITE- DRILLHOLE & SULPHIDE- TOTAL-As TOTAL-Sb TOTAL-Se TOTAL-Mo TOTAL-B SAMPLE SAMPLE DOWN-HOLE LITHOTYPE S (%) (mg/kg) (mg/kg) (mg/kg) (mg/kg) (mg/kg)
NO. NO. INTERVAL (m)
Samples from Above-BoX (= "waste-regoliths" GCA9691 HPES001 HPRC4169, 16-18 RC 0.02 9.0 1.2 0.36 1.8 <50 GCA9692 HPES002 HPRC4153, 34-36 DID1 0.02 7.7 1.1 0.26 1.7 <50 GCA9693 HPES003 HPRC4113, 20-22 DID2 0.02 9.7 1.3 0.58 1.4 <50 GCA9694 HPES004 HPRC4113, 24-26 DID3 0.02 13 1.6 0.24 2.1 <50 GCA9695 HPES005 HPRC4153, 48-50 DID4 0.02 11 1.3 0.67 1.8 <50 GCA9696 HPES006 HPRC4137, 80-82 CID 0.02 11 0.74 1.4 1.0 <50 GCA9697 HPES007 HPRC4155, 58-60 CID 0.01 21 1.3 0.61 1.7 <50 GCA9698 HPES008 HPRC4169, 56-58 CID 0.01 18 1.2 1.2 2.1 <50 GCA9699 HPES009 HPRC4072, 38-40 BID 0.02 21 1.3 3.9 1.2 <50
Samples from Basement [= Below-BoX] (i.e. "waste-bedrocks") GCA9700 HPES010 HPRC4093, 34-36 Shl 0.16 36 2.9 1.7 2.6 <50 GCA9701 HPES011 HPRC4093, 36-38 Shl 0.01 43 3.6 1.2 3.4 <50 GCA9702 HPES012 HPRC4093, 38-40 Bif 1.6 38 4.0 1.7 3.0 <50 GCA9703 HPES013 HPRC4000, 54-56 Bif 0.24 25 2.3 0.77 2.9 <50 GCA9704 HPES014 HPRC4000, 56-58 Shl 1.1 42 3.2 0.52 2.9 <50 GCA9705 HPES015 HPRC4000, 58-60 Shl 0.75 51 3.6 0.56 3.4 <50 GCA9706 HPES016 HPRC4019, 22-24 Shl <0.01 44 3.9 0.51 2.8 <50 GCA9707 HPES017 HPRC4019, 24-26 Shl 0.01 44 3.0 0.83 3.1 <50 GCA9708 HPES018 HPRC4019, 26-28 Bif 2.5 49 3.7 1.3 2.9 <50
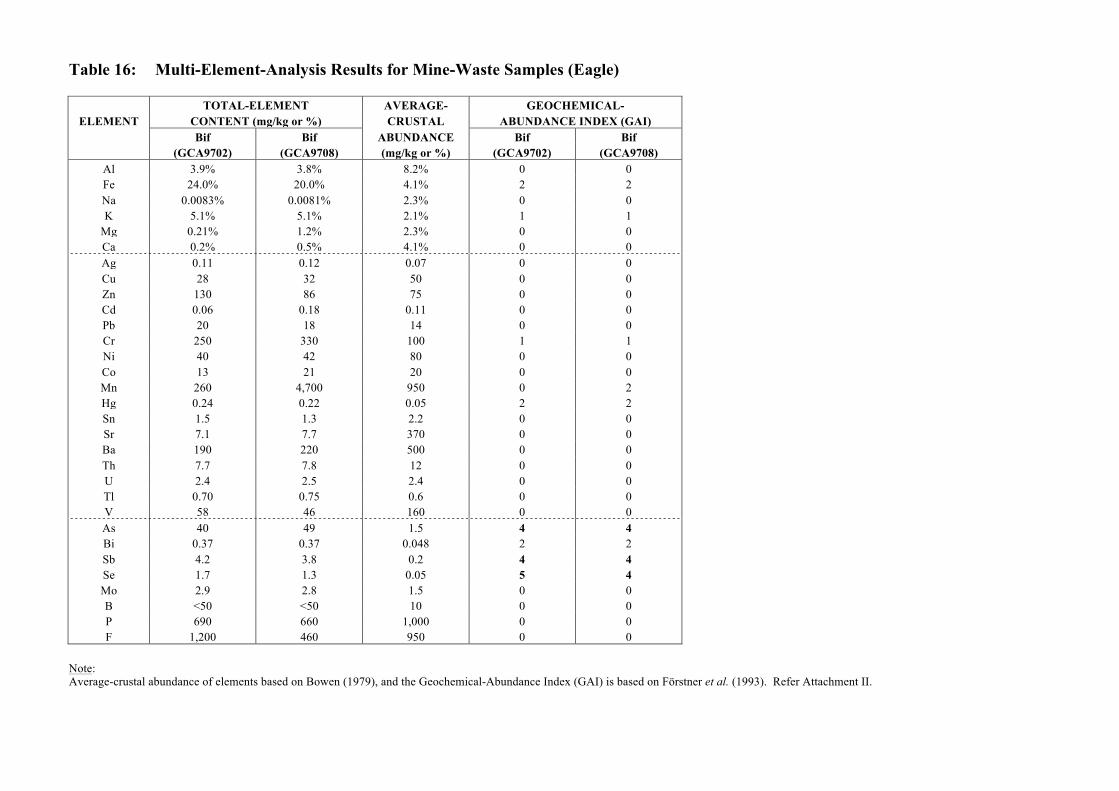
Table 16: Multi-Element-Analysis Results for Mine-Waste Samples (Eagle) TOTAL-ELEMENT AVERAGE- GEOCHEMICAL- ELEMENT CONTENT (mg/kg or %) CRUSTAL ABUNDANCE INDEX (GAI)
Bif Bif ABUNDANCE Bif Bif (GCA9702) (GCA9708) (mg/kg or %) (GCA9702) (GCA9708)
Al 3.9% 3.8% 8.2% 0 0 Fe 24.0% 20.0% 4.1% 2 2 Na 0.0083% 0.0081% 2.3% 0 0 K 5.1% 5.1% 2.1% 1 1
Mg 0.21% 1.2% 2.3% 0 0 Ca 0.2% 0.5% 4.1% 0 0 Ag 0.11 0.12 0.07 0 0 Cu 28 32 50 0 0 Zn 130 86 75 0 0 Cd 0.06 0.18 0.11 0 0 Pb 20 18 14 0 0 Cr 250 330 100 1 1 Ni 40 42 80 0 0 Co 13 21 20 0 0 Mn 260 4,700 950 0 2 Hg 0.24 0.22 0.05 2 2 Sn 1.5 1.3 2.2 0 0 Sr 7.1 7.7 370 0 0 Ba 190 220 500 0 0 Th 7.7 7.8 12 0 0 U 2.4 2.5 2.4 0 0 Tl 0.70 0.75 0.6 0 0 V 58 46 160 0 0 As 40 49 1.5 4 4 Bi 0.37 0.37 0.048 2 2 Sb 4.2 3.8 0.2 4 4 Se 1.7 1.3 0.05 5 4 Mo 2.9 2.8 1.5 0 0 B <50 <50 10 0 0 P 690 660 1,000 0 0 F 1,200 460 950 0 0
Note: Average-crustal abundance of elements based on Bowen (1979), and the Geochemical-Abundance Index (GAI) is based on Förstner et al. (1993). Refer Attachment II.
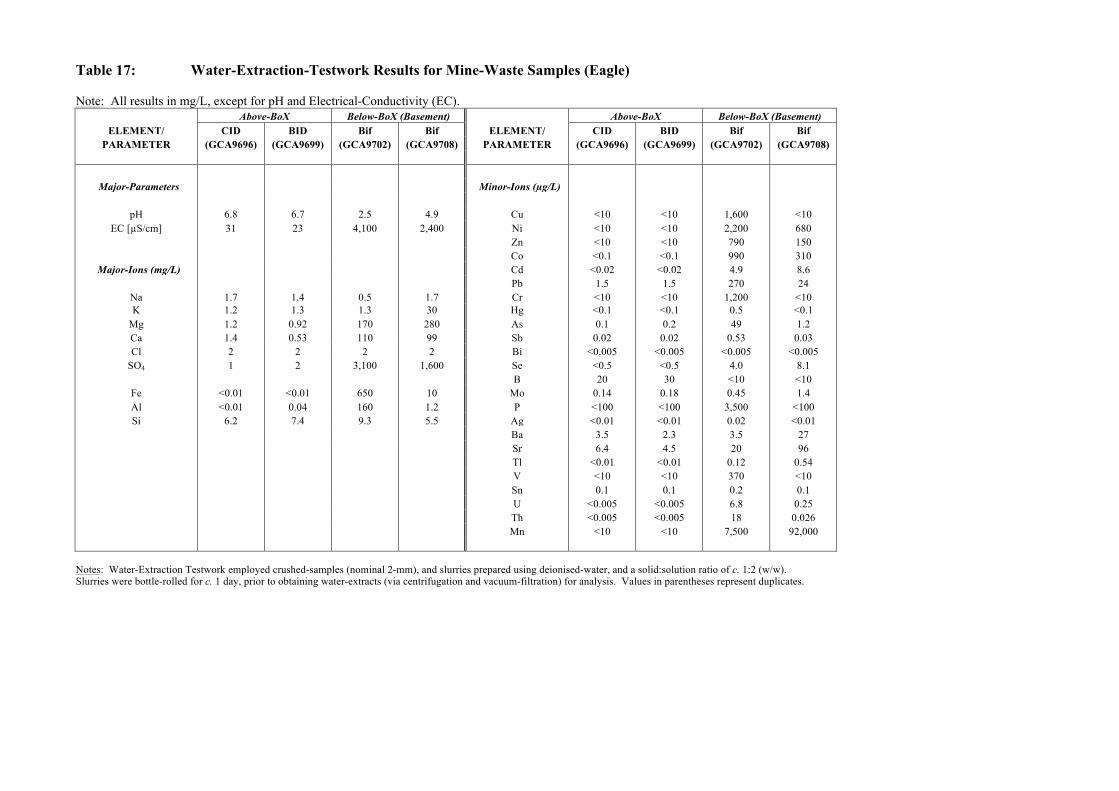
Table 17: Water-Extraction-Testwork Results for Mine-Waste Samples (Eagle) Note: All results in mg/L, except for pH and Electrical-Conductivity (EC). Above-BoX Below-BoX (Basement) Above-BoX Below-BoX (Basement)
ELEMENT/ CID BID Bif Bif ELEMENT/ CID BID Bif Bif PARAMETER (GCA9696) (GCA9699) (GCA9702) (GCA9708) PARAMETER (GCA9696) (GCA9699) (GCA9702) (GCA9708)
Major-Parameters Minor-Ions (µg/L)
pH 6.8 6.7 2.5 4.9 Cu <10 <10 1,600 <10 EC [µS/cm] 31 23 4,100 2,400 Ni <10 <10 2,200 680
Zn <10 <10 790 150 Co <0.1 <0.1 990 310
Major-Ions (mg/L) Cd <0.02 <0.02 4.9 8.6 Pb 1.5 1.5 270 24
Na 1.7 1.4 0.5 1.7 Cr <10 <10 1,200 <10 K 1.2 1.3 1.3 30 Hg <0.1 <0.1 0.5 <0.1
Mg 1.2 0.92 170 280 As 0.1 0.2 49 1.2 Ca 1.4 0.53 110 99 Sb 0.02 0.02 0.53 0.03 Cl 2 2 2 2 Bi <0.005 <0.005 <0.005 <0.005
SO4 1 2 3,100 1,600 Se <0.5 <0.5 4.0 8.1 B 20 30 <10 <10
Fe <0.01 <0.01 650 10 Mo 0.14 0.18 0.45 1.4 Al <0.01 0.04 160 1.2 P <100 <100 3,500 <100 Si 6.2 7.4 9.3 5.5 Ag <0.01 <0.01 0.02 <0.01 Ba 3.5 2.3 3.5 27 Sr 6.4 4.5 20 96 Tl <0.01 <0.01 0.12 0.54 V <10 <10 370 <10 Sn 0.1 0.1 0.2 0.1 U <0.005 <0.005 6.8 0.25 Th <0.005 <0.005 18 0.026 Mn <10 <10 7,500 92,000
Notes: Water-Extraction Testwork employed crushed-samples (nominal 2-mm), and slurries prepared using deionised-water, and a solid:solution ratio of c. 1:2 (w/w). Slurries were bottle-rolled for c. 1 day, prior to obtaining water-extracts (via centrifugation and vacuum-filtration) for analysis. Values in parentheses represent duplicates.
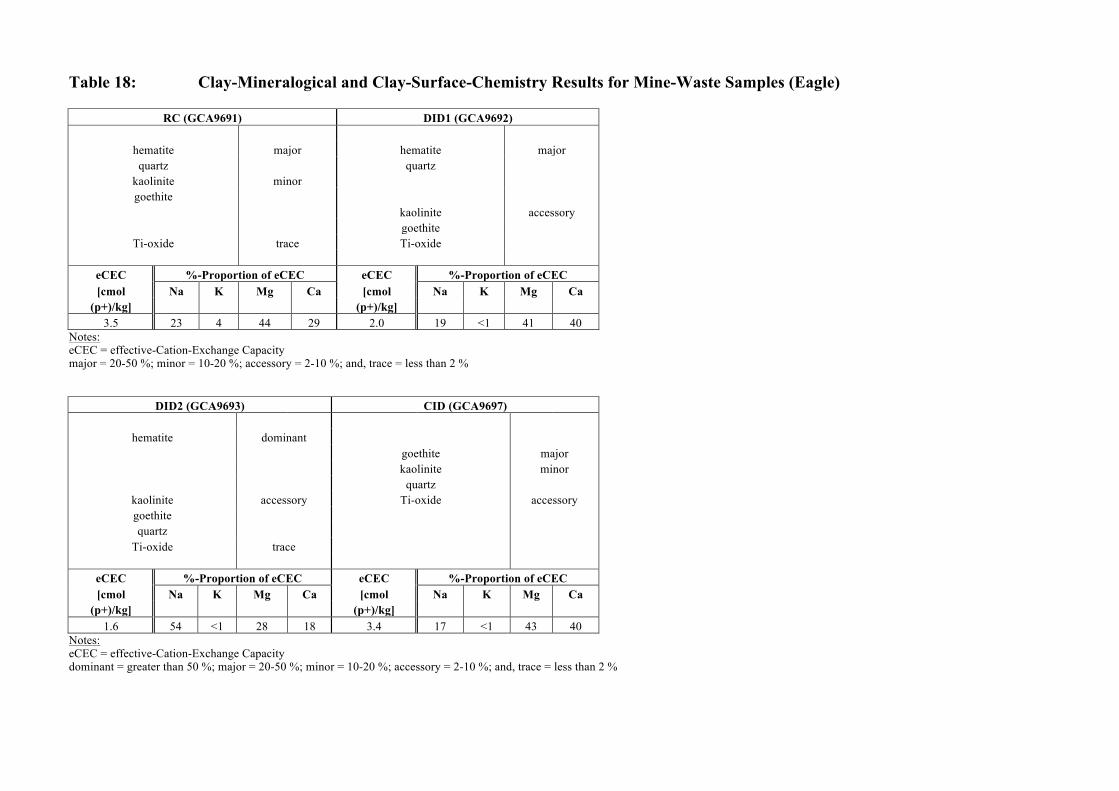
Table 18: Clay-Mineralogical and Clay-Surface-Chemistry Results for Mine-Waste Samples (Eagle)
RC (GCA9691) DID1 (GCA9692)
hematite major hematite major quartz quartz
kaolinite minor
goethite
kaolinite accessory goethite
Ti-oxide trace Ti-oxide
eCEC %-Proportion of eCEC eCEC %-Proportion of eCEC [cmol Na K Mg Ca [cmol Na K Mg Ca
(p+)/kg] (p+)/kg] 3.5 23 4 44 29 2.0 19 <1 41 40
Notes: eCEC = effective-Cation-Exchange Capacity major = 20-50 %; minor = 10-20 %; accessory = 2-10 %; and, trace = less than 2 %
DID2 (GCA9693) CID (GCA9697)
hematite dominant goethite major kaolinite minor
quartz kaolinite accessory Ti-oxide accessory goethite
quartz
Ti-oxide trace
eCEC %-Proportion of eCEC eCEC %-Proportion of eCEC [cmol Na K Mg Ca [cmol Na K Mg Ca
(p+)/kg] (p+)/kg] 1.6 54 <1 28 18 3.4 17 <1 43 40
Notes: eCEC = effective-Cation-Exchange Capacity dominant = greater than 50 %; major = 20-50 %; minor = 10-20 %; accessory = 2-10 %; and, trace = less than 2 %
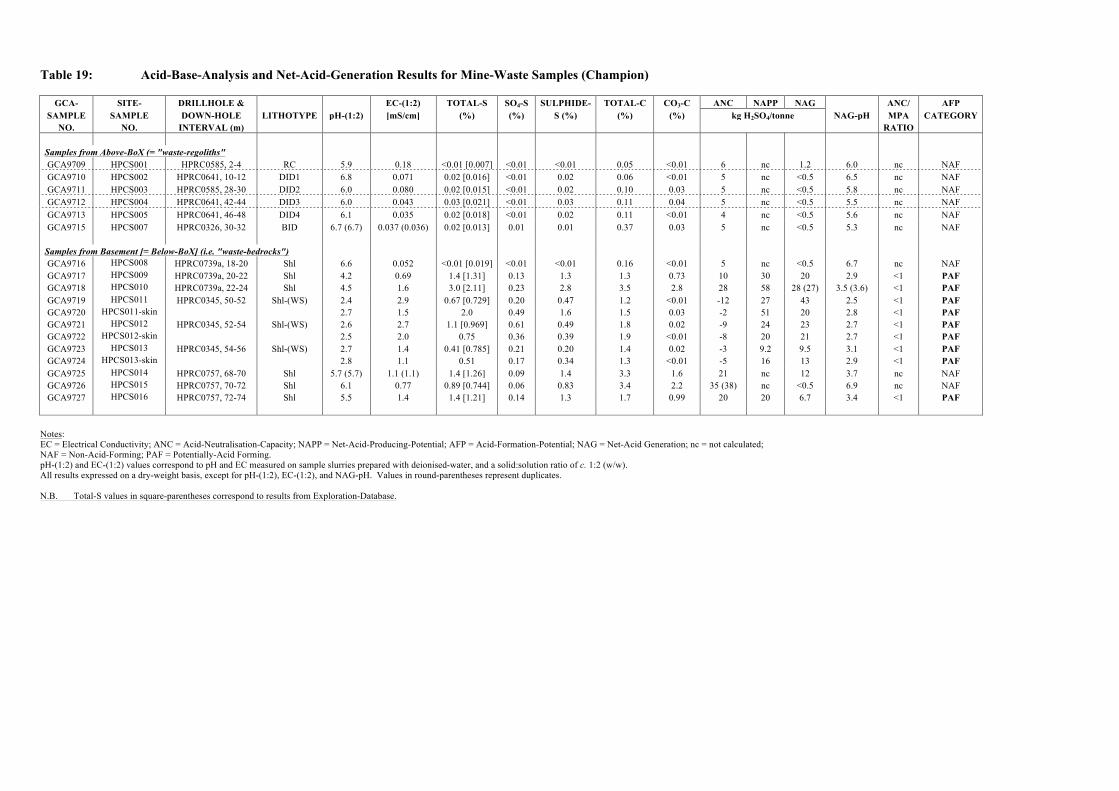
Table 19: Acid-Base-Analysis and Net-Acid-Generation Results for Mine-Waste Samples (Champion)
GCA- SITE- DRILLHOLE & EC-(1:2) TOTAL-S SO4-S SULPHIDE- TOTAL-C CO3-C ANC NAPP NAG ANC/ AFP SAMPLE SAMPLE DOWN-HOLE LITHOTYPE pH-(1:2) [mS/cm] (%) (%) S (%) (%) (%) kg H2SO4/tonne NAG-pH MPA CATEGORY
NO. NO. INTERVAL (m) RATIO
Samples from Above-BoX (= "waste-regoliths" GCA9709 HPCS001 HPRC0585, 2-4 RC 5.9 0.18 <0.01 [0.007] <0.01 <0.01 0.05 <0.01 6 nc 1.2 6.0 nc NAF GCA9710 HPCS002 HPRC0641, 10-12 DID1 6.8 0.071 0.02 [0.016] <0.01 0.02 0.06 <0.01 5 nc <0.5 6.5 nc NAF GCA9711 HPCS003 HPRC0585, 28-30 DID2 6.0 0.080 0.02 [0.015] <0.01 0.02 0.10 0.03 5 nc <0.5 5.8 nc NAF GCA9712 HPCS004 HPRC0641, 42-44 DID3 6.0 0.043 0.03 [0.021] <0.01 0.03 0.11 0.04 5 nc <0.5 5.5 nc NAF GCA9713 HPCS005 HPRC0641, 46-48 DID4 6.1 0.035 0.02 [0.018] <0.01 0.02 0.11 <0.01 4 nc <0.5 5.6 nc NAF GCA9715 HPCS007 HPRC0326, 30-32 BID 6.7 (6.7) 0.037 (0.036) 0.02 [0.013] 0.01 0.01 0.37 0.03 5 nc <0.5 5.3 nc NAF
Samples from Basement [= Below-BoX] (i.e. "waste-bedrocks") GCA9716 HPCS008 HPRC0739a, 18-20 Shl 6.6 0.052 <0.01 [0.019] <0.01 <0.01 0.16 <0.01 5 nc <0.5 6.7 nc NAF GCA9717 HPCS009 HPRC0739a, 20-22 Shl 4.2 0.69 1.4 [1.31] 0.13 1.3 1.3 0.73 10 30 20 2.9 <1 PAF GCA9718 HPCS010 HPRC0739a, 22-24 Shl 4.5 1.6 3.0 [2.11] 0.23 2.8 3.5 2.8 28 58 28 (27) 3.5 (3.6) <1 PAF GCA9719 HPCS011 HPRC0345, 50-52 Shl-(WS) 2.4 2.9 0.67 [0.729] 0.20 0.47 1.2 <0.01 -12 27 43 2.5 <1 PAF GCA9720 HPCS011-skin 2.7 1.5 2.0 0.49 1.6 1.5 0.03 -2 51 20 2.8 <1 PAF GCA9721 HPCS012 HPRC0345, 52-54 Shl-(WS) 2.6 2.7 1.1 [0.969] 0.61 0.49 1.8 0.02 -9 24 23 2.7 <1 PAF GCA9722 HPCS012-skin 2.5 2.0 0.75 0.36 0.39 1.9 <0.01 -8 20 21 2.7 <1 PAF GCA9723 HPCS013 HPRC0345, 54-56 Shl-(WS) 2.7 1.4 0.41 [0.785] 0.21 0.20 1.4 0.02 -3 9.2 9.5 3.1 <1 PAF GCA9724 HPCS013-skin 2.8 1.1 0.51 0.17 0.34 1.3 <0.01 -5 16 13 2.9 <1 PAF GCA9725 HPCS014 HPRC0757, 68-70 Shl 5.7 (5.7) 1.1 (1.1) 1.4 [1.26] 0.09 1.4 3.3 1.6 21 nc 12 3.7 nc NAF GCA9726 HPCS015 HPRC0757, 70-72 Shl 6.1 0.77 0.89 [0.744] 0.06 0.83 3.4 2.2 35 (38) nc <0.5 6.9 nc NAF GCA9727 HPCS016 HPRC0757, 72-74 Shl 5.5 1.4 1.4 [1.21] 0.14 1.3 1.7 0.99 20 20 6.7 3.4 <1 PAF
Notes: EC = Electrical Conductivity; ANC = Acid-Neutralisation-Capacity; NAPP = Net-Acid-Producing-Potential; AFP = Acid-Formation-Potential; NAG = Net-Acid Generation; nc = not calculated; NAF = Non-Acid-Forming; PAF = Potentially-Acid Forming. pH-(1:2) and EC-(1:2) values correspond to pH and EC measured on sample slurries prepared with deionised-water, and a solid:solution ratio of c. 1:2 (w/w). All results expressed on a dry-weight basis, except for pH-(1:2), EC-(1:2), and NAG-pH. Values in round-parentheses represent duplicates. N.B. Total-S values in square-parentheses correspond to results from Exploration-Database.
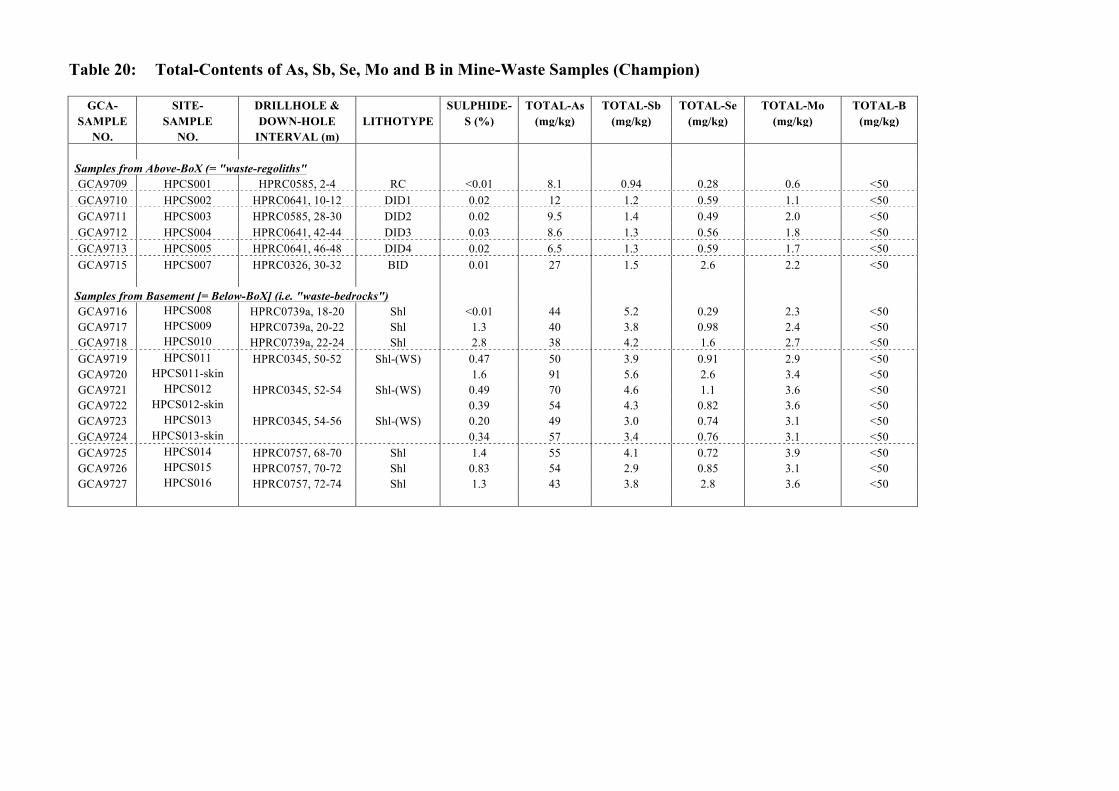
Table 20: Total-Contents of As, Sb, Se, Mo and B in Mine-Waste Samples (Champion)
GCA- SITE- DRILLHOLE & SULPHIDE- TOTAL-As TOTAL-Sb TOTAL-Se TOTAL-Mo TOTAL-B SAMPLE SAMPLE DOWN-HOLE LITHOTYPE S (%) (mg/kg) (mg/kg) (mg/kg) (mg/kg) (mg/kg)
NO. NO. INTERVAL (m)
Samples from Above-BoX (= "waste-regoliths" GCA9709 HPCS001 HPRC0585, 2-4 RC <0.01 8.1 0.94 0.28 0.6 <50 GCA9710 HPCS002 HPRC0641, 10-12 DID1 0.02 12 1.2 0.59 1.1 <50 GCA9711 HPCS003 HPRC0585, 28-30 DID2 0.02 9.5 1.4 0.49 2.0 <50 GCA9712 HPCS004 HPRC0641, 42-44 DID3 0.03 8.6 1.3 0.56 1.8 <50 GCA9713 HPCS005 HPRC0641, 46-48 DID4 0.02 6.5 1.3 0.59 1.7 <50 GCA9715 HPCS007 HPRC0326, 30-32 BID 0.01 27 1.5 2.6 2.2 <50
Samples from Basement [= Below-BoX] (i.e. "waste-bedrocks") GCA9716 HPCS008 HPRC0739a, 18-20 Shl <0.01 44 5.2 0.29 2.3 <50 GCA9717 HPCS009 HPRC0739a, 20-22 Shl 1.3 40 3.8 0.98 2.4 <50 GCA9718 HPCS010 HPRC0739a, 22-24 Shl 2.8 38 4.2 1.6 2.7 <50 GCA9719 HPCS011 HPRC0345, 50-52 Shl-(WS) 0.47 50 3.9 0.91 2.9 <50 GCA9720 HPCS011-skin 1.6 91 5.6 2.6 3.4 <50 GCA9721 HPCS012 HPRC0345, 52-54 Shl-(WS) 0.49 70 4.6 1.1 3.6 <50 GCA9722 HPCS012-skin 0.39 54 4.3 0.82 3.6 <50 GCA9723 HPCS013 HPRC0345, 54-56 Shl-(WS) 0.20 49 3.0 0.74 3.1 <50 GCA9724 HPCS013-skin 0.34 57 3.4 0.76 3.1 <50 GCA9725 HPCS014 HPRC0757, 68-70 Shl 1.4 55 4.1 0.72 3.9 <50 GCA9726 HPCS015 HPRC0757, 70-72 Shl 0.83 54 2.9 0.85 3.1 <50 GCA9727 HPCS016 HPRC0757, 72-74 Shl 1.3 43 3.8 2.8 3.6 <50
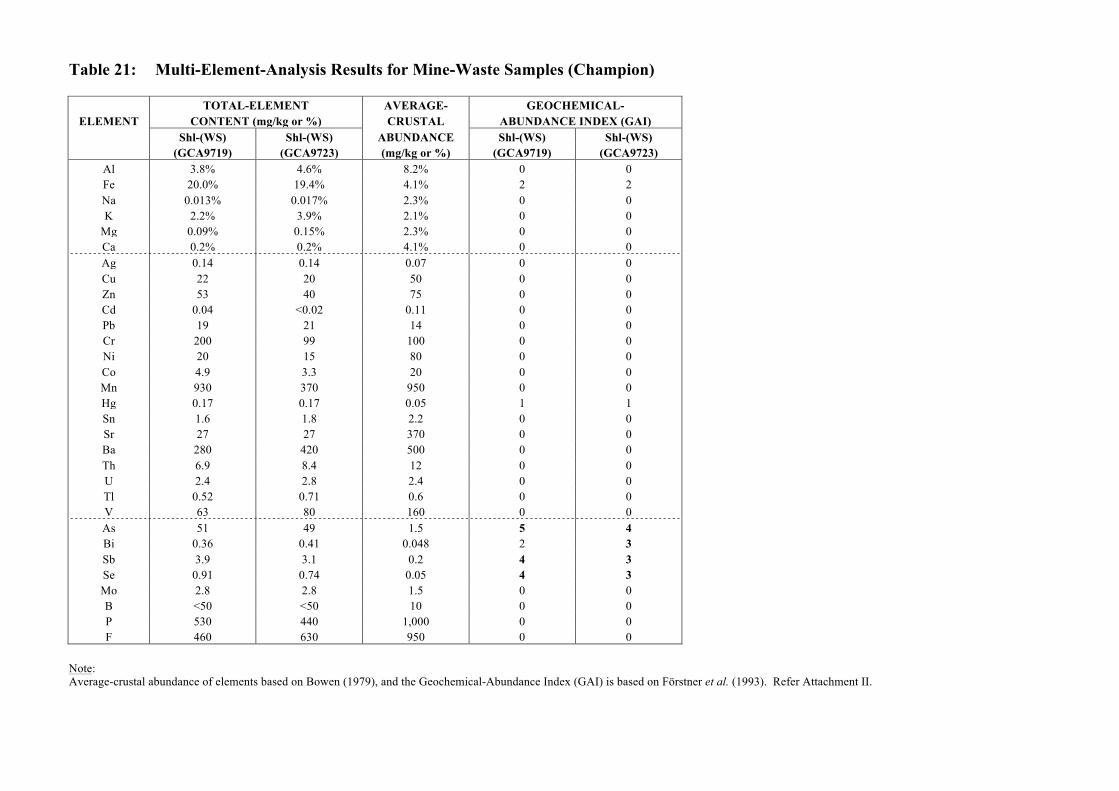
Table 21: Multi-Element-Analysis Results for Mine-Waste Samples (Champion) TOTAL-ELEMENT AVERAGE- GEOCHEMICAL- ELEMENT CONTENT (mg/kg or %) CRUSTAL ABUNDANCE INDEX (GAI)
Shl-(WS) Shl-(WS) ABUNDANCE Shl-(WS) Shl-(WS) (GCA9719) (GCA9723) (mg/kg or %) (GCA9719) (GCA9723)
Al 3.8% 4.6% 8.2% 0 0 Fe 20.0% 19.4% 4.1% 2 2 Na 0.013% 0.017% 2.3% 0 0 K 2.2% 3.9% 2.1% 0 0
Mg 0.09% 0.15% 2.3% 0 0 Ca 0.2% 0.2% 4.1% 0 0 Ag 0.14 0.14 0.07 0 0 Cu 22 20 50 0 0 Zn 53 40 75 0 0 Cd 0.04 <0.02 0.11 0 0 Pb 19 21 14 0 0 Cr 200 99 100 0 0 Ni 20 15 80 0 0 Co 4.9 3.3 20 0 0 Mn 930 370 950 0 0 Hg 0.17 0.17 0.05 1 1 Sn 1.6 1.8 2.2 0 0 Sr 27 27 370 0 0 Ba 280 420 500 0 0 Th 6.9 8.4 12 0 0 U 2.4 2.8 2.4 0 0 Tl 0.52 0.71 0.6 0 0 V 63 80 160 0 0 As 51 49 1.5 5 4 Bi 0.36 0.41 0.048 2 3 Sb 3.9 3.1 0.2 4 3 Se 0.91 0.74 0.05 4 3 Mo 2.8 2.8 1.5 0 0 B <50 <50 10 0 0 P 530 440 1,000 0 0 F 460 630 950 0 0
Note: Average-crustal abundance of elements based on Bowen (1979), and the Geochemical-Abundance Index (GAI) is based on Förstner et al. (1993). Refer Attachment II.
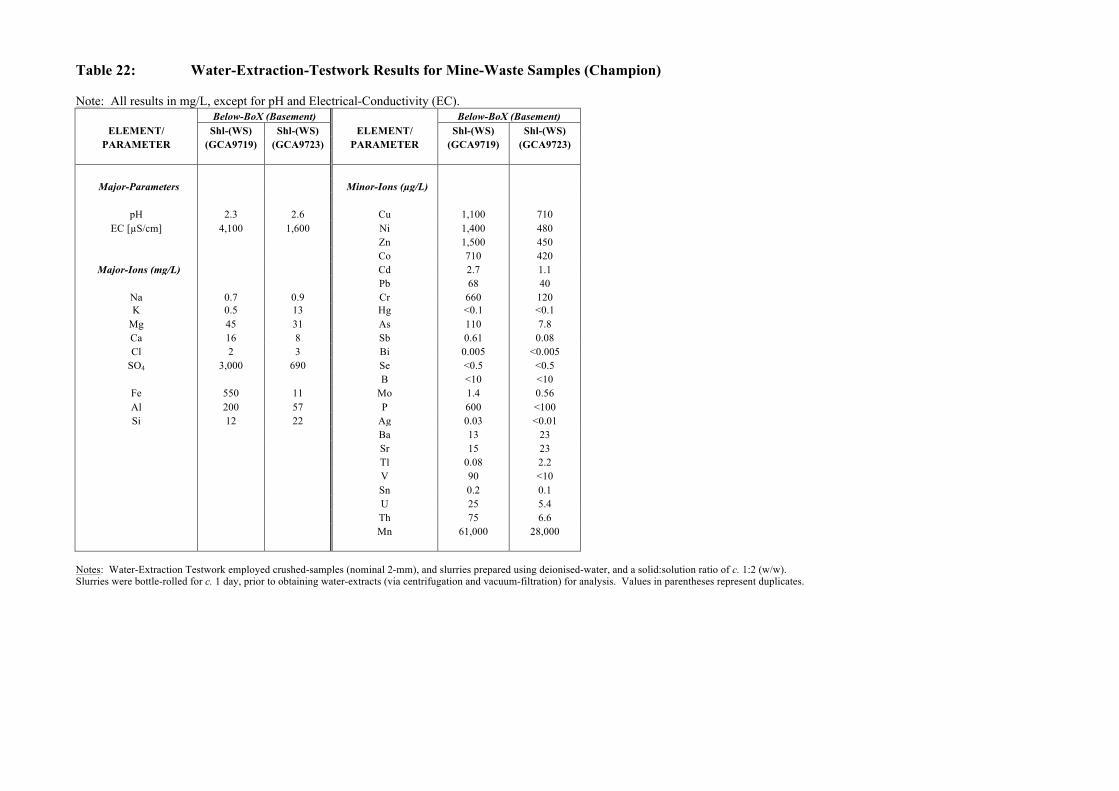
Table 22: Water-Extraction-Testwork Results for Mine-Waste Samples (Champion) Note: All results in mg/L, except for pH and Electrical-Conductivity (EC). Below-BoX (Basement) Below-BoX (Basement)
ELEMENT/ Shl-(WS) Shl-(WS) ELEMENT/ Shl-(WS) Shl-(WS) PARAMETER (GCA9719) (GCA9723) PARAMETER (GCA9719) (GCA9723)
Major-Parameters Minor-Ions (µg/L)
pH 2.3 2.6 Cu 1,100 710 EC [µS/cm] 4,100 1,600 Ni 1,400 480
Zn 1,500 450 Co 710 420
Major-Ions (mg/L) Cd 2.7 1.1 Pb 68 40
Na 0.7 0.9 Cr 660 120 K 0.5 13 Hg <0.1 <0.1
Mg 45 31 As 110 7.8 Ca 16 8 Sb 0.61 0.08 Cl 2 3 Bi 0.005 <0.005
SO4 3,000 690 Se <0.5 <0.5 B <10 <10
Fe 550 11 Mo 1.4 0.56 Al 200 57 P 600 <100 Si 12 22 Ag 0.03 <0.01 Ba 13 23 Sr 15 23 Tl 0.08 2.2 V 90 <10 Sn 0.2 0.1 U 25 5.4 Th 75 6.6 Mn 61,000 28,000
Notes: Water-Extraction Testwork employed crushed-samples (nominal 2-mm), and slurries prepared using deionised-water, and a solid:solution ratio of c. 1:2 (w/w). Slurries were bottle-rolled for c. 1 day, prior to obtaining water-extracts (via centrifugation and vacuum-filtration) for analysis. Values in parentheses represent duplicates.
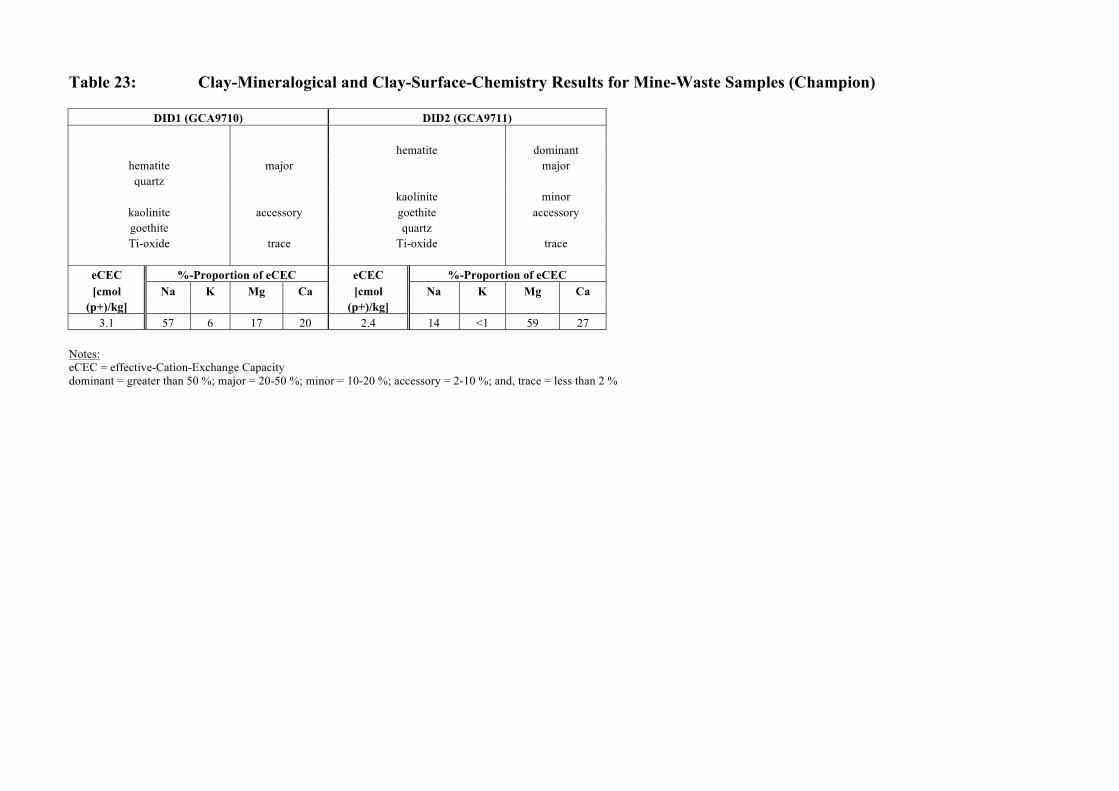
Table 23: Clay-Mineralogical and Clay-Surface-Chemistry Results for Mine-Waste Samples (Champion)
DID1 (GCA9710) DID2 (GCA9711)
hematite dominant
hematite major major quartz
kaolinite minor kaolinite accessory goethite accessory goethite quartz Ti-oxide trace Ti-oxide trace
eCEC %-Proportion of eCEC eCEC %-Proportion of eCEC [cmol Na K Mg Ca [cmol Na K Mg Ca
(p+)/kg] (p+)/kg] 3.1 57 6 17 20 2.4 14 <1 59 27
Notes: eCEC = effective-Cation-Exchange Capacity dominant = greater than 50 %; major = 20-50 %; minor = 10-20 %; accessory = 2-10 %; and, trace = less than 2 %
Graeme Campbell & Associates Pty Ltd
FIGURES
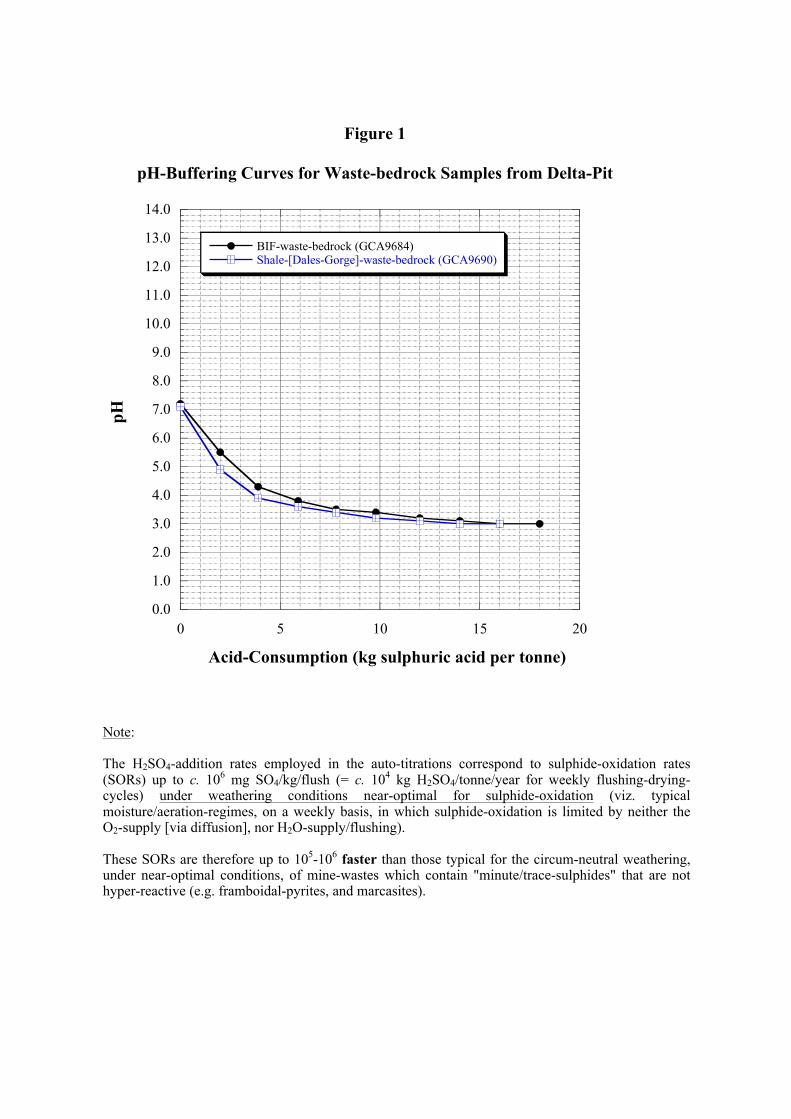
0.0
1.0
2.0
3.0
4.0
5.0
6.0
7.0
8.0
9.0
10.0
11.0
12.0
13.0
14.0
0 5 10 15 20
Figure 1
pH-Buffering Curves for Waste-bedrock Samples from Delta-Pit
BIF-waste-bedrock (GCA9684)Shale-[Dales-Gorge]-waste-bedrock (GCA9690)
pH
Acid-Consumption (kg sulphuric acid per tonne)
Note: The H2SO4-addition rates employed in the auto-titrations correspond to sulphide-oxidation rates (SORs) up to c. 106 mg SO4/kg/flush (= c. 104 kg H2SO4/tonne/year for weekly flushing-drying-cycles) under weathering conditions near-optimal for sulphide-oxidation (viz. typical moisture/aeration-regimes, on a weekly basis, in which sulphide-oxidation is limited by neither the O2-supply [via diffusion], nor H2O-supply/flushing). These SORs are therefore up to 105-106 faster than those typical for the circum-neutral weathering, under near-optimal conditions, of mine-wastes which contain "minute/trace-sulphides" that are not hyper-reactive (e.g. framboidal-pyrites, and marcasites).
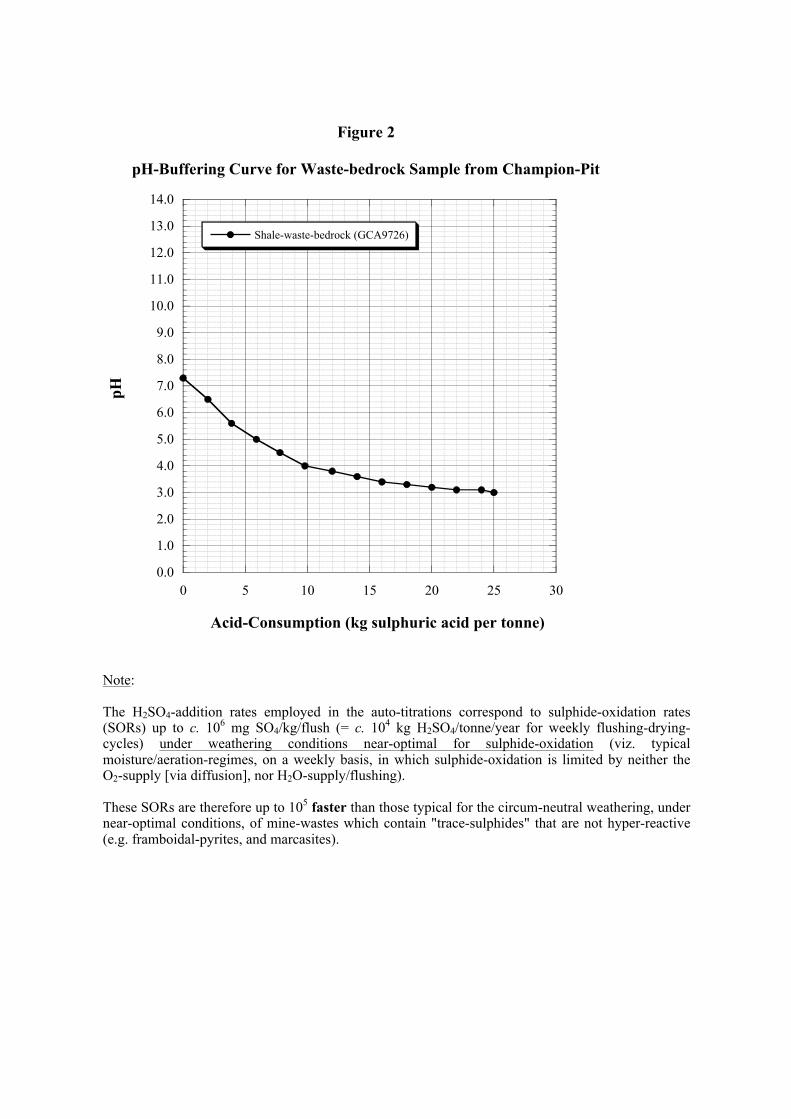
0.0
1.0
2.0
3.0
4.0
5.0
6.0
7.0
8.0
9.0
10.0
11.0
12.0
13.0
14.0
0 5 10 15 20 25 30
Figure 2
pH-Buffering Curve for Waste-bedrock Sample from Champion-Pit
Shale-waste-bedrock (GCA9726)
pH
Acid-Consumption (kg sulphuric acid per tonne)
Note: The H2SO4-addition rates employed in the auto-titrations correspond to sulphide-oxidation rates (SORs) up to c. 106 mg SO4/kg/flush (= c. 104 kg H2SO4/tonne/year for weekly flushing-drying-cycles) under weathering conditions near-optimal for sulphide-oxidation (viz. typical moisture/aeration-regimes, on a weekly basis, in which sulphide-oxidation is limited by neither the O2-supply [via diffusion], nor H2O-supply/flushing). These SORs are therefore up to 105 faster than those typical for the circum-neutral weathering, under near-optimal conditions, of mine-wastes which contain "trace-sulphides" that are not hyper-reactive (e.g. framboidal-pyrites, and marcasites).
Graeme Campbell & Associates Pty Ltd
ATTACHMENT I
STATISTICS OF SULPHUR-OCCURRENCES AND
DETAILS OF SAMPLING PROGRAMME
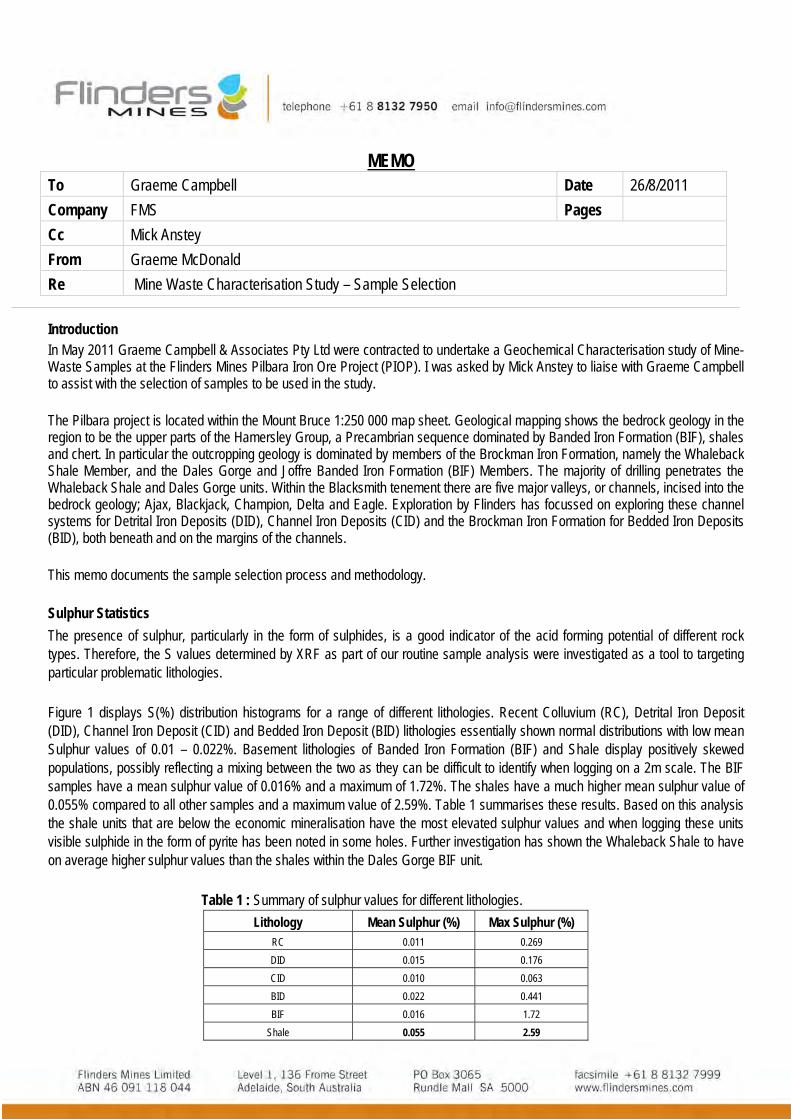
MEMO To Graeme Campbell Date 26/8/2011 Company FMS Pages Cc Mick Anstey From Graeme McDonald Re Mine Waste Characterisation Study – Sample Selection Introduction In May 2011 Graeme Campbell & Associates Pty Ltd were contracted to undertake a Geochemical Characterisation study of Mine-Waste Samples at the Flinders Mines Pilbara Iron Ore Project (PIOP). I was asked by Mick Anstey to liaise with Graeme Campbell to assist with the selection of samples to be used in the study.
The Pilbara project is located within the Mount Bruce 1:250 000 map sheet. Geological mapping shows the bedrock geology in the region to be the upper parts of the Hamersley Group, a Precambrian sequence dominated by Banded Iron Formation (BIF), shales and chert. In particular the outcropping geology is dominated by members of the Brockman Iron Formation, namely the Whaleback Shale Member, and the Dales Gorge and Joffre Banded Iron Formation (BIF) Members. The majority of drilling penetrates the Whaleback Shale and Dales Gorge units. Within the Blacksmith tenement there are five major valleys, or channels, incised into the bedrock geology; Ajax, Blackjack, Champion, Delta and Eagle. Exploration by Flinders has focussed on exploring these channel systems for Detrital Iron Deposits (DID), Channel Iron Deposits (CID) and the Brockman Iron Formation for Bedded Iron Deposits (BID), both beneath and on the margins of the channels.
This memo documents the sample selection process and methodology.
Sulphur Statistics The presence of sulphur, particularly in the form of sulphides, is a good indicator of the acid forming potential of different rock types. Therefore, the S values determined by XRF as part of our routine sample analysis were investigated as a tool to targeting particular problematic lithologies.
Figure 1 displays S(%) distribution histograms for a range of different lithologies. Recent Colluvium (RC), Detrital Iron Deposit (DID), Channel Iron Deposit (CID) and Bedded Iron Deposit (BID) lithologies essentially shown normal distributions with low mean Sulphur values of 0.01 – 0.022%. Basement lithologies of Banded Iron Formation (BIF) and Shale display positively skewed populations, possibly reflecting a mixing between the two as they can be difficult to identify when logging on a 2m scale. The BIF samples have a mean sulphur value of 0.016% and a maximum of 1.72%. The shales have a much higher mean sulphur value of 0.055% compared to all other samples and a maximum value of 2.59%. Table 1 summarises these results. Based on this analysis the shale units that are below the economic mineralisation have the most elevated sulphur values and when logging these units visible sulphide in the form of pyrite has been noted in some holes. Further investigation has shown the Whaleback Shale to have on average higher sulphur values than the shales within the Dales Gorge BIF unit.
Table 1 : Summary of sulphur values for different lithologies. Lithology Mean Sulphur (%) Max Sulphur (%)
RC 0.011 0.269 DID 0.015 0.176 CID 0.010 0.063 BID 0.022 0.441 BIF 0.016 1.72
Shale 0.055 2.59
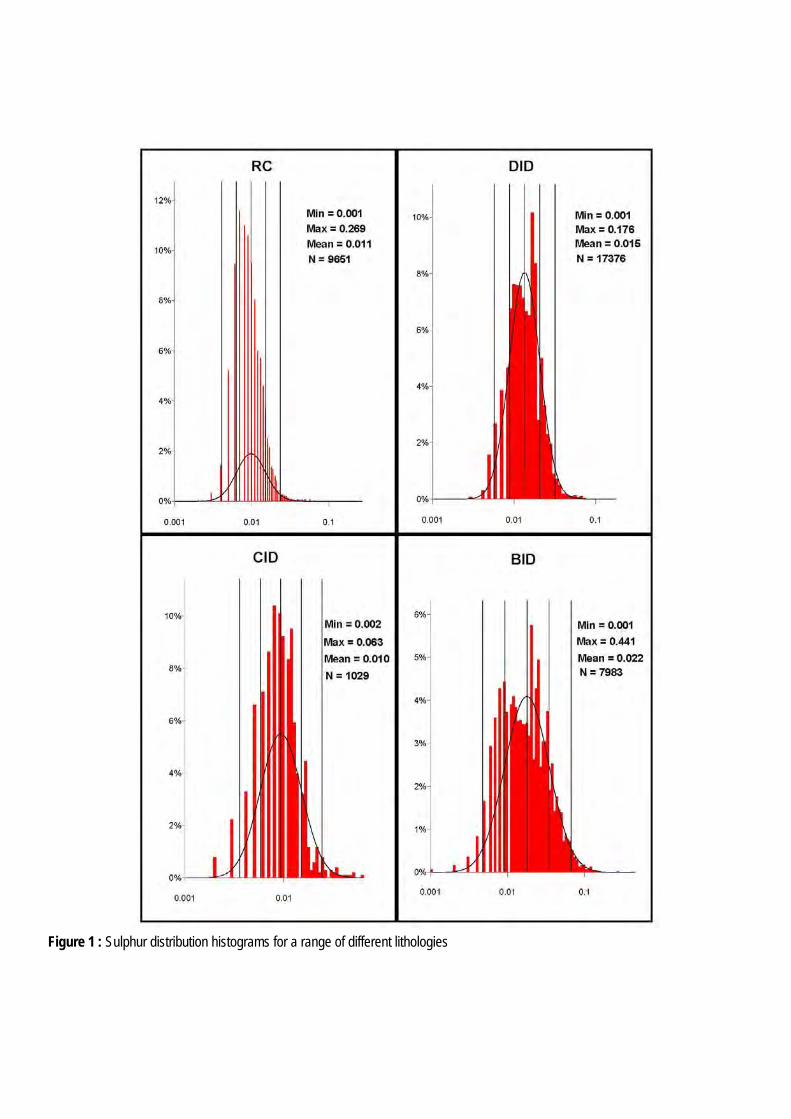
Figure 1 : Sulphur distribution histograms for a range of different lithologies
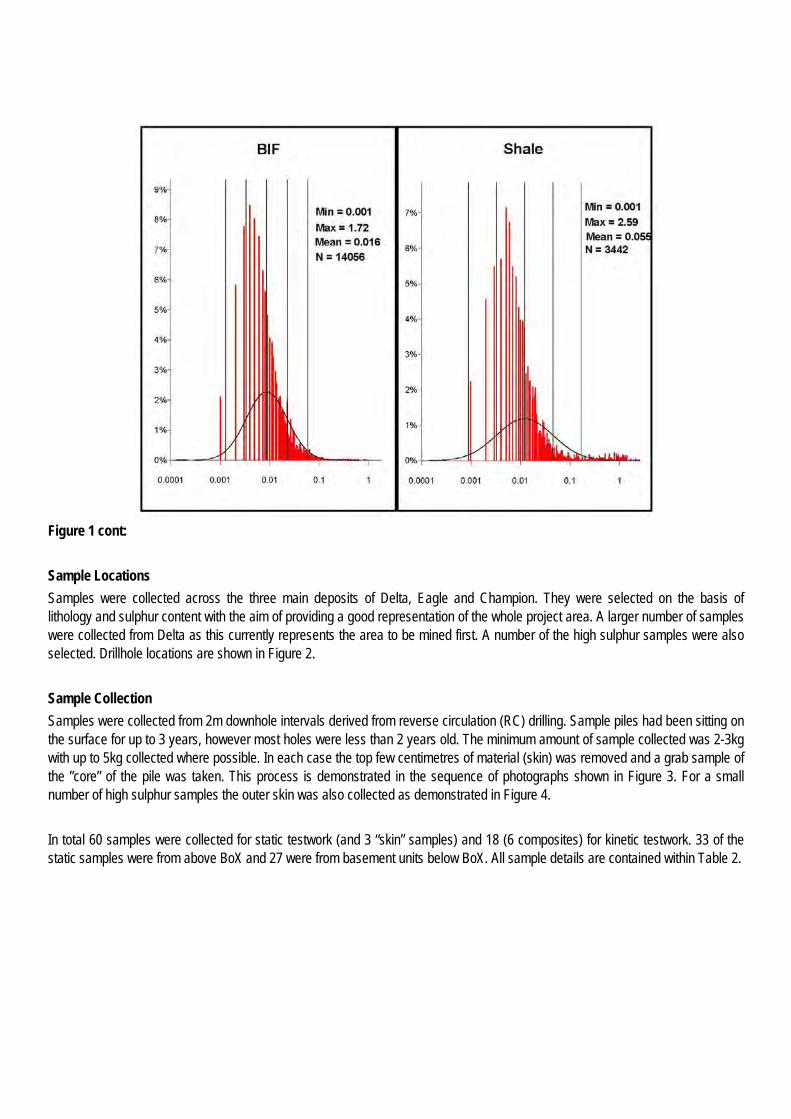
Figure 1 cont: Sample Locations Samples were collected across the three main deposits of Delta, Eagle and Champion. They were selected on the basis of lithology and sulphur content with the aim of providing a good representation of the whole project area. A larger number of samples were collected from Delta as this currently represents the area to be mined first. A number of the high sulphur samples were also selected. Drillhole locations are shown in Figure 2. Sample Collection Samples were collected from 2m downhole intervals derived from reverse circulation (RC) drilling. Sample piles had been sitting on the surface for up to 3 years, however most holes were less than 2 years old. The minimum amount of sample collected was 2-3kg with up to 5kg collected where possible. In each case the top few centimetres of material (skin) was removed and a grab sample of the ”core” of the pile was taken. This process is demonstrated in the sequence of photographs shown in Figure 3. For a small number of high sulphur samples the outer skin was also collected as demonstrated in Figure 4. In total 60 samples were collected for static testwork (and 3 “skin” samples) and 18 (6 composites) for kinetic testwork. 33 of the static samples were from above BoX and 27 were from basement units below BoX. All sample details are contained within Table 2.
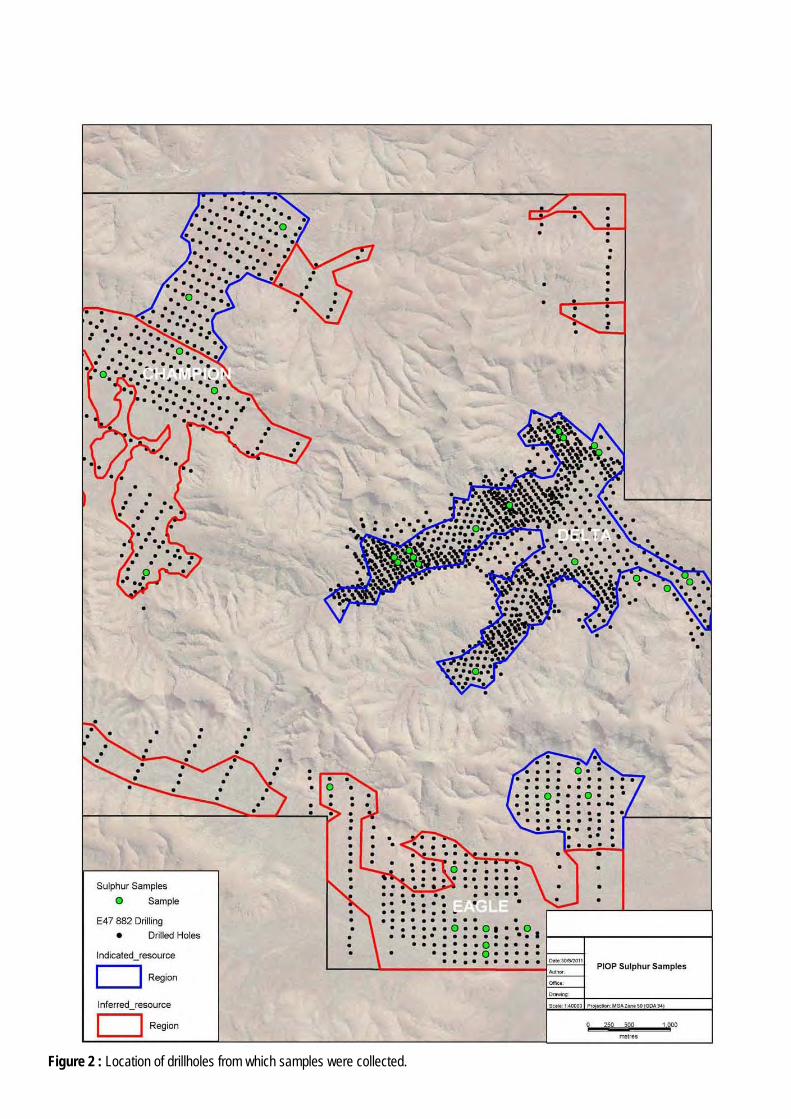
Figure 2 : Location of drillholes from which samples were collected.
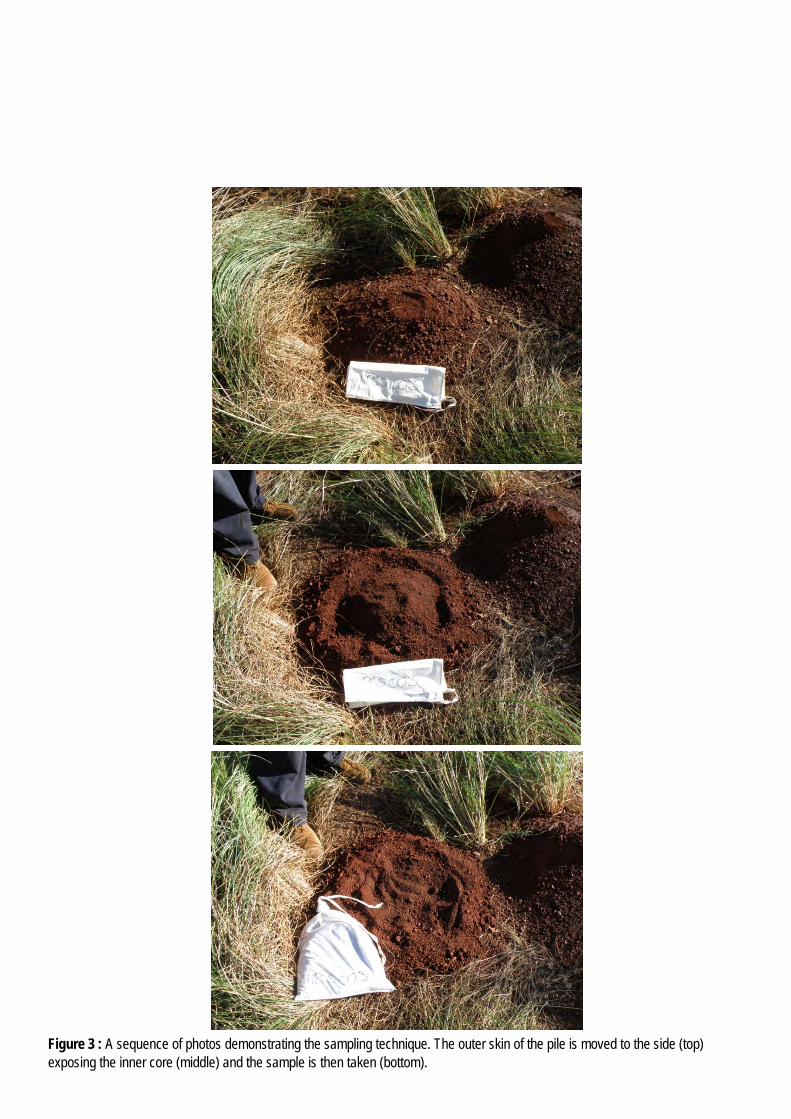
Figure 3 : A sequence of photos demonstrating the sampling technique. The outer skin of the pile is moved to the side (top) exposing the inner core (middle) and the sample is then taken (bottom).
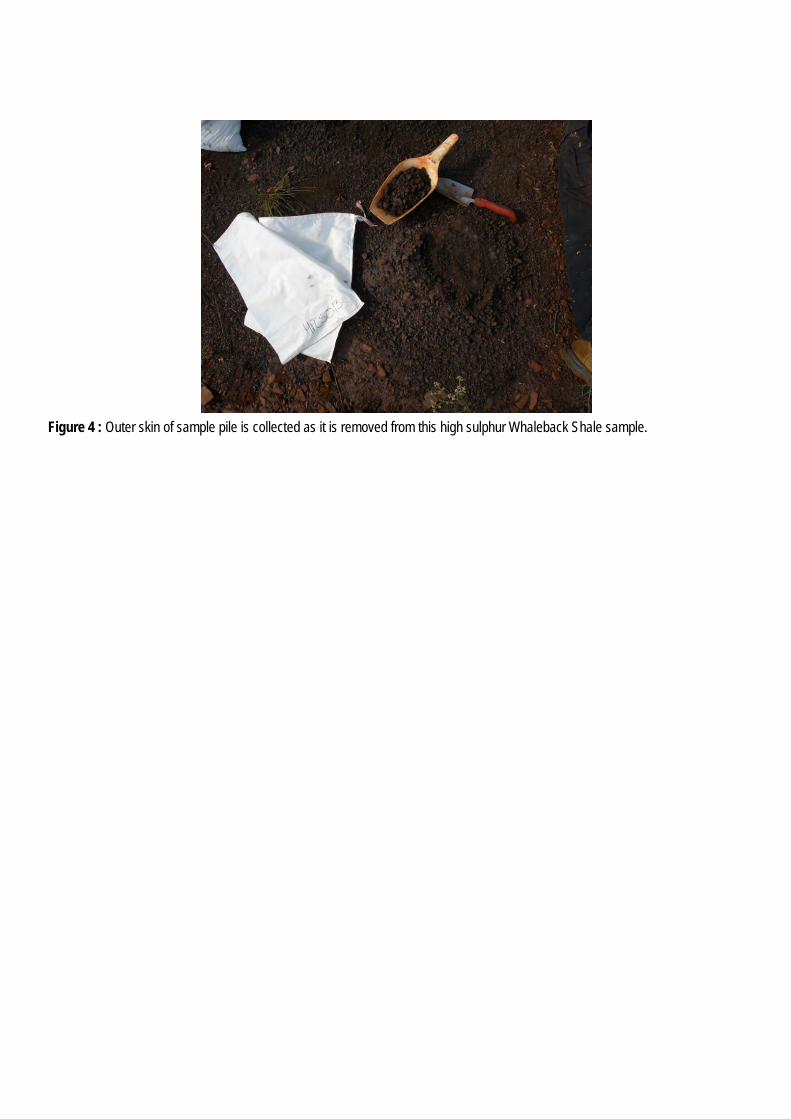
Figure 4 : Outer skin of sample pile is collected as it is removed from this high sulphur Whaleback Shale sample.
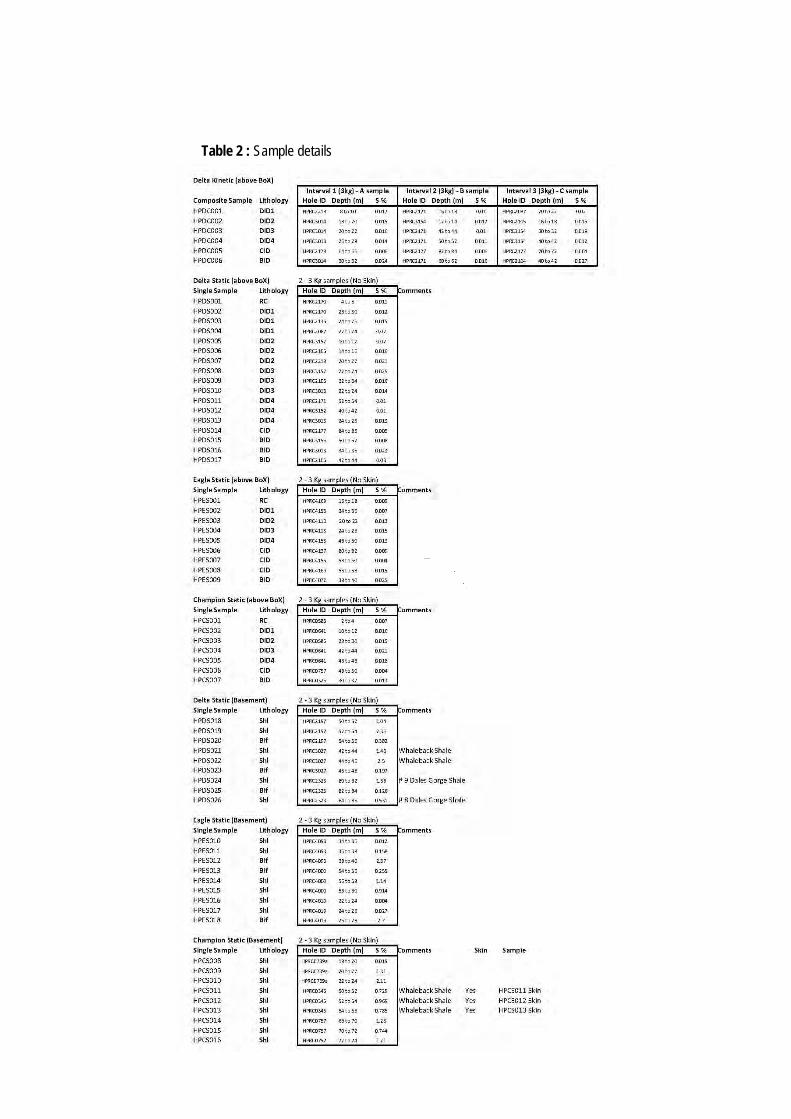
Table 2 : Sample details
Graeme Campbell & Associates Pty Ltd
ATTACHMENT II
TESTWORK METHODS

Graeme Campbell & Associates Pty Ltd
1
ATTACHMENT II
TESTWORK METHODS
The testwork methods outlined below are proven approaches to 'static-testing' and 'kinetic-testing' within the Australian, and international mining-industries (e.g. Price 2009; Stewart et al. 2006; AMIRA 2002; Morin and Hutt 1997).1 The MEND-document prepared by Price (2009), and c. 10-20 years in the making by an experienced practitioner, is an invaluable source of information on testing methods on mine-waste geochemistry. There is also the Global-Acid-Rock-Drainage-Guide (GARD Guide) which is an INAP initiative (go to: www.gardguide.com). However, in terms of comprehensiveness, structure, and clarity, the document by Price (2009) is recommended. Part of the acid-base-account (ABA) testing, and all of the multi-element analyses, and clay-surface-chemical determinations, are carried out by Genalysis Laboratory Services Pty Ltd [GLS] (Maddington). Specialised ABA-testing, and kinetic-testing, is undertaken by GCA (Bridgetown). Characterisation of rock- and clay-mineralogy is carried out by Roger Townend & Associates (Malaga). Samples are crushed to 2mm (nominal) in a jaw/rolls-crusher, and pulverised to 75µm (nominal), for specific tests, as required. These sample-splits are referred to herein as "crushings" and "pulps", respectively. It should be noted that the testwork methods described below are routinely employed in work programmes undertaken by GCA. However, the testwork methods described are generic, and specific tests may not necessarily be undertaken in a given study.
1.0 ACID-BASE-CHEMISTRY AND SALINITY TESTWORK
Acid-base chemistry and salinity are assessed by determining: • pH and Electrical-Conductivity (EC) on sample slurries;
• Total-Sulphur (Total-S), and Sulphate-Sulphur (SO4-S); • Acid-Neutralisation-Capacity (ANC), and CO3-C;
• Net-Acid-Producing-Potential (NAPP); and, • Net-Acid-Generation (NAG). Relevant details of the testwork methods employed are discussed below. Further details are presented in the laboratory reports. 1 'Static'-testing' corresponds to "whole-rock" analyses and tests.
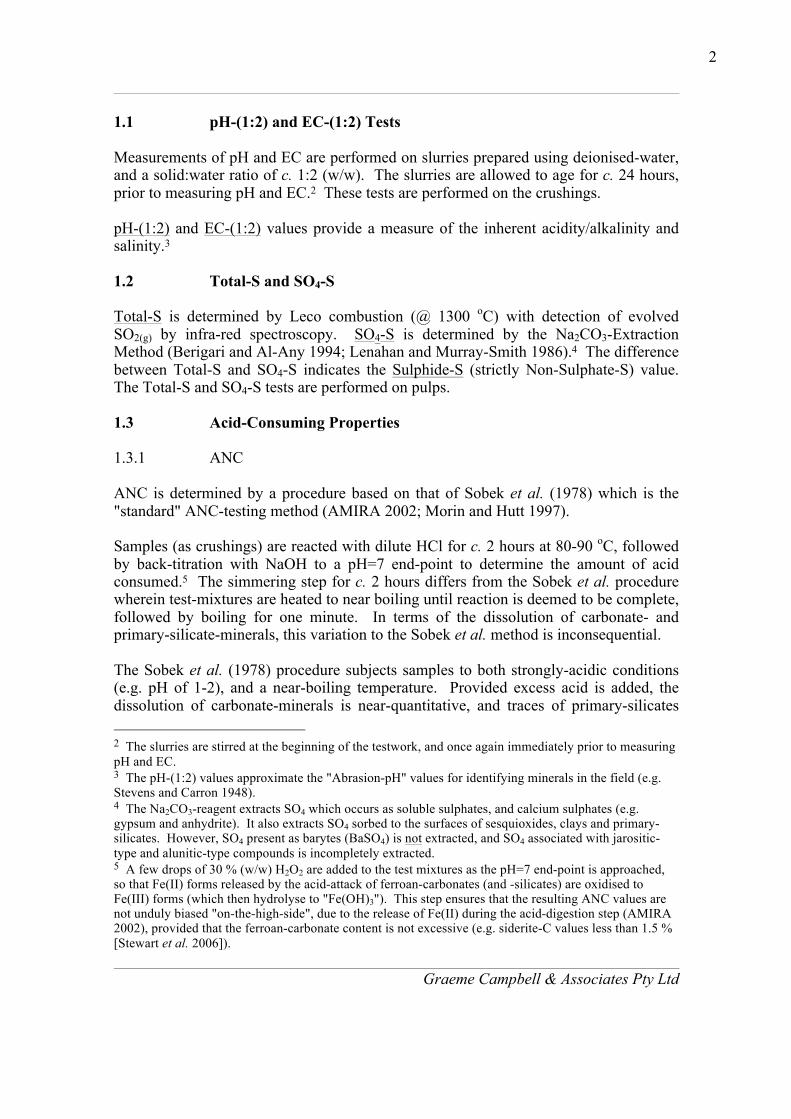
Graeme Campbell & Associates Pty Ltd
2
1.1 pH-(1:2) and EC-(1:2) Tests Measurements of pH and EC are performed on slurries prepared using deionised-water, and a solid:water ratio of c. 1:2 (w/w). The slurries are allowed to age for c. 24 hours, prior to measuring pH and EC.2 These tests are performed on the crushings. pH-(1:2) and EC-(1:2) values provide a measure of the inherent acidity/alkalinity and salinity.3 1.2 Total-S and SO4-S Total-S is determined by Leco combustion (@ 1300 oC) with detection of evolved SO2(g) by infra-red spectroscopy. SO4-S is determined by the Na2CO3-Extraction Method (Berigari and Al-Any 1994; Lenahan and Murray-Smith 1986).4 The difference between Total-S and SO4-S indicates the Sulphide-S (strictly Non-Sulphate-S) value. The Total-S and SO4-S tests are performed on pulps. 1.3 Acid-Consuming Properties 1.3.1 ANC ANC is determined by a procedure based on that of Sobek et al. (1978) which is the "standard" ANC-testing method (AMIRA 2002; Morin and Hutt 1997). Samples (as crushings) are reacted with dilute HCl for c. 2 hours at 80-90 oC, followed by back-titration with NaOH to a pH=7 end-point to determine the amount of acid consumed.5 The simmering step for c. 2 hours differs from the Sobek et al. procedure wherein test-mixtures are heated to near boiling until reaction is deemed to be complete, followed by boiling for one minute. In terms of the dissolution of carbonate- and primary-silicate-minerals, this variation to the Sobek et al. method is inconsequential. The Sobek et al. (1978) procedure subjects samples to both strongly-acidic conditions (e.g. pH of 1-2), and a near-boiling temperature. Provided excess acid is added, the dissolution of carbonate-minerals is near-quantitative, and traces of primary-silicates 2 The slurries are stirred at the beginning of the testwork, and once again immediately prior to measuring pH and EC. 3 The pH-(1:2) values approximate the "Abrasion-pH" values for identifying minerals in the field (e.g. Stevens and Carron 1948). 4 The Na2CO3-reagent extracts SO4 which occurs as soluble sulphates, and calcium sulphates (e.g. gypsum and anhydrite). It also extracts SO4 sorbed to the surfaces of sesquioxides, clays and primary-silicates. However, SO4 present as barytes (BaSO4) is not extracted, and SO4 associated with jarositic-type and alunitic-type compounds is incompletely extracted. 5 A few drops of 30 % (w/w) H2O2 are added to the test mixtures as the pH=7 end-point is approached, so that Fe(II) forms released by the acid-attack of ferroan-carbonates (and -silicates) are oxidised to Fe(III) forms (which then hydrolyse to "Fe(OH)3"). This step ensures that the resulting ANC values are not unduly biased "on-the-high-side", due to the release of Fe(II) during the acid-digestion step (AMIRA 2002), provided that the ferroan-carbonate content is not excessive (e.g. siderite-C values less than 1.5 % [Stewart et al. 2006]).

Graeme Campbell & Associates Pty Ltd
3
also dissolve. However, at circum-neutral-pH (viz. pH 6-8) relevant to mine-waste and environmental management, the dissolution of primary-silicates is kinetically limiting (e.g. see review-monograph by White and Brantley [1995]). In the absence of inhibiting alteration-rims, dissolution rates of mafic/felsic-silicates generally equate to H2SO4-consumption rates 'of-the-order' 10-11-10-12 moles/m2/s. Accordingly, for particle-sizes within the sub-mm range, circum-neutral-dissolution rates of primary-silicates correspond to Sulphide-Oxidation Rates (SORs) 'of-the-order' 1-10 mg SO4/kg/week (= c. 0.1-1.0 kg H2SO4/tonne/year).6 In practice, circum-neutral buffering through the surface-hydrolysis/dissolution of primary-silicates is therefore restricted to both particle-gradings akin to "rock-flour" (viz. sub-mm), and slow rates of sulphide-oxidation (e.g. as exhibited by "trace-sulphides" which are not atypically reactive).7 Despite aggressive-digestion conditions, the ANC values determined by the Sobek et al. (1978) method allow an informed "screening" of acid-consuming properties, especially when due regard is given to groundmass-mineralogy (Morin and Hutt 1997). Jambor et al. (2005, 2002, 2000) list 'Sobek-ANC' values for different types of primary-silicates which assists interpretation of ANC-testwork results. That the ANC value is not an intrinsic property of a sample of geologic media, but rather the outcome of the particular ANC-testwork method employed, is shown by Morin and Hutt (2009). 1.3.2 CO3-C CO3-C is the difference between the Total-C and Total-Organic-C (TOC). Total-C is measured by Leco combustion (@ 1300 oC) with detection of evolved CO2(g) by infra-red spectroscopy. TOC is determined by Leco combustion on a sub-sample which had been treated with strong HCl to decompose carbonate-minerals. Pulps are used for these determinations. 1.3.3 pH-Buffering Properties pH-Buffering properties are determined via a Metrohm® 736 Titrino auto-titrator, and 0.05 M-H2SO4. Auto-titrations comprise regular addition of H2SO4 to decrease the pH values of the test-suspensions (prepared using pulps) to 3.0 typically over the course of
6 SORs of this magnitude (at circum-neutral-pH) would typically only be recorded for the oxidation of "trace-sulphides" (e.g. Sulphide-S contents less than c. 0.5 %) which are not hyper-reactive, and so excludes inter alia framboidal-pyrite, and marcasite. 7 Primary-particle-sizes within the "rock-flour" range is a given for process-tailings-solids. In the case of mine-wastes, despite its usually small weight-based abundance, this size-fraction is invariably the main seat of geochemical-weathering reactions within waste-dumps, and thereby the main "source-term" for solute generation (e.g. Price and Kwong 1997). Such "rock-flour" occurs in two forms: that obtained via dry-sieving, and that associated with the surfaces of clasts of wide-ranging sizes, and which can only be obtained via wet-sieving.
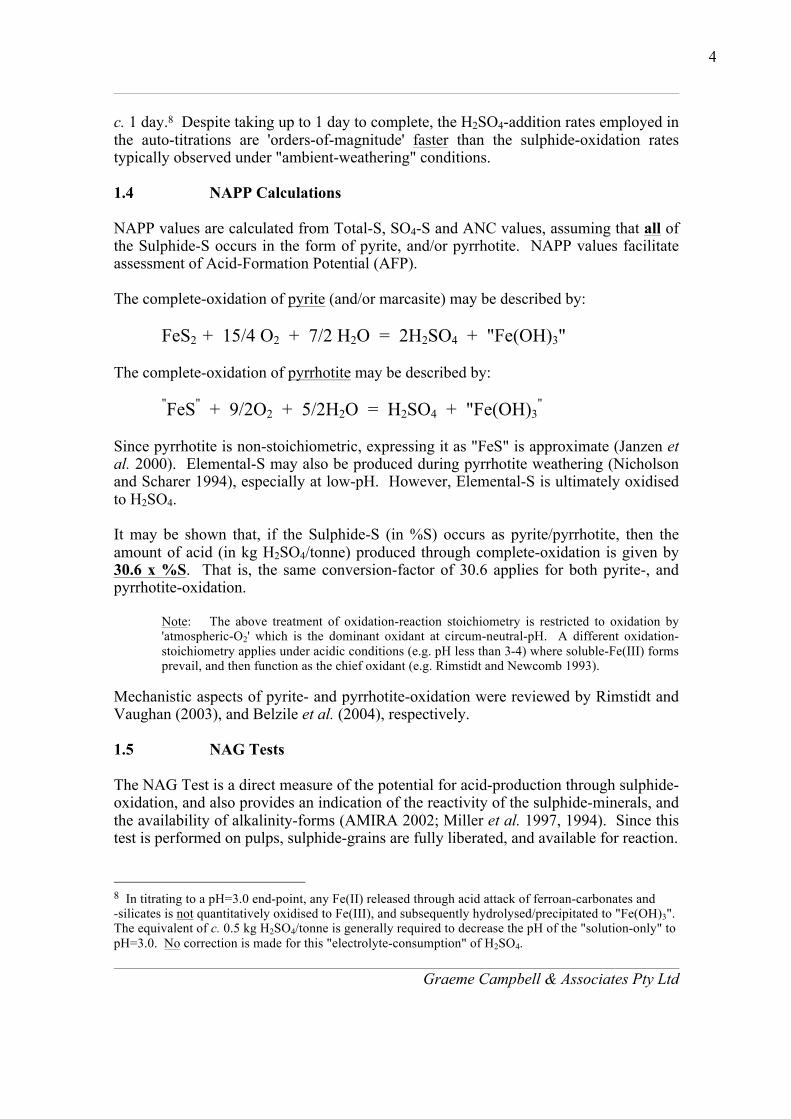
Graeme Campbell & Associates Pty Ltd
4
c. 1 day.8 Despite taking up to 1 day to complete, the H2SO4-addition rates employed in the auto-titrations are 'orders-of-magnitude' faster than the sulphide-oxidation rates typically observed under "ambient-weathering" conditions. 1.4 NAPP Calculations NAPP values are calculated from Total-S, SO4-S and ANC values, assuming that all of the Sulphide-S occurs in the form of pyrite, and/or pyrrhotite. NAPP values facilitate assessment of Acid-Formation Potential (AFP). The complete-oxidation of pyrite (and/or marcasite) may be described by:
FeS2 + 15/4 O2 + 7/2 H2O = 2H2SO4 + "Fe(OH)3"
The complete-oxidation of pyrrhotite may be described by:
"FeS" + 9/2O2 + 5/2H2O = H2SO4 + "Fe(OH)3"
Since pyrrhotite is non-stoichiometric, expressing it as "FeS" is approximate (Janzen et al. 2000). Elemental-S may also be produced during pyrrhotite weathering (Nicholson and Scharer 1994), especially at low-pH. However, Elemental-S is ultimately oxidised to H2SO4. It may be shown that, if the Sulphide-S (in %S) occurs as pyrite/pyrrhotite, then the amount of acid (in kg H2SO4/tonne) produced through complete-oxidation is given by 30.6 x %S. That is, the same conversion-factor of 30.6 applies for both pyrite-, and pyrrhotite-oxidation.
Note: The above treatment of oxidation-reaction stoichiometry is restricted to oxidation by 'atmospheric-O2' which is the dominant oxidant at circum-neutral-pH. A different oxidation-stoichiometry applies under acidic conditions (e.g. pH less than 3-4) where soluble-Fe(III) forms prevail, and then function as the chief oxidant (e.g. Rimstidt and Newcomb 1993).
Mechanistic aspects of pyrite- and pyrrhotite-oxidation were reviewed by Rimstidt and Vaughan (2003), and Belzile et al. (2004), respectively. 1.5 NAG Tests The NAG Test is a direct measure of the potential for acid-production through sulphide-oxidation, and also provides an indication of the reactivity of the sulphide-minerals, and the availability of alkalinity-forms (AMIRA 2002; Miller et al. 1997, 1994). Since this test is performed on pulps, sulphide-grains are fully liberated, and available for reaction. 8 In titrating to a pH=3.0 end-point, any Fe(II) released through acid attack of ferroan-carbonates and -silicates is not quantitatively oxidised to Fe(III), and subsequently hydrolysed/precipitated to "Fe(OH)3". The equivalent of c. 0.5 kg H2SO4/tonne is generally required to decrease the pH of the "solution-only" to pH=3.0. No correction is made for this "electrolyte-consumption" of H2SO4.
Graeme Campbell & Associates Pty Ltd
5
The sample is reacted with H2O2 to oxidise sulphide-minerals, and allow the produced acid to react with the acid-neutralising components (chiefly carbonate-minerals). The results from NAG testwork supplement the NAPP-based assessment of AFP (Stewart et al. 2006; Shaw 2005; Morin and Hutt 1997). The NAG-testing methodology used by GCA is the 'Static-NAG Test' in its "single-addition" mode, with NaOH-titration to a pH=7 end-point (AMIRA 2002; Miller et al. 1994, 1997). The Start-pH of the 15 % (v/v) H2O2 solution (prepared from A.R.-grade H2O2) is adjusted to pH=4.5 using 0.1 M-NaOH. The boiling treatment to decompose residual, unreacted-H2O2 following overnight reaction is carried out in two stages (viz. boiling for c. 2 hours initially, cooling and addition of 1 mL of 0.02 M-CuSO4, followed by boiling for a further c. 2 hours). The addition of Cu(II) catalyses the decomposition of unreacted-H2O2, and thereby prevents "positive-blank" values (McElnea and Ahern 2004; O'Shay et al. 1990).9 Prior to the boiling steps, the pH values of the test-suspensions are measured. Such pH values reflect buffering under ambient conditions without accelerated dissolution of groundmass-minerals through boiling. In the interpretation of NAG-testwork results, it is important to note the pH values prior to the boiling steps, especially for lithotypes characterised by "trace-sulphides" (e.g. Sulphide-S within the sub-% range), and ANC values less than c. 10-20 kg H2SO4/tonne (e.g. a groundmass devoid of carbonate-minerals). The rates of "peroxide-oxidation" are orders-of-magnitude faster than those of "ambient-oxidation" (viz. SORs recorded in kinetic-testing employing Weathering-Columns). If circum-neutral-pH is to prevail during NAG testwork, then the rate of acid-consumption must be proportionately faster than that for "ambient-oxidation", and is essentially restricted to buffering by reactive-carbonate-minerals (e.g. calcites, dolomites, and ankerites). This aspect must be borne in mind when interpreting NAG-testwork results, especially for samples that contain "trace-sulphides" in a carbonate-deficient groundmass. 2.0 MULTI-ELEMENT ANALYSES The total content of a wide range of major- and minor-elements are determined through the use of various digestion and analytical techniques. The respective detection-limits are appropriate for environmental investigations. Element enrichments are identified using the Geochemical Abundance Index (GAI).10 The GAI quantifies an assay result for a particular element in terms of the average-
9 Where samples contain sufficient Cu(II), then Cu(II) forms will be released to solution during reaction with H2O2, especially at low-pH. 10 The GAI was developed by Förstner et al (1993), and is defined as: GAI = log2 [Cn/(1.5 x Bn)] where: Cn = measured content of n-th element in the sample. Bn = "background" content of the n-th element in the sample.
Graeme Campbell & Associates Pty Ltd
6
crustal-abundance of that element.11 The latter corresponds to the typical composition of soils, regoliths and bedrocks derived from unmineralised terrain. The GAI (based on a log-2 scale) is expressed in 7 integer increments (viz. 0 to 6). A GAI of 0 indicates that the content of the element is less than, or similar to, the average-crustal-abundance; a GAI of 3 corresponds to a 12-fold enrichment above the average-crustal-abundance; and so forth, up to a GAI of 6 which corresponds to a 96-fold, or greater, enrichment above average-crustal-abundances. 3.0 MINERALOGY AND CLAY-SURFACE CHEMISTRY The semi-quantitative mineralogy, and clay-surface chemistry (generally restricted to waste-regoliths, oxide-ores, and/or soils), are determined using methods routinely used in geology, and soil science. Indicative abundances of mineral fall into one of the following broad classes, viz. • dominant greater than 50 % • major 20-50 % • minor 10-20 % • accessory 2-10 % • trace less than 2 % Randomly- and preferentially-oriented specimens are prepared, and variously treated with sodium-hexametaphosphate (dispersant), ethylene-glycol, and heating, to quantify non-expansive, and expansive (e.g. smectites), varieties of clay-minerals. The Effective-Cation-Exchange Capacity (eCEC), and suite of Exchangeable-Cations, are determined by different methods for samples (as crushings) of non-calcareous and calcareous materials (Rengasamy and Churchman 1999). In both cases, soluble-salts are initially removed via pre-washing using a "mixed-organic-solvent" (viz. ethylene-glycol and ethanol). Method 15A2 in Rayment and Higginson (1992) is then employed for non-calcareous samples to determine eCEC, and Exchangeable-Sodium Percentage (ESP). In the case of calcareous samples, a method based on that described by Pierce and Morris (2004) is used, and prevents the dissolution of carbonate-minerals (e.g. calcites and dolomites).12 After the initial pre-washing step above, extraction is carried out with 1 M-NH4Cl buffered at pH=8.5 in an ethanolic-aqueous solution. Without such precautions to suppress dissolution of carbonate-minerals, the eCEC is biased "on-the-high-side", and ESP biased "on-the-low-side". Depending on the abundance and nature of the carbonate-minerals, the magnitude of this bias can be marked.
11 The average-crustal-abundances of the elements for the GAI calculations are based on the values listed in Bowen (1979). 12 The procedure described by Pierce and Morris (2004) is closely related to that originally developed by Tucker (1974).
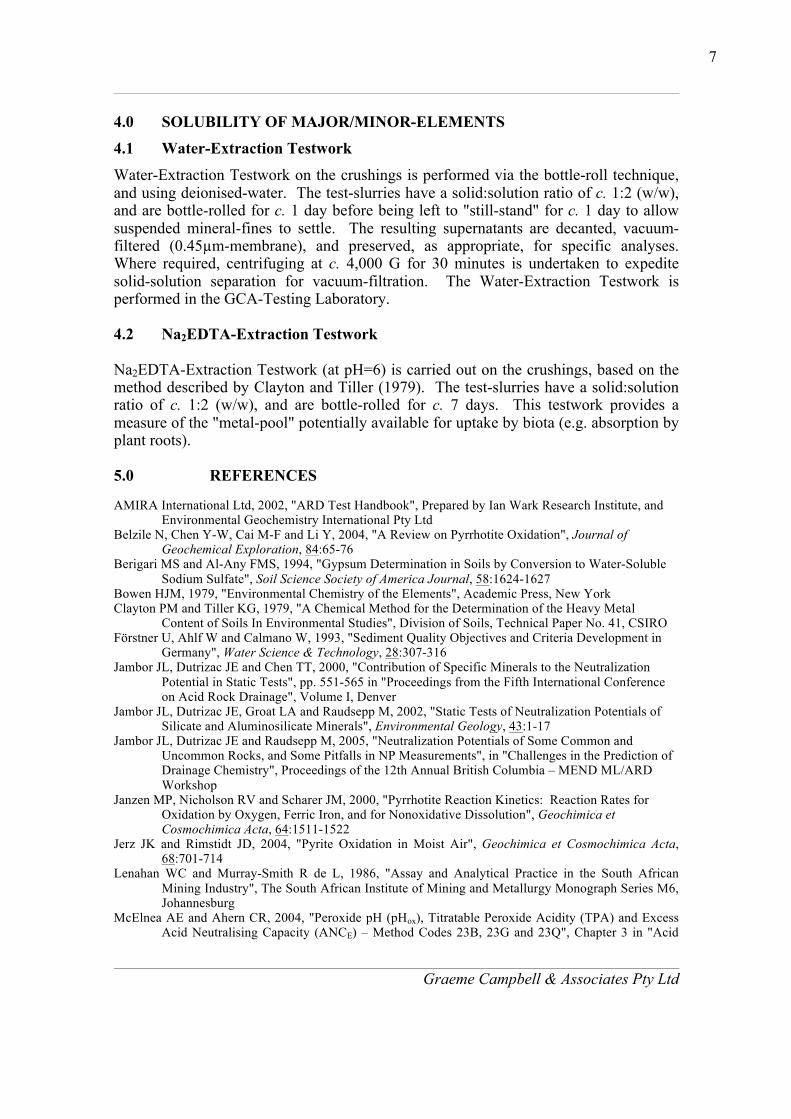
Graeme Campbell & Associates Pty Ltd
7
4.0 SOLUBILITY OF MAJOR/MINOR-ELEMENTS
4.1 Water-Extraction Testwork
Water-Extraction Testwork on the crushings is performed via the bottle-roll technique, and using deionised-water. The test-slurries have a solid:solution ratio of c. 1:2 (w/w), and are bottle-rolled for c. 1 day before being left to "still-stand" for c. 1 day to allow suspended mineral-fines to settle. The resulting supernatants are decanted, vacuum-filtered (0.45µm-membrane), and preserved, as appropriate, for specific analyses. Where required, centrifuging at c. 4,000 G for 30 minutes is undertaken to expedite solid-solution separation for vacuum-filtration. The Water-Extraction Testwork is performed in the GCA-Testing Laboratory. 4.2 Na2EDTA-Extraction Testwork Na2EDTA-Extraction Testwork (at pH=6) is carried out on the crushings, based on the method described by Clayton and Tiller (1979). The test-slurries have a solid:solution ratio of c. 1:2 (w/w), and are bottle-rolled for c. 7 days. This testwork provides a measure of the "metal-pool" potentially available for uptake by biota (e.g. absorption by plant roots). 5.0 REFERENCES AMIRA International Ltd, 2002, "ARD Test Handbook", Prepared by Ian Wark Research Institute, and
Environmental Geochemistry International Pty Ltd Belzile N, Chen Y-W, Cai M-F and Li Y, 2004, "A Review on Pyrrhotite Oxidation", Journal of
Geochemical Exploration, 84:65-76 Berigari MS and Al-Any FMS, 1994, "Gypsum Determination in Soils by Conversion to Water-Soluble
Sodium Sulfate", Soil Science Society of America Journal, 58:1624-1627 Bowen HJM, 1979, "Environmental Chemistry of the Elements", Academic Press, New York Clayton PM and Tiller KG, 1979, "A Chemical Method for the Determination of the Heavy Metal
Content of Soils In Environmental Studies", Division of Soils, Technical Paper No. 41, CSIRO Förstner U, Ahlf W and Calmano W, 1993, "Sediment Quality Objectives and Criteria Development in
Germany", Water Science & Technology, 28:307-316 Jambor JL, Dutrizac JE and Chen TT, 2000, "Contribution of Specific Minerals to the Neutralization
Potential in Static Tests", pp. 551-565 in "Proceedings from the Fifth International Conference on Acid Rock Drainage", Volume I, Denver
Jambor JL, Dutrizac JE, Groat LA and Raudsepp M, 2002, "Static Tests of Neutralization Potentials of Silicate and Aluminosilicate Minerals", Environmental Geology, 43:1-17
Jambor JL, Dutrizac JE and Raudsepp M, 2005, "Neutralization Potentials of Some Common and Uncommon Rocks, and Some Pitfalls in NP Measurements", in "Challenges in the Prediction of Drainage Chemistry", Proceedings of the 12th Annual British Columbia – MEND ML/ARD Workshop
Janzen MP, Nicholson RV and Scharer JM, 2000, "Pyrrhotite Reaction Kinetics: Reaction Rates for Oxidation by Oxygen, Ferric Iron, and for Nonoxidative Dissolution", Geochimica et Cosmochimica Acta, 64:1511-1522
Jerz JK and Rimstidt JD, 2004, "Pyrite Oxidation in Moist Air", Geochimica et Cosmochimica Acta, 68:701-714
Lenahan WC and Murray-Smith R de L, 1986, "Assay and Analytical Practice in the South African Mining Industry", The South African Institute of Mining and Metallurgy Monograph Series M6, Johannesburg
McElnea AE and Ahern CR, 2004, "Peroxide pH (pHox), Titratable Peroxide Acidity (TPA) and Excess Acid Neutralising Capacity (ANCE) – Method Codes 23B, 23G and 23Q", Chapter 3 in "Acid

Graeme Campbell & Associates Pty Ltd
8
Sulfate Soils Laboratory Methods Guidelines", Eds Ahern CR, McElnea AE and Sullivan LA, Department of Natural Resources, Mines and Energy, Indooroopilly, Queensland
Miller SD, Jeffery JJ and Donohue TA, 1994, "Developments in Predicting and Management of Acid Forming Mine Wastes in Australia and Southeast Asia", pp. 177-184 in "Proceedings of the International Land Reclamation and Mine Drainage Conference and Third International Conference on the Abatement of Acidic Drainage", Pittsburgh
Miller S, Robertson A and Donohue T, 1997, "Advances in Acid Drainage Prediction Using the Net Acid Generation (NAG) Test", pp. 535-547 in "Proceedings of the Fourth International Conference on Acid Rock Drainage", Vancouver
Morin KA and Hutt NM, 1997, "Environmental Geochemistry of Minesite Drainage: Practical Theory and Case Studies", MDAG Publishing, Vancouver
Morin KA and Hutt NM, 2009, "On the Nonesense of Arguing the Superiority of an Analytical Method for Neutralization Potential", Mine Drainage Assessment Group (MDAG), Internet Case Study #32 (go to: www.mdag.com)
Nicholson RV and Scharer JM, 1994, "Laboratory Studies of Pyrrhotite Oxidation Kinetics", pp. 14-30 in Alpers CN and Blowes DW (eds), "Environmental Geochemistry of Sulfide Oxidation", ACS Symposium Series 550, American Chemical Society, Washington D.C.
O'Shay T, Hossner LR and Dixon JB, 1990, "A Modified Hydrogen Peroxide Method for Determination of Potential Acidity in Pyritic Overburden", Journal of Environmental Quality, 19:778-782
Pierce CG and Morris S, 2004, "Comparison of Extraction Techniques for Measuring Exchangeable Cations in Calcareous Soils", Australian Journal of Soil Research, 42:301-311 Price W, 2009, "Prediction Manual for Drainage Chemistry from Sulphidic Geologic Materials", MEND Report 1.20.1 Price W and Kwong YTJ, 1997, "Waste Rock Weathering, Sampling and Analysis: Observations from
the British Columbia Ministry of Employment and Investment Database", pp. 31-45 in "Proceedings of the Fourth International Conference on Acid Rock Drainage", Vancouver
Rayment GE and Higginson FR, 1992, "Australian Laboratory Handbook of Soil and Water Chemical Methods", Inkata Press, Melbourne Rengasamy P and Churchman GJ, 1999, "Cation Exchange Capacity, Exchangeable Cations and Sodicity", Chapter 9, pp. 147-170 in Peverill KI, Sparrow LA, and Reuter DJ (eds), "Soil Analysis: An Interpretation Manual", CSIRO Publishing, Collingwood Rimstidt JD and Vaughan DJ, 2003, "Pyrite Oxidation: A State-of-the-Art Assessment of Reaction Mechanism", Geochimica et Cosmochimica Acta, 67:873-880 Shaw S, 2005, "Case Studies and Subsequent Guidelines for the Use of the Static NAG Procedure", Presentation A.4 in "Proceedings of the 12th Annual British Columbia – MEND ML/ARD Workshop on "Challenges in the Prediction of Drainage Chemistry", November 30 to December 1, 2005, Vancouver, British Columbia Sobek AA, Schuller WA, Freeman JR and Smith RM, 1978, "Field and Laboratory Methods Applicable
to Overburdens and Minesoils", EPA-600/2-78-054 Stevens RE and Carron MK, 1948, "Simple Field Test for Distinguishing Minerals by Abrasion pH",
American Mineralogist, 33:31-49 Stewart WA, Miller SD and Smart R, 2006, "Advances in Acid Rock Drainage (ARD) Characterisation
of Mine Wastes", pp. 2098-2117 in "Proceedings from the Seventh International Conference on Acid Rock Drainage", St. Louis, Missouri
Tucker BM, 1974, "Laboratory Procedures for Cation Exchange Measurements on Soils", Division of Soils Technical Paper No. 23, CSIRO, Melbourne
White AF and Brantley SL (eds.), 1995, "Chemical Weathering Rates of Silicate Minerals", Reviews in Mineralogy, Volume 31, Mineralogical Society of America, Washington, D.C.
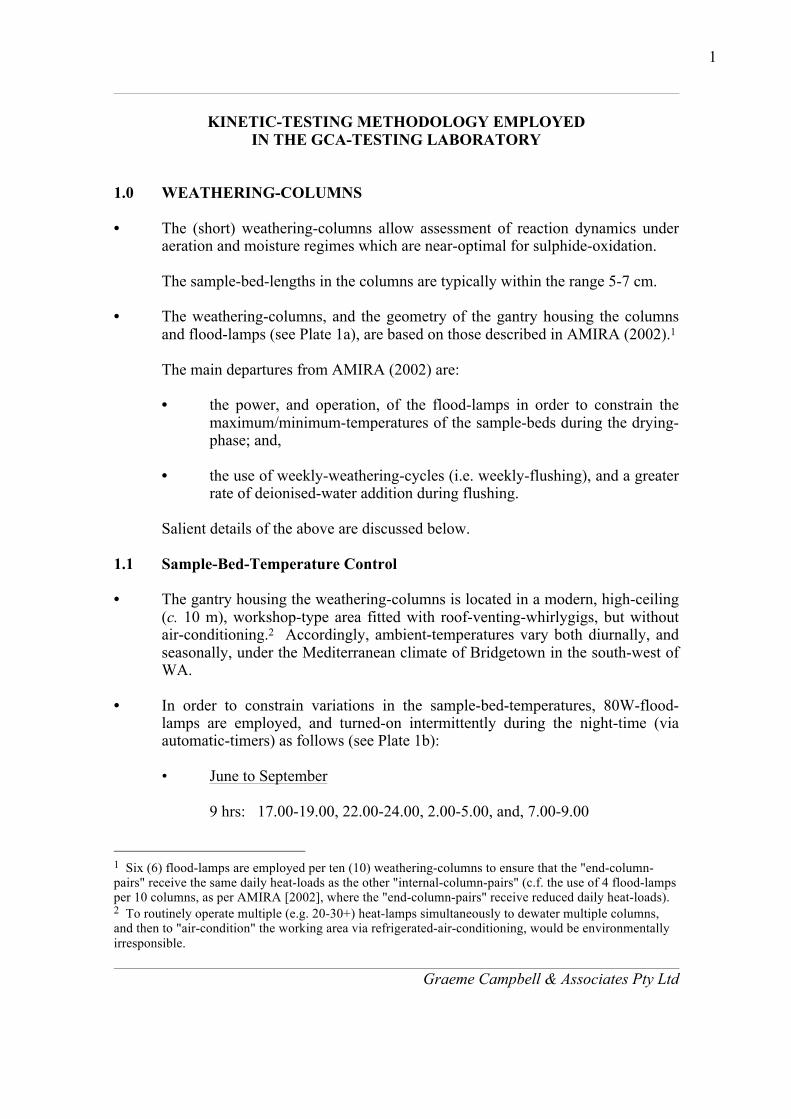
Graeme Campbell & Associates Pty Ltd
1
KINETIC-TESTING METHODOLOGY EMPLOYED IN THE GCA-TESTING LABORATORY
1.0 WEATHERING-COLUMNS • The (short) weathering-columns allow assessment of reaction dynamics under
aeration and moisture regimes which are near-optimal for sulphide-oxidation.
The sample-bed-lengths in the columns are typically within the range 5-7 cm. • The weathering-columns, and the geometry of the gantry housing the columns
and flood-lamps (see Plate 1a), are based on those described in AMIRA (2002).1
The main departures from AMIRA (2002) are:
• the power, and operation, of the flood-lamps in order to constrain the maximum/minimum-temperatures of the sample-beds during the drying-phase; and,
• the use of weekly-weathering-cycles (i.e. weekly-flushing), and a greater
rate of deionised-water addition during flushing.
Salient details of the above are discussed below. 1.1 Sample-Bed-Temperature Control • The gantry housing the weathering-columns is located in a modern, high-ceiling
(c. 10 m), workshop-type area fitted with roof-venting-whirlygigs, but without air-conditioning.2 Accordingly, ambient-temperatures vary both diurnally, and seasonally, under the Mediterranean climate of Bridgetown in the south-west of WA.
• In order to constrain variations in the sample-bed-temperatures, 80W-flood-
lamps are employed, and turned-on intermittently during the night-time (via automatic-timers) as follows (see Plate 1b):
• June to September 9 hrs: 17.00-19.00, 22.00-24.00, 2.00-5.00, and, 7.00-9.00
1 Six (6) flood-lamps are employed per ten (10) weathering-columns to ensure that the "end-column-pairs" receive the same daily heat-loads as the other "internal-column-pairs" (c.f. the use of 4 flood-lamps per 10 columns, as per AMIRA [2002], where the "end-column-pairs" receive reduced daily heat-loads). 2 To routinely operate multiple (e.g. 20-30+) heat-lamps simultaneously to dewater multiple columns, and then to "air-condition" the working area via refrigerated-air-conditioning, would be environmentally irresponsible.
Graeme Campbell & Associates Pty Ltd
2
• October to May 6 hrs: 22.00-24.00, 2.00-5.00, and, 8.00-9.00
• The above differs from that described in AMIRA (2002) where 150W-flood-lamps are turned-on continuously during the daytime for c. 8-10 hrs. Although it is implied in AMIRA (2002) that this setup maintains a surface-temperature of c. 30-35 oC, this is not the case under the conditions of our laboratory.
GCA-research (unpublished) using columns instrumented with thermistors and
soil-moisture sensors, and automatically logged hourly (see Plate 2), has shown that, during the latter stages of drying when residual-moisture contents are attained, the methodology described in AMIRA (2002) results in summer-peak-temperatures (for c. 1-2 hrs in mid-afternoon) up to c. 70-80 oC in the top c. 10 mm on the side of columns closest to the centre of the flood-lamps (i.e. near-lamp-side). However, with the 80W-flood-lamps operated intermittently during the night-time, the near-lamp-side temperature in the top c. 10 mm ranges up to c. 40 oC only on extreme-summer-days. Since the peak-temperature is in the top c. 10 mm on the near-lamp-side, the remainder of the sample-bed has temperatures ranging up to no greater than 30-40 oC.
Likewise, during winter, the operation of the 80W-flood-lamps during the night-
time ensures that the basal-section of the sample-beds on the far-lamp-side have winter-peak-temperatures typically above 10-15 oC during the coldest nights. The flood-lamps are operated 9 hrs per day during winter (c.f. 6 hrs per day for the rest of year) to ensure that sulphide-oxidation is not limited by restricted evaporative-drying.3
• Summarising, under the conditions employed in the GCA-Testing Laboratory,
use of the 80W-flood-lamps operated intermittently has been proved to constrain the maximum temperature of the sample-beds to within 30-40 oC during the latter stages of the drying-phase, even on extreme-summer days.
In terms of assessing the temperature dependence of sulphide-oxidation rates (SORs), the winter- and summer-peak-SORs broadly correspond to mean-temperatures of 20 oC, and 30 oC, respectively. Therefore, where SORs have more-or-less stabilised during kinetic-testing (as often observed during circum-neutral-weathering), the difference between the peak-seasonal-SORs, together with the peak-seasonal-temperature variation of 10 oC, then allows estimation of the activation-energy (Ea) for sulphide-oxidation specific to the tested-lithotype.4 Such lithotype-specific estimates of Ea serve as useful input to geochemical modelling of sulphide-oxidation at field-scale.
3 Pan-evaporation (Epan) rates are routinely determined, and range from 3-5 mm/day over the winter-peak, to 6-8 mm/day over the summer-peak. 4 In practice, it generally means that the kinetic-testing programme would need to run for at least 1-2 years in order to capture the seasonal-extremes of "stable-SORs" for Ea estimation.
Graeme Campbell & Associates Pty Ltd
3
1.2 Weekly-Weathering-Cycles • The columns are weighed each day to track the rate, and extent, of dewatering.5
Where the attainment of residual-moisture contents is not desired (e.g. for mine-sites in well-watered settings), an addition of 0.10-0.20 kg of deionised-water is added to "wet" (but not "flush") the sample-beds part way through the drying-phase of each weathering-cycle.
• The flood-lamps are operated intermittently commencing on Monday, Tuesday,
Wednesday, and Thursday evenings/nights (i.e. flood-lamps operated over four nights during each weathering-cycle). The flushing-step is undertaken late-morning on Fridays, and corresponds to a "flood-addition" of deionised-water. Where required, the top 5-10 mm of the sample-bed-surface is worked-over with a spatula to fill-in, and seal-over, any cracks developed during the drying-phase, and thereby prevent inefficient leaching from "breakthrough", and "by-pass".
• The AMIRA (2002) procedure involves the wetting of the sample-beds at the
end of Week-1, Week-2, and Week-3, and then flushing at the end of Week-4 to produce leachates for analysis (i.e. 4-weekly-flushing regime with weekly-wetting between). The rate of deionised-water addition (viz. 0.10 kg deionised-water per kg solids) in the wetting-step is typically shy of "field-capacity" (enhanced by the seepage-face-lower-boundary condition), so there is generally no drainage.
Weekly-weathering-cycles (i.e. flushing with leachate collection on a weekly basis) are employed in the GCA procedure.
• 1.00 kg of deionised-water is employed for flushing, corresponding to 0.66 kg of deionised-water per kg of solids (i.e. 1.00 kg of deionised-water used to flush 1.50 kg [dry-solids-equivalent] of sample). This rate of water addition exceeds the 0.40 kg per kg solids advocated in AMIRA (2002) which occurs every 4-weeks (c.f. c. 2.7 kg of deionised-water per kg solids over 4-weeks herein). The weekly-flushing regime, and rate of deionised-water addition, employed by GCA is similar to that typically employed in "humidity-cell" testing in Canada, and the USA (Price 2006; Morin and Hutt 1997; ASTM 2007).
• The residence-time of water during the flushing-step is generally ranges up to c.
12 hrs, as governed by sample texture.
5 Due to the "sub-decimetre" thickness of the sample-beds, and the seepage-face-lower-boundary condition, the actual-evaporation rates (Eactual) are typically close to the corresponding Epan rates until residual-moisture/suctions are approached.
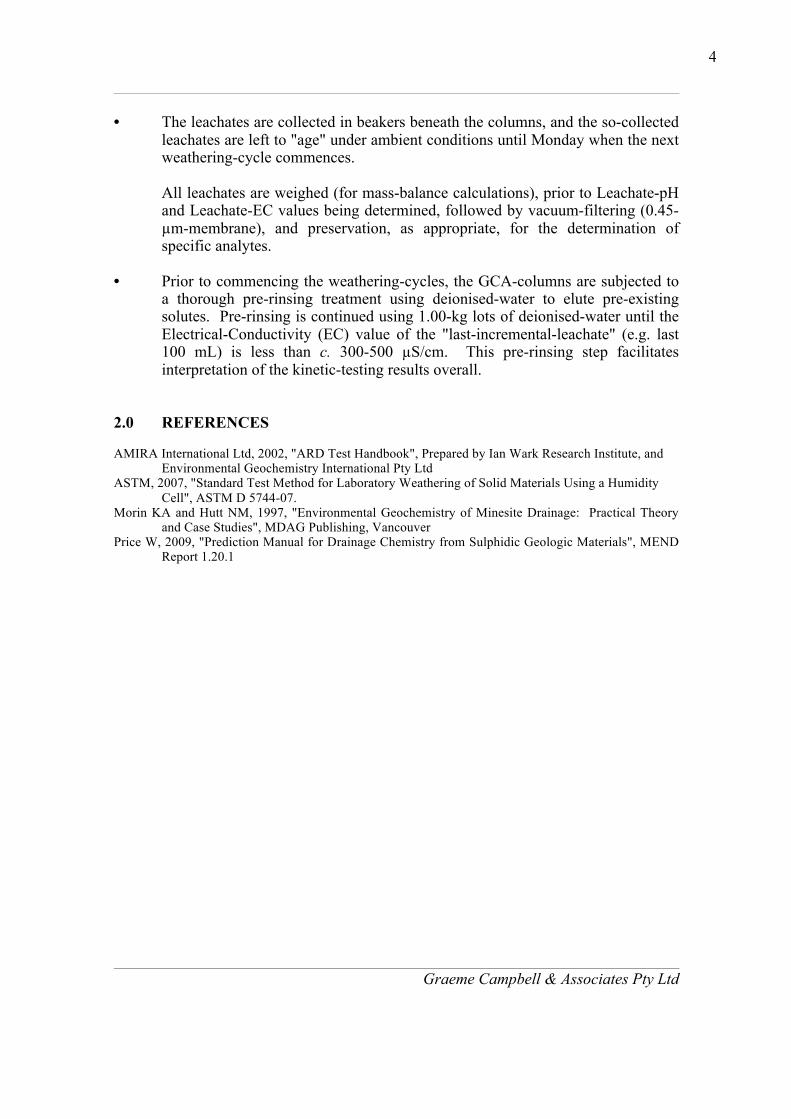
Graeme Campbell & Associates Pty Ltd
4
• The leachates are collected in beakers beneath the columns, and the so-collected leachates are left to "age" under ambient conditions until Monday when the next weathering-cycle commences.
All leachates are weighed (for mass-balance calculations), prior to Leachate-pH and Leachate-EC values being determined, followed by vacuum-filtering (0.45-µm-membrane), and preservation, as appropriate, for the determination of specific analytes.
• Prior to commencing the weathering-cycles, the GCA-columns are subjected to
a thorough pre-rinsing treatment using deionised-water to elute pre-existing solutes. Pre-rinsing is continued using 1.00-kg lots of deionised-water until the Electrical-Conductivity (EC) value of the "last-incremental-leachate" (e.g. last 100 mL) is less than c. 300-500 µS/cm. This pre-rinsing step facilitates interpretation of the kinetic-testing results overall.
2.0 REFERENCES AMIRA International Ltd, 2002, "ARD Test Handbook", Prepared by Ian Wark Research Institute, and
Environmental Geochemistry International Pty Ltd ASTM, 2007, "Standard Test Method for Laboratory Weathering of Solid Materials Using a Humidity
Cell", ASTM D 5744-07. Morin KA and Hutt NM, 1997, "Environmental Geochemistry of Minesite Drainage: Practical Theory
and Case Studies", MDAG Publishing, Vancouver Price W, 2009, "Prediction Manual for Drainage Chemistry from Sulphidic Geologic Materials", MEND Report 1.20.1
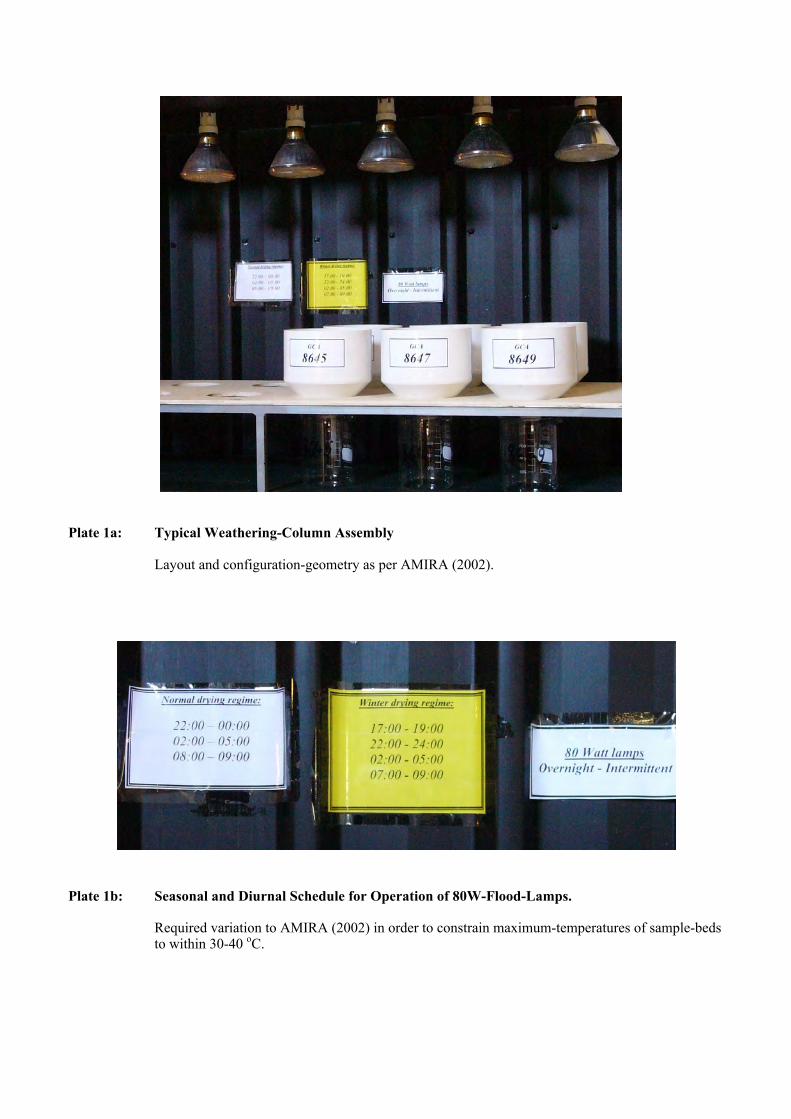
Plate 1a: Typical Weathering-Column Assembly
Layout and configuration-geometry as per AMIRA (2002). Plate 1b: Seasonal and Diurnal Schedule for Operation of 80W-Flood-Lamps.
Required variation to AMIRA (2002) in order to constrain maximum-temperatures of sample-beds to within 30-40 oC.
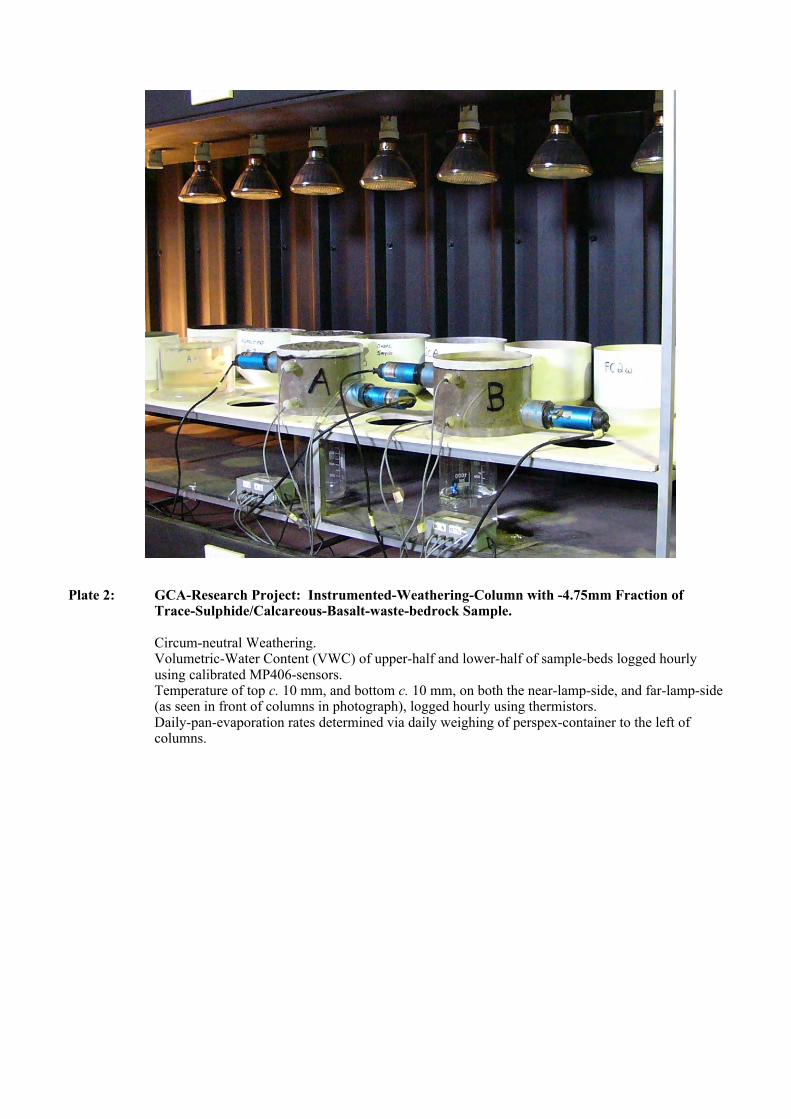
Plate 2: GCA-Research Project: Instrumented-Weathering-Column with -4.75mm Fraction of
Trace-Sulphide/Calcareous-Basalt-waste-bedrock Sample.
Circum-neutral Weathering. Volumetric-Water Content (VWC) of upper-half and lower-half of sample-beds logged hourly using calibrated MP406-sensors. Temperature of top c. 10 mm, and bottom c. 10 mm, on both the near-lamp-side, and far-lamp-side (as seen in front of columns in photograph), logged hourly using thermistors. Daily-pan-evaporation rates determined via daily weighing of perspex-container to the left of columns.
Graeme Campbell & Associates Pty Ltd
ATTACHMENT III
ACID-FORMATION POTENTIAL (AFP):
CALCULATED PARAMETERS AND CLASSIFICATION CRITERIA

Graeme Campbell & Associates Pty Ltd
1
ATTACHMENT III
ACID-FORMATION POTENTIAL (AFP):
CALCULATED PARAMETERS AND CLASSIFICATION CRITERIA
Notes: The geochemically-based parameters, and AFP-classification criteria, indicated below apply equally to samples of mine-wastes (e.g. waste-regoliths and waste-bedrocks), low-grade-ores, and process-tailings-solids. The generic descriptor "test-sample" is employed below.
1.0 CALCULATED PARAMETERS Maximum-Potential-Acidity (MPA) values (in kg H2SO4/tonne) of test-samples are typically calculated by multiplying the Sulphide-S values (in %) by 30.6. The multiplication-factor of 30.6 reflects both the reaction stoichiometry for the complete-oxidation of pyrite, by O2 to "Fe(OH)3" and H2SO4, and the different weight-based units of %, and kg H2SO4/tonne. Net-Acid-Producing-Potential (NAPP) values (in kg H2SO4/tonne) are calculated from the corresponding MPA and Acid-Neutralisation-Capacity (ANC) values (i.e. NAPP = MPA - ANC). 2.0 CLASSIFICATION CRITERIA In terms of AFP, test-samples may be classified into one of the following categories, viz. • Non-Acid Forming (NAF) • Potentially-Acid Forming (PAF) There are no unifying, "standard" criteria for classifying the AFP of test-samples (e.g. Price 2009; AMIRA 2002), and reflects the diversity of sulphide- and gangue-mineral assemblages within (un)mineralised-lithotypes of varying weathering- and alteration-status. Rather, criteria for classifying AFP may need to be tailored to deposit-specific geochemistry, mineralogy, and site-specific climate. The AFP-classification criteria often employed at mining-operations worldwide are:
• NAF: Sulphide-S < 0.3 %. For Sulphide-S ≥ 0.3 %, both a negative NAPP value, and an ANC/MPA ratio ≥ 2.0
• PAF: For Sulphide-S ≥ 0.3 %, any positive-NAPP value; negative-NAPP value with an ANC/MPA ratio < 2.0
Graeme Campbell & Associates Pty Ltd
2
In assessing AFP, lithotypes from hard-rock mines with Sulphide-S values less than 0.3 % are unlikely to acidify (e.g. pH less than 4-5) through sulphide-oxidation. This position holds especially where the groundmass hosting the "trace-sulphides" is not simply quartz, soil-clays, and/or sesquioxides (Price et al. 1997), and where the sulphide-minerals are not hyper-reactive varieties (e.g. framboidal-pyrite). A "cut-off" of 0.3 % for Sulphide-S also accords with the findings of kinetic-testing, since the late-1980s, by Dr. Graeme Campbell for test-samples of diverse mineralogy in terms of sulphide-weathering dynamics, and solubility behaviour. The risk posed by PAF-lithotypes during the active-mine-life is governed primarily by the duration of the lag-phase (i.e. the period during which sulphide-oxidation occurs, but acidification does not develop, due to circum-neutral buffering by gangue-phases [chiefly reactive-carbonate-minerals]).1 Although the duration of the lag-phase for mine-wastes at field-scale cannot be accurately predicted a priori, estimates may still be needed to identify threshold exposure-times for the safe handling of PAF-lithotypes. Lag-phase duration may be estimated via kinetic-testing (viz. Weathering-Columns), and consideration of the moisture/aeration/thermal-regimes of exposed (i.e. uncovered) mine-wastes under the site's climatic conditions. In the absence of results from kinetic-testing, experience permits "first-pass" estimates of sulphide-oxidation rates and lag-phase duration to be made from the results of static-testing, and thereby classify PAF-lithotypes into PAF-[Short-Lag] and PAF-[Long-Lag] sub-categories. Such "first-pass" estimations are necessarily provisional, and subject to revision, in the light of the outcomes of kinetic-testing, and field observations. 3.0 REFERENCES AMIRA International Ltd, 2002, "ARD Test Handbook", Prepared by Ian Wark Research Institute, and
Environmental Geochemistry International Pty Ltd Price W, 2009, "Prediction Manual for Drainage Chemistry from Sulphidic Geologic Materials", MEND Report 1.20.1 Price WA, Morin K and Hutt N, 1997, "Guidelines for the Prediction of Acid Rock Drainage and Metal
Leaching for Mines in British Columbia: Part II. Recommended Procedures for Static and Kinetic Testing", pp. 15-30 in "Proceedings of the Fourth International Conference on Acid Rock Drainage", Volume I, Vancouver
1 SO4 is still produced by sulphide-oxidation during the lag-phase, and appreciable amounts of soluble-forms of certain minor-elements (e.g. Ni and As) may be released at circum-neutral-pH during lag-phase weathering. However, in the latter case, the mine-wastes would need to be sufficiently enriched in Total-Ni and Total-As to begin with.
Graeme Campbell & Associates Pty Ltd
ATTACHMENT IV
LABORATORY REPORTS
Graeme Campbell & Associates Pty Ltd
Note:
The laboratory-reports in the following pages correspond to
the static-testing programme carried out on the sixty-three (63) "individual-samples" of
waste-regoliths and waste-bedrocks variously derived from the
Delta-Pit, Eagle-Pit, and Champion-Pit.
Correspondence to Box 3129, Malaga D.C. WA 6945 ACN 069 920 476 ABN 92 076 109 663
GRAEME CAMPBELL AND ASSOCIATES 6-‐9-‐2011 PO BOX 247, BRIDGETOWN WA OUR REFERENCE 22969 YOUR REFERENCE: 1112 XRD/PLM /SEM ANALYSIS OF EIGHT ROCK PULPS. R & D TOWNEND
Roger Townend and Associates Consulting Mineralogists
Unit 4, 40 Irvine drive, Malaga Western Australia 6062 Phone: (08) 9248 1674 Fax: (08) 9248 1502 email: [email protected]
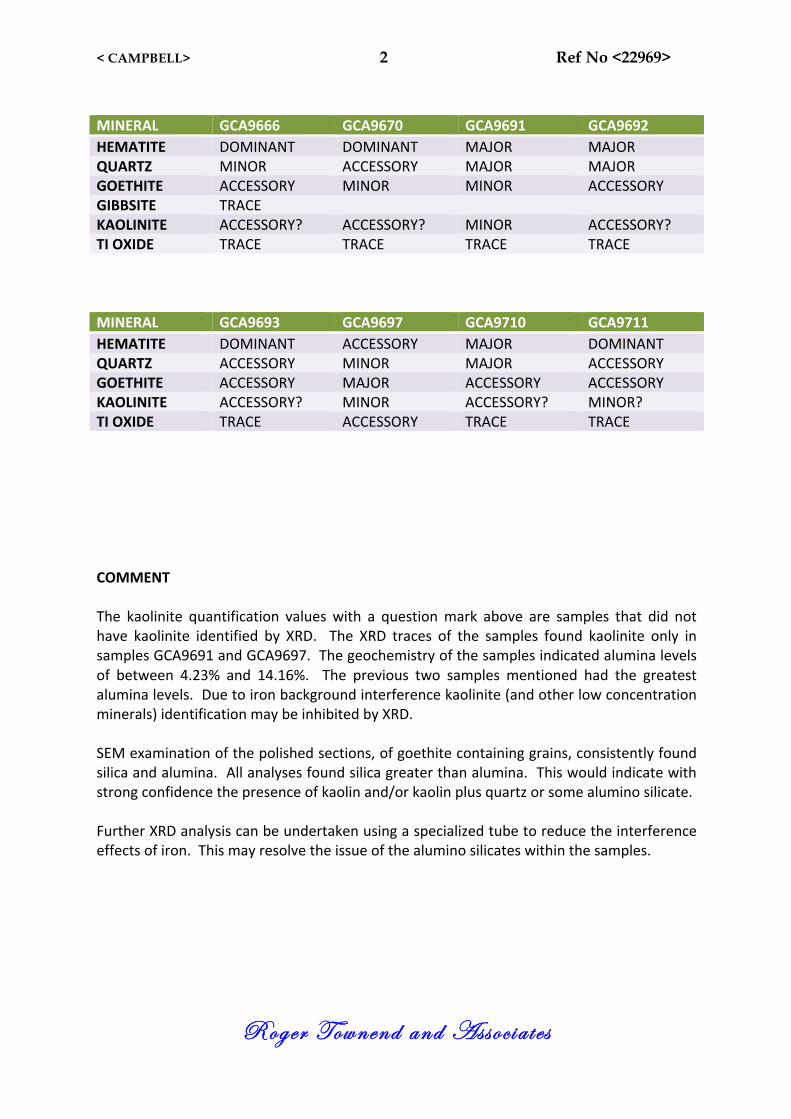
< CAMPBELL> 2 Ref No <22969>
Roger Townend and Asso c i a t e s
MINERAL GCA9666 GCA9670 GCA9691 GCA9692 HEMATITE DOMINANT DOMINANT MAJOR MAJOR QUARTZ MINOR ACCESSORY MAJOR MAJOR GOETHITE ACCESSORY MINOR MINOR ACCESSORY GIBBSITE TRACE KAOLINITE ACCESSORY? ACCESSORY? MINOR ACCESSORY? TI OXIDE TRACE TRACE TRACE TRACE MINERAL GCA9693 GCA9697 GCA9710 GCA9711 HEMATITE DOMINANT ACCESSORY MAJOR DOMINANT QUARTZ ACCESSORY MINOR MAJOR ACCESSORY GOETHITE ACCESSORY MAJOR ACCESSORY ACCESSORY KAOLINITE ACCESSORY? MINOR ACCESSORY? MINOR? TI OXIDE TRACE ACCESSORY TRACE TRACE COMMENT The kaolinite quantification values with a question mark above are samples that did not have kaolinite identified by XRD. The XRD traces of the samples found kaolinite only in samples GCA9691 and GCA9697. The geochemistry of the samples indicated alumina levels of between 4.23% and 14.16%. The previous two samples mentioned had the greatest alumina levels. Due to iron background interference kaolinite (and other low concentration minerals) identification may be inhibited by XRD. SEM examination of the polished sections, of goethite containing grains, consistently found silica and alumina. All analyses found silica greater than alumina. This would indicate with strong confidence the presence of kaolin and/or kaolin plus quartz or some alumino silicate. Further XRD analysis can be undertaken using a specialized tube to reduce the interference effects of iron. This may resolve the issue of the alumino silicates within the samples.
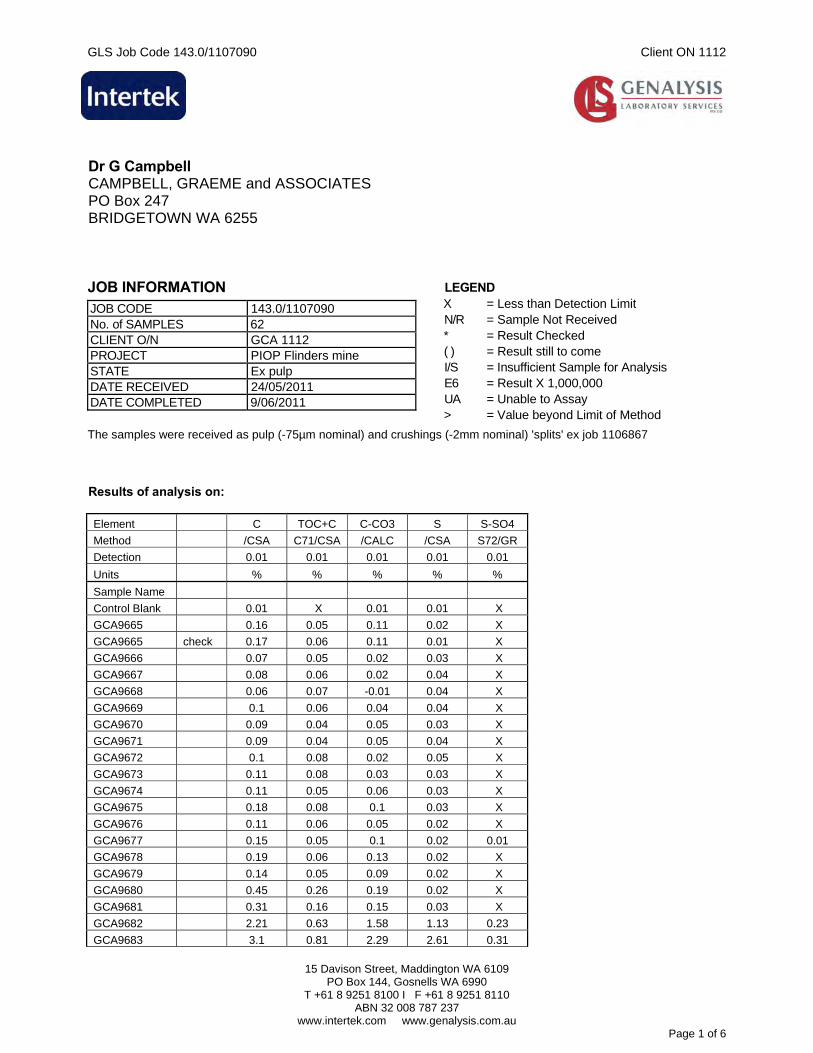
GLS Job Code 143.0/1107090 Client ON 1112
15 Davison Street, Maddington WA 6109
PO Box 144, Gosnells WA 6990 T +61 8 9251 8100 I F +61 8 9251 8110
ABN 32 008 787 237 www.intertek.com www.genalysis.com.au
Page 1 of 6
Dr G Campbell CAMPBELL, GRAEME and ASSOCIATES PO Box 247 BRIDGETOWN WA 6255 JOB INFORMATION
JOB CODE 143.0/1107090 No. of SAMPLES 62 CLIENT O/N GCA 1112 PROJECT PIOP Flinders mine STATE Ex pulp DATE RECEIVED 24/05/2011 DATE COMPLETED 9/06/2011
LEGEND X = Less than Detection Limit N/R = Sample Not Received * = Result Checked ( ) = Result still to come I/S = Insufficient Sample for Analysis E6 = Result X 1,000,000 UA = Unable to Assay > = Value beyond Limit of Method
The samples were received as pulp (-75µm nominal) and crushings (-2mm nominal) 'splits' ex job 1106867 Results of analysis on: Element C TOC+C C-CO3 S S-SO4
Method /CSA C71/CSA /CALC /CSA S72/GR
Detection 0.01 0.01 0.01 0.01 0.01
Units % % % % %
Sample Name
Control Blank 0.01 X 0.01 0.01 X
GCA9665 0.16 0.05 0.11 0.02 X
GCA9665 check 0.17 0.06 0.11 0.01 X
GCA9666 0.07 0.05 0.02 0.03 X
GCA9667 0.08 0.06 0.02 0.04 X
GCA9668 0.06 0.07 -0.01 0.04 X
GCA9669 0.1 0.06 0.04 0.04 X
GCA9670 0.09 0.04 0.05 0.03 X
GCA9671 0.09 0.04 0.05 0.04 X
GCA9672 0.1 0.08 0.02 0.05 X
GCA9673 0.11 0.08 0.03 0.03 X
GCA9674 0.11 0.05 0.06 0.03 X
GCA9675 0.18 0.08 0.1 0.03 X
GCA9676 0.11 0.06 0.05 0.02 X
GCA9677 0.15 0.05 0.1 0.02 0.01
GCA9678 0.19 0.06 0.13 0.02 X
GCA9679 0.14 0.05 0.09 0.02 X
GCA9680 0.45 0.26 0.19 0.02 X
GCA9681 0.31 0.16 0.15 0.03 X
GCA9682 2.21 0.63 1.58 1.13 0.23
GCA9683 3.1 0.81 2.29 2.61 0.31
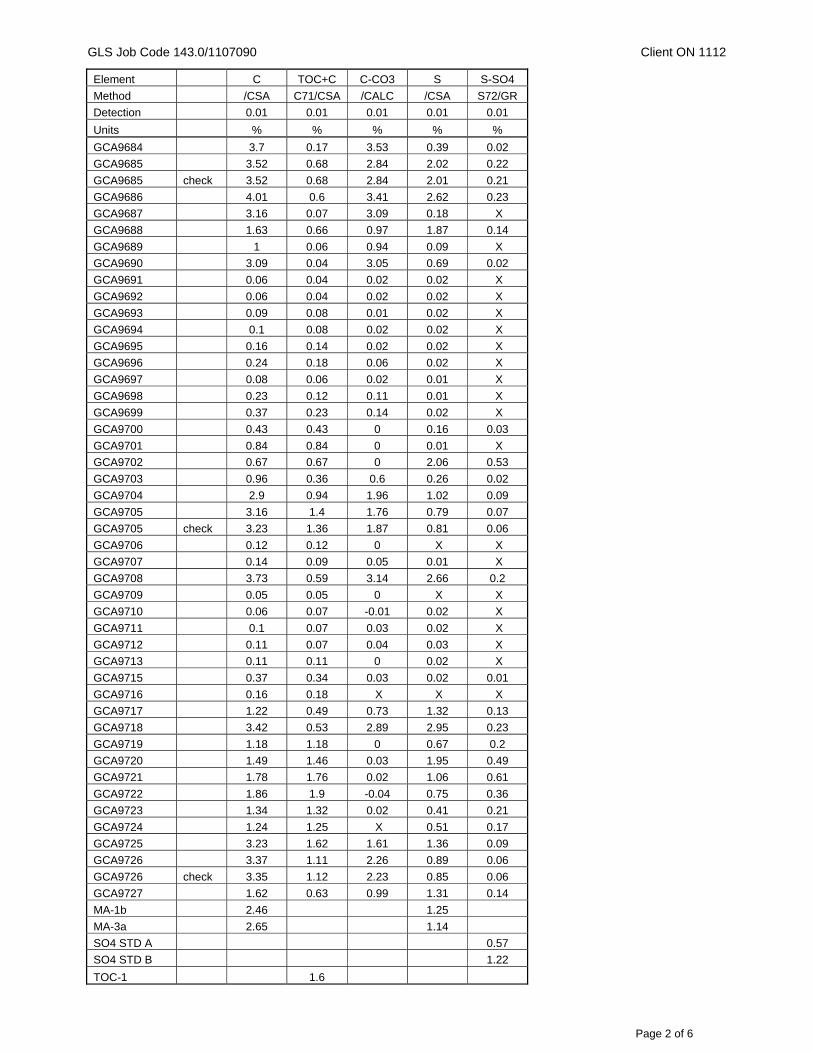
GLS Job Code 143.0/1107090 Client ON 1112
Page 2 of 6
Element C TOC+C C-CO3 S S-SO4
Method /CSA C71/CSA /CALC /CSA S72/GR
Detection 0.01 0.01 0.01 0.01 0.01
Units % % % % %
GCA9684 3.7 0.17 3.53 0.39 0.02
GCA9685 3.52 0.68 2.84 2.02 0.22
GCA9685 check 3.52 0.68 2.84 2.01 0.21
GCA9686 4.01 0.6 3.41 2.62 0.23
GCA9687 3.16 0.07 3.09 0.18 X
GCA9688 1.63 0.66 0.97 1.87 0.14
GCA9689 1 0.06 0.94 0.09 X
GCA9690 3.09 0.04 3.05 0.69 0.02
GCA9691 0.06 0.04 0.02 0.02 X
GCA9692 0.06 0.04 0.02 0.02 X
GCA9693 0.09 0.08 0.01 0.02 X
GCA9694 0.1 0.08 0.02 0.02 X
GCA9695 0.16 0.14 0.02 0.02 X
GCA9696 0.24 0.18 0.06 0.02 X
GCA9697 0.08 0.06 0.02 0.01 X
GCA9698 0.23 0.12 0.11 0.01 X
GCA9699 0.37 0.23 0.14 0.02 X
GCA9700 0.43 0.43 0 0.16 0.03
GCA9701 0.84 0.84 0 0.01 X
GCA9702 0.67 0.67 0 2.06 0.53
GCA9703 0.96 0.36 0.6 0.26 0.02
GCA9704 2.9 0.94 1.96 1.02 0.09
GCA9705 3.16 1.4 1.76 0.79 0.07
GCA9705 check 3.23 1.36 1.87 0.81 0.06
GCA9706 0.12 0.12 0 X X
GCA9707 0.14 0.09 0.05 0.01 X
GCA9708 3.73 0.59 3.14 2.66 0.2
GCA9709 0.05 0.05 0 X X
GCA9710 0.06 0.07 -0.01 0.02 X
GCA9711 0.1 0.07 0.03 0.02 X
GCA9712 0.11 0.07 0.04 0.03 X
GCA9713 0.11 0.11 0 0.02 X
GCA9715 0.37 0.34 0.03 0.02 0.01
GCA9716 0.16 0.18 X X X
GCA9717 1.22 0.49 0.73 1.32 0.13
GCA9718 3.42 0.53 2.89 2.95 0.23
GCA9719 1.18 1.18 0 0.67 0.2
GCA9720 1.49 1.46 0.03 1.95 0.49
GCA9721 1.78 1.76 0.02 1.06 0.61
GCA9722 1.86 1.9 -0.04 0.75 0.36
GCA9723 1.34 1.32 0.02 0.41 0.21
GCA9724 1.24 1.25 X 0.51 0.17
GCA9725 3.23 1.62 1.61 1.36 0.09
GCA9726 3.37 1.11 2.26 0.89 0.06
GCA9726 check 3.35 1.12 2.23 0.85 0.06
GCA9727 1.62 0.63 0.99 1.31 0.14
MA-1b 2.46 1.25
MA-3a 2.65 1.14
SO4 STD A 0.57
SO4 STD B 1.22
TOC-1 1.6
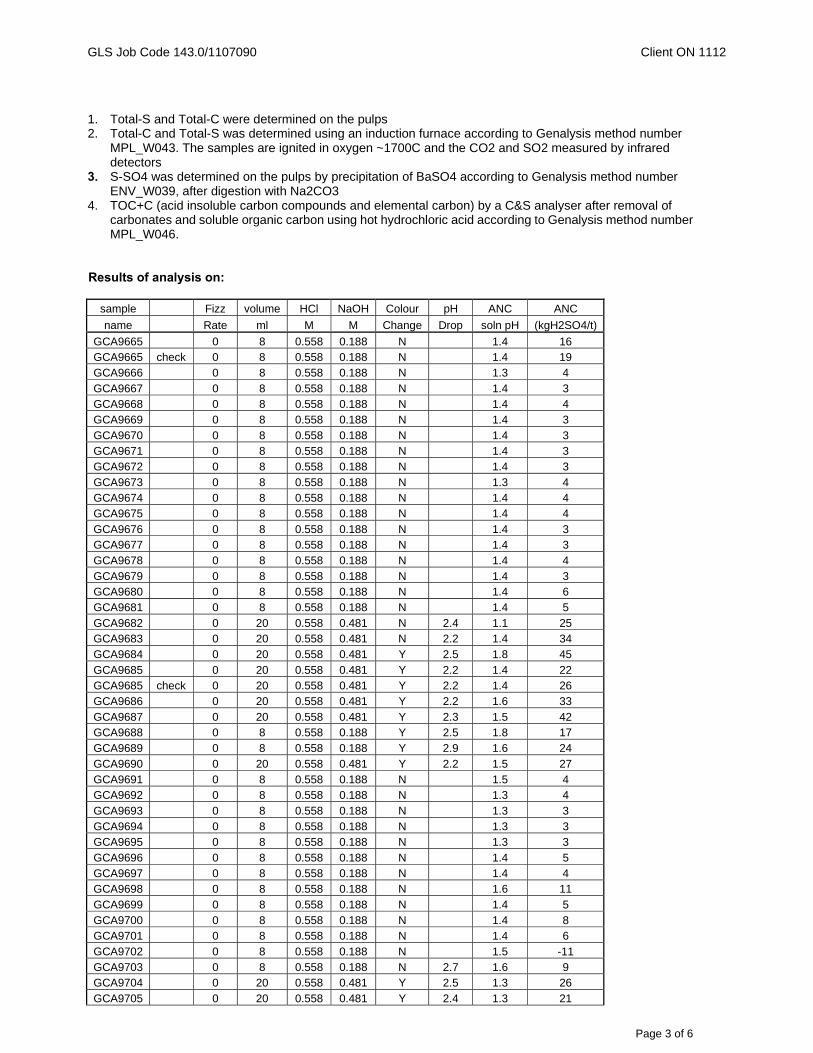
GLS Job Code 143.0/1107090 Client ON 1112
Page 3 of 6
1. Total-S and Total-C were determined on the pulps 2. Total-C and Total-S was determined using an induction furnace according to Genalysis method number
MPL_W043. The samples are ignited in oxygen ~1700C and the CO2 and SO2 measured by infrared detectors
3. S-SO4 was determined on the pulps by precipitation of BaSO4 according to Genalysis method number ENV_W039, after digestion with Na2CO3
4. TOC+C (acid insoluble carbon compounds and elemental carbon) by a C&S analyser after removal of carbonates and soluble organic carbon using hot hydrochloric acid according to Genalysis method number MPL_W046.
Results of analysis on:
sample Fizz volume HCl NaOH Colour pH ANC ANC
name Rate ml M M Change Drop soln pH (kgH2SO4/t)
GCA9665 0 8 0.558 0.188 N 1.4 16 GCA9665 check 0 8 0.558 0.188 N 1.4 19 GCA9666 0 8 0.558 0.188 N 1.3 4
GCA9667 0 8 0.558 0.188 N 1.4 3 GCA9668 0 8 0.558 0.188 N 1.4 4 GCA9669 0 8 0.558 0.188 N 1.4 3
GCA9670 0 8 0.558 0.188 N 1.4 3 GCA9671 0 8 0.558 0.188 N 1.4 3 GCA9672 0 8 0.558 0.188 N 1.4 3
GCA9673 0 8 0.558 0.188 N 1.3 4 GCA9674 0 8 0.558 0.188 N 1.4 4 GCA9675 0 8 0.558 0.188 N 1.4 4
GCA9676 0 8 0.558 0.188 N 1.4 3 GCA9677 0 8 0.558 0.188 N 1.4 3 GCA9678 0 8 0.558 0.188 N 1.4 4
GCA9679 0 8 0.558 0.188 N 1.4 3 GCA9680 0 8 0.558 0.188 N 1.4 6 GCA9681 0 8 0.558 0.188 N 1.4 5
GCA9682 0 20 0.558 0.481 N 2.4 1.1 25 GCA9683 0 20 0.558 0.481 N 2.2 1.4 34 GCA9684 0 20 0.558 0.481 Y 2.5 1.8 45
GCA9685 0 20 0.558 0.481 Y 2.2 1.4 22 GCA9685 check 0 20 0.558 0.481 Y 2.2 1.4 26 GCA9686 0 20 0.558 0.481 Y 2.2 1.6 33
GCA9687 0 20 0.558 0.481 Y 2.3 1.5 42 GCA9688 0 8 0.558 0.188 Y 2.5 1.8 17 GCA9689 0 8 0.558 0.188 Y 2.9 1.6 24
GCA9690 0 20 0.558 0.481 Y 2.2 1.5 27 GCA9691 0 8 0.558 0.188 N 1.5 4 GCA9692 0 8 0.558 0.188 N 1.3 4
GCA9693 0 8 0.558 0.188 N 1.3 3 GCA9694 0 8 0.558 0.188 N 1.3 3 GCA9695 0 8 0.558 0.188 N 1.3 3
GCA9696 0 8 0.558 0.188 N 1.4 5 GCA9697 0 8 0.558 0.188 N 1.4 4 GCA9698 0 8 0.558 0.188 N 1.6 11
GCA9699 0 8 0.558 0.188 N 1.4 5 GCA9700 0 8 0.558 0.188 N 1.4 8 GCA9701 0 8 0.558 0.188 N 1.4 6
GCA9702 0 8 0.558 0.188 N 1.5 -11 GCA9703 0 8 0.558 0.188 N 2.7 1.6 9 GCA9704 0 20 0.558 0.481 Y 2.5 1.3 26
GCA9705 0 20 0.558 0.481 Y 2.4 1.3 21
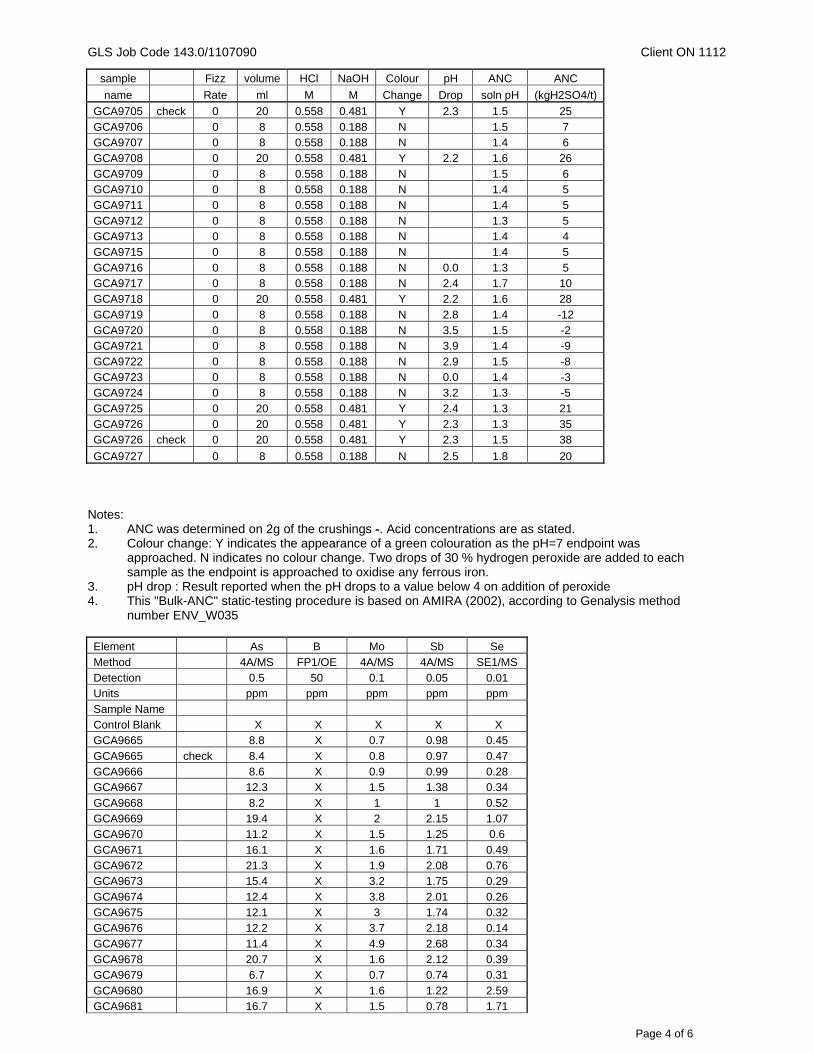
GLS Job Code 143.0/1107090 Client ON 1112
Page 4 of 6
sample Fizz volume HCl NaOH Colour pH ANC ANC
name Rate ml M M Change Drop soln pH (kgH2SO4/t)
GCA9705 check 0 20 0.558 0.481 Y 2.3 1.5 25
GCA9706 0 8 0.558 0.188 N 1.5 7 GCA9707 0 8 0.558 0.188 N 1.4 6 GCA9708 0 20 0.558 0.481 Y 2.2 1.6 26
GCA9709 0 8 0.558 0.188 N 1.5 6 GCA9710 0 8 0.558 0.188 N 1.4 5 GCA9711 0 8 0.558 0.188 N 1.4 5
GCA9712 0 8 0.558 0.188 N 1.3 5 GCA9713 0 8 0.558 0.188 N 1.4 4 GCA9715 0 8 0.558 0.188 N 1.4 5
GCA9716 0 8 0.558 0.188 N 0.0 1.3 5 GCA9717 0 8 0.558 0.188 N 2.4 1.7 10 GCA9718 0 20 0.558 0.481 Y 2.2 1.6 28
GCA9719 0 8 0.558 0.188 N 2.8 1.4 -12 GCA9720 0 8 0.558 0.188 N 3.5 1.5 -2 GCA9721 0 8 0.558 0.188 N 3.9 1.4 -9
GCA9722 0 8 0.558 0.188 N 2.9 1.5 -8 GCA9723 0 8 0.558 0.188 N 0.0 1.4 -3 GCA9724 0 8 0.558 0.188 N 3.2 1.3 -5
GCA9725 0 20 0.558 0.481 Y 2.4 1.3 21 GCA9726 0 20 0.558 0.481 Y 2.3 1.3 35 GCA9726 check 0 20 0.558 0.481 Y 2.3 1.5 38
GCA9727 0 8 0.558 0.188 N 2.5 1.8 20 Notes: 1. ANC was determined on 2g of the crushings -. Acid concentrations are as stated. 2. Colour change: Y indicates the appearance of a green colouration as the pH=7 endpoint was
approached. N indicates no colour change. Two drops of 30 % hydrogen peroxide are added to each sample as the endpoint is approached to oxidise any ferrous iron.
3. pH drop : Result reported when the pH drops to a value below 4 on addition of peroxide 4. This "Bulk-ANC" static-testing procedure is based on AMIRA (2002), according to Genalysis method
number ENV_W035 Element As B Mo Sb Se
Method 4A/MS FP1/OE 4A/MS 4A/MS SE1/MS Detection 0.5 50 0.1 0.05 0.01 Units ppm ppm ppm ppm ppm
Sample Name Control Blank X X X X X GCA9665 8.8 X 0.7 0.98 0.45
GCA9665 check 8.4 X 0.8 0.97 0.47 GCA9666 8.6 X 0.9 0.99 0.28 GCA9667 12.3 X 1.5 1.38 0.34
GCA9668 8.2 X 1 1 0.52 GCA9669 19.4 X 2 2.15 1.07 GCA9670 11.2 X 1.5 1.25 0.6
GCA9671 16.1 X 1.6 1.71 0.49 GCA9672 21.3 X 1.9 2.08 0.76 GCA9673 15.4 X 3.2 1.75 0.29
GCA9674 12.4 X 3.8 2.01 0.26 GCA9675 12.1 X 3 1.74 0.32 GCA9676 12.2 X 3.7 2.18 0.14
GCA9677 11.4 X 4.9 2.68 0.34 GCA9678 20.7 X 1.6 2.12 0.39 GCA9679 6.7 X 0.7 0.74 0.31
GCA9680 16.9 X 1.6 1.22 2.59 GCA9681 16.7 X 1.5 0.78 1.71
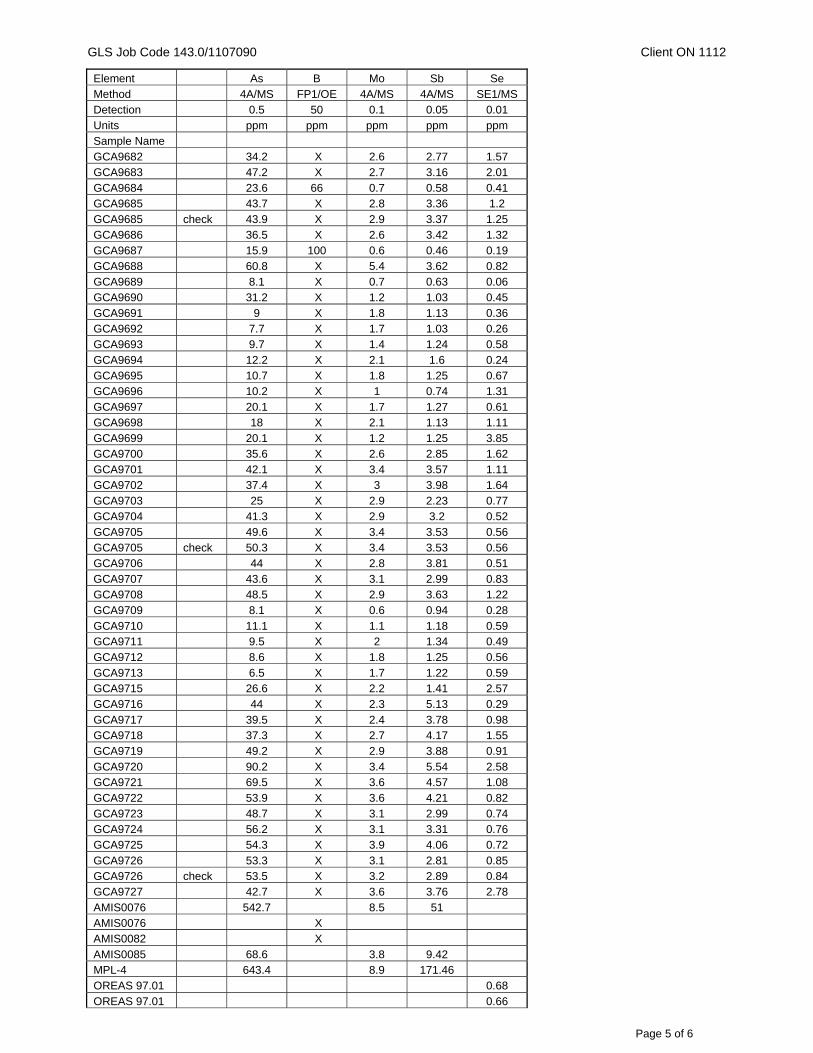
GLS Job Code 143.0/1107090 Client ON 1112
Page 5 of 6
Element As B Mo Sb Se Method 4A/MS FP1/OE 4A/MS 4A/MS SE1/MS Detection 0.5 50 0.1 0.05 0.01 Units ppm ppm ppm ppm ppm Sample Name GCA9682 34.2 X 2.6 2.77 1.57 GCA9683 47.2 X 2.7 3.16 2.01 GCA9684 23.6 66 0.7 0.58 0.41 GCA9685 43.7 X 2.8 3.36 1.2 GCA9685 check 43.9 X 2.9 3.37 1.25 GCA9686 36.5 X 2.6 3.42 1.32 GCA9687 15.9 100 0.6 0.46 0.19 GCA9688 60.8 X 5.4 3.62 0.82 GCA9689 8.1 X 0.7 0.63 0.06 GCA9690 31.2 X 1.2 1.03 0.45 GCA9691 9 X 1.8 1.13 0.36 GCA9692 7.7 X 1.7 1.03 0.26 GCA9693 9.7 X 1.4 1.24 0.58 GCA9694 12.2 X 2.1 1.6 0.24 GCA9695 10.7 X 1.8 1.25 0.67 GCA9696 10.2 X 1 0.74 1.31 GCA9697 20.1 X 1.7 1.27 0.61 GCA9698 18 X 2.1 1.13 1.11 GCA9699 20.1 X 1.2 1.25 3.85 GCA9700 35.6 X 2.6 2.85 1.62 GCA9701 42.1 X 3.4 3.57 1.11 GCA9702 37.4 X 3 3.98 1.64 GCA9703 25 X 2.9 2.23 0.77 GCA9704 41.3 X 2.9 3.2 0.52 GCA9705 49.6 X 3.4 3.53 0.56 GCA9705 check 50.3 X 3.4 3.53 0.56 GCA9706 44 X 2.8 3.81 0.51 GCA9707 43.6 X 3.1 2.99 0.83 GCA9708 48.5 X 2.9 3.63 1.22 GCA9709 8.1 X 0.6 0.94 0.28
GCA9710 11.1 X 1.1 1.18 0.59 GCA9711 9.5 X 2 1.34 0.49 GCA9712 8.6 X 1.8 1.25 0.56
GCA9713 6.5 X 1.7 1.22 0.59 GCA9715 26.6 X 2.2 1.41 2.57 GCA9716 44 X 2.3 5.13 0.29
GCA9717 39.5 X 2.4 3.78 0.98 GCA9718 37.3 X 2.7 4.17 1.55 GCA9719 49.2 X 2.9 3.88 0.91
GCA9720 90.2 X 3.4 5.54 2.58 GCA9721 69.5 X 3.6 4.57 1.08 GCA9722 53.9 X 3.6 4.21 0.82
GCA9723 48.7 X 3.1 2.99 0.74 GCA9724 56.2 X 3.1 3.31 0.76 GCA9725 54.3 X 3.9 4.06 0.72
GCA9726 53.3 X 3.1 2.81 0.85 GCA9726 check 53.5 X 3.2 2.89 0.84 GCA9727 42.7 X 3.6 3.76 2.78
AMIS0076 542.7 8.5 51 AMIS0076 X AMIS0082 X
AMIS0085 68.6 3.8 9.42 MPL-4 643.4 8.9 171.46 OREAS 97.01 0.68
OREAS 97.01 0.66
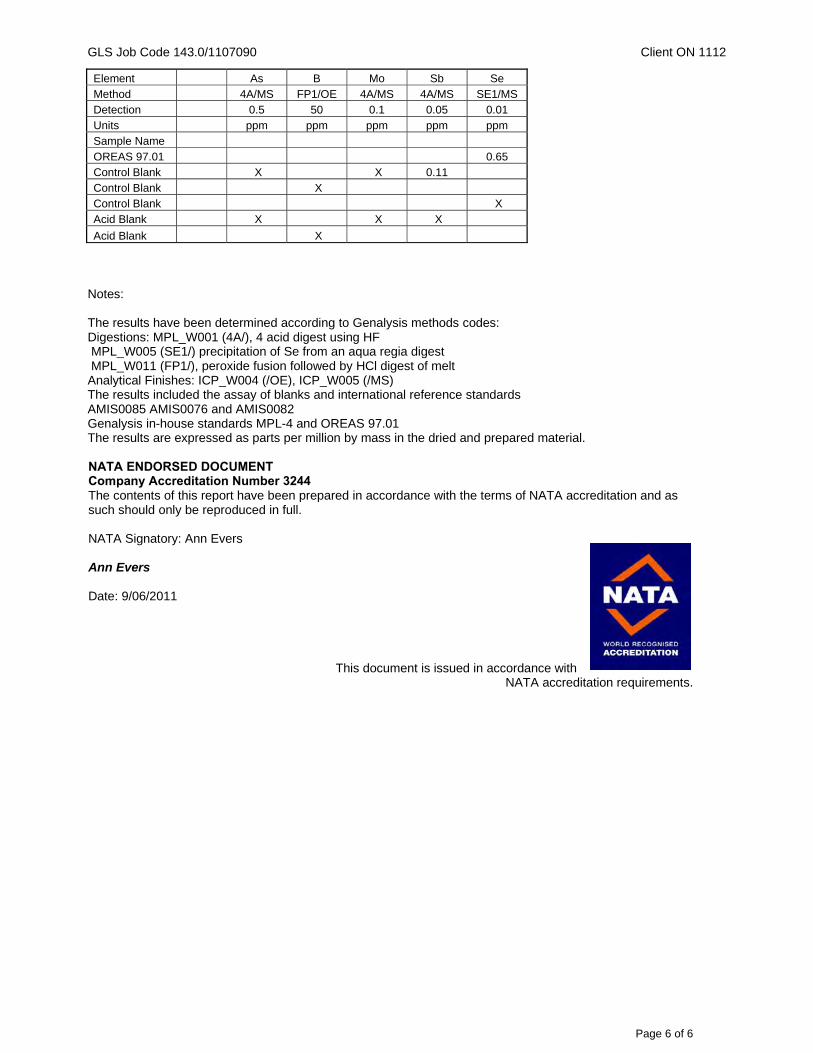
GLS Job Code 143.0/1107090 Client ON 1112
Page 6 of 6
Element As B Mo Sb Se Method 4A/MS FP1/OE 4A/MS 4A/MS SE1/MS Detection 0.5 50 0.1 0.05 0.01 Units ppm ppm ppm ppm ppm Sample Name OREAS 97.01 0.65 Control Blank X X 0.11 Control Blank X Control Blank X Acid Blank X X X
Acid Blank X Notes: The results have been determined according to Genalysis methods codes: Digestions: MPL_W001 (4A/), 4 acid digest using HF MPL_W005 (SE1/) precipitation of Se from an aqua regia digest MPL_W011 (FP1/), peroxide fusion followed by HCl digest of melt Analytical Finishes: ICP_W004 (/OE), ICP_W005 (/MS) The results included the assay of blanks and international reference standards AMIS0085 AMIS0076 and AMIS0082 Genalysis in-house standards MPL-4 and OREAS 97.01 The results are expressed as parts per million by mass in the dried and prepared material. NATA ENDORSED DOCUMENT Company Accreditation Number 3244 The contents of this report have been prepared in accordance with the terms of NATA accreditation and as such should only be reproduced in full. NATA Signatory: Ann Evers Ann Evers Date: 9/06/2011
This document is issued in accordance with NATA accreditation requirements.
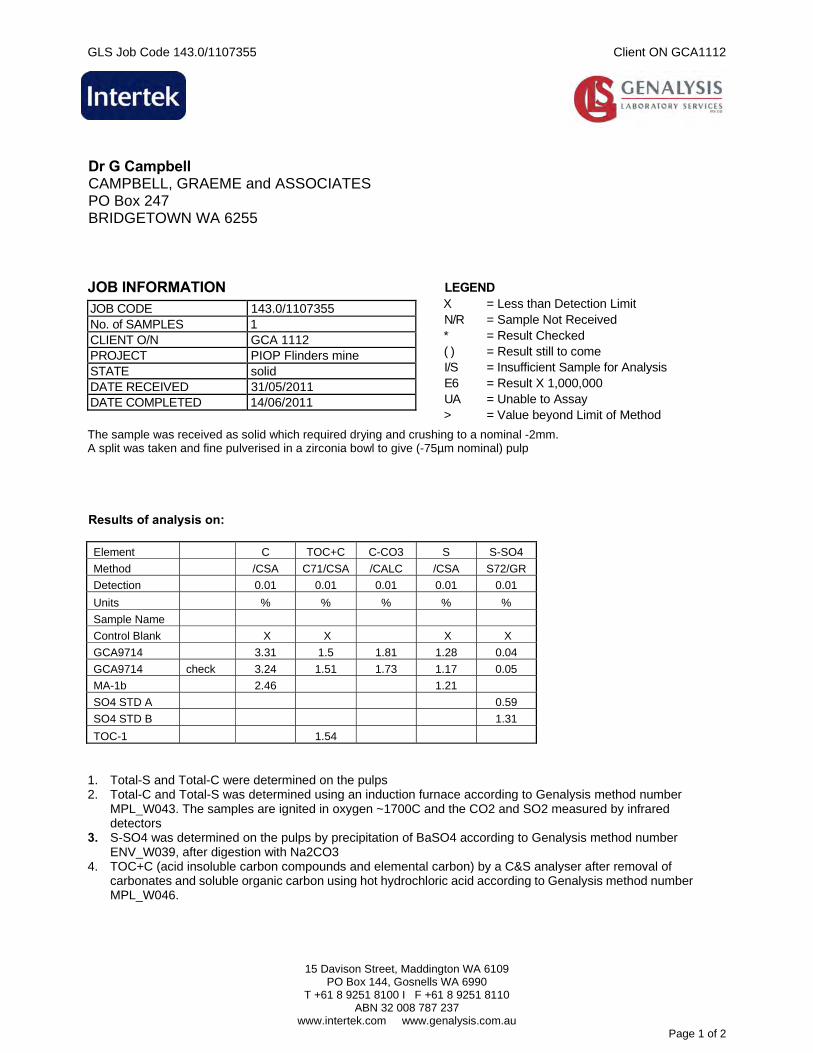
GLS Job Code 143.0/1107355 Client ON GCA1112
15 Davison Street, Maddington WA 6109
PO Box 144, Gosnells WA 6990 T +61 8 9251 8100 I F +61 8 9251 8110
ABN 32 008 787 237 www.intertek.com www.genalysis.com.au
Page 1 of 2
Dr G Campbell CAMPBELL, GRAEME and ASSOCIATES PO Box 247 BRIDGETOWN WA 6255 JOB INFORMATION
JOB CODE 143.0/1107355 No. of SAMPLES 1 CLIENT O/N GCA 1112 PROJECT PIOP Flinders mine STATE solid DATE RECEIVED 31/05/2011 DATE COMPLETED 14/06/2011
LEGEND X = Less than Detection Limit N/R = Sample Not Received * = Result Checked ( ) = Result still to come I/S = Insufficient Sample for Analysis E6 = Result X 1,000,000 UA = Unable to Assay > = Value beyond Limit of Method
The sample was received as solid which required drying and crushing to a nominal -2mm. A split was taken and fine pulverised in a zirconia bowl to give (-75µm nominal) pulp Results of analysis on: Element C TOC+C C-CO3 S S-SO4
Method /CSA C71/CSA /CALC /CSA S72/GR
Detection 0.01 0.01 0.01 0.01 0.01
Units % % % % %
Sample Name
Control Blank X X X X
GCA9714 3.31 1.5 1.81 1.28 0.04
GCA9714 check 3.24 1.51 1.73 1.17 0.05
MA-1b 2.46 1.21
SO4 STD A 0.59
SO4 STD B 1.31
TOC-1 1.54 1. Total-S and Total-C were determined on the pulps 2. Total-C and Total-S was determined using an induction furnace according to Genalysis method number
MPL_W043. The samples are ignited in oxygen ~1700C and the CO2 and SO2 measured by infrared detectors
3. S-SO4 was determined on the pulps by precipitation of BaSO4 according to Genalysis method number ENV_W039, after digestion with Na2CO3
4. TOC+C (acid insoluble carbon compounds and elemental carbon) by a C&S analyser after removal of carbonates and soluble organic carbon using hot hydrochloric acid according to Genalysis method number MPL_W046.
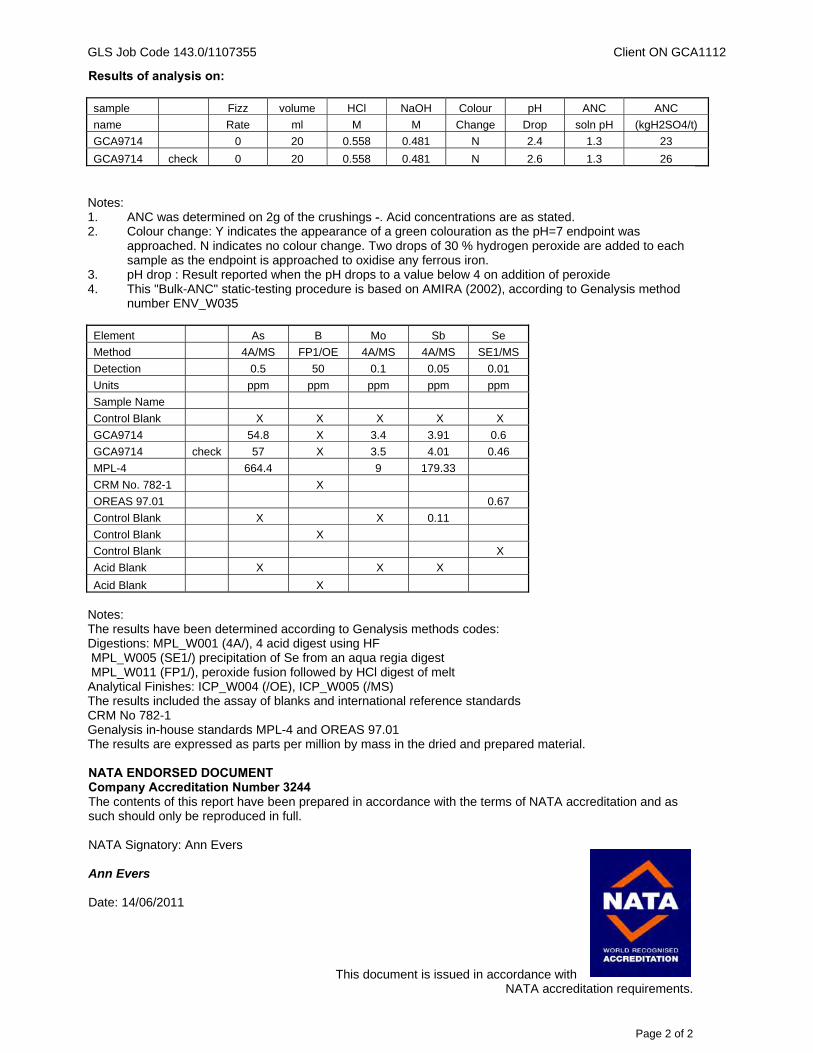
GLS Job Code 143.0/1107355 Client ON GCA1112
Page 2 of 2
Results of analysis on: sample Fizz volume HCl NaOH Colour pH ANC ANC
name Rate ml M M Change Drop soln pH (kgH2SO4/t)
GCA9714 0 20 0.558 0.481 N 2.4 1.3 23
GCA9714 check 0 20 0.558 0.481 N 2.6 1.3 26 Notes: 1. ANC was determined on 2g of the crushings -. Acid concentrations are as stated. 2. Colour change: Y indicates the appearance of a green colouration as the pH=7 endpoint was
approached. N indicates no colour change. Two drops of 30 % hydrogen peroxide are added to each sample as the endpoint is approached to oxidise any ferrous iron.
3. pH drop : Result reported when the pH drops to a value below 4 on addition of peroxide 4. This "Bulk-ANC" static-testing procedure is based on AMIRA (2002), according to Genalysis method
number ENV_W035 Element As B Mo Sb Se
Method 4A/MS FP1/OE 4A/MS 4A/MS SE1/MS
Detection 0.5 50 0.1 0.05 0.01
Units ppm ppm ppm ppm ppm
Sample Name
Control Blank X X X X X
GCA9714 54.8 X 3.4 3.91 0.6
GCA9714 check 57 X 3.5 4.01 0.46
MPL-4 664.4 9 179.33
CRM No. 782-1 X
OREAS 97.01 0.67
Control Blank X X 0.11
Control Blank X
Control Blank X
Acid Blank X X X
Acid Blank X Notes: The results have been determined according to Genalysis methods codes: Digestions: MPL_W001 (4A/), 4 acid digest using HF MPL_W005 (SE1/) precipitation of Se from an aqua regia digest MPL_W011 (FP1/), peroxide fusion followed by HCl digest of melt Analytical Finishes: ICP_W004 (/OE), ICP_W005 (/MS) The results included the assay of blanks and international reference standards CRM No 782-1 Genalysis in-house standards MPL-4 and OREAS 97.01 The results are expressed as parts per million by mass in the dried and prepared material. NATA ENDORSED DOCUMENT Company Accreditation Number 3244 The contents of this report have been prepared in accordance with the terms of NATA accreditation and as such should only be reproduced in full. NATA Signatory: Ann Evers Ann Evers Date: 14/06/2011
This document is issued in accordance with NATA accreditation requirements.
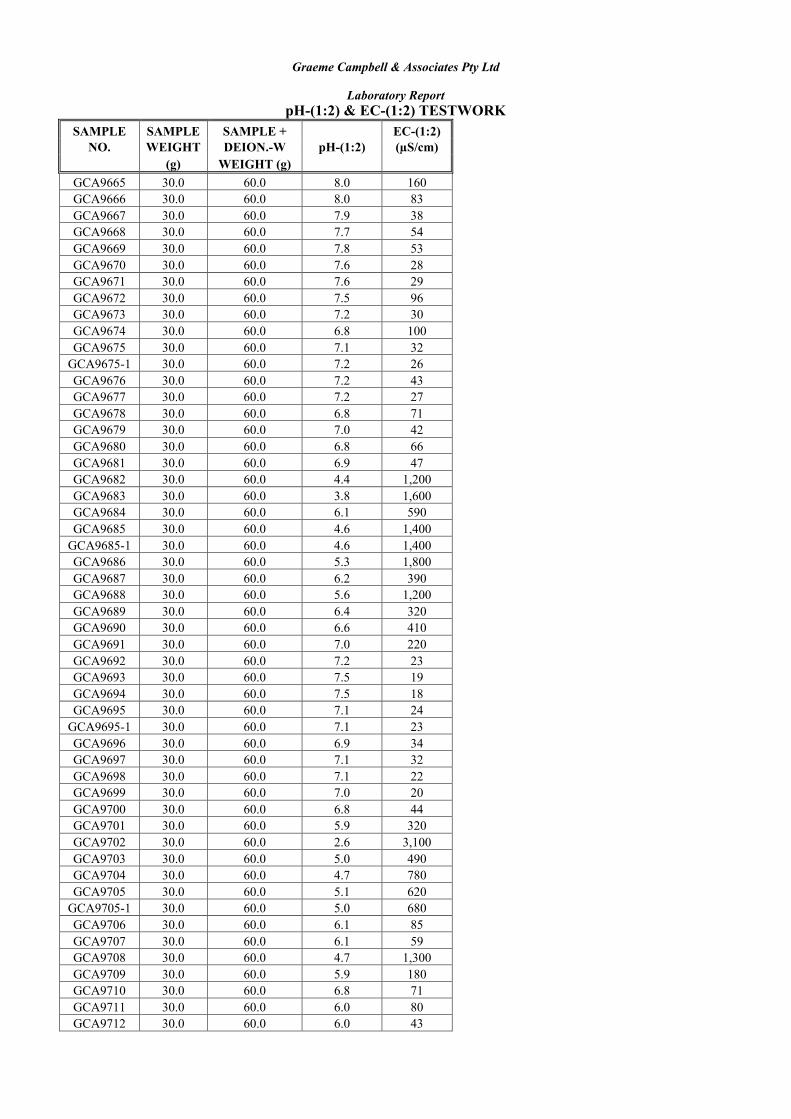
Graeme Campbell & Associates Pty Ltd
Laboratory Report pH-(1:2) & EC-(1:2) TESTWORK
SAMPLE SAMPLE SAMPLE + EC-(1:2) NO. WEIGHT DEION.-W pH-(1:2) (µS/cm)
(g) WEIGHT (g) GCA9665 30.0 60.0 8.0 160 GCA9666 30.0 60.0 8.0 83 GCA9667 30.0 60.0 7.9 38 GCA9668 30.0 60.0 7.7 54 GCA9669 30.0 60.0 7.8 53 GCA9670 30.0 60.0 7.6 28 GCA9671 30.0 60.0 7.6 29 GCA9672 30.0 60.0 7.5 96 GCA9673 30.0 60.0 7.2 30 GCA9674 30.0 60.0 6.8 100 GCA9675 30.0 60.0 7.1 32
GCA9675-1 30.0 60.0 7.2 26 GCA9676 30.0 60.0 7.2 43 GCA9677 30.0 60.0 7.2 27 GCA9678 30.0 60.0 6.8 71 GCA9679 30.0 60.0 7.0 42 GCA9680 30.0 60.0 6.8 66 GCA9681 30.0 60.0 6.9 47 GCA9682 30.0 60.0 4.4 1,200 GCA9683 30.0 60.0 3.8 1,600 GCA9684 30.0 60.0 6.1 590 GCA9685 30.0 60.0 4.6 1,400
GCA9685-1 30.0 60.0 4.6 1,400 GCA9686 30.0 60.0 5.3 1,800 GCA9687 30.0 60.0 6.2 390 GCA9688 30.0 60.0 5.6 1,200 GCA9689 30.0 60.0 6.4 320 GCA9690 30.0 60.0 6.6 410 GCA9691 30.0 60.0 7.0 220 GCA9692 30.0 60.0 7.2 23 GCA9693 30.0 60.0 7.5 19 GCA9694 30.0 60.0 7.5 18 GCA9695 30.0 60.0 7.1 24
GCA9695-1 30.0 60.0 7.1 23 GCA9696 30.0 60.0 6.9 34 GCA9697 30.0 60.0 7.1 32 GCA9698 30.0 60.0 7.1 22 GCA9699 30.0 60.0 7.0 20 GCA9700 30.0 60.0 6.8 44 GCA9701 30.0 60.0 5.9 320 GCA9702 30.0 60.0 2.6 3,100 GCA9703 30.0 60.0 5.0 490 GCA9704 30.0 60.0 4.7 780 GCA9705 30.0 60.0 5.1 620
GCA9705-1 30.0 60.0 5.0 680 GCA9706 30.0 60.0 6.1 85 GCA9707 30.0 60.0 6.1 59 GCA9708 30.0 60.0 4.7 1,300 GCA9709 30.0 60.0 5.9 180 GCA9710 30.0 60.0 6.8 71 GCA9711 30.0 60.0 6.0 80 GCA9712 30.0 60.0 6.0 43
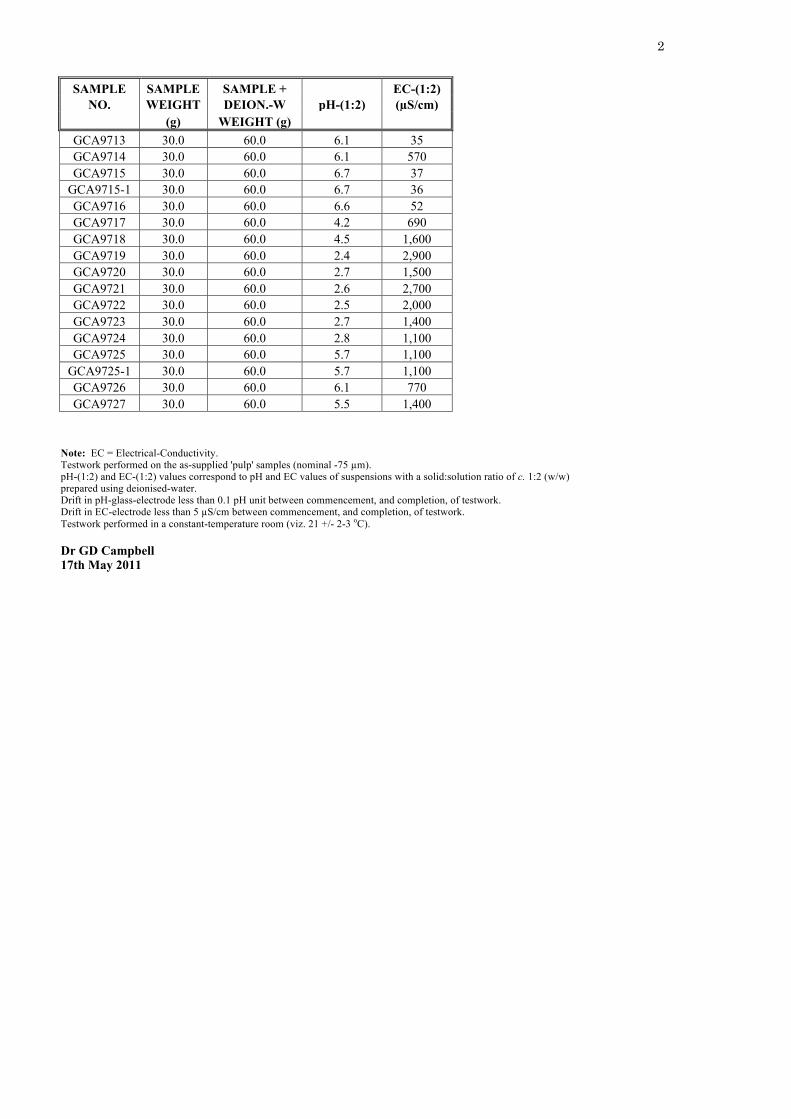
2
SAMPLE SAMPLE SAMPLE + EC-(1:2)
NO. WEIGHT DEION.-W pH-(1:2) (µS/cm) (g) WEIGHT (g)
GCA9713 30.0 60.0 6.1 35 GCA9714 30.0 60.0 6.1 570 GCA9715 30.0 60.0 6.7 37
GCA9715-1 30.0 60.0 6.7 36 GCA9716 30.0 60.0 6.6 52 GCA9717 30.0 60.0 4.2 690 GCA9718 30.0 60.0 4.5 1,600 GCA9719 30.0 60.0 2.4 2,900 GCA9720 30.0 60.0 2.7 1,500 GCA9721 30.0 60.0 2.6 2,700 GCA9722 30.0 60.0 2.5 2,000 GCA9723 30.0 60.0 2.7 1,400 GCA9724 30.0 60.0 2.8 1,100 GCA9725 30.0 60.0 5.7 1,100
GCA9725-1 30.0 60.0 5.7 1,100 GCA9726 30.0 60.0 6.1 770 GCA9727 30.0 60.0 5.5 1,400
Note: EC = Electrical-Conductivity. Testwork performed on the as-supplied 'pulp' samples (nominal -75 µm). pH-(1:2) and EC-(1:2) values correspond to pH and EC values of suspensions with a solid:solution ratio of c. 1:2 (w/w) prepared using deionised-water. Drift in pH-glass-electrode less than 0.1 pH unit between commencement, and completion, of testwork. Drift in EC-electrode less than 5 µS/cm between commencement, and completion, of testwork. Testwork performed in a constant-temperature room (viz. 21 +/- 2-3 oC). Dr GD Campbell 17th May 2011
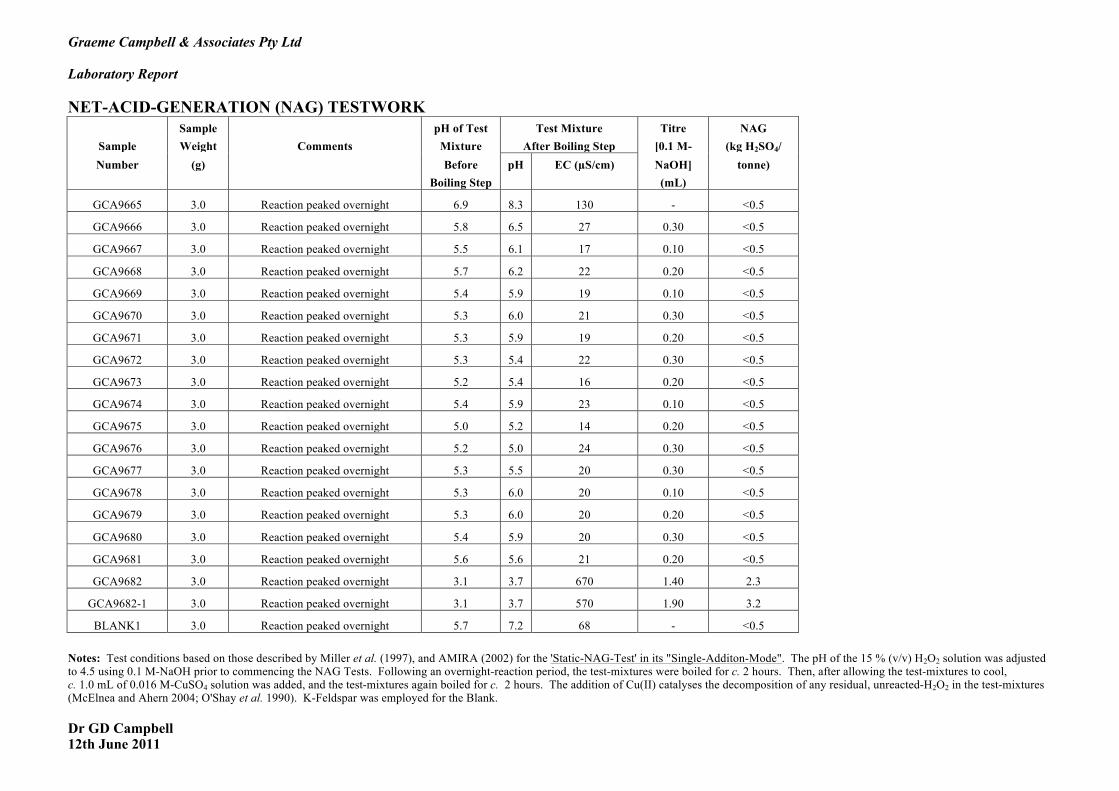
Graeme Campbell & Associates Pty Ltd Laboratory Report NET-ACID-GENERATION (NAG) TESTWORK Sample pH of Test Test Mixture Titre NAG
Sample Weight Comments Mixture After Boiling Step [0.1 M- (kg H2SO4/ Number (g) Before pH EC (µS/cm) NaOH] tonne)
Boiling Step (mL)
GCA9665 3.0 Reaction peaked overnight 6.9 8.3 130 - <0.5
GCA9666 3.0 Reaction peaked overnight 5.8 6.5 27 0.30 <0.5
GCA9667 3.0 Reaction peaked overnight 5.5 6.1 17 0.10 <0.5
GCA9668 3.0 Reaction peaked overnight 5.7 6.2 22 0.20 <0.5
GCA9669 3.0 Reaction peaked overnight 5.4 5.9 19 0.10 <0.5
GCA9670 3.0 Reaction peaked overnight 5.3 6.0 21 0.30 <0.5
GCA9671 3.0 Reaction peaked overnight 5.3 5.9 19 0.20 <0.5
GCA9672 3.0 Reaction peaked overnight 5.3 5.4 22 0.30 <0.5
GCA9673 3.0 Reaction peaked overnight 5.2 5.4 16 0.20 <0.5
GCA9674 3.0 Reaction peaked overnight 5.4 5.9 23 0.10 <0.5
GCA9675 3.0 Reaction peaked overnight 5.0 5.2 14 0.20 <0.5
GCA9676 3.0 Reaction peaked overnight 5.2 5.0 24 0.30 <0.5
GCA9677 3.0 Reaction peaked overnight 5.3 5.5 20 0.30 <0.5
GCA9678 3.0 Reaction peaked overnight 5.3 6.0 20 0.10 <0.5
GCA9679 3.0 Reaction peaked overnight 5.3 6.0 20 0.20 <0.5
GCA9680 3.0 Reaction peaked overnight 5.4 5.9 20 0.30 <0.5
GCA9681 3.0 Reaction peaked overnight 5.6 5.6 21 0.20 <0.5
GCA9682 3.0 Reaction peaked overnight 3.1 3.7 670 1.40 2.3
GCA9682-1 3.0 Reaction peaked overnight 3.1 3.7 570 1.90 3.2
BLANK1 3.0 Reaction peaked overnight 5.7 7.2 68 - <0.5 Notes: Test conditions based on those described by Miller et al. (1997), and AMIRA (2002) for the 'Static-NAG-Test' in its "Single-Additon-Mode". The pH of the 15 % (v/v) H2O2 solution was adjusted to 4.5 using 0.1 M-NaOH prior to commencing the NAG Tests. Following an overnight-reaction period, the test-mixtures were boiled for c. 2 hours. Then, after allowing the test-mixtures to cool, c. 1.0 mL of 0.016 M-CuSO4 solution was added, and the test-mixtures again boiled for c. 2 hours. The addition of Cu(II) catalyses the decomposition of any residual, unreacted-H2O2 in the test-mixtures (McElnea and Ahern 2004; O'Shay et al. 1990). K-Feldspar was employed for the Blank. Dr GD Campbell 12th June 2011
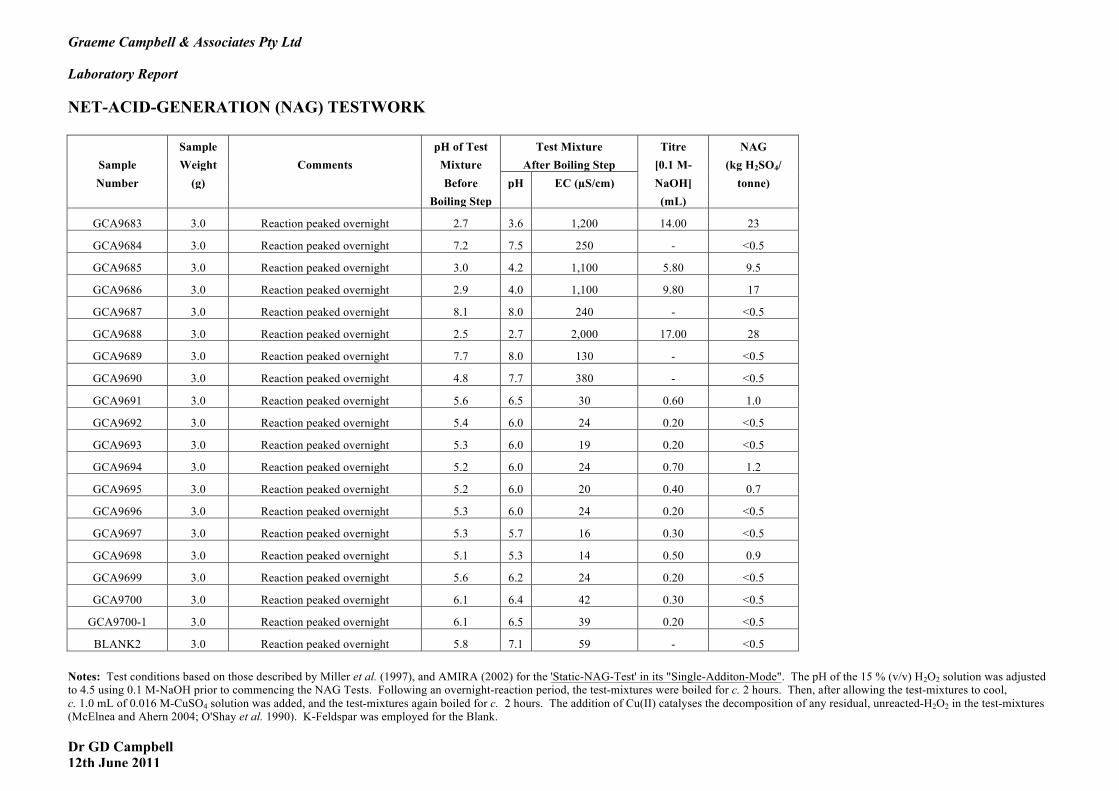
Graeme Campbell & Associates Pty Ltd Laboratory Report NET-ACID-GENERATION (NAG) TESTWORK Sample pH of Test Test Mixture Titre NAG
Sample Weight Comments Mixture After Boiling Step [0.1 M- (kg H2SO4/ Number (g) Before pH EC (µS/cm) NaOH] tonne)
Boiling Step (mL)
GCA9683 3.0 Reaction peaked overnight 2.7 3.6 1,200 14.00 23
GCA9684 3.0 Reaction peaked overnight 7.2 7.5 250 - <0.5
GCA9685 3.0 Reaction peaked overnight 3.0 4.2 1,100 5.80 9.5
GCA9686 3.0 Reaction peaked overnight 2.9 4.0 1,100 9.80 17
GCA9687 3.0 Reaction peaked overnight 8.1 8.0 240 - <0.5
GCA9688 3.0 Reaction peaked overnight 2.5 2.7 2,000 17.00 28
GCA9689 3.0 Reaction peaked overnight 7.7 8.0 130 - <0.5
GCA9690 3.0 Reaction peaked overnight 4.8 7.7 380 - <0.5
GCA9691 3.0 Reaction peaked overnight 5.6 6.5 30 0.60 1.0
GCA9692 3.0 Reaction peaked overnight 5.4 6.0 24 0.20 <0.5
GCA9693 3.0 Reaction peaked overnight 5.3 6.0 19 0.20 <0.5
GCA9694 3.0 Reaction peaked overnight 5.2 6.0 24 0.70 1.2
GCA9695 3.0 Reaction peaked overnight 5.2 6.0 20 0.40 0.7
GCA9696 3.0 Reaction peaked overnight 5.3 6.0 24 0.20 <0.5
GCA9697 3.0 Reaction peaked overnight 5.3 5.7 16 0.30 <0.5
GCA9698 3.0 Reaction peaked overnight 5.1 5.3 14 0.50 0.9
GCA9699 3.0 Reaction peaked overnight 5.6 6.2 24 0.20 <0.5
GCA9700 3.0 Reaction peaked overnight 6.1 6.4 42 0.30 <0.5
GCA9700-1 3.0 Reaction peaked overnight 6.1 6.5 39 0.20 <0.5
BLANK2 3.0 Reaction peaked overnight 5.8 7.1 59 - <0.5 Notes: Test conditions based on those described by Miller et al. (1997), and AMIRA (2002) for the 'Static-NAG-Test' in its "Single-Additon-Mode". The pH of the 15 % (v/v) H2O2 solution was adjusted to 4.5 using 0.1 M-NaOH prior to commencing the NAG Tests. Following an overnight-reaction period, the test-mixtures were boiled for c. 2 hours. Then, after allowing the test-mixtures to cool, c. 1.0 mL of 0.016 M-CuSO4 solution was added, and the test-mixtures again boiled for c. 2 hours. The addition of Cu(II) catalyses the decomposition of any residual, unreacted-H2O2 in the test-mixtures (McElnea and Ahern 2004; O'Shay et al. 1990). K-Feldspar was employed for the Blank. Dr GD Campbell 12th June 2011

Graeme Campbell & Associates Pty Ltd Laboratory Report NET-ACID-GENERATION (NAG) TESTWORK Sample pH of Test Test Mixture Titre NAG
Sample Weight Comments Mixture After Boiling Step [0.1 M- (kg H2SO4/ Number (g) Before pH EC (µS/cm) NaOH] tonne)
Boiling Step (mL)
GCA9701 3.0 Reaction peaked overnight 4.7 5.0 120 0.10 <0.5
GCA9702 3.0 Reaction peaked overnight 2.3 2.4 2,600 29.90 49
GCA9703 3.0 Reaction peaked overnight 4.8 5.9 190 0.70 1.2
GCA9704 3.0 Reaction peaked overnight 3.5 5.1 480 0.80 1.4
GCA9705 3.0 Reaction peaked overnight 3.5 5.6 490 0.90 1.5
GCA9706 3.0 Reaction peaked overnight 6.4 6.9 62 - <0.5
GCA9707 3.0 Reaction peaked overnight 8.4 7.9 38 - <0.5
GCA9708 3.0 Reaction peaked overnight 3.0 3.8 1,100 9.90 17
GCA9709 3.0 Reaction peaked overnight 6.0 6.0 39 0.70 1.2
GCA9710 3.0 Reaction peaked overnight 5.8 6.5 35 0.10 <0.5
GCA9711 3.0 Reaction peaked overnight 5.3 5.8 19 0.20 <0.5
GCA9712 3.0 Reaction peaked overnight 5.2 5.5 20 0.30 <0.5
GCA9713 3.0 Reaction peaked overnight 5.1 5.6 19 0.30 <0.5
GCA9714 3.0 Reaction peaked overnight 2.9 3.7 690 7.10 12
GCA9715 3.0 Reaction peaked overnight 5.2 5.3 22 0.30 <0.5
GCA9716 3.0 Reaction peaked overnight 7.4 6.7 31 0.20 <0.5
GCA9717 3.0 Reaction peaked overnight 2.7 2.9 1,200 11.80 20
GCA9718 3.0 Reaction peaked overnight 2.6 3.5 1,300 16.70 28
GCA9718-1 3.0 Reaction peaked overnight 2.6 3.6 1,300 16.50 27
BLANK3 3.0 Reaction peaked overnight 5.8 7.2 69 - <0.5 Notes: Test conditions based on those described by Miller et al. (1997), and AMIRA (2002) for the 'Static-NAG-Test' in its "Single-Additon-Mode". The pH of the 15 % (v/v) H2O2 solution was adjusted to 4.5 using 0.1 M-NaOH prior to commencing the NAG Tests. Following an overnight-reaction period, the test-mixtures were boiled for c. 2 hours. Then, after allowing the test-mixtures to cool, c. 1.0 mL of 0.016 M-CuSO4 solution was added, and the test-mixtures again boiled for c. 2 hours. The addition of Cu(II) catalyses the decomposition of any residual, unreacted-H2O2 in the test-mixtures (McElnea and Ahern 2004; O'Shay et al. 1990). K-Feldspar was employed for the Blank. Dr GD Campbell 12th June 2011
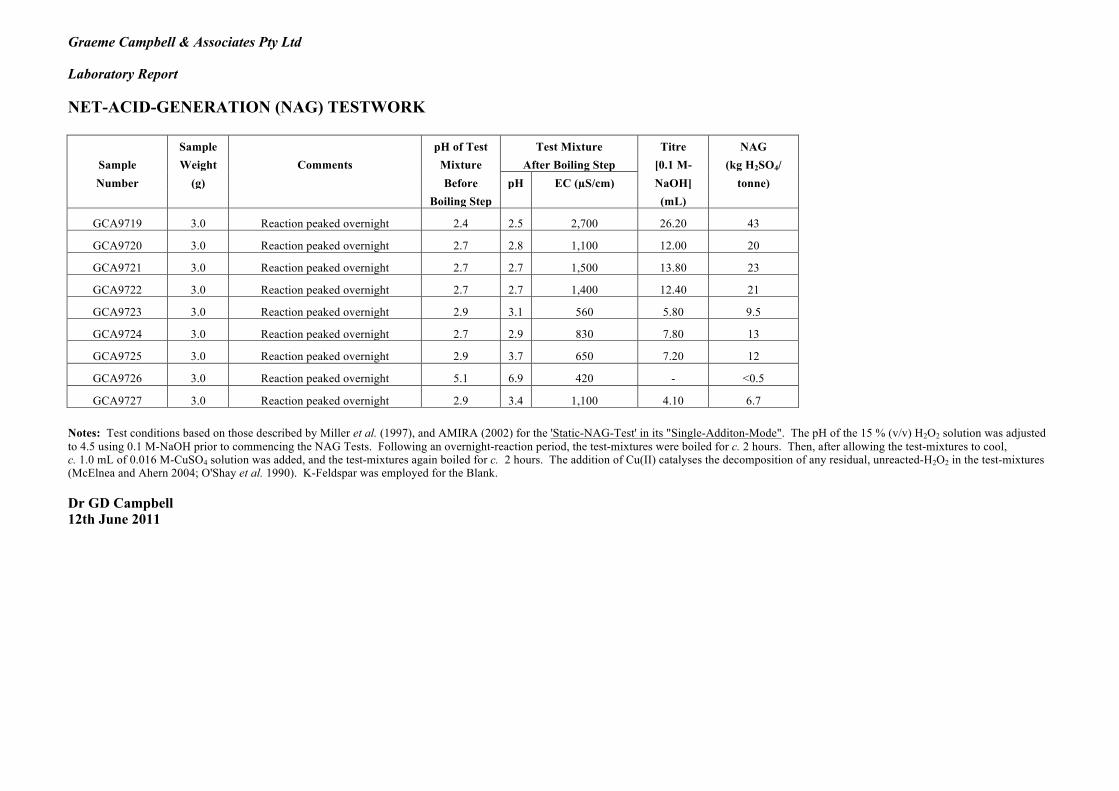
Graeme Campbell & Associates Pty Ltd Laboratory Report NET-ACID-GENERATION (NAG) TESTWORK Sample pH of Test Test Mixture Titre NAG
Sample Weight Comments Mixture After Boiling Step [0.1 M- (kg H2SO4/ Number (g) Before pH EC (µS/cm) NaOH] tonne)
Boiling Step (mL)
GCA9719 3.0 Reaction peaked overnight 2.4 2.5 2,700 26.20 43
GCA9720 3.0 Reaction peaked overnight 2.7 2.8 1,100 12.00 20
GCA9721 3.0 Reaction peaked overnight 2.7 2.7 1,500 13.80 23
GCA9722 3.0 Reaction peaked overnight 2.7 2.7 1,400 12.40 21
GCA9723 3.0 Reaction peaked overnight 2.9 3.1 560 5.80 9.5
GCA9724 3.0 Reaction peaked overnight 2.7 2.9 830 7.80 13
GCA9725 3.0 Reaction peaked overnight 2.9 3.7 650 7.20 12
GCA9726 3.0 Reaction peaked overnight 5.1 6.9 420 - <0.5
GCA9727 3.0 Reaction peaked overnight 2.9 3.4 1,100 4.10 6.7 Notes: Test conditions based on those described by Miller et al. (1997), and AMIRA (2002) for the 'Static-NAG-Test' in its "Single-Additon-Mode". The pH of the 15 % (v/v) H2O2 solution was adjusted to 4.5 using 0.1 M-NaOH prior to commencing the NAG Tests. Following an overnight-reaction period, the test-mixtures were boiled for c. 2 hours. Then, after allowing the test-mixtures to cool, c. 1.0 mL of 0.016 M-CuSO4 solution was added, and the test-mixtures again boiled for c. 2 hours. The addition of Cu(II) catalyses the decomposition of any residual, unreacted-H2O2 in the test-mixtures (McElnea and Ahern 2004; O'Shay et al. 1990). K-Feldspar was employed for the Blank. Dr GD Campbell 12th June 2011
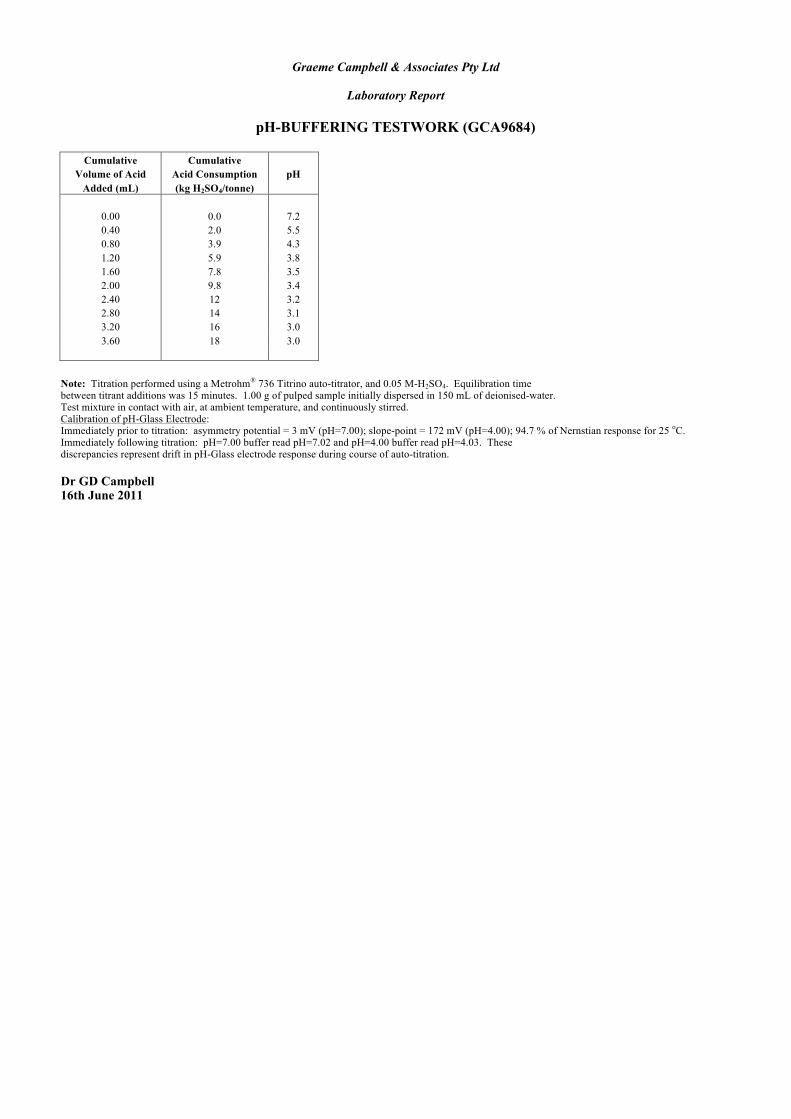
Graeme Campbell & Associates Pty Ltd
Laboratory Report
pH-BUFFERING TESTWORK (GCA9684)
Cumulative Cumulative Volume of Acid Acid Consumption pH
Added (mL) (kg H2SO4/tonne)
0.00 0.0 7.2 0.40 2.0 5.5 0.80 3.9 4.3 1.20 5.9 3.8 1.60 7.8 3.5 2.00 9.8 3.4 2.40 12 3.2 2.80 14 3.1 3.20 16 3.0 3.60 18 3.0
Note: Titration performed using a Metrohm® 736 Titrino auto-titrator, and 0.05 M-H2SO4. Equilibration time between titrant additions was 15 minutes. 1.00 g of pulped sample initially dispersed in 150 mL of deionised-water. Test mixture in contact with air, at ambient temperature, and continuously stirred. Calibration of pH-Glass Electrode: Immediately prior to titration: asymmetry potential = 3 mV (pH=7.00); slope-point = 172 mV (pH=4.00); 94.7 % of Nernstian response for 25 oC. Immediately following titration: pH=7.00 buffer read pH=7.02 and pH=4.00 buffer read pH=4.03. These discrepancies represent drift in pH-Glass electrode response during course of auto-titration. Dr GD Campbell 16th June 2011
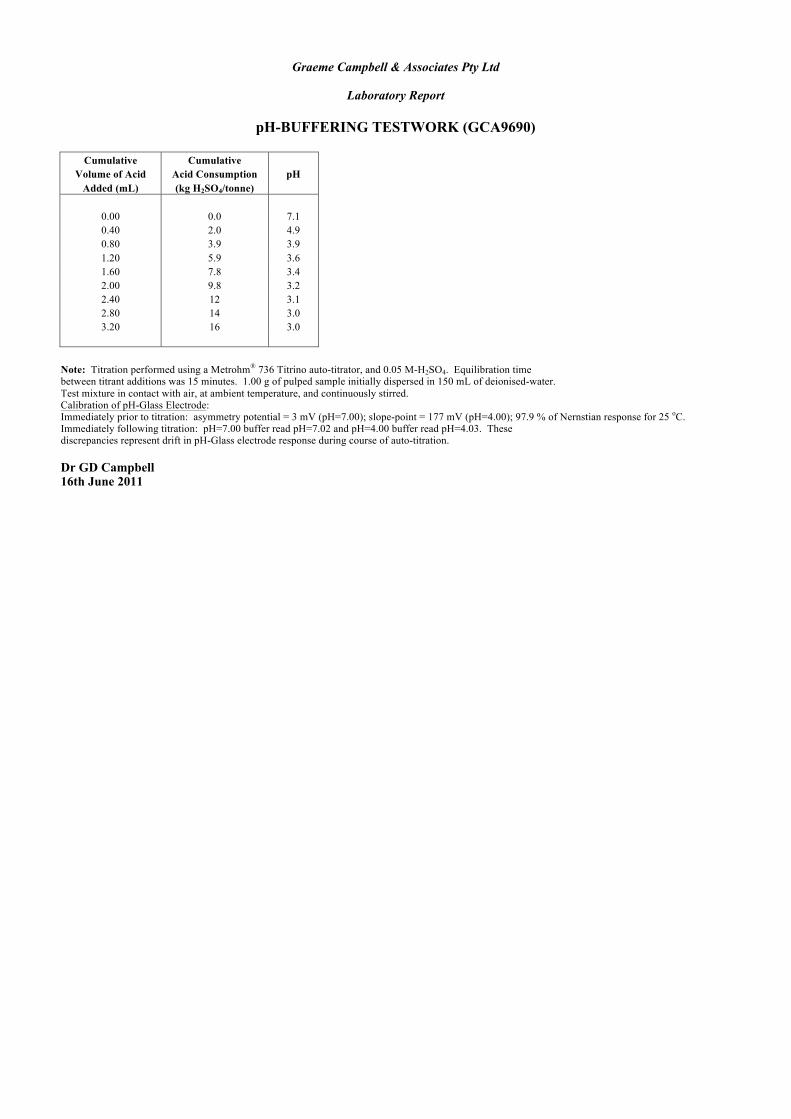
Graeme Campbell & Associates Pty Ltd
Laboratory Report
pH-BUFFERING TESTWORK (GCA9690)
Cumulative Cumulative Volume of Acid Acid Consumption pH
Added (mL) (kg H2SO4/tonne)
0.00 0.0 7.1 0.40 2.0 4.9 0.80 3.9 3.9 1.20 5.9 3.6 1.60 7.8 3.4 2.00 9.8 3.2 2.40 12 3.1 2.80 14 3.0 3.20 16 3.0
Note: Titration performed using a Metrohm® 736 Titrino auto-titrator, and 0.05 M-H2SO4. Equilibration time between titrant additions was 15 minutes. 1.00 g of pulped sample initially dispersed in 150 mL of deionised-water. Test mixture in contact with air, at ambient temperature, and continuously stirred. Calibration of pH-Glass Electrode: Immediately prior to titration: asymmetry potential = 3 mV (pH=7.00); slope-point = 177 mV (pH=4.00); 97.9 % of Nernstian response for 25 oC. Immediately following titration: pH=7.00 buffer read pH=7.02 and pH=4.00 buffer read pH=4.03. These discrepancies represent drift in pH-Glass electrode response during course of auto-titration. Dr GD Campbell 16th June 2011
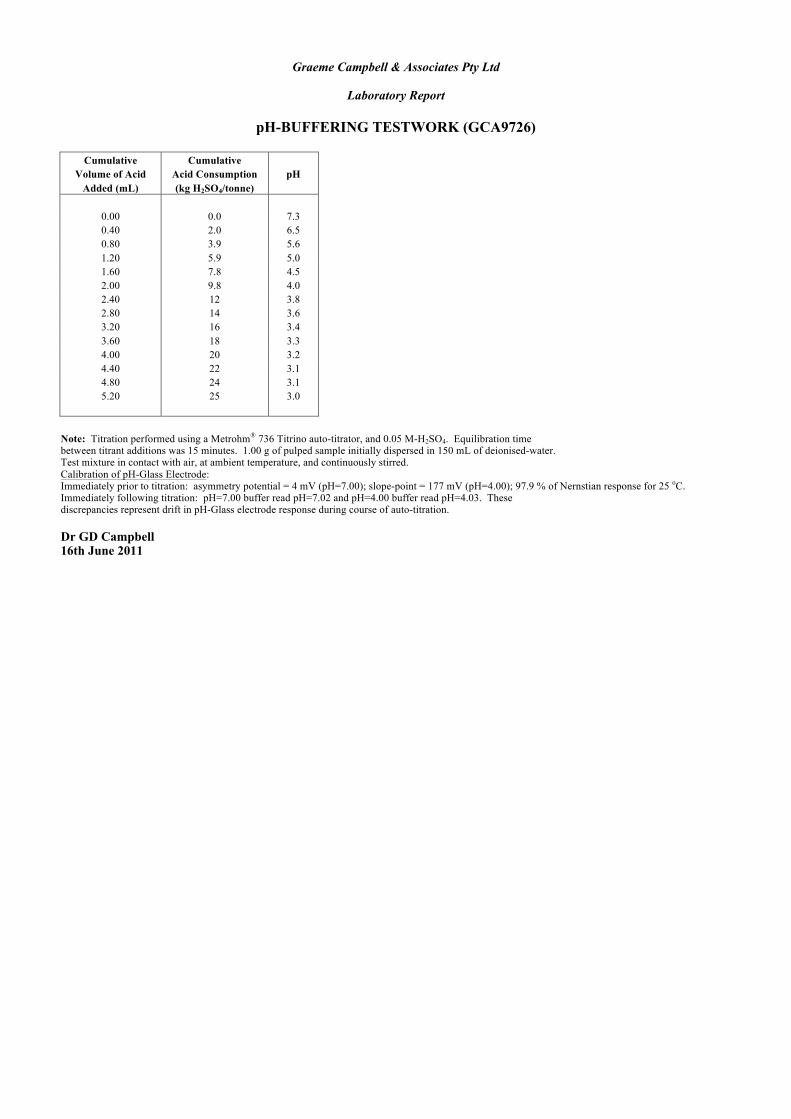
Graeme Campbell & Associates Pty Ltd
Laboratory Report
pH-BUFFERING TESTWORK (GCA9726)
Cumulative Cumulative Volume of Acid Acid Consumption pH
Added (mL) (kg H2SO4/tonne)
0.00 0.0 7.3 0.40 2.0 6.5 0.80 3.9 5.6 1.20 5.9 5.0 1.60 7.8 4.5 2.00 9.8 4.0 2.40 12 3.8 2.80 14 3.6 3.20 16 3.4 3.60 18 3.3 4.00 20 3.2 4.40 22 3.1 4.80 24 3.1 5.20 25 3.0
Note: Titration performed using a Metrohm® 736 Titrino auto-titrator, and 0.05 M-H2SO4. Equilibration time between titrant additions was 15 minutes. 1.00 g of pulped sample initially dispersed in 150 mL of deionised-water. Test mixture in contact with air, at ambient temperature, and continuously stirred. Calibration of pH-Glass Electrode: Immediately prior to titration: asymmetry potential = 4 mV (pH=7.00); slope-point = 177 mV (pH=4.00); 97.9 % of Nernstian response for 25 oC. Immediately following titration: pH=7.00 buffer read pH=7.02 and pH=4.00 buffer read pH=4.03. These discrepancies represent drift in pH-Glass electrode response during course of auto-titration. Dr GD Campbell 16th June 2011
3Page 1 of 8
TOWNSVILLE LABORATORY9-23 Kelli Street, Mt St John, Bohle, Queensland, Australia 4818
Tel: +61 7 4774 3655 Fax: +61 7 4774 4692
JOHANNESBURG LABORATORY43 Malcolm Moodie Crescent,
Jet Park, Gauteng, South Africa 1459
Tel: +27 11 552 8149 Fax: +27 11 552 8248
ADELAIDE LABORATORY11 Senna Road, Wingfield, 5013, South Australia
Tel: +61 8 8162 9714 Fax: +61 8 8349 7444
KALGOORLIE SAMPLE PREPARATION DIVISION12 Keogh Way, Kalgoorlie 6430, Western Australia
Tel: +61 8 9021 6057 Fax: +61 8 9021 3476
MAIN OFFICE AND LABORATORY15 Davison Street, Maddington 6109, Western Australia
PO Box 144, Gosnells 6990, Western Australia
Tel: +61 8 9251 8100 Fax: +61 8 9251 8110
Email: [email protected]
Web Page: www.genalysis.com.au
JOB INFORMATIONJOB CODENo. of SAMPLESNo. of ELEMENTSCLIENT O/NSAMPLE SUBMISSION No. :
::::
PROJECT :STATE :DATE RECEIVEDDATE COMPLETED
::
3210143.0/1110718
PIOP, Flinders MineEx-Pulp13/06/2011
GCA1112 (Job 1 of 1)
29/07/201129/07/2011DATE PRINTED Genalysis Main LaboratoryPRIMARY LABORATORY
::
LEGENDX = Less than Detection Limit
N/R = Sample Not Received
* = Result Checked
( ) = Result still to come
I/S = Insufficient Sample for Analysis
E6 = Result X 1,000,000
UA = Unable to Assay
> = Value beyond Limit of Method
OV = Value over-range for Package
Dr G. CAMPBELLCAMPBELL, GRAEME and ASSOCIATESPO Box 247BRIDGETOWN, W.A. 6255AUSTRALIA
ANALYTICAL REPORT

3143.0/1110718 (29/07/2011) CLIENT O/N: GCA1112 Page 2 of 8
DISCLAIMER
SAMPLE DETAILS
Genalysis Laboratory Services Pty Ltd wishes to make the following disclaimer pertaining to the accompanying
analytical results.
Genalysis Laboratory Services Pty Ltd disclaims any liability, legal or otherwise, for any inferences implied from
this report relating to either the origin of, or the sampling technique employed in the collection of, the submitted
samples.
SIGNIFICANT FIGURESIt is common practice to report data derived from analytical instrumentation to a maximum of two or three
significant figures. Some data reported herein may show more figures than this. The reporting of more than
two or three figures in no way implies that the third, fourth and subsequent figures may be real or significant.
Genalysis Laboratory Services Pty Ltd accepts no responsibility whatsoever for any interpretationby any party of any data where more than two or three significant figures have been reported.
GENERAL CONDITIONS
SAMPLE STORAGE DETAILS
SAMPLE STORAGE OF SOLIDSBulk Residues and Pulps will be stored for 60 DAYS without charge. After this time all Bulk Residues and Pulps
will be stored at a rate of $3.30 per cubic metre per day until your written advice regarding collection or disposal
is received. Expenses related to the return or disposal of samples will be charged to you at cost. Current
disposal cost is charged at $100.00 per cubic metre.
SAMPLE STORAGE OF SOLUTIONSSamples received as liquids, waters or solutions will be held for 60 DAYS free of charge then disposed of,
unless written advice for return or collection is received.
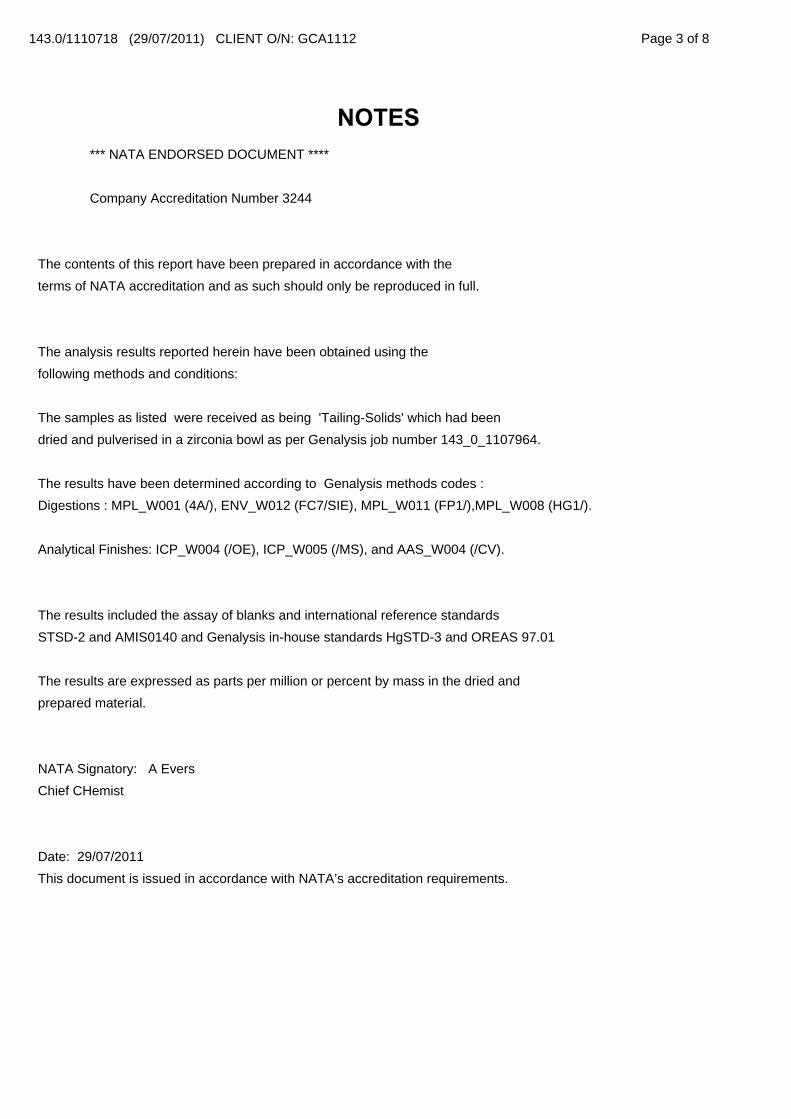
3143.0/1110718 (29/07/2011) CLIENT O/N: GCA1112 Page 3 of 8
NOTES *** NATA ENDORSED DOCUMENT ****
Company Accreditation Number 3244
The contents of this report have been prepared in accordance with the
terms of NATA accreditation and as such should only be reproduced in full.
The analysis results reported herein have been obtained using the
following methods and conditions:
The samples as listed were received as being 'Tailing-Solids' which had been
dried and pulverised in a zirconia bowl as per Genalysis job number 143_0_1107964.
The results have been determined according to Genalysis methods codes :
Digestions : MPL_W001 (4A/), ENV_W012 (FC7/SIE), MPL_W011 (FP1/),MPL_W008 (HG1/).
Analytical Finishes: ICP_W004 (/OE), ICP_W005 (/MS), and AAS_W004 (/CV).
The results included the assay of blanks and international reference standards
STSD-2 and AMIS0140 and Genalysis in-house standards HgSTD-3 and OREAS 97.01
The results are expressed as parts per million or percent by mass in the dried and
prepared material.
NATA Signatory: A Evers
Chief CHemist
Date: 29/07/2011
This document is issued in accordance with NATA’s accreditation requirements.
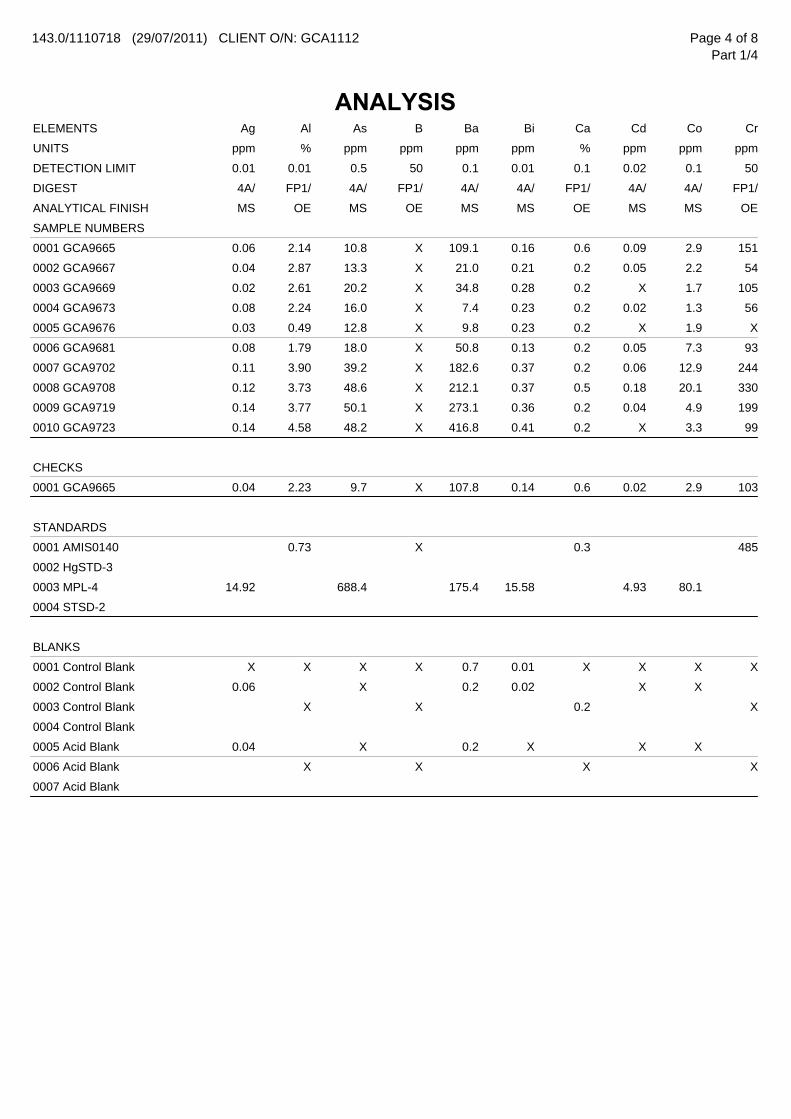
143.0/1110718 (29/07/2011) CLIENT O/N: GCA1112
ANALYSIS
Page 4 of 8Part 1/4
Ag AlELEMENTS As B Ba Bi Ca Cd Co Cr
ppm %UNITS ppm ppm ppm ppm % ppm ppm ppm
0.01 0.01DETECTION LIMIT 0.5 50 0.1 0.01 0.1 0.02 0.1 50
4A/ FP1/DIGEST 4A/ FP1/ 4A/ 4A/ FP1/ 4A/ 4A/ FP1/
MS OEANALYTICAL FINISH MS OE MS MS OE MS MS OE
SAMPLE NUMBERS
0.06 2.140001 GCA9665 10.8 X 109.1 0.16 0.6 0.09 2.9 151
0.04 2.870002 GCA9667 13.3 X 21.0 0.21 0.2 0.05 2.2 54
0.02 2.610003 GCA9669 20.2 X 34.8 0.28 0.2 X 1.7 105
0.08 2.240004 GCA9673 16.0 X 7.4 0.23 0.2 0.02 1.3 56
0.03 0.490005 GCA9676 12.8 X 9.8 0.23 0.2 X 1.9 X
0.08 1.790006 GCA9681 18.0 X 50.8 0.13 0.2 0.05 7.3 93
0.11 3.900007 GCA9702 39.2 X 182.6 0.37 0.2 0.06 12.9 244
0.12 3.730008 GCA9708 48.6 X 212.1 0.37 0.5 0.18 20.1 330
0.14 3.770009 GCA9719 50.1 X 273.1 0.36 0.2 0.04 4.9 199
0.14 4.580010 GCA9723 48.2 X 416.8 0.41 0.2 X 3.3 99
CHECKS
0.04 2.230001 GCA9665 9.7 X 107.8 0.14 0.6 0.02 2.9 103
STANDARDS
0.730001 AMIS0140 X 0.3 485
0002 HgSTD-3
14.920003 MPL-4 688.4 175.4 15.58 4.93 80.1
0004 STSD-2
BLANKS
X X0001 Control Blank X X 0.7 0.01 X X X X
0.060002 Control Blank X 0.2 0.02 X X
X0003 Control Blank X 0.2 X
0004 Control Blank
0.040005 Acid Blank X 0.2 X X X
X0006 Acid Blank X X X
0007 Acid Blank
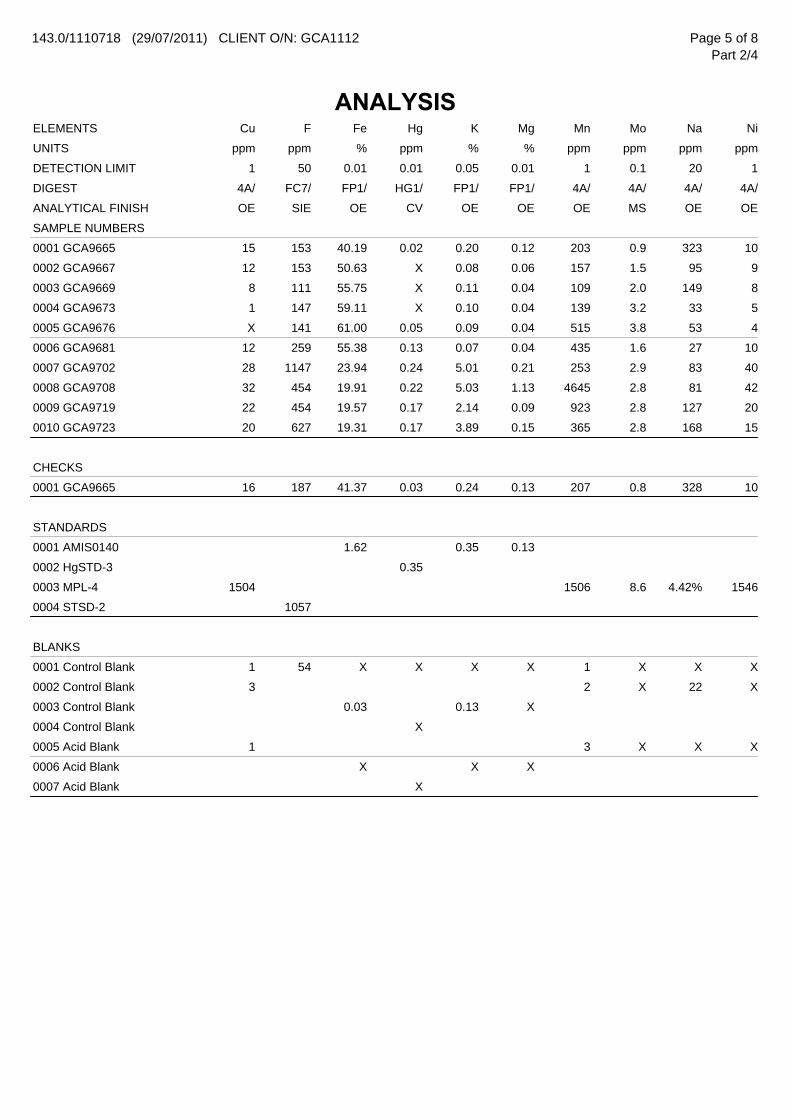
143.0/1110718 (29/07/2011) CLIENT O/N: GCA1112
ANALYSIS
Page 5 of 8Part 2/4
Cu FELEMENTS Fe Hg K Mg Mn Mo Na Ni
ppm ppmUNITS % ppm % % ppm ppm ppm ppm
1 50DETECTION LIMIT 0.01 0.01 0.05 0.01 1 0.1 20 1
4A/ FC7/DIGEST FP1/ HG1/ FP1/ FP1/ 4A/ 4A/ 4A/ 4A/
OE SIEANALYTICAL FINISH OE CV OE OE OE MS OE OE
SAMPLE NUMBERS
15 1530001 GCA9665 40.19 0.02 0.20 0.12 203 0.9 323 10
12 1530002 GCA9667 50.63 X 0.08 0.06 157 1.5 95 9
8 1110003 GCA9669 55.75 X 0.11 0.04 109 2.0 149 8
1 1470004 GCA9673 59.11 X 0.10 0.04 139 3.2 33 5
X 1410005 GCA9676 61.00 0.05 0.09 0.04 515 3.8 53 4
12 2590006 GCA9681 55.38 0.13 0.07 0.04 435 1.6 27 10
28 11470007 GCA9702 23.94 0.24 5.01 0.21 253 2.9 83 40
32 4540008 GCA9708 19.91 0.22 5.03 1.13 4645 2.8 81 42
22 4540009 GCA9719 19.57 0.17 2.14 0.09 923 2.8 127 20
20 6270010 GCA9723 19.31 0.17 3.89 0.15 365 2.8 168 15
CHECKS
16 1870001 GCA9665 41.37 0.03 0.24 0.13 207 0.8 328 10
STANDARDS
0001 AMIS0140 1.62 0.35 0.13
0002 HgSTD-3 0.35
15040003 MPL-4 1506 8.6 4.42% 1546
10570004 STSD-2
BLANKS
1 540001 Control Blank X X X X 1 X X X
30002 Control Blank 2 X 22 X
0003 Control Blank 0.03 0.13 X
0004 Control Blank X
10005 Acid Blank 3 X X X
0006 Acid Blank X X X
0007 Acid Blank X
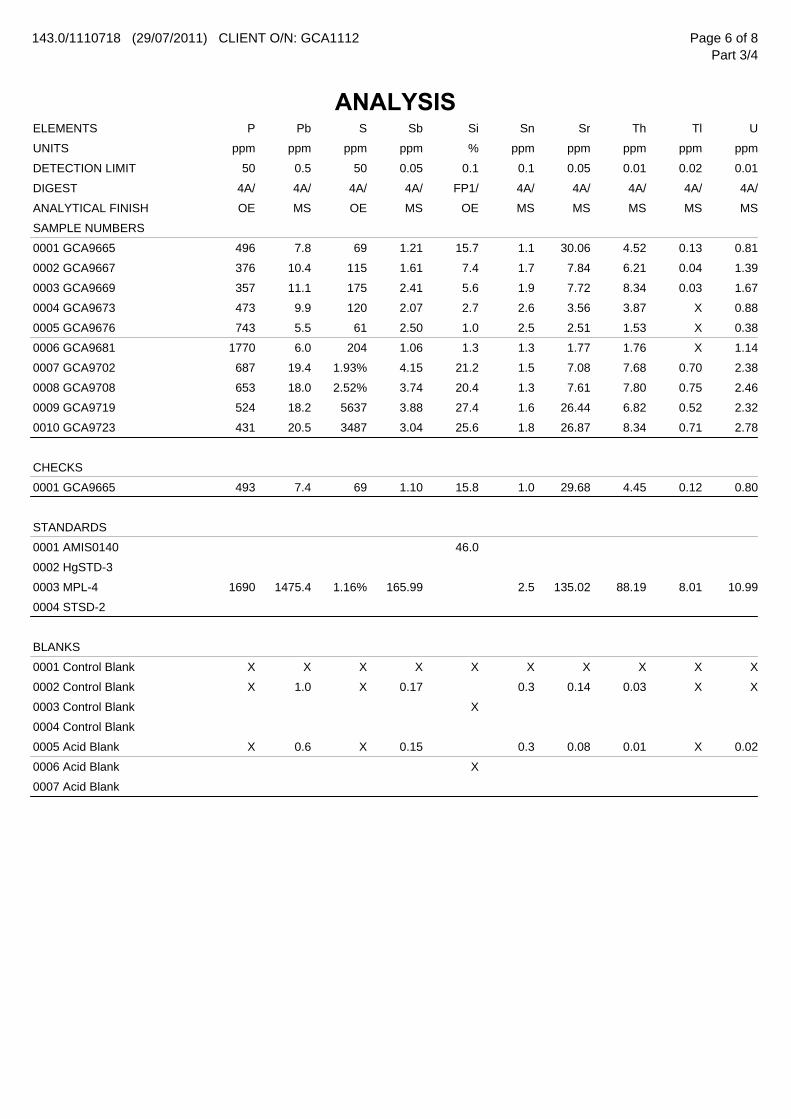
143.0/1110718 (29/07/2011) CLIENT O/N: GCA1112
ANALYSIS
Page 6 of 8Part 3/4
P PbELEMENTS S Sb Si Sn Sr Th Tl U
ppm ppmUNITS ppm ppm % ppm ppm ppm ppm ppm
50 0.5DETECTION LIMIT 50 0.05 0.1 0.1 0.05 0.01 0.02 0.01
4A/ 4A/DIGEST 4A/ 4A/ FP1/ 4A/ 4A/ 4A/ 4A/ 4A/
OE MSANALYTICAL FINISH OE MS OE MS MS MS MS MS
SAMPLE NUMBERS
496 7.80001 GCA9665 69 1.21 15.7 1.1 30.06 4.52 0.13 0.81
376 10.40002 GCA9667 115 1.61 7.4 1.7 7.84 6.21 0.04 1.39
357 11.10003 GCA9669 175 2.41 5.6 1.9 7.72 8.34 0.03 1.67
473 9.90004 GCA9673 120 2.07 2.7 2.6 3.56 3.87 X 0.88
743 5.50005 GCA9676 61 2.50 1.0 2.5 2.51 1.53 X 0.38
1770 6.00006 GCA9681 204 1.06 1.3 1.3 1.77 1.76 X 1.14
687 19.40007 GCA9702 1.93% 4.15 21.2 1.5 7.08 7.68 0.70 2.38
653 18.00008 GCA9708 2.52% 3.74 20.4 1.3 7.61 7.80 0.75 2.46
524 18.20009 GCA9719 5637 3.88 27.4 1.6 26.44 6.82 0.52 2.32
431 20.50010 GCA9723 3487 3.04 25.6 1.8 26.87 8.34 0.71 2.78
CHECKS
493 7.40001 GCA9665 69 1.10 15.8 1.0 29.68 4.45 0.12 0.80
STANDARDS
0001 AMIS0140 46.0
0002 HgSTD-3
1690 1475.40003 MPL-4 1.16% 165.99 2.5 135.02 88.19 8.01 10.99
0004 STSD-2
BLANKS
X X0001 Control Blank X X X X X X X X
X 1.00002 Control Blank X 0.17 0.3 0.14 0.03 X X
0003 Control Blank X
0004 Control Blank
X 0.60005 Acid Blank X 0.15 0.3 0.08 0.01 X 0.02
0006 Acid Blank X
0007 Acid Blank
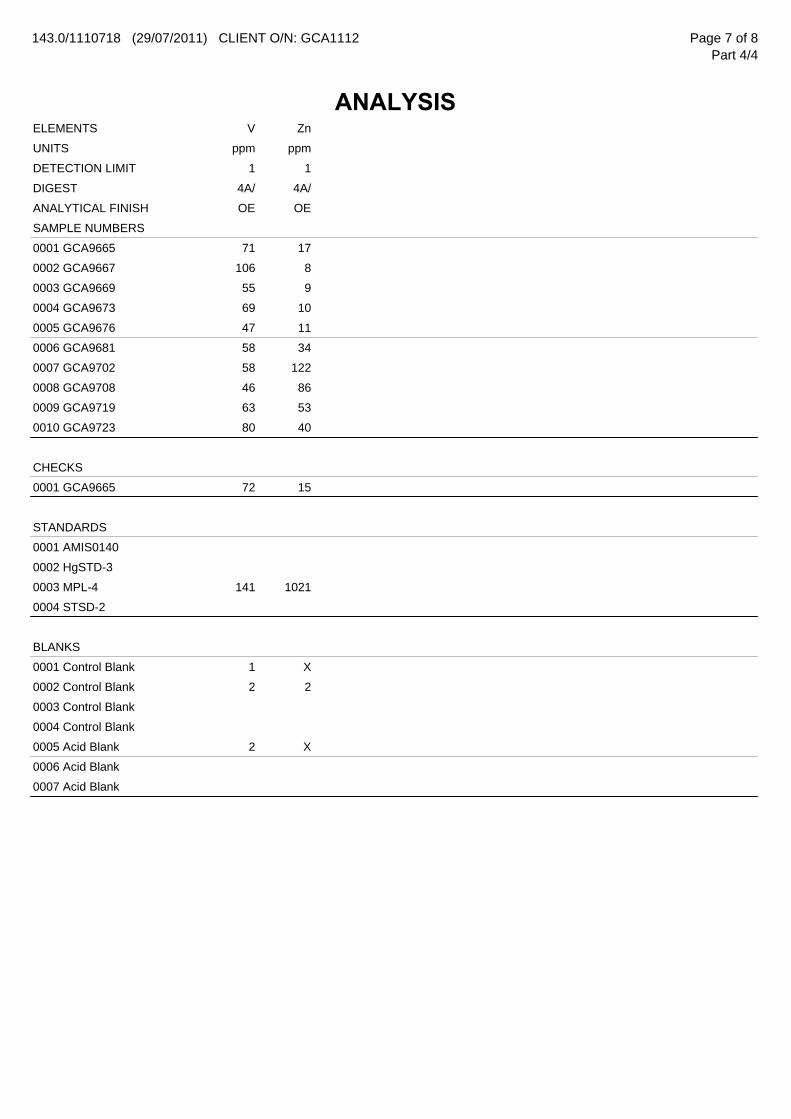
143.0/1110718 (29/07/2011) CLIENT O/N: GCA1112
ANALYSIS
Page 7 of 8Part 4/4
V ZnELEMENTS
ppm ppmUNITS
1 1DETECTION LIMIT
4A/ 4A/DIGEST
OE OEANALYTICAL FINISH
SAMPLE NUMBERS
71 170001 GCA9665
106 80002 GCA9667
55 90003 GCA9669
69 100004 GCA9673
47 110005 GCA9676
58 340006 GCA9681
58 1220007 GCA9702
46 860008 GCA9708
63 530009 GCA9719
80 400010 GCA9723
CHECKS
72 150001 GCA9665
STANDARDS
0001 AMIS0140
0002 HgSTD-3
141 10210003 MPL-4
0004 STSD-2
BLANKS
1 X0001 Control Blank
2 20002 Control Blank
0003 Control Blank
0004 Control Blank
2 X0005 Acid Blank
0006 Acid Blank
0007 Acid Blank
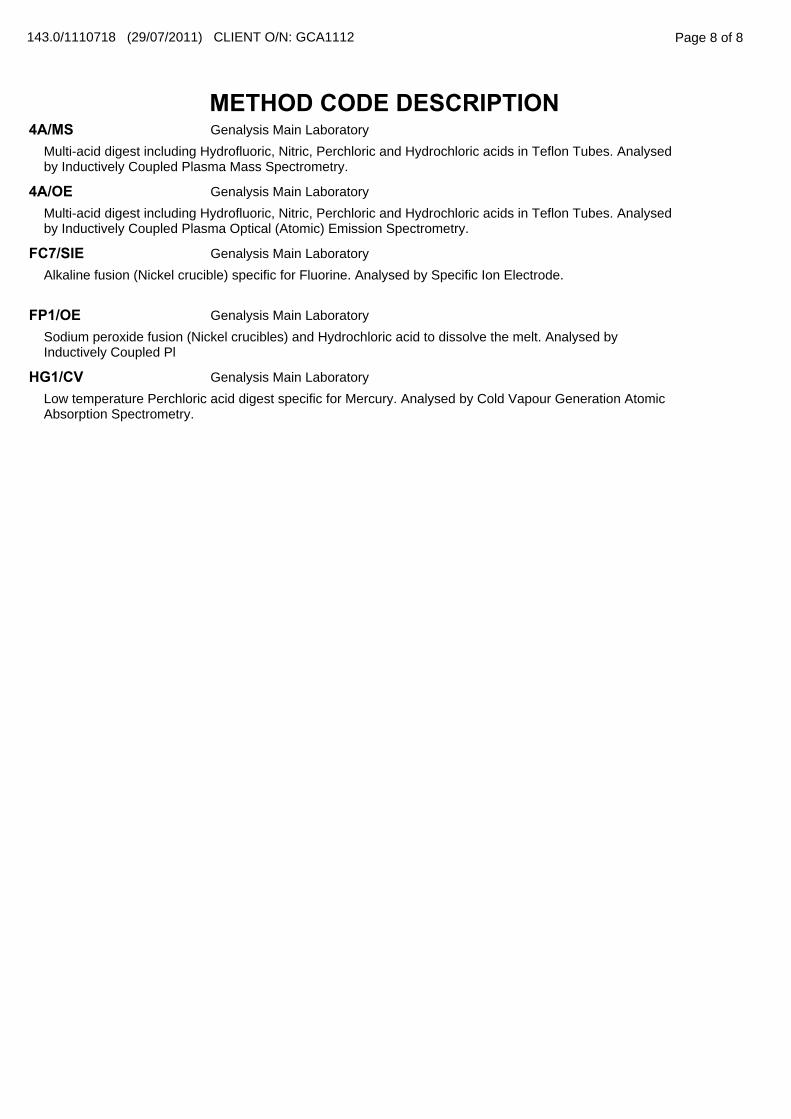
Page 8 of 8
METHOD CODE DESCRIPTION
143.0/1110718 (29/07/2011) CLIENT O/N: GCA1112
4A/MSMulti-acid digest including Hydrofluoric, Nitric, Perchloric and Hydrochloric acids in Teflon Tubes. Analysedby Inductively Coupled Plasma Mass Spectrometry.
Genalysis Main Laboratory
4A/OEMulti-acid digest including Hydrofluoric, Nitric, Perchloric and Hydrochloric acids in Teflon Tubes. Analysedby Inductively Coupled Plasma Optical (Atomic) Emission Spectrometry.
Genalysis Main Laboratory
FC7/SIEAlkaline fusion (Nickel crucible) specific for Fluorine. Analysed by Specific Ion Electrode.
Genalysis Main Laboratory
FP1/OESodium peroxide fusion (Nickel crucibles) and Hydrochloric acid to dissolve the melt. Analysed byInductively Coupled Pl
Genalysis Main Laboratory
HG1/CVLow temperature Perchloric acid digest specific for Mercury. Analysed by Cold Vapour Generation AtomicAbsorption Spectrometry.
Genalysis Main Laboratory

2Page 1 of 5
ANALYTICAL REPORTDr G. CAMPBELLCAMPBELL, GRAEME and ASSOCIATESPO Box 247BRIDGETOWN, W.A. 6255AUSTRALIA
JOB INFORMATIONJOB CODENo. of SAMPLESNo. of ELEMENTSCLIENT O/NSAMPLE SUBMISSION No. :
::::
PROJECT :STATE :DATE RECEIVEDDATE COMPLETED
::
148143.0/1107130
Flinders, PIOPEx-Pulp24/05/2011
GCA1112 (Job 1 of 1)
13/06/201113/06/2011DATE PRINTED Genalysis Main LaboratoryPRIMARY LABORATORY
::
LEGENDX = Less than Detection Limit
N/R = Sample Not Received
* = Result Checked
( ) = Result still to come
I/S = Insufficient Sample for Analysis
E6 = Result X 1,000,000
UA = Unable to Assay
> = Value beyond Limit of Method
OV = Value over-range for Package
JOHANNESBURG LABORATORY43 Malcolm Moodie Crescent,
Jet Park, Gauteng, South Africa 1459
Tel: +27 11 552 8149 Fax: +27 11 552 8248
ADELAIDE LABORATORY11 Senna Road, Wingfield, 5013, South Australia
Tel: +61 8 8162 9714 Fax: +61 8 8349 7444
KALGOORLIE SAMPLE PREPARATION DIVISION12 Keogh Way, Kalgoorlie 6430, Western Australia
Tel: +61 8 9021 6057 Fax: +61 8 9021 3476
MAIN OFFICE AND LABORATORY15 Davison Street, Maddington 6109, Western Australia
PO Box 144, Gosnells 6990, Western Australia
Tel: +61 8 9251 8100 Fax: +61 8 9251 8110
Email: [email protected]
Web Page: www.genalysis.com.au
TOWNSVILLE LABORATORY9-23 Kelli Street, Mt St John, Bohle, Queensland, Australia 4818
Tel: +61 7 4774 3655 Fax: +61 7 4774 4692
2143.0/1107130 (13/06/2011) CLIENT O/N: GCA1112 Page 2 of 5
DISCLAIMER
SAMPLE DETAILS
Genalysis Laboratory Services Pty Ltd wishes to make the following disclaimer pertaining to the accompanying
analytical results.
Genalysis Laboratory Services Pty Ltd disclaims any liability, legal or otherwise, for any inferences implied from
this report relating to either the origin of, or the sampling technique employed in the collection of, the submitted
samples.
SIGNIFICANT FIGURESIt is common practice to report data derived from analytical instrumentation to a maximum of two or three
significant figures. Some data reported herein may show more figures than this. The reporting of more than
two or three figures in no way implies that the third, fourth and subsequent figures may be real or significant.
Genalysis Laboratory Services Pty Ltd accepts no responsibility whatsoever for any interpretationby any party of any data where more than two or three significant figures have been reported.
GENERAL CONDITIONS
SAMPLE STORAGE DETAILS
SAMPLE STORAGE OF SOLIDSBulk Residues and Pulps will be stored for 60 DAYS without charge. After this time all Bulk Residues and Pulps
will be stored at a rate of $3.30 per cubic metre per day until your written advice regarding collection or disposal
is received. Expenses related to the return or disposal of samples will be charged to you at cost. Current
disposal cost is charged at $100.00 per cubic metre.
SAMPLE STORAGE OF SOLUTIONSSamples received as liquids, waters or solutions will be held for 60 DAYS free of charge then disposed of,
unless written advice for return or collection is received.
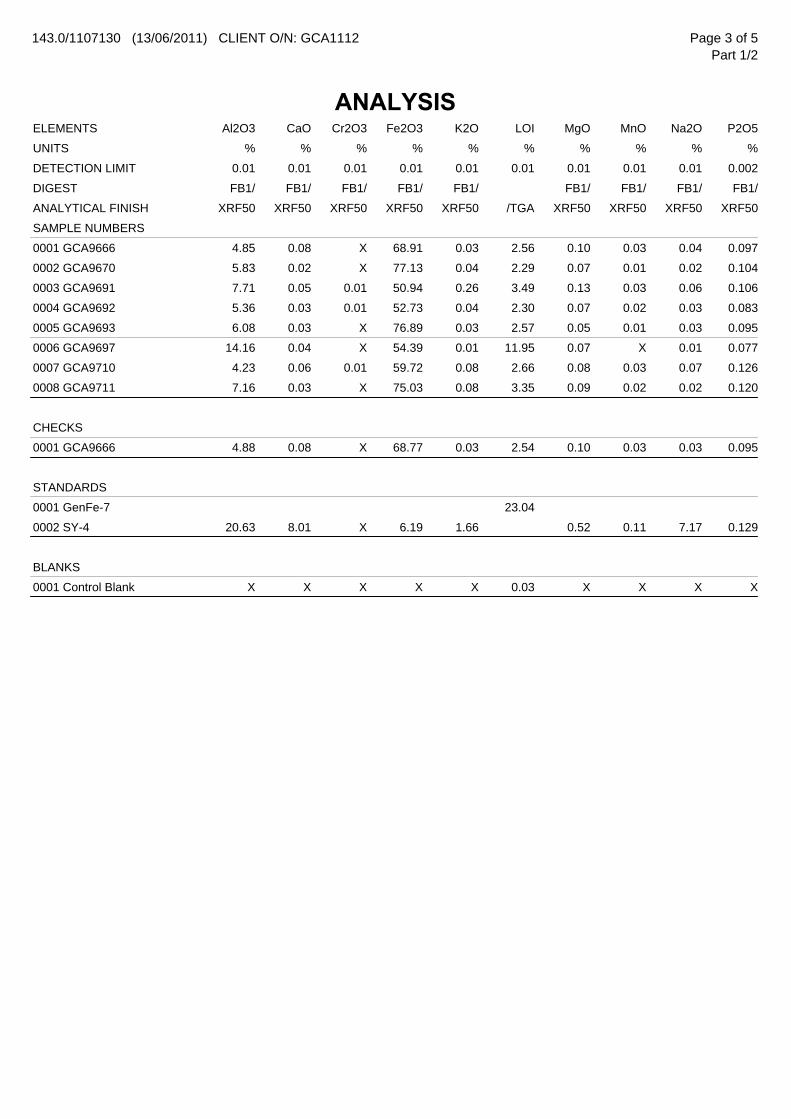
143.0/1107130 (13/06/2011) CLIENT O/N: GCA1112
ANALYSIS
Page 3 of 5Part 1/2
Al2O3 CaOELEMENTS Cr2O3 Fe2O3 K2O LOI MgO MnO Na2O P2O5
% %UNITS % % % % % % % %
0.01 0.01DETECTION LIMIT 0.01 0.01 0.01 0.01 0.01 0.01 0.01 0.002
FB1/ FB1/DIGEST FB1/ FB1/ FB1/ FB1/ FB1/ FB1/ FB1/
XRF50 XRF50ANALYTICAL FINISH XRF50 XRF50 XRF50 /TGA XRF50 XRF50 XRF50 XRF50
SAMPLE NUMBERS
4.85 0.080001 GCA9666 X 68.91 0.03 2.56 0.10 0.03 0.04 0.097
5.83 0.020002 GCA9670 X 77.13 0.04 2.29 0.07 0.01 0.02 0.104
7.71 0.050003 GCA9691 0.01 50.94 0.26 3.49 0.13 0.03 0.06 0.106
5.36 0.030004 GCA9692 0.01 52.73 0.04 2.30 0.07 0.02 0.03 0.083
6.08 0.030005 GCA9693 X 76.89 0.03 2.57 0.05 0.01 0.03 0.095
14.16 0.040006 GCA9697 X 54.39 0.01 11.95 0.07 X 0.01 0.077
4.23 0.060007 GCA9710 0.01 59.72 0.08 2.66 0.08 0.03 0.07 0.126
7.16 0.030008 GCA9711 X 75.03 0.08 3.35 0.09 0.02 0.02 0.120
CHECKS
4.88 0.080001 GCA9666 X 68.77 0.03 2.54 0.10 0.03 0.03 0.095
STANDARDS
0001 GenFe-7 23.04
20.63 8.010002 SY-4 X 6.19 1.66 0.52 0.11 7.17 0.129
BLANKS
X X0001 Control Blank X X X 0.03 X X X X
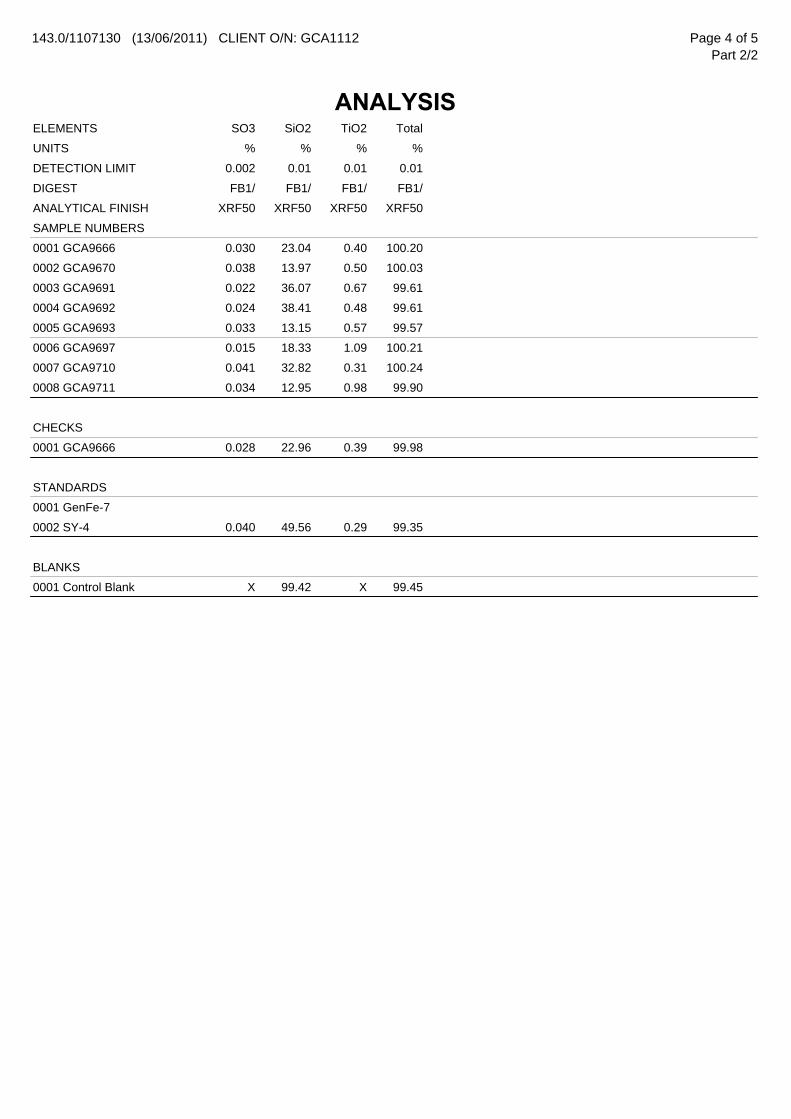
143.0/1107130 (13/06/2011) CLIENT O/N: GCA1112
ANALYSIS
Page 4 of 5Part 2/2
SO3 SiO2ELEMENTS TiO2 Total
% %UNITS % %
0.002 0.01DETECTION LIMIT 0.01 0.01
FB1/ FB1/DIGEST FB1/ FB1/
XRF50 XRF50ANALYTICAL FINISH XRF50 XRF50
SAMPLE NUMBERS
0.030 23.040001 GCA9666 0.40 100.20
0.038 13.970002 GCA9670 0.50 100.03
0.022 36.070003 GCA9691 0.67 99.61
0.024 38.410004 GCA9692 0.48 99.61
0.033 13.150005 GCA9693 0.57 99.57
0.015 18.330006 GCA9697 1.09 100.21
0.041 32.820007 GCA9710 0.31 100.24
0.034 12.950008 GCA9711 0.98 99.90
CHECKS
0.028 22.960001 GCA9666 0.39 99.98
STANDARDS
0001 GenFe-7
0.040 49.560002 SY-4 0.29 99.35
BLANKS
X 99.420001 Control Blank X 99.45
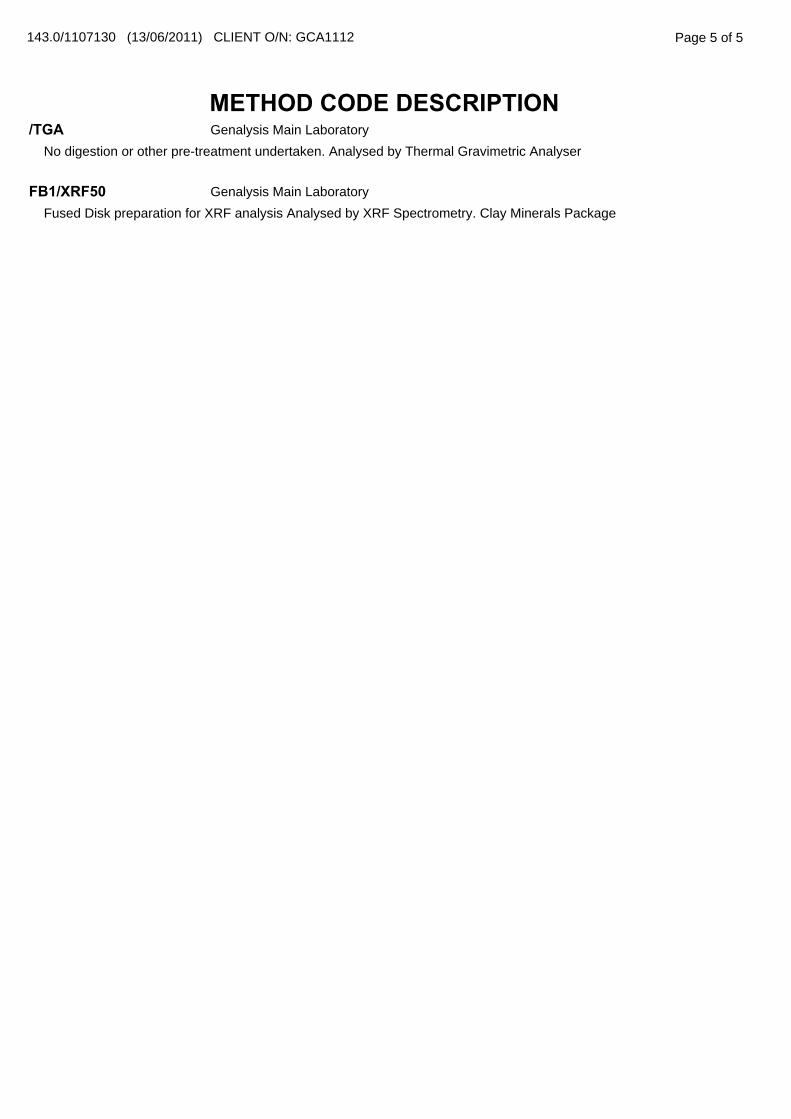
Page 5 of 5
METHOD CODE DESCRIPTION
143.0/1107130 (13/06/2011) CLIENT O/N: GCA1112
/TGANo digestion or other pre-treatment undertaken. Analysed by Thermal Gravimetric Analyser
Genalysis Main Laboratory
FB1/XRF50Fused Disk preparation for XRF analysis Analysed by XRF Spectrometry. Clay Minerals Package
Genalysis Main Laboratory
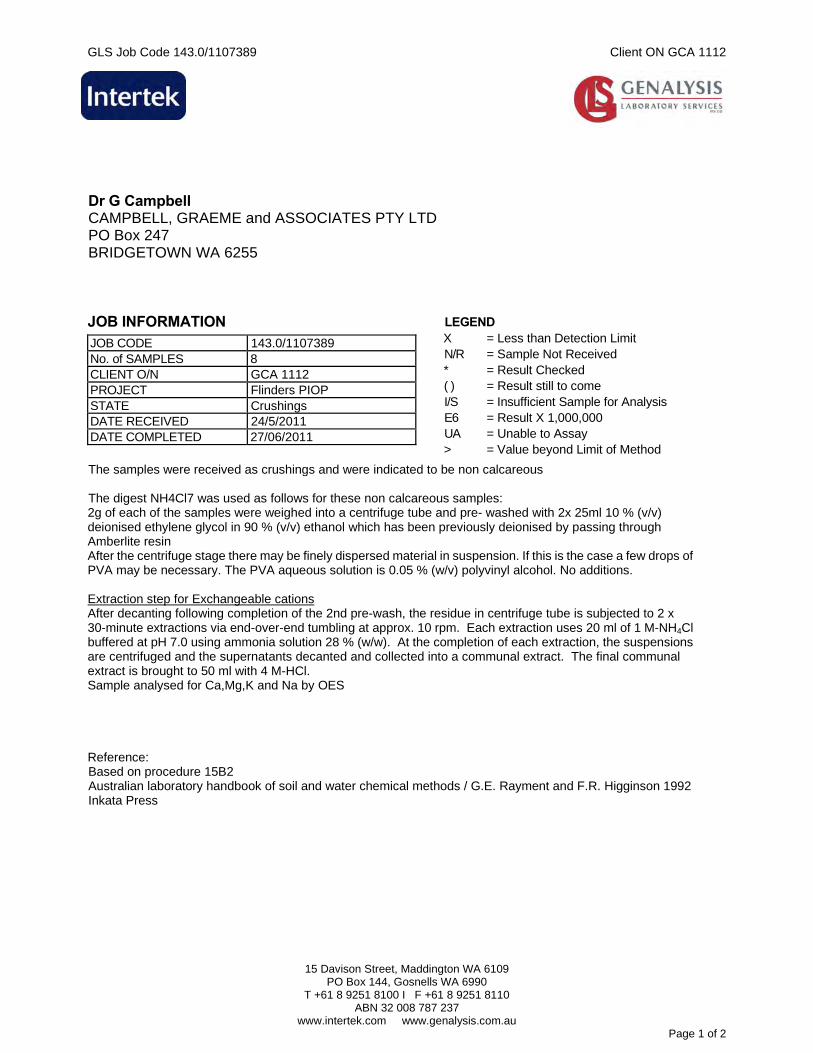
GLS Job Code 143.0/1107389 Client ON GCA 1112
15 Davison Street, Maddington WA 6109
PO Box 144, Gosnells WA 6990 T +61 8 9251 8100 I F +61 8 9251 8110
ABN 32 008 787 237 www.intertek.com www.genalysis.com.au
Page 1 of 2
Dr G Campbell CAMPBELL, GRAEME and ASSOCIATES PTY LTD PO Box 247 BRIDGETOWN WA 6255 JOB INFORMATION
JOB CODE 143.0/1107389 No. of SAMPLES 8 CLIENT O/N GCA 1112 PROJECT Flinders PIOP STATE Crushings DATE RECEIVED 24/5/2011 DATE COMPLETED 27/06/2011
LEGEND X = Less than Detection Limit N/R = Sample Not Received * = Result Checked ( ) = Result still to come I/S = Insufficient Sample for Analysis E6 = Result X 1,000,000 UA = Unable to Assay > = Value beyond Limit of Method
The samples were received as crushings and were indicated to be non calcareous The digest NH4Cl7 was used as follows for these non calcareous samples: 2g of each of the samples were weighed into a centrifuge tube and pre- washed with 2x 25ml 10 % (v/v) deionised ethylene glycol in 90 % (v/v) ethanol which has been previously deionised by passing through Amberlite resin After the centrifuge stage there may be finely dispersed material in suspension. If this is the case a few drops of PVA may be necessary. The PVA aqueous solution is 0.05 % (w/v) polyvinyl alcohol. No additions. Extraction step for Exchangeable cations After decanting following completion of the 2nd pre-wash, the residue in centrifuge tube is subjected to 2 x 30-minute extractions via end-over-end tumbling at approx. 10 rpm. Each extraction uses 20 ml of 1 M-NH4Cl buffered at pH 7.0 using ammonia solution 28 % (w/w). At the completion of each extraction, the suspensions are centrifuged and the supernatants decanted and collected into a communal extract. The final communal extract is brought to 50 ml with 4 M-HCl. Sample analysed for Ca,Mg,K and Na by OES Reference: Based on procedure 15B2 Australian laboratory handbook of soil and water chemical methods / G.E. Rayment and F.R. Higginson 1992 Inkata Press
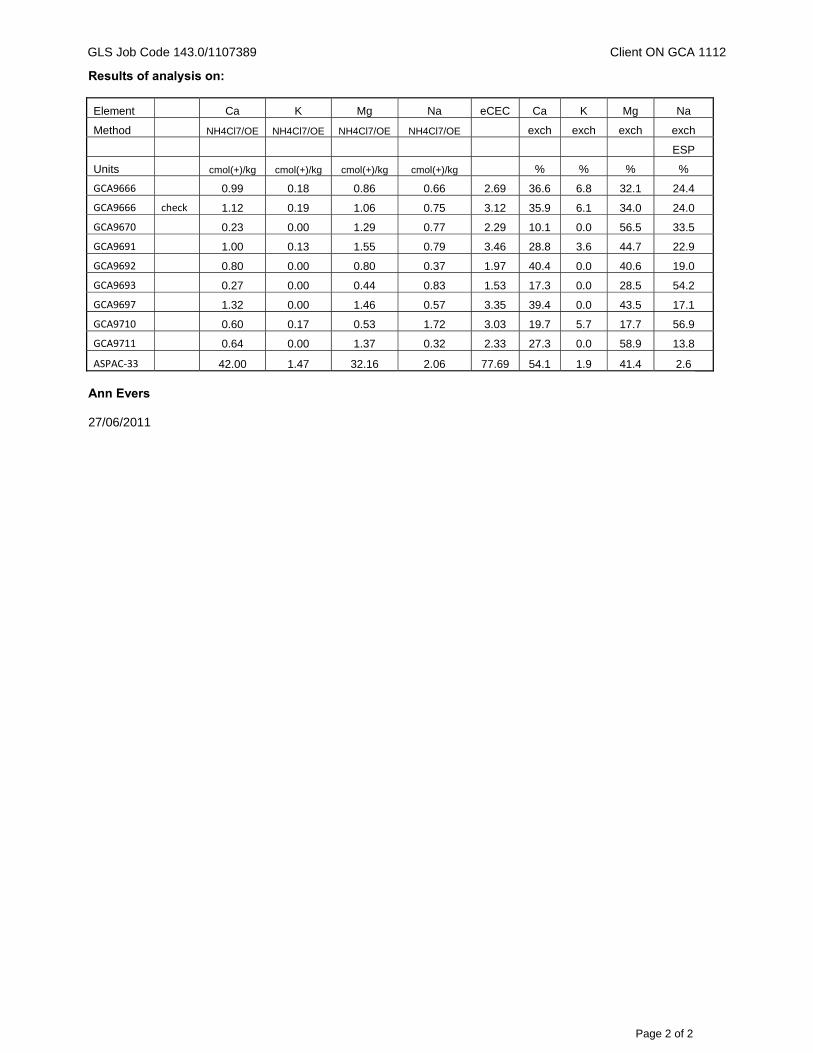
GLS Job Code 143.0/1107389 Client ON GCA 1112
Page 2 of 2
Results of analysis on: Element Ca K Mg Na eCEC Ca K Mg Na
Method NH4Cl7/OE NH4Cl7/OE NH4Cl7/OE NH4Cl7/OE exch exch exch exch
ESP
Units cmol(+)/kg cmol(+)/kg cmol(+)/kg cmol(+)/kg % % % %
GCA9666 0.99 0.18 0.86 0.66 2.69 36.6 6.8 32.1 24.4
GCA9666 check 1.12 0.19 1.06 0.75 3.12 35.9 6.1 34.0 24.0
GCA9670 0.23 0.00 1.29 0.77 2.29 10.1 0.0 56.5 33.5
GCA9691 1.00 0.13 1.55 0.79 3.46 28.8 3.6 44.7 22.9
GCA9692 0.80 0.00 0.80 0.37 1.97 40.4 0.0 40.6 19.0
GCA9693 0.27 0.00 0.44 0.83 1.53 17.3 0.0 28.5 54.2
GCA9697 1.32 0.00 1.46 0.57 3.35 39.4 0.0 43.5 17.1
GCA9710 0.60 0.17 0.53 1.72 3.03 19.7 5.7 17.7 56.9
GCA9711 0.64 0.00 1.37 0.32 2.33 27.3 0.0 58.9 13.8
ASPAC‐33 42.00 1.47 32.16 2.06 77.69 54.1 1.9 41.4 2.6 Ann Evers 27/06/2011
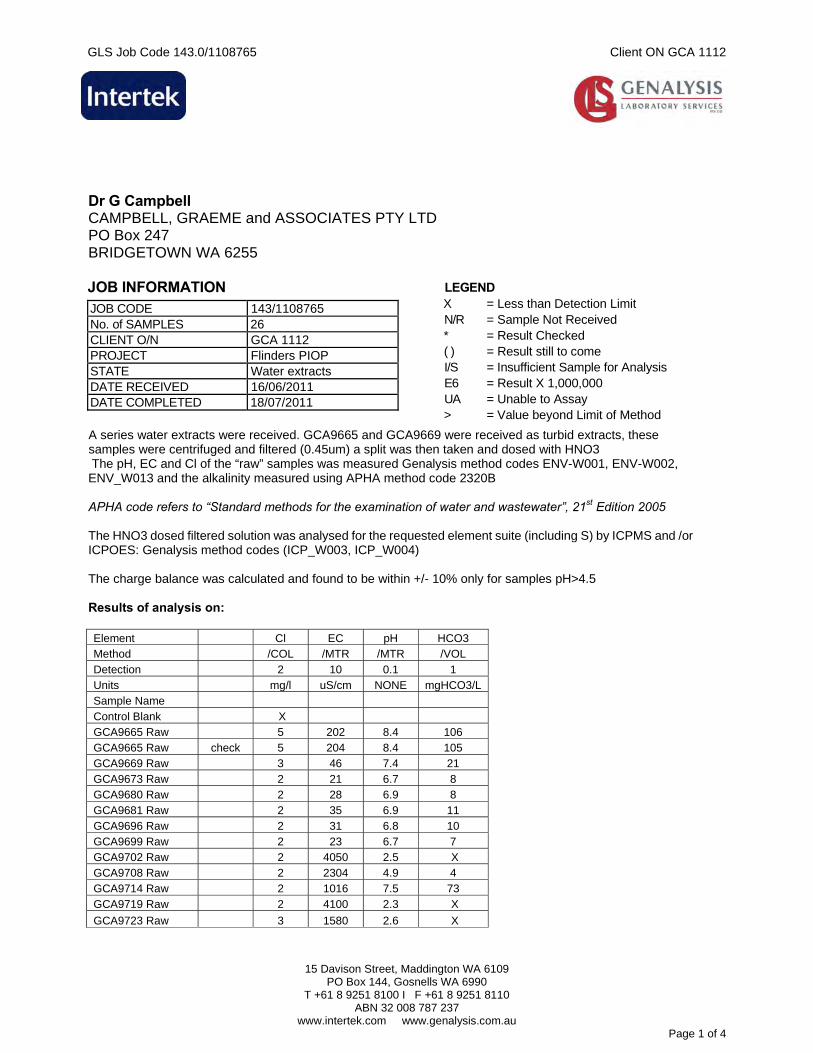
GLS Job Code 143.0/1108765 Client ON GCA 1112
15 Davison Street, Maddington WA 6109
PO Box 144, Gosnells WA 6990 T +61 8 9251 8100 I F +61 8 9251 8110
ABN 32 008 787 237 www.intertek.com www.genalysis.com.au
Page 1 of 4
Dr G Campbell CAMPBELL, GRAEME and ASSOCIATES PTY LTD PO Box 247 BRIDGETOWN WA 6255 JOB INFORMATION
JOB CODE 143/1108765 No. of SAMPLES 26 CLIENT O/N GCA 1112 PROJECT Flinders PIOP STATE Water extracts DATE RECEIVED 16/06/2011 DATE COMPLETED 18/07/2011
LEGEND X = Less than Detection Limit N/R = Sample Not Received * = Result Checked ( ) = Result still to come I/S = Insufficient Sample for Analysis E6 = Result X 1,000,000 UA = Unable to Assay > = Value beyond Limit of Method
A series water extracts were received. GCA9665 and GCA9669 were received as turbid extracts, these samples were centrifuged and filtered (0.45um) a split was then taken and dosed with HNO3 The pH, EC and Cl of the “raw” samples was measured Genalysis method codes ENV-W001, ENV-W002, ENV_W013 and the alkalinity measured using APHA method code 2320B APHA code refers to “Standard methods for the examination of water and wastewater”, 21st Edition 2005 The HNO3 dosed filtered solution was analysed for the requested element suite (including S) by ICPMS and /or ICPOES: Genalysis method codes (ICP_W003, ICP_W004) The charge balance was calculated and found to be within +/- 10% only for samples pH>4.5 Results of analysis on: Element Cl EC pH HCO3 Method /COL /MTR /MTR /VOL
Detection 2 10 0.1 1 Units mg/l uS/cm NONE mgHCO3/L Sample Name Control Blank X GCA9665 Raw 5 202 8.4 106 GCA9665 Raw check 5 204 8.4 105 GCA9669 Raw 3 46 7.4 21 GCA9673 Raw 2 21 6.7 8 GCA9680 Raw 2 28 6.9 8 GCA9681 Raw 2 35 6.9 11 GCA9696 Raw 2 31 6.8 10 GCA9699 Raw 2 23 6.7 7 GCA9702 Raw 2 4050 2.5 X GCA9708 Raw 2 2304 4.9 4 GCA9714 Raw 2 1016 7.5 73 GCA9719 Raw 2 4100 2.3 X
GCA9723 Raw 3 1580 2.6 X
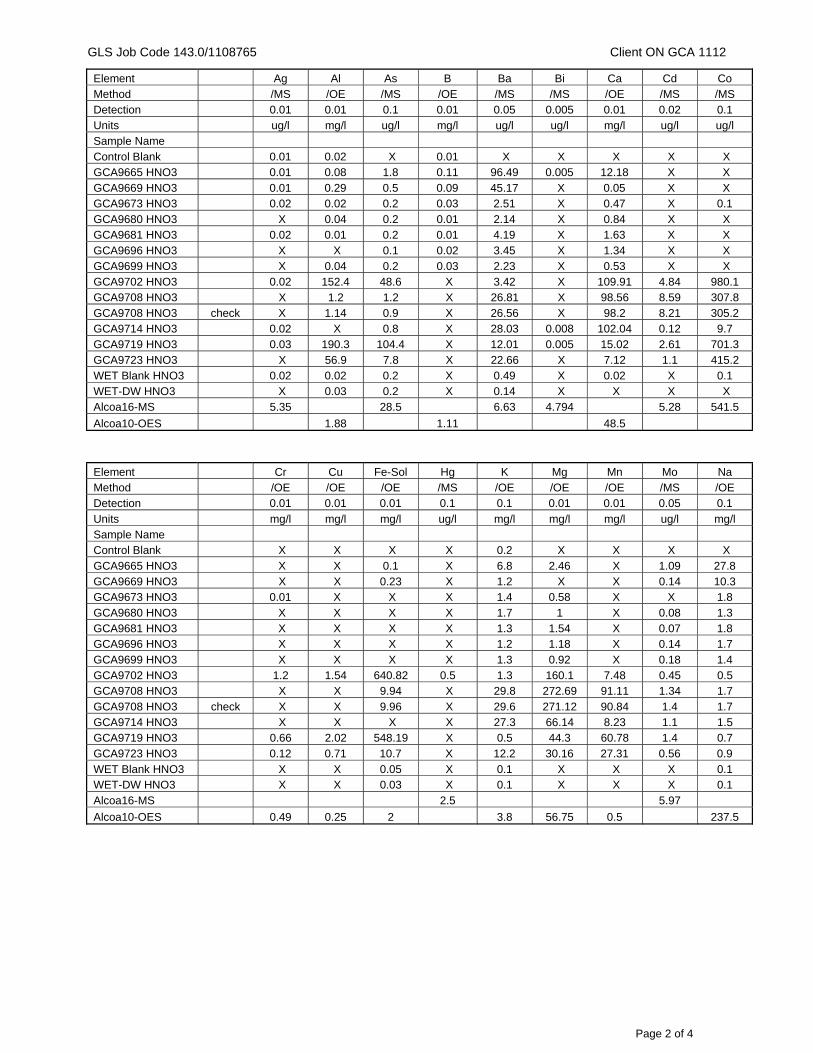
GLS Job Code 143.0/1108765 Client ON GCA 1112
Page 2 of 4
Element Ag Al As B Ba Bi Ca Cd Co Method /MS /OE /MS /OE /MS /MS /OE /MS /MS Detection 0.01 0.01 0.1 0.01 0.05 0.005 0.01 0.02 0.1 Units ug/l mg/l ug/l mg/l ug/l ug/l mg/l ug/l ug/l Sample Name Control Blank 0.01 0.02 X 0.01 X X X X X GCA9665 HNO3 0.01 0.08 1.8 0.11 96.49 0.005 12.18 X X GCA9669 HNO3 0.01 0.29 0.5 0.09 45.17 X 0.05 X X GCA9673 HNO3 0.02 0.02 0.2 0.03 2.51 X 0.47 X 0.1 GCA9680 HNO3 X 0.04 0.2 0.01 2.14 X 0.84 X X GCA9681 HNO3 0.02 0.01 0.2 0.01 4.19 X 1.63 X X GCA9696 HNO3 X X 0.1 0.02 3.45 X 1.34 X X GCA9699 HNO3 X 0.04 0.2 0.03 2.23 X 0.53 X X GCA9702 HNO3 0.02 152.4 48.6 X 3.42 X 109.91 4.84 980.1 GCA9708 HNO3 X 1.2 1.2 X 26.81 X 98.56 8.59 307.8 GCA9708 HNO3 check X 1.14 0.9 X 26.56 X 98.2 8.21 305.2 GCA9714 HNO3 0.02 X 0.8 X 28.03 0.008 102.04 0.12 9.7 GCA9719 HNO3 0.03 190.3 104.4 X 12.01 0.005 15.02 2.61 701.3 GCA9723 HNO3 X 56.9 7.8 X 22.66 X 7.12 1.1 415.2 WET Blank HNO3 0.02 0.02 0.2 X 0.49 X 0.02 X 0.1 WET-DW HNO3 X 0.03 0.2 X 0.14 X X X X Alcoa16-MS 5.35 28.5 6.63 4.794 5.28 541.5
Alcoa10-OES 1.88 1.11 48.5
Element Cr Cu Fe-Sol Hg K Mg Mn Mo Na Method /OE /OE /OE /MS /OE /OE /OE /MS /OE Detection 0.01 0.01 0.01 0.1 0.1 0.01 0.01 0.05 0.1
Units mg/l mg/l mg/l ug/l mg/l mg/l mg/l ug/l mg/l Sample Name Control Blank X X X X 0.2 X X X X
GCA9665 HNO3 X X 0.1 X 6.8 2.46 X 1.09 27.8 GCA9669 HNO3 X X 0.23 X 1.2 X X 0.14 10.3 GCA9673 HNO3 0.01 X X X 1.4 0.58 X X 1.8
GCA9680 HNO3 X X X X 1.7 1 X 0.08 1.3 GCA9681 HNO3 X X X X 1.3 1.54 X 0.07 1.8 GCA9696 HNO3 X X X X 1.2 1.18 X 0.14 1.7
GCA9699 HNO3 X X X X 1.3 0.92 X 0.18 1.4 GCA9702 HNO3 1.2 1.54 640.82 0.5 1.3 160.1 7.48 0.45 0.5 GCA9708 HNO3 X X 9.94 X 29.8 272.69 91.11 1.34 1.7
GCA9708 HNO3 check X X 9.96 X 29.6 271.12 90.84 1.4 1.7 GCA9714 HNO3 X X X X 27.3 66.14 8.23 1.1 1.5 GCA9719 HNO3 0.66 2.02 548.19 X 0.5 44.3 60.78 1.4 0.7
GCA9723 HNO3 0.12 0.71 10.7 X 12.2 30.16 27.31 0.56 0.9 WET Blank HNO3 X X 0.05 X 0.1 X X X 0.1 WET-DW HNO3 X X 0.03 X 0.1 X X X 0.1
Alcoa16-MS 2.5 5.97
Alcoa10-OES 0.49 0.25 2 3.8 56.75 0.5 237.5
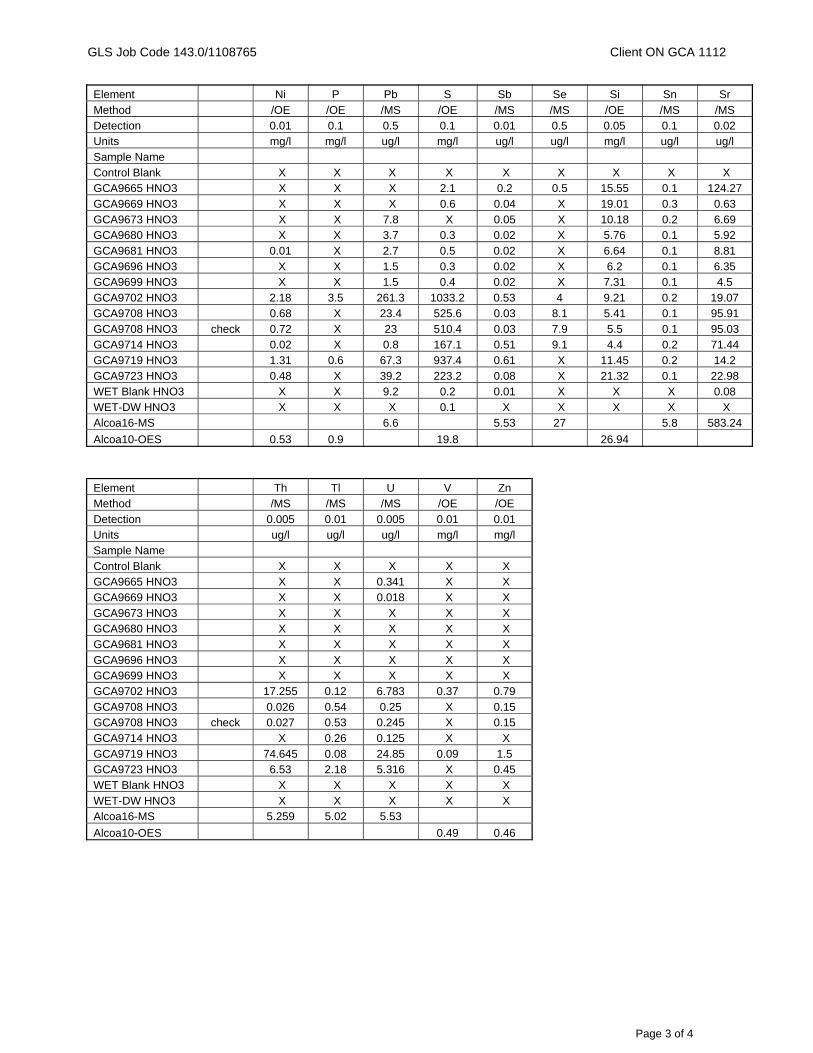
GLS Job Code 143.0/1108765 Client ON GCA 1112
Page 3 of 4
Element Ni P Pb S Sb Se Si Sn Sr
Method /OE /OE /MS /OE /MS /MS /OE /MS /MS Detection 0.01 0.1 0.5 0.1 0.01 0.5 0.05 0.1 0.02 Units mg/l mg/l ug/l mg/l ug/l ug/l mg/l ug/l ug/l
Sample Name Control Blank X X X X X X X X X GCA9665 HNO3 X X X 2.1 0.2 0.5 15.55 0.1 124.27
GCA9669 HNO3 X X X 0.6 0.04 X 19.01 0.3 0.63 GCA9673 HNO3 X X 7.8 X 0.05 X 10.18 0.2 6.69 GCA9680 HNO3 X X 3.7 0.3 0.02 X 5.76 0.1 5.92
GCA9681 HNO3 0.01 X 2.7 0.5 0.02 X 6.64 0.1 8.81 GCA9696 HNO3 X X 1.5 0.3 0.02 X 6.2 0.1 6.35 GCA9699 HNO3 X X 1.5 0.4 0.02 X 7.31 0.1 4.5
GCA9702 HNO3 2.18 3.5 261.3 1033.2 0.53 4 9.21 0.2 19.07 GCA9708 HNO3 0.68 X 23.4 525.6 0.03 8.1 5.41 0.1 95.91 GCA9708 HNO3 check 0.72 X 23 510.4 0.03 7.9 5.5 0.1 95.03 GCA9714 HNO3 0.02 X 0.8 167.1 0.51 9.1 4.4 0.2 71.44 GCA9719 HNO3 1.31 0.6 67.3 937.4 0.61 X 11.45 0.2 14.2 GCA9723 HNO3 0.48 X 39.2 223.2 0.08 X 21.32 0.1 22.98 WET Blank HNO3 X X 9.2 0.2 0.01 X X X 0.08 WET-DW HNO3 X X X 0.1 X X X X X Alcoa16-MS 6.6 5.53 27 5.8 583.24
Alcoa10-OES 0.53 0.9 19.8 26.94
Element Th Tl U V Zn Method /MS /MS /MS /OE /OE
Detection 0.005 0.01 0.005 0.01 0.01 Units ug/l ug/l ug/l mg/l mg/l Sample Name
Control Blank X X X X X GCA9665 HNO3 X X 0.341 X X GCA9669 HNO3 X X 0.018 X X
GCA9673 HNO3 X X X X X GCA9680 HNO3 X X X X X GCA9681 HNO3 X X X X X
GCA9696 HNO3 X X X X X GCA9699 HNO3 X X X X X GCA9702 HNO3 17.255 0.12 6.783 0.37 0.79
GCA9708 HNO3 0.026 0.54 0.25 X 0.15 GCA9708 HNO3 check 0.027 0.53 0.245 X 0.15 GCA9714 HNO3 X 0.26 0.125 X X
GCA9719 HNO3 74.645 0.08 24.85 0.09 1.5 GCA9723 HNO3 6.53 2.18 5.316 X 0.45 WET Blank HNO3 X X X X X
WET-DW HNO3 X X X X X Alcoa16-MS 5.259 5.02 5.53
Alcoa10-OES 0.49 0.46
GLS Job Code 143.0/1108765 Client ON GCA 1112
Page 4 of 4
NATA ENDORSED DOCUMENT Company Accreditation Number 3244 The contents of this report have been prepared in accordance with the terms of NATA accreditation and as such should only be reproduced in full. NATA Signatory: Ann Evers Ann Evers Date: 18/07//2011
This document is issued in accordance with NATA accreditation requirements.
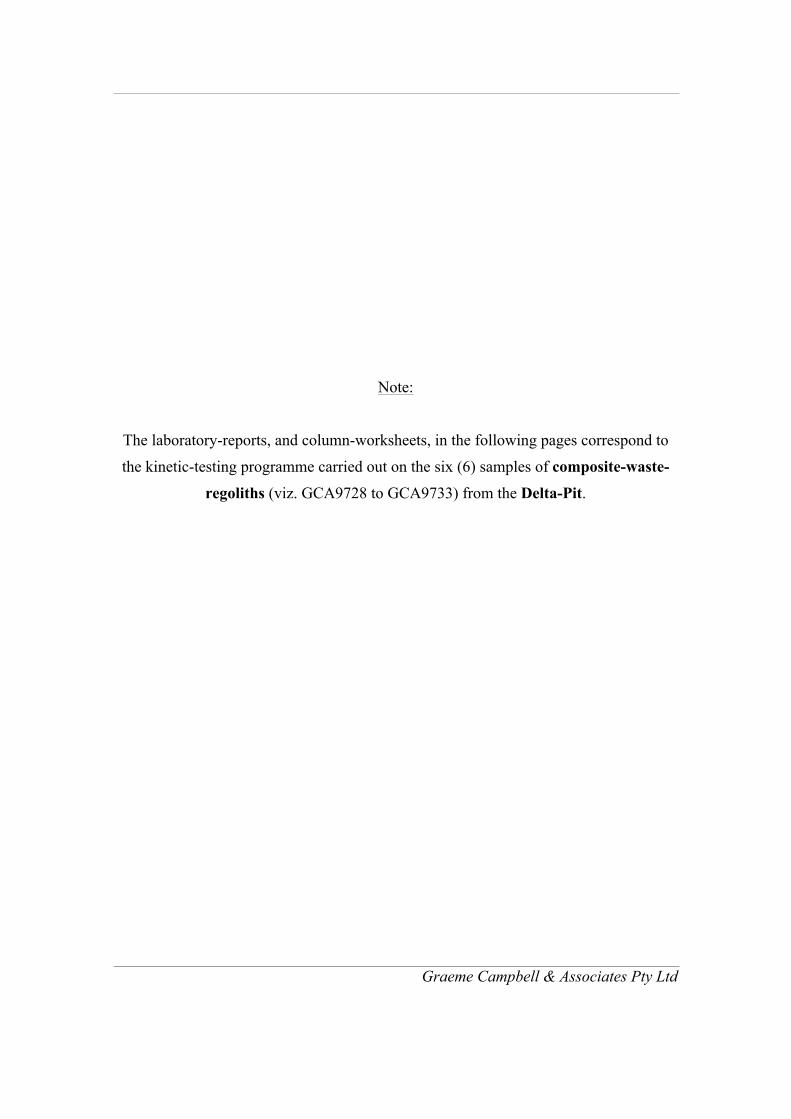
Graeme Campbell & Associates Pty Ltd
Note:
The laboratory-reports, and column-worksheets, in the following pages correspond to
the kinetic-testing programme carried out on the six (6) samples of composite-waste-
regoliths (viz. GCA9728 to GCA9733) from the Delta-Pit.

Correspondence to Box 3129, Malaga D.C. WA 6945 ACN 069 920 476 ABN 92 076 109 663
GRAEME CAMPBELL AND ASSOCIATES 14-‐9-‐2011 PO BOX 247, BRIDGETOWN WA OUR REFERENCE 23011 YOUR REFERENCE: 1112 (FLINDERS PIOP) XRD/PLM ANALYSIS OF SIX ROCK PULPS. R & D TOWNEND
Roger Townend and Associates Consulting Mineralogists
Unit 4, 40 Irvine drive, Malaga Western Australia 6062 Phone: (08) 9248 1674 Fax: (08) 9248 1502 email: [email protected]
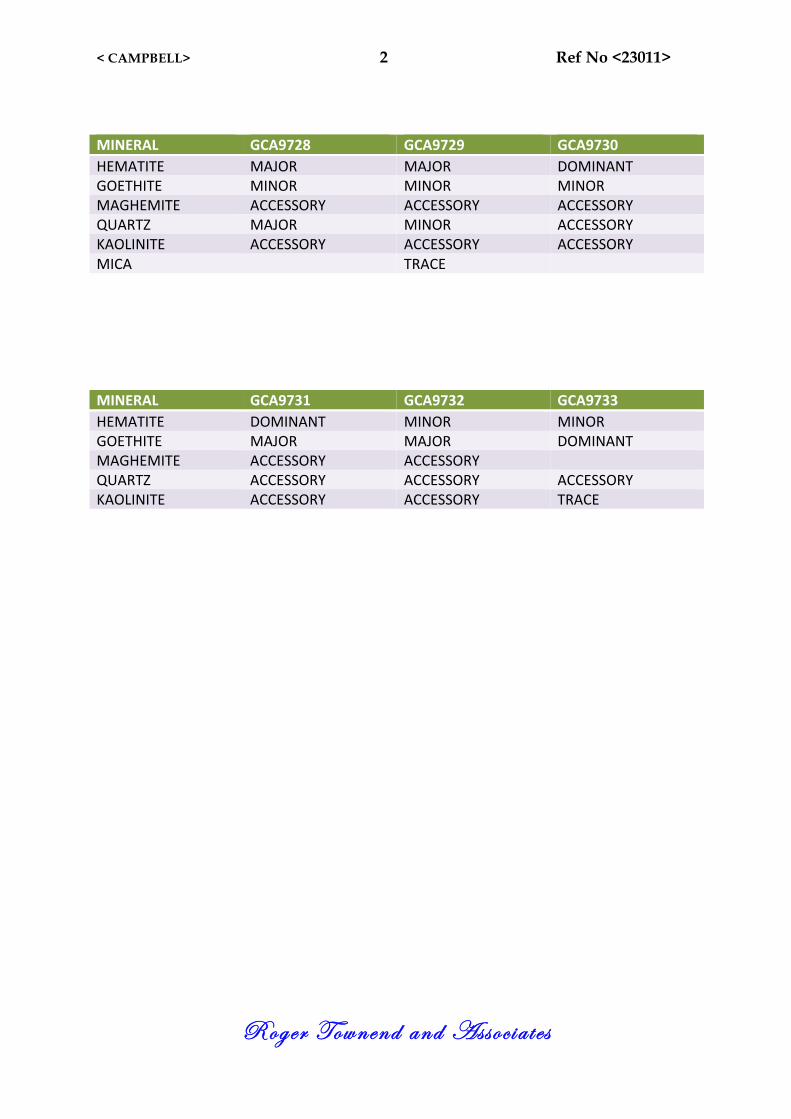
< CAMPBELL> 2 Ref No <23011>
Roger Townend and Asso c i a t e s
MINERAL GCA9728 GCA9729 GCA9730 HEMATITE MAJOR MAJOR DOMINANT GOETHITE MINOR MINOR MINOR MAGHEMITE ACCESSORY ACCESSORY ACCESSORY QUARTZ MAJOR MINOR ACCESSORY KAOLINITE ACCESSORY ACCESSORY ACCESSORY MICA TRACE MINERAL GCA9731 GCA9732 GCA9733 HEMATITE DOMINANT MINOR MINOR GOETHITE MAJOR MAJOR DOMINANT MAGHEMITE ACCESSORY ACCESSORY QUARTZ ACCESSORY ACCESSORY ACCESSORY KAOLINITE ACCESSORY ACCESSORY TRACE
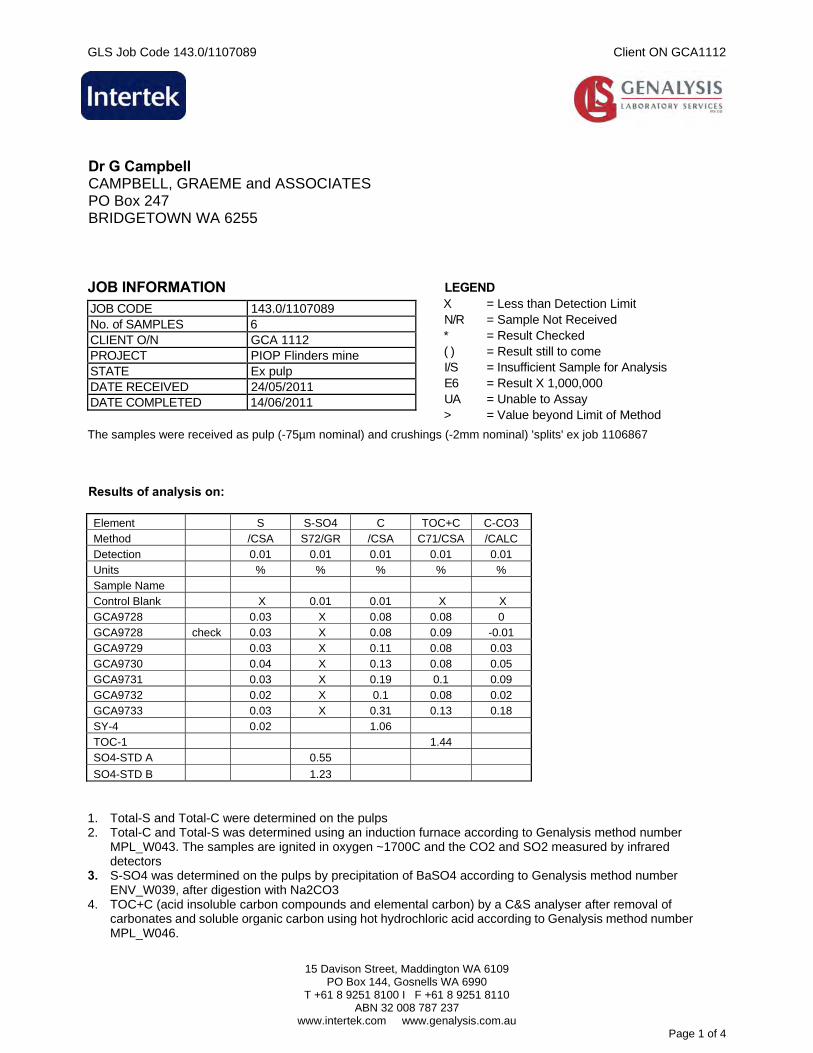
GLS Job Code 143.0/1107089 Client ON GCA1112
15 Davison Street, Maddington WA 6109
PO Box 144, Gosnells WA 6990 T +61 8 9251 8100 I F +61 8 9251 8110
ABN 32 008 787 237 www.intertek.com www.genalysis.com.au
Page 1 of 4
Dr G Campbell CAMPBELL, GRAEME and ASSOCIATES PO Box 247 BRIDGETOWN WA 6255 JOB INFORMATION
JOB CODE 143.0/1107089 No. of SAMPLES 6 CLIENT O/N GCA 1112 PROJECT PIOP Flinders mine STATE Ex pulp DATE RECEIVED 24/05/2011 DATE COMPLETED 14/06/2011
LEGEND X = Less than Detection Limit N/R = Sample Not Received * = Result Checked ( ) = Result still to come I/S = Insufficient Sample for Analysis E6 = Result X 1,000,000 UA = Unable to Assay > = Value beyond Limit of Method
The samples were received as pulp (-75µm nominal) and crushings (-2mm nominal) 'splits' ex job 1106867 Results of analysis on: Element S S-SO4 C TOC+C C-CO3 Method /CSA S72/GR /CSA C71/CSA /CALC Detection 0.01 0.01 0.01 0.01 0.01 Units % % % % % Sample Name Control Blank X 0.01 0.01 X X GCA9728 0.03 X 0.08 0.08 0 GCA9728 check 0.03 X 0.08 0.09 -0.01 GCA9729 0.03 X 0.11 0.08 0.03 GCA9730 0.04 X 0.13 0.08 0.05 GCA9731 0.03 X 0.19 0.1 0.09 GCA9732 0.02 X 0.1 0.08 0.02 GCA9733 0.03 X 0.31 0.13 0.18 SY-4 0.02 1.06 TOC-1 1.44 SO4-STD A 0.55
SO4-STD B 1.23 1. Total-S and Total-C were determined on the pulps 2. Total-C and Total-S was determined using an induction furnace according to Genalysis method number
MPL_W043. The samples are ignited in oxygen ~1700C and the CO2 and SO2 measured by infrared detectors
3. S-SO4 was determined on the pulps by precipitation of BaSO4 according to Genalysis method number ENV_W039, after digestion with Na2CO3
4. TOC+C (acid insoluble carbon compounds and elemental carbon) by a C&S analyser after removal of carbonates and soluble organic carbon using hot hydrochloric acid according to Genalysis method number MPL_W046.
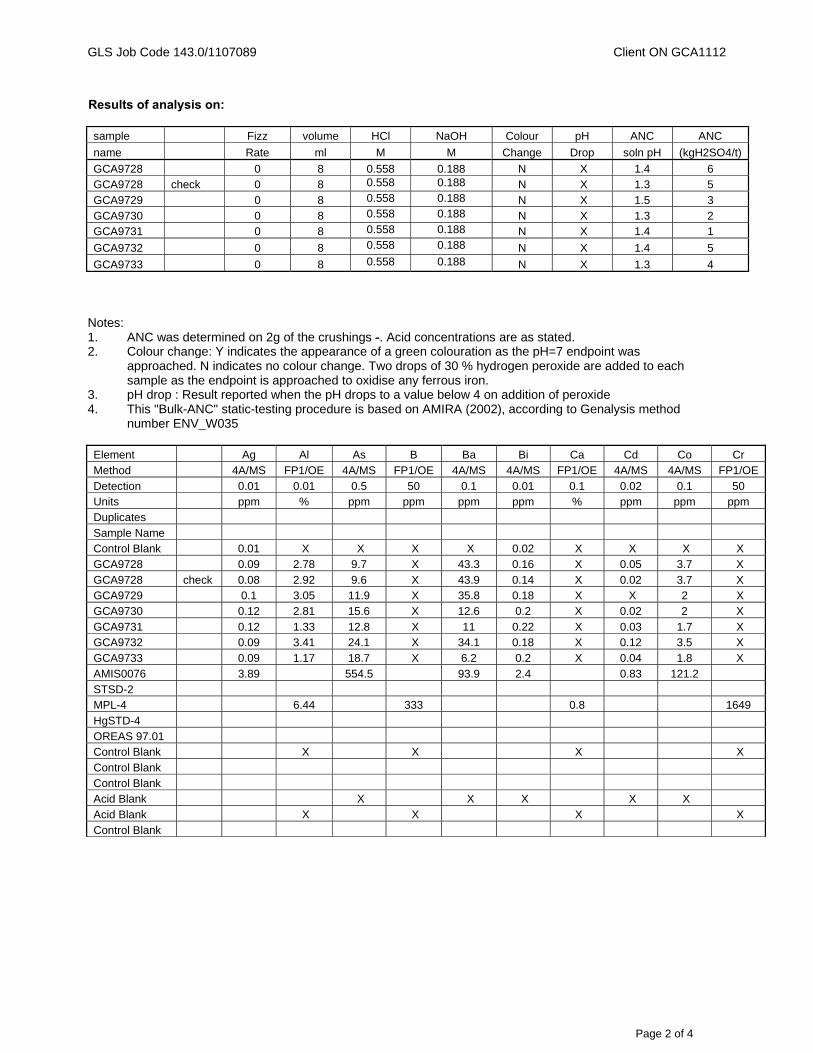
GLS Job Code 143.0/1107089 Client ON GCA1112
Page 2 of 4
Results of analysis on: sample Fizz volume HCl NaOH Colour pH ANC ANC
name Rate ml M M Change Drop soln pH (kgH2SO4/t)
GCA9728 0 8 0.558 0.188 N X 1.4 6 GCA9728 check 0 8 0.558 0.188 N X 1.3 5
GCA9729 0 8 0.558 0.188 N X 1.5 3 GCA9730 0 8 0.558 0.188 N X 1.3 2 GCA9731 0 8 0.558 0.188 N X 1.4 1
GCA9732 0 8 0.558 0.188 N X 1.4 5
GCA9733 0 8 0.558 0.188 N X 1.3 4 Notes: 1. ANC was determined on 2g of the crushings -. Acid concentrations are as stated. 2. Colour change: Y indicates the appearance of a green colouration as the pH=7 endpoint was
approached. N indicates no colour change. Two drops of 30 % hydrogen peroxide are added to each sample as the endpoint is approached to oxidise any ferrous iron.
3. pH drop : Result reported when the pH drops to a value below 4 on addition of peroxide 4. This "Bulk-ANC" static-testing procedure is based on AMIRA (2002), according to Genalysis method
number ENV_W035 Element Ag Al As B Ba Bi Ca Cd Co Cr Method 4A/MS FP1/OE 4A/MS FP1/OE 4A/MS 4A/MS FP1/OE 4A/MS 4A/MS FP1/OE
Detection 0.01 0.01 0.5 50 0.1 0.01 0.1 0.02 0.1 50 Units ppm % ppm ppm ppm ppm % ppm ppm ppm Duplicates
Sample Name Control Blank 0.01 X X X X 0.02 X X X X GCA9728 0.09 2.78 9.7 X 43.3 0.16 X 0.05 3.7 X
GCA9728 check 0.08 2.92 9.6 X 43.9 0.14 X 0.02 3.7 X GCA9729 0.1 3.05 11.9 X 35.8 0.18 X X 2 X GCA9730 0.12 2.81 15.6 X 12.6 0.2 X 0.02 2 X
GCA9731 0.12 1.33 12.8 X 11 0.22 X 0.03 1.7 X GCA9732 0.09 3.41 24.1 X 34.1 0.18 X 0.12 3.5 X GCA9733 0.09 1.17 18.7 X 6.2 0.2 X 0.04 1.8 X
AMIS0076 3.89 554.5 93.9 2.4 0.83 121.2 STSD-2 MPL-4 6.44 333 0.8 1649
HgSTD-4 OREAS 97.01 Control Blank X X X X
Control Blank Control Blank Acid Blank X X X X X
Acid Blank X X X X Control Blank
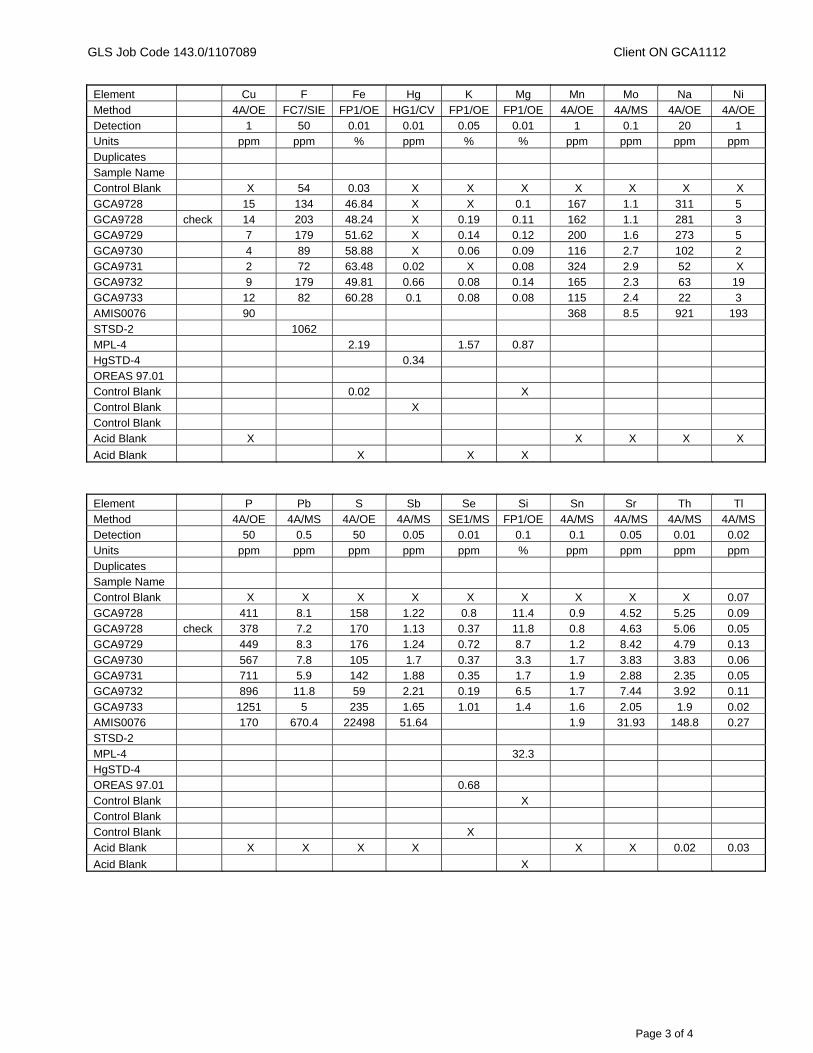
GLS Job Code 143.0/1107089 Client ON GCA1112
Page 3 of 4
Element Cu F Fe Hg K Mg Mn Mo Na Ni
Method 4A/OE FC7/SIE FP1/OE HG1/CV FP1/OE FP1/OE 4A/OE 4A/MS 4A/OE 4A/OE Detection 1 50 0.01 0.01 0.05 0.01 1 0.1 20 1 Units ppm ppm % ppm % % ppm ppm ppm ppm
Duplicates Sample Name Control Blank X 54 0.03 X X X X X X X
GCA9728 15 134 46.84 X X 0.1 167 1.1 311 5 GCA9728 check 14 203 48.24 X 0.19 0.11 162 1.1 281 3 GCA9729 7 179 51.62 X 0.14 0.12 200 1.6 273 5
GCA9730 4 89 58.88 X 0.06 0.09 116 2.7 102 2 GCA9731 2 72 63.48 0.02 X 0.08 324 2.9 52 X GCA9732 9 179 49.81 0.66 0.08 0.14 165 2.3 63 19
GCA9733 12 82 60.28 0.1 0.08 0.08 115 2.4 22 3 AMIS0076 90 368 8.5 921 193 STSD-2 1062 MPL-4 2.19 1.57 0.87 HgSTD-4 0.34 OREAS 97.01 Control Blank 0.02 X Control Blank X Control Blank Acid Blank X X X X X
Acid Blank X X X
Element P Pb S Sb Se Si Sn Sr Th Tl
Method 4A/OE 4A/MS 4A/OE 4A/MS SE1/MS FP1/OE 4A/MS 4A/MS 4A/MS 4A/MS Detection 50 0.5 50 0.05 0.01 0.1 0.1 0.05 0.01 0.02 Units ppm ppm ppm ppm ppm % ppm ppm ppm ppm
Duplicates Sample Name Control Blank X X X X X X X X X 0.07
GCA9728 411 8.1 158 1.22 0.8 11.4 0.9 4.52 5.25 0.09 GCA9728 check 378 7.2 170 1.13 0.37 11.8 0.8 4.63 5.06 0.05 GCA9729 449 8.3 176 1.24 0.72 8.7 1.2 8.42 4.79 0.13
GCA9730 567 7.8 105 1.7 0.37 3.3 1.7 3.83 3.83 0.06 GCA9731 711 5.9 142 1.88 0.35 1.7 1.9 2.88 2.35 0.05 GCA9732 896 11.8 59 2.21 0.19 6.5 1.7 7.44 3.92 0.11
GCA9733 1251 5 235 1.65 1.01 1.4 1.6 2.05 1.9 0.02 AMIS0076 170 670.4 22498 51.64 1.9 31.93 148.8 0.27 STSD-2
MPL-4 32.3 HgSTD-4 OREAS 97.01 0.68
Control Blank X Control Blank Control Blank X
Acid Blank X X X X X X 0.02 0.03
Acid Blank X
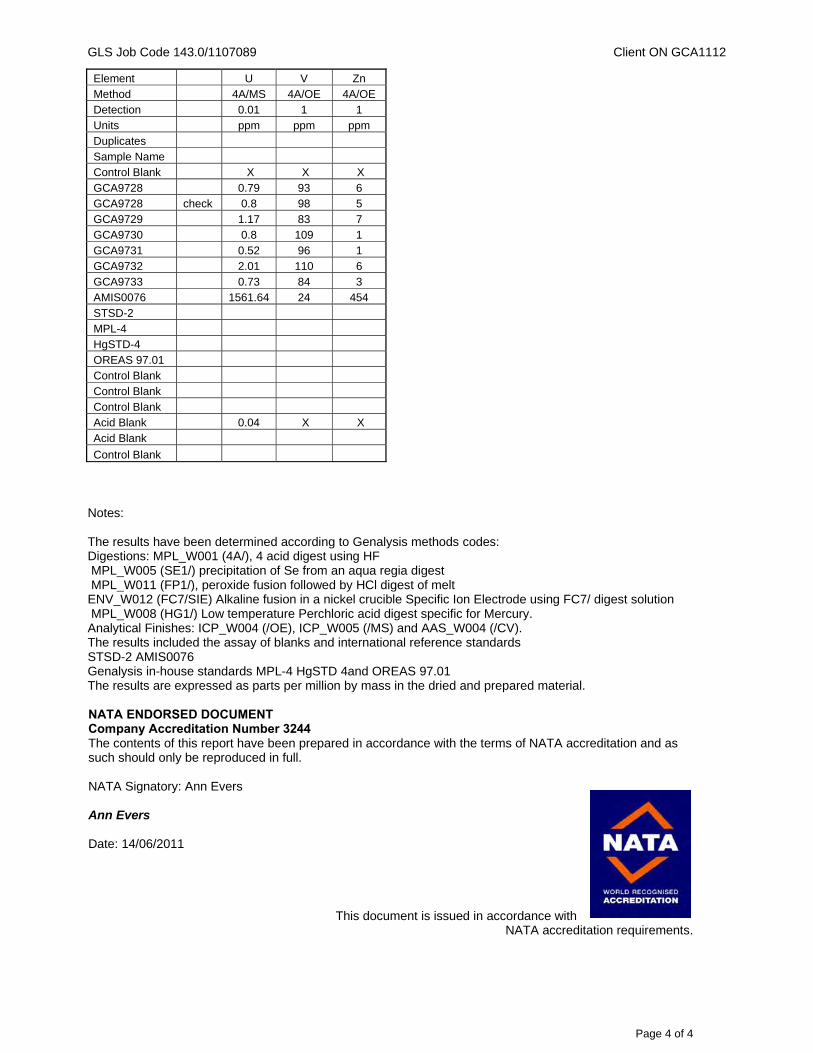
GLS Job Code 143.0/1107089 Client ON GCA1112
Page 4 of 4
Element U V Zn Method 4A/MS 4A/OE 4A/OE Detection 0.01 1 1 Units ppm ppm ppm Duplicates Sample Name Control Blank X X X GCA9728 0.79 93 6 GCA9728 check 0.8 98 5 GCA9729 1.17 83 7 GCA9730 0.8 109 1 GCA9731 0.52 96 1 GCA9732 2.01 110 6 GCA9733 0.73 84 3 AMIS0076 1561.64 24 454 STSD-2 MPL-4 HgSTD-4 OREAS 97.01 Control Blank Control Blank Control Blank Acid Blank 0.04 X X Acid Blank
Control Blank Notes: The results have been determined according to Genalysis methods codes: Digestions: MPL_W001 (4A/), 4 acid digest using HF MPL_W005 (SE1/) precipitation of Se from an aqua regia digest MPL_W011 (FP1/), peroxide fusion followed by HCl digest of melt ENV_W012 (FC7/SIE) Alkaline fusion in a nickel crucible Specific Ion Electrode using FC7/ digest solution MPL_W008 (HG1/) Low temperature Perchloric acid digest specific for Mercury. Analytical Finishes: ICP_W004 (/OE), ICP_W005 (/MS) and AAS_W004 (/CV). The results included the assay of blanks and international reference standards STSD-2 AMIS0076 Genalysis in-house standards MPL-4 HgSTD 4and OREAS 97.01 The results are expressed as parts per million by mass in the dried and prepared material. NATA ENDORSED DOCUMENT Company Accreditation Number 3244 The contents of this report have been prepared in accordance with the terms of NATA accreditation and as such should only be reproduced in full. NATA Signatory: Ann Evers Ann Evers Date: 14/06/2011
This document is issued in accordance with NATA accreditation requirements.
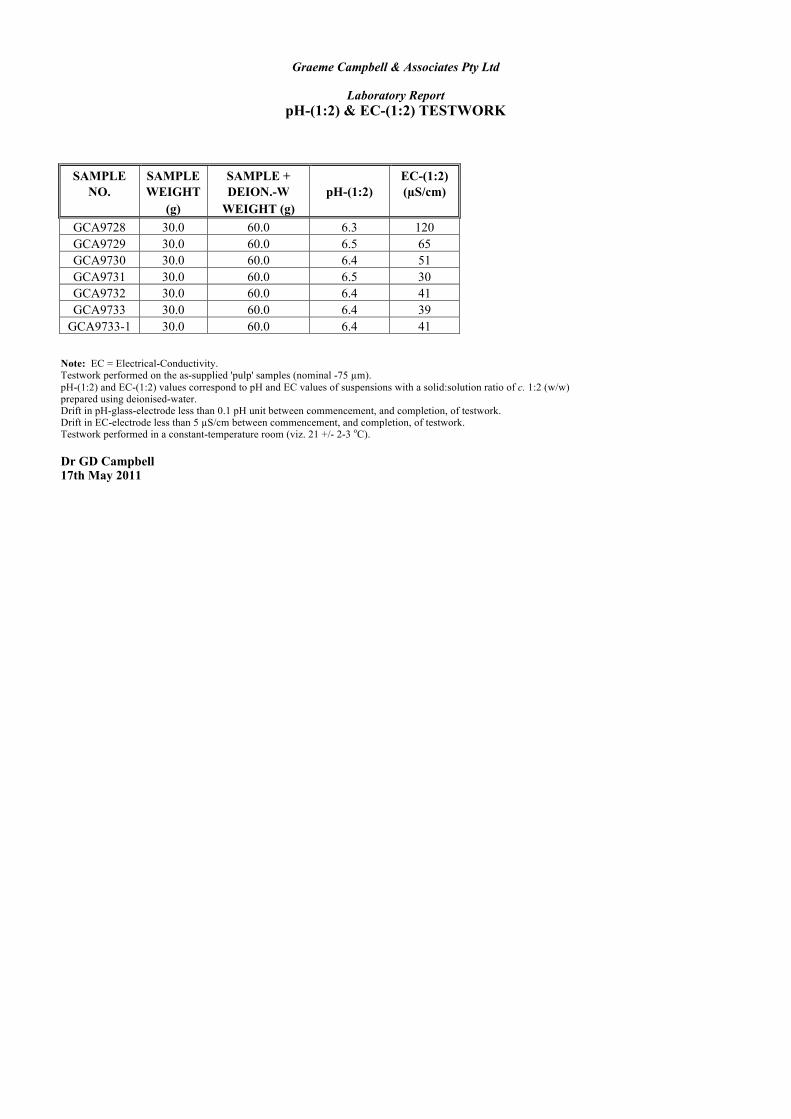
Graeme Campbell & Associates Pty Ltd
Laboratory Report pH-(1:2) & EC-(1:2) TESTWORK
SAMPLE SAMPLE SAMPLE + EC-(1:2) NO. WEIGHT DEION.-W pH-(1:2) (µS/cm)
(g) WEIGHT (g) GCA9728 30.0 60.0 6.3 120 GCA9729 30.0 60.0 6.5 65 GCA9730 30.0 60.0 6.4 51 GCA9731 30.0 60.0 6.5 30 GCA9732 30.0 60.0 6.4 41 GCA9733 30.0 60.0 6.4 39
GCA9733-1 30.0 60.0 6.4 41 Note: EC = Electrical-Conductivity. Testwork performed on the as-supplied 'pulp' samples (nominal -75 µm). pH-(1:2) and EC-(1:2) values correspond to pH and EC values of suspensions with a solid:solution ratio of c. 1:2 (w/w) prepared using deionised-water. Drift in pH-glass-electrode less than 0.1 pH unit between commencement, and completion, of testwork. Drift in EC-electrode less than 5 µS/cm between commencement, and completion, of testwork. Testwork performed in a constant-temperature room (viz. 21 +/- 2-3 oC). Dr GD Campbell 17th May 2011
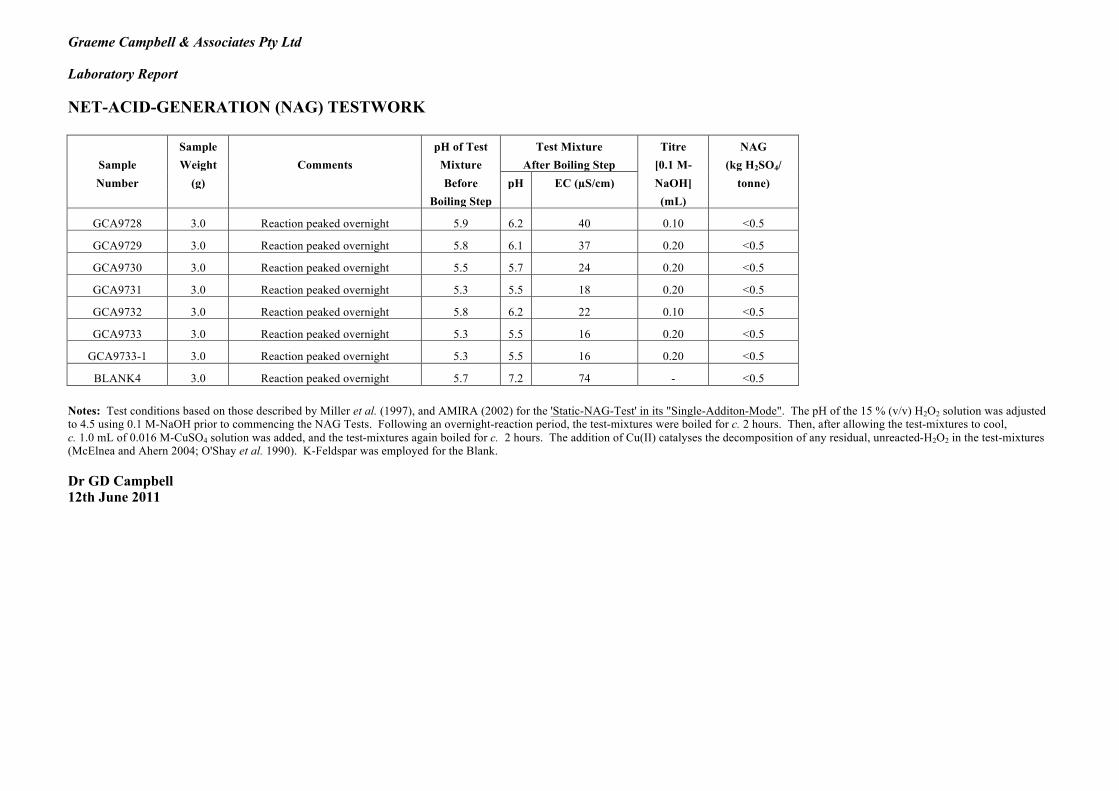
Graeme Campbell & Associates Pty Ltd Laboratory Report NET-ACID-GENERATION (NAG) TESTWORK Sample pH of Test Test Mixture Titre NAG
Sample Weight Comments Mixture After Boiling Step [0.1 M- (kg H2SO4/ Number (g) Before pH EC (µS/cm) NaOH] tonne)
Boiling Step (mL)
GCA9728 3.0 Reaction peaked overnight 5.9 6.2 40 0.10 <0.5
GCA9729 3.0 Reaction peaked overnight 5.8 6.1 37 0.20 <0.5
GCA9730 3.0 Reaction peaked overnight 5.5 5.7 24 0.20 <0.5
GCA9731 3.0 Reaction peaked overnight 5.3 5.5 18 0.20 <0.5
GCA9732 3.0 Reaction peaked overnight 5.8 6.2 22 0.10 <0.5
GCA9733 3.0 Reaction peaked overnight 5.3 5.5 16 0.20 <0.5
GCA9733-1 3.0 Reaction peaked overnight 5.3 5.5 16 0.20 <0.5
BLANK4 3.0 Reaction peaked overnight 5.7 7.2 74 - <0.5 Notes: Test conditions based on those described by Miller et al. (1997), and AMIRA (2002) for the 'Static-NAG-Test' in its "Single-Additon-Mode". The pH of the 15 % (v/v) H2O2 solution was adjusted to 4.5 using 0.1 M-NaOH prior to commencing the NAG Tests. Following an overnight-reaction period, the test-mixtures were boiled for c. 2 hours. Then, after allowing the test-mixtures to cool, c. 1.0 mL of 0.016 M-CuSO4 solution was added, and the test-mixtures again boiled for c. 2 hours. The addition of Cu(II) catalyses the decomposition of any residual, unreacted-H2O2 in the test-mixtures (McElnea and Ahern 2004; O'Shay et al. 1990). K-Feldspar was employed for the Blank. Dr GD Campbell 12th June 2011
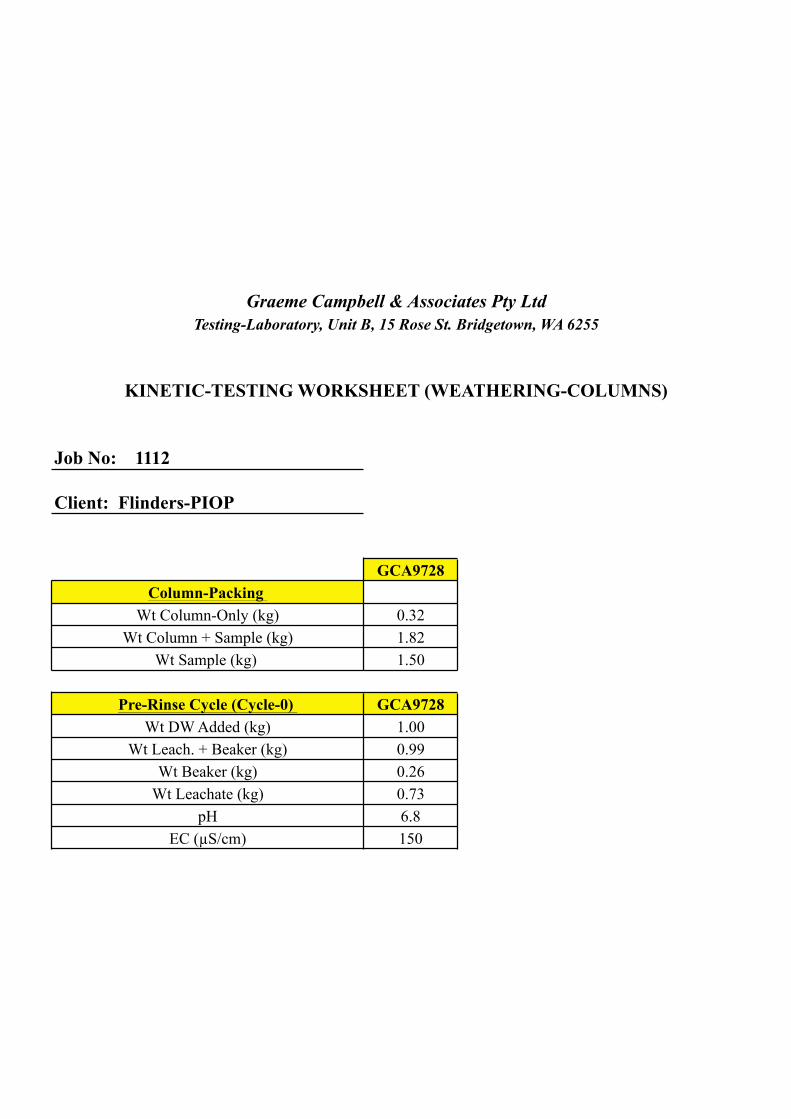
Job No: 1112
Client: Flinders-PIOP
GCA9728Column-Packing
Wt Column-Only (kg) 0.32Wt Column + Sample (kg) 1.82
Wt Sample (kg) 1.50
Pre-Rinse Cycle (Cycle-0) GCA9728Wt DW Added (kg) 1.00
Wt Leach. + Beaker (kg) 0.99Wt Beaker (kg) 0.26
Wt Leachate (kg) 0.73pH 6.8
EC (µS/cm) 150
Graeme Campbell & Associates Pty LtdTesting-Laboratory, Unit B, 15 Rose St. Bridgetown, WA 6255
KINETIC-TESTING WORKSHEET (WEATHERING-COLUMNS)

GCA9728Weathering-Cycles
Cycle No. 1DAY-1 (i.e. Start-of-Day-1) [Monday]
Lamps-On: Date 6/6/11Lamps-On: Time 17:00
Wt Deionised-Water Added (kg) 1.00(Lamps remain off)
After-FlushingWt Drained-Column(kg) 1.99
Gravimetric-Water-Content (%, w/w) 11.3Wt Leachate + Beaker (kg) 0.92
Wt Beaker (kg) 0.26Wt Leachate (kg) 0.66
Leachate-pH 7.0Leachate-EC (µS/cm) 63
N.B. Approx. 2 weeks to complete draining.
GCA9728Weathering-Cycles
Cycle No. 2DAY-1 (i.e. Start-of-Day-1) [Monday]
Lamps-On: Date 27/6/11Lamps-On: Time 17:00
Wt Deionised-Water Added (kg) 1.00(Lamps remain off)
After-FlushingWt Drained-Column(kg) 2.00
Gravimetric-Water-Content (%, w/w) 12.0Wt Leachate + Beaker (kg) 0.91
Wt Beaker (kg) 0.26Wt Leachate (kg) 0.65
Leachate-pH 6.6Leachate-EC (µS/cm) 49
N.B. Approx. 2 weeks to complete draining.
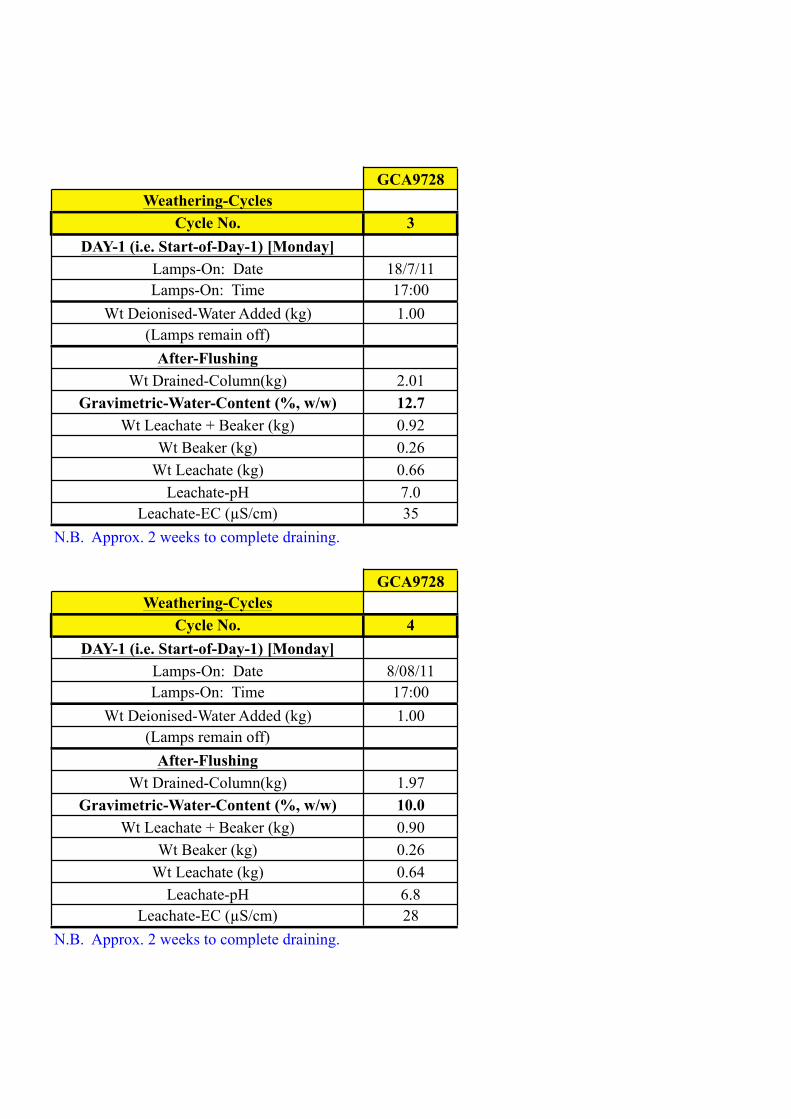
GCA9728Weathering-Cycles
Cycle No. 3DAY-1 (i.e. Start-of-Day-1) [Monday]
Lamps-On: Date 18/7/11Lamps-On: Time 17:00
Wt Deionised-Water Added (kg) 1.00(Lamps remain off)
After-FlushingWt Drained-Column(kg) 2.01
Gravimetric-Water-Content (%, w/w) 12.7Wt Leachate + Beaker (kg) 0.92
Wt Beaker (kg) 0.26Wt Leachate (kg) 0.66
Leachate-pH 7.0Leachate-EC (µS/cm) 35
N.B. Approx. 2 weeks to complete draining.
GCA9728Weathering-Cycles
Cycle No. 4DAY-1 (i.e. Start-of-Day-1) [Monday]
Lamps-On: Date 8/08/11Lamps-On: Time 17:00
Wt Deionised-Water Added (kg) 1.00(Lamps remain off)
After-FlushingWt Drained-Column(kg) 1.97
Gravimetric-Water-Content (%, w/w) 10.0Wt Leachate + Beaker (kg) 0.90
Wt Beaker (kg) 0.26Wt Leachate (kg) 0.64
Leachate-pH 6.8Leachate-EC (µS/cm) 28
N.B. Approx. 2 weeks to complete draining.
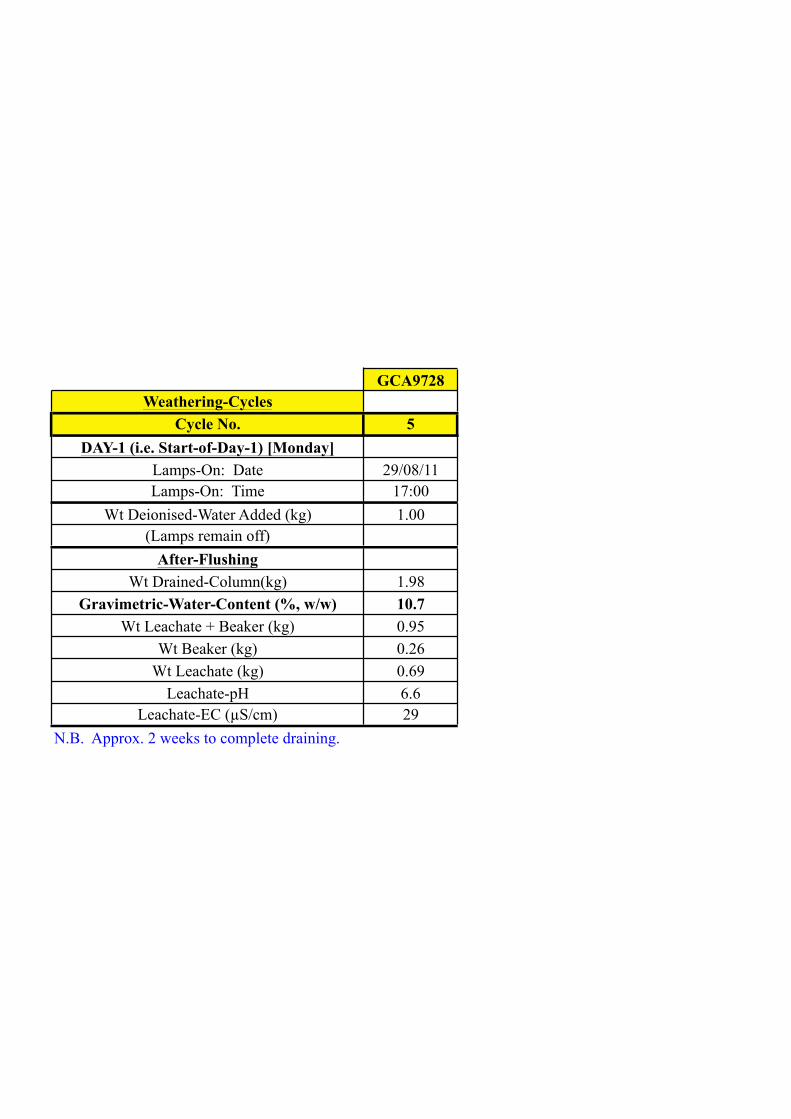
GCA9728Weathering-Cycles
Cycle No. 5DAY-1 (i.e. Start-of-Day-1) [Monday]
Lamps-On: Date 29/08/11Lamps-On: Time 17:00
Wt Deionised-Water Added (kg) 1.00(Lamps remain off)
After-FlushingWt Drained-Column(kg) 1.98
Gravimetric-Water-Content (%, w/w) 10.7Wt Leachate + Beaker (kg) 0.95
Wt Beaker (kg) 0.26Wt Leachate (kg) 0.69
Leachate-pH 6.6Leachate-EC (µS/cm) 29
N.B. Approx. 2 weeks to complete draining.
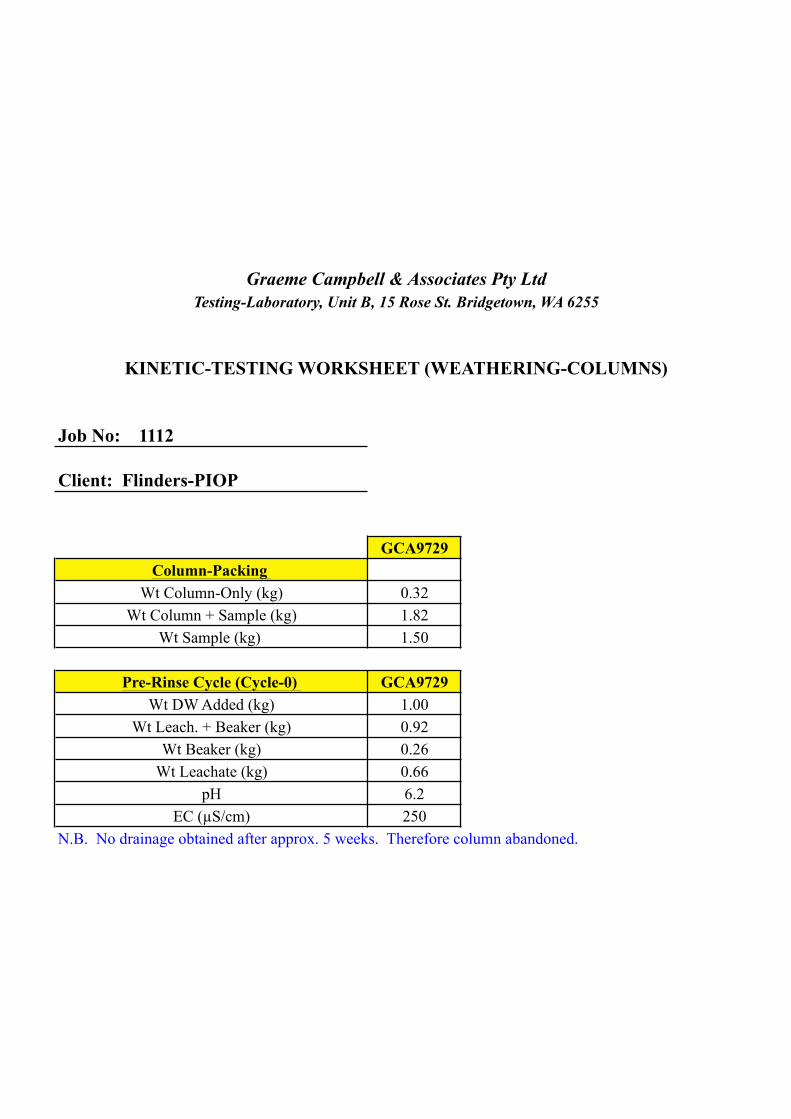
Job No: 1112
Client: Flinders-PIOP
GCA9729Column-Packing
Wt Column-Only (kg) 0.32Wt Column + Sample (kg) 1.82
Wt Sample (kg) 1.50
Pre-Rinse Cycle (Cycle-0) GCA9729Wt DW Added (kg) 1.00
Wt Leach. + Beaker (kg) 0.92Wt Beaker (kg) 0.26
Wt Leachate (kg) 0.66pH 6.2
EC (µS/cm) 250N.B. No drainage obtained after approx. 5 weeks. Therefore column abandoned.
Graeme Campbell & Associates Pty LtdTesting-Laboratory, Unit B, 15 Rose St. Bridgetown, WA 6255
KINETIC-TESTING WORKSHEET (WEATHERING-COLUMNS)
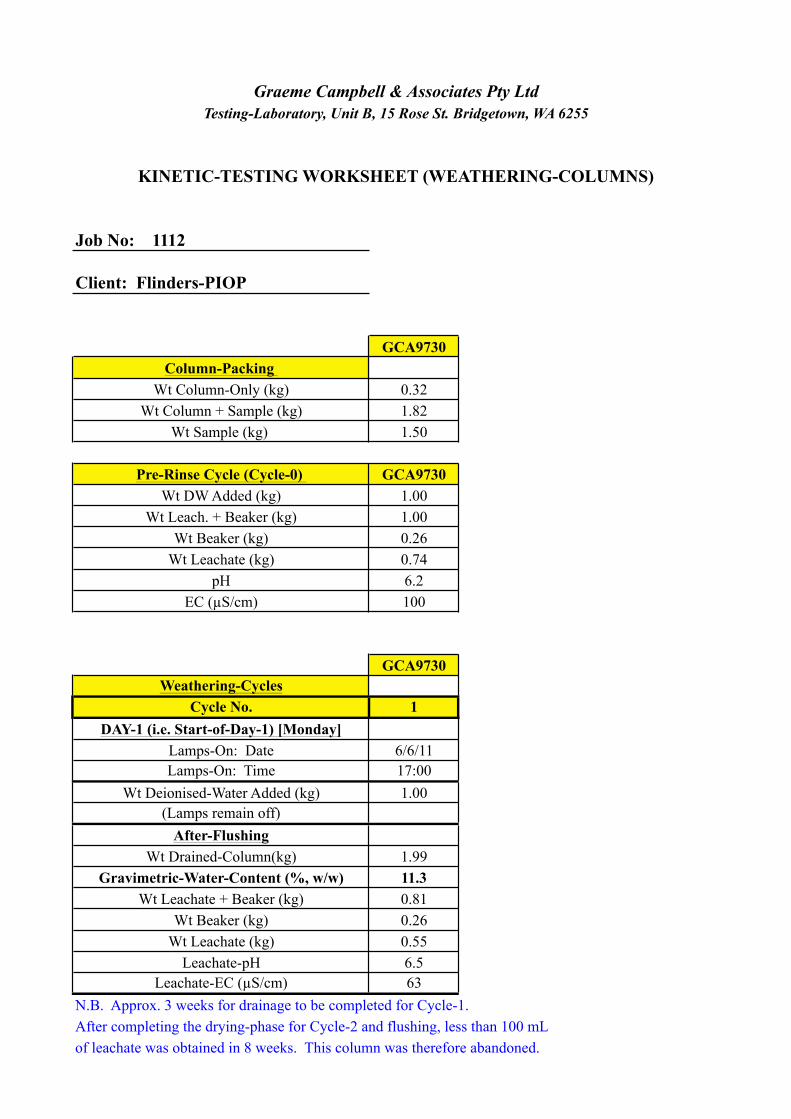
Job No: 1112
Client: Flinders-PIOP
GCA9730Column-Packing
Wt Column-Only (kg) 0.32Wt Column + Sample (kg) 1.82
Wt Sample (kg) 1.50
Pre-Rinse Cycle (Cycle-0) GCA9730Wt DW Added (kg) 1.00
Wt Leach. + Beaker (kg) 1.00Wt Beaker (kg) 0.26
Wt Leachate (kg) 0.74pH 6.2
EC (µS/cm) 100
GCA9730Weathering-Cycles
Cycle No. 1DAY-1 (i.e. Start-of-Day-1) [Monday]
Lamps-On: Date 6/6/11Lamps-On: Time 17:00
Wt Deionised-Water Added (kg) 1.00(Lamps remain off)
After-FlushingWt Drained-Column(kg) 1.99
Gravimetric-Water-Content (%, w/w) 11.3Wt Leachate + Beaker (kg) 0.81
Wt Beaker (kg) 0.26Wt Leachate (kg) 0.55
Leachate-pH 6.5Leachate-EC (µS/cm) 63
N.B. Approx. 3 weeks for drainage to be completed for Cycle-1.After completing the drying-phase for Cycle-2 and flushing, less than 100 mLof leachate was obtained in 8 weeks. This column was therefore abandoned.
Graeme Campbell & Associates Pty LtdTesting-Laboratory, Unit B, 15 Rose St. Bridgetown, WA 6255
KINETIC-TESTING WORKSHEET (WEATHERING-COLUMNS)
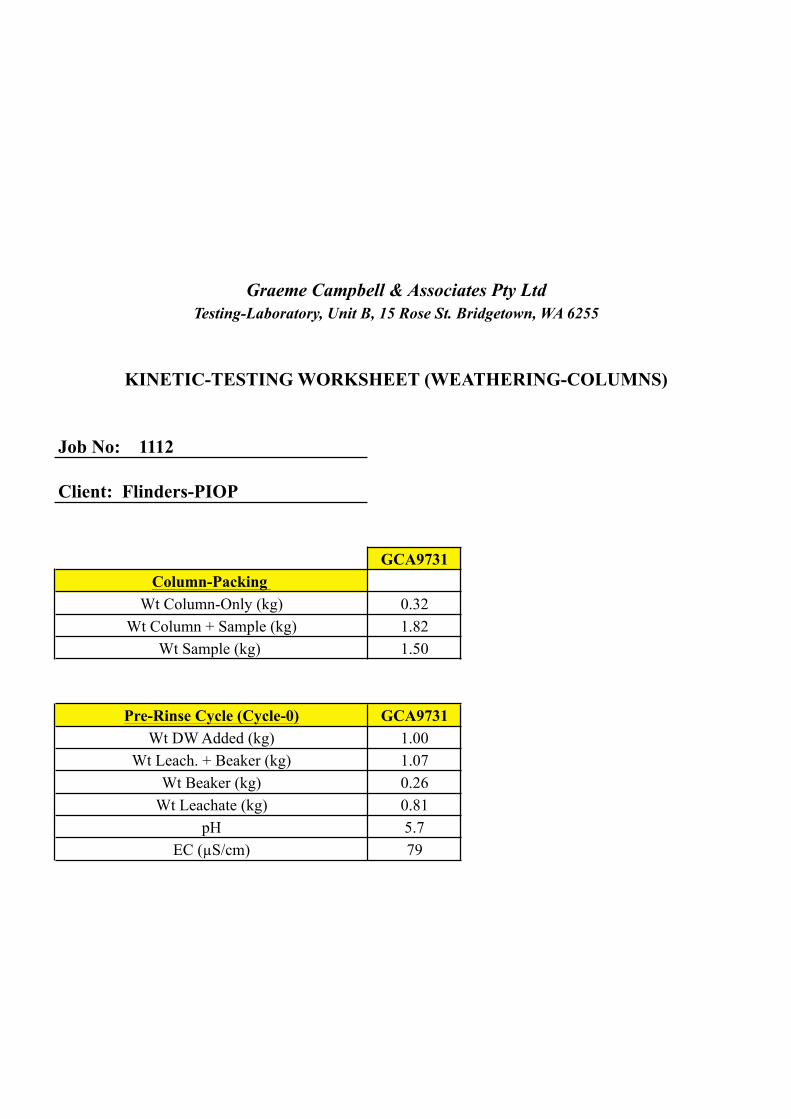
Job No: 1112
Client: Flinders-PIOP
GCA9731Column-Packing
Wt Column-Only (kg) 0.32Wt Column + Sample (kg) 1.82
Wt Sample (kg) 1.50
Pre-Rinse Cycle (Cycle-0) GCA9731Wt DW Added (kg) 1.00
Wt Leach. + Beaker (kg) 1.07Wt Beaker (kg) 0.26
Wt Leachate (kg) 0.81pH 5.7
EC (µS/cm) 79
Graeme Campbell & Associates Pty LtdTesting-Laboratory, Unit B, 15 Rose St. Bridgetown, WA 6255
KINETIC-TESTING WORKSHEET (WEATHERING-COLUMNS)
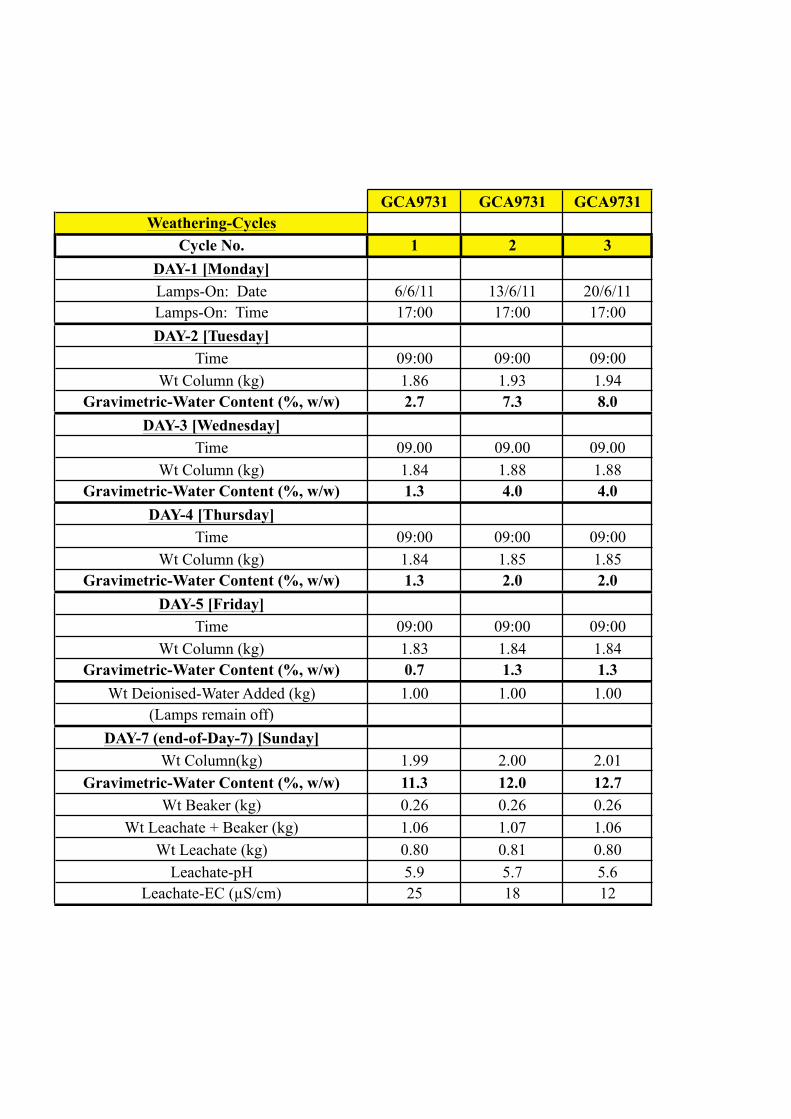
GCA9731 GCA9731 GCA9731Weathering-Cycles
Cycle No. 1 2 3DAY-1 [Monday]Lamps-On: Date 6/6/11 13/6/11 20/6/11Lamps-On: Time 17:00 17:00 17:00DAY-2 [Tuesday]
Time 09:00 09:00 09:00Wt Column (kg) 1.86 1.93 1.94
Gravimetric-Water Content (%, w/w) 2.7 7.3 8.0DAY-3 [Wednesday]
Time 09.00 09.00 09.00Wt Column (kg) 1.84 1.88 1.88
Gravimetric-Water Content (%, w/w) 1.3 4.0 4.0DAY-4 [Thursday]
Time 09:00 09:00 09:00Wt Column (kg) 1.84 1.85 1.85
Gravimetric-Water Content (%, w/w) 1.3 2.0 2.0DAY-5 [Friday]
Time 09:00 09:00 09:00Wt Column (kg) 1.83 1.84 1.84
Gravimetric-Water Content (%, w/w) 0.7 1.3 1.3Wt Deionised-Water Added (kg) 1.00 1.00 1.00
(Lamps remain off)DAY-7 (end-of-Day-7) [Sunday]
Wt Column(kg) 1.99 2.00 2.01Gravimetric-Water Content (%, w/w) 11.3 12.0 12.7
Wt Beaker (kg) 0.26 0.26 0.26Wt Leachate + Beaker (kg) 1.06 1.07 1.06
Wt Leachate (kg) 0.80 0.81 0.80Leachate-pH 5.9 5.7 5.6
Leachate-EC (µS/cm) 25 18 12

GCA9731 GCA9731 GCA9731Weathering-Cycles
Cycle No. 4 5 6DAY-1 [Monday]Lamps-On: Date 27/6/11 4/7/11 11/7/11Lamps-On: Time 17:00 17:00 17:00DAY-2 [Tuesday]
Time 09:00 09:00 09:00Wt Column (kg) 1.94 1.95 1.94
Gravimetric-Water Content (%, w/w) 8.0 8.7 8.0DAY-3 [Wednesday]
Time 09.00 09.00 09.00Wt Column (kg) 1.88 1.90 1.87
Gravimetric-Water Content (%, w/w) 4.0 5.3 3.3DAY-4 [Thursday]
Time 09:00 09:00 09:00Wt Column (kg) 1.85 1.86 1.85
Gravimetric-Water Content (%, w/w) 2.0 2.7 2.0DAY-5 [Friday]
Time 09:00 09:00 09:00Wt Column (kg) 1.84 1.84 1.83
Gravimetric-Water Content (%, w/w) 1.3 1.3 0.7Wt Deionised-Water Added (kg) 1.00 1.00 1.00
(Lamps remain off)DAY-7 (end-of-Day-7) [Sunday]
Wt Column(kg) 2.01 2.01 2.01Gravimetric-Water Content (%, w/w) 12.7 12.7 12.7
Wt Beaker (kg) 0.26 0.26 0.26Wt Leachate + Beaker (kg) 1.06 1.06 1.06
Wt Leachate (kg) 0.80 0.80 0.80Leachate-pH 6.0 5.4 5.6
Leachate-EC (µS/cm) 16 8 9

Job No: 1112
Client: Flinders-PIOP
GCA9732Column-Packing
Wt Column-Only (kg) 0.32Wt Column + Sample (kg) 1.82
Wt Sample (kg) 1.50
Pre-Rinse Cycle (Cycle-0) GCA9732Wt DW Added (kg) 1.00
Wt Leach. + Beaker (kg) 0.92Wt Beaker (kg) 0.26
Wt Leachate (kg) 0.66pH 6.5
EC (µS/cm) 210
Graeme Campbell & Associates Pty LtdTesting-Laboratory, Unit B, 15 Rose St. Bridgetown, WA 6255
KINETIC-TESTING WORKSHEET (WEATHERING-COLUMNS)
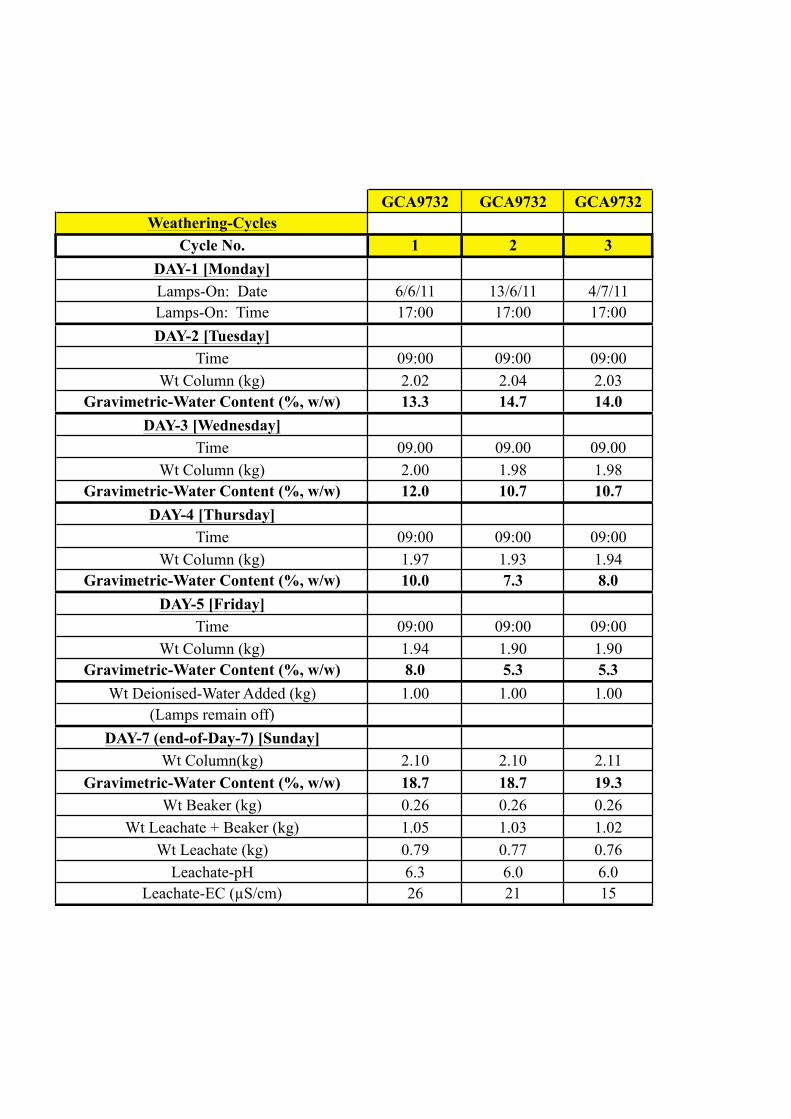
GCA9732 GCA9732 GCA9732Weathering-Cycles
Cycle No. 1 2 3DAY-1 [Monday]Lamps-On: Date 6/6/11 13/6/11 4/7/11Lamps-On: Time 17:00 17:00 17:00DAY-2 [Tuesday]
Time 09:00 09:00 09:00Wt Column (kg) 2.02 2.04 2.03
Gravimetric-Water Content (%, w/w) 13.3 14.7 14.0DAY-3 [Wednesday]
Time 09.00 09.00 09.00Wt Column (kg) 2.00 1.98 1.98
Gravimetric-Water Content (%, w/w) 12.0 10.7 10.7DAY-4 [Thursday]
Time 09:00 09:00 09:00Wt Column (kg) 1.97 1.93 1.94
Gravimetric-Water Content (%, w/w) 10.0 7.3 8.0DAY-5 [Friday]
Time 09:00 09:00 09:00Wt Column (kg) 1.94 1.90 1.90
Gravimetric-Water Content (%, w/w) 8.0 5.3 5.3Wt Deionised-Water Added (kg) 1.00 1.00 1.00
(Lamps remain off)DAY-7 (end-of-Day-7) [Sunday]
Wt Column(kg) 2.10 2.10 2.11Gravimetric-Water Content (%, w/w) 18.7 18.7 19.3
Wt Beaker (kg) 0.26 0.26 0.26Wt Leachate + Beaker (kg) 1.05 1.03 1.02
Wt Leachate (kg) 0.79 0.77 0.76Leachate-pH 6.3 6.0 6.0
Leachate-EC (µS/cm) 26 21 15
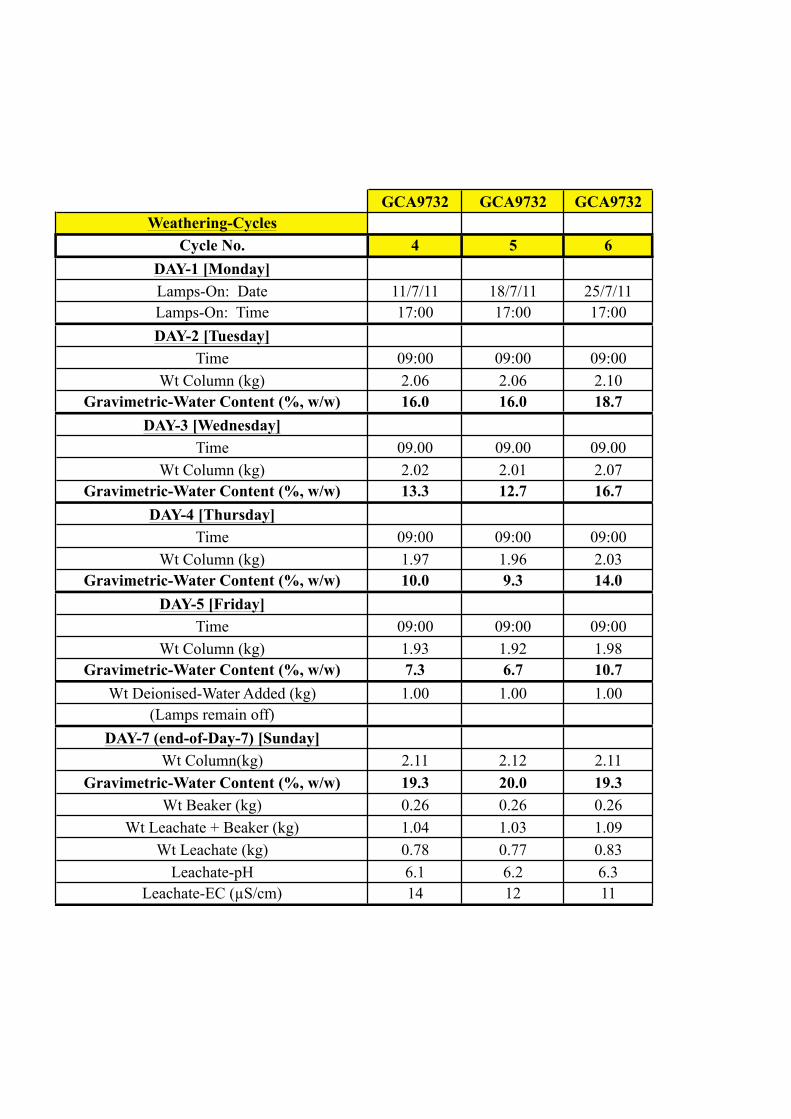
GCA9732 GCA9732 GCA9732Weathering-Cycles
Cycle No. 4 5 6DAY-1 [Monday]Lamps-On: Date 11/7/11 18/7/11 25/7/11Lamps-On: Time 17:00 17:00 17:00DAY-2 [Tuesday]
Time 09:00 09:00 09:00Wt Column (kg) 2.06 2.06 2.10
Gravimetric-Water Content (%, w/w) 16.0 16.0 18.7DAY-3 [Wednesday]
Time 09.00 09.00 09.00Wt Column (kg) 2.02 2.01 2.07
Gravimetric-Water Content (%, w/w) 13.3 12.7 16.7DAY-4 [Thursday]
Time 09:00 09:00 09:00Wt Column (kg) 1.97 1.96 2.03
Gravimetric-Water Content (%, w/w) 10.0 9.3 14.0DAY-5 [Friday]
Time 09:00 09:00 09:00Wt Column (kg) 1.93 1.92 1.98
Gravimetric-Water Content (%, w/w) 7.3 6.7 10.7Wt Deionised-Water Added (kg) 1.00 1.00 1.00
(Lamps remain off)DAY-7 (end-of-Day-7) [Sunday]
Wt Column(kg) 2.11 2.12 2.11Gravimetric-Water Content (%, w/w) 19.3 20.0 19.3
Wt Beaker (kg) 0.26 0.26 0.26Wt Leachate + Beaker (kg) 1.04 1.03 1.09
Wt Leachate (kg) 0.78 0.77 0.83Leachate-pH 6.1 6.2 6.3
Leachate-EC (µS/cm) 14 12 11

Job No: 1112
Client: Flinders-PIOP
GCA9733Column-Packing
Wt Column-Only (kg) 0.32Wt Column + Sample (kg) 1.82
Wt Sample (kg) 1.50
Pre-Rinse Cycle (Cycle-0) GCA9733Wt DW Added (kg) 1.00
Wt Leach. + Beaker (kg) 1.03Wt Beaker (kg) 0.26
Wt Leachate (kg) 0.77pH 6.2
EC (µS/cm) 130
Graeme Campbell & Associates Pty LtdTesting-Laboratory, Unit B, 15 Rose St. Bridgetown, WA 6255
KINETIC-TESTING WORKSHEET (WEATHERING-COLUMNS)

GCA9733 GCA9733 GCA9733Weathering-Cycles
Cycle No. 1 2 3DAY-1 [Monday]Lamps-On: Date 6/6/11 13/6/11 20/6/11Lamps-On: Time 17:00 17:00 17:00DAY-2 [Tuesday]
Time 09:00 09:00 09:00Wt Column (kg) 1.93 1.97 1.99
Gravimetric-Water Content (%, w/w) 7.3 10.0 11.3DAY-3 [Wednesday]
Time 09.00 09.00 09.00Wt Column (kg) 1.90 1.91 1.93
Gravimetric-Water Content (%, w/w) 5.3 6.0 7.3DAY-4 [Thursday]
Time 09:00 09:00 09:00Wt Column (kg) 1.88 1.87 1.88
Gravimetric-Water Content (%, w/w) 4.0 3.3 4.0DAY-5 [Friday]
Time 09:00 09:00 09:00Wt Column (kg) 1.86 1.86 1.86
Gravimetric-Water Content (%, w/w) 2.7 2.7 2.7Wt Deionised-Water Added (kg) 1.00 1.00 1.00
(Lamps remain off)DAY-7 (end-of-Day-7) [Sunday]
Wt Column(kg) 2.04 2.03 2.05Gravimetric-Water Content (%, w/w) 14.7 14.0 15.3
Wt Beaker (kg) 0.26 0.26 0.26Wt Leachate + Beaker (kg) 1.05 1.07 1.05
Wt Leachate (kg) 0.79 0.81 0.79Leachate-pH 6.1 6.1 5.9
Leachate-EC (µS/cm) 32 35 24
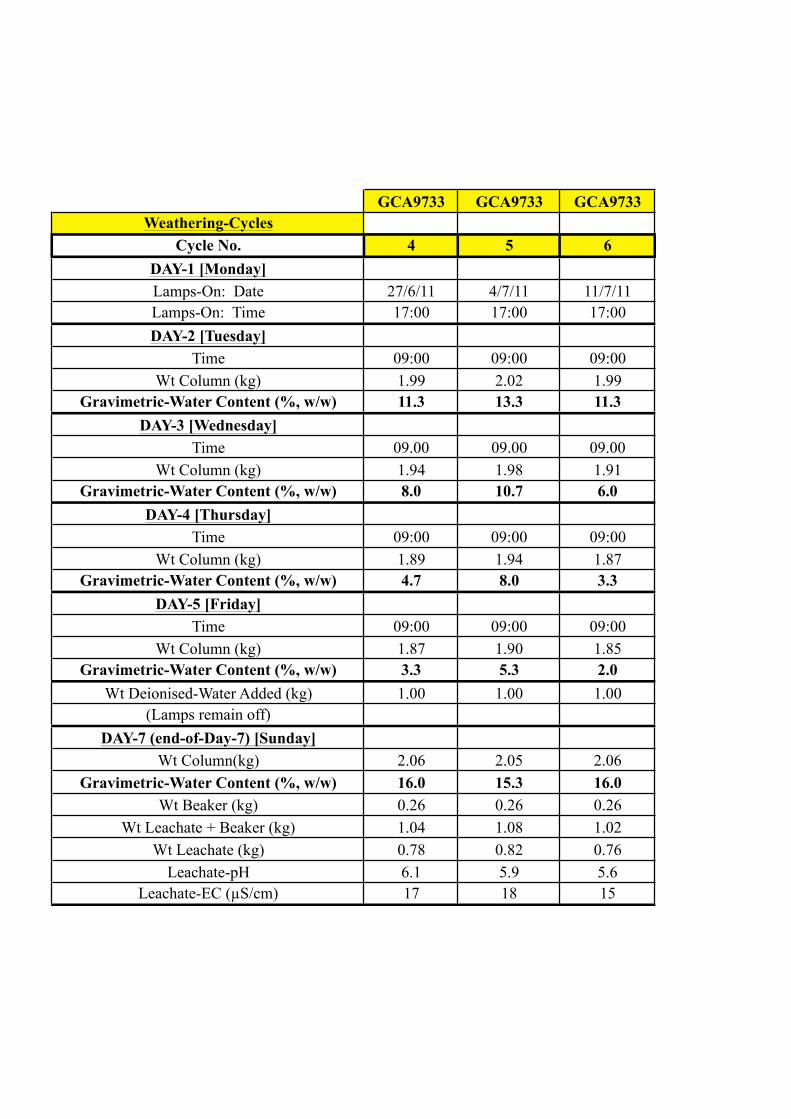
GCA9733 GCA9733 GCA9733Weathering-Cycles
Cycle No. 4 5 6DAY-1 [Monday]Lamps-On: Date 27/6/11 4/7/11 11/7/11Lamps-On: Time 17:00 17:00 17:00DAY-2 [Tuesday]
Time 09:00 09:00 09:00Wt Column (kg) 1.99 2.02 1.99
Gravimetric-Water Content (%, w/w) 11.3 13.3 11.3DAY-3 [Wednesday]
Time 09.00 09.00 09.00Wt Column (kg) 1.94 1.98 1.91
Gravimetric-Water Content (%, w/w) 8.0 10.7 6.0DAY-4 [Thursday]
Time 09:00 09:00 09:00Wt Column (kg) 1.89 1.94 1.87
Gravimetric-Water Content (%, w/w) 4.7 8.0 3.3DAY-5 [Friday]
Time 09:00 09:00 09:00Wt Column (kg) 1.87 1.90 1.85
Gravimetric-Water Content (%, w/w) 3.3 5.3 2.0Wt Deionised-Water Added (kg) 1.00 1.00 1.00
(Lamps remain off)DAY-7 (end-of-Day-7) [Sunday]
Wt Column(kg) 2.06 2.05 2.06Gravimetric-Water Content (%, w/w) 16.0 15.3 16.0
Wt Beaker (kg) 0.26 0.26 0.26Wt Leachate + Beaker (kg) 1.04 1.08 1.02
Wt Leachate (kg) 0.78 0.82 0.76Leachate-pH 6.1 5.9 5.6
Leachate-EC (µS/cm) 17 18 15
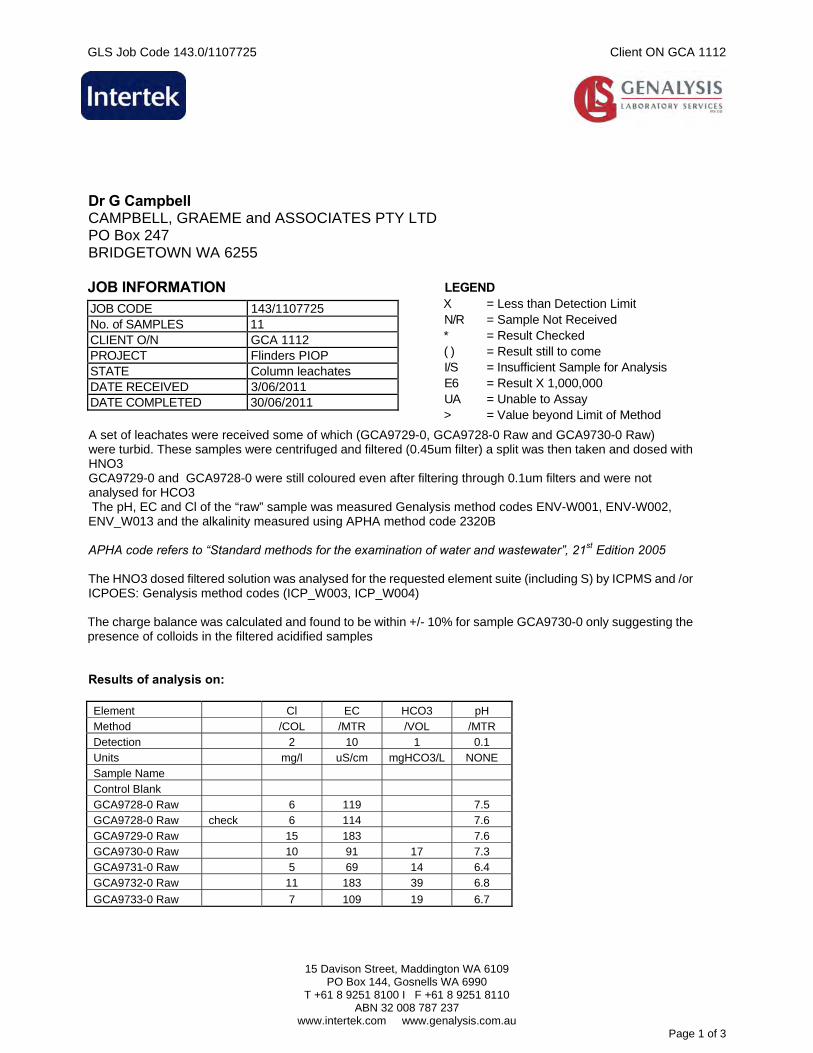
GLS Job Code 143.0/1107725 Client ON GCA 1112
15 Davison Street, Maddington WA 6109
PO Box 144, Gosnells WA 6990 T +61 8 9251 8100 I F +61 8 9251 8110
ABN 32 008 787 237 www.intertek.com www.genalysis.com.au
Page 1 of 3
Dr G Campbell CAMPBELL, GRAEME and ASSOCIATES PTY LTD PO Box 247 BRIDGETOWN WA 6255 JOB INFORMATION
JOB CODE 143/1107725 No. of SAMPLES 11 CLIENT O/N GCA 1112 PROJECT Flinders PIOP STATE Column leachates DATE RECEIVED 3/06/2011 DATE COMPLETED 30/06/2011
LEGEND X = Less than Detection Limit N/R = Sample Not Received * = Result Checked ( ) = Result still to come I/S = Insufficient Sample for Analysis E6 = Result X 1,000,000 UA = Unable to Assay > = Value beyond Limit of Method
A set of leachates were received some of which (GCA9729-0, GCA9728-0 Raw and GCA9730-0 Raw) were turbid. These samples were centrifuged and filtered (0.45um filter) a split was then taken and dosed with HNO3 GCA9729-0 and GCA9728-0 were still coloured even after filtering through 0.1um filters and were not analysed for HCO3 The pH, EC and Cl of the “raw” sample was measured Genalysis method codes ENV-W001, ENV-W002, ENV_W013 and the alkalinity measured using APHA method code 2320B APHA code refers to “Standard methods for the examination of water and wastewater”, 21st Edition 2005 The HNO3 dosed filtered solution was analysed for the requested element suite (including S) by ICPMS and /or ICPOES: Genalysis method codes (ICP_W003, ICP_W004) The charge balance was calculated and found to be within +/- 10% for sample GCA9730-0 only suggesting the presence of colloids in the filtered acidified samples Results of analysis on: Element Cl EC HCO3 pH Method /COL /MTR /VOL /MTR Detection 2 10 1 0.1 Units mg/l uS/cm mgHCO3/L NONE Sample Name Control Blank GCA9728-0 Raw 6 119 7.5 GCA9728-0 Raw check 6 114 7.6 GCA9729-0 Raw 15 183 7.6 GCA9730-0 Raw 10 91 17 7.3 GCA9731-0 Raw 5 69 14 6.4 GCA9732-0 Raw 11 183 39 6.8
GCA9733-0 Raw 7 109 19 6.7
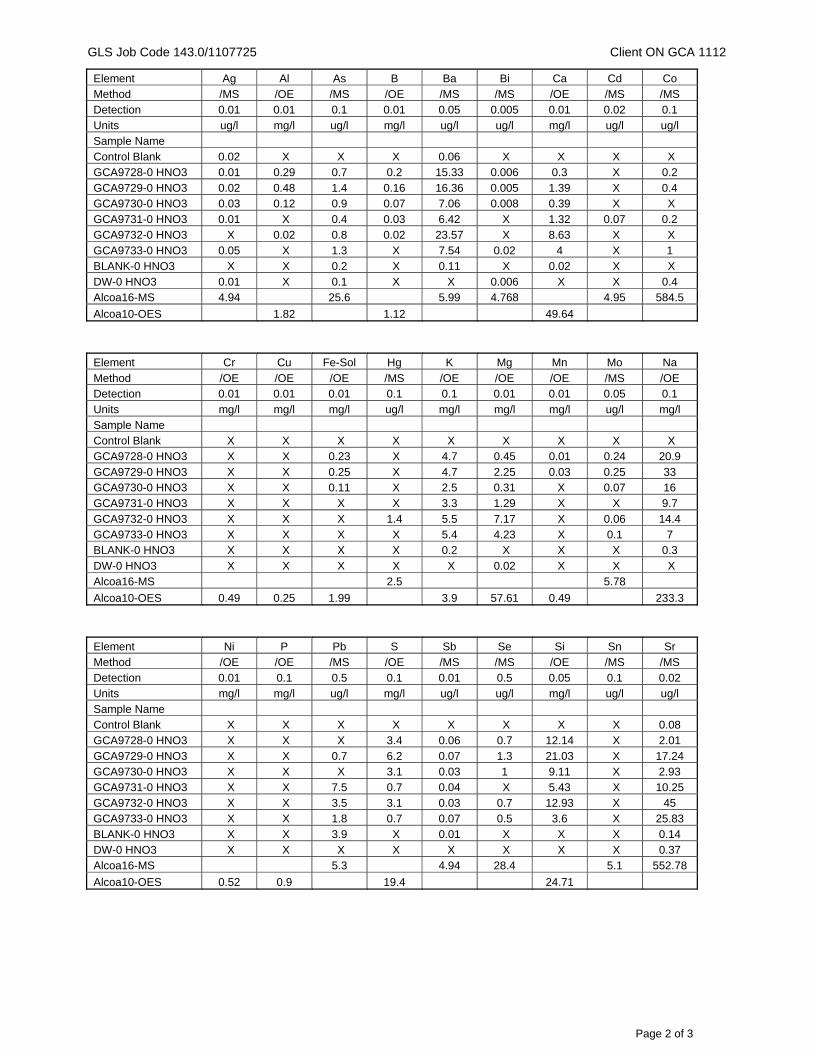
GLS Job Code 143.0/1107725 Client ON GCA 1112
Page 2 of 3
Element Ag Al As B Ba Bi Ca Cd Co Method /MS /OE /MS /OE /MS /MS /OE /MS /MS Detection 0.01 0.01 0.1 0.01 0.05 0.005 0.01 0.02 0.1 Units ug/l mg/l ug/l mg/l ug/l ug/l mg/l ug/l ug/l Sample Name Control Blank 0.02 X X X 0.06 X X X X GCA9728-0 HNO3 0.01 0.29 0.7 0.2 15.33 0.006 0.3 X 0.2 GCA9729-0 HNO3 0.02 0.48 1.4 0.16 16.36 0.005 1.39 X 0.4 GCA9730-0 HNO3 0.03 0.12 0.9 0.07 7.06 0.008 0.39 X X GCA9731-0 HNO3 0.01 X 0.4 0.03 6.42 X 1.32 0.07 0.2 GCA9732-0 HNO3 X 0.02 0.8 0.02 23.57 X 8.63 X X GCA9733-0 HNO3 0.05 X 1.3 X 7.54 0.02 4 X 1 BLANK-0 HNO3 X X 0.2 X 0.11 X 0.02 X X DW-0 HNO3 0.01 X 0.1 X X 0.006 X X 0.4 Alcoa16-MS 4.94 25.6 5.99 4.768 4.95 584.5
Alcoa10-OES 1.82 1.12 49.64
Element Cr Cu Fe-Sol Hg K Mg Mn Mo Na
Method /OE /OE /OE /MS /OE /OE /OE /MS /OE Detection 0.01 0.01 0.01 0.1 0.1 0.01 0.01 0.05 0.1 Units mg/l mg/l mg/l ug/l mg/l mg/l mg/l ug/l mg/l
Sample Name Control Blank X X X X X X X X X GCA9728-0 HNO3 X X 0.23 X 4.7 0.45 0.01 0.24 20.9
GCA9729-0 HNO3 X X 0.25 X 4.7 2.25 0.03 0.25 33 GCA9730-0 HNO3 X X 0.11 X 2.5 0.31 X 0.07 16 GCA9731-0 HNO3 X X X X 3.3 1.29 X X 9.7
GCA9732-0 HNO3 X X X 1.4 5.5 7.17 X 0.06 14.4 GCA9733-0 HNO3 X X X X 5.4 4.23 X 0.1 7 BLANK-0 HNO3 X X X X 0.2 X X X 0.3
DW-0 HNO3 X X X X X 0.02 X X X Alcoa16-MS 2.5 5.78
Alcoa10-OES 0.49 0.25 1.99 3.9 57.61 0.49 233.3
Element Ni P Pb S Sb Se Si Sn Sr Method /OE /OE /MS /OE /MS /MS /OE /MS /MS Detection 0.01 0.1 0.5 0.1 0.01 0.5 0.05 0.1 0.02 Units mg/l mg/l ug/l mg/l ug/l ug/l mg/l ug/l ug/l Sample Name Control Blank X X X X X X X X 0.08 GCA9728-0 HNO3 X X X 3.4 0.06 0.7 12.14 X 2.01 GCA9729-0 HNO3 X X 0.7 6.2 0.07 1.3 21.03 X 17.24 GCA9730-0 HNO3 X X X 3.1 0.03 1 9.11 X 2.93 GCA9731-0 HNO3 X X 7.5 0.7 0.04 X 5.43 X 10.25 GCA9732-0 HNO3 X X 3.5 3.1 0.03 0.7 12.93 X 45 GCA9733-0 HNO3 X X 1.8 0.7 0.07 0.5 3.6 X 25.83 BLANK-0 HNO3 X X 3.9 X 0.01 X X X 0.14 DW-0 HNO3 X X X X X X X X 0.37 Alcoa16-MS 5.3 4.94 28.4 5.1 552.78
Alcoa10-OES 0.52 0.9 19.4 24.71
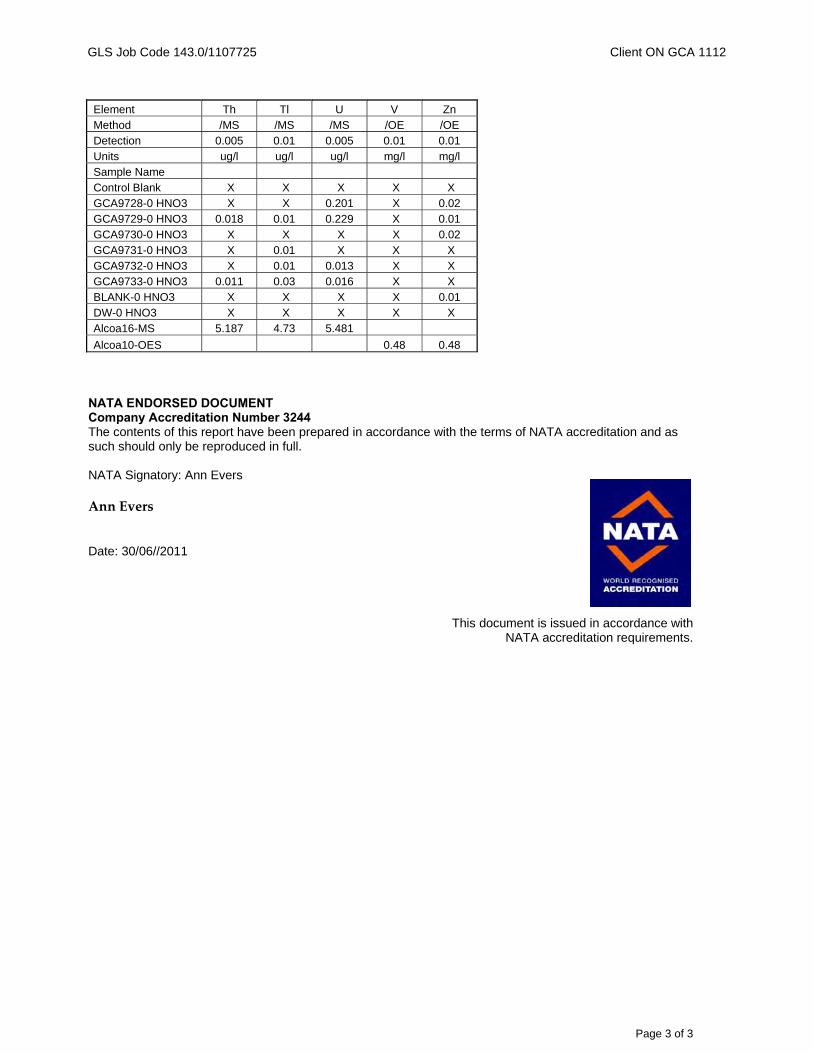
GLS Job Code 143.0/1107725 Client ON GCA 1112
Page 3 of 3
Element Th Tl U V Zn Method /MS /MS /MS /OE /OE Detection 0.005 0.01 0.005 0.01 0.01 Units ug/l ug/l ug/l mg/l mg/l Sample Name Control Blank X X X X X GCA9728-0 HNO3 X X 0.201 X 0.02 GCA9729-0 HNO3 0.018 0.01 0.229 X 0.01 GCA9730-0 HNO3 X X X X 0.02 GCA9731-0 HNO3 X 0.01 X X X GCA9732-0 HNO3 X 0.01 0.013 X X GCA9733-0 HNO3 0.011 0.03 0.016 X X BLANK-0 HNO3 X X X X 0.01 DW-0 HNO3 X X X X X Alcoa16-MS 5.187 4.73 5.481
Alcoa10-OES 0.48 0.48 NATA ENDORSED DOCUMENT Company Accreditation Number 3244 The contents of this report have been prepared in accordance with the terms of NATA accreditation and as such should only be reproduced in full. NATA Signatory: Ann Evers Ann Evers Date: 30/06//2011
This document is issued in accordance with NATA accreditation requirements.
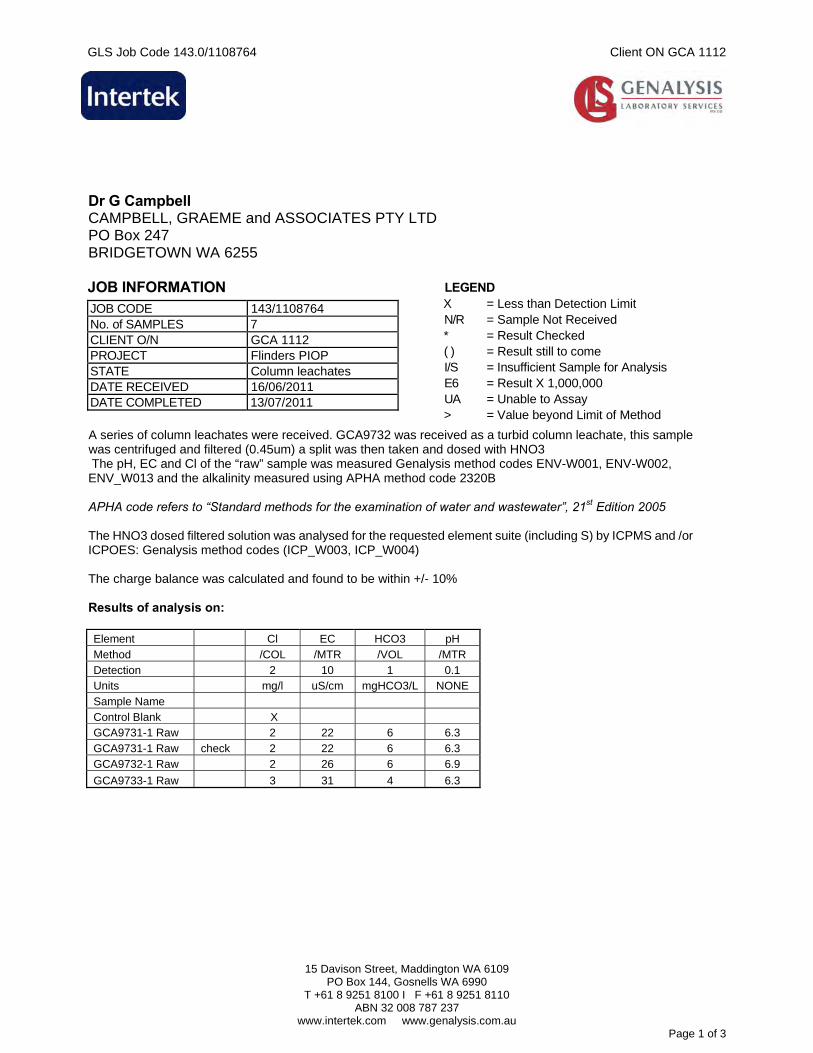
GLS Job Code 143.0/1108764 Client ON GCA 1112
15 Davison Street, Maddington WA 6109
PO Box 144, Gosnells WA 6990 T +61 8 9251 8100 I F +61 8 9251 8110
ABN 32 008 787 237 www.intertek.com www.genalysis.com.au
Page 1 of 3
Dr G Campbell CAMPBELL, GRAEME and ASSOCIATES PTY LTD PO Box 247 BRIDGETOWN WA 6255 JOB INFORMATION
JOB CODE 143/1108764 No. of SAMPLES 7 CLIENT O/N GCA 1112 PROJECT Flinders PIOP STATE Column leachates DATE RECEIVED 16/06/2011 DATE COMPLETED 13/07/2011
LEGEND X = Less than Detection Limit N/R = Sample Not Received * = Result Checked ( ) = Result still to come I/S = Insufficient Sample for Analysis E6 = Result X 1,000,000 UA = Unable to Assay > = Value beyond Limit of Method
A series of column leachates were received. GCA9732 was received as a turbid column leachate, this sample was centrifuged and filtered (0.45um) a split was then taken and dosed with HNO3 The pH, EC and Cl of the “raw” sample was measured Genalysis method codes ENV-W001, ENV-W002, ENV_W013 and the alkalinity measured using APHA method code 2320B APHA code refers to “Standard methods for the examination of water and wastewater”, 21st Edition 2005 The HNO3 dosed filtered solution was analysed for the requested element suite (including S) by ICPMS and /or ICPOES: Genalysis method codes (ICP_W003, ICP_W004) The charge balance was calculated and found to be within +/- 10% Results of analysis on: Element Cl EC HCO3 pH
Method /COL /MTR /VOL /MTR Detection 2 10 1 0.1 Units mg/l uS/cm mgHCO3/L NONE
Sample Name Control Blank X GCA9731-1 Raw 2 22 6 6.3
GCA9731-1 Raw check 2 22 6 6.3 GCA9732-1 Raw 2 26 6 6.9
GCA9733-1 Raw 3 31 4 6.3
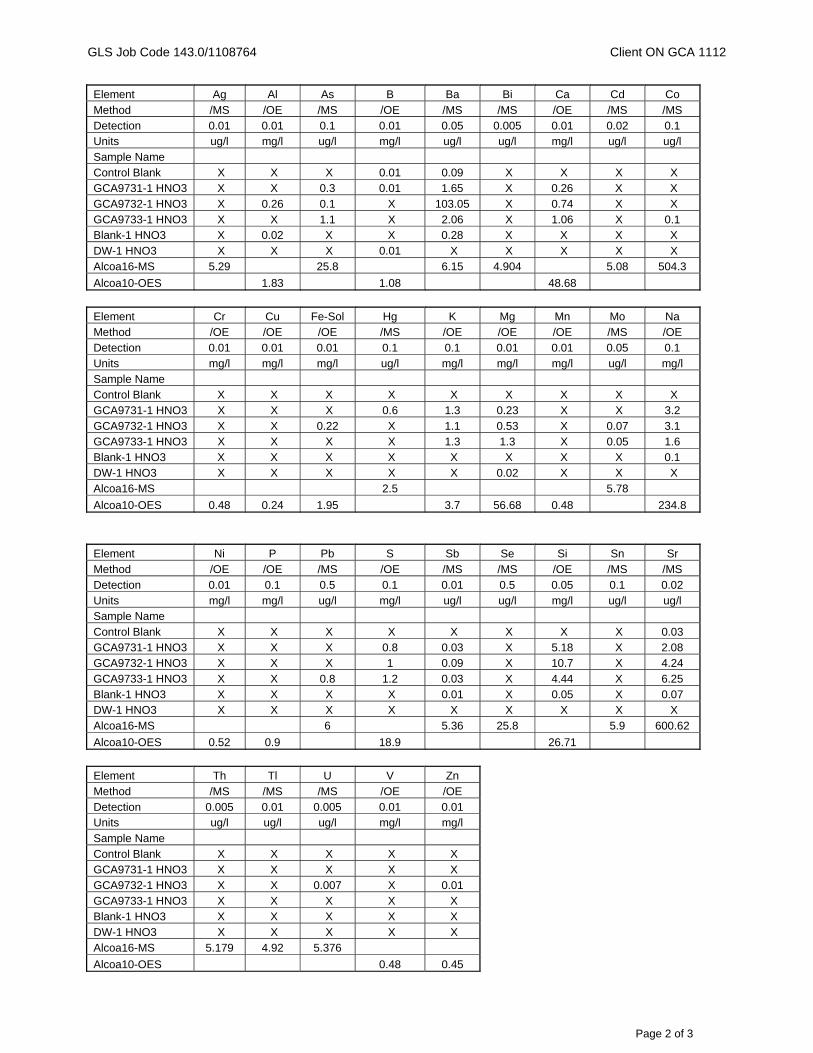
GLS Job Code 143.0/1108764 Client ON GCA 1112
Page 2 of 3
Element Ag Al As B Ba Bi Ca Cd Co
Method /MS /OE /MS /OE /MS /MS /OE /MS /MS Detection 0.01 0.01 0.1 0.01 0.05 0.005 0.01 0.02 0.1 Units ug/l mg/l ug/l mg/l ug/l ug/l mg/l ug/l ug/l
Sample Name Control Blank X X X 0.01 0.09 X X X X GCA9731-1 HNO3 X X 0.3 0.01 1.65 X 0.26 X X
GCA9732-1 HNO3 X 0.26 0.1 X 103.05 X 0.74 X X GCA9733-1 HNO3 X X 1.1 X 2.06 X 1.06 X 0.1 Blank-1 HNO3 X 0.02 X X 0.28 X X X X
DW-1 HNO3 X X X 0.01 X X X X X Alcoa16-MS 5.29 25.8 6.15 4.904 5.08 504.3
Alcoa10-OES 1.83 1.08 48.68
Element Cr Cu Fe-Sol Hg K Mg Mn Mo Na Method /OE /OE /OE /MS /OE /OE /OE /MS /OE Detection 0.01 0.01 0.01 0.1 0.1 0.01 0.01 0.05 0.1 Units mg/l mg/l mg/l ug/l mg/l mg/l mg/l ug/l mg/l Sample Name Control Blank X X X X X X X X X GCA9731-1 HNO3 X X X 0.6 1.3 0.23 X X 3.2 GCA9732-1 HNO3 X X 0.22 X 1.1 0.53 X 0.07 3.1 GCA9733-1 HNO3 X X X X 1.3 1.3 X 0.05 1.6 Blank-1 HNO3 X X X X X X X X 0.1 DW-1 HNO3 X X X X X 0.02 X X X Alcoa16-MS 2.5 5.78
Alcoa10-OES 0.48 0.24 1.95 3.7 56.68 0.48 234.8
Element Ni P Pb S Sb Se Si Sn Sr Method /OE /OE /MS /OE /MS /MS /OE /MS /MS
Detection 0.01 0.1 0.5 0.1 0.01 0.5 0.05 0.1 0.02 Units mg/l mg/l ug/l mg/l ug/l ug/l mg/l ug/l ug/l Sample Name
Control Blank X X X X X X X X 0.03 GCA9731-1 HNO3 X X X 0.8 0.03 X 5.18 X 2.08 GCA9732-1 HNO3 X X X 1 0.09 X 10.7 X 4.24
GCA9733-1 HNO3 X X 0.8 1.2 0.03 X 4.44 X 6.25 Blank-1 HNO3 X X X X 0.01 X 0.05 X 0.07 DW-1 HNO3 X X X X X X X X X
Alcoa16-MS 6 5.36 25.8 5.9 600.62
Alcoa10-OES 0.52 0.9 18.9 26.71
Element Th Tl U V Zn
Method /MS /MS /MS /OE /OE Detection 0.005 0.01 0.005 0.01 0.01 Units ug/l ug/l ug/l mg/l mg/l
Sample Name Control Blank X X X X X GCA9731-1 HNO3 X X X X X GCA9732-1 HNO3 X X 0.007 X 0.01 GCA9733-1 HNO3 X X X X X Blank-1 HNO3 X X X X X DW-1 HNO3 X X X X X Alcoa16-MS 5.179 4.92 5.376
Alcoa10-OES 0.48 0.45
GLS Job Code 143.0/1108764 Client ON GCA 1112
Page 3 of 3
NATA ENDORSED DOCUMENT Company Accreditation Number 3244 The contents of this report have been prepared in accordance with the terms of NATA accreditation and as such should only be reproduced in full. NATA Signatory: Ann Evers Ann Evers Date: 13/07//2011
This document is issued in accordance with NATA accreditation requirements.
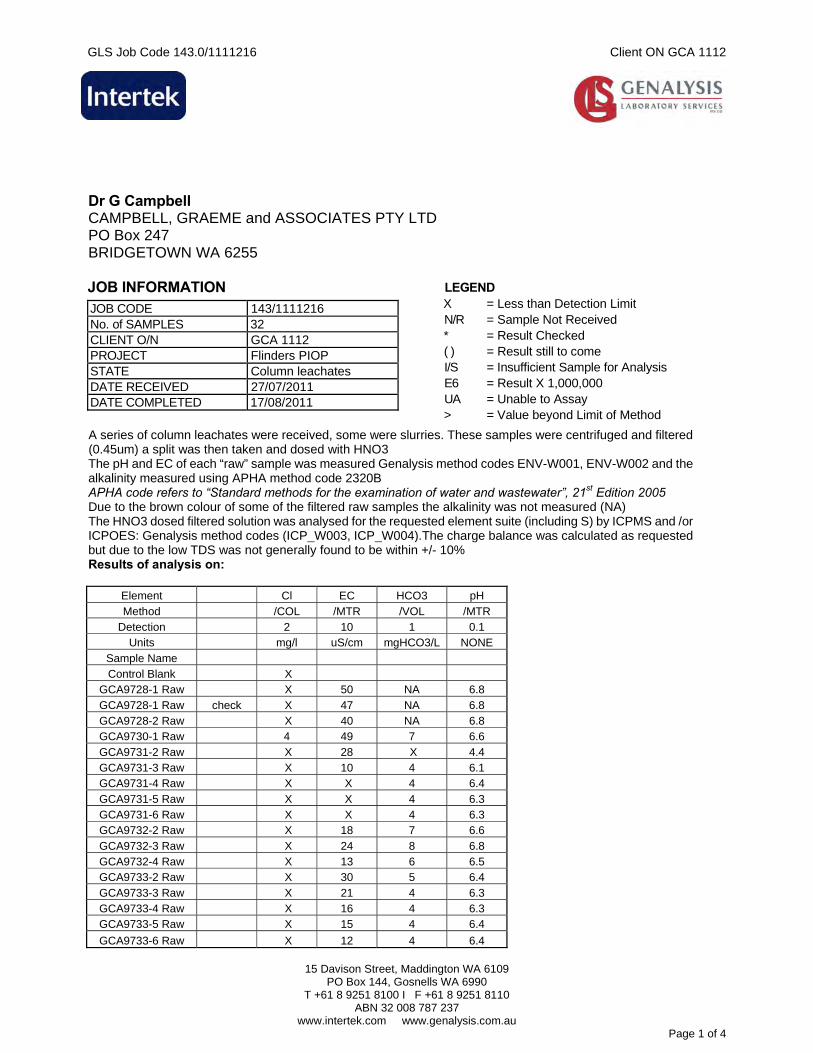
GLS Job Code 143.0/1111216 Client ON GCA 1112
15 Davison Street, Maddington WA 6109
PO Box 144, Gosnells WA 6990 T +61 8 9251 8100 I F +61 8 9251 8110
ABN 32 008 787 237 www.intertek.com www.genalysis.com.au
Page 1 of 4
Dr G Campbell CAMPBELL, GRAEME and ASSOCIATES PTY LTD PO Box 247 BRIDGETOWN WA 6255 JOB INFORMATION
JOB CODE 143/1111216 No. of SAMPLES 32 CLIENT O/N GCA 1112 PROJECT Flinders PIOP STATE Column leachates DATE RECEIVED 27/07/2011 DATE COMPLETED 17/08/2011
LEGEND X = Less than Detection Limit N/R = Sample Not Received * = Result Checked ( ) = Result still to come I/S = Insufficient Sample for Analysis E6 = Result X 1,000,000 UA = Unable to Assay > = Value beyond Limit of Method
A series of column leachates were received, some were slurries. These samples were centrifuged and filtered (0.45um) a split was then taken and dosed with HNO3 The pH and EC of each “raw” sample was measured Genalysis method codes ENV-W001, ENV-W002 and the alkalinity measured using APHA method code 2320B APHA code refers to “Standard methods for the examination of water and wastewater”, 21st Edition 2005 Due to the brown colour of some of the filtered raw samples the alkalinity was not measured (NA) The HNO3 dosed filtered solution was analysed for the requested element suite (including S) by ICPMS and /or ICPOES: Genalysis method codes (ICP_W003, ICP_W004).The charge balance was calculated as requested but due to the low TDS was not generally found to be within +/- 10% Results of analysis on:
Element Cl EC HCO3 pH
Method /COL /MTR /VOL /MTR Detection 2 10 1 0.1
Units mg/l uS/cm mgHCO3/L NONE
Sample Name Control Blank X
GCA9728-1 Raw X 50 NA 6.8
GCA9728-1 Raw check X 47 NA 6.8 GCA9728-2 Raw X 40 NA 6.8 GCA9730-1 Raw 4 49 7 6.6
GCA9731-2 Raw X 28 X 4.4 GCA9731-3 Raw X 10 4 6.1 GCA9731-4 Raw X X 4 6.4
GCA9731-5 Raw X X 4 6.3 GCA9731-6 Raw X X 4 6.3 GCA9732-2 Raw X 18 7 6.6
GCA9732-3 Raw X 24 8 6.8 GCA9732-4 Raw X 13 6 6.5 GCA9733-2 Raw X 30 5 6.4
GCA9733-3 Raw X 21 4 6.3 GCA9733-4 Raw X 16 4 6.3 GCA9733-5 Raw X 15 4 6.4
GCA9733-6 Raw X 12 4 6.4
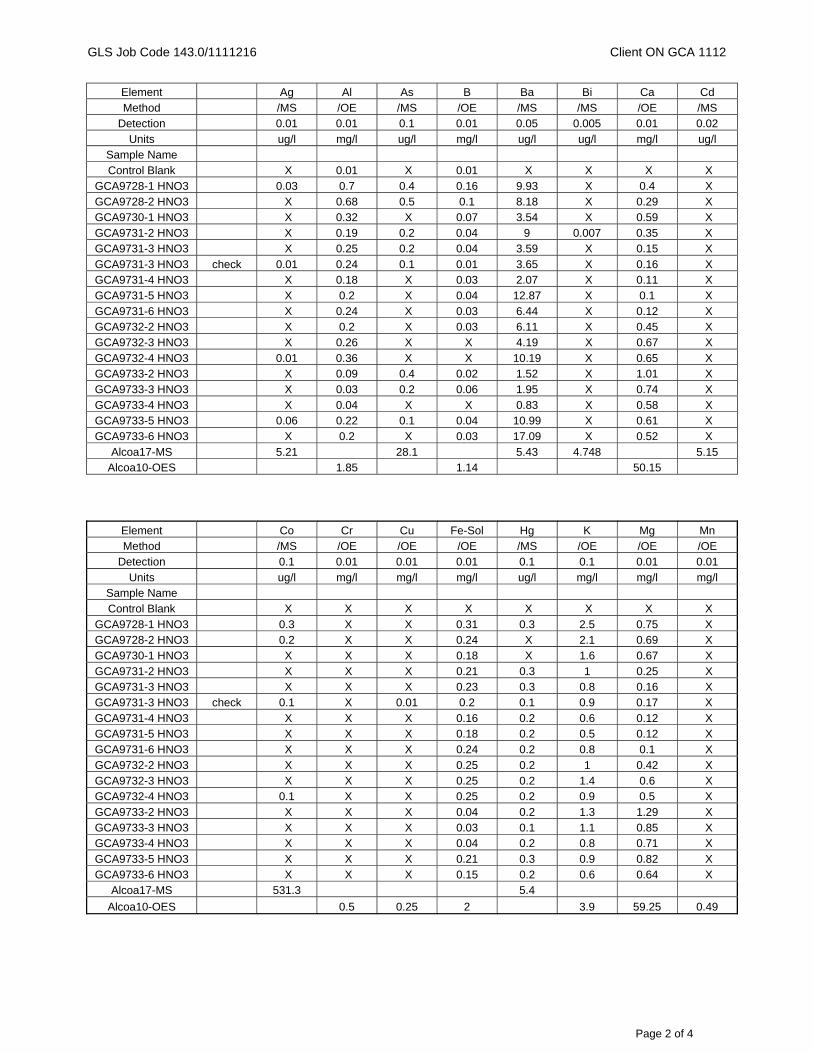
GLS Job Code 143.0/1111216 Client ON GCA 1112
Page 2 of 4
Element Ag Al As B Ba Bi Ca Cd Method /MS /OE /MS /OE /MS /MS /OE /MS
Detection 0.01 0.01 0.1 0.01 0.05 0.005 0.01 0.02 Units ug/l mg/l ug/l mg/l ug/l ug/l mg/l ug/l
Sample Name Control Blank X 0.01 X 0.01 X X X X
GCA9728-1 HNO3 0.03 0.7 0.4 0.16 9.93 X 0.4 X GCA9728-2 HNO3 X 0.68 0.5 0.1 8.18 X 0.29 X GCA9730-1 HNO3 X 0.32 X 0.07 3.54 X 0.59 X GCA9731-2 HNO3 X 0.19 0.2 0.04 9 0.007 0.35 X GCA9731-3 HNO3 X 0.25 0.2 0.04 3.59 X 0.15 X
GCA9731-3 HNO3 check 0.01 0.24 0.1 0.01 3.65 X 0.16 X GCA9731-4 HNO3 X 0.18 X 0.03 2.07 X 0.11 X GCA9731-5 HNO3 X 0.2 X 0.04 12.87 X 0.1 X
GCA9731-6 HNO3 X 0.24 X 0.03 6.44 X 0.12 X GCA9732-2 HNO3 X 0.2 X 0.03 6.11 X 0.45 X GCA9732-3 HNO3 X 0.26 X X 4.19 X 0.67 X
GCA9732-4 HNO3 0.01 0.36 X X 10.19 X 0.65 X GCA9733-2 HNO3 X 0.09 0.4 0.02 1.52 X 1.01 X GCA9733-3 HNO3 X 0.03 0.2 0.06 1.95 X 0.74 X
GCA9733-4 HNO3 X 0.04 X X 0.83 X 0.58 X GCA9733-5 HNO3 0.06 0.22 0.1 0.04 10.99 X 0.61 X GCA9733-6 HNO3 X 0.2 X 0.03 17.09 X 0.52 X
Alcoa17-MS 5.21 28.1 5.43 4.748 5.15 Alcoa10-OES 1.85 1.14 50.15
Element Co Cr Cu Fe-Sol Hg K Mg Mn Method /MS /OE /OE /OE /MS /OE /OE /OE
Detection 0.1 0.01 0.01 0.01 0.1 0.1 0.01 0.01
Units ug/l mg/l mg/l mg/l ug/l mg/l mg/l mg/l Sample Name Control Blank X X X X X X X X
GCA9728-1 HNO3 0.3 X X 0.31 0.3 2.5 0.75 X GCA9728-2 HNO3 0.2 X X 0.24 X 2.1 0.69 X GCA9730-1 HNO3 X X X 0.18 X 1.6 0.67 X
GCA9731-2 HNO3 X X X 0.21 0.3 1 0.25 X GCA9731-3 HNO3 X X X 0.23 0.3 0.8 0.16 X GCA9731-3 HNO3 check 0.1 X 0.01 0.2 0.1 0.9 0.17 X
GCA9731-4 HNO3 X X X 0.16 0.2 0.6 0.12 X GCA9731-5 HNO3 X X X 0.18 0.2 0.5 0.12 X GCA9731-6 HNO3 X X X 0.24 0.2 0.8 0.1 X
GCA9732-2 HNO3 X X X 0.25 0.2 1 0.42 X GCA9732-3 HNO3 X X X 0.25 0.2 1.4 0.6 X GCA9732-4 HNO3 0.1 X X 0.25 0.2 0.9 0.5 X
GCA9733-2 HNO3 X X X 0.04 0.2 1.3 1.29 X GCA9733-3 HNO3 X X X 0.03 0.1 1.1 0.85 X GCA9733-4 HNO3 X X X 0.04 0.2 0.8 0.71 X
GCA9733-5 HNO3 X X X 0.21 0.3 0.9 0.82 X GCA9733-6 HNO3 X X X 0.15 0.2 0.6 0.64 X
Alcoa17-MS 531.3 5.4
Alcoa10-OES 0.5 0.25 2 3.9 59.25 0.49
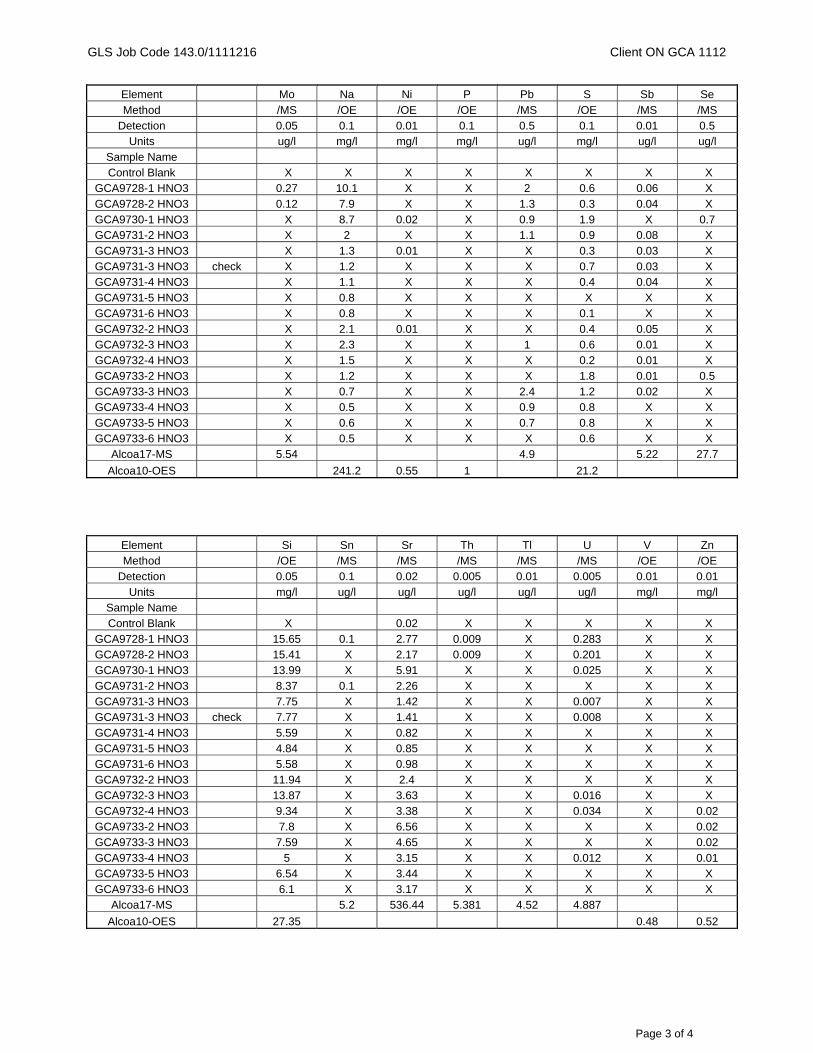
GLS Job Code 143.0/1111216 Client ON GCA 1112
Page 3 of 4
Element Mo Na Ni P Pb S Sb Se
Method /MS /OE /OE /OE /MS /OE /MS /MS Detection 0.05 0.1 0.01 0.1 0.5 0.1 0.01 0.5
Units ug/l mg/l mg/l mg/l ug/l mg/l ug/l ug/l
Sample Name Control Blank X X X X X X X X
GCA9728-1 HNO3 0.27 10.1 X X 2 0.6 0.06 X
GCA9728-2 HNO3 0.12 7.9 X X 1.3 0.3 0.04 X GCA9730-1 HNO3 X 8.7 0.02 X 0.9 1.9 X 0.7 GCA9731-2 HNO3 X 2 X X 1.1 0.9 0.08 X
GCA9731-3 HNO3 X 1.3 0.01 X X 0.3 0.03 X GCA9731-3 HNO3 check X 1.2 X X X 0.7 0.03 X GCA9731-4 HNO3 X 1.1 X X X 0.4 0.04 X
GCA9731-5 HNO3 X 0.8 X X X X X X GCA9731-6 HNO3 X 0.8 X X X 0.1 X X GCA9732-2 HNO3 X 2.1 0.01 X X 0.4 0.05 X GCA9732-3 HNO3 X 2.3 X X 1 0.6 0.01 X GCA9732-4 HNO3 X 1.5 X X X 0.2 0.01 X GCA9733-2 HNO3 X 1.2 X X X 1.8 0.01 0.5 GCA9733-3 HNO3 X 0.7 X X 2.4 1.2 0.02 X GCA9733-4 HNO3 X 0.5 X X 0.9 0.8 X X GCA9733-5 HNO3 X 0.6 X X 0.7 0.8 X X GCA9733-6 HNO3 X 0.5 X X X 0.6 X X
Alcoa17-MS 5.54 4.9 5.22 27.7
Alcoa10-OES 241.2 0.55 1 21.2
Element Si Sn Sr Th Tl U V Zn Method /OE /MS /MS /MS /MS /MS /OE /OE
Detection 0.05 0.1 0.02 0.005 0.01 0.005 0.01 0.01 Units mg/l ug/l ug/l ug/l ug/l ug/l mg/l mg/l
Sample Name Control Blank X 0.02 X X X X X
GCA9728-1 HNO3 15.65 0.1 2.77 0.009 X 0.283 X X GCA9728-2 HNO3 15.41 X 2.17 0.009 X 0.201 X X GCA9730-1 HNO3 13.99 X 5.91 X X 0.025 X X GCA9731-2 HNO3 8.37 0.1 2.26 X X X X X GCA9731-3 HNO3 7.75 X 1.42 X X 0.007 X X GCA9731-3 HNO3 check 7.77 X 1.41 X X 0.008 X X GCA9731-4 HNO3 5.59 X 0.82 X X X X X GCA9731-5 HNO3 4.84 X 0.85 X X X X X GCA9731-6 HNO3 5.58 X 0.98 X X X X X GCA9732-2 HNO3 11.94 X 2.4 X X X X X GCA9732-3 HNO3 13.87 X 3.63 X X 0.016 X X GCA9732-4 HNO3 9.34 X 3.38 X X 0.034 X 0.02 GCA9733-2 HNO3 7.8 X 6.56 X X X X 0.02 GCA9733-3 HNO3 7.59 X 4.65 X X X X 0.02 GCA9733-4 HNO3 5 X 3.15 X X 0.012 X 0.01 GCA9733-5 HNO3 6.54 X 3.44 X X X X X GCA9733-6 HNO3 6.1 X 3.17 X X X X X
Alcoa17-MS 5.2 536.44 5.381 4.52 4.887
Alcoa10-OES 27.35 0.48 0.52
GLS Job Code 143.0/1111216 Client ON GCA 1112
Page 4 of 4
NATA ENDORSED DOCUMENT Company Accreditation Number 3244 The contents of this report have been prepared in accordance with the terms of NATA accreditation and as such should only be reproduced in full. NATA Signatory: Ann Evers Ann Evers Date: 17/08//2011
This document is issued in accordance with NATA accreditation requirements.
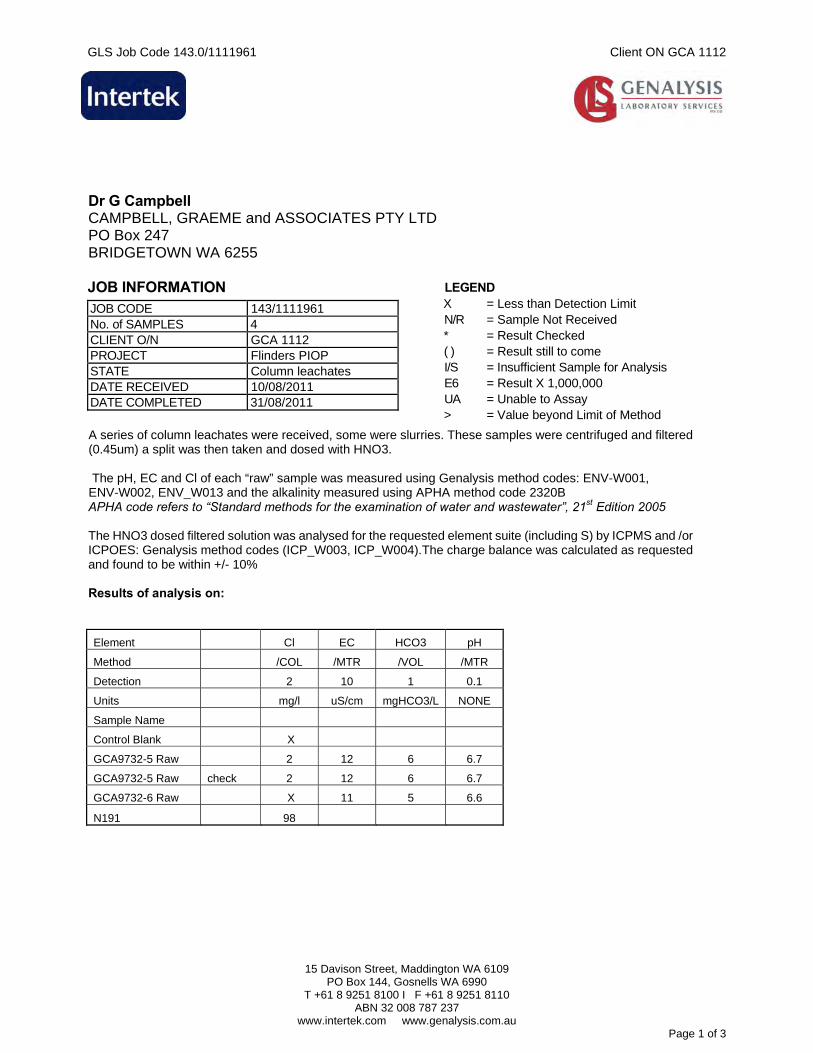
GLS Job Code 143.0/1111961 Client ON GCA 1112
15 Davison Street, Maddington WA 6109
PO Box 144, Gosnells WA 6990 T +61 8 9251 8100 I F +61 8 9251 8110
ABN 32 008 787 237 www.intertek.com www.genalysis.com.au
Page 1 of 3
Dr G Campbell CAMPBELL, GRAEME and ASSOCIATES PTY LTD PO Box 247 BRIDGETOWN WA 6255 JOB INFORMATION
JOB CODE 143/1111961 No. of SAMPLES 4 CLIENT O/N GCA 1112 PROJECT Flinders PIOP STATE Column leachates DATE RECEIVED 10/08/2011 DATE COMPLETED 31/08/2011
LEGEND X = Less than Detection Limit N/R = Sample Not Received * = Result Checked ( ) = Result still to come I/S = Insufficient Sample for Analysis E6 = Result X 1,000,000 UA = Unable to Assay > = Value beyond Limit of Method
A series of column leachates were received, some were slurries. These samples were centrifuged and filtered (0.45um) a split was then taken and dosed with HNO3. The pH, EC and Cl of each “raw” sample was measured using Genalysis method codes: ENV-W001, ENV-W002, ENV_W013 and the alkalinity measured using APHA method code 2320B APHA code refers to “Standard methods for the examination of water and wastewater”, 21st Edition 2005 The HNO3 dosed filtered solution was analysed for the requested element suite (including S) by ICPMS and /or ICPOES: Genalysis method codes (ICP_W003, ICP_W004).The charge balance was calculated as requested and found to be within +/- 10% Results of analysis on: Element Cl EC HCO3 pH
Method /COL /MTR /VOL /MTR
Detection 2 10 1 0.1
Units mg/l uS/cm mgHCO3/L NONE
Sample Name
Control Blank X
GCA9732-5 Raw 2 12 6 6.7
GCA9732-5 Raw check 2 12 6 6.7
GCA9732-6 Raw X 11 5 6.6
N191 98
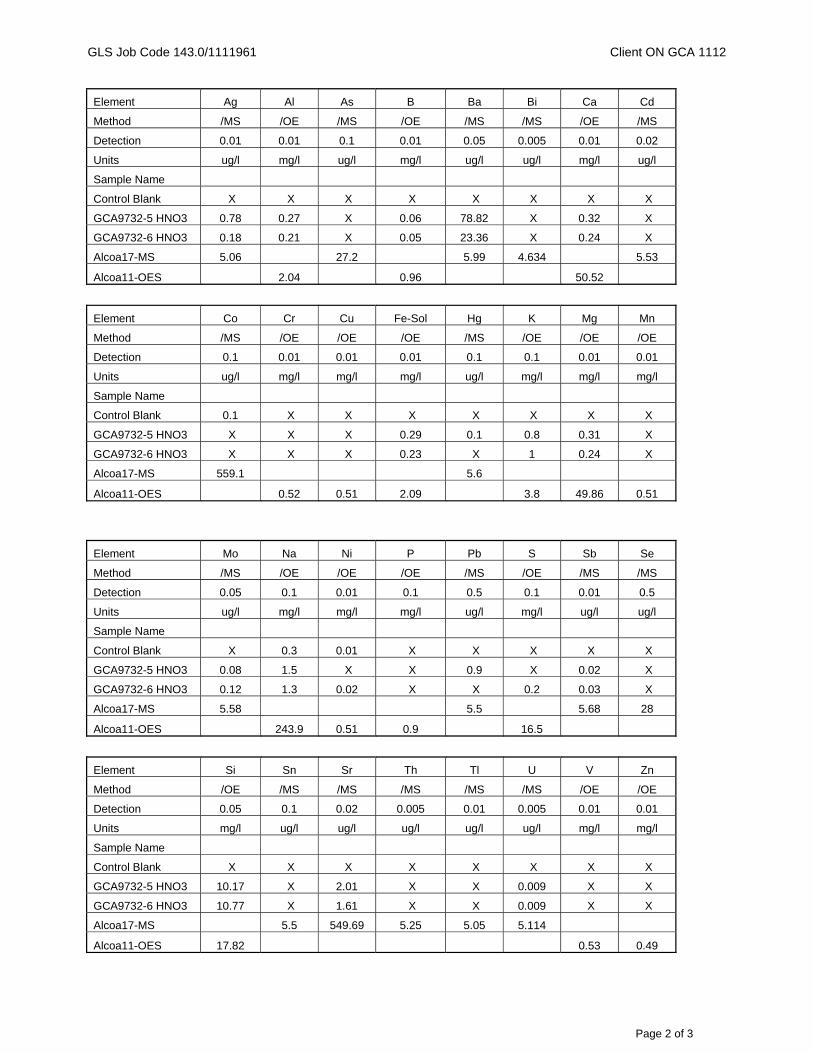
GLS Job Code 143.0/1111961 Client ON GCA 1112
Page 2 of 3
Element Ag Al As B Ba Bi Ca Cd
Method /MS /OE /MS /OE /MS /MS /OE /MS
Detection 0.01 0.01 0.1 0.01 0.05 0.005 0.01 0.02
Units ug/l mg/l ug/l mg/l ug/l ug/l mg/l ug/l
Sample Name
Control Blank X X X X X X X X
GCA9732-5 HNO3 0.78 0.27 X 0.06 78.82 X 0.32 X
GCA9732-6 HNO3 0.18 0.21 X 0.05 23.36 X 0.24 X
Alcoa17-MS 5.06 27.2 5.99 4.634 5.53
Alcoa11-OES 2.04 0.96 50.52
Element Co Cr Cu Fe-Sol Hg K Mg Mn
Method /MS /OE /OE /OE /MS /OE /OE /OE
Detection 0.1 0.01 0.01 0.01 0.1 0.1 0.01 0.01
Units ug/l mg/l mg/l mg/l ug/l mg/l mg/l mg/l
Sample Name
Control Blank 0.1 X X X X X X X
GCA9732-5 HNO3 X X X 0.29 0.1 0.8 0.31 X
GCA9732-6 HNO3 X X X 0.23 X 1 0.24 X
Alcoa17-MS 559.1 5.6
Alcoa11-OES 0.52 0.51 2.09 3.8 49.86 0.51
Element Mo Na Ni P Pb S Sb Se
Method /MS /OE /OE /OE /MS /OE /MS /MS
Detection 0.05 0.1 0.01 0.1 0.5 0.1 0.01 0.5
Units ug/l mg/l mg/l mg/l ug/l mg/l ug/l ug/l
Sample Name
Control Blank X 0.3 0.01 X X X X X
GCA9732-5 HNO3 0.08 1.5 X X 0.9 X 0.02 X
GCA9732-6 HNO3 0.12 1.3 0.02 X X 0.2 0.03 X
Alcoa17-MS 5.58 5.5 5.68 28
Alcoa11-OES 243.9 0.51 0.9 16.5
Element Si Sn Sr Th Tl U V Zn
Method /OE /MS /MS /MS /MS /MS /OE /OE
Detection 0.05 0.1 0.02 0.005 0.01 0.005 0.01 0.01
Units mg/l ug/l ug/l ug/l ug/l ug/l mg/l mg/l
Sample Name
Control Blank X X X X X X X X
GCA9732-5 HNO3 10.17 X 2.01 X X 0.009 X X
GCA9732-6 HNO3 10.77 X 1.61 X X 0.009 X X
Alcoa17-MS 5.5 549.69 5.25 5.05 5.114
Alcoa11-OES 17.82 0.53 0.49

GLS Job Code 143.0/1111961 Client ON GCA 1112
Page 3 of 3
NATA ENDORSED DOCUMENT Company Accreditation Number 3244 The contents of this report have been prepared in accordance with the terms of NATA accreditation and as such should only be reproduced in full. NATA Signatory: Ann Evers Ann Evers Date: 31/08//2011
This document is issued in accordance with NATA accreditation requirements.
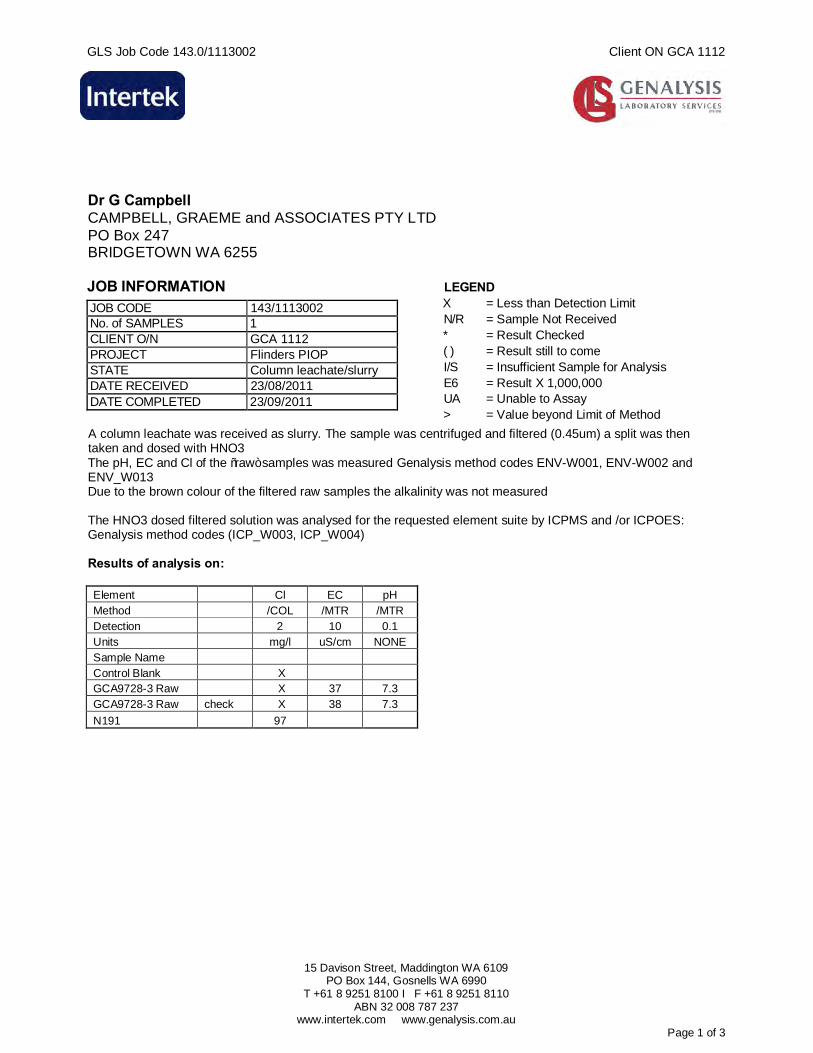
GLS Job Code 143.0/1113002 Client ON GCA 1112
15 Davison Street, Maddington WA 6109
PO Box 144, Gosnells WA 6990 T +61 8 9251 8100 I F +61 8 9251 8110
ABN 32 008 787 237 www.intertek.com www.genalysis.com.au
Page 1 of 3
Dr G Campbell CAMPBELL, GRAEME and ASSOCIATES PTY LTD PO Box 247 BRIDGETOWN WA 6255 JOB INFORMATION
JOB CODE 143/1113002 No. of SAMPLES 1 CLIENT O/N GCA 1112 PROJECT Flinders PIOP STATE Column leachate/slurry DATE RECEIVED 23/08/2011 DATE COMPLETED 23/09/2011
LEGEND X = Less than Detection Limit N/R = Sample Not Received * = Result Checked ( ) = Result still to come I/S = Insufficient Sample for Analysis E6 = Result X 1,000,000 UA = Unable to Assay > = Value beyond Limit of Method
A column leachate was received as slurry. The sample was centrifuged and filtered (0.45um) a split was then taken and dosed with HNO3 The pH, EC and Cl of the “raw” samples was measured Genalysis method codes ENV-W001, ENV-W002 and ENV_W013 Due to the brown colour of the filtered raw samples the alkalinity was not measured The HNO3 dosed filtered solution was analysed for the requested element suite by ICPMS and /or ICPOES: Genalysis method codes (ICP_W003, ICP_W004) Results of analysis on: Element Cl EC pH Method /COL /MTR /MTR Detection 2 10 0.1 Units mg/l uS/cm NONE Sample Name Control Blank X GCA9728-3 Raw X 37 7.3 GCA9728-3 Raw check X 38 7.3
N191 97
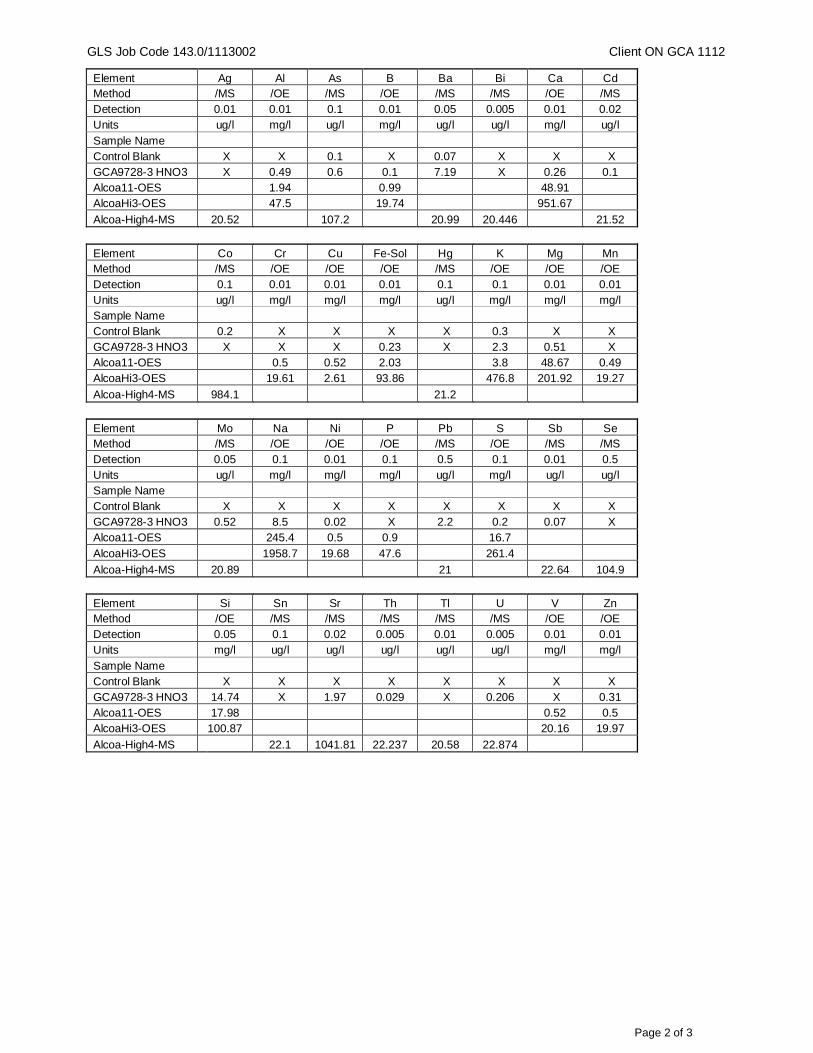
GLS Job Code 143.0/1113002 Client ON GCA 1112
Page 2 of 3
Element Ag Al As B Ba Bi Ca Cd Method /MS /OE /MS /OE /MS /MS /OE /MS Detection 0.01 0.01 0.1 0.01 0.05 0.005 0.01 0.02 Units ug/l mg/l ug/l mg/l ug/l ug/l mg/l ug/l
Sample Name Control Blank X X 0.1 X 0.07 X X X GCA9728-3 HNO3 X 0.49 0.6 0.1 7.19 X 0.26 0.1 Alcoa11-OES 1.94 0.99 48.91 AlcoaHi3-OES 47.5 19.74 951.67
Alcoa-High4-MS 20.52 107.2 20.99 20.446 21.52
Element Co Cr Cu Fe-Sol Hg K Mg Mn Method /MS /OE /OE /OE /MS /OE /OE /OE Detection 0.1 0.01 0.01 0.01 0.1 0.1 0.01 0.01 Units ug/l mg/l mg/l mg/l ug/l mg/l mg/l mg/l Sample Name Control Blank 0.2 X X X X 0.3 X X GCA9728-3 HNO3 X X X 0.23 X 2.3 0.51 X Alcoa11-OES 0.5 0.52 2.03 3.8 48.67 0.49 AlcoaHi3-OES 19.61 2.61 93.86 476.8 201.92 19.27
Alcoa-High4-MS 984.1 21.2
Element Mo Na Ni P Pb S Sb Se Method /MS /OE /OE /OE /MS /OE /MS /MS Detection 0.05 0.1 0.01 0.1 0.5 0.1 0.01 0.5 Units ug/l mg/l mg/l mg/l ug/l mg/l ug/l ug/l Sample Name Control Blank X X X X X X X X GCA9728-3 HNO3 0.52 8.5 0.02 X 2.2 0.2 0.07 X Alcoa11-OES 245.4 0.5 0.9 16.7
AlcoaHi3-OES 1958.7 19.68 47.6 261.4
Alcoa-High4-MS 20.89 21 22.64 104.9
Element Si Sn Sr Th Tl U V Zn Method /OE /MS /MS /MS /MS /MS /OE /OE Detection 0.05 0.1 0.02 0.005 0.01 0.005 0.01 0.01 Units mg/l ug/l ug/l ug/l ug/l ug/l mg/l mg/l
Sample Name Control Blank X X X X X X X X GCA9728-3 HNO3 14.74 X 1.97 0.029 X 0.206 X 0.31 Alcoa11-OES 17.98 0.52 0.5 AlcoaHi3-OES 100.87 20.16 19.97
Alcoa-High4-MS 22.1 1041.81 22.237 20.58 22.874
GLS Job Code 143.0/1113002 Client ON GCA 1112
Page 3 of 3
NATA ENDORSED DOCUMENT Company Accreditation Number 3244 The contents of this report have been prepared in accordance with the terms of NATA accreditation and as such should only be reproduced in full. NATA Signatory: Ann Evers Ann Evers Date: 23/09//2011
This document is issued in accordance with NATA accreditation requirements.
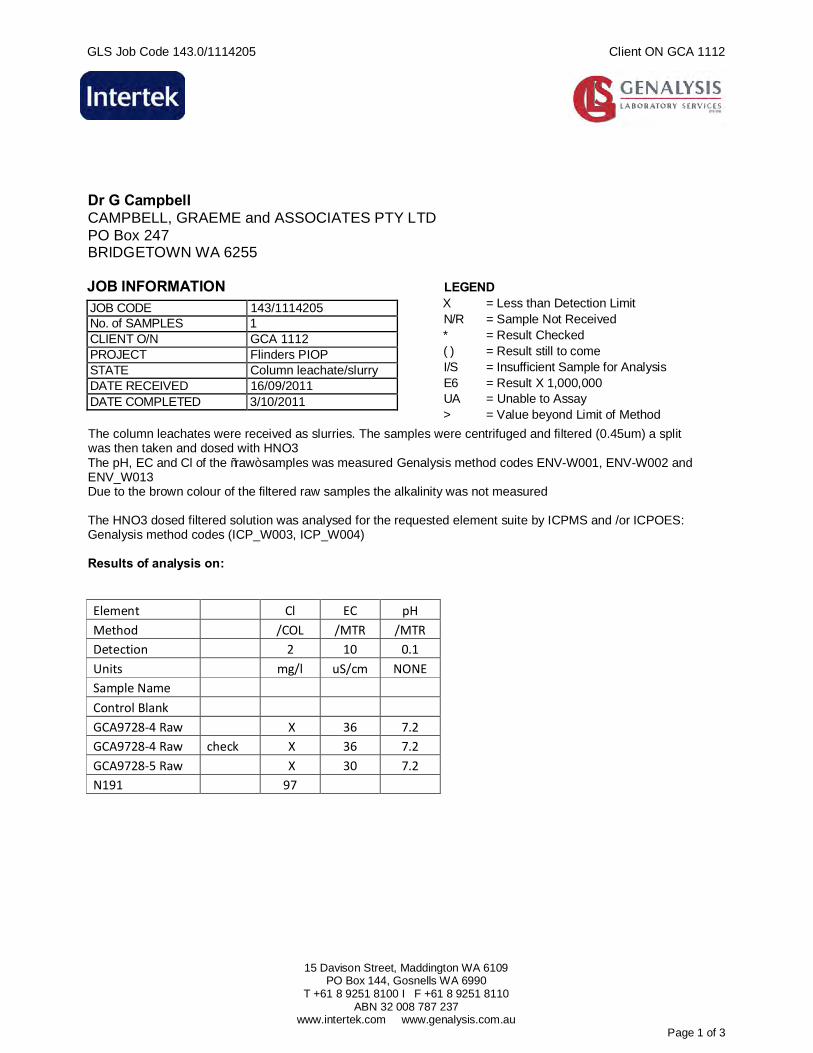
GLS Job Code 143.0/1114205 Client ON GCA 1112
15 Davison Street, Maddington WA 6109
PO Box 144, Gosnells WA 6990 T +61 8 9251 8100 I F +61 8 9251 8110
ABN 32 008 787 237 www.intertek.com www.genalysis.com.au
Page 1 of 3
Dr G Campbell CAMPBELL, GRAEME and ASSOCIATES PTY LTD PO Box 247 BRIDGETOWN WA 6255 JOB INFORMATION
JOB CODE 143/1114205 No. of SAMPLES 1 CLIENT O/N GCA 1112 PROJECT Flinders PIOP STATE Column leachate/slurry DATE RECEIVED 16/09/2011 DATE COMPLETED 3/10/2011
LEGEND X = Less than Detection Limit N/R = Sample Not Received * = Result Checked ( ) = Result still to come I/S = Insufficient Sample for Analysis E6 = Result X 1,000,000 UA = Unable to Assay > = Value beyond Limit of Method
The column leachates were received as slurries. The samples were centrifuged and filtered (0.45um) a split was then taken and dosed with HNO3 The pH, EC and Cl of the “raw” samples was measured Genalysis method codes ENV-W001, ENV-W002 and ENV_W013 Due to the brown colour of the filtered raw samples the alkalinity was not measured The HNO3 dosed filtered solution was analysed for the requested element suite by ICPMS and /or ICPOES: Genalysis method codes (ICP_W003, ICP_W004) Results of analysis on: Element Cl EC pH Method /COL /MTR /MTR Detection 2 10 0.1 Units mg/l uS/cm NONE
Sample Name Control Blank GCA9728-4 Raw X 36 7.2 GCA9728-4 Raw check X 36 7.2 GCA9728-5 Raw X 30 7.2
N191 97
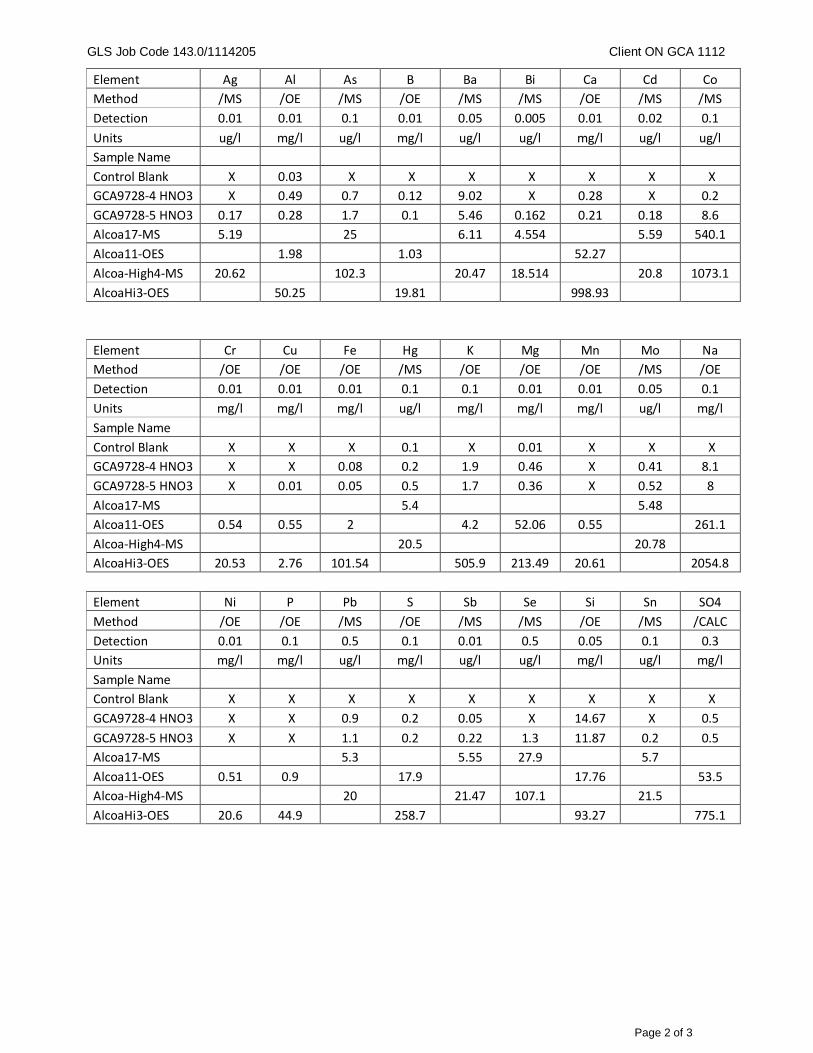
GLS Job Code 143.0/1114205 Client ON GCA 1112
Page 2 of 3
Element Ag Al As B Ba Bi Ca Cd Co Method /MS /OE /MS /OE /MS /MS /OE /MS /MS Detection 0.01 0.01 0.1 0.01 0.05 0.005 0.01 0.02 0.1 Units ug/l mg/l ug/l mg/l ug/l ug/l mg/l ug/l ug/l Sample Name Control Blank X 0.03 X X X X X X X GCA9728-4 HNO3 X 0.49 0.7 0.12 9.02 X 0.28 X 0.2 GCA9728-5 HNO3 0.17 0.28 1.7 0.1 5.46 0.162 0.21 0.18 8.6 Alcoa17-MS 5.19 25 6.11 4.554 5.59 540.1 Alcoa11-OES 1.98 1.03 52.27 Alcoa-High4-MS 20.62 102.3 20.47 18.514 20.8 1073.1 AlcoaHi3-OES 50.25 19.81 998.93
Element Cr Cu Fe Hg K Mg Mn Mo Na Method /OE /OE /OE /MS /OE /OE /OE /MS /OE Detection 0.01 0.01 0.01 0.1 0.1 0.01 0.01 0.05 0.1 Units mg/l mg/l mg/l ug/l mg/l mg/l mg/l ug/l mg/l Sample Name Control Blank X X X 0.1 X 0.01 X X X GCA9728-4 HNO3 X X 0.08 0.2 1.9 0.46 X 0.41 8.1 GCA9728-5 HNO3 X 0.01 0.05 0.5 1.7 0.36 X 0.52 8 Alcoa17-MS 5.4 5.48 Alcoa11-OES 0.54 0.55 2 4.2 52.06 0.55 261.1 Alcoa-High4-MS 20.5 20.78 AlcoaHi3-OES 20.53 2.76 101.54 505.9 213.49 20.61 2054.8
Element Ni P Pb S Sb Se Si Sn SO4 Method /OE /OE /MS /OE /MS /MS /OE /MS /CALC Detection 0.01 0.1 0.5 0.1 0.01 0.5 0.05 0.1 0.3 Units mg/l mg/l ug/l mg/l ug/l ug/l mg/l ug/l mg/l Sample Name Control Blank X X X X X X X X X GCA9728-4 HNO3 X X 0.9 0.2 0.05 X 14.67 X 0.5 GCA9728-5 HNO3 X X 1.1 0.2 0.22 1.3 11.87 0.2 0.5 Alcoa17-MS 5.3 5.55 27.9 5.7 Alcoa11-OES 0.51 0.9 17.9 17.76 53.5 Alcoa-High4-MS 20 21.47 107.1 21.5 AlcoaHi3-OES 20.6 44.9 258.7 93.27 775.1
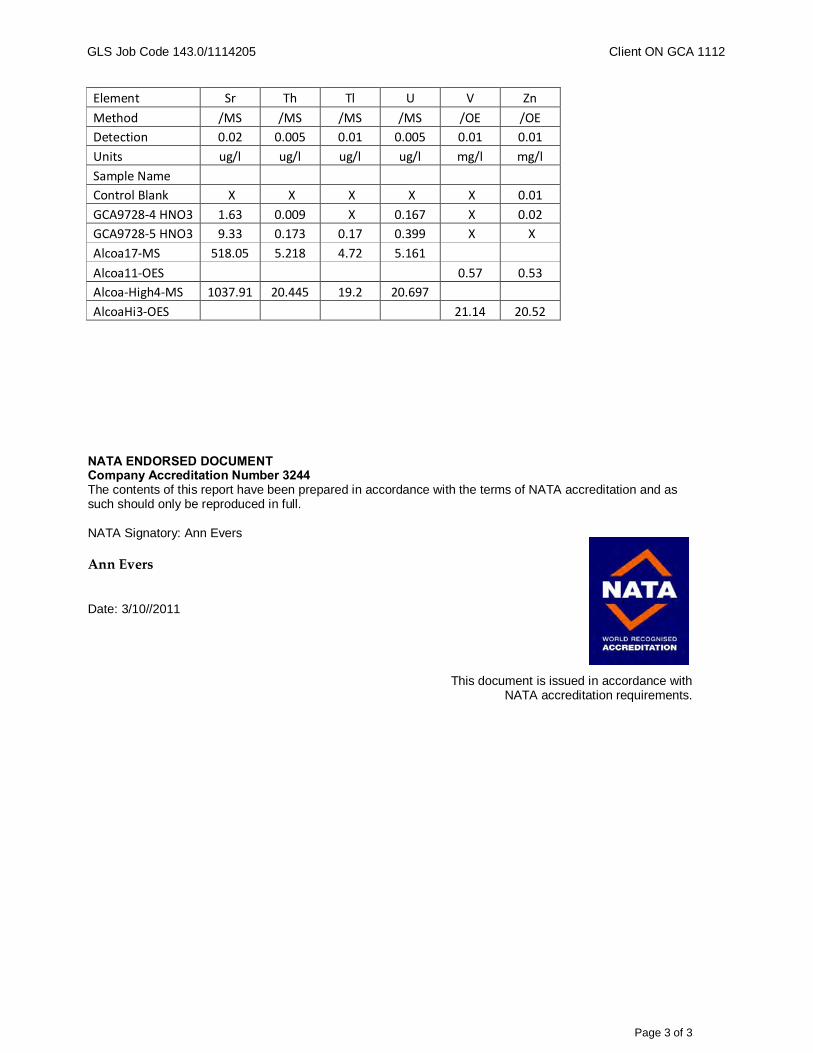
GLS Job Code 143.0/1114205 Client ON GCA 1112
Page 3 of 3
Element Sr Th Tl U V Zn
Method /MS /MS /MS /MS /OE /OE Detection 0.02 0.005 0.01 0.005 0.01 0.01 Units ug/l ug/l ug/l ug/l mg/l mg/l Sample Name
Control Blank X X X X X 0.01 GCA9728-4 HNO3 1.63 0.009 X 0.167 X 0.02 GCA9728-5 HNO3 9.33 0.173 0.17 0.399 X X
Alcoa17-MS 518.05 5.218 4.72 5.161 Alcoa11-OES 0.57 0.53 Alcoa-High4-MS 1037.91 20.445 19.2 20.697 AlcoaHi3-OES 21.14 20.52
NATA ENDORSED DOCUMENT Company Accreditation Number 3244 The contents of this report have been prepared in accordance with the terms of NATA accreditation and as such should only be reproduced in full. NATA Signatory: Ann Evers Ann Evers Date: 3/10//2011
This document is issued in accordance with NATA accreditation requirements.
Graeme Campbell & Associates Pty Ltd
Note:
The laboratory-reports, and column-worksheets, in the following pages correspond to
the kinetic-testing programme carried out on the three (3) samples of composite-waste-
bedrocks (viz. GCA9682/83, GCA9685/86, and GCA9688/90) from the Delta-Pit.
Correspondence to Box 3129, Malaga D.C. WA 6945 ACN 069 920 476 ABN 92 076 109 663
GRAEME CAMPBELL AND ASSOC 23-10-2011 PO BOX 247, BRIDGE TOWN WA OUR REFERENCE 23061 XRD/PLM/SEM ANALYSES OF THREE WASTE ROCK SAMPLES . R TOWNEND
Roger Townend and Associates Consulting Mineralogists
Unit 4, 40 Irvine drive, Malaga Western Australia 6062 Phone: (08) 9248 1674 Fax: (08) 9248 1502 email: [email protected]
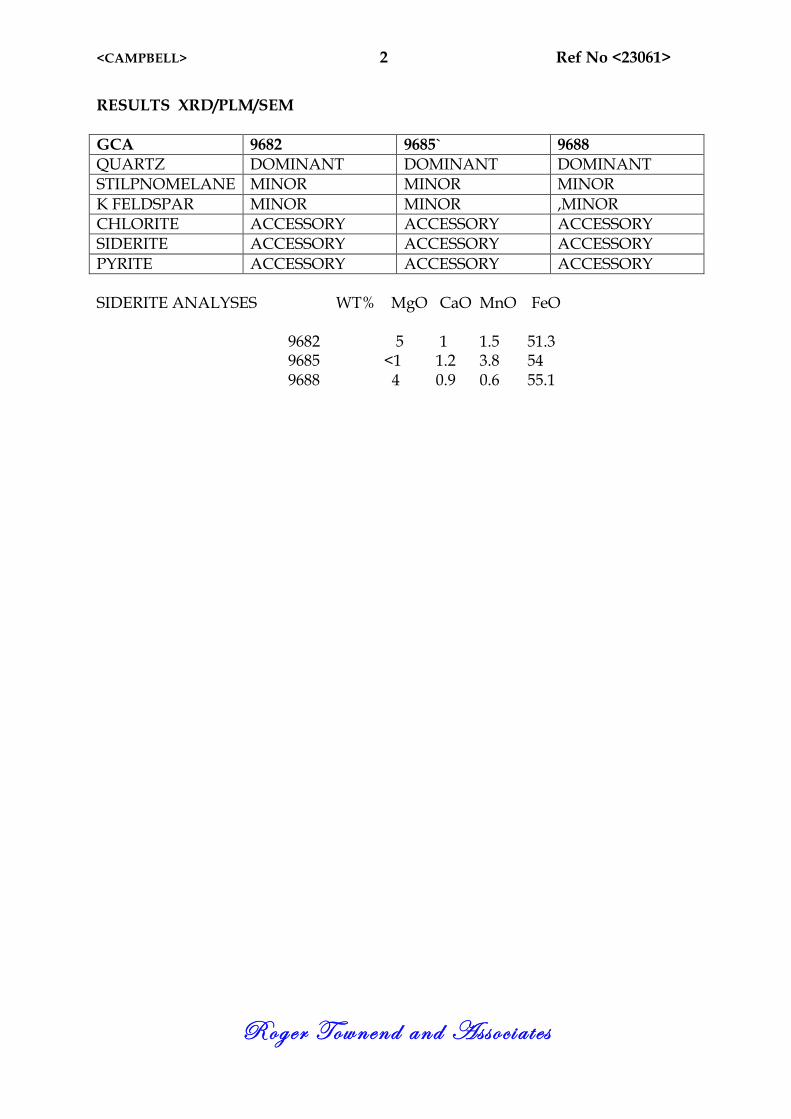
<CAMPBELL> 2 Ref No <23061>
Roger Townend and Asso c i a t e s
RESULTS XRD/PLM/SEM GCA 9682 9685` 9688 QUARTZ DOMINANT DOMINANT DOMINANT STILPNOMELANE MINOR MINOR MINOR K FELDSPAR MINOR MINOR ,MINOR CHLORITE ACCESSORY ACCESSORY ACCESSORY SIDERITE ACCESSORY ACCESSORY ACCESSORY PYRITE ACCESSORY ACCESSORY ACCESSORY SIDERITE ANALYSES WT% MgO CaO MnO FeO 9682 5 1 1.5 51.3 9685 <1 1.2 3.8 54 9688 4 0.9 0.6 55.1
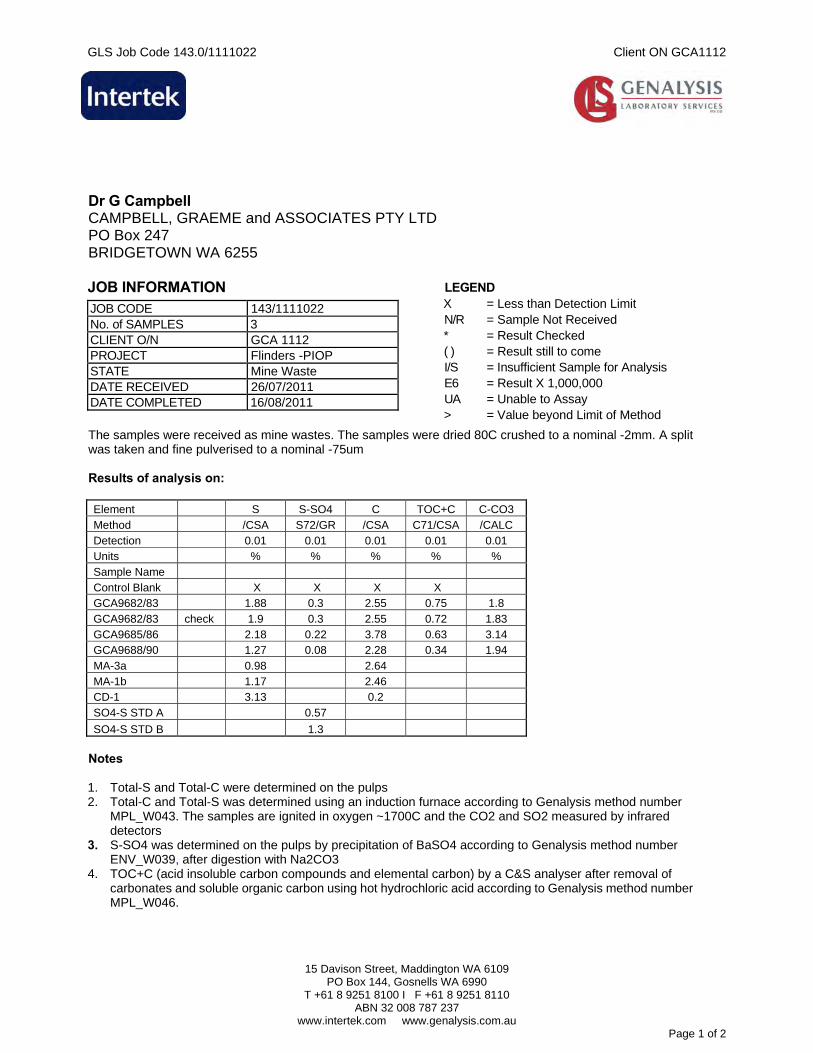
GLS Job Code 143.0/1111022 Client ON GCA1112
15 Davison Street, Maddington WA 6109
PO Box 144, Gosnells WA 6990 T +61 8 9251 8100 I F +61 8 9251 8110
ABN 32 008 787 237 www.intertek.com www.genalysis.com.au
Page 1 of 2
Dr G Campbell CAMPBELL, GRAEME and ASSOCIATES PTY LTD PO Box 247 BRIDGETOWN WA 6255 JOB INFORMATION
JOB CODE 143/1111022 No. of SAMPLES 3 CLIENT O/N GCA 1112 PROJECT Flinders -PIOP STATE Mine Waste DATE RECEIVED 26/07/2011 DATE COMPLETED 16/08/2011
LEGEND X = Less than Detection Limit N/R = Sample Not Received * = Result Checked ( ) = Result still to come I/S = Insufficient Sample for Analysis E6 = Result X 1,000,000 UA = Unable to Assay > = Value beyond Limit of Method
The samples were received as mine wastes. The samples were dried 80C crushed to a nominal -2mm. A split was taken and fine pulverised to a nominal -75um Results of analysis on: Element S S-SO4 C TOC+C C-CO3
Method /CSA S72/GR /CSA C71/CSA /CALC Detection 0.01 0.01 0.01 0.01 0.01 Units % % % % %
Sample Name Control Blank X X X X GCA9682/83 1.88 0.3 2.55 0.75 1.8
GCA9682/83 check 1.9 0.3 2.55 0.72 1.83 GCA9685/86 2.18 0.22 3.78 0.63 3.14 GCA9688/90 1.27 0.08 2.28 0.34 1.94
MA-3a 0.98 2.64 MA-1b 1.17 2.46 CD-1 3.13 0.2
SO4-S STD A 0.57
SO4-S STD B 1.3 Notes 1. Total-S and Total-C were determined on the pulps 2. Total-C and Total-S was determined using an induction furnace according to Genalysis method number
MPL_W043. The samples are ignited in oxygen ~1700C and the CO2 and SO2 measured by infrared detectors
3. S-SO4 was determined on the pulps by precipitation of BaSO4 according to Genalysis method number ENV_W039, after digestion with Na2CO3
4. TOC+C (acid insoluble carbon compounds and elemental carbon) by a C&S analyser after removal of carbonates and soluble organic carbon using hot hydrochloric acid according to Genalysis method number MPL_W046.
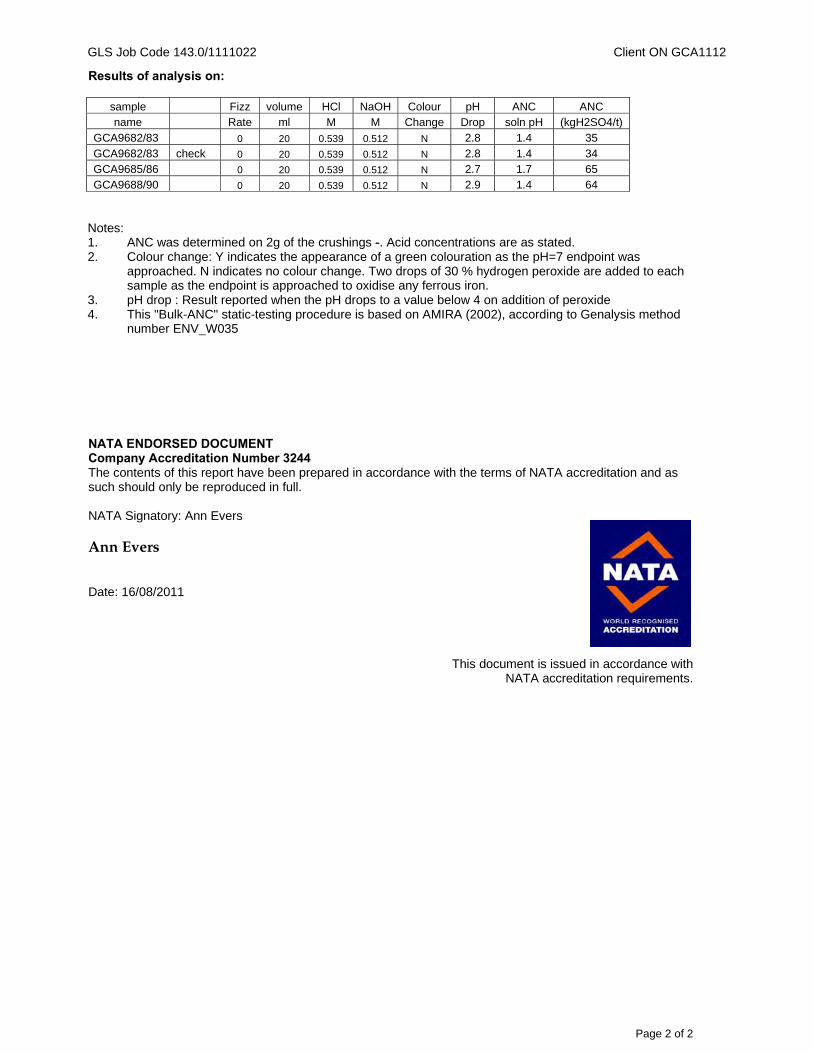
GLS Job Code 143.0/1111022 Client ON GCA1112
Page 2 of 2
Results of analysis on:
sample Fizz volume HCl NaOH Colour pH ANC ANC name Rate ml M M Change Drop soln pH (kgH2SO4/t)
GCA9682/83 0 20 0.539 0.512 N 2.8 1.4 35
GCA9682/83 check 0 20 0.539 0.512 N 2.8 1.4 34 GCA9685/86 0 20 0.539 0.512 N 2.7 1.7 65 GCA9688/90 0 20 0.539 0.512 N 2.9 1.4 64
Notes: 1. ANC was determined on 2g of the crushings -. Acid concentrations are as stated. 2. Colour change: Y indicates the appearance of a green colouration as the pH=7 endpoint was
approached. N indicates no colour change. Two drops of 30 % hydrogen peroxide are added to each sample as the endpoint is approached to oxidise any ferrous iron.
3. pH drop : Result reported when the pH drops to a value below 4 on addition of peroxide 4. This "Bulk-ANC" static-testing procedure is based on AMIRA (2002), according to Genalysis method
number ENV_W035 NATA ENDORSED DOCUMENT Company Accreditation Number 3244 The contents of this report have been prepared in accordance with the terms of NATA accreditation and as such should only be reproduced in full. NATA Signatory: Ann Evers Ann Evers Date: 16/08/2011
This document is issued in accordance with NATA accreditation requirements.
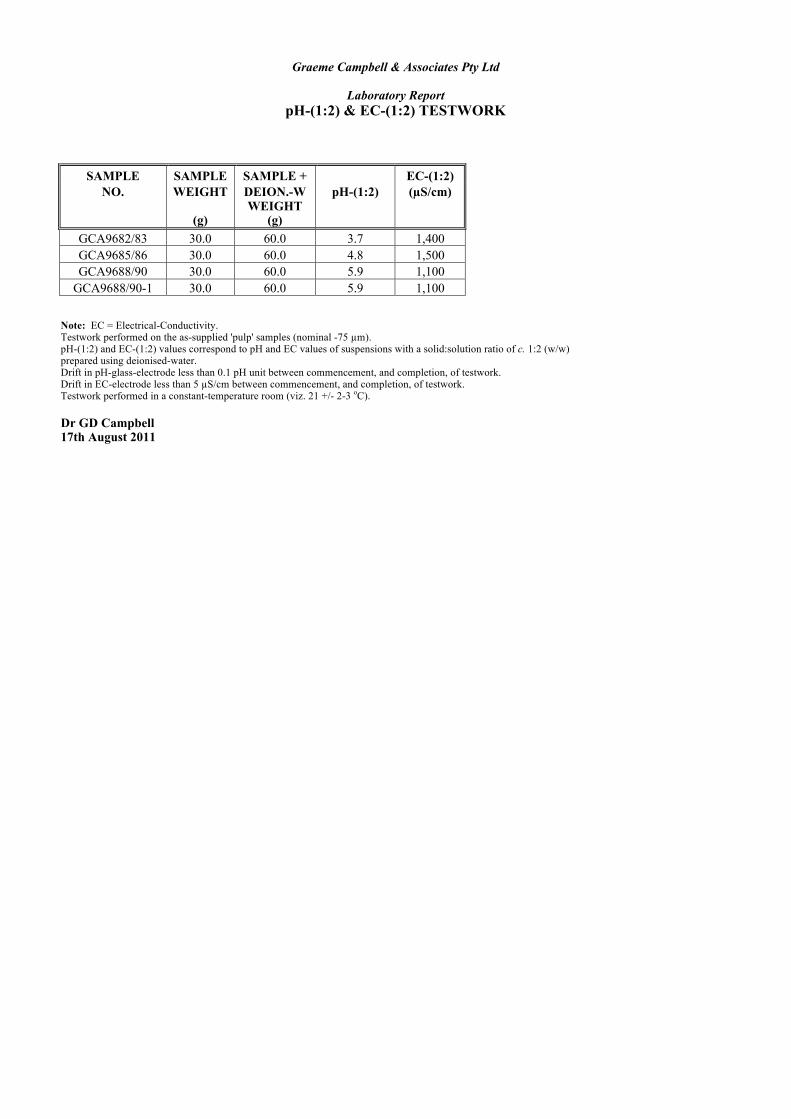
Graeme Campbell & Associates Pty Ltd
Laboratory Report pH-(1:2) & EC-(1:2) TESTWORK
SAMPLE SAMPLE SAMPLE + EC-(1:2) NO. WEIGHT DEION.-W pH-(1:2) (µS/cm)
(g) WEIGHT
(g) GCA9682/83 30.0 60.0 3.7 1,400 GCA9685/86 30.0 60.0 4.8 1,500 GCA9688/90 30.0 60.0 5.9 1,100
GCA9688/90-1 30.0 60.0 5.9 1,100 Note: EC = Electrical-Conductivity. Testwork performed on the as-supplied 'pulp' samples (nominal -75 µm). pH-(1:2) and EC-(1:2) values correspond to pH and EC values of suspensions with a solid:solution ratio of c. 1:2 (w/w) prepared using deionised-water. Drift in pH-glass-electrode less than 0.1 pH unit between commencement, and completion, of testwork. Drift in EC-electrode less than 5 µS/cm between commencement, and completion, of testwork. Testwork performed in a constant-temperature room (viz. 21 +/- 2-3 oC). Dr GD Campbell 17th August 2011
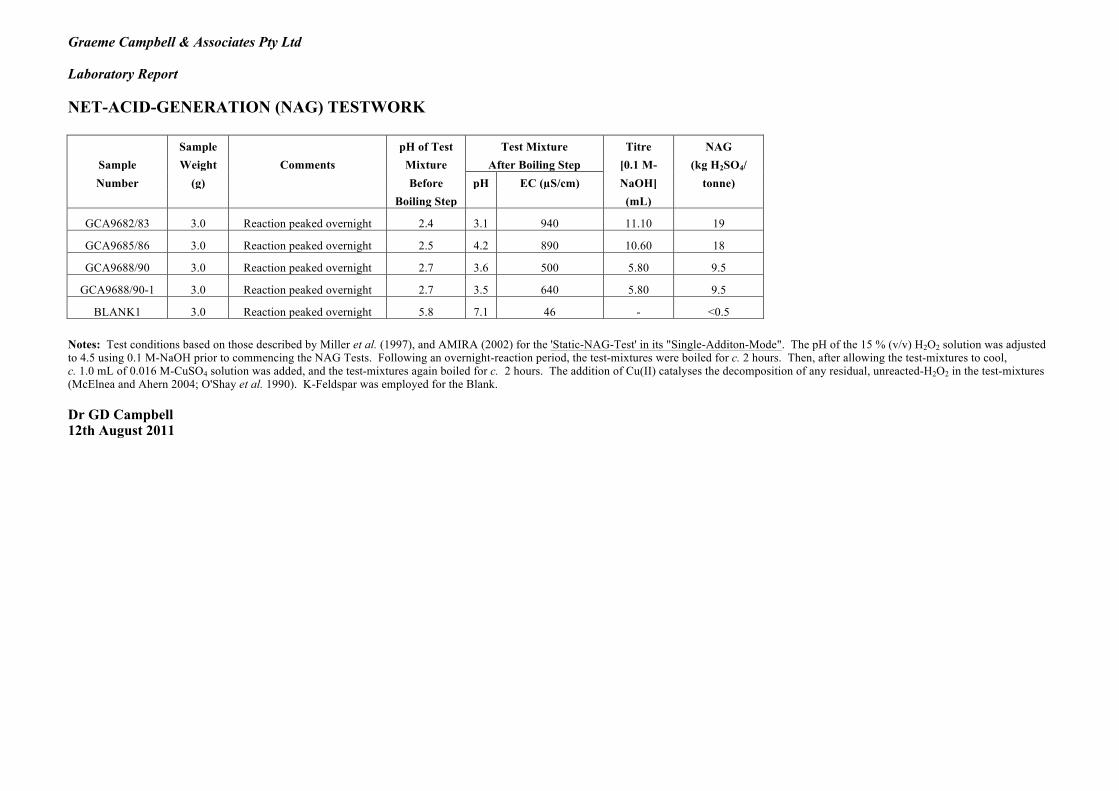
Graeme Campbell & Associates Pty Ltd Laboratory Report NET-ACID-GENERATION (NAG) TESTWORK Sample pH of Test Test Mixture Titre NAG
Sample Weight Comments Mixture After Boiling Step [0.1 M- (kg H2SO4/ Number (g) Before pH EC (µS/cm) NaOH] tonne)
Boiling Step (mL)
GCA9682/83 3.0 Reaction peaked overnight 2.4 3.1 940 11.10 19
GCA9685/86 3.0 Reaction peaked overnight 2.5 4.2 890 10.60 18
GCA9688/90 3.0 Reaction peaked overnight 2.7 3.6 500 5.80 9.5
GCA9688/90-1 3.0 Reaction peaked overnight 2.7 3.5 640 5.80 9.5
BLANK1 3.0 Reaction peaked overnight 5.8 7.1 46 - <0.5 Notes: Test conditions based on those described by Miller et al. (1997), and AMIRA (2002) for the 'Static-NAG-Test' in its "Single-Additon-Mode". The pH of the 15 % (v/v) H2O2 solution was adjusted to 4.5 using 0.1 M-NaOH prior to commencing the NAG Tests. Following an overnight-reaction period, the test-mixtures were boiled for c. 2 hours. Then, after allowing the test-mixtures to cool, c. 1.0 mL of 0.016 M-CuSO4 solution was added, and the test-mixtures again boiled for c. 2 hours. The addition of Cu(II) catalyses the decomposition of any residual, unreacted-H2O2 in the test-mixtures (McElnea and Ahern 2004; O'Shay et al. 1990). K-Feldspar was employed for the Blank. Dr GD Campbell 12th August 2011

2Page 1 of 7
ANALYTICAL REPORTDr G. CAMPBELLCAMPBELL, GRAEME and ASSOCIATESPO Box 247BRIDGETOWN, W.A. 6255AUSTRALIA
JOB INFORMATIONJOB CODENo. of SAMPLESNo. of ELEMENTSCLIENT O/NSAMPLE SUBMISSION No. :
::::
PROJECT :STATE :DATE RECEIVEDDATE COMPLETED
::
323143.0/1111024
Flinders-PIOPEx-Pulp26/07/2011
GCA1112 (Job 2 of 2)
18/08/201116/09/2011DATE PRINTED Genalysis Main LaboratoryPRIMARY LABORATORY
::
LEGENDX = Less than Detection Limit
N/R = Sample Not Received
* = Result Checked
( ) = Result still to come
I/S = Insufficient Sample for Analysis
E6 = Result X 1,000,000
UA = Unable to Assay
> = Value beyond Limit of Method
OV = Value over-range for Package
JOHANNESBURG LABORATORY43 Malcolm Moodie Crescent,
Jet Park, Gauteng, South Africa 1459
Tel: +27 11 552 8149 Fax: +27 11 552 8248
ADELAIDE LABORATORY11 Senna Road, Wingfield, 5013, South Australia
Tel: +61 8 8162 9714 Fax: +61 8 8349 7444
KALGOORLIE SAMPLE PREPARATION DIVISION12 Keogh Way, Kalgoorlie 6430, Western Australia
Tel: +61 8 9021 6057 Fax: +61 8 9021 3476
MAIN OFFICE AND LABORATORY15 Davison Street, Maddington 6109, Western Australia
PO Box 144, Gosnells 6990, Western Australia
Tel: +61 8 9251 8100 Fax: +61 8 9251 8110
Email: [email protected]
Web Page: www.genalysis.com.au
TOWNSVILLE LABORATORY9-23 Kelli Street, Mt St John, Bohle, Queensland, Australia 4818
Tel: +61 7 4774 3655 Fax: +61 7 4774 4692

2143.0/1111024 (16/09/2011) CLIENT O/N: GCA1112 Page 2 of 7
DISCLAIMER
SAMPLE DETAILS
Genalysis Laboratory Services Pty Ltd wishes to make the following disclaimer pertaining to the accompanying
analytical results.
Genalysis Laboratory Services Pty Ltd disclaims any liability, legal or otherwise, for any inferences implied from
this report relating to either the origin of, or the sampling technique employed in the collection of, the submitted
samples.
SIGNIFICANT FIGURESIt is common practice to report data derived from analytical instrumentation to a maximum of two or three
significant figures. Some data reported herein may show more figures than this. The reporting of more than
two or three figures in no way implies that the third, fourth and subsequent figures may be real or significant.
Genalysis Laboratory Services Pty Ltd accepts no responsibility whatsoever for any interpretationby any party of any data where more than two or three significant figures have been reported.
GENERAL CONDITIONS
SAMPLE STORAGE DETAILS
SAMPLE STORAGE OF SOLIDSBulk Residues and Pulps will be stored for 60 DAYS without charge. After this time all Bulk Residues and Pulps
will be stored at a rate of $3.30 per cubic metre per day until your written advice regarding collection or disposal
is received. Expenses related to the return or disposal of samples will be charged to you at cost. Current
disposal cost is charged at $100.00 per cubic metre.
SAMPLE STORAGE OF SOLUTIONSSamples received as liquids, waters or solutions will be held for 60 DAYS free of charge then disposed of,
unless written advice for return or collection is received.
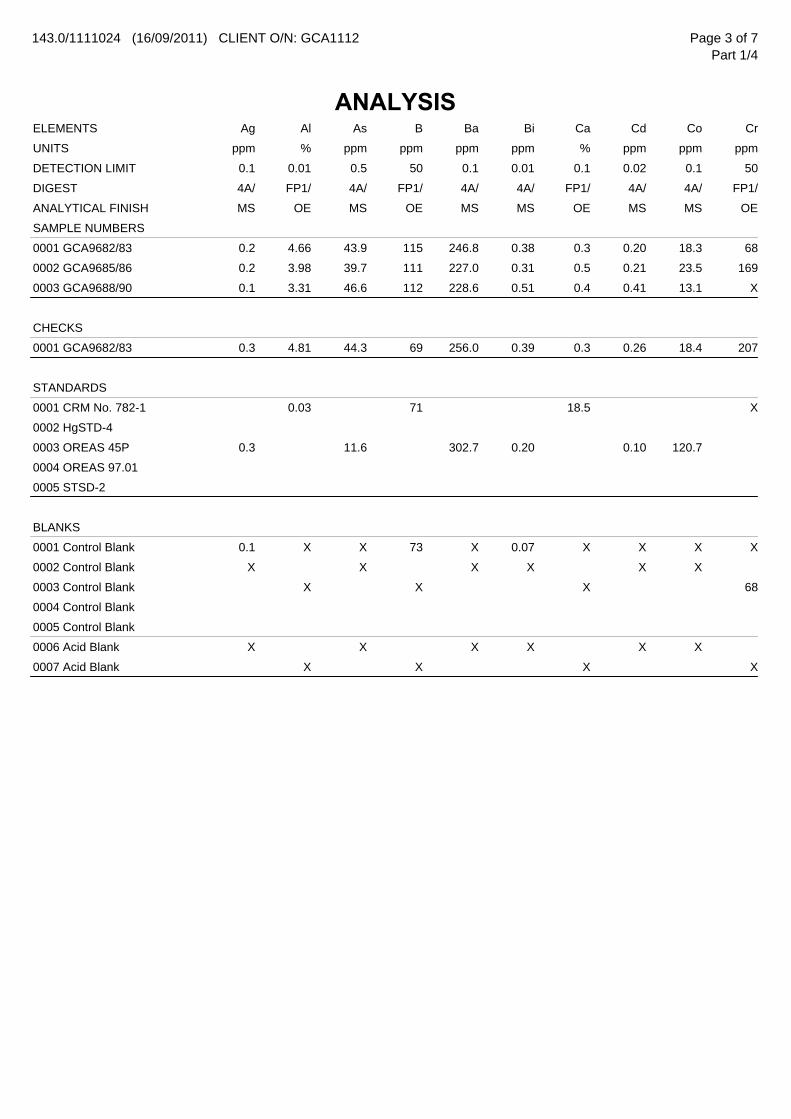
143.0/1111024 (16/09/2011) CLIENT O/N: GCA1112
ANALYSIS
Page 3 of 7Part 1/4
Ag AlELEMENTS As B Ba Bi Ca Cd Co Cr
ppm %UNITS ppm ppm ppm ppm % ppm ppm ppm
0.1 0.01DETECTION LIMIT 0.5 50 0.1 0.01 0.1 0.02 0.1 50
4A/ FP1/DIGEST 4A/ FP1/ 4A/ 4A/ FP1/ 4A/ 4A/ FP1/
MS OEANALYTICAL FINISH MS OE MS MS OE MS MS OE
SAMPLE NUMBERS
0.2 4.660001 GCA9682/83 43.9 115 246.8 0.38 0.3 0.20 18.3 68
0.2 3.980002 GCA9685/86 39.7 111 227.0 0.31 0.5 0.21 23.5 169
0.1 3.310003 GCA9688/90 46.6 112 228.6 0.51 0.4 0.41 13.1 X
CHECKS
0.3 4.810001 GCA9682/83 44.3 69 256.0 0.39 0.3 0.26 18.4 207
STANDARDS
0.030001 CRM No. 782-1 71 18.5 X
0002 HgSTD-4
0.30003 OREAS 45P 11.6 302.7 0.20 0.10 120.7
0004 OREAS 97.01
0005 STSD-2
BLANKS
0.1 X0001 Control Blank X 73 X 0.07 X X X X
X0002 Control Blank X X X X X
X0003 Control Blank X X 68
0004 Control Blank
0005 Control Blank
X0006 Acid Blank X X X X X
X0007 Acid Blank X X X
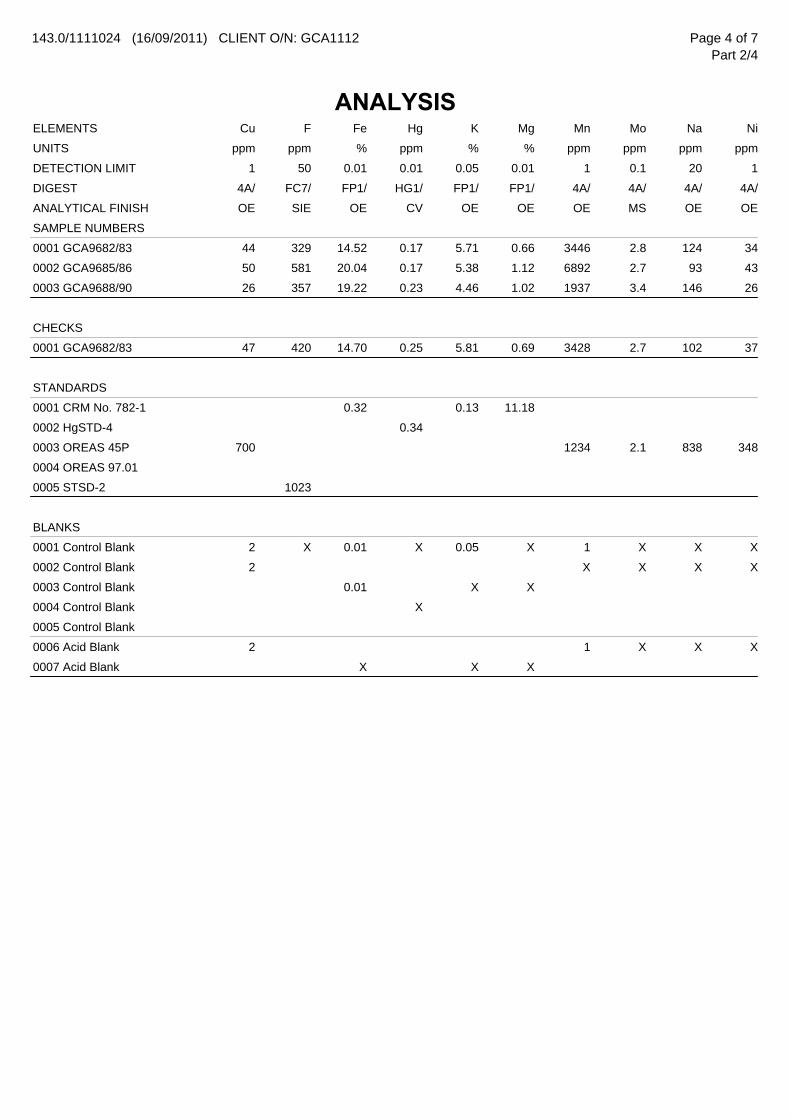
143.0/1111024 (16/09/2011) CLIENT O/N: GCA1112
ANALYSIS
Page 4 of 7Part 2/4
Cu FELEMENTS Fe Hg K Mg Mn Mo Na Ni
ppm ppmUNITS % ppm % % ppm ppm ppm ppm
1 50DETECTION LIMIT 0.01 0.01 0.05 0.01 1 0.1 20 1
4A/ FC7/DIGEST FP1/ HG1/ FP1/ FP1/ 4A/ 4A/ 4A/ 4A/
OE SIEANALYTICAL FINISH OE CV OE OE OE MS OE OE
SAMPLE NUMBERS
44 3290001 GCA9682/83 14.52 0.17 5.71 0.66 3446 2.8 124 34
50 5810002 GCA9685/86 20.04 0.17 5.38 1.12 6892 2.7 93 43
26 3570003 GCA9688/90 19.22 0.23 4.46 1.02 1937 3.4 146 26
CHECKS
47 4200001 GCA9682/83 14.70 0.25 5.81 0.69 3428 2.7 102 37
STANDARDS
0001 CRM No. 782-1 0.32 0.13 11.18
0002 HgSTD-4 0.34
7000003 OREAS 45P 1234 2.1 838 348
0004 OREAS 97.01
10230005 STSD-2
BLANKS
2 X0001 Control Blank 0.01 X 0.05 X 1 X X X
20002 Control Blank X X X X
0003 Control Blank 0.01 X X
0004 Control Blank X
0005 Control Blank
20006 Acid Blank 1 X X X
0007 Acid Blank X X X
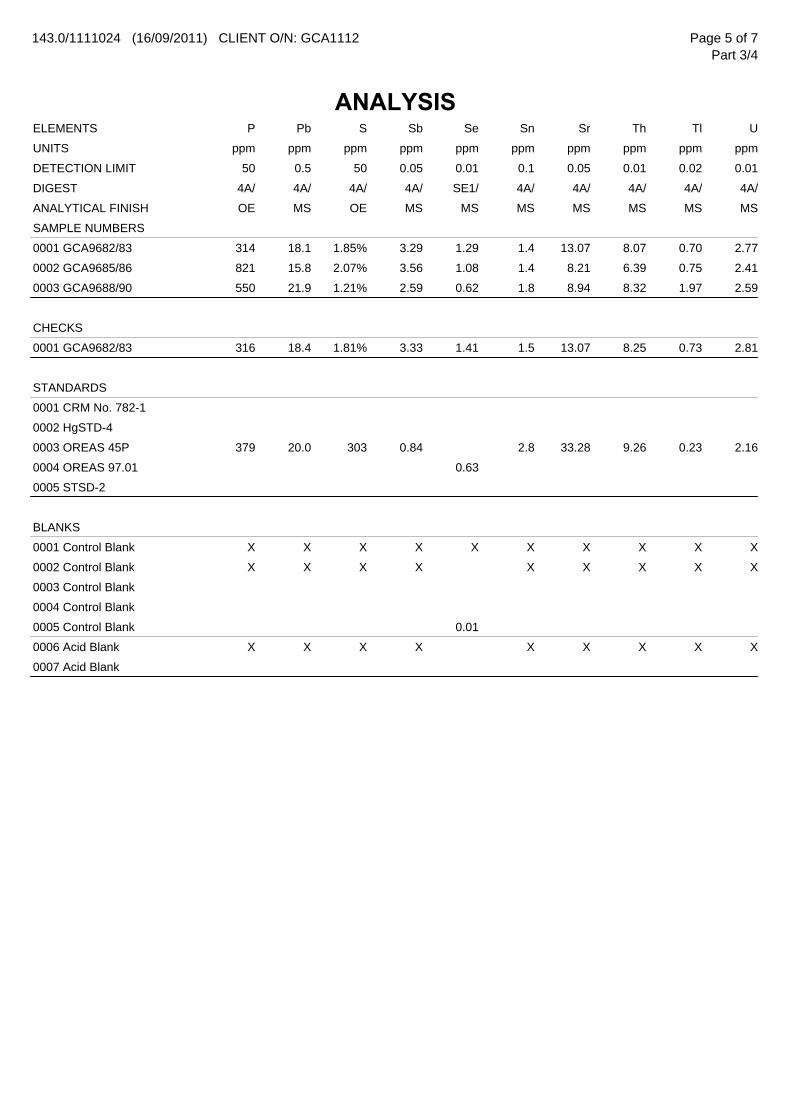
143.0/1111024 (16/09/2011) CLIENT O/N: GCA1112
ANALYSIS
Page 5 of 7Part 3/4
P PbELEMENTS S Sb Se Sn Sr Th Tl U
ppm ppmUNITS ppm ppm ppm ppm ppm ppm ppm ppm
50 0.5DETECTION LIMIT 50 0.05 0.01 0.1 0.05 0.01 0.02 0.01
4A/ 4A/DIGEST 4A/ 4A/ SE1/ 4A/ 4A/ 4A/ 4A/ 4A/
OE MSANALYTICAL FINISH OE MS MS MS MS MS MS MS
SAMPLE NUMBERS
314 18.10001 GCA9682/83 1.85% 3.29 1.29 1.4 13.07 8.07 0.70 2.77
821 15.80002 GCA9685/86 2.07% 3.56 1.08 1.4 8.21 6.39 0.75 2.41
550 21.90003 GCA9688/90 1.21% 2.59 0.62 1.8 8.94 8.32 1.97 2.59
CHECKS
316 18.40001 GCA9682/83 1.81% 3.33 1.41 1.5 13.07 8.25 0.73 2.81
STANDARDS
0001 CRM No. 782-1
0002 HgSTD-4
379 20.00003 OREAS 45P 303 0.84 2.8 33.28 9.26 0.23 2.16
0004 OREAS 97.01 0.63
0005 STSD-2
BLANKS
X X0001 Control Blank X X X X X X X X
X X0002 Control Blank X X X X X X X
0003 Control Blank
0004 Control Blank
0005 Control Blank 0.01
X X0006 Acid Blank X X X X X X X
0007 Acid Blank
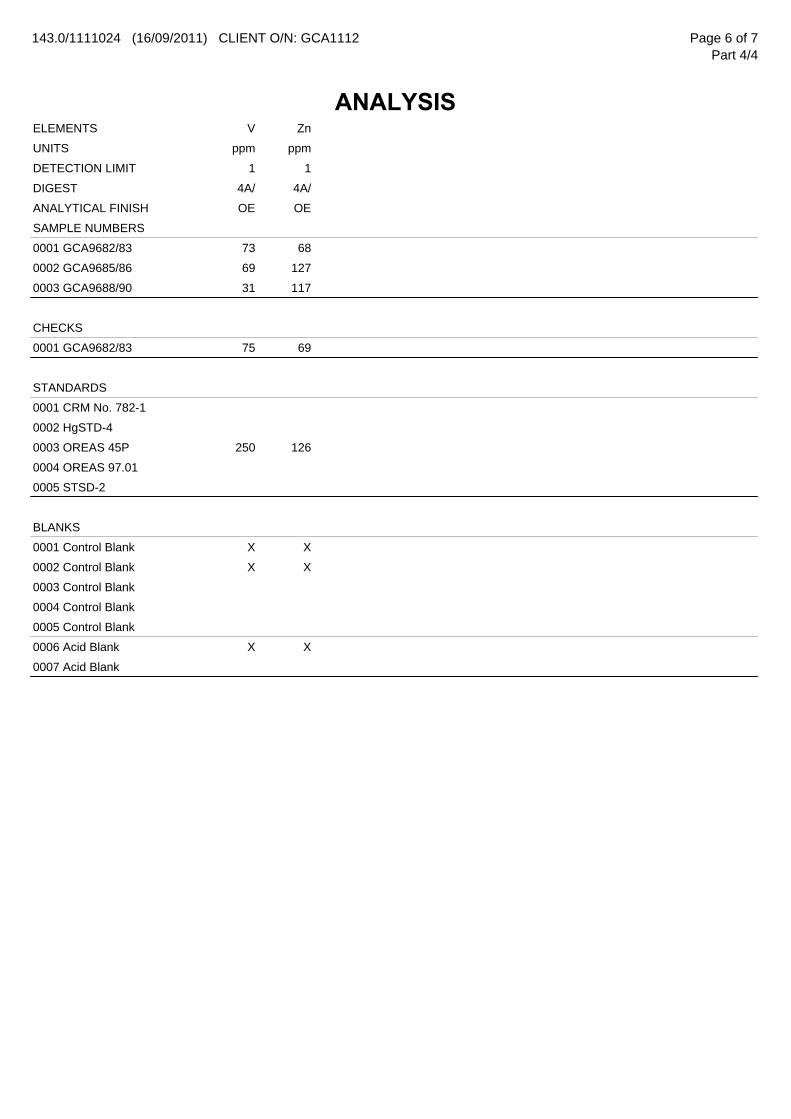
143.0/1111024 (16/09/2011) CLIENT O/N: GCA1112
ANALYSIS
Page 6 of 7Part 4/4
V ZnELEMENTS
ppm ppmUNITS
1 1DETECTION LIMIT
4A/ 4A/DIGEST
OE OEANALYTICAL FINISH
SAMPLE NUMBERS
73 680001 GCA9682/83
69 1270002 GCA9685/86
31 1170003 GCA9688/90
CHECKS
75 690001 GCA9682/83
STANDARDS
0001 CRM No. 782-1
0002 HgSTD-4
250 1260003 OREAS 45P
0004 OREAS 97.01
0005 STSD-2
BLANKS
X X0001 Control Blank
X X0002 Control Blank
0003 Control Blank
0004 Control Blank
0005 Control Blank
X X0006 Acid Blank
0007 Acid Blank

Page 7 of 7
METHOD CODE DESCRIPTION
143.0/1111024 (16/09/2011) CLIENT O/N: GCA1112
4A/MSMulti-acid digest including Hydrofluoric, Nitric, Perchloric and Hydrochloric acids in Teflon Tubes. Analysedby Inductively Coupled Plasma Mass Spectrometry.
Genalysis Main Laboratory
4A/OEMulti-acid digest including Hydrofluoric, Nitric, Perchloric and Hydrochloric acids in Teflon Tubes. Analysedby Inductively Coupled Plasma Optical (Atomic) Emission Spectrometry.
Genalysis Main Laboratory
FC7/SIEAlkaline fusion (Nickel crucible) specific for Fluorine. Analysed by Specific Ion Electrode.
Genalysis Main Laboratory
FP1/OESodium peroxide fusion (Nickel crucibles) and Hydrochloric acid to dissolve the melt. Analysed byInductively Coupled Pl
Genalysis Main Laboratory
HG1/CVLow temperature Perchloric acid digest specific for Mercury. Analysed by Cold Vapour Generation AtomicAbsorption Spectrometry.
Genalysis Main Laboratory
SE1/MSAqua-Regia digest followed by Precipitation and Concentration. Specific for Selenium. Analysed byInductively Coupled Pl
Genalysis Main Laboratory
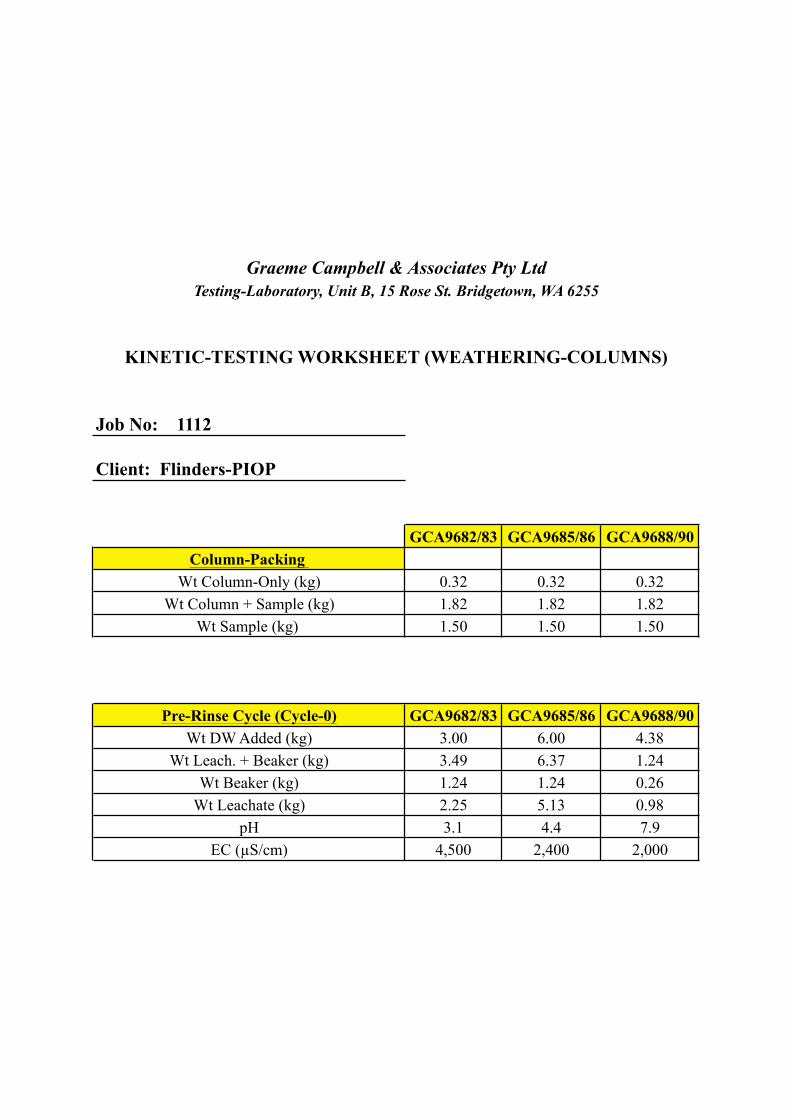
Job No: 1112
Client: Flinders-PIOP
GCA9682/83 GCA9685/86 GCA9688/90Column-Packing
Wt Column-Only (kg) 0.32 0.32 0.32Wt Column + Sample (kg) 1.82 1.82 1.82
Wt Sample (kg) 1.50 1.50 1.50
Pre-Rinse Cycle (Cycle-0) GCA9682/83 GCA9685/86 GCA9688/90Wt DW Added (kg) 3.00 6.00 4.38
Wt Leach. + Beaker (kg) 3.49 6.37 1.24Wt Beaker (kg) 1.24 1.24 0.26
Wt Leachate (kg) 2.25 5.13 0.98pH 3.1 4.4 7.9
EC (µS/cm) 4,500 2,400 2,000
Graeme Campbell & Associates Pty LtdTesting-Laboratory, Unit B, 15 Rose St. Bridgetown, WA 6255
KINETIC-TESTING WORKSHEET (WEATHERING-COLUMNS)
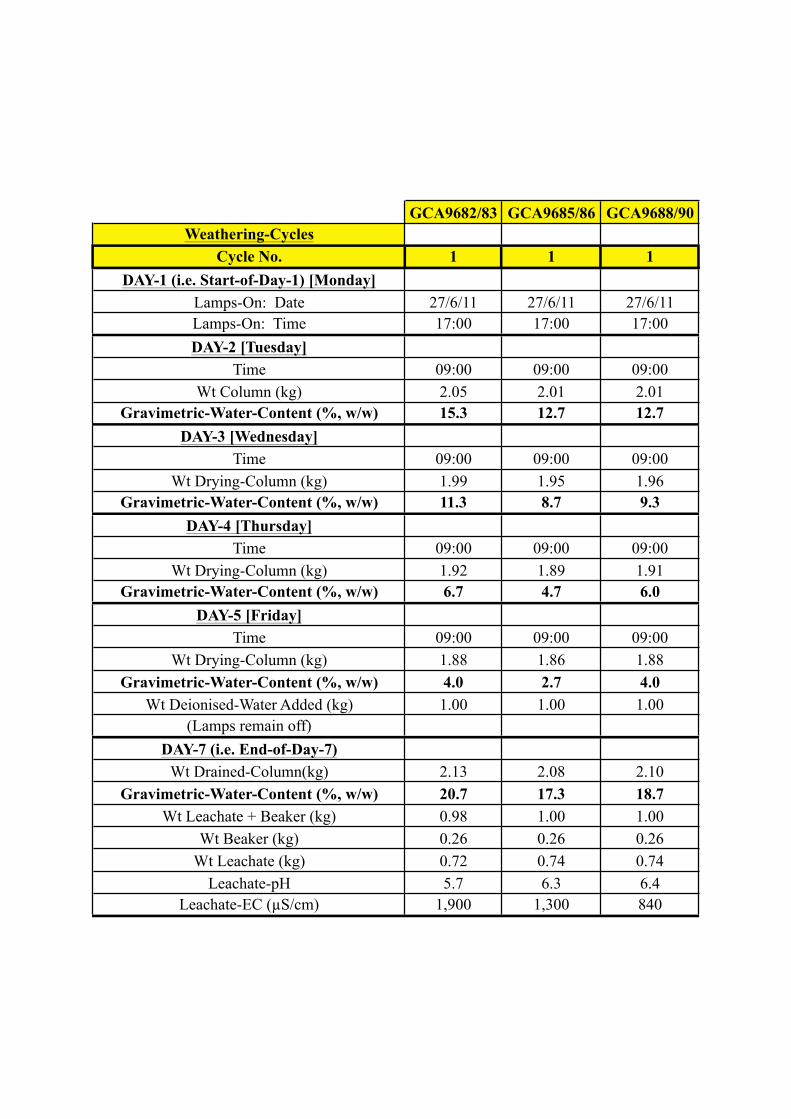
GCA9682/83 GCA9685/86 GCA9688/90Weathering-Cycles
Cycle No. 1 1 1DAY-1 (i.e. Start-of-Day-1) [Monday]
Lamps-On: Date 27/6/11 27/6/11 27/6/11Lamps-On: Time 17:00 17:00 17:00DAY-2 [Tuesday]
Time 09:00 09:00 09:00Wt Column (kg) 2.05 2.01 2.01
Gravimetric-Water-Content (%, w/w) 15.3 12.7 12.7DAY-3 [Wednesday]
Time 09:00 09:00 09:00Wt Drying-Column (kg) 1.99 1.95 1.96
Gravimetric-Water-Content (%, w/w) 11.3 8.7 9.3DAY-4 [Thursday]
Time 09:00 09:00 09:00Wt Drying-Column (kg) 1.92 1.89 1.91
Gravimetric-Water-Content (%, w/w) 6.7 4.7 6.0DAY-5 [Friday]
Time 09:00 09:00 09:00Wt Drying-Column (kg) 1.88 1.86 1.88
Gravimetric-Water-Content (%, w/w) 4.0 2.7 4.0Wt Deionised-Water Added (kg) 1.00 1.00 1.00
(Lamps remain off)DAY-7 (i.e. End-of-Day-7)
Wt Drained-Column(kg) 2.13 2.08 2.10Gravimetric-Water-Content (%, w/w) 20.7 17.3 18.7
Wt Leachate + Beaker (kg) 0.98 1.00 1.00Wt Beaker (kg) 0.26 0.26 0.26
Wt Leachate (kg) 0.72 0.74 0.74Leachate-pH 5.7 6.3 6.4
Leachate-EC (µS/cm) 1,900 1,300 840
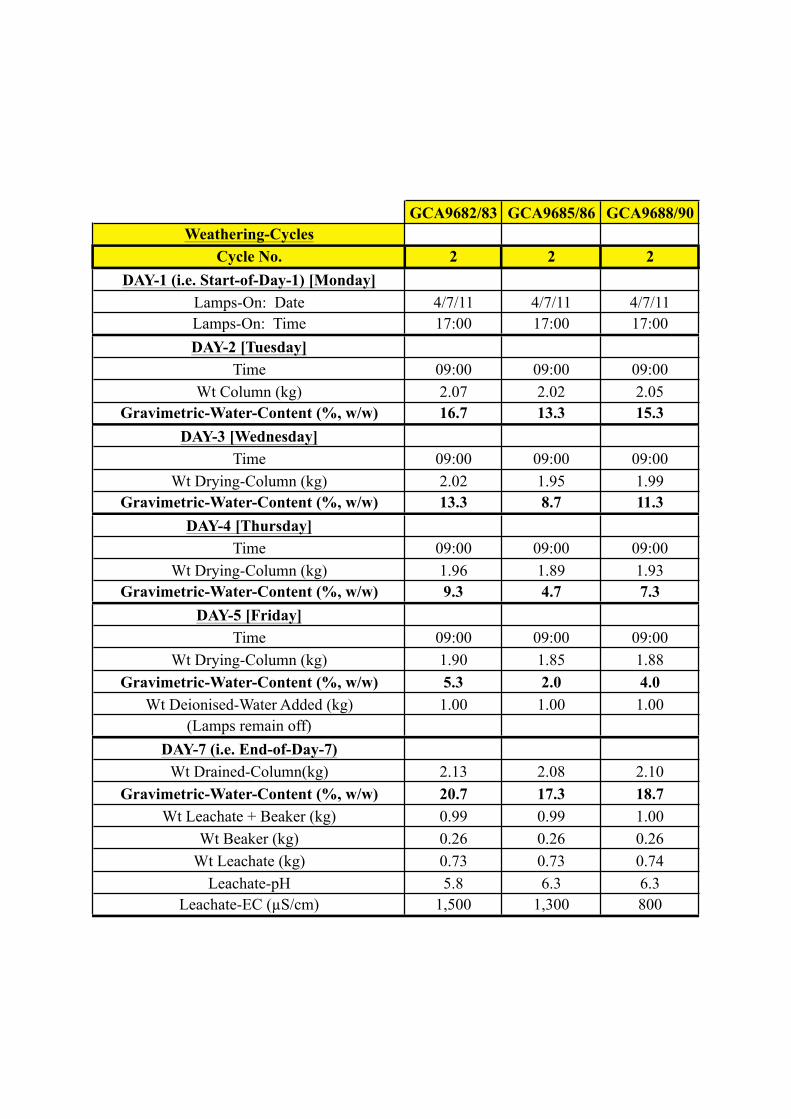
GCA9682/83 GCA9685/86 GCA9688/90Weathering-Cycles
Cycle No. 2 2 2DAY-1 (i.e. Start-of-Day-1) [Monday]
Lamps-On: Date 4/7/11 4/7/11 4/7/11Lamps-On: Time 17:00 17:00 17:00DAY-2 [Tuesday]
Time 09:00 09:00 09:00Wt Column (kg) 2.07 2.02 2.05
Gravimetric-Water-Content (%, w/w) 16.7 13.3 15.3DAY-3 [Wednesday]
Time 09:00 09:00 09:00Wt Drying-Column (kg) 2.02 1.95 1.99
Gravimetric-Water-Content (%, w/w) 13.3 8.7 11.3DAY-4 [Thursday]
Time 09:00 09:00 09:00Wt Drying-Column (kg) 1.96 1.89 1.93
Gravimetric-Water-Content (%, w/w) 9.3 4.7 7.3DAY-5 [Friday]
Time 09:00 09:00 09:00Wt Drying-Column (kg) 1.90 1.85 1.88
Gravimetric-Water-Content (%, w/w) 5.3 2.0 4.0Wt Deionised-Water Added (kg) 1.00 1.00 1.00
(Lamps remain off)DAY-7 (i.e. End-of-Day-7)
Wt Drained-Column(kg) 2.13 2.08 2.10Gravimetric-Water-Content (%, w/w) 20.7 17.3 18.7
Wt Leachate + Beaker (kg) 0.99 0.99 1.00Wt Beaker (kg) 0.26 0.26 0.26
Wt Leachate (kg) 0.73 0.73 0.74Leachate-pH 5.8 6.3 6.3
Leachate-EC (µS/cm) 1,500 1,300 800

GCA9682/83 GCA9685/86 GCA9688/90Weathering-Cycles
Cycle No. 3 3 3DAY-1 (i.e. Start-of-Day-1) [Monday]
Lamps-On: Date 11/7/11 11/7/11 11/7/11Lamps-On: Time 17:00 17:00 17:00DAY-2 [Tuesday]
Time 09:00 09:00 09:00Wt Column (kg) 2.07 2.01 2.05
Gravimetric-Water-Content (%, w/w) 16.7 12.7 15.3DAY-3 [Wednesday]
Time 09:00 09:00 09:00Wt Drying-Column (kg) 2.00 1.94 1.99
Gravimetric-Water-Content (%, w/w) 12.0 8.0 11.3DAY-4 [Thursday]
Time 09:00 09:00 09:00Wt Drying-Column (kg) 1.94 1.87 1.94
Gravimetric-Water-Content (%, w/w) 8.0 3.3 8.0DAY-5 [Friday]
Time 09:00 09:00 09:00Wt Drying-Column (kg) 1.88 1.84 1.88
Gravimetric-Water-Content (%, w/w) 4.0 1.3 4.0Wt Deionised-Water Added (kg) 1.00 1.00 1.00
(Lamps remain off)DAY-7 (i.e. End-of-Day-7)
Wt Drained-Column(kg) 2.12 2.07 2.09Gravimetric-Water-Content (%, w/w) 20.0 16.7 18.0
Wt Leachate + Beaker (kg) 0.99 1.01 0.98Wt Beaker (kg) 0.26 0.26 0.26
Wt Leachate (kg) 0.73 0.75 0.72Leachate-pH 5.7 6.2 6.4
Leachate-EC (µS/cm) 1,400 1,400 900

GCA9682/83 GCA9685/86 GCA9688/90Weathering-Cycles
Cycle No. 4 4 4DAY-1 (i.e. Start-of-Day-1) [Monday]
Lamps-On: Date 18/7/11 18/7/11 18/7/11Lamps-On: Time 17:00 17:00 17:00DAY-2 [Tuesday]
Time 09:00 09:00 09:00Wt Column (kg) 2.06 2.02 2.03
Gravimetric-Water-Content (%, w/w) 16.0 13.3 14.0DAY-3 [Wednesday]
Time 09:00 09:00 09:00Wt Drying-Column (kg) 1.98 1.97 1.98
Gravimetric-Water-Content (%, w/w) 10.7 10.0 10.7DAY-4 [Thursday]
Time 09:00 09:00 09:00Wt Drying-Column (kg) 1.92 1.92 1.93
Gravimetric-Water-Content (%, w/w) 6.7 6.7 7.3DAY-5 [Friday]
Time 09:00 09:00 09:00Wt Drying-Column (kg) 1.87 1.87 1.88
Gravimetric-Water-Content (%, w/w) 3.3 3.3 4.0Wt Deionised-Water Added (kg) 1.00 1.00 1.00
(Lamps remain off)DAY-7 (i.e. End-of-Day-7)
Wt Drained-Column(kg) 2.13 2.07 2.09Gravimetric-Water-Content (%, w/w) 20.7 16.7 18.0
Wt Leachate + Beaker (kg) 0.97 1.02 1.01Wt Beaker (kg) 0.26 0.26 0.26
Wt Leachate (kg) 0.71 0.76 0.75Leachate-pH 5.7 6.2 6.6
Leachate-EC (µS/cm) 880 770 580
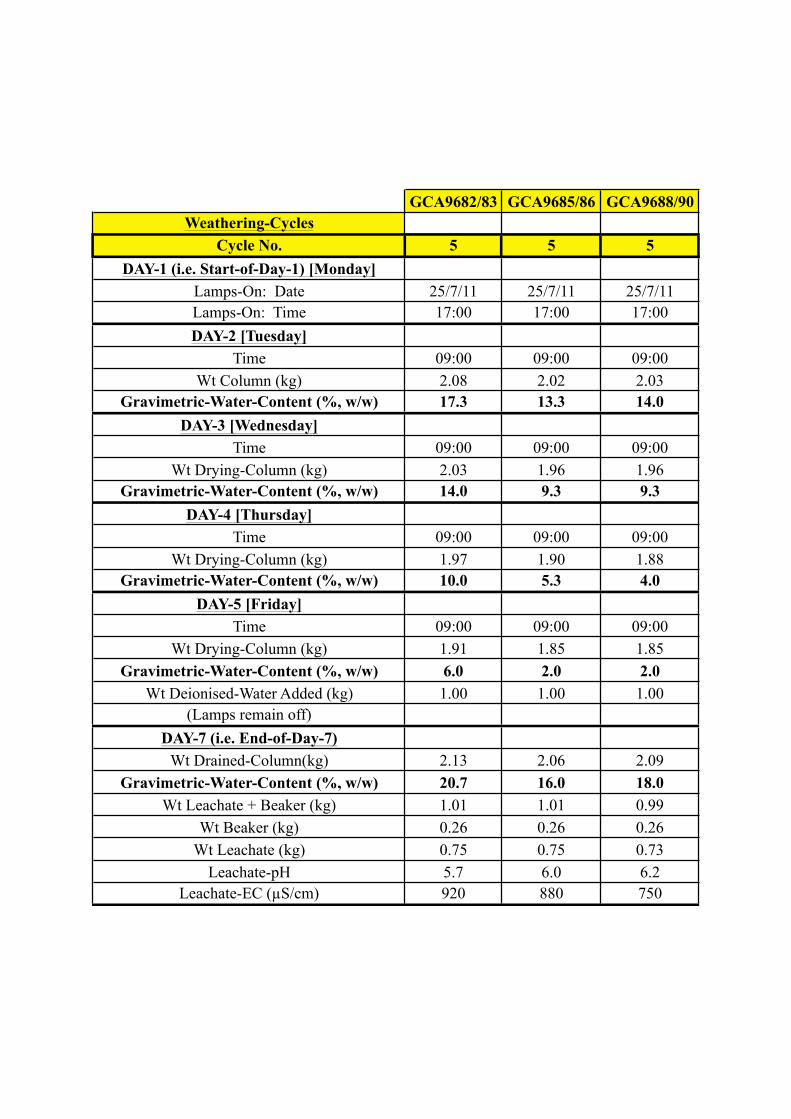
GCA9682/83 GCA9685/86 GCA9688/90Weathering-Cycles
Cycle No. 5 5 5DAY-1 (i.e. Start-of-Day-1) [Monday]
Lamps-On: Date 25/7/11 25/7/11 25/7/11Lamps-On: Time 17:00 17:00 17:00DAY-2 [Tuesday]
Time 09:00 09:00 09:00Wt Column (kg) 2.08 2.02 2.03
Gravimetric-Water-Content (%, w/w) 17.3 13.3 14.0DAY-3 [Wednesday]
Time 09:00 09:00 09:00Wt Drying-Column (kg) 2.03 1.96 1.96
Gravimetric-Water-Content (%, w/w) 14.0 9.3 9.3DAY-4 [Thursday]
Time 09:00 09:00 09:00Wt Drying-Column (kg) 1.97 1.90 1.88
Gravimetric-Water-Content (%, w/w) 10.0 5.3 4.0DAY-5 [Friday]
Time 09:00 09:00 09:00Wt Drying-Column (kg) 1.91 1.85 1.85
Gravimetric-Water-Content (%, w/w) 6.0 2.0 2.0Wt Deionised-Water Added (kg) 1.00 1.00 1.00
(Lamps remain off)DAY-7 (i.e. End-of-Day-7)
Wt Drained-Column(kg) 2.13 2.06 2.09Gravimetric-Water-Content (%, w/w) 20.7 16.0 18.0
Wt Leachate + Beaker (kg) 1.01 1.01 0.99Wt Beaker (kg) 0.26 0.26 0.26
Wt Leachate (kg) 0.75 0.75 0.73Leachate-pH 5.7 6.0 6.2
Leachate-EC (µS/cm) 920 880 750
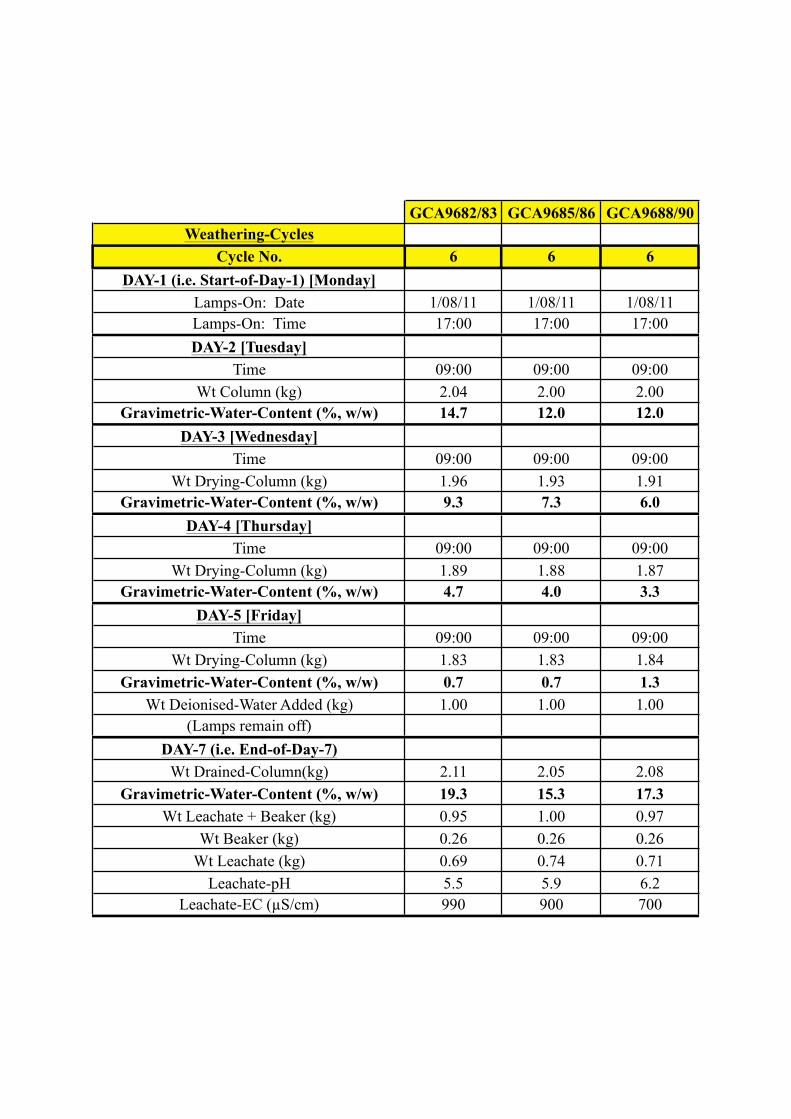
GCA9682/83 GCA9685/86 GCA9688/90Weathering-Cycles
Cycle No. 6 6 6DAY-1 (i.e. Start-of-Day-1) [Monday]
Lamps-On: Date 1/08/11 1/08/11 1/08/11Lamps-On: Time 17:00 17:00 17:00DAY-2 [Tuesday]
Time 09:00 09:00 09:00Wt Column (kg) 2.04 2.00 2.00
Gravimetric-Water-Content (%, w/w) 14.7 12.0 12.0DAY-3 [Wednesday]
Time 09:00 09:00 09:00Wt Drying-Column (kg) 1.96 1.93 1.91
Gravimetric-Water-Content (%, w/w) 9.3 7.3 6.0DAY-4 [Thursday]
Time 09:00 09:00 09:00Wt Drying-Column (kg) 1.89 1.88 1.87
Gravimetric-Water-Content (%, w/w) 4.7 4.0 3.3DAY-5 [Friday]
Time 09:00 09:00 09:00Wt Drying-Column (kg) 1.83 1.83 1.84
Gravimetric-Water-Content (%, w/w) 0.7 0.7 1.3Wt Deionised-Water Added (kg) 1.00 1.00 1.00
(Lamps remain off)DAY-7 (i.e. End-of-Day-7)
Wt Drained-Column(kg) 2.11 2.05 2.08Gravimetric-Water-Content (%, w/w) 19.3 15.3 17.3
Wt Leachate + Beaker (kg) 0.95 1.00 0.97Wt Beaker (kg) 0.26 0.26 0.26
Wt Leachate (kg) 0.69 0.74 0.71Leachate-pH 5.5 5.9 6.2
Leachate-EC (µS/cm) 990 900 700
GLS Job Code 143.0/1112030 Client ON GCA 1112
15 Davison Street, Maddington WA 6109
PO Box 144, Gosnells WA 6990 T +61 8 9251 8100 I F +61 8 9251 8110
ABN 32 008 787 237 www.intertek.com www.genalysis.com.au
Page 1 of 3
Dr G Campbell CAMPBELL, GRAEME and ASSOCIATES PTY LTD PO Box 247 BRIDGETOWN WA 6255 JOB INFORMATION
JOB CODE 143/1112030 No. of SAMPLES 36 CLIENT O/N GCA 1112 PROJECT Flinders PIOP STATE Column leachates DATE RECEIVED 10/08/2011 DATE COMPLETED 31/08/2011
LEGEND X = Less than Detection Limit N/R = Sample Not Received * = Result Checked ( ) = Result still to come I/S = Insufficient Sample for Analysis E6 = Result X 1,000,000 UA = Unable to Assay > = Value beyond Limit of Method
A series of column leachates were received. The pH, EC and Cl of each “raw” sample was measured using Genalysis method codes: ENV-W001, ENV-W002, and ENV_W013 The acidity of requested samples was measured by titration to pH=8.3(Acidy) using sodium hydroxide and expressed as mgH2SO4/L. APHA method code 2310B APHA code refers to “Standard methods for the examination of water and wastewater”, 21st Edition 2005 The HNO3 dosed filtered solution was analysed for the requested element suite (including S) by ICPMS and /or ICPOES: Genalysis method codes (ICP_W003, ICP_W004).
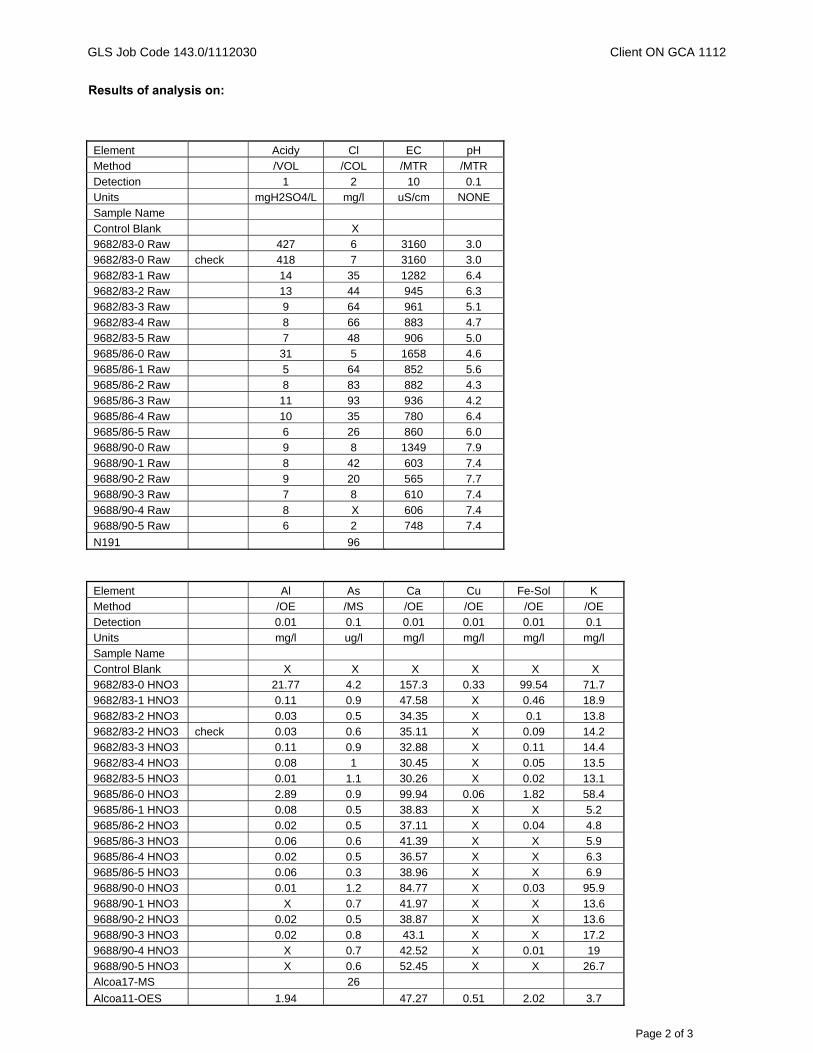
GLS Job Code 143.0/1112030 Client ON GCA 1112
Page 2 of 3
Results of analysis on: Element Acidy Cl EC pH Method /VOL /COL /MTR /MTR
Detection 1 2 10 0.1 Units mgH2SO4/L mg/l uS/cm NONE Sample Name
Control Blank X 9682/83-0 Raw 427 6 3160 3.0 9682/83-0 Raw check 418 7 3160 3.0
9682/83-1 Raw 14 35 1282 6.4 9682/83-2 Raw 13 44 945 6.3 9682/83-3 Raw 9 64 961 5.1
9682/83-4 Raw 8 66 883 4.7 9682/83-5 Raw 7 48 906 5.0 9685/86-0 Raw 31 5 1658 4.6
9685/86-1 Raw 5 64 852 5.6 9685/86-2 Raw 8 83 882 4.3 9685/86-3 Raw 11 93 936 4.2
9685/86-4 Raw 10 35 780 6.4 9685/86-5 Raw 6 26 860 6.0 9688/90-0 Raw 9 8 1349 7.9
9688/90-1 Raw 8 42 603 7.4 9688/90-2 Raw 9 20 565 7.7 9688/90-3 Raw 7 8 610 7.4
9688/90-4 Raw 8 X 606 7.4 9688/90-5 Raw 6 2 748 7.4
N191 96
Element Al As Ca Cu Fe-Sol K Method /OE /MS /OE /OE /OE /OE Detection 0.01 0.1 0.01 0.01 0.01 0.1 Units mg/l ug/l mg/l mg/l mg/l mg/l Sample Name Control Blank X X X X X X 9682/83-0 HNO3 21.77 4.2 157.3 0.33 99.54 71.7 9682/83-1 HNO3 0.11 0.9 47.58 X 0.46 18.9 9682/83-2 HNO3 0.03 0.5 34.35 X 0.1 13.8 9682/83-2 HNO3 check 0.03 0.6 35.11 X 0.09 14.2 9682/83-3 HNO3 0.11 0.9 32.88 X 0.11 14.4 9682/83-4 HNO3 0.08 1 30.45 X 0.05 13.5 9682/83-5 HNO3 0.01 1.1 30.26 X 0.02 13.1 9685/86-0 HNO3 2.89 0.9 99.94 0.06 1.82 58.4 9685/86-1 HNO3 0.08 0.5 38.83 X X 5.2 9685/86-2 HNO3 0.02 0.5 37.11 X 0.04 4.8 9685/86-3 HNO3 0.06 0.6 41.39 X X 5.9 9685/86-4 HNO3 0.02 0.5 36.57 X X 6.3 9685/86-5 HNO3 0.06 0.3 38.96 X X 6.9 9688/90-0 HNO3 0.01 1.2 84.77 X 0.03 95.9 9688/90-1 HNO3 X 0.7 41.97 X X 13.6 9688/90-2 HNO3 0.02 0.5 38.87 X X 13.6 9688/90-3 HNO3 0.02 0.8 43.1 X X 17.2 9688/90-4 HNO3 X 0.7 42.52 X 0.01 19 9688/90-5 HNO3 X 0.6 52.45 X X 26.7 Alcoa17-MS 26
Alcoa11-OES 1.94 47.27 0.51 2.02 3.7
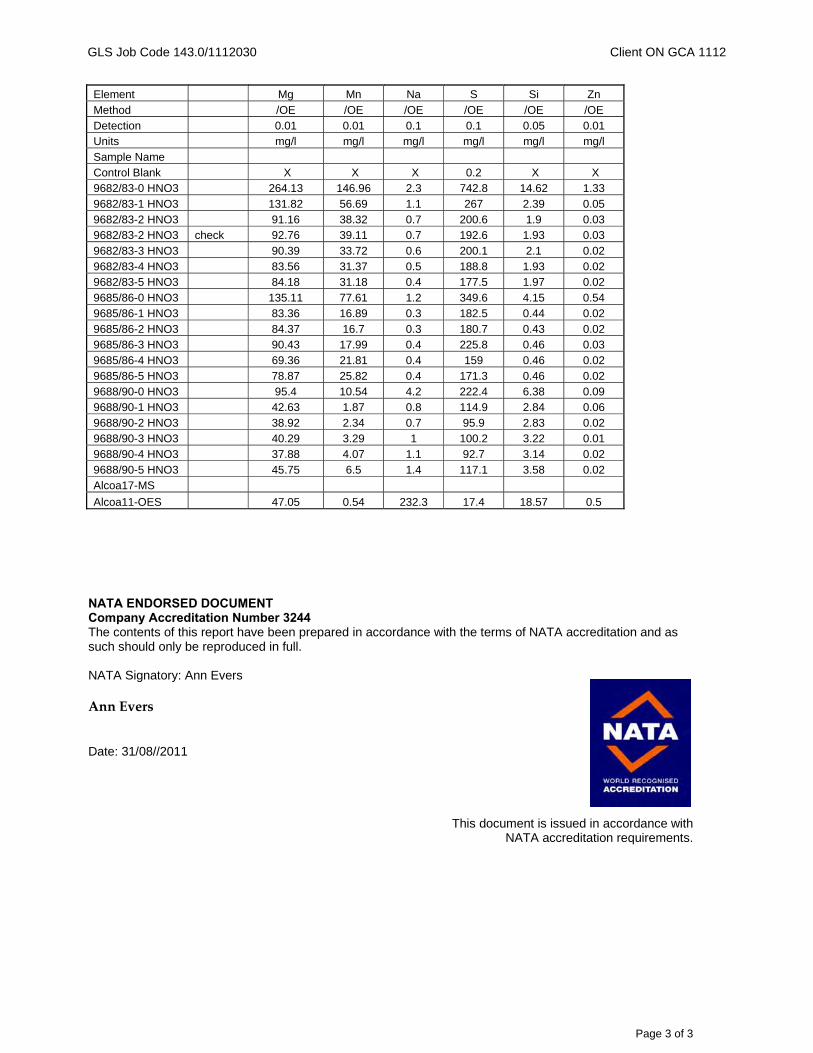
GLS Job Code 143.0/1112030 Client ON GCA 1112
Page 3 of 3
Element Mg Mn Na S Si Zn
Method /OE /OE /OE /OE /OE /OE Detection 0.01 0.01 0.1 0.1 0.05 0.01 Units mg/l mg/l mg/l mg/l mg/l mg/l
Sample Name Control Blank X X X 0.2 X X 9682/83-0 HNO3 264.13 146.96 2.3 742.8 14.62 1.33
9682/83-1 HNO3 131.82 56.69 1.1 267 2.39 0.05 9682/83-2 HNO3 91.16 38.32 0.7 200.6 1.9 0.03 9682/83-2 HNO3 check 92.76 39.11 0.7 192.6 1.93 0.03
9682/83-3 HNO3 90.39 33.72 0.6 200.1 2.1 0.02 9682/83-4 HNO3 83.56 31.37 0.5 188.8 1.93 0.02 9682/83-5 HNO3 84.18 31.18 0.4 177.5 1.97 0.02
9685/86-0 HNO3 135.11 77.61 1.2 349.6 4.15 0.54 9685/86-1 HNO3 83.36 16.89 0.3 182.5 0.44 0.02 9685/86-2 HNO3 84.37 16.7 0.3 180.7 0.43 0.02 9685/86-3 HNO3 90.43 17.99 0.4 225.8 0.46 0.03 9685/86-4 HNO3 69.36 21.81 0.4 159 0.46 0.02 9685/86-5 HNO3 78.87 25.82 0.4 171.3 0.46 0.02 9688/90-0 HNO3 95.4 10.54 4.2 222.4 6.38 0.09 9688/90-1 HNO3 42.63 1.87 0.8 114.9 2.84 0.06 9688/90-2 HNO3 38.92 2.34 0.7 95.9 2.83 0.02 9688/90-3 HNO3 40.29 3.29 1 100.2 3.22 0.01 9688/90-4 HNO3 37.88 4.07 1.1 92.7 3.14 0.02 9688/90-5 HNO3 45.75 6.5 1.4 117.1 3.58 0.02 Alcoa17-MS
Alcoa11-OES 47.05 0.54 232.3 17.4 18.57 0.5 NATA ENDORSED DOCUMENT Company Accreditation Number 3244 The contents of this report have been prepared in accordance with the terms of NATA accreditation and as such should only be reproduced in full. NATA Signatory: Ann Evers Ann Evers Date: 31/08//2011
This document is issued in accordance with NATA accreditation requirements.
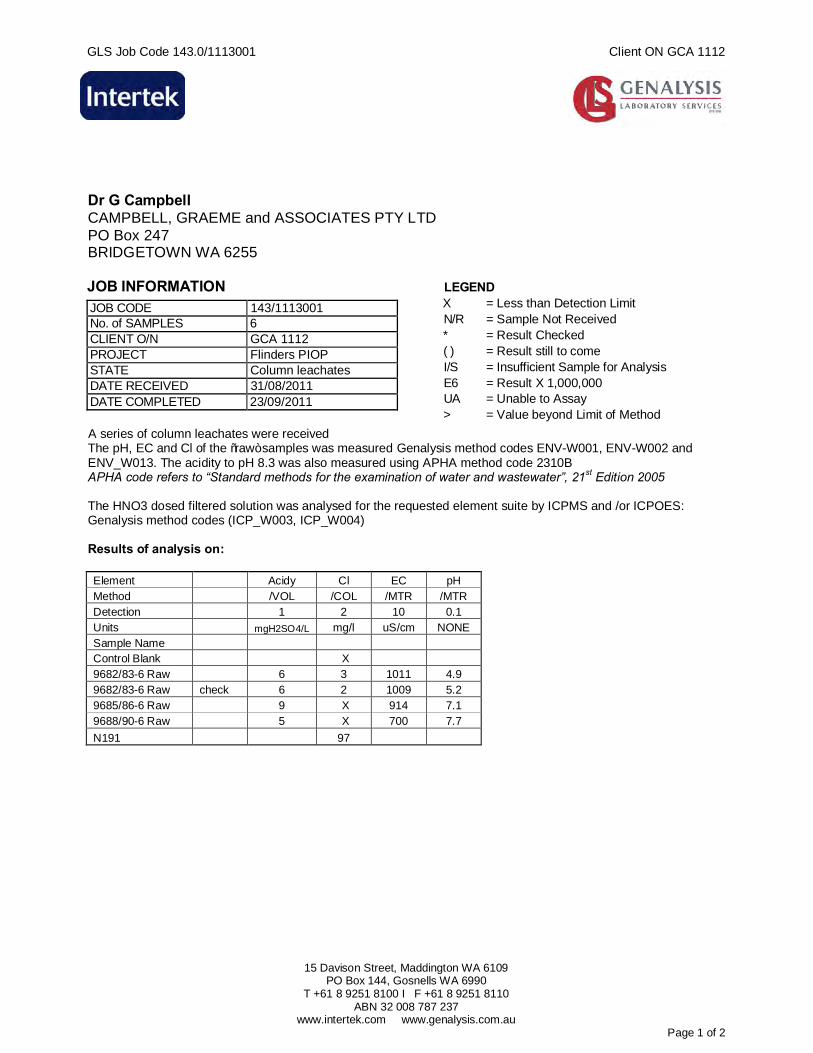
GLS Job Code 143.0/1113001 Client ON GCA 1112
15 Davison Street, Maddington WA 6109
PO Box 144, Gosnells WA 6990 T +61 8 9251 8100 I F +61 8 9251 8110
ABN 32 008 787 237 www.intertek.com www.genalysis.com.au
Page 1 of 2
Dr G Campbell CAMPBELL, GRAEME and ASSOCIATES PTY LTD PO Box 247 BRIDGETOWN WA 6255 JOB INFORMATION
JOB CODE 143/1113001 No. of SAMPLES 6 CLIENT O/N GCA 1112 PROJECT Flinders PIOP STATE Column leachates DATE RECEIVED 31/08/2011 DATE COMPLETED 23/09/2011
LEGEND X = Less than Detection Limit N/R = Sample Not Received * = Result Checked ( ) = Result still to come I/S = Insufficient Sample for Analysis E6 = Result X 1,000,000 UA = Unable to Assay > = Value beyond Limit of Method
A series of column leachates were received The pH, EC and Cl of the “raw” samples was measured Genalysis method codes ENV-W001, ENV-W002 and ENV_W013. The acidity to pH 8.3 was also measured using APHA method code 2310B APHA code refers to “Standard methods for the examination of water and wastewater”, 21st Edition 2005 The HNO3 dosed filtered solution was analysed for the requested element suite by ICPMS and /or ICPOES: Genalysis method codes (ICP_W003, ICP_W004) Results of analysis on: Element Acidy Cl EC pH Method /VOL /COL /MTR /MTR Detection 1 2 10 0.1 Units mgH2SO4/L mg/l uS/cm NONE Sample Name Control Blank X 9682/83-6 Raw 6 3 1011 4.9 9682/83-6 Raw check 6 2 1009 5.2 9685/86-6 Raw 9 X 914 7.1 9688/90-6 Raw 5 X 700 7.7
N191 97
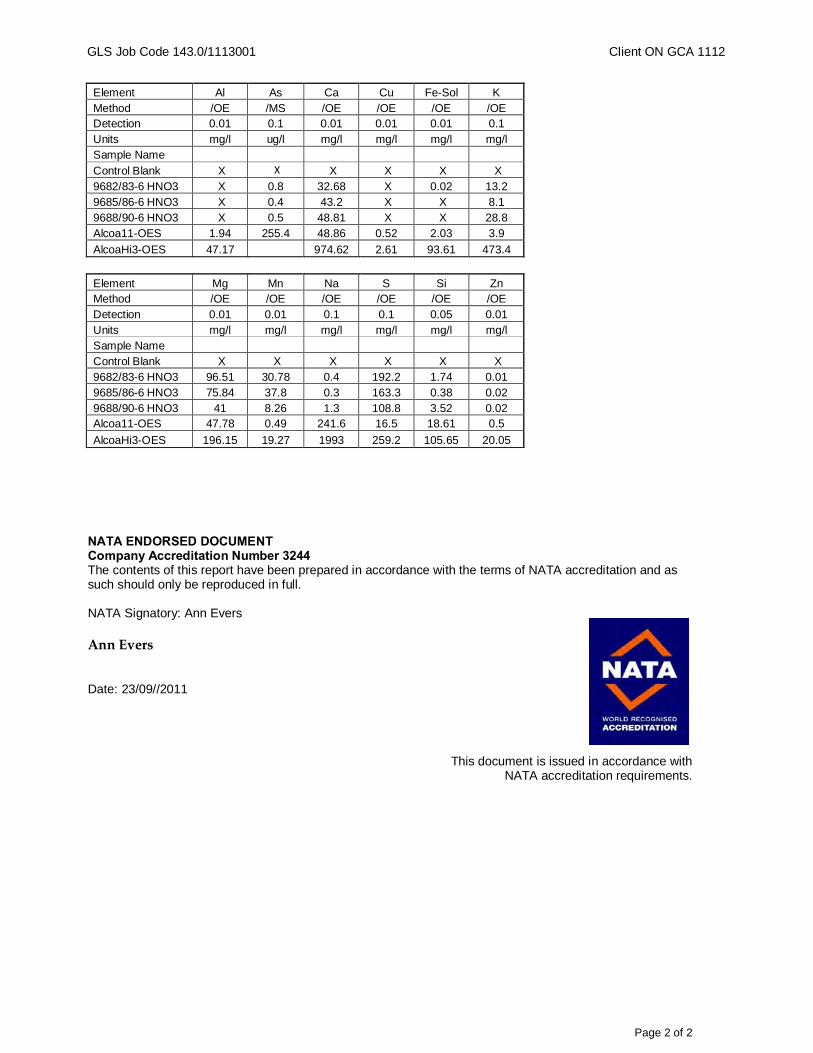
GLS Job Code 143.0/1113001 Client ON GCA 1112
Page 2 of 2
Element Al As Ca Cu Fe-Sol K Method /OE /MS /OE /OE /OE /OE Detection 0.01 0.1 0.01 0.01 0.01 0.1 Units mg/l ug/l mg/l mg/l mg/l mg/l Sample Name
Control Blank X X X X X X 9682/83-6 HNO3 X 0.8 32.68 X 0.02 13.2 9685/86-6 HNO3 X 0.4 43.2 X X 8.1 9688/90-6 HNO3 X 0.5 48.81 X X 28.8 Alcoa11-OES 1.94 255.4 48.86 0.52 2.03 3.9
AlcoaHi3-OES 47.17 974.62 2.61 93.61 473.4
Element Mg Mn Na S Si Zn Method /OE /OE /OE /OE /OE /OE Detection 0.01 0.01 0.1 0.1 0.05 0.01 Units mg/l mg/l mg/l mg/l mg/l mg/l Sample Name Control Blank X X X X X X 9682/83-6 HNO3 96.51 30.78 0.4 192.2 1.74 0.01 9685/86-6 HNO3 75.84 37.8 0.3 163.3 0.38 0.02 9688/90-6 HNO3 41 8.26 1.3 108.8 3.52 0.02 Alcoa11-OES 47.78 0.49 241.6 16.5 18.61 0.5
AlcoaHi3-OES 196.15 19.27 1993 259.2 105.65 20.05 NATA ENDORSED DOCUMENT Company Accreditation Number 3244 The contents of this report have been prepared in accordance with the terms of NATA accreditation and as such should only be reproduced in full. NATA Signatory: Ann Evers Ann Evers Date: 23/09//2011
This document is issued in accordance with NATA accreditation requirements.

FLINDERS MINES LIMITED
GEOCHEMICAL CHARACTERISATION OF MINE WASTE AND TAILINGS
IMPLICATIONS FOR MINE WASTE MANAGEMENT
i:\projects\201012-00322 fms vip\2.0 reports\geochem report\201012-00322 fms waste rock management_rev0..doc Page 14 201012-00322 :0000-EN-REP-0011Rev 0 : 20 July 2012
APPENDIX B
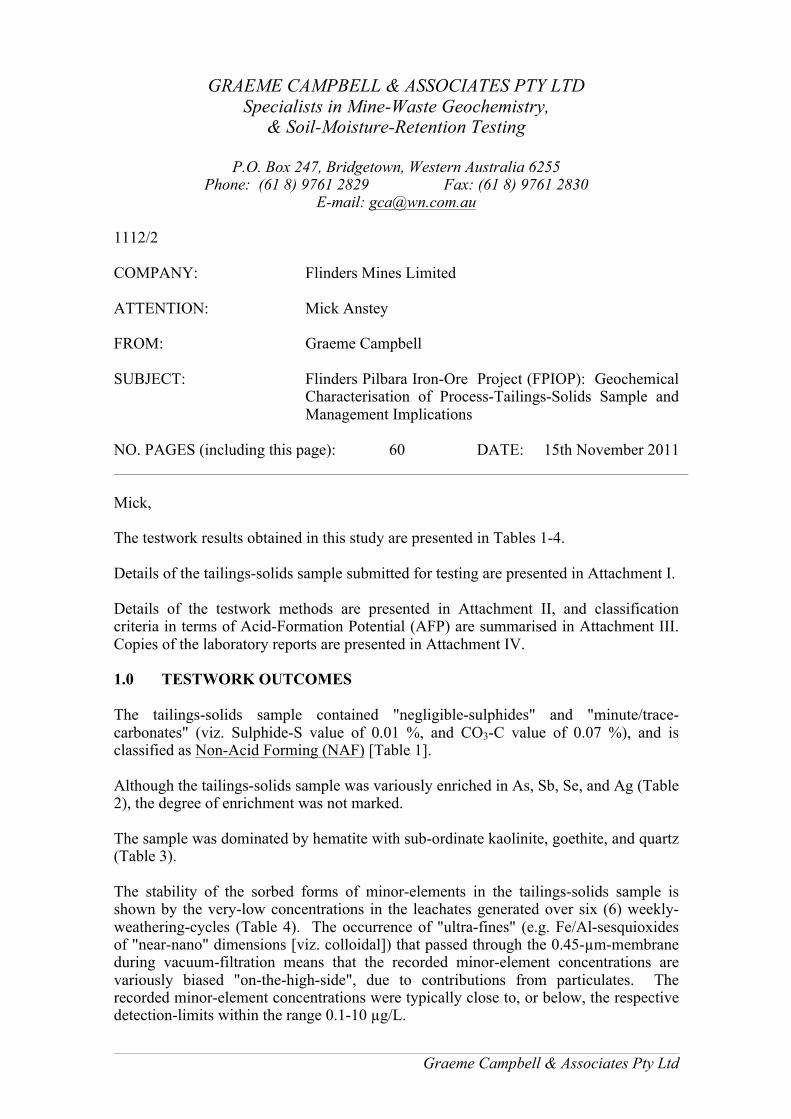
Graeme Campbell & Associates Pty Ltd
GRAEME CAMPBELL & ASSOCIATES PTY LTD Specialists in Mine-Waste Geochemistry,
& Soil-Moisture-Retention Testing
P.O. Box 247, Bridgetown, Western Australia 6255 Phone: (61 8) 9761 2829 Fax: (61 8) 9761 2830
E-mail: [email protected] 1112/2 COMPANY: Flinders Mines Limited ATTENTION: Mick Anstey FROM: Graeme Campbell SUBJECT: Flinders Pilbara Iron-Ore Project (FPIOP): Geochemical
Characterisation of Process-Tailings-Solids Sample and Management Implications
NO. PAGES (including this page): 60 DATE: 15th November 2011 Mick, The testwork results obtained in this study are presented in Tables 1-4. Details of the tailings-solids sample submitted for testing are presented in Attachment I. Details of the testwork methods are presented in Attachment II, and classification criteria in terms of Acid-Formation Potential (AFP) are summarised in Attachment III. Copies of the laboratory reports are presented in Attachment IV. 1.0 TESTWORK OUTCOMES The tailings-solids sample contained "negligible-sulphides" and "minute/trace-carbonates" (viz. Sulphide-S value of 0.01 %, and CO3-C value of 0.07 %), and is classified as Non-Acid Forming (NAF) [Table 1]. Although the tailings-solids sample was variously enriched in As, Sb, Se, and Ag (Table 2), the degree of enrichment was not marked. The sample was dominated by hematite with sub-ordinate kaolinite, goethite, and quartz (Table 3). The stability of the sorbed forms of minor-elements in the tailings-solids sample is shown by the very-low concentrations in the leachates generated over six (6) weekly-weathering-cycles (Table 4). The occurrence of "ultra-fines" (e.g. Fe/Al-sesquioxides of "near-nano" dimensions [viz. colloidal]) that passed through the 0.45-µm-membrane during vacuum-filtration means that the recorded minor-element concentrations are variously biased "on-the-high-side", due to contributions from particulates. The recorded minor-element concentrations were typically close to, or below, the respective detection-limits within the range 0.1-10 µg/L.
Graeme Campbell & Associates Pty Ltd
2
2.0 CONCLUSIONS Based on the testwork results obtain in this study, it is concluded that the process-tailings to be produced during the FPIOP should be geochemically benign. In essence, due to the strongly-weathered and -leached status of the ores in situ, the process-tailings have "nonething-to-give", hydrogeochemically, as they are subjected to slow 'residual-weathering' under the episodic, pulsed rainfall-regime of the Pilbara. 3.0 CLOSURE I trust the above is useful to you. Regards, Dr GD Campbell Director encl. Tables 1-4. Attachments I to IV.
Graeme Campbell & Associates Pty Ltd
TABLES
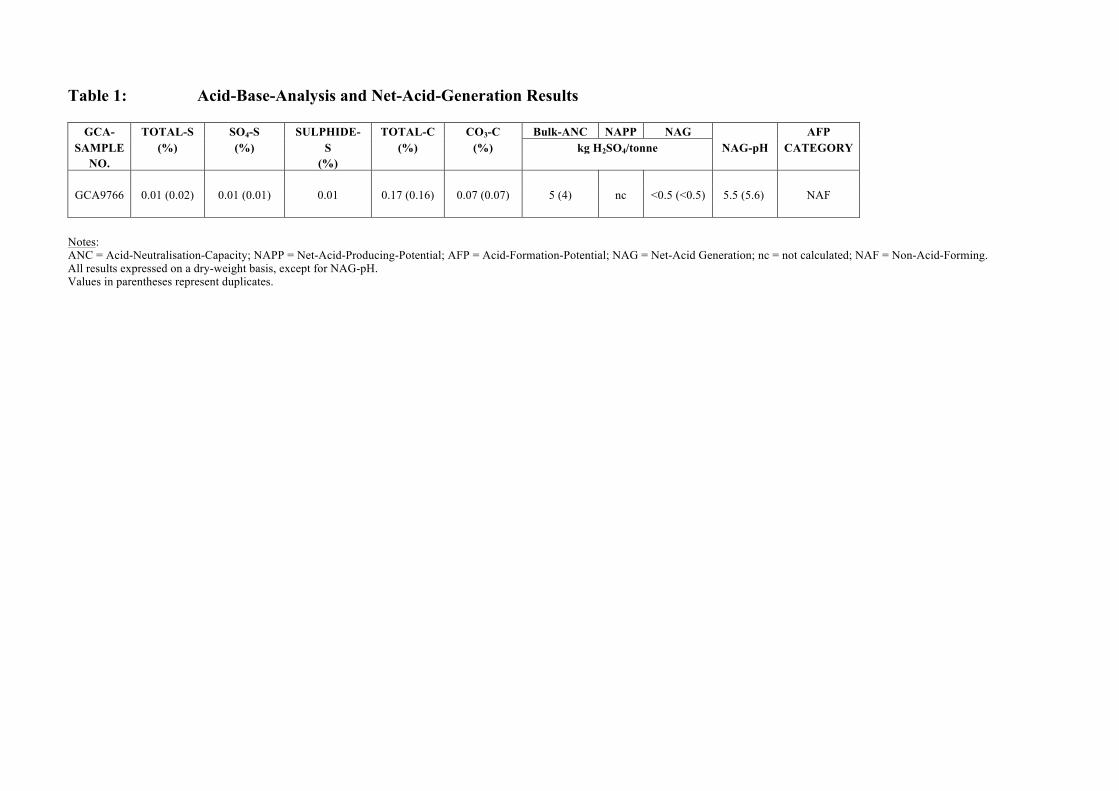
Table 1: Acid-Base-Analysis and Net-Acid-Generation Results
GCA- TOTAL-S SO4-S SULPHIDE- TOTAL-C CO3-C Bulk-ANC NAPP NAG AFP SAMPLE (%) (%) S (%) (%) kg H2SO4/tonne NAG-pH CATEGORY
NO. (%)
GCA9766 0.01 (0.02) 0.01 (0.01) 0.01 0.17 (0.16) 0.07 (0.07) 5 (4) nc <0.5 (<0.5) 5.5 (5.6) NAF
Notes: ANC = Acid-Neutralisation-Capacity; NAPP = Net-Acid-Producing-Potential; AFP = Acid-Formation-Potential; NAG = Net-Acid Generation; nc = not calculated; NAF = Non-Acid-Forming. All results expressed on a dry-weight basis, except for NAG-pH. Values in parentheses represent duplicates.
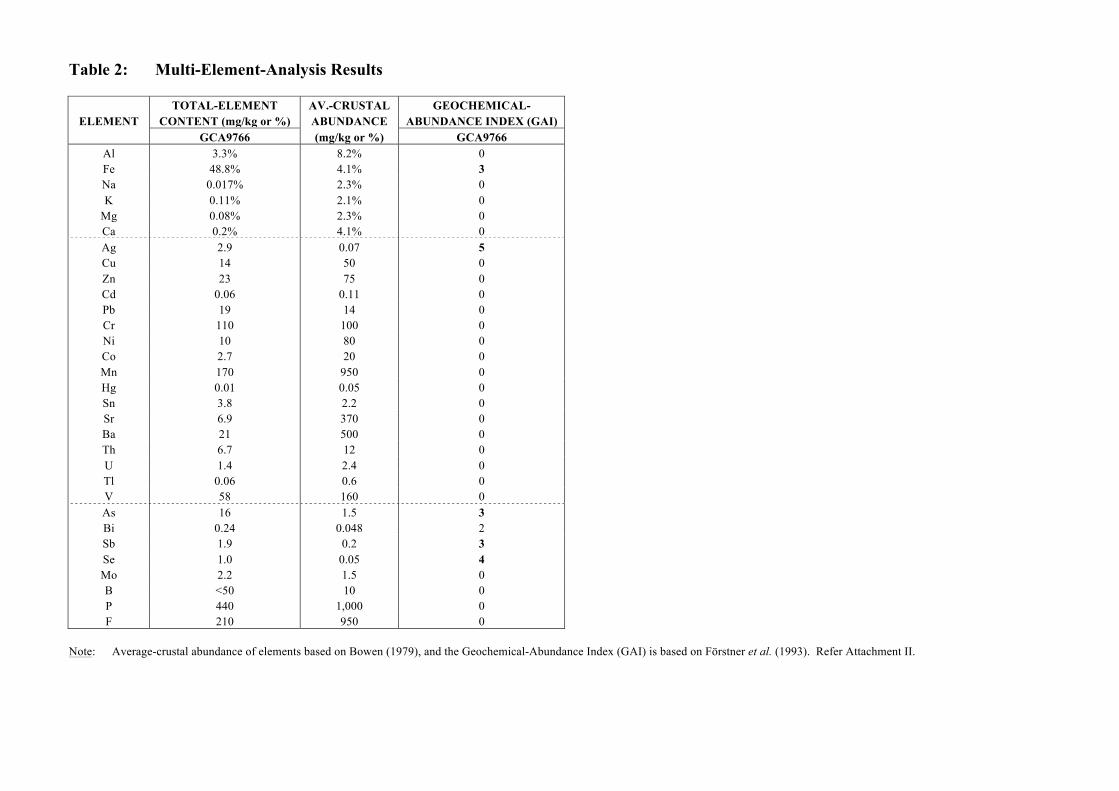
Table 2: Multi-Element-Analysis Results
TOTAL-ELEMENT AV.-CRUSTAL GEOCHEMICAL- ELEMENT CONTENT (mg/kg or %) ABUNDANCE ABUNDANCE INDEX (GAI)
GCA9766 (mg/kg or %) GCA9766 Al 3.3% 8.2% 0 Fe 48.8% 4.1% 3 Na 0.017% 2.3% 0 K 0.11% 2.1% 0
Mg 0.08% 2.3% 0 Ca 0.2% 4.1% 0 Ag 2.9 0.07 5 Cu 14 50 0 Zn 23 75 0 Cd 0.06 0.11 0 Pb 19 14 0 Cr 110 100 0 Ni 10 80 0 Co 2.7 20 0 Mn 170 950 0 Hg 0.01 0.05 0 Sn 3.8 2.2 0 Sr 6.9 370 0 Ba 21 500 0 Th 6.7 12 0 U 1.4 2.4 0 Tl 0.06 0.6 0 V 58 160 0 As 16 1.5 3 Bi 0.24 0.048 2 Sb 1.9 0.2 3 Se 1.0 0.05 4 Mo 2.2 1.5 0 B <50 10 0 P 440 1,000 0 F 210 950 0
Note: Average-crustal abundance of elements based on Bowen (1979), and the Geochemical-Abundance Index (GAI) is based on Förstner et al. (1993). Refer Attachment II.
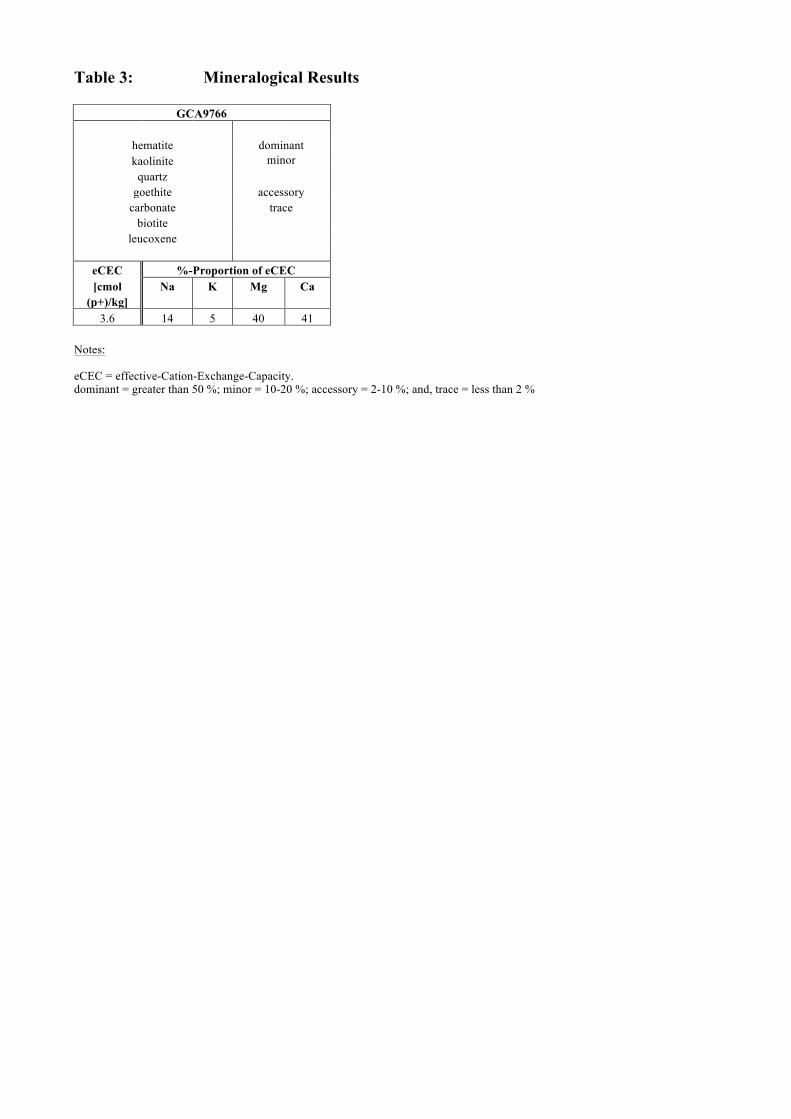
Table 3: Mineralogical Results
GCA9766
hematite dominant kaolinite minor
quartz goethite accessory
carbonate trace biotite
leucoxene
eCEC %-Proportion of eCEC [cmol Na K Mg Ca
(p+)/kg] 3.6 14 5 40 41
Notes: eCEC = effective-Cation-Exchange-Capacity. dominant = greater than 50 %; minor = 10-20 %; accessory = 2-10 %; and, trace = less than 2 %
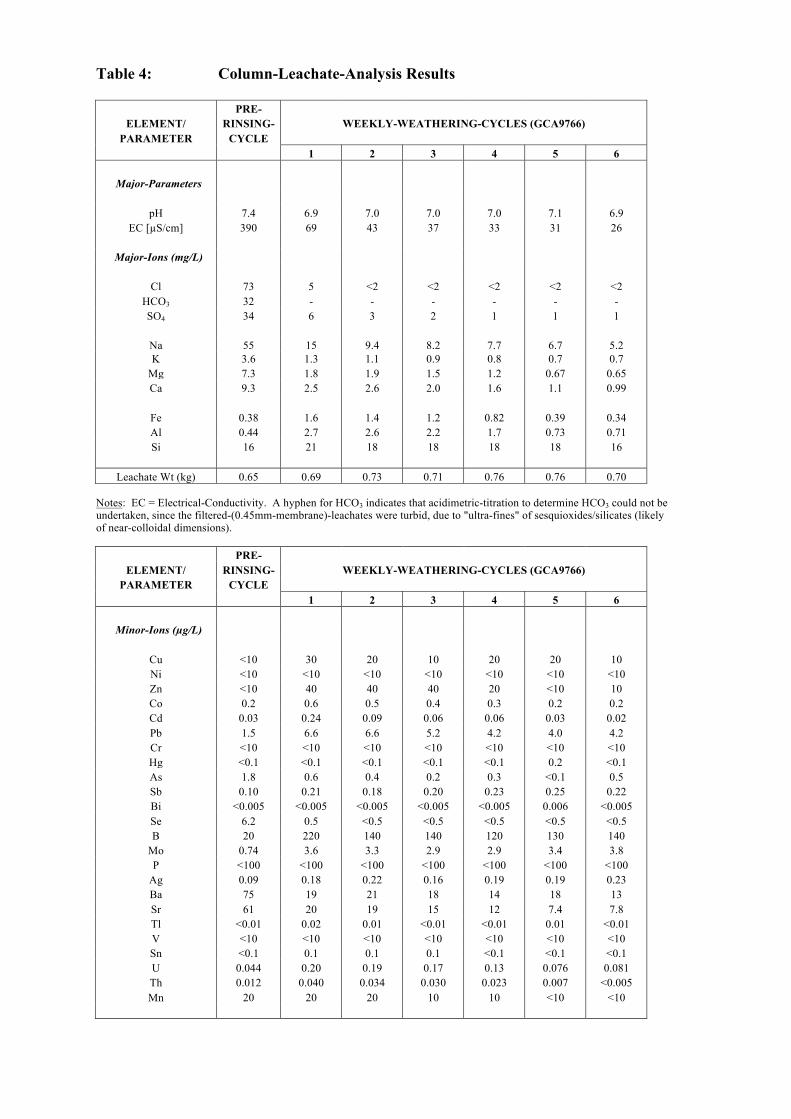
Table 4: Column-Leachate-Analysis Results PRE-
ELEMENT/ RINSING- WEEKLY-WEATHERING-CYCLES (GCA9766) PARAMETER CYCLE
1 2 3 4 5 6
Major-Parameters
pH 7.4 6.9 7.0 7.0 7.0 7.1 6.9 EC [µS/cm] 390 69 43 37 33 31 26
Major-Ions (mg/L)
Cl 73 5 <2 <2 <2 <2 <2
HCO3 32 - - - - - - SO4 34 6 3 2 1 1 1
Na 55 15 9.4 8.2 7.7 6.7 5.2 K 3.6 1.3 1.1 0.9 0.8 0.7 0.7
Mg 7.3 1.8 1.9 1.5 1.2 0.67 0.65 Ca 9.3 2.5 2.6 2.0 1.6 1.1 0.99
Fe 0.38 1.6 1.4 1.2 0.82 0.39 0.34 Al 0.44 2.7 2.6 2.2 1.7 0.73 0.71 Si 16 21 18 18 18 18 16
Leachate Wt (kg) 0.65 0.69 0.73 0.71 0.76 0.76 0.70 Notes: EC = Electrical-Conductivity. A hyphen for HCO3 indicates that acidimetric-titration to determine HCO3 could not be undertaken, since the filtered-(0.45mm-membrane)-leachates were turbid, due to "ultra-fines" of sesquioxides/silicates (likely of near-colloidal dimensions). PRE-
ELEMENT/ RINSING- WEEKLY-WEATHERING-CYCLES (GCA9766) PARAMETER CYCLE
1 2 3 4 5 6
Minor-Ions (µg/L)
Cu <10 30 20 10 20 20 10 Ni <10 <10 <10 <10 <10 <10 <10 Zn <10 40 40 40 20 <10 10 Co 0.2 0.6 0.5 0.4 0.3 0.2 0.2 Cd 0.03 0.24 0.09 0.06 0.06 0.03 0.02 Pb 1.5 6.6 6.6 5.2 4.2 4.0 4.2 Cr <10 <10 <10 <10 <10 <10 <10 Hg <0.1 <0.1 <0.1 <0.1 <0.1 0.2 <0.1 As 1.8 0.6 0.4 0.2 0.3 <0.1 0.5 Sb 0.10 0.21 0.18 0.20 0.23 0.25 0.22 Bi <0.005 <0.005 <0.005 <0.005 <0.005 0.006 <0.005 Se 6.2 0.5 <0.5 <0.5 <0.5 <0.5 <0.5 B 20 220 140 140 120 130 140
Mo 0.74 3.6 3.3 2.9 2.9 3.4 3.8 P <100 <100 <100 <100 <100 <100 <100
Ag 0.09 0.18 0.22 0.16 0.19 0.19 0.23 Ba 75 19 21 18 14 18 13 Sr 61 20 19 15 12 7.4 7.8 Tl <0.01 0.02 0.01 <0.01 <0.01 0.01 <0.01 V <10 <10 <10 <10 <10 <10 <10 Sn <0.1 0.1 0.1 0.1 <0.1 <0.1 <0.1 U 0.044 0.20 0.19 0.17 0.13 0.076 0.081 Th 0.012 0.040 0.034 0.030 0.023 0.007 <0.005 Mn 20 20 20 10 10 <10 <10
Graeme Campbell & Associates Pty Ltd
ATTACHMENT I
SAMPLE DETAILS
FLINDERS MINES LIMITED
Pilbara Iron Ore Project Tailings Sample Testwork
201012-00322
30-Aug-11
Minerals & Metals Level 7, QV1 Building 250 St Georges Terrace Perth WA 6000 Australia Tel: +61 8 9278 8111 Fax: +61 8 9278 8110 www.worleyparsons.com WorleyParsons Services Pty Ltd ABN 61 001 279 812
© Copyright 2011 WorleyParsons Services Pty Ltd
FLINDERS MINES LIMITED PILBARA IRON ORE PROJECT TAILINGS SAMPLE TESTWORK
PROJECT 201012-00322 - PILBARA IRON ORE PROJECT
REV DESCRIPTION ORIG REVIEW WORLEY- PARSONS APPROVAL
DATE CLIENT APPROVAL
DATE
A Issued for Study J Patel
M Esvelt
N/A
30-Aug-11 N/A
macintosh hd:users:graemecampbell:documents:__projects_word:pilbara-iop__flinders-mines:tailings_study:static-testing:piop_tailings_sample.doc Page ii
SYNOPSIS
This note provides a summary of the tailings sample assay used for the mineralogy analysis performed by Graeme Campbell.
This report has been prepared on behalf of and for the exclusive use of Flinders Mines Limited, and is subject to and issued in accordance with the agreement between Flinders Mines Limited and WorleyParsons Services Pty Ltd. WorleyParsons Services Pty Ltd accepts no liability or responsibility whatsoever for it in respect of any use of or reliance upon this report by any third party.
Copying this report without the permission of Flinders Mines Limited and WorleyParsons Services Pty Ltd is not permitted.
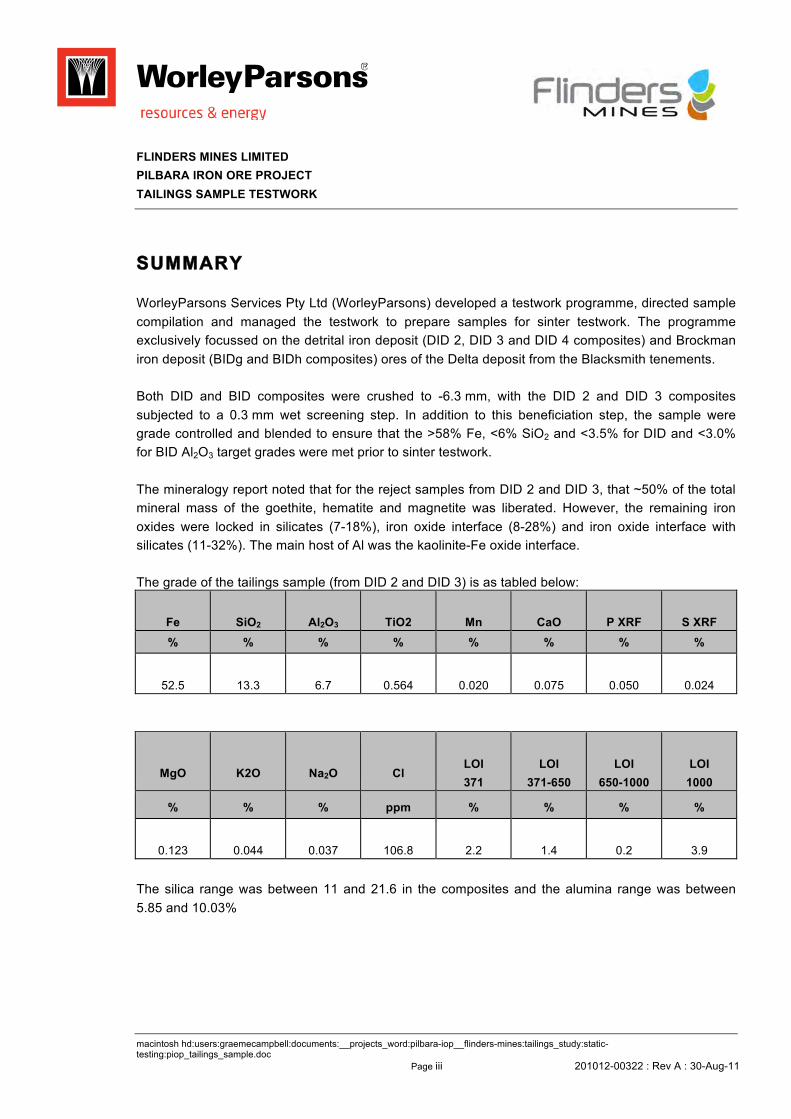
FLINDERS MINES LIMITED PILBARA IRON ORE PROJECT TAILINGS SAMPLE TESTWORK
macintosh hd:users:graemecampbell:documents:__projects_word:pilbara-iop__flinders-mines:tailings_study:static-testing:piop_tailings_sample.doc Page iii 201012-00322 : Rev A : 30-Aug-11
SUMMARY
WorleyParsons Services Pty Ltd (WorleyParsons) developed a testwork programme, directed sample compilation and managed the testwork to prepare samples for sinter testwork. The programme exclusively focussed on the detrital iron deposit (DID 2, DID 3 and DID 4 composites) and Brockman iron deposit (BIDg and BIDh composites) ores of the Delta deposit from the Blacksmith tenements.
Both DID and BID composites were crushed to -6.3 mm, with the DID 2 and DID 3 composites subjected to a 0.3 mm wet screening step. In addition to this beneficiation step, the sample were grade controlled and blended to ensure that the >58% Fe, <6% SiO2 and <3.5% for DID and <3.0% for BID Al2O3 target grades were met prior to sinter testwork.
The mineralogy report noted that for the reject samples from DID 2 and DID 3, that ~50% of the total mineral mass of the goethite, hematite and magnetite was liberated. However, the remaining iron oxides were locked in silicates (7-18%), iron oxide interface (8-28%) and iron oxide interface with silicates (11-32%). The main host of Al was the kaolinite-Fe oxide interface.
The grade of the tailings sample (from DID 2 and DID 3) is as tabled below:
Fe SiO2 Al2O3 TiO2 Mn CaO P XRF S XRF
% % % % % % % %
52.5 13.3 6.7 0.564 0.020 0.075 0.050 0.024
MgO K2O Na2O Cl LOI 371
LOI 371-650
LOI 650-1000
LOI 1000
% % % ppm % % % %
0.123 0.044 0.037 106.8 2.2 1.4 0.2 3.9
The silica range was between 11 and 21.6 in the composites and the alumina range was between 5.85 and 10.03%

Graeme Campbell & Associates Pty Ltd
ATTACHMENT II
TESTWORK METHODS
Graeme Campbell & Associates Pty Ltd
1
ATTACHMENT II
TESTWORK METHODS
The testwork methods outlined below are proven approaches to 'static-testing' and 'kinetic-testing' within the Australian, and international mining-industries (e.g. Price 2009; Stewart et al. 2006; AMIRA 2002; Morin and Hutt 1997).1 The MEND-document prepared by Price (2009), and c. 10-20 years in the making by an experienced practitioner, is an invaluable source of information on testing methods on mine-waste geochemistry. There is also the Global-Acid-Rock-Drainage-Guide (GARD Guide) which is an INAP initiative (go to: www.gardguide.com). However, in terms of comprehensiveness, structure, and clarity, the document by Price (2009) is recommended. Part of the acid-base-account (ABA) testing, and all of the multi-element analyses, and clay-surface-chemical determinations, are carried out by Genalysis Laboratory Services Pty Ltd [GLS] (Maddington). Specialised ABA-testing, and kinetic-testing, is undertaken by GCA (Bridgetown). Characterisation of rock- and clay-mineralogy is carried out by Roger Townend & Associates (Malaga). Samples are crushed to 2mm (nominal) in a jaw/rolls-crusher, and pulverised to 75µm (nominal), for specific tests, as required. These sample-splits are referred to herein as "crushings" and "pulps", respectively. It should be noted that the testwork methods described below are routinely employed in work programmes undertaken by GCA. However, the testwork methods described are generic, and specific tests may not necessarily be undertaken in a given study.
1.0 ACID-BASE-CHEMISTRY AND SALINITY TESTWORK
Acid-base chemistry and salinity are assessed by determining: • pH and Electrical-Conductivity (EC) on sample slurries;
• Total-Sulphur (Total-S), and Sulphate-Sulphur (SO4-S); • Acid-Neutralisation-Capacity (ANC), and CO3-C;
• Net-Acid-Producing-Potential (NAPP); and, • Net-Acid-Generation (NAG). Relevant details of the testwork methods employed are discussed below. Further details are presented in the laboratory reports. 1 'Static'-testing' corresponds to "whole-rock" analyses and tests.

Graeme Campbell & Associates Pty Ltd
2
1.1 pH-(1:2) and EC-(1:2) Tests Measurements of pH and EC are performed on slurries prepared using deionised-water, and a solid:water ratio of c. 1:2 (w/w). The slurries are allowed to age for c. 24 hours, prior to measuring pH and EC.2 These tests are performed on the crushings. pH-(1:2) and EC-(1:2) values provide a measure of the inherent acidity/alkalinity and salinity.3 1.2 Total-S and SO4-S Total-S is determined by Leco combustion (@ 1300 oC) with detection of evolved SO2(g) by infra-red spectroscopy. SO4-S is determined by the Na2CO3-Extraction Method (Berigari and Al-Any 1994; Lenahan and Murray-Smith 1986).4 The difference between Total-S and SO4-S indicates the Sulphide-S (strictly Non-Sulphate-S) value. The Total-S and SO4-S tests are performed on pulps. 1.3 Acid-Consuming Properties 1.3.1 ANC ANC is determined by a procedure based on that of Sobek et al. (1978) which is the "standard" ANC-testing method (AMIRA 2002; Morin and Hutt 1997). Samples (as crushings) are reacted with dilute HCl for c. 2 hours at 80-90 oC, followed by back-titration with NaOH to a pH=7 end-point to determine the amount of acid consumed.5 The simmering step for c. 2 hours differs from the Sobek et al. procedure wherein test-mixtures are heated to near boiling until reaction is deemed to be complete, followed by boiling for one minute. In terms of the dissolution of carbonate- and primary-silicate-minerals, this variation to the Sobek et al. method is inconsequential. The Sobek et al. (1978) procedure subjects samples to both strongly-acidic conditions (e.g. pH of 1-2), and a near-boiling temperature. Provided excess acid is added, the dissolution of carbonate-minerals is near-quantitative, and traces of primary-silicates 2 The slurries are stirred at the beginning of the testwork, and once again immediately prior to measuring pH and EC. 3 The pH-(1:2) values approximate the "Abrasion-pH" values for identifying minerals in the field (e.g. Stevens and Carron 1948). 4 The Na2CO3-reagent extracts SO4 which occurs as soluble sulphates, and calcium sulphates (e.g. gypsum and anhydrite). It also extracts SO4 sorbed to the surfaces of sesquioxides, clays and primary-silicates. However, SO4 present as barytes (BaSO4) is not extracted, and SO4 associated with jarositic-type and alunitic-type compounds is incompletely extracted. 5 A few drops of 30 % (w/w) H2O2 are added to the test mixtures as the pH=7 end-point is approached, so that Fe(II) forms released by the acid-attack of ferroan-carbonates (and -silicates) are oxidised to Fe(III) forms (which then hydrolyse to "Fe(OH)3"). This step ensures that the resulting ANC values are not unduly biased "on-the-high-side", due to the release of Fe(II) during the acid-digestion step (AMIRA 2002), provided that the ferroan-carbonate content is not excessive (e.g. siderite-C values less than 1.5 % [Stewart et al. 2006]).
Graeme Campbell & Associates Pty Ltd
3
also dissolve. However, at circum-neutral-pH (viz. pH 6-8) relevant to mine-waste and environmental management, the dissolution of primary-silicates is kinetically limiting (e.g. see review-monograph by White and Brantley [1995]). In the absence of inhibiting alteration-rims, dissolution rates of mafic/felsic-silicates generally equate to H2SO4-consumption rates 'of-the-order' 10-11-10-12 moles/m2/s. Accordingly, for particle-sizes within the sub-mm range, circum-neutral-dissolution rates of primary-silicates correspond to Sulphide-Oxidation Rates (SORs) 'of-the-order' 1-10 mg SO4/kg/week (= c. 0.1-1.0 kg H2SO4/tonne/year).6 In practice, circum-neutral buffering through the surface-hydrolysis/dissolution of primary-silicates is therefore restricted to both particle-gradings akin to "rock-flour" (viz. sub-mm), and slow rates of sulphide-oxidation (e.g. as exhibited by "trace-sulphides" which are not atypically reactive).7 Despite aggressive-digestion conditions, the ANC values determined by the Sobek et al. (1978) method allow an informed "screening" of acid-consuming properties, especially when due regard is given to groundmass-mineralogy (Morin and Hutt 1997). Jambor et al. (2005, 2002, 2000) list 'Sobek-ANC' values for different types of primary-silicates which assists interpretation of ANC-testwork results. That the ANC value is not an intrinsic property of a sample of geologic media, but rather the outcome of the particular ANC-testwork method employed, is shown by Morin and Hutt (2009). 1.3.2 CO3-C CO3-C is the difference between the Total-C and Total-Organic-C (TOC). Total-C is measured by Leco combustion (@ 1300 oC) with detection of evolved CO2(g) by infra-red spectroscopy. TOC is determined by Leco combustion on a sub-sample which had been treated with strong HCl to decompose carbonate-minerals. Pulps are used for these determinations. 1.3.3 pH-Buffering Properties pH-Buffering properties are determined via a Metrohm® 736 Titrino auto-titrator, and 0.05 M-H2SO4. Auto-titrations comprise regular addition of H2SO4 to decrease the pH values of the test-suspensions (prepared using pulps) to 3.0 typically over the course of
6 SORs of this magnitude (at circum-neutral-pH) would typically only be recorded for the oxidation of "trace-sulphides" (e.g. Sulphide-S contents less than c. 0.5 %) which are not hyper-reactive, and so excludes inter alia framboidal-pyrite, and marcasite. 7 Primary-particle-sizes within the "rock-flour" range is a given for process-tailings-solids. In the case of mine-wastes, despite its usually small weight-based abundance, this size-fraction is invariably the main seat of geochemical-weathering reactions within waste-dumps, and thereby the main "source-term" for solute generation (e.g. Price and Kwong 1997). Such "rock-flour" occurs in two forms: that obtained via dry-sieving, and that associated with the surfaces of clasts of wide-ranging sizes, and which can only be obtained via wet-sieving.

Graeme Campbell & Associates Pty Ltd
4
c. 1 day.8 Despite taking up to 1 day to complete, the H2SO4-addition rates employed in the auto-titrations are 'orders-of-magnitude' faster than the sulphide-oxidation rates typically observed under "ambient-weathering" conditions. 1.4 NAPP Calculations NAPP values are calculated from Total-S, SO4-S and ANC values, assuming that all of the Sulphide-S occurs in the form of pyrite, and/or pyrrhotite. NAPP values facilitate assessment of Acid-Formation Potential (AFP). The complete-oxidation of pyrite (and/or marcasite) may be described by:
FeS2 + 15/4 O2 + 7/2 H2O = 2H2SO4 + "Fe(OH)3"
The complete-oxidation of pyrrhotite may be described by:
"FeS" + 9/2O2 + 5/2H2O = H2SO4 + "Fe(OH)3"
Since pyrrhotite is non-stoichiometric, expressing it as "FeS" is approximate (Janzen et al. 2000). Elemental-S may also be produced during pyrrhotite weathering (Nicholson and Scharer 1994), especially at low-pH. However, Elemental-S is ultimately oxidised to H2SO4. It may be shown that, if the Sulphide-S (in %S) occurs as pyrite/pyrrhotite, then the amount of acid (in kg H2SO4/tonne) produced through complete-oxidation is given by 30.6 x %S. That is, the same conversion-factor of 30.6 applies for both pyrite-, and pyrrhotite-oxidation.
Note: The above treatment of oxidation-reaction stoichiometry is restricted to oxidation by 'atmospheric-O2' which is the dominant oxidant at circum-neutral-pH. A different oxidation-stoichiometry applies under acidic conditions (e.g. pH less than 3-4) where soluble-Fe(III) forms prevail, and then function as the chief oxidant (e.g. Rimstidt and Newcomb 1993).
Mechanistic aspects of pyrite- and pyrrhotite-oxidation were reviewed by Rimstidt and Vaughan (2003), and Belzile et al. (2004), respectively. 1.5 NAG Tests The NAG Test is a direct measure of the potential for acid-production through sulphide-oxidation, and also provides an indication of the reactivity of the sulphide-minerals, and the availability of alkalinity-forms (AMIRA 2002; Miller et al. 1997, 1994). Since this test is performed on pulps, sulphide-grains are fully liberated, and available for reaction. 8 In titrating to a pH=3.0 end-point, any Fe(II) released through acid attack of ferroan-carbonates and -silicates is not quantitatively oxidised to Fe(III), and subsequently hydrolysed/precipitated to "Fe(OH)3". The equivalent of c. 0.5 kg H2SO4/tonne is generally required to decrease the pH of the "solution-only" to pH=3.0. No correction is made for this "electrolyte-consumption" of H2SO4.

Graeme Campbell & Associates Pty Ltd
5
The sample is reacted with H2O2 to oxidise sulphide-minerals, and allow the produced acid to react with the acid-neutralising components (chiefly carbonate-minerals). The results from NAG testwork supplement the NAPP-based assessment of AFP (Stewart et al. 2006; Shaw 2005; Morin and Hutt 1997). The NAG-testing methodology used by GCA is the 'Static-NAG Test' in its "single-addition" mode, with NaOH-titration to a pH=7 end-point (AMIRA 2002; Miller et al. 1994, 1997). The Start-pH of the 15 % (v/v) H2O2 solution (prepared from A.R.-grade H2O2) is adjusted to pH=4.5 using 0.1 M-NaOH. The boiling treatment to decompose residual, unreacted-H2O2 following overnight reaction is carried out in two stages (viz. boiling for c. 2 hours initially, cooling and addition of 1 mL of 0.02 M-CuSO4, followed by boiling for a further c. 2 hours). The addition of Cu(II) catalyses the decomposition of unreacted-H2O2, and thereby prevents "positive-blank" values (McElnea and Ahern 2004; O'Shay et al. 1990).9 Prior to the boiling steps, the pH values of the test-suspensions are measured. Such pH values reflect buffering under ambient conditions without accelerated dissolution of groundmass-minerals through boiling. In the interpretation of NAG-testwork results, it is important to note the pH values prior to the boiling steps, especially for lithotypes characterised by "trace-sulphides" (e.g. Sulphide-S within the sub-% range), and ANC values less than c. 10-20 kg H2SO4/tonne (e.g. a groundmass devoid of carbonate-minerals). The rates of "peroxide-oxidation" are orders-of-magnitude faster than those of "ambient-oxidation" (viz. SORs recorded in kinetic-testing employing Weathering-Columns). If circum-neutral-pH is to prevail during NAG testwork, then the rate of acid-consumption must be proportionately faster than that for "ambient-oxidation", and is essentially restricted to buffering by reactive-carbonate-minerals (e.g. calcites, dolomites, and ankerites). This aspect must be borne in mind when interpreting NAG-testwork results, especially for samples that contain "trace-sulphides" in a carbonate-deficient groundmass. 2.0 MULTI-ELEMENT ANALYSES The total content of a wide range of major- and minor-elements are determined through the use of various digestion and analytical techniques. The respective detection-limits are appropriate for environmental investigations. Element enrichments are identified using the Geochemical Abundance Index (GAI).10 The GAI quantifies an assay result for a particular element in terms of the average-
9 Where samples contain sufficient Cu(II), then Cu(II) forms will be released to solution during reaction with H2O2, especially at low-pH. 10 The GAI was developed by Förstner et al (1993), and is defined as: GAI = log2 [Cn/(1.5 x Bn)] where: Cn = measured content of n-th element in the sample. Bn = "background" content of the n-th element in the sample.

Graeme Campbell & Associates Pty Ltd
6
crustal-abundance of that element.11 The latter corresponds to the typical composition of soils, regoliths and bedrocks derived from unmineralised terrain. The GAI (based on a log-2 scale) is expressed in 7 integer increments (viz. 0 to 6). A GAI of 0 indicates that the content of the element is less than, or similar to, the average-crustal-abundance; a GAI of 3 corresponds to a 12-fold enrichment above the average-crustal-abundance; and so forth, up to a GAI of 6 which corresponds to a 96-fold, or greater, enrichment above average-crustal-abundances. 3.0 MINERALOGY AND CLAY-SURFACE CHEMISTRY The semi-quantitative mineralogy, and clay-surface chemistry (generally restricted to waste-regoliths, oxide-ores, and/or soils), are determined using methods routinely used in geology, and soil science. Indicative abundances of mineral fall into one of the following broad classes, viz. • dominant greater than 50 % • major 20-50 % • minor 10-20 % • accessory 2-10 % • trace less than 2 % Randomly- and preferentially-oriented specimens are prepared, and variously treated with sodium-hexametaphosphate (dispersant), ethylene-glycol, and heating, to quantify non-expansive, and expansive (e.g. smectites), varieties of clay-minerals. The Effective-Cation-Exchange Capacity (eCEC), and suite of Exchangeable-Cations, are determined by different methods for samples (as crushings) of non-calcareous and calcareous materials (Rengasamy and Churchman 1999). In both cases, soluble-salts are initially removed via pre-washing using a "mixed-organic-solvent" (viz. ethylene-glycol and ethanol). Method 15A2 in Rayment and Higginson (1992) is then employed for non-calcareous samples to determine eCEC, and Exchangeable-Sodium Percentage (ESP). In the case of calcareous samples, a method based on that described by Pierce and Morris (2004) is used, and prevents the dissolution of carbonate-minerals (e.g. calcites and dolomites).12 After the initial pre-washing step above, extraction is carried out with 1 M-NH4Cl buffered at pH=8.5 in an ethanolic-aqueous solution. Without such precautions to suppress dissolution of carbonate-minerals, the eCEC is biased "on-the-high-side", and ESP biased "on-the-low-side". Depending on the abundance and nature of the carbonate-minerals, the magnitude of this bias can be marked.
11 The average-crustal-abundances of the elements for the GAI calculations are based on the values listed in Bowen (1979). 12 The procedure described by Pierce and Morris (2004) is closely related to that originally developed by Tucker (1974).

Graeme Campbell & Associates Pty Ltd
7
4.0 SOLUBILITY OF MAJOR/MINOR-ELEMENTS
4.1 Water-Extraction Testwork
Water-Extraction Testwork on the crushings is performed via the bottle-roll technique, and using deionised-water. The test-slurries have a solid:solution ratio of c. 1:2 (w/w), and are bottle-rolled for c. 1 day before being left to "still-stand" for c. 1 day to allow suspended mineral-fines to settle. The resulting supernatants are decanted, vacuum-filtered (0.45µm-membrane), and preserved, as appropriate, for specific analyses. Where required, centrifuging at c. 4,000 G for 30 minutes is undertaken to expedite solid-solution separation for vacuum-filtration. The Water-Extraction Testwork is performed in the GCA-Testing Laboratory. 4.2 Na2EDTA-Extraction Testwork Na2EDTA-Extraction Testwork (at pH=6) is carried out on the crushings, based on the method described by Clayton and Tiller (1979). The test-slurries have a solid:solution ratio of c. 1:2 (w/w), and are bottle-rolled for c. 7 days. This testwork provides a measure of the "metal-pool" potentially available for uptake by biota (e.g. absorption by plant roots). 5.0 REFERENCES AMIRA International Ltd, 2002, "ARD Test Handbook", Prepared by Ian Wark Research Institute, and
Environmental Geochemistry International Pty Ltd Belzile N, Chen Y-W, Cai M-F and Li Y, 2004, "A Review on Pyrrhotite Oxidation", Journal of
Geochemical Exploration, 84:65-76 Berigari MS and Al-Any FMS, 1994, "Gypsum Determination in Soils by Conversion to Water-Soluble
Sodium Sulfate", Soil Science Society of America Journal, 58:1624-1627 Bowen HJM, 1979, "Environmental Chemistry of the Elements", Academic Press, New York Clayton PM and Tiller KG, 1979, "A Chemical Method for the Determination of the Heavy Metal
Content of Soils In Environmental Studies", Division of Soils, Technical Paper No. 41, CSIRO Förstner U, Ahlf W and Calmano W, 1993, "Sediment Quality Objectives and Criteria Development in
Germany", Water Science & Technology, 28:307-316 Jambor JL, Dutrizac JE and Chen TT, 2000, "Contribution of Specific Minerals to the Neutralization
Potential in Static Tests", pp. 551-565 in "Proceedings from the Fifth International Conference on Acid Rock Drainage", Volume I, Denver
Jambor JL, Dutrizac JE, Groat LA and Raudsepp M, 2002, "Static Tests of Neutralization Potentials of Silicate and Aluminosilicate Minerals", Environmental Geology, 43:1-17
Jambor JL, Dutrizac JE and Raudsepp M, 2005, "Neutralization Potentials of Some Common and Uncommon Rocks, and Some Pitfalls in NP Measurements", in "Challenges in the Prediction of Drainage Chemistry", Proceedings of the 12th Annual British Columbia – MEND ML/ARD Workshop
Janzen MP, Nicholson RV and Scharer JM, 2000, "Pyrrhotite Reaction Kinetics: Reaction Rates for Oxidation by Oxygen, Ferric Iron, and for Nonoxidative Dissolution", Geochimica et Cosmochimica Acta, 64:1511-1522
Jerz JK and Rimstidt JD, 2004, "Pyrite Oxidation in Moist Air", Geochimica et Cosmochimica Acta, 68:701-714
Lenahan WC and Murray-Smith R de L, 1986, "Assay and Analytical Practice in the South African Mining Industry", The South African Institute of Mining and Metallurgy Monograph Series M6, Johannesburg
McElnea AE and Ahern CR, 2004, "Peroxide pH (pHox), Titratable Peroxide Acidity (TPA) and Excess Acid Neutralising Capacity (ANCE) – Method Codes 23B, 23G and 23Q", Chapter 3 in "Acid
Graeme Campbell & Associates Pty Ltd
8
Sulfate Soils Laboratory Methods Guidelines", Eds Ahern CR, McElnea AE and Sullivan LA, Department of Natural Resources, Mines and Energy, Indooroopilly, Queensland
Miller SD, Jeffery JJ and Donohue TA, 1994, "Developments in Predicting and Management of Acid Forming Mine Wastes in Australia and Southeast Asia", pp. 177-184 in "Proceedings of the International Land Reclamation and Mine Drainage Conference and Third International Conference on the Abatement of Acidic Drainage", Pittsburgh
Miller S, Robertson A and Donohue T, 1997, "Advances in Acid Drainage Prediction Using the Net Acid Generation (NAG) Test", pp. 535-547 in "Proceedings of the Fourth International Conference on Acid Rock Drainage", Vancouver
Morin KA and Hutt NM, 1997, "Environmental Geochemistry of Minesite Drainage: Practical Theory and Case Studies", MDAG Publishing, Vancouver
Morin KA and Hutt NM, 2009, "On the Nonesense of Arguing the Superiority of an Analytical Method for Neutralization Potential", Mine Drainage Assessment Group (MDAG), Internet Case Study #32 (go to: www.mdag.com)
Nicholson RV and Scharer JM, 1994, "Laboratory Studies of Pyrrhotite Oxidation Kinetics", pp. 14-30 in Alpers CN and Blowes DW (eds), "Environmental Geochemistry of Sulfide Oxidation", ACS Symposium Series 550, American Chemical Society, Washington D.C.
O'Shay T, Hossner LR and Dixon JB, 1990, "A Modified Hydrogen Peroxide Method for Determination of Potential Acidity in Pyritic Overburden", Journal of Environmental Quality, 19:778-782
Pierce CG and Morris S, 2004, "Comparison of Extraction Techniques for Measuring Exchangeable Cations in Calcareous Soils", Australian Journal of Soil Research, 42:301-311 Price W, 2009, "Prediction Manual for Drainage Chemistry from Sulphidic Geologic Materials", MEND Report 1.20.1 Price W and Kwong YTJ, 1997, "Waste Rock Weathering, Sampling and Analysis: Observations from
the British Columbia Ministry of Employment and Investment Database", pp. 31-45 in "Proceedings of the Fourth International Conference on Acid Rock Drainage", Vancouver
Rayment GE and Higginson FR, 1992, "Australian Laboratory Handbook of Soil and Water Chemical Methods", Inkata Press, Melbourne Rengasamy P and Churchman GJ, 1999, "Cation Exchange Capacity, Exchangeable Cations and Sodicity", Chapter 9, pp. 147-170 in Peverill KI, Sparrow LA, and Reuter DJ (eds), "Soil Analysis: An Interpretation Manual", CSIRO Publishing, Collingwood Rimstidt JD and Vaughan DJ, 2003, "Pyrite Oxidation: A State-of-the-Art Assessment of Reaction Mechanism", Geochimica et Cosmochimica Acta, 67:873-880 Shaw S, 2005, "Case Studies and Subsequent Guidelines for the Use of the Static NAG Procedure", Presentation A.4 in "Proceedings of the 12th Annual British Columbia – MEND ML/ARD Workshop on "Challenges in the Prediction of Drainage Chemistry", November 30 to December 1, 2005, Vancouver, British Columbia Sobek AA, Schuller WA, Freeman JR and Smith RM, 1978, "Field and Laboratory Methods Applicable
to Overburdens and Minesoils", EPA-600/2-78-054 Stevens RE and Carron MK, 1948, "Simple Field Test for Distinguishing Minerals by Abrasion pH",
American Mineralogist, 33:31-49 Stewart WA, Miller SD and Smart R, 2006, "Advances in Acid Rock Drainage (ARD) Characterisation
of Mine Wastes", pp. 2098-2117 in "Proceedings from the Seventh International Conference on Acid Rock Drainage", St. Louis, Missouri
Tucker BM, 1974, "Laboratory Procedures for Cation Exchange Measurements on Soils", Division of Soils Technical Paper No. 23, CSIRO, Melbourne
White AF and Brantley SL (eds.), 1995, "Chemical Weathering Rates of Silicate Minerals", Reviews in Mineralogy, Volume 31, Mineralogical Society of America, Washington, D.C.
Graeme Campbell & Associates Pty Ltd
1
KINETIC-TESTING METHODOLOGY EMPLOYED IN THE GCA-TESTING LABORATORY
1.0 GENERAL The kinetic-testing methodology employed in the GCA-Testing Laboratory is based on "standard" procedures developed by practitioners, academics, and regulators both within Australia, and the northern-hemisphere (chiefly Canada and USA). Such "standard" procedures vary in detail, but essentially entail inundating a rigid, porous sample-bed in a column (or "cell") to elute solutes produced from weathering, followed by dewatering to promote weathering (e.g. sulphide-oxidation) prior to the next flushing-step. The drying-phase often produces a final moisture status that is at, or close to, residual-moistures/suctions. The GCA-kinetic-testing methodology also reflects research by Dr. Graeme Campbell since the early-1990s, as governed by the diverse demands of projects in terms of both lithotype traits (viz. geochemistry, mineralogy, and physicals), and biophysical setting of the project-site (especially climate). Where geochemically logical, modifications to the basic procedure (performed for routine kinetic-testing) are made to meet study objectives, and assist management-decision making (c.f. "blind-adherence" to some "standard" protocol which may provide information on reaction dynamics and solubility behaviour that is inconclusive, at best, or worse still, misleading). 2.0 WEATHERING-COLUMNS • The (short) weathering-columns allow assessment of reaction dynamics under
aeration and moisture regimes which are near-optimal for sulphide-oxidation.
The sample-bed-lengths in the columns are typically within the range 5-7 cm. • The weathering-columns, and the geometry of the gantry housing the columns
and flood-lamps (see Plate 1a), are based on those described in AMIRA (2002).1
The main departures from AMIRA (2002) are:
• the power, and operation, of the flood-lamps in order to constrain the maximum/minimum-temperatures of the sample-beds during the drying-phase; and,
• the use of weekly-weathering-cycles (i.e. weekly-flushing), and a greater
rate of deionised-water addition during flushing.
1 Six (6) flood-lamps are employed per ten (10) weathering-columns to ensure that the "end-column-pairs" receive the same daily heat-loads as the other "internal-column-pairs" (c.f. the use of 4 flood-lamps per 10 columns, as per AMIRA [2002], where the "end-column-pairs" receive reduced daily heat-loads).
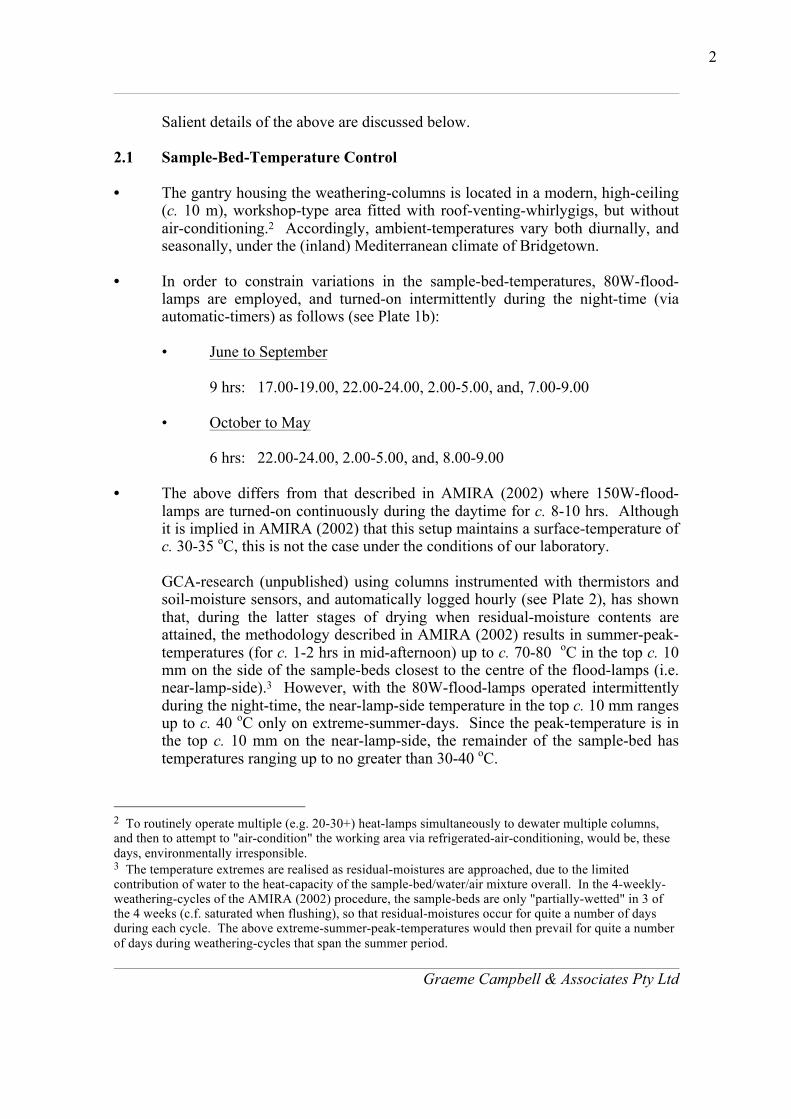
Graeme Campbell & Associates Pty Ltd
2
Salient details of the above are discussed below. 2.1 Sample-Bed-Temperature Control • The gantry housing the weathering-columns is located in a modern, high-ceiling
(c. 10 m), workshop-type area fitted with roof-venting-whirlygigs, but without air-conditioning.2 Accordingly, ambient-temperatures vary both diurnally, and seasonally, under the (inland) Mediterranean climate of Bridgetown.
• In order to constrain variations in the sample-bed-temperatures, 80W-flood-
lamps are employed, and turned-on intermittently during the night-time (via automatic-timers) as follows (see Plate 1b):
• June to September 9 hrs: 17.00-19.00, 22.00-24.00, 2.00-5.00, and, 7.00-9.00 • October to May 6 hrs: 22.00-24.00, 2.00-5.00, and, 8.00-9.00
• The above differs from that described in AMIRA (2002) where 150W-flood-lamps are turned-on continuously during the daytime for c. 8-10 hrs. Although it is implied in AMIRA (2002) that this setup maintains a surface-temperature of c. 30-35 oC, this is not the case under the conditions of our laboratory.
GCA-research (unpublished) using columns instrumented with thermistors and
soil-moisture sensors, and automatically logged hourly (see Plate 2), has shown that, during the latter stages of drying when residual-moisture contents are attained, the methodology described in AMIRA (2002) results in summer-peak-temperatures (for c. 1-2 hrs in mid-afternoon) up to c. 70-80 oC in the top c. 10 mm on the side of the sample-beds closest to the centre of the flood-lamps (i.e. near-lamp-side).3 However, with the 80W-flood-lamps operated intermittently during the night-time, the near-lamp-side temperature in the top c. 10 mm ranges up to c. 40 oC only on extreme-summer-days. Since the peak-temperature is in the top c. 10 mm on the near-lamp-side, the remainder of the sample-bed has temperatures ranging up to no greater than 30-40 oC.
2 To routinely operate multiple (e.g. 20-30+) heat-lamps simultaneously to dewater multiple columns, and then to attempt to "air-condition" the working area via refrigerated-air-conditioning, would be, these days, environmentally irresponsible. 3 The temperature extremes are realised as residual-moistures are approached, due to the limited contribution of water to the heat-capacity of the sample-bed/water/air mixture overall. In the 4-weekly-weathering-cycles of the AMIRA (2002) procedure, the sample-beds are only "partially-wetted" in 3 of the 4 weeks (c.f. saturated when flushing), so that residual-moistures occur for quite a number of days during each cycle. The above extreme-summer-peak-temperatures would then prevail for quite a number of days during weathering-cycles that span the summer period.
Graeme Campbell & Associates Pty Ltd
3
Likewise, during winter, the operation of the 80W-flood-lamps during the night-time ensures that the basal-section of the sample-beds on the far-lamp-side have winter-peak-temperatures typically above 10-15 oC during the coldest nights with ambient-temperature-minima near 5 oC.4 During the winter-months, the flood-lamps are operated 9 hrs per day (c.f. 6 hrs per day for the rest of year) to ensure that sulphide-oxidation is not limited by restricted evaporative-drying (i.e. relative-saturation of pore-spaces remaining above 80-85 % for too long).5
• Summarising, operation of weathering-columns in the GCA-Testing Laboratory,
as described, has been proved to constrain maximum-sample-bed-temperatures to within 30-40 oC during the latter stages of the drying-phase when residual-moisture are attained, even on extreme-summer days.
In terms of assessing the temperature dependence of sulphide-oxidation rates (SORs), the winter- and summer-peak-SORs broadly correspond to mean-sample-bed-temperatures of 20 oC, and 30 oC, respectively. Therefore, where SORs have more-or-less stabilised during kinetic-testing (as often observed during circum-neutral-weathering), the difference between the peak-seasonal-SORs, together with the mean-peak-seasonal-temperature difference of 10 oC, allows estimation of the activation-energy (Ea) for sulphide-oxidation specific to the tested-lithotype.6 Such lithotype-specific estimates of Ea then serve as useful input to geochemical modelling of sulphide-oxidation rates at field-scale (and so supplement literature-derived Ea values obtained for "pristine" (i.e. sulphide-grain-surfaces purposely "pre-cleaned"), monomineralic specimens of specific sulphide-minerals [e.g. pyrite]).
2.2 Weekly-Weathering-Cycles • The columns are weighed each day to track the rate, and extent, of dewatering.7
Where the attainment of residual-moisture contents is not desired (e.g. for mine-sites in well-watered settings), an addition of 0.10-0.20 kg of deionised-water is added to "wet" (but not "flush") the sample-beds part way through the drying-phase of each weathering-cycle. The amount and timing of such "remoistening" is sample- and project-specific.
4 In terms of the peak-temperatures attained with the AMIRA (2002) procedure during the winter-months, the instrumented-columns showed that the top c. 10 mm on the near-lamp-side of the sample-beds reached c. 45-50 oC as residual-moistures were approached. 5 Pan-evaporation (Epan) rates are routinely determined, and range from 3-5 mm/day over the winter-peak, to 6-8 mm/day over the summer-peak. 6 In practice, it generally means that the kinetic-testing programme would need to run for at least 1-2 years in order to capture the seasonal-extremes of "stable-SORs" for Ea estimation. 7 Due to the "sub-decimetre" thickness of the sample-beds, and the seepage-face-lower-boundary condition, the actual-evaporation rates (Eactual) are typically close to the corresponding Epan rates until residual-moisture/suctions are approached.
Graeme Campbell & Associates Pty Ltd
4
• The flood-lamps are operated intermittently commencing on Monday, Tuesday, Wednesday, and Thursday evenings/nights (i.e. flood-lamps operated over four nights during each weathering-cycle). The flushing-step is undertaken late-morning on Fridays, and corresponds to a "flooding-with-ponding" mode of deionised-water addition. Where required, the top 5-10 mm of the sample-bed-surface is worked-over with a spatula to fill-in/seal-over, any desiccation-cracks developed during the drying-phase, and thereby prevent inefficient leaching from "breakthrough", and "by-pass", during the flushing-step.
• The AMIRA (2002) procedure involves the wetting of the sample-beds at the
end of Week-1, Week-2, and Week-3, and then flushing at the end of Week-4 to produce leachates for analysis (i.e. 4-weekly-flushing regime with weekly-wetting between). The rate of deionised-water addition (viz. 0.10 kg deionised-water per kg solids) in the wetting-step is typically shy of "field-capacity" (enhanced by the seepage-face-lower-boundary condition), so there is generally no drainage.
Weekly-weathering-cycles (i.e. flushing with leachate collection on a weekly basis) are employed in the GCA procedure.
• Typically, there is 1.50 kg (dry-solids-equivalent) of sample in each weathering-column.8 1.00 kg of deionised-water is generally added to each column during the flushing-step, corresponding to 0.66 kg of deionised-water per kg of solids (i.e. 1.00 kg of deionised-water used to flush 1.50 kg of solids). This rate of water addition exceeds the 0.40 kg per kg solids advocated in AMIRA (2002) which occurs every 4-weeks (c.f. 2.7 kg of deionised-water per kg solids over 4-weeks herein). Where the Leachate-EC value indicate that flushing of solutes from the columns is limited, then a second 1.00-kg-lot of deionised-water is added, and a "communal-leachate" then generated.9 The weekly-flushing regime, and rate of deionised-water addition, employed by GCA is similar to that typically employed in "humidity-cell" testing in Canada, and the USA (Price 2009; Morin and Hutt 1997; ASTM 2007). In broad terms, the addition of 1.00 kg of deionised-water to each column corresponds to a storm-depth of c. 45 mm. This provides a useful, approximate basis for cross-correlating lab-weathering and field-weathering dynamics under the episodic, pulsed rainfall-regime of the Australian interior.
• The residence-time of water during the flushing-step is generally ranges up to c.
12 hrs, as governed by sample texture.
8 With 1.50 kg of solids in each column there is sufficient free-board, and so expedites flushing with deionised-water. 9 EC = Electrical-Conductivity.

Graeme Campbell & Associates Pty Ltd
5
• The leachates are collected in beakers beneath the columns, and left to "age" under ambient conditions until the Monday when the next weathering-cycle commences.
All leachates are weighed (for mass-balance calculations), prior to Leachate-pH and Leachate-EC values being determined, followed by vacuum-filtering (0.45-µm-membrane), and preservation, as appropriate, for the determination of specific analytes.
• Prior to commencing the weathering-cycles, the GCA-columns are subjected to
a thorough pre-rinsing treatment using deionised-water to elute pre-existing solutes. Pre-rinsing is continued using 1.00-kg lots of deionised-water until the EC value of the "last-incremental-leachate" (e.g. last 100 mL) is less than c. 300-500 µS/cm. This pre-rinsing step facilitates interpretation of the kinetic-testing results overall.
3.0 REFERENCES AMIRA International Ltd, 2002, "ARD Test Handbook", Prepared by Ian Wark Research Institute, and
Environmental Geochemistry International Pty Ltd ASTM, 2007, "Standard Test Method for Laboratory Weathering of Solid Materials Using a Humidity
Cell", ASTM D 5744-07. Morin KA and Hutt NM, 1997, "Environmental Geochemistry of Minesite Drainage: Practical Theory
and Case Studies", MDAG Publishing, Vancouver Price W, 2009, "Prediction Manual for Drainage Chemistry from Sulphidic Geologic Materials", MEND Report 1.20.1

Plate 1a: Typical Weathering-Column Assembly
Layout and configuration-geometry as per AMIRA (2002). Plate 1b: Seasonal and Diurnal Schedule for Operation of 80W-Flood-Lamps.
Required variation to AMIRA (2002) in order to constrain maximum-temperatures of sample-beds to within 30-40 oC.

Plate 2: GCA-Research Project: Instrumented-Weathering-Column with -4.75mm Fraction of
Trace-Sulphide/Calcareous-Basalt-waste-bedrock Sample.
Circum-neutral Weathering. Volumetric-Water Content (VWC) of upper-half and lower-half of sample-beds logged hourly using calibrated MP406-sensors. Temperature of top c. 10 mm, and bottom c. 10 mm, on both the near-lamp-side, and far-lamp-side (as seen in front of columns in photograph), logged hourly using thermistors. Daily-pan-evaporation rates determined via daily weighing of perspex-container to the left of columns.

Graeme Campbell & Associates Pty Ltd
ATTACHMENT III
ACID-FORMATION POTENTIAL (AFP):
CALCULATED PARAMETERS AND CLASSIFICATION CRITERIA
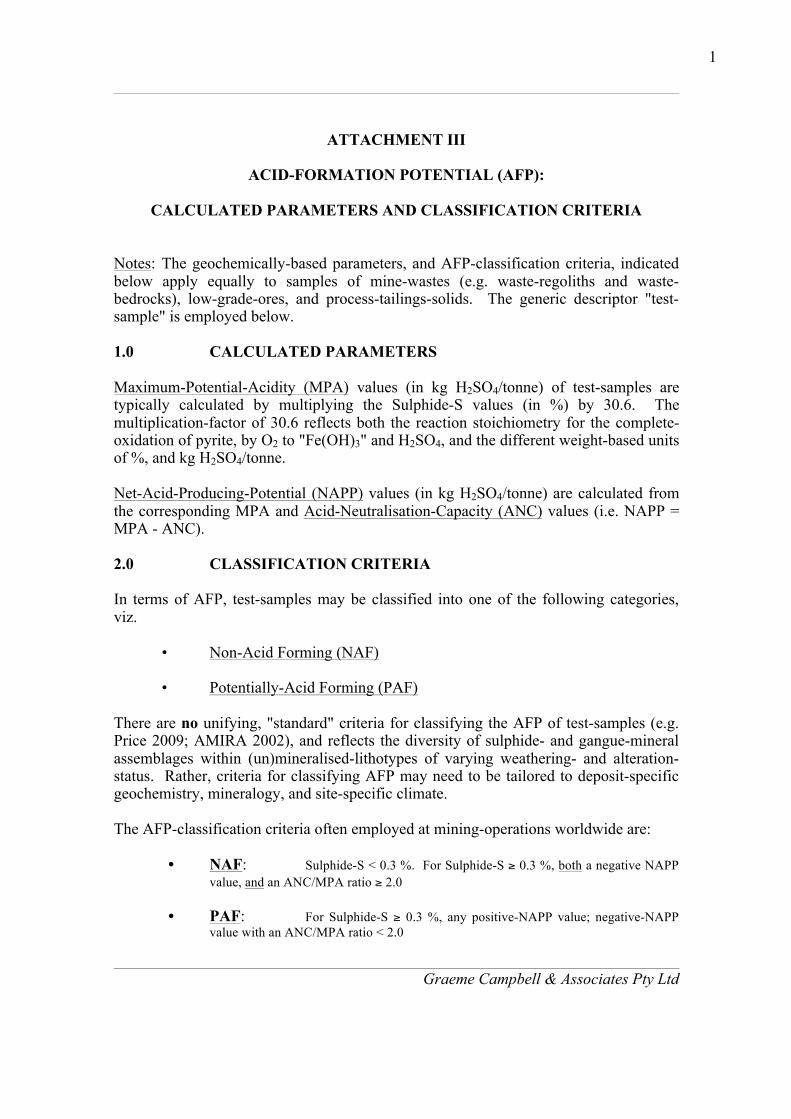
Graeme Campbell & Associates Pty Ltd
1
ATTACHMENT III
ACID-FORMATION POTENTIAL (AFP):
CALCULATED PARAMETERS AND CLASSIFICATION CRITERIA
Notes: The geochemically-based parameters, and AFP-classification criteria, indicated below apply equally to samples of mine-wastes (e.g. waste-regoliths and waste-bedrocks), low-grade-ores, and process-tailings-solids. The generic descriptor "test-sample" is employed below.
1.0 CALCULATED PARAMETERS Maximum-Potential-Acidity (MPA) values (in kg H2SO4/tonne) of test-samples are typically calculated by multiplying the Sulphide-S values (in %) by 30.6. The multiplication-factor of 30.6 reflects both the reaction stoichiometry for the complete-oxidation of pyrite, by O2 to "Fe(OH)3" and H2SO4, and the different weight-based units of %, and kg H2SO4/tonne. Net-Acid-Producing-Potential (NAPP) values (in kg H2SO4/tonne) are calculated from the corresponding MPA and Acid-Neutralisation-Capacity (ANC) values (i.e. NAPP = MPA - ANC). 2.0 CLASSIFICATION CRITERIA In terms of AFP, test-samples may be classified into one of the following categories, viz. • Non-Acid Forming (NAF) • Potentially-Acid Forming (PAF) There are no unifying, "standard" criteria for classifying the AFP of test-samples (e.g. Price 2009; AMIRA 2002), and reflects the diversity of sulphide- and gangue-mineral assemblages within (un)mineralised-lithotypes of varying weathering- and alteration-status. Rather, criteria for classifying AFP may need to be tailored to deposit-specific geochemistry, mineralogy, and site-specific climate. The AFP-classification criteria often employed at mining-operations worldwide are:
• NAF: Sulphide-S < 0.3 %. For Sulphide-S ≥ 0.3 %, both a negative NAPP value, and an ANC/MPA ratio ≥ 2.0
• PAF: For Sulphide-S ≥ 0.3 %, any positive-NAPP value; negative-NAPP value with an ANC/MPA ratio < 2.0

Graeme Campbell & Associates Pty Ltd
2
In assessing AFP, lithotypes from hard-rock mines with Sulphide-S values less than 0.3 % are unlikely to acidify (e.g. pH less than 4-5) through sulphide-oxidation. This position holds especially where the groundmass hosting the "trace-sulphides" is not simply quartz, soil-clays, and/or sesquioxides (Price et al. 1997), and where the sulphide-minerals are not hyper-reactive varieties (e.g. framboidal-pyrite). A "cut-off" of 0.3 % for Sulphide-S also accords with the findings of kinetic-testing, since the late-1980s, by Dr. Graeme Campbell for test-samples of diverse mineralogy in terms of sulphide-weathering dynamics, and solubility behaviour. The risk posed by PAF-lithotypes during the active-mine-life is governed primarily by the duration of the lag-phase (i.e. the period during which sulphide-oxidation occurs, but acidification does not develop, due to circum-neutral buffering by gangue-phases [chiefly reactive-carbonate-minerals]).1 Although the duration of the lag-phase for mine-wastes at field-scale cannot be accurately predicted a priori, estimates may still be needed to identify threshold exposure-times for the safe handling of PAF-lithotypes. Lag-phase duration may be estimated via kinetic-testing (viz. Weathering-Columns), and consideration of the moisture/aeration/thermal-regimes of exposed (i.e. uncovered) mine-wastes under the site's climatic conditions. In the absence of results from kinetic-testing, experience permits "first-pass" estimates of sulphide-oxidation rates and lag-phase duration to be made from the results of static-testing, and thereby classify PAF-lithotypes into PAF-[Short-Lag] and PAF-[Long-Lag] sub-categories. Such "first-pass" estimations are necessarily provisional, and subject to revision, in the light of the outcomes of kinetic-testing, and field observations. 3.0 REFERENCES AMIRA International Ltd, 2002, "ARD Test Handbook", Prepared by Ian Wark Research Institute, and
Environmental Geochemistry International Pty Ltd Price W, 2009, "Prediction Manual for Drainage Chemistry from Sulphidic Geologic Materials", MEND Report 1.20.1 Price WA, Morin K and Hutt N, 1997, "Guidelines for the Prediction of Acid Rock Drainage and Metal
Leaching for Mines in British Columbia: Part II. Recommended Procedures for Static and Kinetic Testing", pp. 15-30 in "Proceedings of the Fourth International Conference on Acid Rock Drainage", Volume I, Vancouver
1 SO4 is still produced by sulphide-oxidation during the lag-phase, and appreciable amounts of soluble-forms of certain minor-elements (e.g. Ni and As) may be released at circum-neutral-pH during lag-phase weathering. However, in the latter case, the mine-wastes would need to be sufficiently enriched in Total-Ni and Total-As to begin with.

Graeme Campbell & Associates Pty Ltd
ATTACHMENT IV
LABORATORY REPORTS
Correspondence to Box 3129, Malaga D.C. WA 6945 ACN 069 920 476 ABN 92 076 109 663
GRAEME CAMPBELL AND ASSOC. 2-‐11-‐2011 PO BOX 247, BRIDGETOWN WA OUR REFERENCE 22987 YOUR REFERENCE: 1112/2 (FLINDERS PIOP) XRD/PLM ANALYSIS OF ONE ROCK PULP. D TOWNEND
Roger Townend and Associates Consulting Mineralogists
Unit 4, 40 Irvine drive, Malaga Western Australia 6062 Phone: (08) 9248 1674 Fax: (08) 9248 1502 email: [email protected]
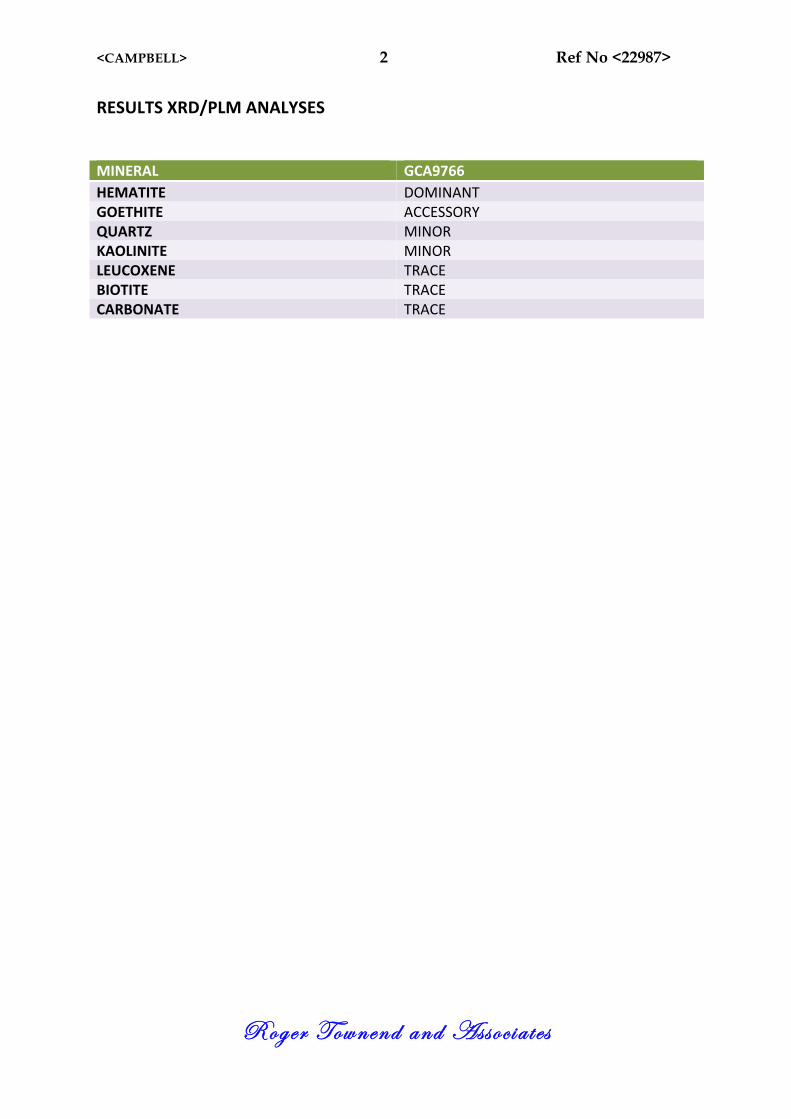
<CAMPBELL> 2 Ref No <22987>
Roger Townend and Asso c i a t e s
RESULTS XRD/PLM ANALYSES MINERAL GCA9766 HEMATITE DOMINANT GOETHITE ACCESSORY QUARTZ MINOR KAOLINITE MINOR LEUCOXENE TRACE BIOTITE TRACE CARBONATE TRACE
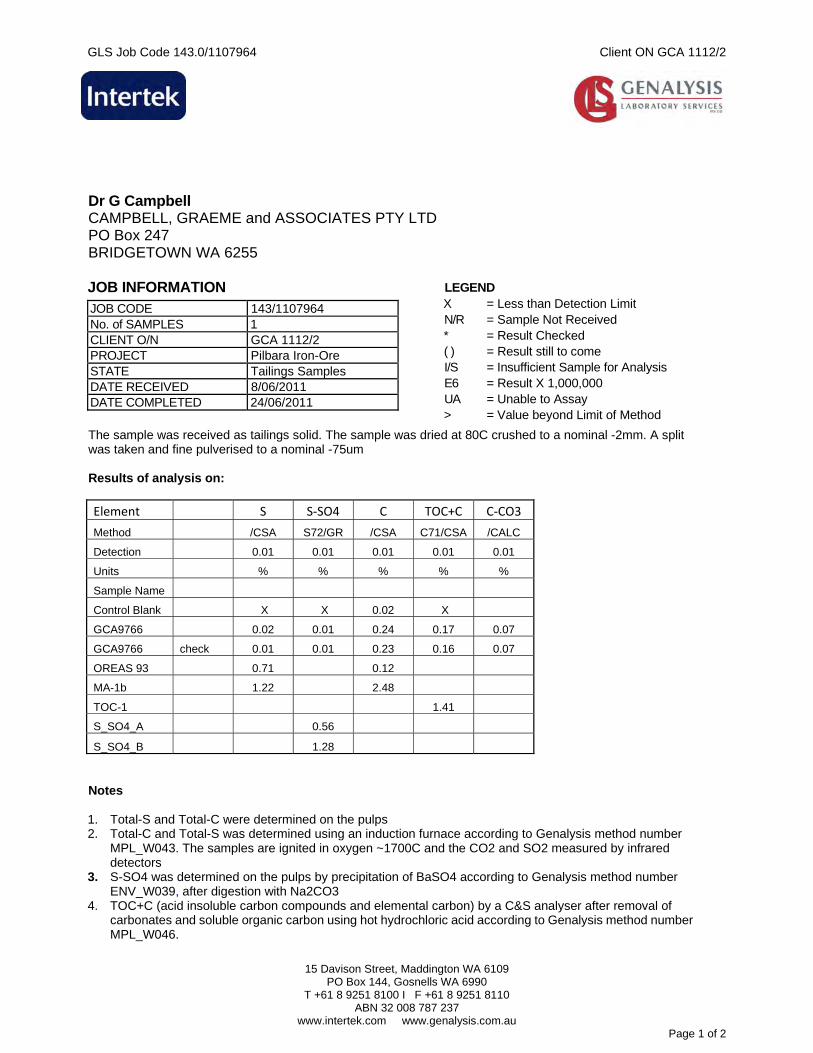
GLS Job Code 143.0/1107964 Client ON GCA 1112/2
15 Davison Street, Maddington WA 6109
PO Box 144, Gosnells WA 6990 T +61 8 9251 8100 I F +61 8 9251 8110
ABN 32 008 787 237 www.intertek.com www.genalysis.com.au
Page 1 of 2
Dr G Campbell CAMPBELL, GRAEME and ASSOCIATES PTY LTD PO Box 247 BRIDGETOWN WA 6255 JOB INFORMATION
JOB CODE 143/1107964 No. of SAMPLES 1 CLIENT O/N GCA 1112/2 PROJECT Pilbara Iron-Ore STATE Tailings Samples DATE RECEIVED 8/06/2011 DATE COMPLETED 24/06/2011
LEGEND X = Less than Detection Limit N/R = Sample Not Received * = Result Checked ( ) = Result still to come I/S = Insufficient Sample for Analysis E6 = Result X 1,000,000 UA = Unable to Assay > = Value beyond Limit of Method
The sample was received as tailings solid. The sample was dried at 80C crushed to a nominal -2mm. A split was taken and fine pulverised to a nominal -75um Results of analysis on:
Element S S‐SO4 C TOC+C C‐CO3
Method /CSA S72/GR /CSA C71/CSA /CALC
Detection 0.01 0.01 0.01 0.01 0.01
Units % % % % %
Sample Name
Control Blank X X 0.02 X
GCA9766 0.02 0.01 0.24 0.17 0.07
GCA9766 check 0.01 0.01 0.23 0.16 0.07
OREAS 93 0.71 0.12
MA-1b 1.22 2.48
TOC-1 1.41
S_SO4_A 0.56
S_SO4_B 1.28 Notes 1. Total-S and Total-C were determined on the pulps 2. Total-C and Total-S was determined using an induction furnace according to Genalysis method number
MPL_W043. The samples are ignited in oxygen ~1700C and the CO2 and SO2 measured by infrared detectors
3. S-SO4 was determined on the pulps by precipitation of BaSO4 according to Genalysis method number ENV_W039, after digestion with Na2CO3
4. TOC+C (acid insoluble carbon compounds and elemental carbon) by a C&S analyser after removal of carbonates and soluble organic carbon using hot hydrochloric acid according to Genalysis method number MPL_W046.
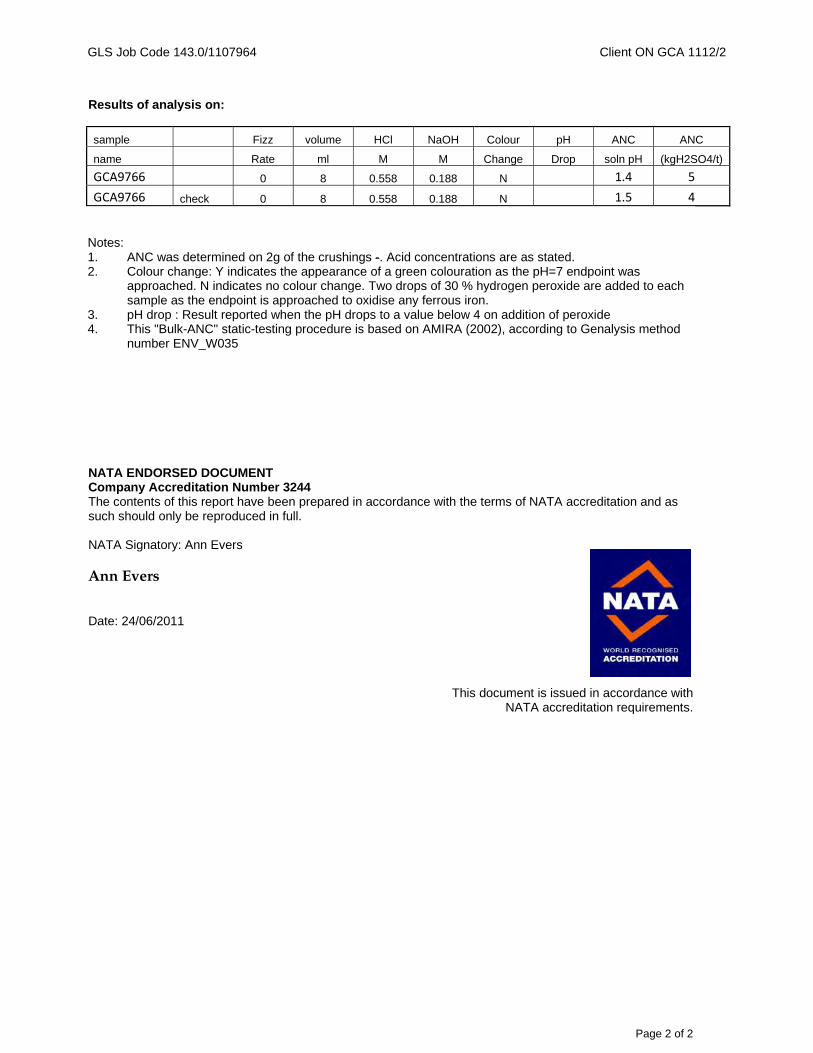
GLS Job Code 143.0/1107964 Client ON GCA 1112/2
Page 2 of 2
Results of analysis on:
sample Fizz volume HCl NaOH Colour pH ANC ANC
name Rate ml M M Change Drop soln pH (kgH2SO4/t)
GCA9766 0 8 0.558 0.188 N 1.4 5
GCA9766 check 0 8 0.558 0.188 N 1.5 4 Notes: 1. ANC was determined on 2g of the crushings -. Acid concentrations are as stated. 2. Colour change: Y indicates the appearance of a green colouration as the pH=7 endpoint was
approached. N indicates no colour change. Two drops of 30 % hydrogen peroxide are added to each sample as the endpoint is approached to oxidise any ferrous iron.
3. pH drop : Result reported when the pH drops to a value below 4 on addition of peroxide 4. This "Bulk-ANC" static-testing procedure is based on AMIRA (2002), according to Genalysis method
number ENV_W035 NATA ENDORSED DOCUMENT Company Accreditation Number 3244 The contents of this report have been prepared in accordance with the terms of NATA accreditation and as such should only be reproduced in full. NATA Signatory: Ann Evers Ann Evers Date: 24/06/2011
This document is issued in accordance with NATA accreditation requirements.
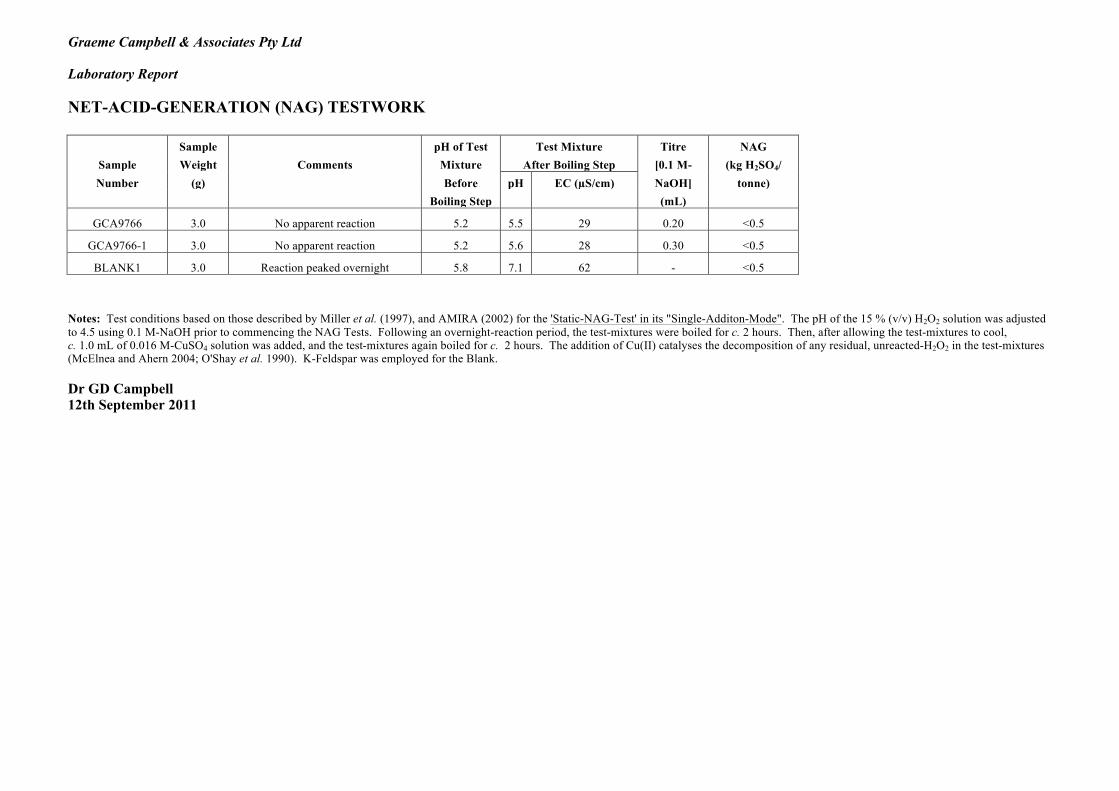
Graeme Campbell & Associates Pty Ltd Laboratory Report NET-ACID-GENERATION (NAG) TESTWORK Sample pH of Test Test Mixture Titre NAG
Sample Weight Comments Mixture After Boiling Step [0.1 M- (kg H2SO4/ Number (g) Before pH EC (µS/cm) NaOH] tonne)
Boiling Step (mL)
GCA9766 3.0 No apparent reaction 5.2 5.5 29 0.20 <0.5
GCA9766-1 3.0 No apparent reaction 5.2 5.6 28 0.30 <0.5
BLANK1 3.0 Reaction peaked overnight 5.8 7.1 62 - <0.5 Notes: Test conditions based on those described by Miller et al. (1997), and AMIRA (2002) for the 'Static-NAG-Test' in its "Single-Additon-Mode". The pH of the 15 % (v/v) H2O2 solution was adjusted to 4.5 using 0.1 M-NaOH prior to commencing the NAG Tests. Following an overnight-reaction period, the test-mixtures were boiled for c. 2 hours. Then, after allowing the test-mixtures to cool, c. 1.0 mL of 0.016 M-CuSO4 solution was added, and the test-mixtures again boiled for c. 2 hours. The addition of Cu(II) catalyses the decomposition of any residual, unreacted-H2O2 in the test-mixtures (McElnea and Ahern 2004; O'Shay et al. 1990). K-Feldspar was employed for the Blank. Dr GD Campbell 12th September 2011

3Page 1 of 8
TOWNSVILLE LABORATORY9-23 Kelli Street, Mt St John, Bohle, Queensland, Australia 4818
Tel: +61 7 4774 3655 Fax: +61 7 4774 4692
JOHANNESBURG LABORATORY43 Malcolm Moodie Crescent,
Jet Park, Gauteng, South Africa 1459
Tel: +27 11 552 8149 Fax: +27 11 552 8248
ADELAIDE LABORATORY11 Senna Road, Wingfield, 5013, South Australia
Tel: +61 8 8162 9714 Fax: +61 8 8349 7444
KALGOORLIE SAMPLE PREPARATION DIVISION12 Keogh Way, Kalgoorlie 6430, Western Australia
Tel: +61 8 9021 6057 Fax: +61 8 9021 3476
MAIN OFFICE AND LABORATORY
15 Davison Street, Maddington 6109, Western Australia
PO Box 144, Gosnells 6990, Western Australia
Tel: +61 8 9251 8100 Fax: +61 8 9251 8110
Email: [email protected]
Web Page: www.genalysis.com.au
JOB INFORMATIONJOB CODENo. of SAMPLESNo. of ELEMENTSCLIENT O/NSAMPLE SUBMISSION No. :
::::
PROJECT :STATE :DATE RECEIVEDDATE COMPLETED
::
331143.0/1108180
Pilbara Iron-Ore ProjectEx-Pulp14/06/2011
GCA1112/2 (Job 1 of 1)
27/06/201127/06/2011DATE PRINTED Genalysis Main LaboratoryPRIMARY LABORATORY
::
LEGENDX = Less than Detection Limit
N/R = Sample Not Received
* = Result Checked
( ) = Result still to come
I/S = Insufficient Sample for Analysis
E6 = Result X 1,000,000
UA = Unable to Assay
> = Value beyond Limit of Method
OV = Value over-range for Package
Dr G. CAMPBELLCAMPBELL, GRAEME and ASSOCIATESPO Box 247BRIDGETOWN, W.A. 6255AUSTRALIA
ANALYTICAL REPORT
3143.0/1108180 (27/06/2011) CLIENT O/N: GCA1112/2 Page 2 of 8
DISCLAIMER
SAMPLE DETAILS
Genalysis Laboratory Services Pty Ltd wishes to make the following disclaimer pertaining to the accompanying
analytical results.
Genalysis Laboratory Services Pty Ltd disclaims any liability, legal or otherwise, for any inferences implied from
this report relating to either the origin of, or the sampling technique employed in the collection of, the submitted
samples.
SIGNIFICANT FIGURES
It is common practice to report data derived from analytical instrumentation to a maximum of two or three
significant figures. Some data reported herein may show more figures than this. The reporting of more than
two or three figures in no way implies that the third, fourth and subsequent figures may be real or significant.
Genalysis Laboratory Services Pty Ltd accepts no responsibility whatsoever for any interpretation
by any party of any data where more than two or three significant figures have been reported.
GENERAL CONDITIONS
SAMPLE STORAGE DETAILS
SAMPLE STORAGE OF SOLIDS
Bulk Residues and Pulps will be stored for 60 DAYS without charge. After this time all Bulk Residues and Pulps
will be stored at a rate of $3.30 per cubic metre per day until your written advice regarding collection or disposal
is received. Expenses related to the return or disposal of samples will be charged to you at cost. Current
disposal cost is charged at $100.00 per cubic metre.
SAMPLE STORAGE OF SOLUTIONS
Samples received as liquids, waters or solutions will be held for 60 DAYS free of charge then disposed of,
unless written advice for return or collection is received.
3143.0/1108180 (27/06/2011) CLIENT O/N: GCA1112/2 Page 3 of 8
NOTES *** NATA ENDORSED DOCUMENT ****
Company Accreditation Number 3244
The contents of this report have been prepared in accordance with the
terms of NATA accreditation and as such should only be reproduced in full.
The analysis results reported herein have been obtained using the
following methods and conditions:
The samples as listed were received as being 'Tailing-Solids' which had been
dried and pulverised in a zirconia bowl as per Genalysis job number 143_0_1107964.
The results have been determined according to Genalysis methods codes :
Digestions : MPL_W001 (4A/), MPL_W005 (SE1/), ENV_W012 (FC7/SIE), MPL_W011 (FP1/),
MPL_W008 (HG1/).
Analytical Finishes: ICP_W004 (/OE), ICP_W005 (/MS), and AAS_W004 (/CV).
The results included the assay of blanks and international reference standards
STSD-2, AMIS0076 and AMIS0085 and Genalysis in-house standards HgSTD-4 and OREAS 97.01
The results are expressed as parts per million or percent by mass in the dried and
prepared material.
NATA Signatory: A Evers
Chief CHemist
Date: 27/06/2011
This document is issued in accordance with NATA’s accreditation requirements.
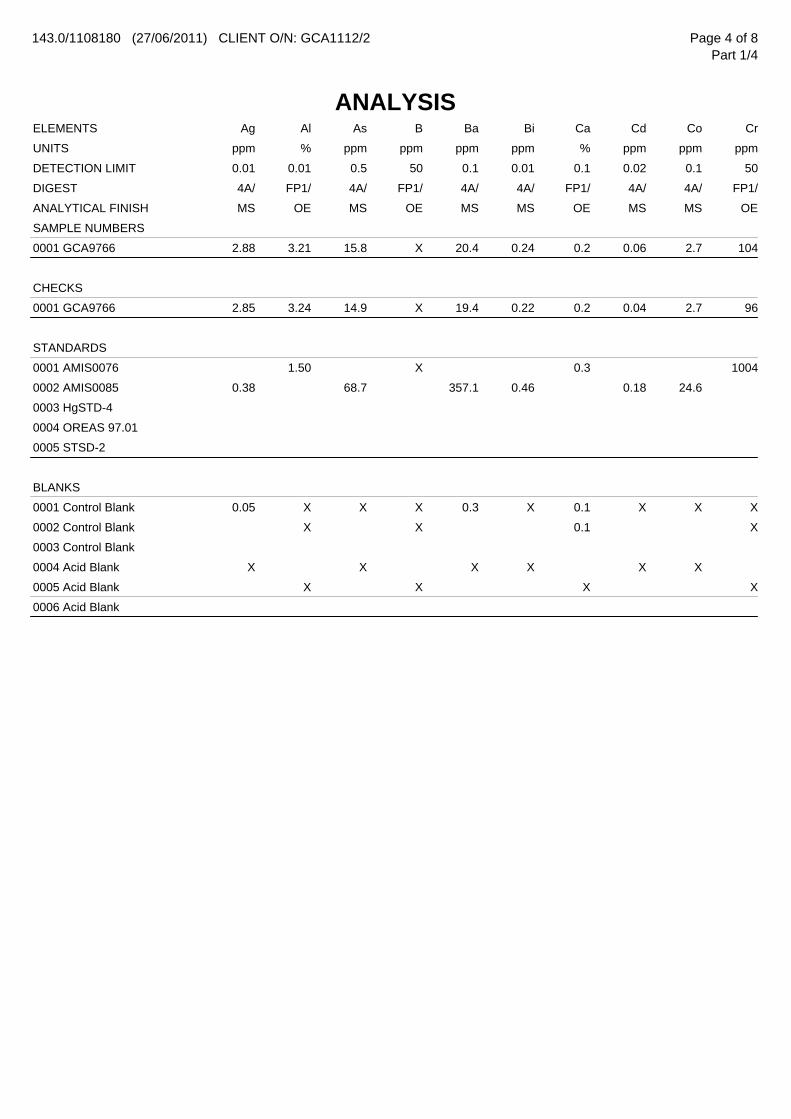
143.0/1108180 (27/06/2011) CLIENT O/N: GCA1112/2
ANALYSIS
Page 4 of 8Part 1/4
Ag AlELEMENTS As B Ba Bi Ca Cd Co Cr
ppm %UNITS ppm ppm ppm ppm % ppm ppm ppm
0.01 0.01DETECTION LIMIT 0.5 50 0.1 0.01 0.1 0.02 0.1 50
4A/ FP1/DIGEST 4A/ FP1/ 4A/ 4A/ FP1/ 4A/ 4A/ FP1/
MS OEANALYTICAL FINISH MS OE MS MS OE MS MS OE
SAMPLE NUMBERS
2.88 3.210001 GCA9766 15.8 X 20.4 0.24 0.2 0.06 2.7 104
CHECKS
2.85 3.240001 GCA9766 14.9 X 19.4 0.22 0.2 0.04 2.7 96
STANDARDS
1.500001 AMIS0076 X 0.3 1004
0.380002 AMIS0085 68.7 357.1 0.46 0.18 24.6
0003 HgSTD-4
0004 OREAS 97.01
0005 STSD-2
BLANKS
0.05 X0001 Control Blank X X 0.3 X 0.1 X X X
X0002 Control Blank X 0.1 X
0003 Control Blank
X0004 Acid Blank X X X X X
X0005 Acid Blank X X X
0006 Acid Blank
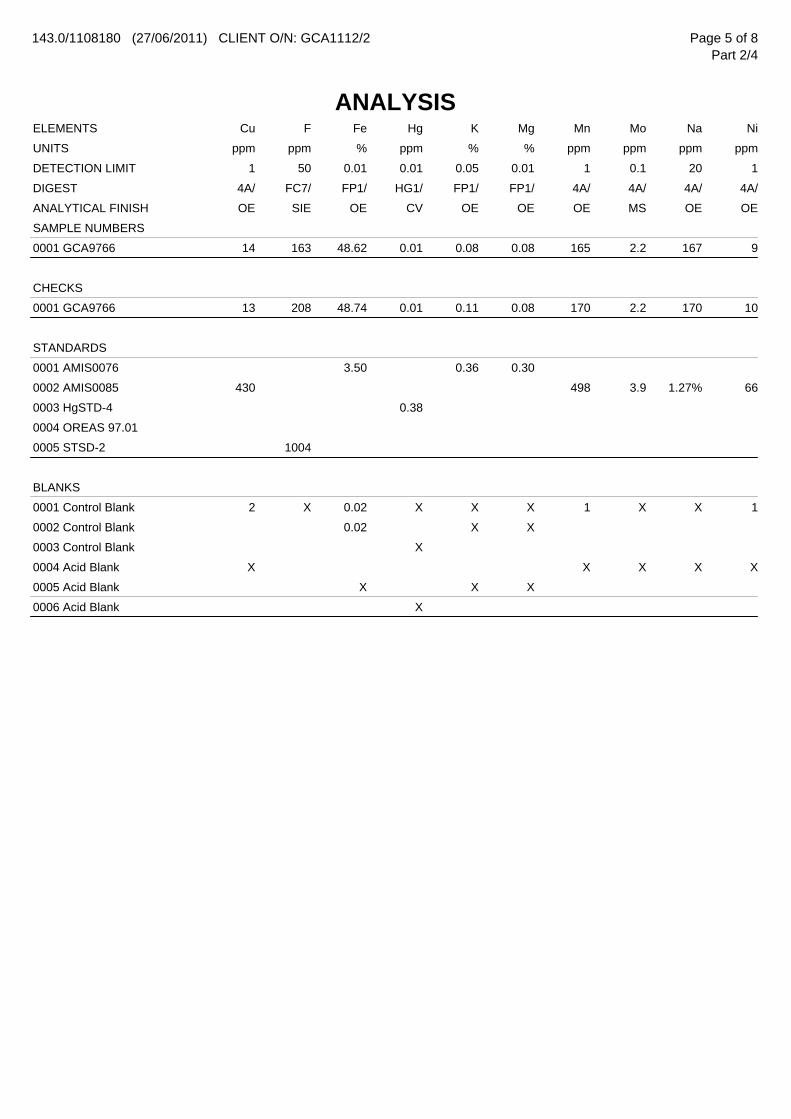
143.0/1108180 (27/06/2011) CLIENT O/N: GCA1112/2
ANALYSIS
Page 5 of 8Part 2/4
Cu FELEMENTS Fe Hg K Mg Mn Mo Na Ni
ppm ppmUNITS % ppm % % ppm ppm ppm ppm
1 50DETECTION LIMIT 0.01 0.01 0.05 0.01 1 0.1 20 1
4A/ FC7/DIGEST FP1/ HG1/ FP1/ FP1/ 4A/ 4A/ 4A/ 4A/
OE SIEANALYTICAL FINISH OE CV OE OE OE MS OE OE
SAMPLE NUMBERS
14 1630001 GCA9766 48.62 0.01 0.08 0.08 165 2.2 167 9
CHECKS
13 2080001 GCA9766 48.74 0.01 0.11 0.08 170 2.2 170 10
STANDARDS
0001 AMIS0076 3.50 0.36 0.30
4300002 AMIS0085 498 3.9 1.27% 66
0003 HgSTD-4 0.38
0004 OREAS 97.01
10040005 STSD-2
BLANKS
2 X0001 Control Blank 0.02 X X X 1 X X 1
0002 Control Blank 0.02 X X
0003 Control Blank X
X0004 Acid Blank X X X X
0005 Acid Blank X X X
0006 Acid Blank X
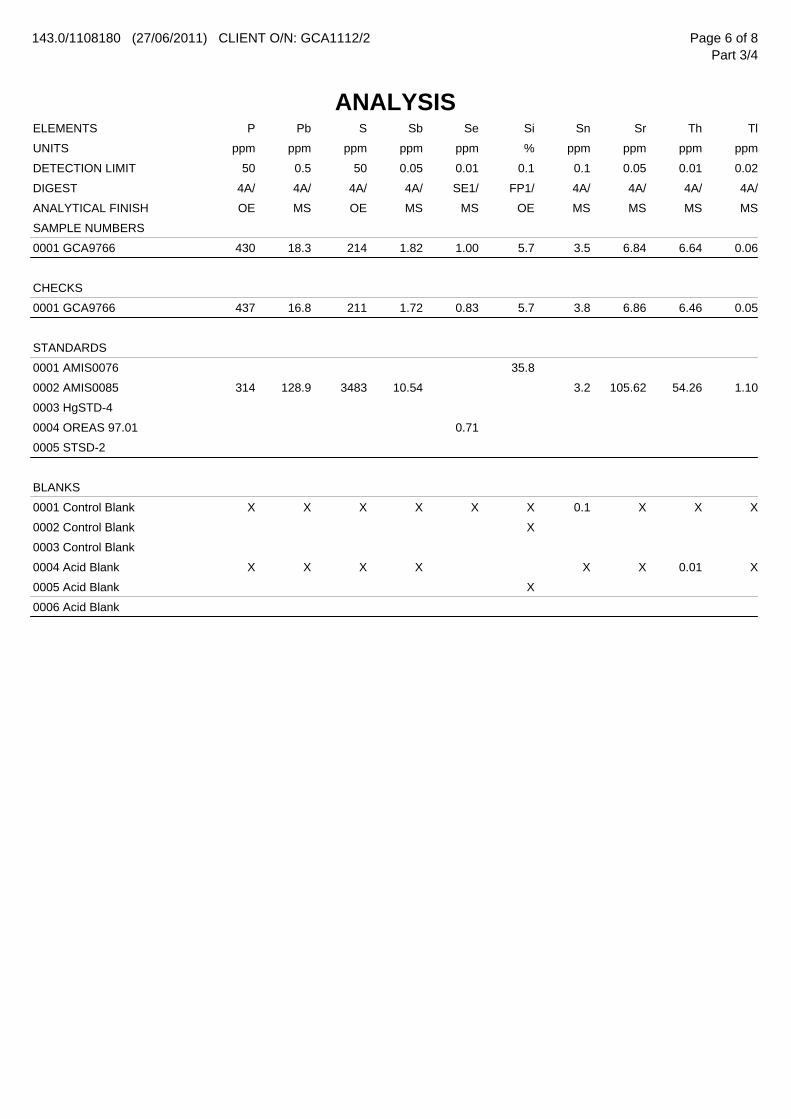
143.0/1108180 (27/06/2011) CLIENT O/N: GCA1112/2
ANALYSIS
Page 6 of 8Part 3/4
P PbELEMENTS S Sb Se Si Sn Sr Th Tl
ppm ppmUNITS ppm ppm ppm % ppm ppm ppm ppm
50 0.5DETECTION LIMIT 50 0.05 0.01 0.1 0.1 0.05 0.01 0.02
4A/ 4A/DIGEST 4A/ 4A/ SE1/ FP1/ 4A/ 4A/ 4A/ 4A/
OE MSANALYTICAL FINISH OE MS MS OE MS MS MS MS
SAMPLE NUMBERS
430 18.30001 GCA9766 214 1.82 1.00 5.7 3.5 6.84 6.64 0.06
CHECKS
437 16.80001 GCA9766 211 1.72 0.83 5.7 3.8 6.86 6.46 0.05
STANDARDS
0001 AMIS0076 35.8
314 128.90002 AMIS0085 3483 10.54 3.2 105.62 54.26 1.10
0003 HgSTD-4
0004 OREAS 97.01 0.71
0005 STSD-2
BLANKS
X X0001 Control Blank X X X X 0.1 X X X
0002 Control Blank X
0003 Control Blank
X X0004 Acid Blank X X X X 0.01 X
0005 Acid Blank X
0006 Acid Blank
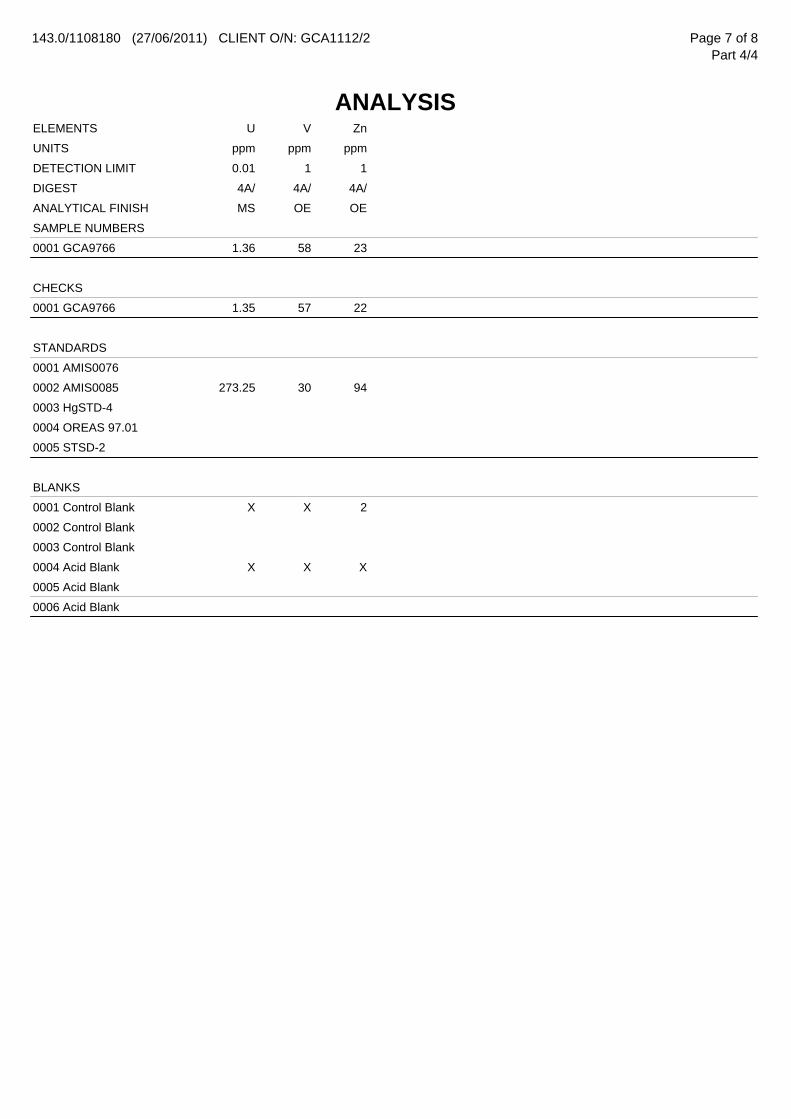
143.0/1108180 (27/06/2011) CLIENT O/N: GCA1112/2
ANALYSIS
Page 7 of 8Part 4/4
U VELEMENTS Zn
ppm ppmUNITS ppm
0.01 1DETECTION LIMIT 1
4A/ 4A/DIGEST 4A/
MS OEANALYTICAL FINISH OE
SAMPLE NUMBERS
1.36 580001 GCA9766 23
CHECKS
1.35 570001 GCA9766 22
STANDARDS
0001 AMIS0076
273.25 300002 AMIS0085 94
0003 HgSTD-4
0004 OREAS 97.01
0005 STSD-2
BLANKS
X X0001 Control Blank 2
0002 Control Blank
0003 Control Blank
X X0004 Acid Blank X
0005 Acid Blank
0006 Acid Blank
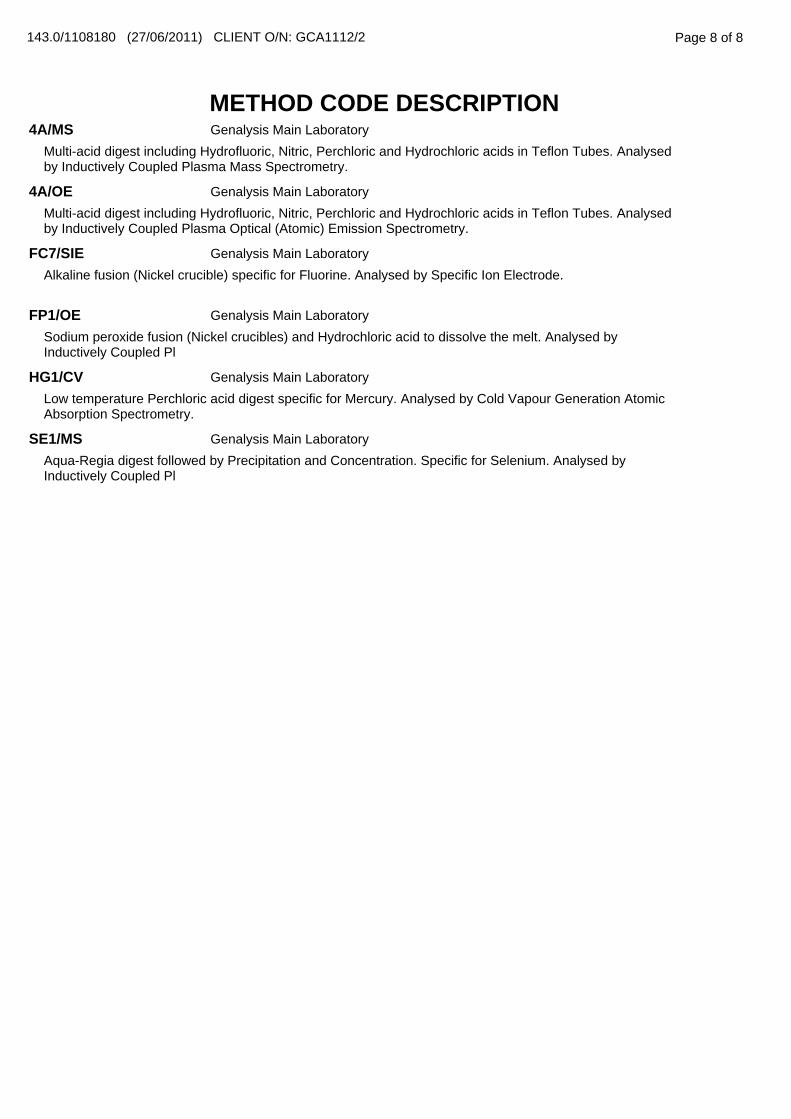
Page 8 of 8
METHOD CODE DESCRIPTION
143.0/1108180 (27/06/2011) CLIENT O/N: GCA1112/2
4A/MS
Multi-acid digest including Hydrofluoric, Nitric, Perchloric and Hydrochloric acids in Teflon Tubes. Analysedby Inductively Coupled Plasma Mass Spectrometry.
Genalysis Main Laboratory
4A/OE
Multi-acid digest including Hydrofluoric, Nitric, Perchloric and Hydrochloric acids in Teflon Tubes. Analysedby Inductively Coupled Plasma Optical (Atomic) Emission Spectrometry.
Genalysis Main Laboratory
FC7/SIE
Alkaline fusion (Nickel crucible) specific for Fluorine. Analysed by Specific Ion Electrode.
Genalysis Main Laboratory
FP1/OE
Sodium peroxide fusion (Nickel crucibles) and Hydrochloric acid to dissolve the melt. Analysed byInductively Coupled Pl
Genalysis Main Laboratory
HG1/CV
Low temperature Perchloric acid digest specific for Mercury. Analysed by Cold Vapour Generation AtomicAbsorption Spectrometry.
Genalysis Main Laboratory
SE1/MS
Aqua-Regia digest followed by Precipitation and Concentration. Specific for Selenium. Analysed byInductively Coupled Pl
Genalysis Main Laboratory
2Page 1 of 5
ANALYTICAL REPORTDr G. CAMPBELLCAMPBELL, GRAEME and ASSOCIATESPO Box 247BRIDGETOWN, W.A. 6255AUSTRALIA
JOB INFORMATIONJOB CODENo. of SAMPLESNo. of ELEMENTSCLIENT O/NSAMPLE SUBMISSION No. :
::::
PROJECT :STATE :DATE RECEIVEDDATE COMPLETED
::
141143.0/1108182
Pilbara Iron-Ore ProjectEx-Pulp14/06/2011
GCA1112/2 (Job 1 of 1)
06/07/201121/07/2011DATE PRINTED Genalysis Main LaboratoryPRIMARY LABORATORY
::
LEGENDX = Less than Detection Limit
N/R = Sample Not Received
* = Result Checked
( ) = Result still to come
I/S = Insufficient Sample for Analysis
E6 = Result X 1,000,000
UA = Unable to Assay
> = Value beyond Limit of Method
OV = Value over-range for Package
JOHANNESBURG LABORATORY43 Malcolm Moodie Crescent,
Jet Park, Gauteng, South Africa 1459
Tel: +27 11 552 8149 Fax: +27 11 552 8248
ADELAIDE LABORATORY11 Senna Road, Wingfield, 5013, South Australia
Tel: +61 8 8162 9714 Fax: +61 8 8349 7444
KALGOORLIE SAMPLE PREPARATION DIVISION12 Keogh Way, Kalgoorlie 6430, Western Australia
Tel: +61 8 9021 6057 Fax: +61 8 9021 3476
MAIN OFFICE AND LABORATORY
15 Davison Street, Maddington 6109, Western Australia
PO Box 144, Gosnells 6990, Western Australia
Tel: +61 8 9251 8100 Fax: +61 8 9251 8110
Email: [email protected]
Web Page: www.genalysis.com.au
TOWNSVILLE LABORATORY9-23 Kelli Street, Mt St John, Bohle, Queensland, Australia 4818
Tel: +61 7 4774 3655 Fax: +61 7 4774 4692
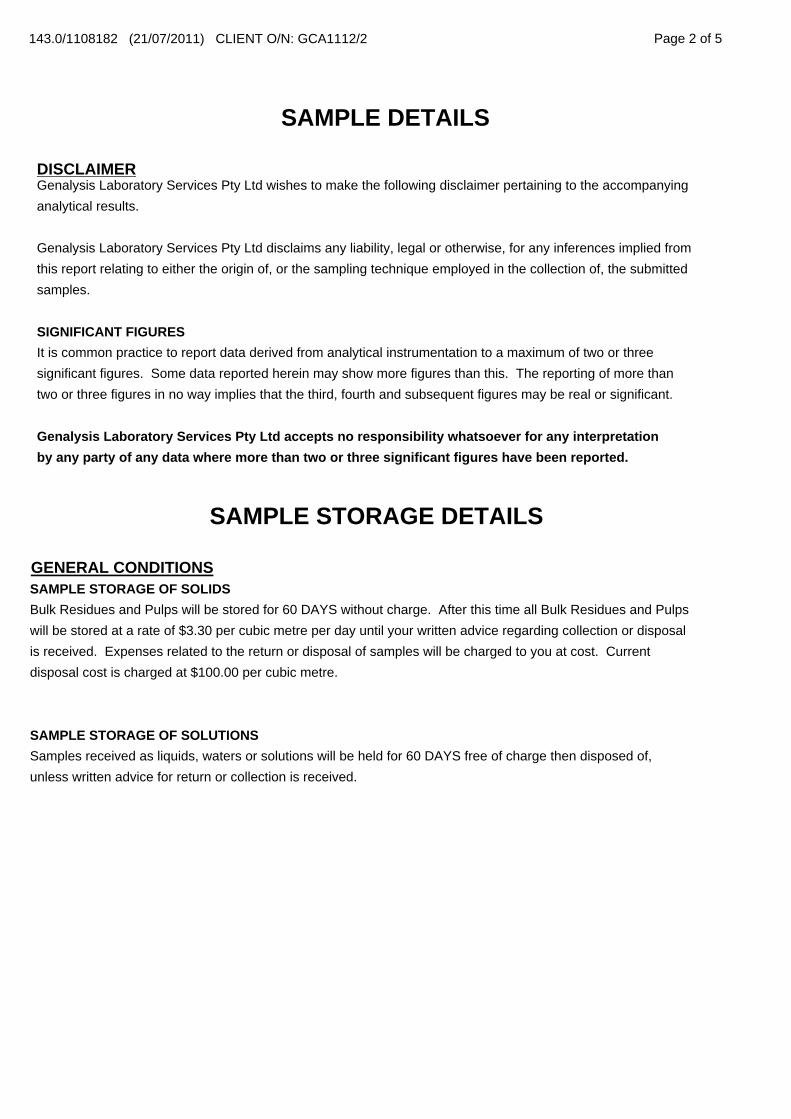
2143.0/1108182 (21/07/2011) CLIENT O/N: GCA1112/2 Page 2 of 5
DISCLAIMER
SAMPLE DETAILS
Genalysis Laboratory Services Pty Ltd wishes to make the following disclaimer pertaining to the accompanying
analytical results.
Genalysis Laboratory Services Pty Ltd disclaims any liability, legal or otherwise, for any inferences implied from
this report relating to either the origin of, or the sampling technique employed in the collection of, the submitted
samples.
SIGNIFICANT FIGURES
It is common practice to report data derived from analytical instrumentation to a maximum of two or three
significant figures. Some data reported herein may show more figures than this. The reporting of more than
two or three figures in no way implies that the third, fourth and subsequent figures may be real or significant.
Genalysis Laboratory Services Pty Ltd accepts no responsibility whatsoever for any interpretation
by any party of any data where more than two or three significant figures have been reported.
GENERAL CONDITIONS
SAMPLE STORAGE DETAILS
SAMPLE STORAGE OF SOLIDS
Bulk Residues and Pulps will be stored for 60 DAYS without charge. After this time all Bulk Residues and Pulps
will be stored at a rate of $3.30 per cubic metre per day until your written advice regarding collection or disposal
is received. Expenses related to the return or disposal of samples will be charged to you at cost. Current
disposal cost is charged at $100.00 per cubic metre.
SAMPLE STORAGE OF SOLUTIONS
Samples received as liquids, waters or solutions will be held for 60 DAYS free of charge then disposed of,
unless written advice for return or collection is received.
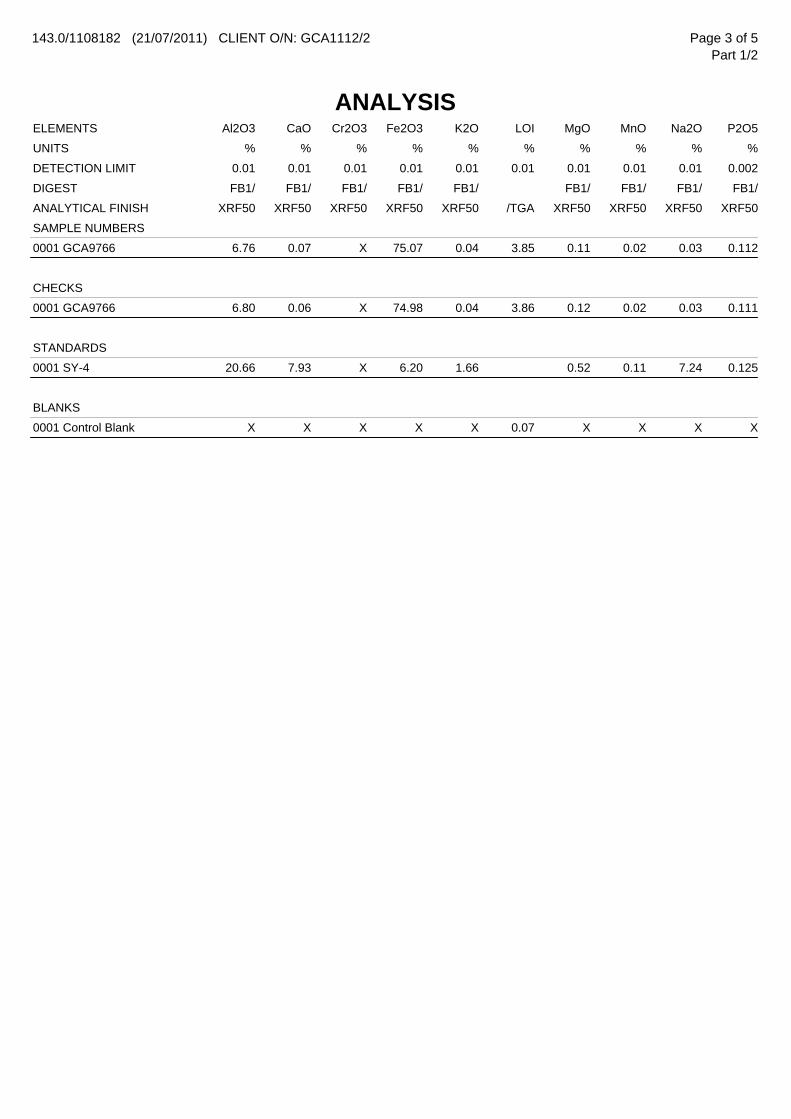
143.0/1108182 (21/07/2011) CLIENT O/N: GCA1112/2
ANALYSIS
Page 3 of 5Part 1/2
Al2O3 CaOELEMENTS Cr2O3 Fe2O3 K2O LOI MgO MnO Na2O P2O5
% %UNITS % % % % % % % %
0.01 0.01DETECTION LIMIT 0.01 0.01 0.01 0.01 0.01 0.01 0.01 0.002
FB1/ FB1/DIGEST FB1/ FB1/ FB1/ FB1/ FB1/ FB1/ FB1/
XRF50 XRF50ANALYTICAL FINISH XRF50 XRF50 XRF50 /TGA XRF50 XRF50 XRF50 XRF50
SAMPLE NUMBERS
6.76 0.070001 GCA9766 X 75.07 0.04 3.85 0.11 0.02 0.03 0.112
CHECKS
6.80 0.060001 GCA9766 X 74.98 0.04 3.86 0.12 0.02 0.03 0.111
STANDARDS
20.66 7.930001 SY-4 X 6.20 1.66 0.52 0.11 7.24 0.125
BLANKS
X X0001 Control Blank X X X 0.07 X X X X
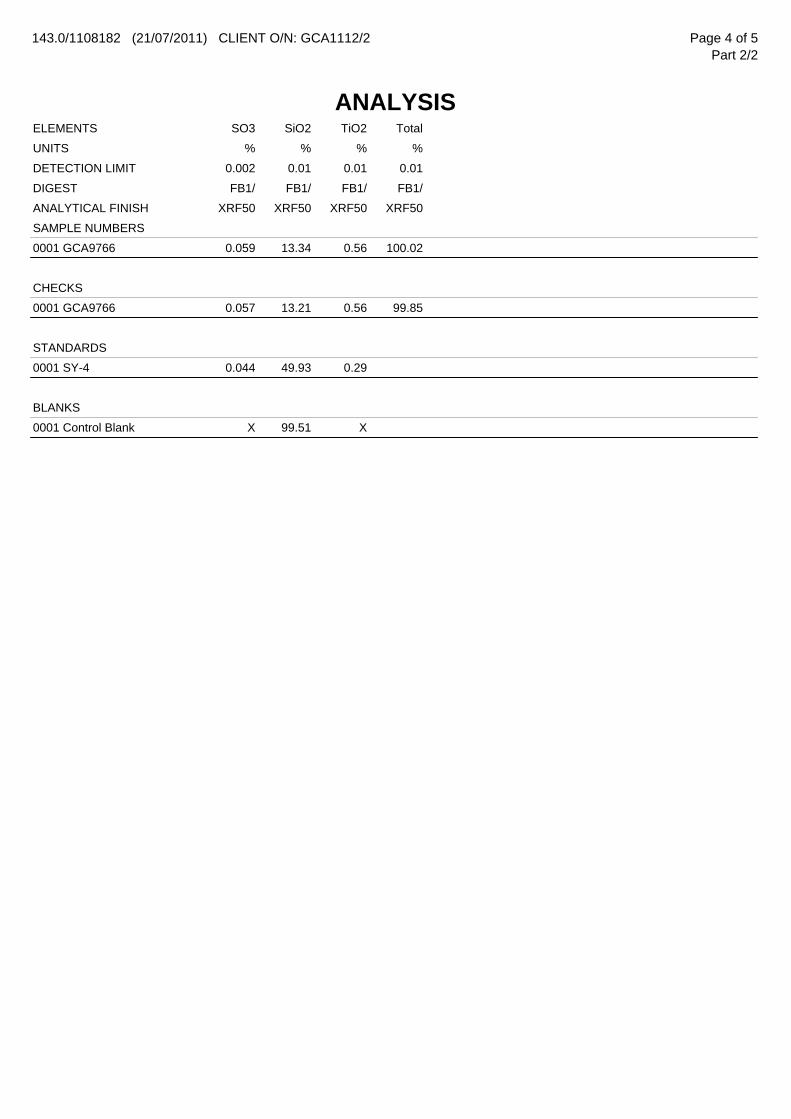
143.0/1108182 (21/07/2011) CLIENT O/N: GCA1112/2
ANALYSIS
Page 4 of 5Part 2/2
SO3 SiO2ELEMENTS TiO2 Total
% %UNITS % %
0.002 0.01DETECTION LIMIT 0.01 0.01
FB1/ FB1/DIGEST FB1/ FB1/
XRF50 XRF50ANALYTICAL FINISH XRF50 XRF50
SAMPLE NUMBERS
0.059 13.340001 GCA9766 0.56 100.02
CHECKS
0.057 13.210001 GCA9766 0.56 99.85
STANDARDS
0.044 49.930001 SY-4 0.29
BLANKS
X 99.510001 Control Blank X
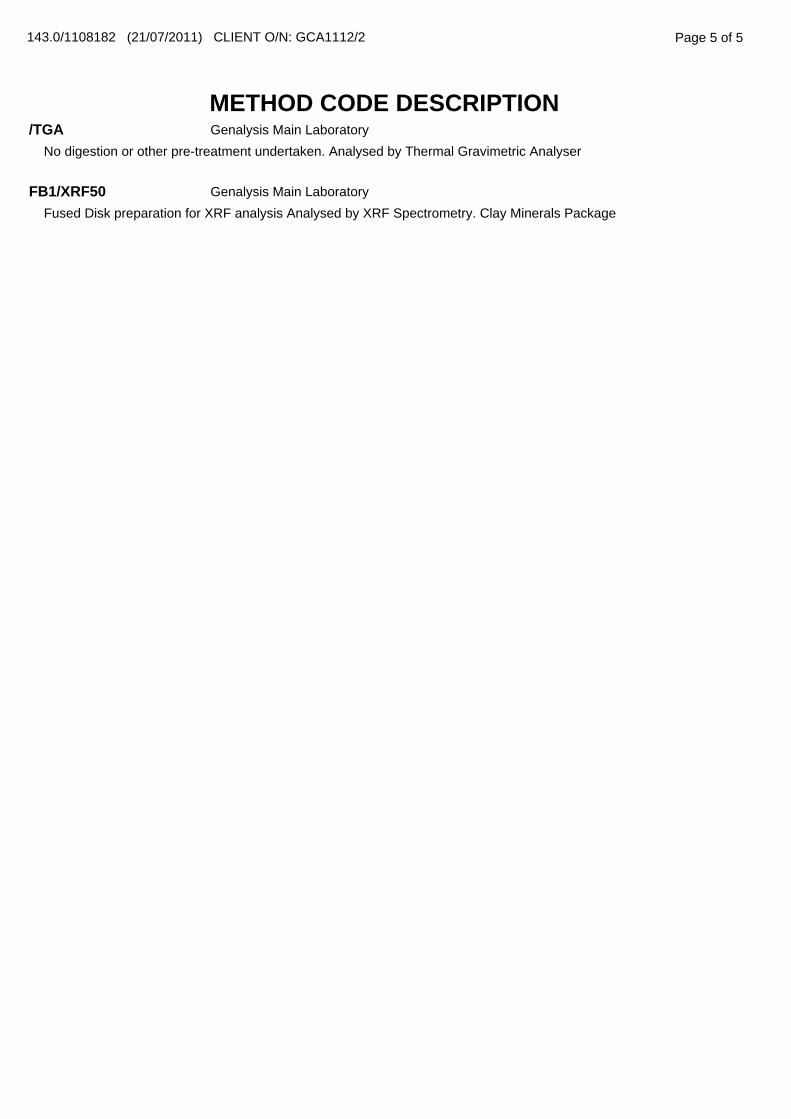
Page 5 of 5
METHOD CODE DESCRIPTION
143.0/1108182 (21/07/2011) CLIENT O/N: GCA1112/2
/TGA
No digestion or other pre-treatment undertaken. Analysed by Thermal Gravimetric Analyser
Genalysis Main Laboratory
FB1/XRF50
Fused Disk preparation for XRF analysis Analysed by XRF Spectrometry. Clay Minerals Package
Genalysis Main Laboratory
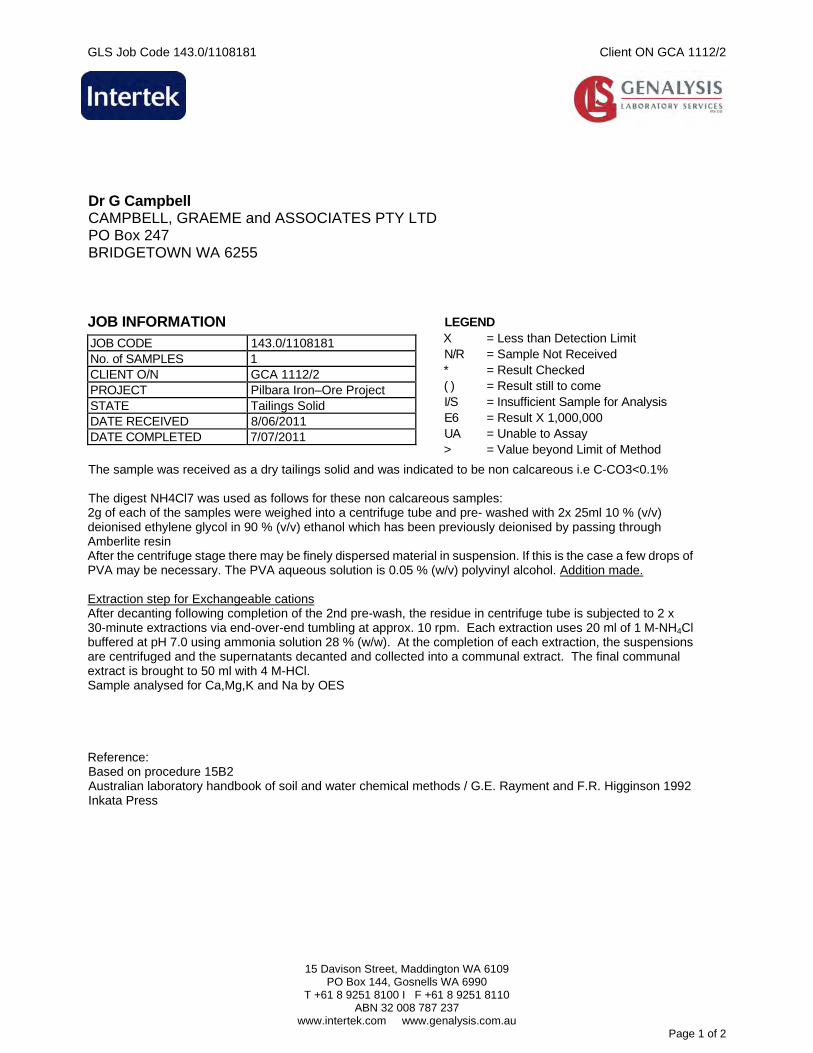
GLS Job Code 143.0/1108181 Client ON GCA 1112/2
15 Davison Street, Maddington WA 6109
PO Box 144, Gosnells WA 6990 T +61 8 9251 8100 I F +61 8 9251 8110
ABN 32 008 787 237 www.intertek.com www.genalysis.com.au
Page 1 of 2
Dr G Campbell CAMPBELL, GRAEME and ASSOCIATES PTY LTD PO Box 247 BRIDGETOWN WA 6255 JOB INFORMATION
JOB CODE 143.0/1108181 No. of SAMPLES 1 CLIENT O/N GCA 1112/2 PROJECT Pilbara Iron–Ore Project STATE Tailings Solid DATE RECEIVED 8/06/2011 DATE COMPLETED 7/07/2011
LEGEND X = Less than Detection Limit N/R = Sample Not Received * = Result Checked ( ) = Result still to come I/S = Insufficient Sample for Analysis E6 = Result X 1,000,000 UA = Unable to Assay > = Value beyond Limit of Method
The sample was received as a dry tailings solid and was indicated to be non calcareous i.e C-CO3<0.1% The digest NH4Cl7 was used as follows for these non calcareous samples: 2g of each of the samples were weighed into a centrifuge tube and pre- washed with 2x 25ml 10 % (v/v) deionised ethylene glycol in 90 % (v/v) ethanol which has been previously deionised by passing through Amberlite resin After the centrifuge stage there may be finely dispersed material in suspension. If this is the case a few drops of PVA may be necessary. The PVA aqueous solution is 0.05 % (w/v) polyvinyl alcohol. Addition made. Extraction step for Exchangeable cations After decanting following completion of the 2nd pre-wash, the residue in centrifuge tube is subjected to 2 x 30-minute extractions via end-over-end tumbling at approx. 10 rpm. Each extraction uses 20 ml of 1 M-NH4Cl buffered at pH 7.0 using ammonia solution 28 % (w/w). At the completion of each extraction, the suspensions are centrifuged and the supernatants decanted and collected into a communal extract. The final communal extract is brought to 50 ml with 4 M-HCl. Sample analysed for Ca,Mg,K and Na by OES Reference: Based on procedure 15B2 Australian laboratory handbook of soil and water chemical methods / G.E. Rayment and F.R. Higginson 1992 Inkata Press
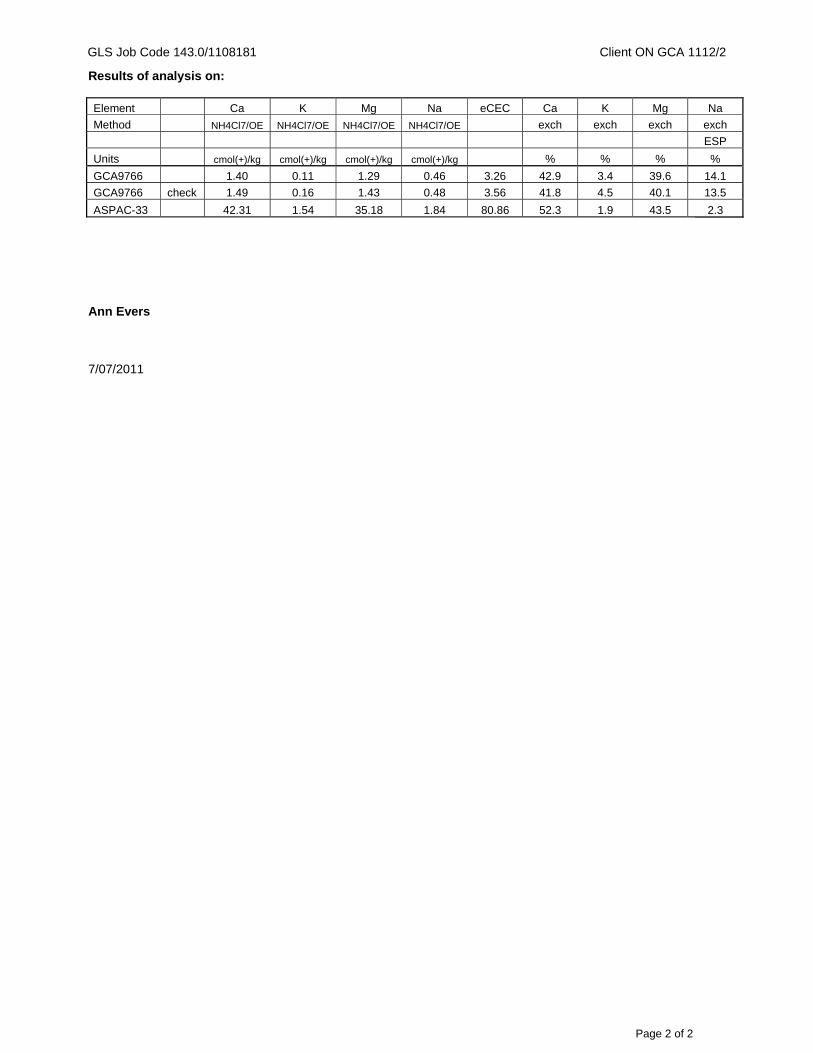
GLS Job Code 143.0/1108181 Client ON GCA 1112/2
Page 2 of 2
Results of analysis on:
Element Ca K Mg Na eCEC Ca K Mg Na
Method NH4Cl7/OE NH4Cl7/OE NH4Cl7/OE NH4Cl7/OE exch exch exch exch
ESP
Units cmol(+)/kg cmol(+)/kg cmol(+)/kg cmol(+)/kg % % % %
GCA9766 1.40 0.11 1.29 0.46 3.26 42.9 3.4 39.6 14.1
GCA9766 check 1.49 0.16 1.43 0.48 3.56 41.8 4.5 40.1 13.5
ASPAC-33 42.31 1.54 35.18 1.84 80.86 52.3 1.9 43.5 2.3 Ann Evers 7/07/2011
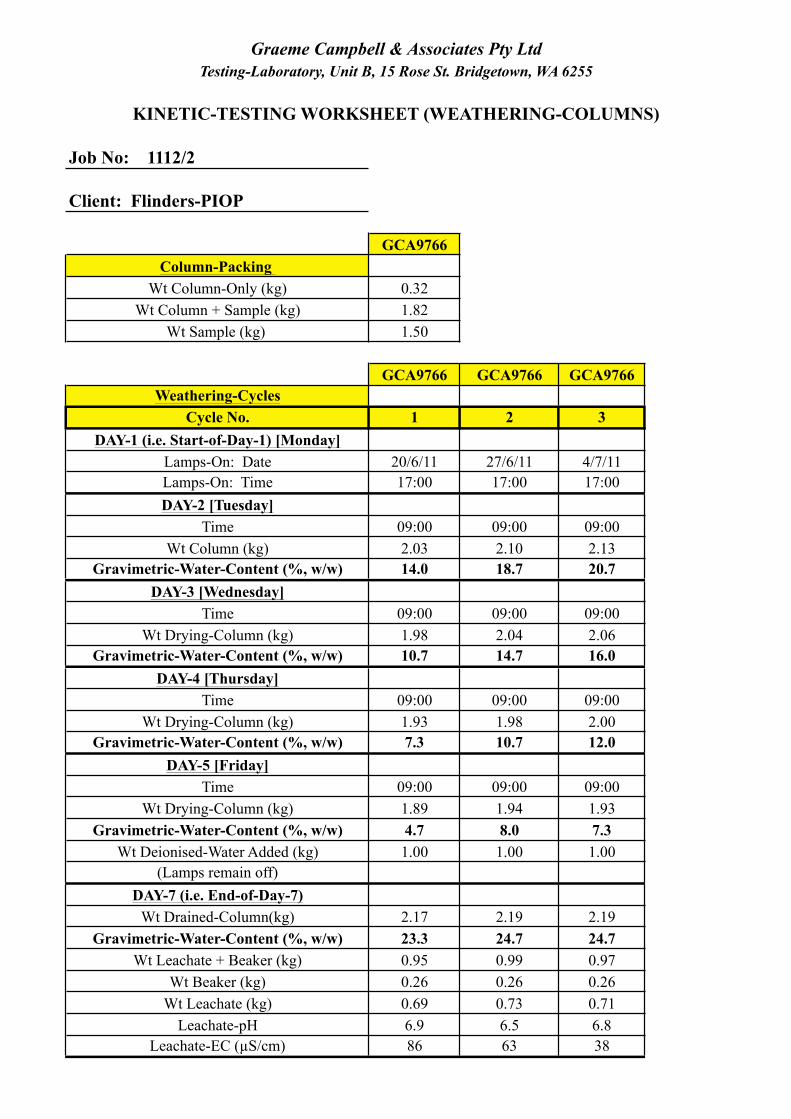
Job No: 1112/2
Client: Flinders-PIOP
GCA9766Column-Packing
Wt Column-Only (kg) 0.32Wt Column + Sample (kg) 1.82
Wt Sample (kg) 1.50
GCA9766 GCA9766 GCA9766Weathering-Cycles
Cycle No. 1 2 3DAY-1 (i.e. Start-of-Day-1) [Monday]
Lamps-On: Date 20/6/11 27/6/11 4/7/11Lamps-On: Time 17:00 17:00 17:00DAY-2 [Tuesday]
Time 09:00 09:00 09:00Wt Column (kg) 2.03 2.10 2.13
Gravimetric-Water-Content (%, w/w) 14.0 18.7 20.7DAY-3 [Wednesday]
Time 09:00 09:00 09:00Wt Drying-Column (kg) 1.98 2.04 2.06
Gravimetric-Water-Content (%, w/w) 10.7 14.7 16.0DAY-4 [Thursday]
Time 09:00 09:00 09:00Wt Drying-Column (kg) 1.93 1.98 2.00
Gravimetric-Water-Content (%, w/w) 7.3 10.7 12.0DAY-5 [Friday]
Time 09:00 09:00 09:00Wt Drying-Column (kg) 1.89 1.94 1.93
Gravimetric-Water-Content (%, w/w) 4.7 8.0 7.3Wt Deionised-Water Added (kg) 1.00 1.00 1.00
(Lamps remain off)DAY-7 (i.e. End-of-Day-7)
Wt Drained-Column(kg) 2.17 2.19 2.19Gravimetric-Water-Content (%, w/w) 23.3 24.7 24.7
Wt Leachate + Beaker (kg) 0.95 0.99 0.97Wt Beaker (kg) 0.26 0.26 0.26
Wt Leachate (kg) 0.69 0.73 0.71Leachate-pH 6.9 6.5 6.8
Leachate-EC (µS/cm) 86 63 38
Graeme Campbell & Associates Pty LtdTesting-Laboratory, Unit B, 15 Rose St. Bridgetown, WA 6255
KINETIC-TESTING WORKSHEET (WEATHERING-COLUMNS)
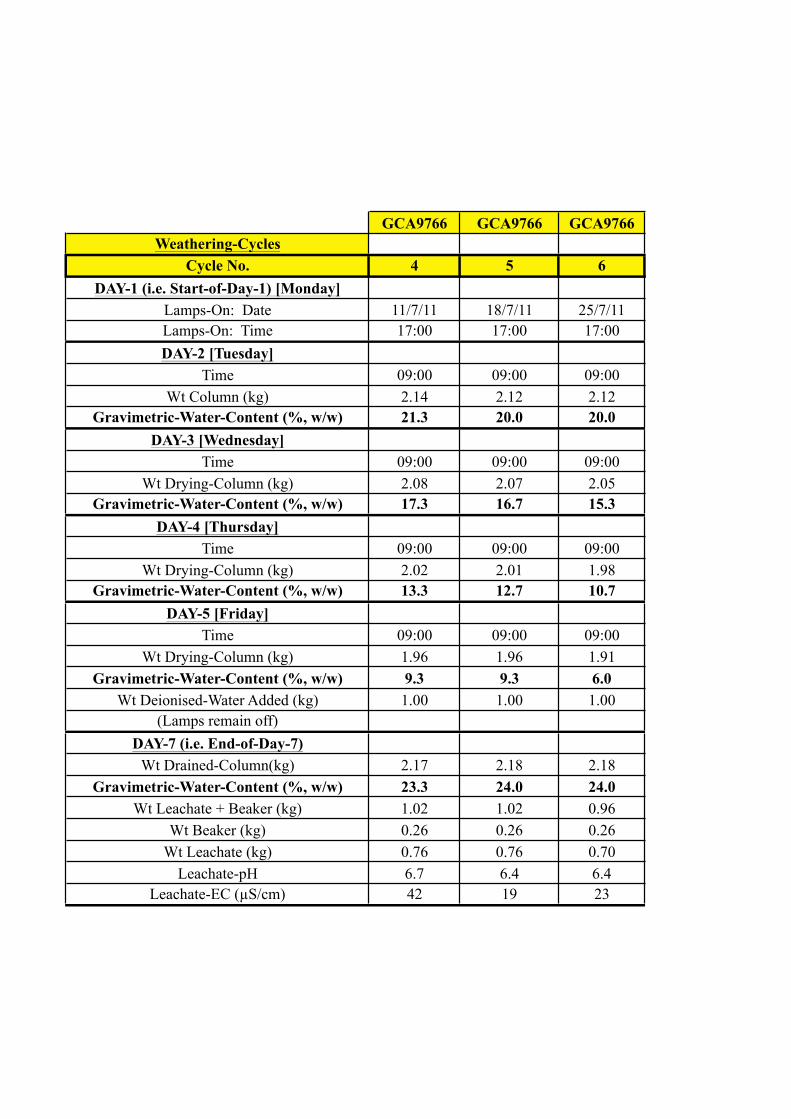
GCA9766 GCA9766 GCA9766Weathering-Cycles
Cycle No. 4 5 6DAY-1 (i.e. Start-of-Day-1) [Monday]
Lamps-On: Date 11/7/11 18/7/11 25/7/11Lamps-On: Time 17:00 17:00 17:00DAY-2 [Tuesday]
Time 09:00 09:00 09:00Wt Column (kg) 2.14 2.12 2.12
Gravimetric-Water-Content (%, w/w) 21.3 20.0 20.0DAY-3 [Wednesday]
Time 09:00 09:00 09:00Wt Drying-Column (kg) 2.08 2.07 2.05
Gravimetric-Water-Content (%, w/w) 17.3 16.7 15.3DAY-4 [Thursday]
Time 09:00 09:00 09:00Wt Drying-Column (kg) 2.02 2.01 1.98
Gravimetric-Water-Content (%, w/w) 13.3 12.7 10.7DAY-5 [Friday]
Time 09:00 09:00 09:00Wt Drying-Column (kg) 1.96 1.96 1.91
Gravimetric-Water-Content (%, w/w) 9.3 9.3 6.0Wt Deionised-Water Added (kg) 1.00 1.00 1.00
(Lamps remain off)DAY-7 (i.e. End-of-Day-7)
Wt Drained-Column(kg) 2.17 2.18 2.18Gravimetric-Water-Content (%, w/w) 23.3 24.0 24.0
Wt Leachate + Beaker (kg) 1.02 1.02 0.96Wt Beaker (kg) 0.26 0.26 0.26
Wt Leachate (kg) 0.76 0.76 0.70Leachate-pH 6.7 6.4 6.4
Leachate-EC (µS/cm) 42 19 23
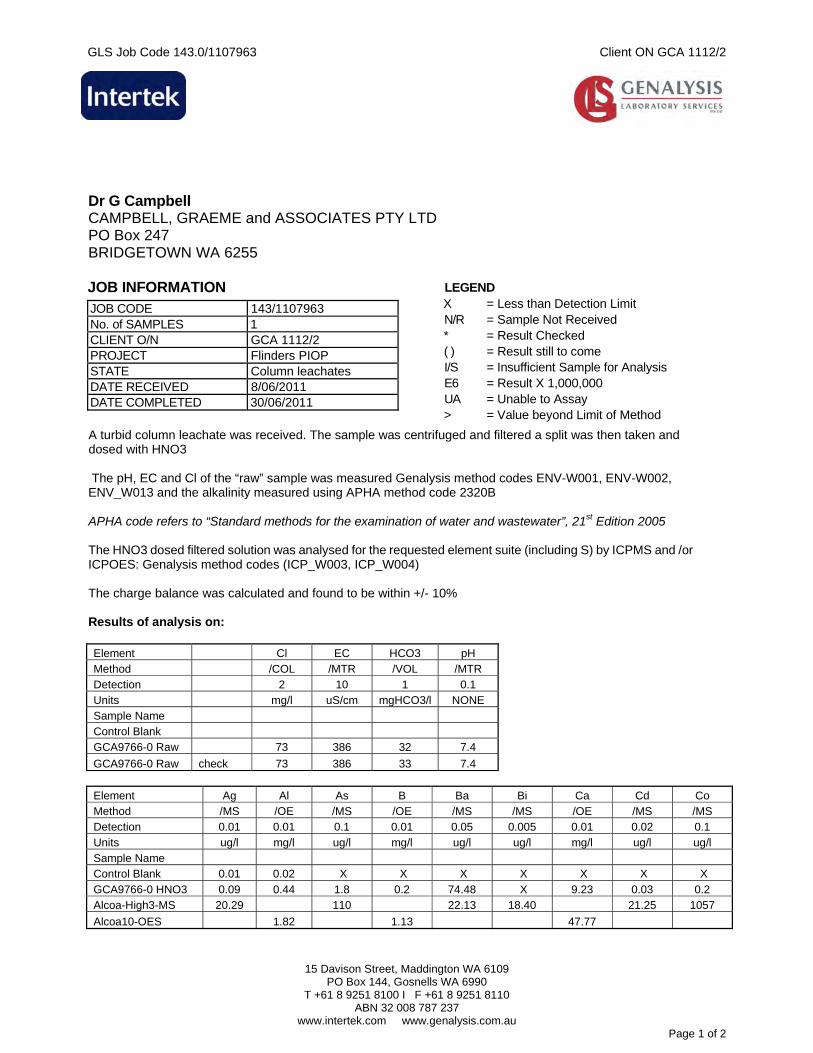
GLS Job Code 143.0/1107963 Client ON GCA 1112/2
15 Davison Street, Maddington WA 6109
PO Box 144, Gosnells WA 6990 T +61 8 9251 8100 I F +61 8 9251 8110
ABN 32 008 787 237 www.intertek.com www.genalysis.com.au
Page 1 of 2
Dr G Campbell CAMPBELL, GRAEME and ASSOCIATES PTY LTD PO Box 247 BRIDGETOWN WA 6255 JOB INFORMATION
JOB CODE 143/1107963 No. of SAMPLES 1 CLIENT O/N GCA 1112/2 PROJECT Flinders PIOP STATE Column leachates DATE RECEIVED 8/06/2011 DATE COMPLETED 30/06/2011
LEGEND X = Less than Detection Limit N/R = Sample Not Received * = Result Checked ( ) = Result still to come I/S = Insufficient Sample for Analysis E6 = Result X 1,000,000 UA = Unable to Assay > = Value beyond Limit of Method
A turbid column leachate was received. The sample was centrifuged and filtered a split was then taken and dosed with HNO3 The pH, EC and Cl of the “raw” sample was measured Genalysis method codes ENV-W001, ENV-W002, ENV_W013 and the alkalinity measured using APHA method code 2320B APHA code refers to “Standard methods for the examination of water and wastewater”, 21st Edition 2005 The HNO3 dosed filtered solution was analysed for the requested element suite (including S) by ICPMS and /or ICPOES: Genalysis method codes (ICP_W003, ICP_W004) The charge balance was calculated and found to be within +/- 10% Results of analysis on: Element Cl EC HCO3 pH Method /COL /MTR /VOL /MTR Detection 2 10 1 0.1 Units mg/l uS/cm mgHCO3/l NONE Sample Name Control Blank GCA9766-0 Raw 73 386 32 7.4
GCA9766-0 Raw check 73 386 33 7.4 Element Ag Al As B Ba Bi Ca Cd Co Method /MS /OE /MS /OE /MS /MS /OE /MS /MS Detection 0.01 0.01 0.1 0.01 0.05 0.005 0.01 0.02 0.1
Units ug/l mg/l ug/l mg/l ug/l ug/l mg/l ug/l ug/l Sample Name Control Blank 0.01 0.02 X X X X X X X
GCA9766-0 HNO3 0.09 0.44 1.8 0.2 74.48 X 9.23 0.03 0.2 Alcoa-High3-MS 20.29 110 22.13 18.40 21.25 1057
Alcoa10-OES 1.82 1.13 47.77
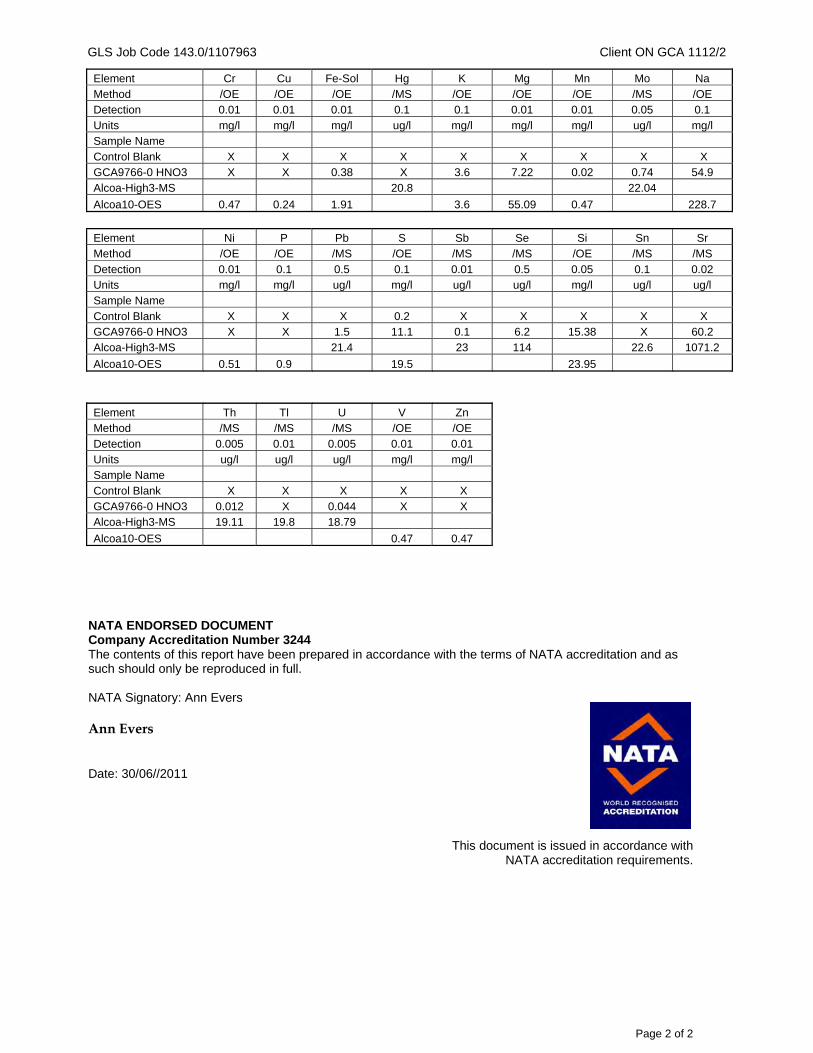
GLS Job Code 143.0/1107963 Client ON GCA 1112/2
Page 2 of 2
Element Cr Cu Fe-Sol Hg K Mg Mn Mo Na Method /OE /OE /OE /MS /OE /OE /OE /MS /OE Detection 0.01 0.01 0.01 0.1 0.1 0.01 0.01 0.05 0.1 Units mg/l mg/l mg/l ug/l mg/l mg/l mg/l ug/l mg/l Sample Name Control Blank X X X X X X X X X GCA9766-0 HNO3 X X 0.38 X 3.6 7.22 0.02 0.74 54.9 Alcoa-High3-MS 20.8 22.04
Alcoa10-OES 0.47 0.24 1.91 3.6 55.09 0.47 228.7
Element Ni P Pb S Sb Se Si Sn Sr Method /OE /OE /MS /OE /MS /MS /OE /MS /MS
Detection 0.01 0.1 0.5 0.1 0.01 0.5 0.05 0.1 0.02 Units mg/l mg/l ug/l mg/l ug/l ug/l mg/l ug/l ug/l Sample Name
Control Blank X X X 0.2 X X X X X GCA9766-0 HNO3 X X 1.5 11.1 0.1 6.2 15.38 X 60.2 Alcoa-High3-MS 21.4 23 114 22.6 1071.2
Alcoa10-OES 0.51 0.9 19.5 23.95
Element Th Tl U V Zn Method /MS /MS /MS /OE /OE
Detection 0.005 0.01 0.005 0.01 0.01 Units ug/l ug/l ug/l mg/l mg/l Sample Name
Control Blank X X X X X GCA9766-0 HNO3 0.012 X 0.044 X X Alcoa-High3-MS 19.11 19.8 18.79
Alcoa10-OES 0.47 0.47 NATA ENDORSED DOCUMENT Company Accreditation Number 3244 The contents of this report have been prepared in accordance with the terms of NATA accreditation and as such should only be reproduced in full. NATA Signatory: Ann Evers Ann Evers Date: 30/06//2011
This document is issued in accordance with NATA accreditation requirements.
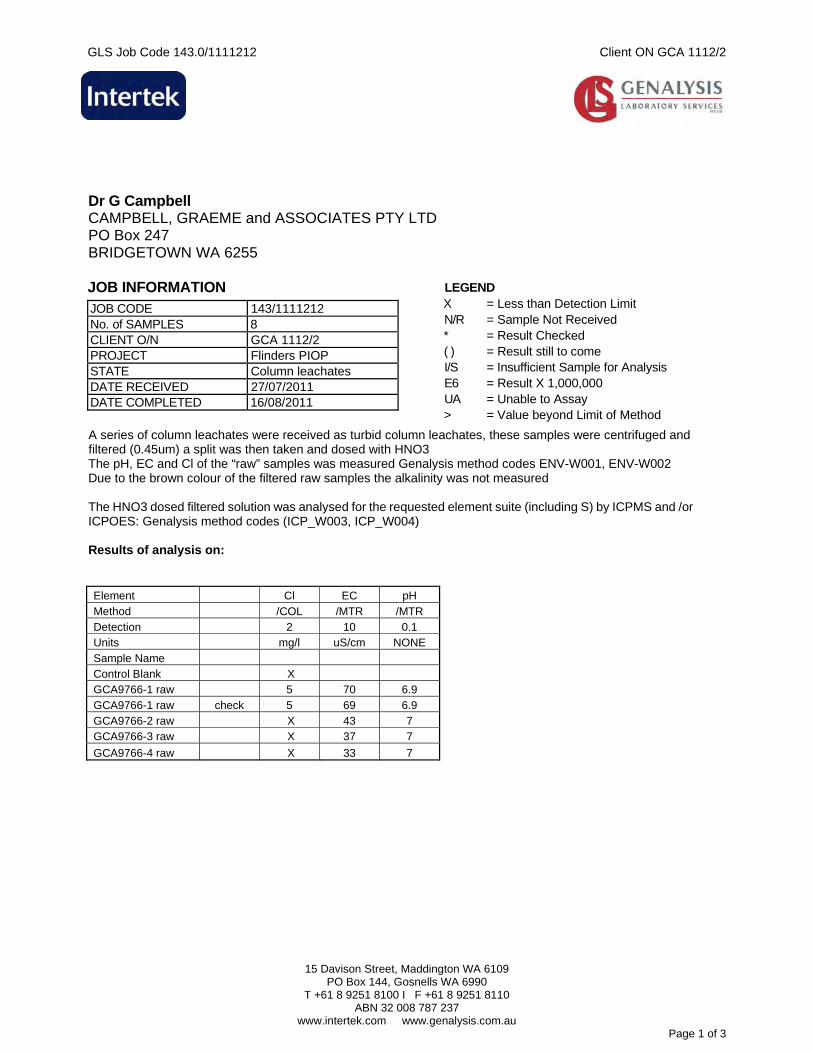
GLS Job Code 143.0/1111212 Client ON GCA 1112/2
15 Davison Street, Maddington WA 6109
PO Box 144, Gosnells WA 6990 T +61 8 9251 8100 I F +61 8 9251 8110
ABN 32 008 787 237 www.intertek.com www.genalysis.com.au
Page 1 of 3
Dr G Campbell CAMPBELL, GRAEME and ASSOCIATES PTY LTD PO Box 247 BRIDGETOWN WA 6255 JOB INFORMATION
JOB CODE 143/1111212 No. of SAMPLES 8 CLIENT O/N GCA 1112/2 PROJECT Flinders PIOP STATE Column leachates DATE RECEIVED 27/07/2011 DATE COMPLETED 16/08/2011
LEGEND X = Less than Detection Limit N/R = Sample Not Received * = Result Checked ( ) = Result still to come I/S = Insufficient Sample for Analysis E6 = Result X 1,000,000 UA = Unable to Assay > = Value beyond Limit of Method
A series of column leachates were received as turbid column leachates, these samples were centrifuged and filtered (0.45um) a split was then taken and dosed with HNO3 The pH, EC and Cl of the “raw” samples was measured Genalysis method codes ENV-W001, ENV-W002 Due to the brown colour of the filtered raw samples the alkalinity was not measured The HNO3 dosed filtered solution was analysed for the requested element suite (including S) by ICPMS and /or ICPOES: Genalysis method codes (ICP_W003, ICP_W004) Results of analysis on: Element Cl EC pH
Method /COL /MTR /MTR Detection 2 10 0.1 Units mg/l uS/cm NONE
Sample Name Control Blank X GCA9766-1 raw 5 70 6.9
GCA9766-1 raw check 5 69 6.9 GCA9766-2 raw X 43 7 GCA9766-3 raw X 37 7
GCA9766-4 raw X 33 7
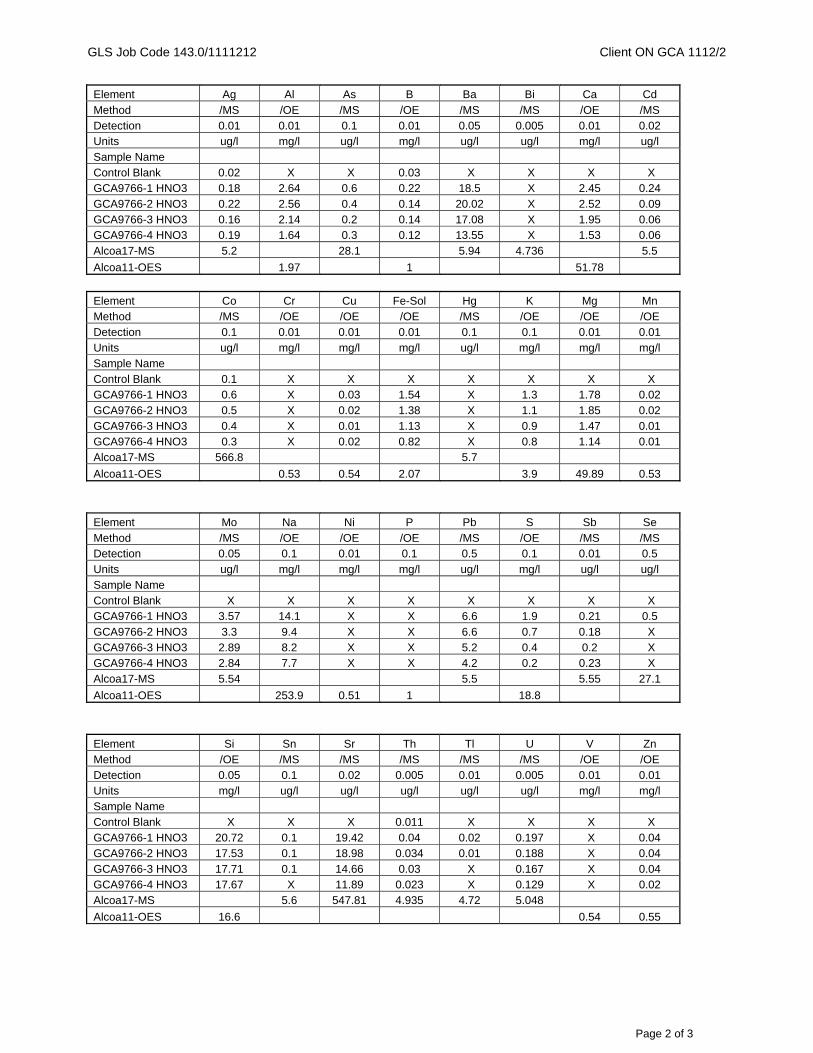
GLS Job Code 143.0/1111212 Client ON GCA 1112/2
Page 2 of 3
Element Ag Al As B Ba Bi Ca Cd
Method /MS /OE /MS /OE /MS /MS /OE /MS Detection 0.01 0.01 0.1 0.01 0.05 0.005 0.01 0.02 Units ug/l mg/l ug/l mg/l ug/l ug/l mg/l ug/l
Sample Name Control Blank 0.02 X X 0.03 X X X X GCA9766-1 HNO3 0.18 2.64 0.6 0.22 18.5 X 2.45 0.24
GCA9766-2 HNO3 0.22 2.56 0.4 0.14 20.02 X 2.52 0.09 GCA9766-3 HNO3 0.16 2.14 0.2 0.14 17.08 X 1.95 0.06 GCA9766-4 HNO3 0.19 1.64 0.3 0.12 13.55 X 1.53 0.06
Alcoa17-MS 5.2 28.1 5.94 4.736 5.5
Alcoa11-OES 1.97 1 51.78
Element Co Cr Cu Fe-Sol Hg K Mg Mn Method /MS /OE /OE /OE /MS /OE /OE /OE Detection 0.1 0.01 0.01 0.01 0.1 0.1 0.01 0.01 Units ug/l mg/l mg/l mg/l ug/l mg/l mg/l mg/l Sample Name Control Blank 0.1 X X X X X X X GCA9766-1 HNO3 0.6 X 0.03 1.54 X 1.3 1.78 0.02 GCA9766-2 HNO3 0.5 X 0.02 1.38 X 1.1 1.85 0.02 GCA9766-3 HNO3 0.4 X 0.01 1.13 X 0.9 1.47 0.01 GCA9766-4 HNO3 0.3 X 0.02 0.82 X 0.8 1.14 0.01 Alcoa17-MS 566.8 5.7
Alcoa11-OES 0.53 0.54 2.07 3.9 49.89 0.53
Element Mo Na Ni P Pb S Sb Se
Method /MS /OE /OE /OE /MS /OE /MS /MS Detection 0.05 0.1 0.01 0.1 0.5 0.1 0.01 0.5 Units ug/l mg/l mg/l mg/l ug/l mg/l ug/l ug/l
Sample Name Control Blank X X X X X X X X GCA9766-1 HNO3 3.57 14.1 X X 6.6 1.9 0.21 0.5
GCA9766-2 HNO3 3.3 9.4 X X 6.6 0.7 0.18 X GCA9766-3 HNO3 2.89 8.2 X X 5.2 0.4 0.2 X GCA9766-4 HNO3 2.84 7.7 X X 4.2 0.2 0.23 X
Alcoa17-MS 5.54 5.5 5.55 27.1
Alcoa11-OES 253.9 0.51 1 18.8
Element Si Sn Sr Th Tl U V Zn Method /OE /MS /MS /MS /MS /MS /OE /OE Detection 0.05 0.1 0.02 0.005 0.01 0.005 0.01 0.01 Units mg/l ug/l ug/l ug/l ug/l ug/l mg/l mg/l Sample Name Control Blank X X X 0.011 X X X X GCA9766-1 HNO3 20.72 0.1 19.42 0.04 0.02 0.197 X 0.04 GCA9766-2 HNO3 17.53 0.1 18.98 0.034 0.01 0.188 X 0.04 GCA9766-3 HNO3 17.71 0.1 14.66 0.03 X 0.167 X 0.04 GCA9766-4 HNO3 17.67 X 11.89 0.023 X 0.129 X 0.02 Alcoa17-MS 5.6 547.81 4.935 4.72 5.048
Alcoa11-OES 16.6 0.54 0.55
GLS Job Code 143.0/1111212 Client ON GCA 1112/2
Page 3 of 3
NATA ENDORSED DOCUMENT Company Accreditation Number 3244 The contents of this report have been prepared in accordance with the terms of NATA accreditation and as such should only be reproduced in full. NATA Signatory: Ann Evers Ann Evers Date: 16/08//2011
This document is issued in accordance with NATA accreditation requirements.
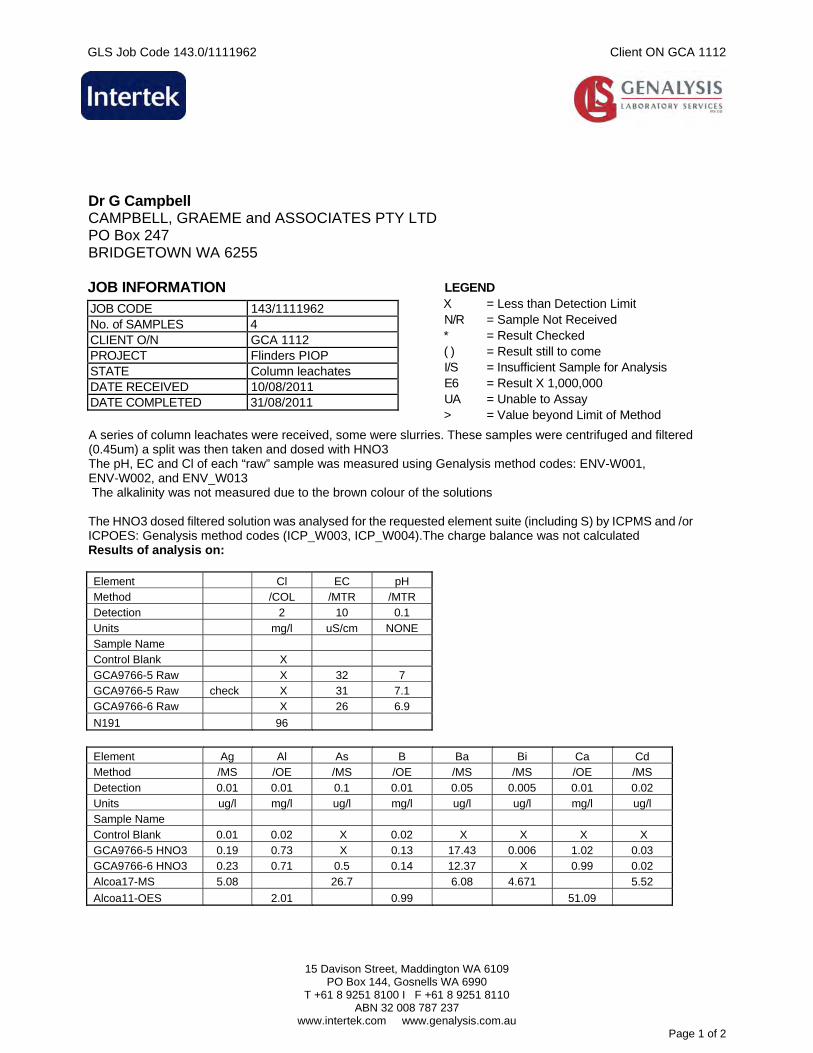
GLS Job Code 143.0/1111962 Client ON GCA 1112
15 Davison Street, Maddington WA 6109
PO Box 144, Gosnells WA 6990 T +61 8 9251 8100 I F +61 8 9251 8110
ABN 32 008 787 237 www.intertek.com www.genalysis.com.au
Page 1 of 2
Dr G Campbell CAMPBELL, GRAEME and ASSOCIATES PTY LTD PO Box 247 BRIDGETOWN WA 6255 JOB INFORMATION
JOB CODE 143/1111962 No. of SAMPLES 4 CLIENT O/N GCA 1112 PROJECT Flinders PIOP STATE Column leachates DATE RECEIVED 10/08/2011 DATE COMPLETED 31/08/2011
LEGEND X = Less than Detection Limit N/R = Sample Not Received * = Result Checked ( ) = Result still to come I/S = Insufficient Sample for Analysis E6 = Result X 1,000,000 UA = Unable to Assay > = Value beyond Limit of Method
A series of column leachates were received, some were slurries. These samples were centrifuged and filtered (0.45um) a split was then taken and dosed with HNO3 The pH, EC and Cl of each “raw” sample was measured using Genalysis method codes: ENV-W001, ENV-W002, and ENV_W013 The alkalinity was not measured due to the brown colour of the solutions The HNO3 dosed filtered solution was analysed for the requested element suite (including S) by ICPMS and /or ICPOES: Genalysis method codes (ICP_W003, ICP_W004).The charge balance was not calculated Results of analysis on: Element Cl EC pH Method /COL /MTR /MTR Detection 2 10 0.1
Units mg/l uS/cm NONE Sample Name Control Blank X
GCA9766-5 Raw X 32 7 GCA9766-5 Raw check X 31 7.1 GCA9766-6 Raw X 26 6.9
N191 96
Element Ag Al As B Ba Bi Ca Cd Method /MS /OE /MS /OE /MS /MS /OE /MS
Detection 0.01 0.01 0.1 0.01 0.05 0.005 0.01 0.02 Units ug/l mg/l ug/l mg/l ug/l ug/l mg/l ug/l Sample Name
Control Blank 0.01 0.02 X 0.02 X X X X GCA9766-5 HNO3 0.19 0.73 X 0.13 17.43 0.006 1.02 0.03 GCA9766-6 HNO3 0.23 0.71 0.5 0.14 12.37 X 0.99 0.02
Alcoa17-MS 5.08 26.7 6.08 4.671 5.52
Alcoa11-OES 2.01 0.99 51.09
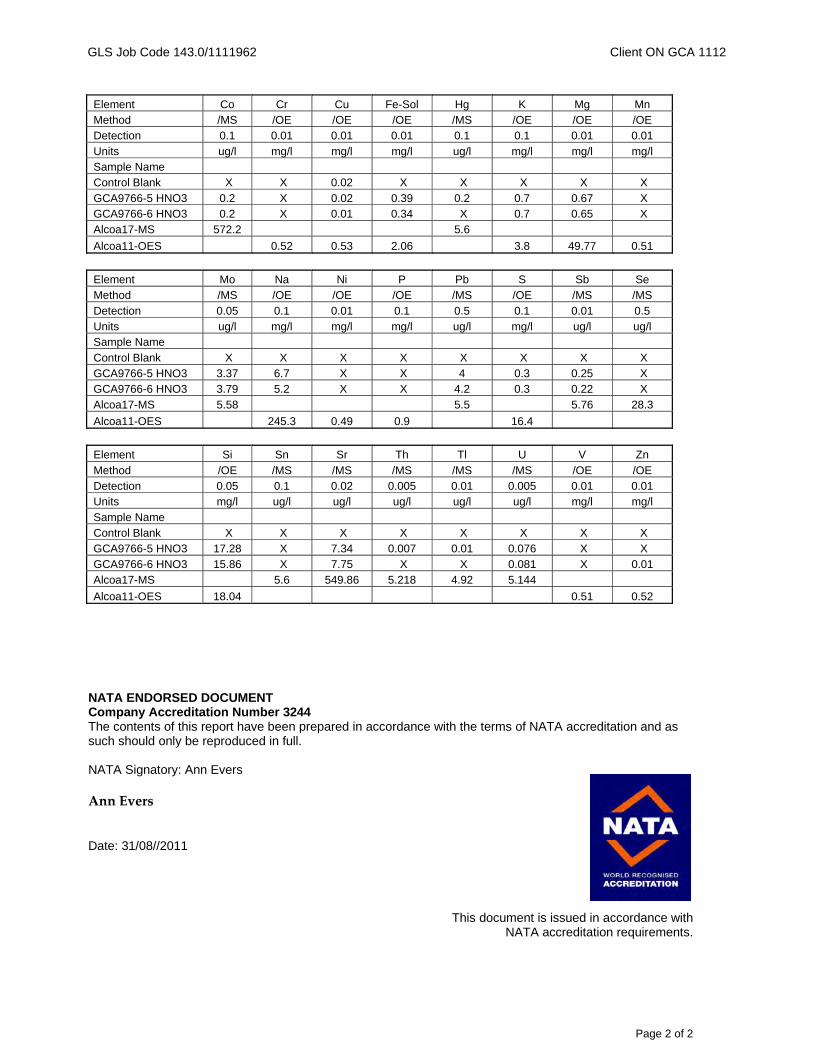
GLS Job Code 143.0/1111962 Client ON GCA 1112
Page 2 of 2
Element Co Cr Cu Fe-Sol Hg K Mg Mn Method /MS /OE /OE /OE /MS /OE /OE /OE Detection 0.1 0.01 0.01 0.01 0.1 0.1 0.01 0.01
Units ug/l mg/l mg/l mg/l ug/l mg/l mg/l mg/l Sample Name Control Blank X X 0.02 X X X X X
GCA9766-5 HNO3 0.2 X 0.02 0.39 0.2 0.7 0.67 X GCA9766-6 HNO3 0.2 X 0.01 0.34 X 0.7 0.65 X Alcoa17-MS 572.2 5.6
Alcoa11-OES 0.52 0.53 2.06 3.8 49.77 0.51
Element Mo Na Ni P Pb S Sb Se Method /MS /OE /OE /OE /MS /OE /MS /MS
Detection 0.05 0.1 0.01 0.1 0.5 0.1 0.01 0.5 Units ug/l mg/l mg/l mg/l ug/l mg/l ug/l ug/l Sample Name
Control Blank X X X X X X X X GCA9766-5 HNO3 3.37 6.7 X X 4 0.3 0.25 X GCA9766-6 HNO3 3.79 5.2 X X 4.2 0.3 0.22 X
Alcoa17-MS 5.58 5.5 5.76 28.3
Alcoa11-OES 245.3 0.49 0.9 16.4
Element Si Sn Sr Th Tl U V Zn
Method /OE /MS /MS /MS /MS /MS /OE /OE Detection 0.05 0.1 0.02 0.005 0.01 0.005 0.01 0.01 Units mg/l ug/l ug/l ug/l ug/l ug/l mg/l mg/l
Sample Name Control Blank X X X X X X X X GCA9766-5 HNO3 17.28 X 7.34 0.007 0.01 0.076 X X GCA9766-6 HNO3 15.86 X 7.75 X X 0.081 X 0.01 Alcoa17-MS 5.6 549.86 5.218 4.92 5.144
Alcoa11-OES 18.04 0.51 0.52 NATA ENDORSED DOCUMENT Company Accreditation Number 3244 The contents of this report have been prepared in accordance with the terms of NATA accreditation and as such should only be reproduced in full. NATA Signatory: Ann Evers Ann Evers Date: 31/08//2011
This document is issued in accordance with NATA accreditation requirements.
FLINDERS MINES LIMITED
GEOCHEMICAL CHARACTERISATION OF MINE WASTE AND TAILINGS
IMPLICATIONS FOR MINE WASTE MANAGEMENT
i:\projects\201012-00322 fms vip\2.0 reports\geochem report\201012-00322 fms waste rock management_rev0..doc Page 15 201012-00322 :0000-EN-REP-0011Rev 0 : 20 July 2012
APPENDIX C
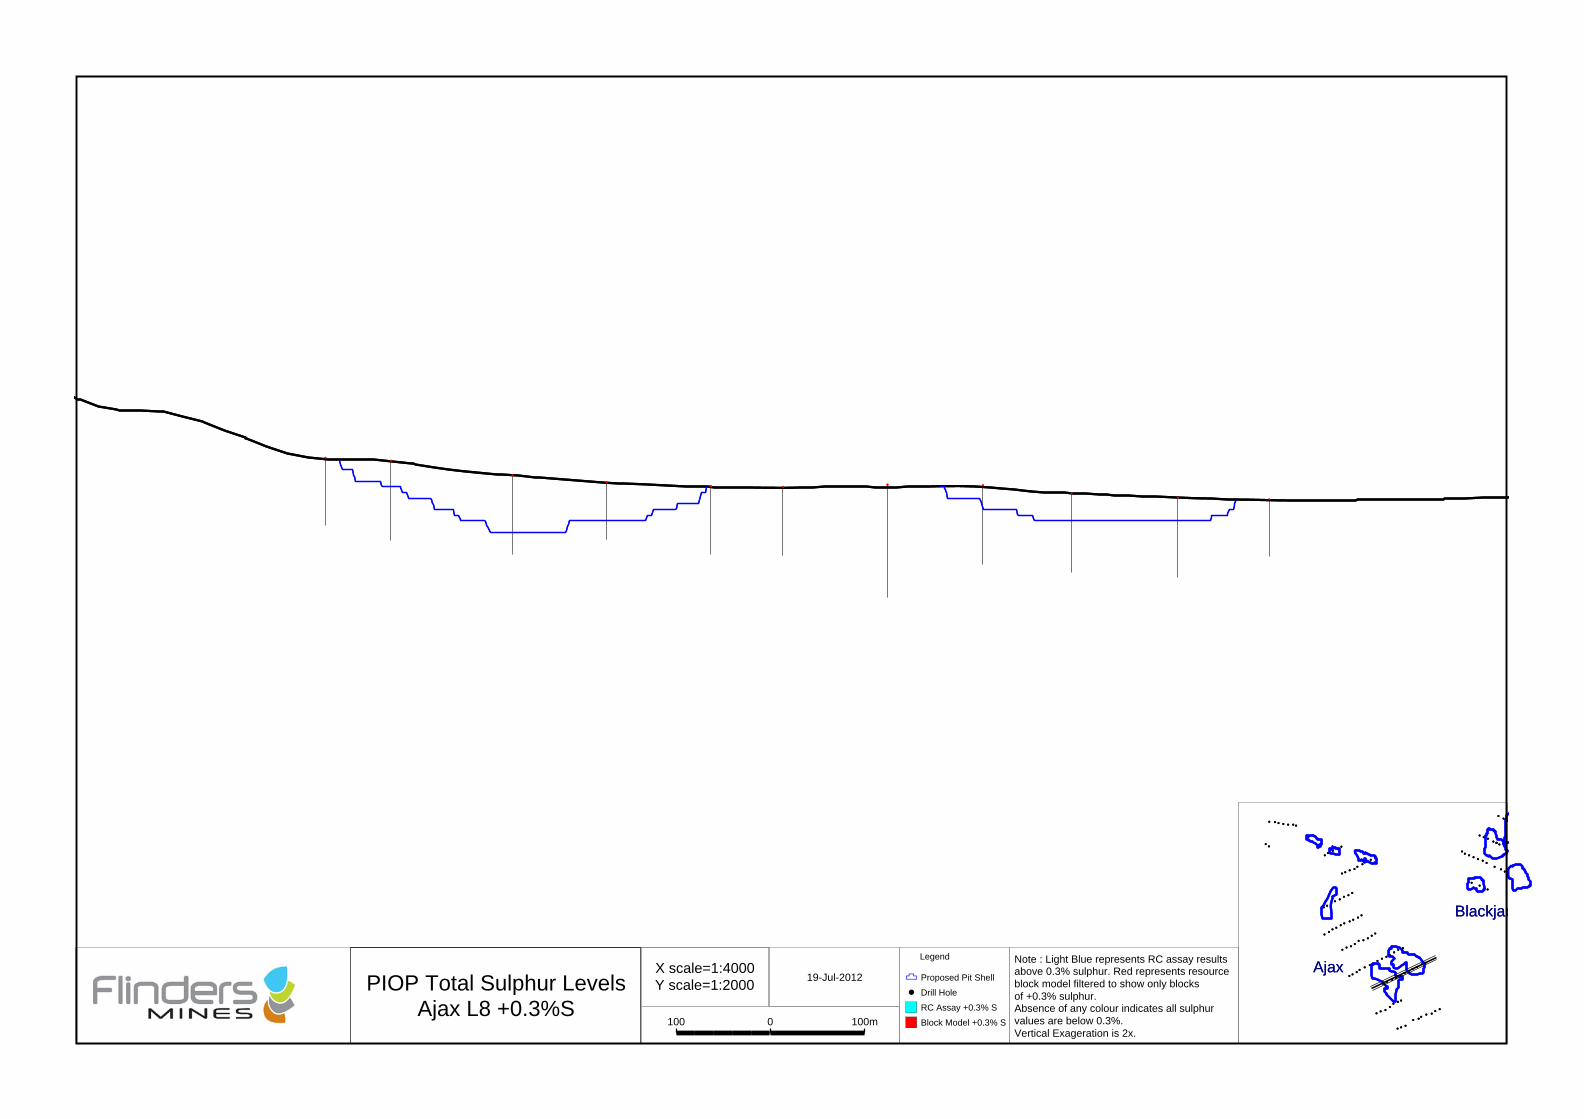
{
{
{{
{
{
{
{
{
{
{
{
{
{
{
{{
{
{
{
{
{
{
{
{
{
{{
{{
{{
{
{{
{{
{{
{{
{ {{
{{
{{
{{
{{
{{
{{
{
{{
{{{
{
{{
{
{
{
{
{
{{
{
{{
{{
{
{{
{{
{{
{
{{
{
{{ {
{{
{{
{{
{
{{
{
{{
{
{{
{{{
{
{{{{{{{
{{
Blackjac
Ajax
{
{
{{
{
{
{
{
{
{
{
{
{
{
{
{{
{
{
{
{
{
{
{
{
{
{{
{{
{{
{
{{
{{
{{
{{
{ {{
{{
{{
{{
{{
{{
{{
{
{{
{{{
{
{{
{
{
{
{
{
{{
{
{{
{{
{
{{
{{
{{
{
{{
{
{{ {
{{
{{
{{
{
{{
{
{{
{
{{
{{{
{
{{{{{{{
{{
Blackjac
AjaxPIOP Total Sulphur Levels
Ajax L8 +0.3%S
X scale=1:4000Y scale=1:2000
100 100m0
19-Jul-2012
Note : Light Blue represents RC assay resultsabove 0.3% sulphur. Red represents resourceblock model filtered to show only blocksof +0.3% sulphur.Absence of any colour indicates all sulphurvalues are below 0.3%.Vertical Exageration is 2x.
Legend
1 Proposed Pit Shell
Drill Hole
RC Assay +0.3% S
Block Model +0.3% S
{
{{ {
{ {
{
{
{ {
{
{
{{ {
{ {
{
{
{ {
{
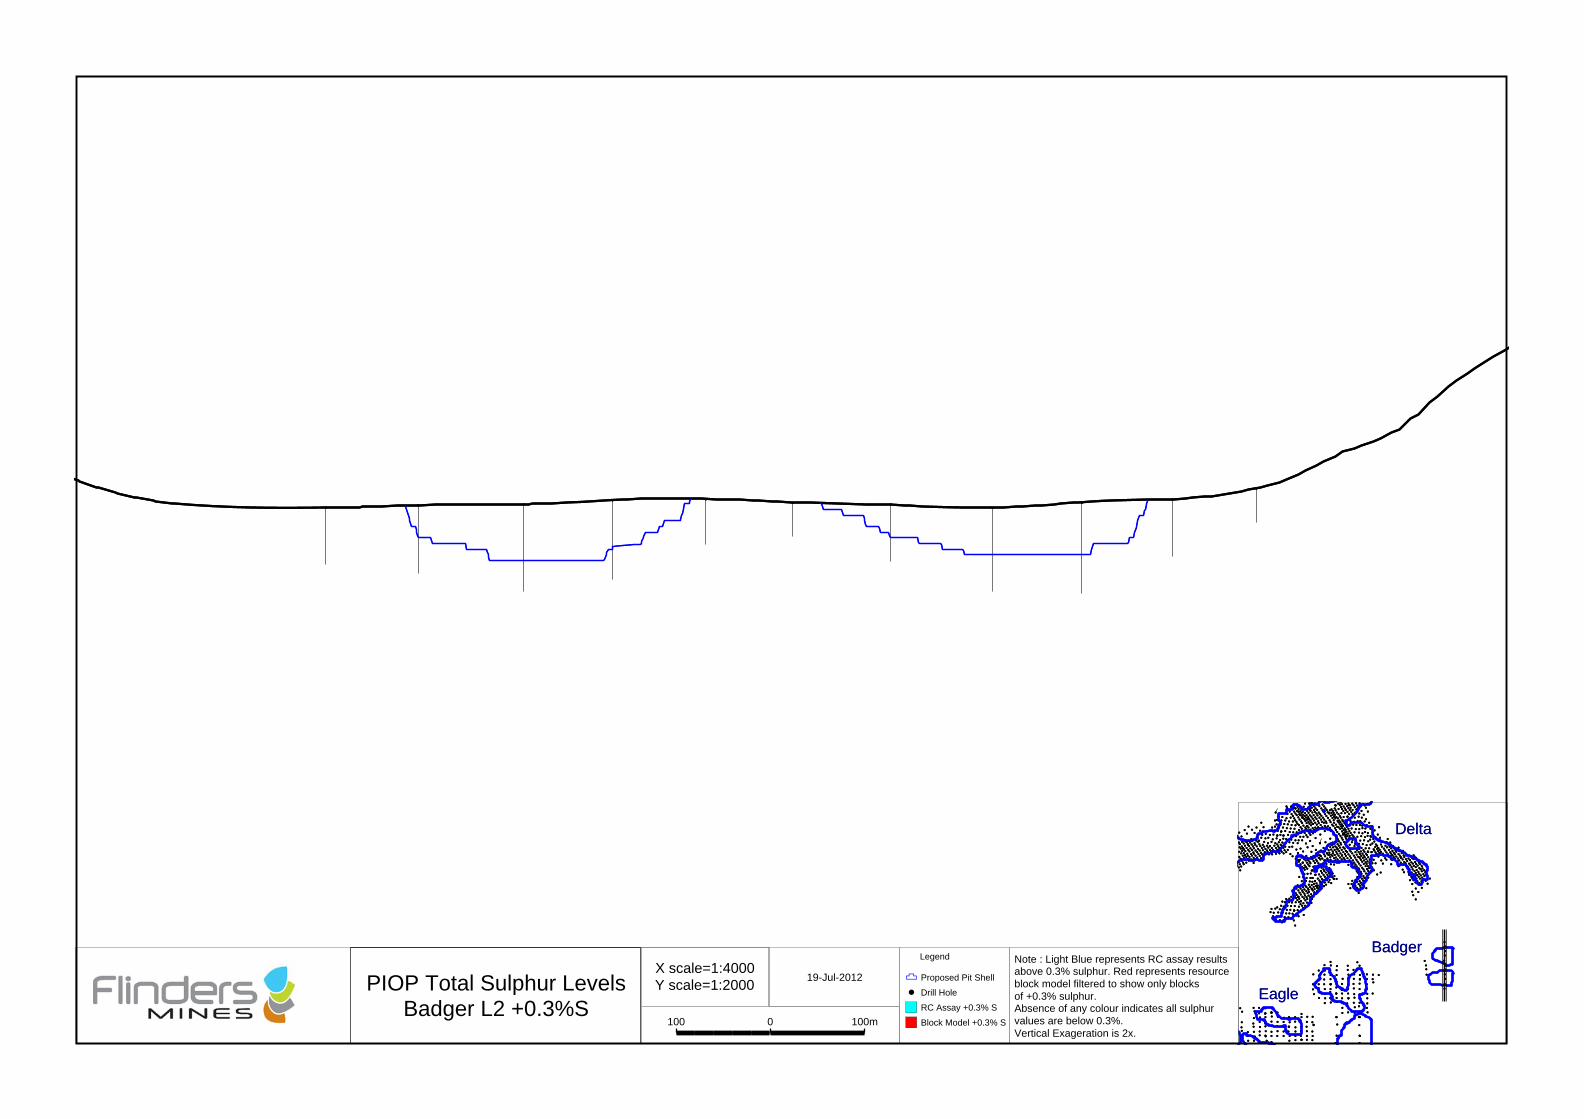
{
{
{
{
{
{
{{
{
{{
{
{
{{
{
{
{
{{
{
{
{
{
{
{
{
{
{
{{
{
{
{
{
{{
{
{
{
{
{
{
{
{
{
{
{
{
{
{{{{
{
{
{
{{
{
{{{{{{{{{{
{{{{{
{{{{{{{{{
{{{
{ {
{
{{{{{{{{{
{{{{{
{
{{{
{{{{{{{
{{
{{
{{{{{{{{
{
{{{{{{
{
{{ {
{
{{{ {
{{{
{{{{{
{{
{{{
{{{
{
{
{{{{{
{
{{{{{{{{{
{{{
{{{{
{{{{{
{
{{{{{{
{
{
{
{
{
{{
{
{{{{{{{{{{{
{{{{
Delta
Eagle
Badger
{
{
{
{
{
{
{{
{
{{
{
{
{{
{
{
{
{{
{
{
{
{
{
{
{
{
{
{{
{
{
{
{
{{
{
{
{
{
{
{
{
{
{
{
{
{
{
{{{{
{
{
{
{{
{
{{{{{{{{{{
{{{{{
{{{{{{{{{
{{{
{ {
{
{{{{{{{{{
{{{{{
{
{{{
{{{{{{{
{{
{{
{{{{{{{{
{
{{{{{{
{
{{ {
{
{{{ {
{{{
{{{{{
{{
{{{
{{{
{
{
{{{{{
{
{{{{{{{{{
{{{
{{{{
{{{{{
{
{{{{{{
{
{
{
{
{
{{
{
{{{{{{{{{{{
{{{{
Delta
Eagle
Badger
PIOP Total Sulphur LevelsBadger L2 +0.3%S
X scale=1:4000Y scale=1:2000
100 100m0
19-Jul-2012
Note : Light Blue represents RC assay resultsabove 0.3% sulphur. Red represents resourceblock model filtered to show only blocksof +0.3% sulphur.Absence of any colour indicates all sulphurvalues are below 0.3%.Vertical Exageration is 2x.
Legend
1 Proposed Pit Shell
Drill Hole
RC Assay +0.3% S
Block Model +0.3% S
{{ {
{ {{ {
{{
{
{
{{ {
{ {{ {
{{
{
{
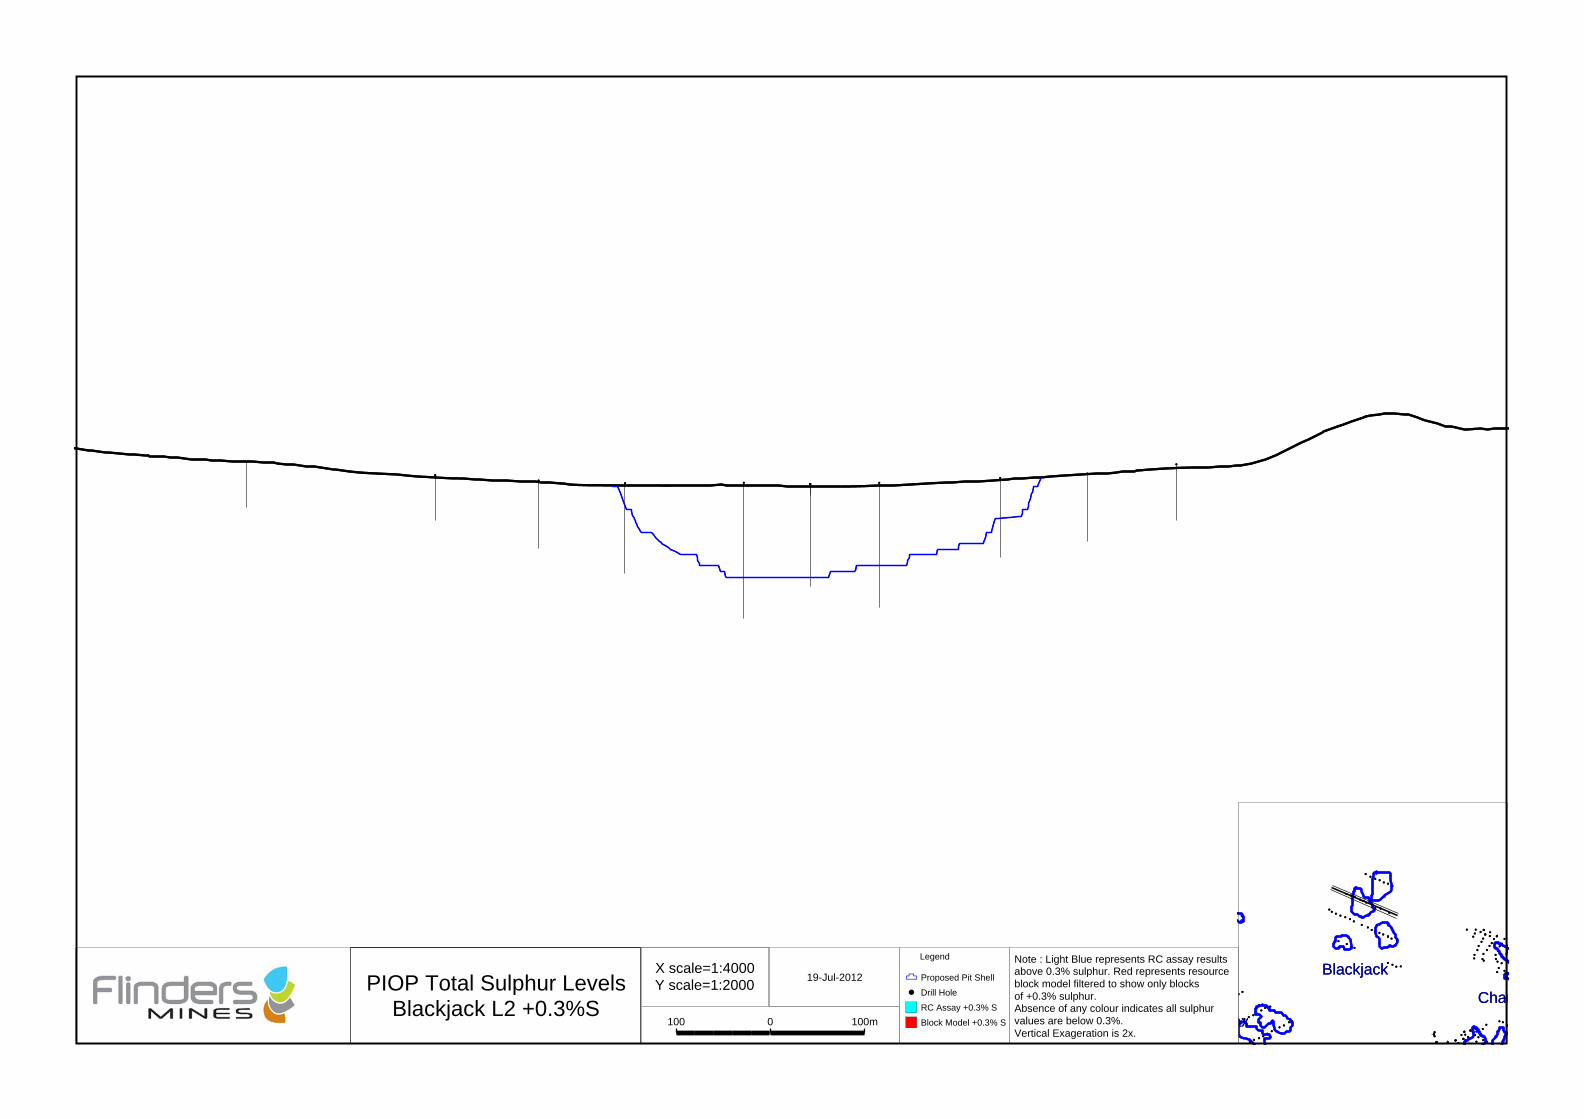
{{
{{
{
{
{
{{
{
{
{{
{
{
{
{
{
{{{
{
{
{
{{
{
{
{{
{
{{
{
{
{
{
{
{
{
{
{
{{
{
{
{{
{ {{
{{
{{
{
{{
{{ {
{{
{{
Cham
Blackjack
ax
{{
{{
{
{
{
{{
{
{
{{
{
{
{
{
{
{{{
{
{
{
{{
{
{
{{
{
{{
{
{
{
{
{
{
{
{
{
{{
{
{
{{
{ {{
{{
{{
{
{{
{{ {
{{
{{
Cham
Blackjack
ax
PIOP Total Sulphur LevelsBlackjack L2 +0.3%S
X scale=1:4000Y scale=1:2000
100 100m0
19-Jul-2012
Note : Light Blue represents RC assay resultsabove 0.3% sulphur. Red represents resourceblock model filtered to show only blocksof +0.3% sulphur.Absence of any colour indicates all sulphurvalues are below 0.3%.Vertical Exageration is 2x.
Legend
1 Proposed Pit Shell
Drill Hole
RC Assay +0.3% S
Block Model +0.3% S
{
{
{
{
{
{
{
{{
{{
{
{
{
{
{
{
{
{{
{{
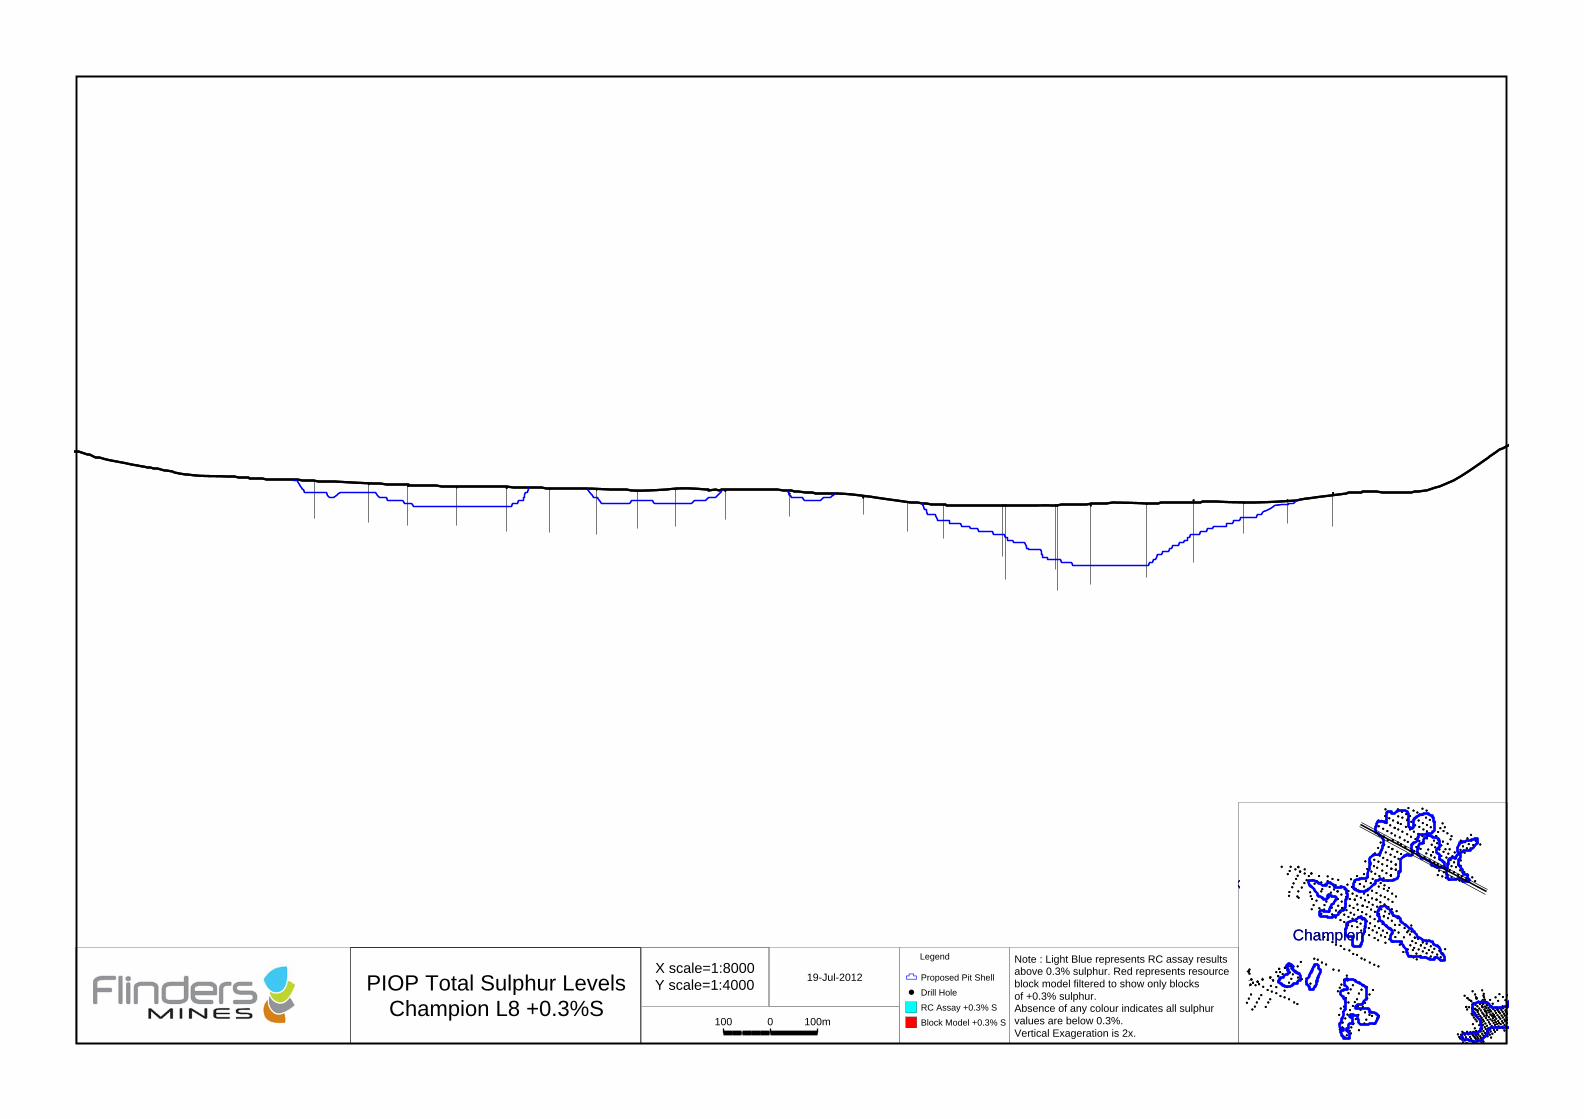
Champion
k
Champion
k
PIOP Total Sulphur LevelsChampion L8 +0.3%S
X scale=1:8000Y scale=1:4000
100 100m0
19-Jul-2012
Note : Light Blue represents RC assay resultsabove 0.3% sulphur. Red represents resourceblock model filtered to show only blocksof +0.3% sulphur.Absence of any colour indicates all sulphurvalues are below 0.3%.Vertical Exageration is 2x.
Legend
1 Proposed Pit Shell
Drill Hole
RC Assay +0.3% S
Block Model +0.3% S
{{ {
{
{
{{
{
{ { {{
{{{{{
{ {{
{{
{
{
{{ {
{
{
{{
{
{ { {{
{{{{{
{ {{
{{
{
{
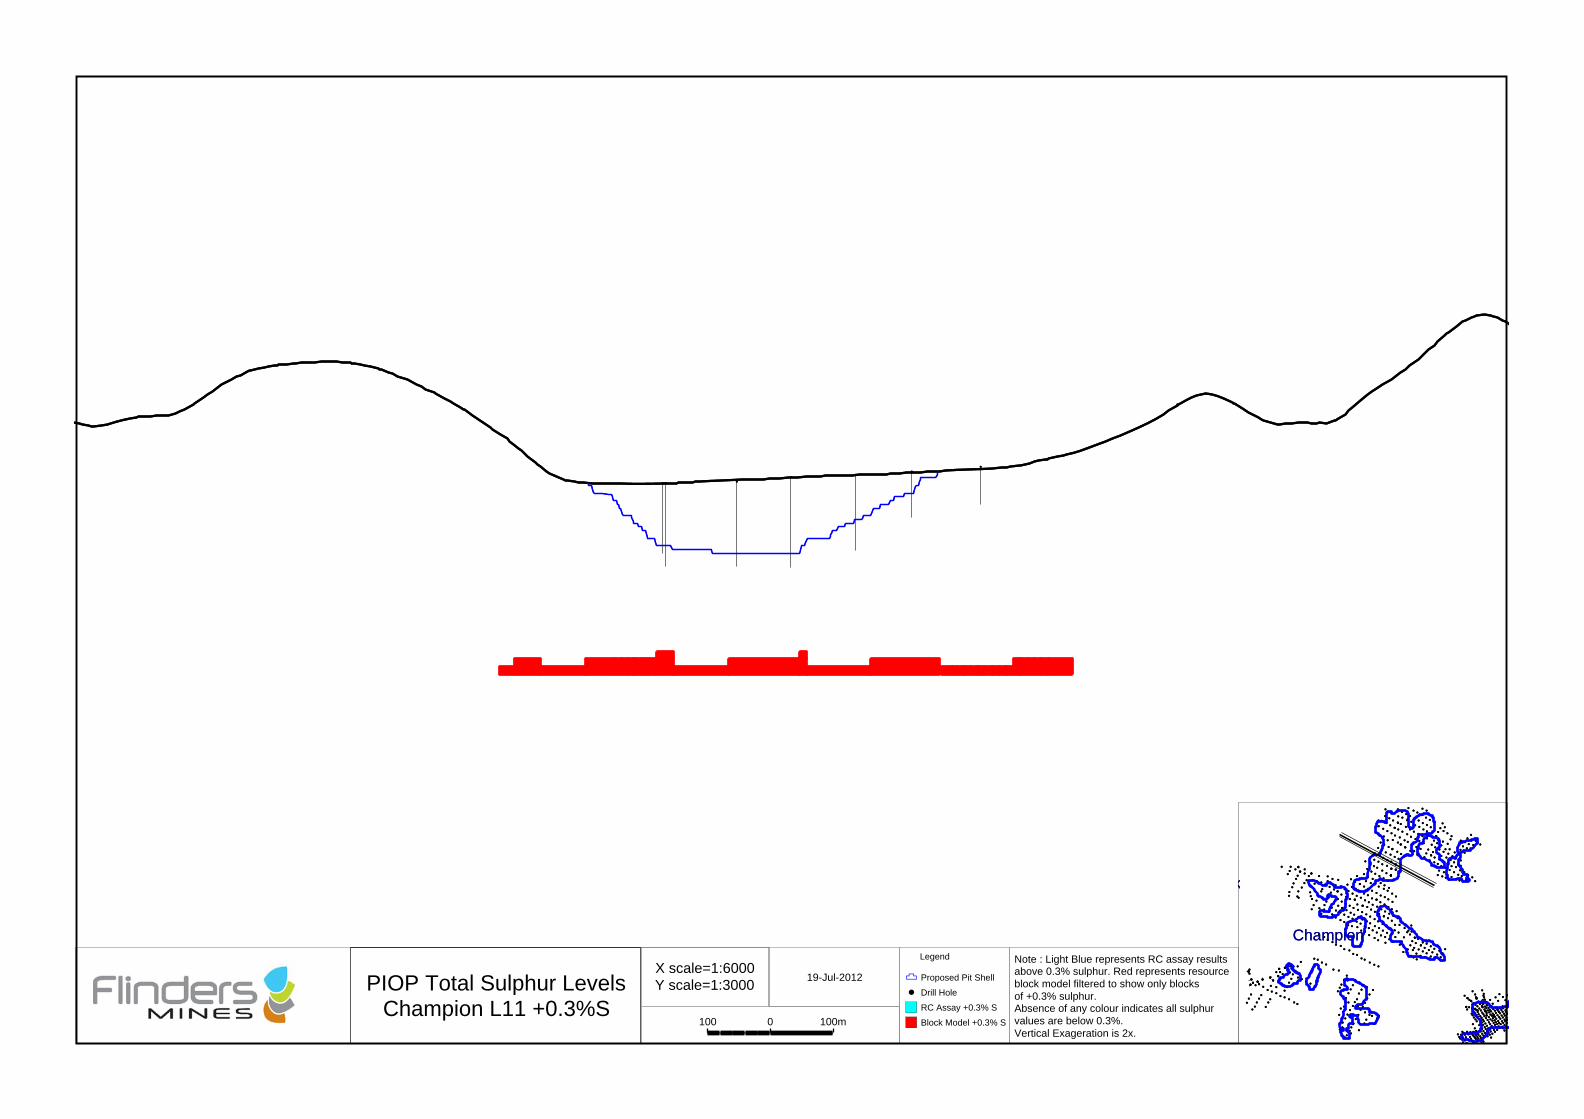
Champion
k
Champion
k
PIOP Total Sulphur LevelsChampion L11 +0.3%S
X scale=1:6000Y scale=1:3000
100 100m0
19-Jul-2012
Note : Light Blue represents RC assay resultsabove 0.3% sulphur. Red represents resourceblock model filtered to show only blocksof +0.3% sulphur.Absence of any colour indicates all sulphurvalues are below 0.3%.Vertical Exageration is 2x.
Legend
1 Proposed Pit Shell
Drill Hole
RC Assay +0.3% S
Block Model +0.3% S
{{
{{{
{{
{{
{{{
{{
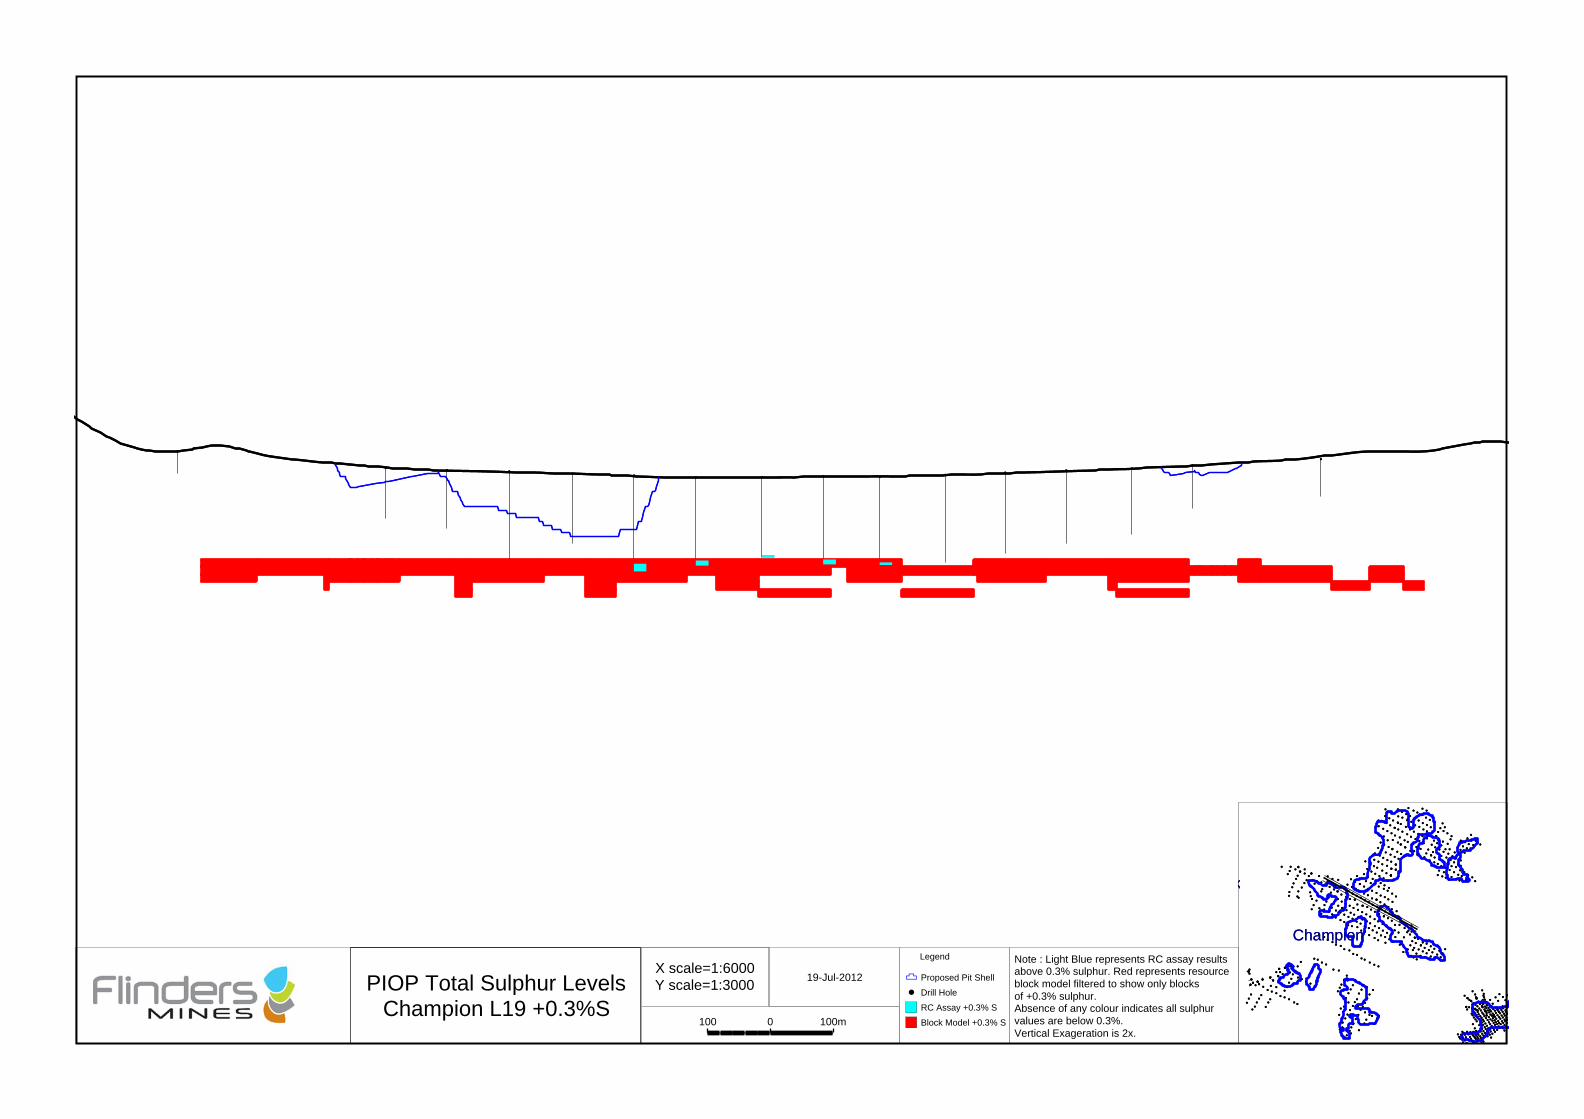
Champion
k
Champion
k
PIOP Total Sulphur LevelsChampion L19 +0.3%S
X scale=1:6000Y scale=1:3000
100 100m0
19-Jul-2012
Note : Light Blue represents RC assay resultsabove 0.3% sulphur. Red represents resourceblock model filtered to show only blocksof +0.3% sulphur.Absence of any colour indicates all sulphurvalues are below 0.3%.Vertical Exageration is 2x.
Legend
1 Proposed Pit Shell
Drill Hole
RC Assay +0.3% S
Block Model +0.3% S
{
{{{{{
{{
{
{
{{{
{
{
{
{
{{{{{
{{
{
{
{{{
{
{
{
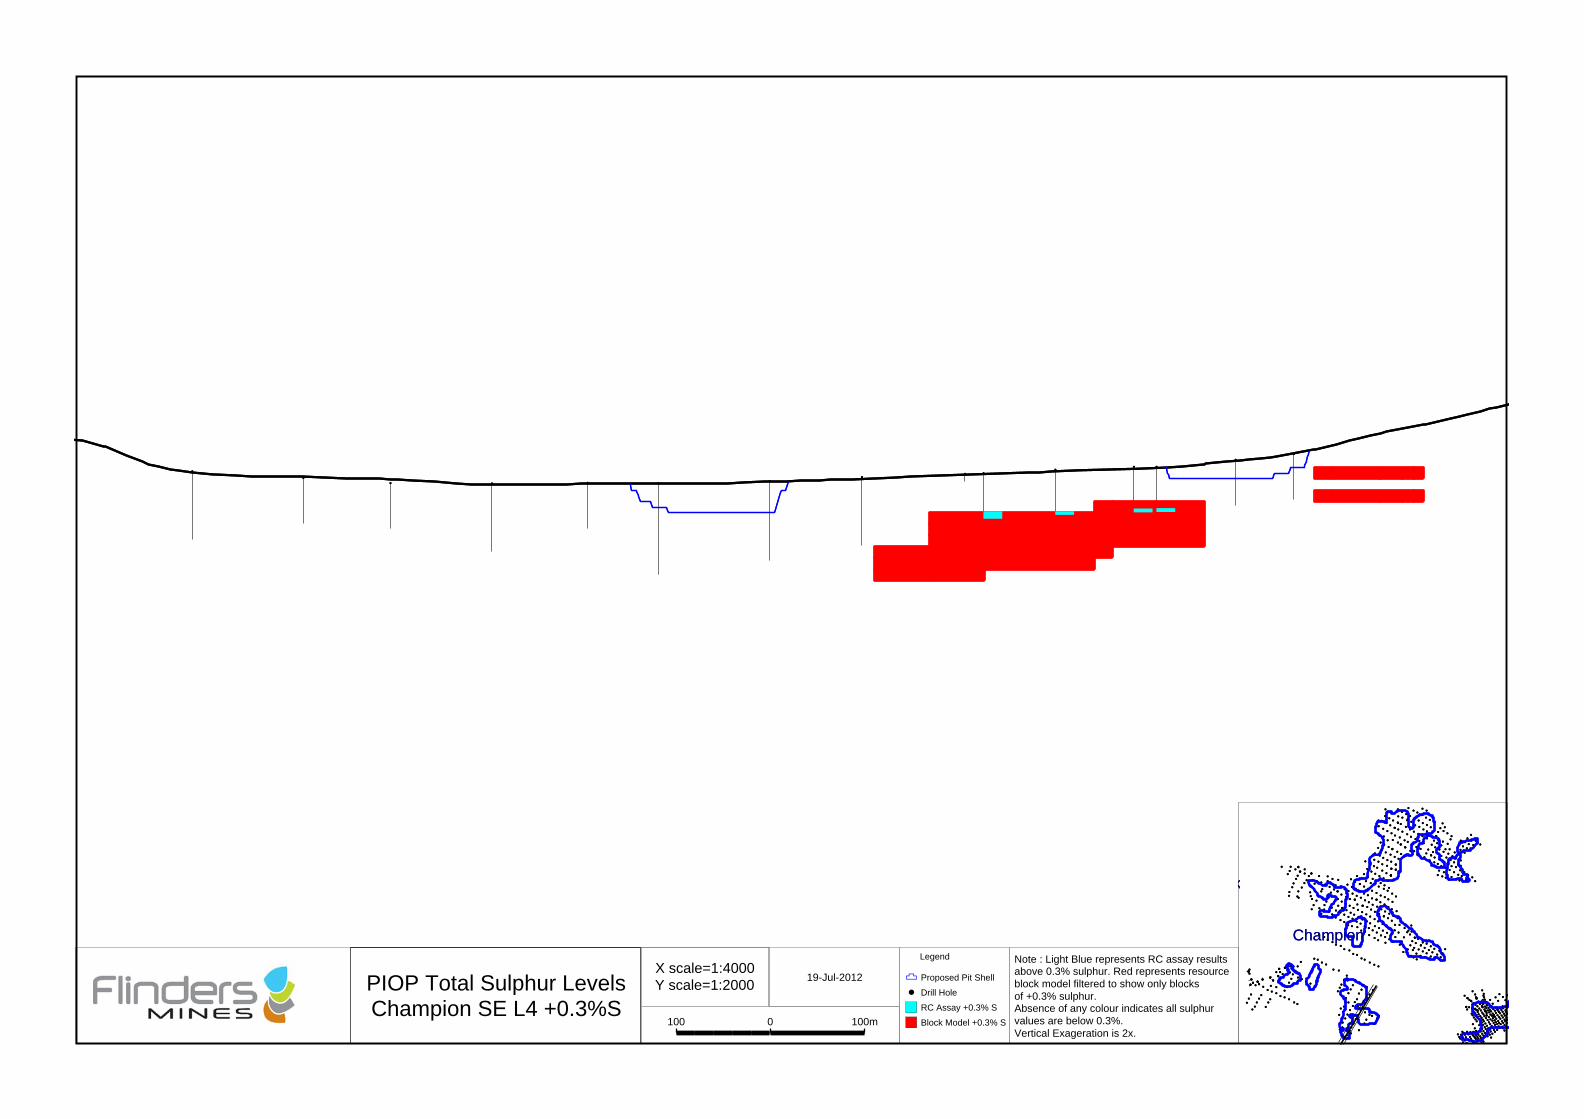
Champion
k
Champion
k
PIOP Total Sulphur LevelsChampion SE L4 +0.3%S
X scale=1:4000Y scale=1:2000
100 100m0
19-Jul-2012
Note : Light Blue represents RC assay resultsabove 0.3% sulphur. Red represents resourceblock model filtered to show only blocksof +0.3% sulphur.Absence of any colour indicates all sulphurvalues are below 0.3%.Vertical Exageration is 2x.
Legend
1 Proposed Pit Shell
Drill Hole
RC Assay +0.3% S
Block Model +0.3% S
{ { {
{{
{
{
{
{
{
{{
{
{
{
{ { {
{{
{
{
{
{
{
{{
{
{
{
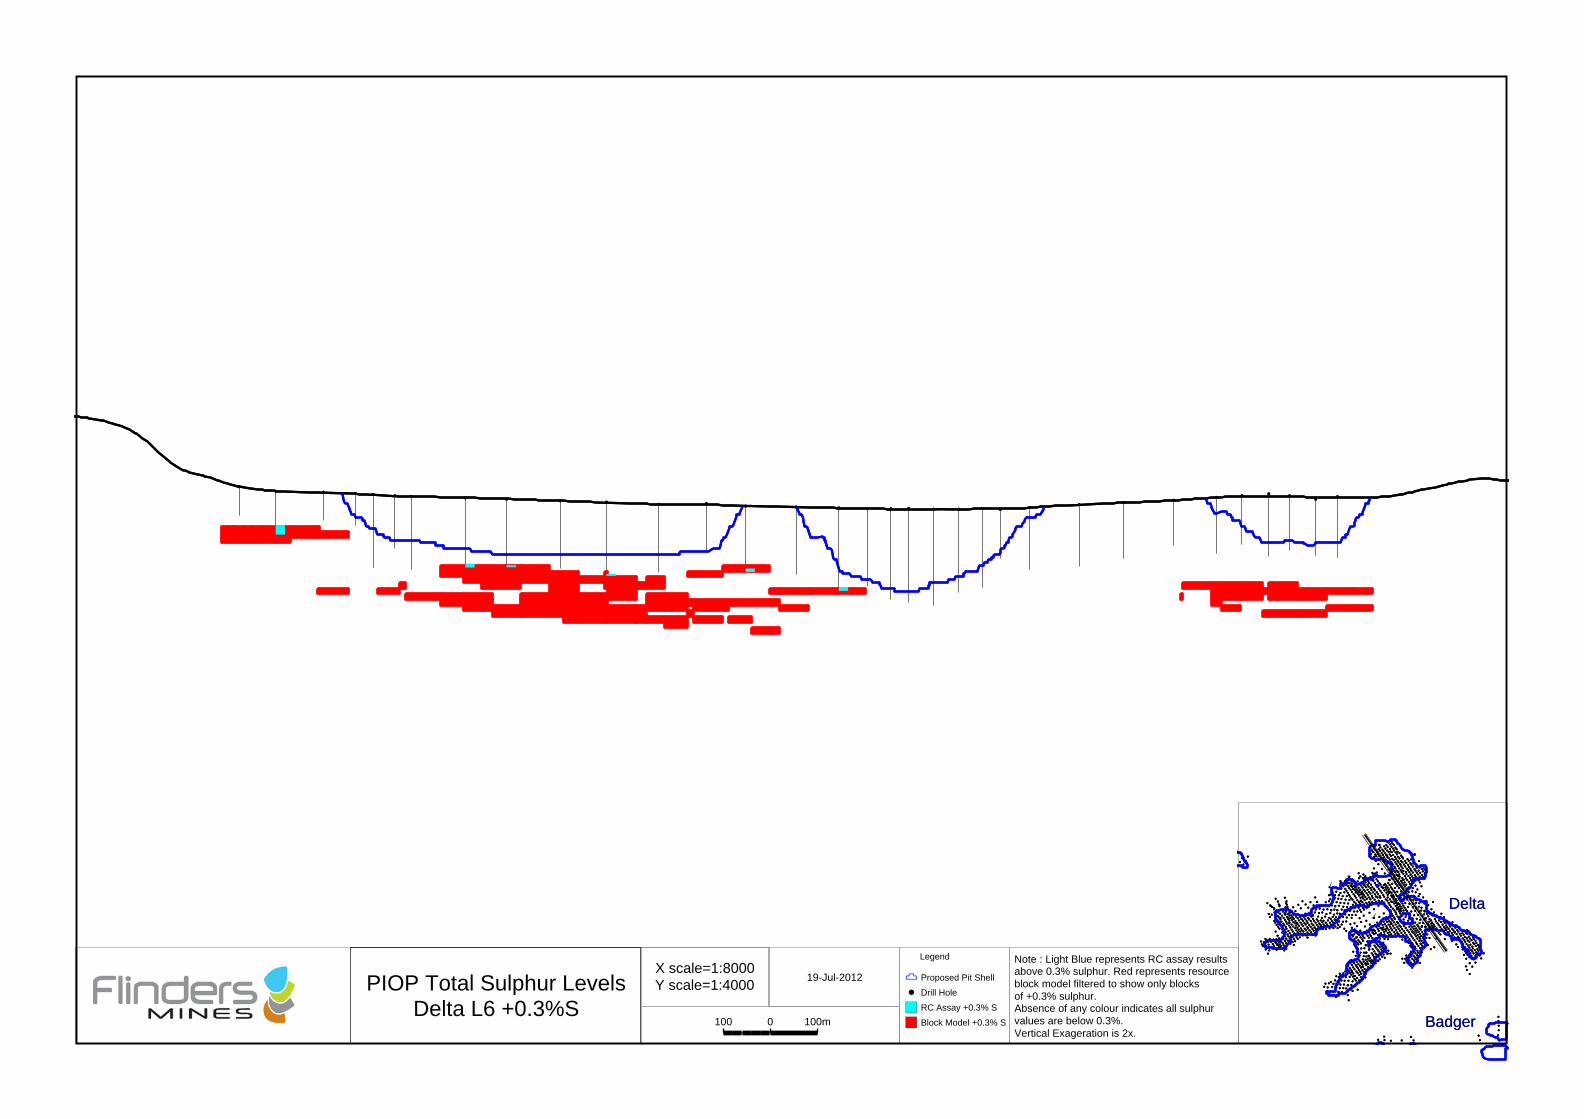
{{{
{{{ {{
{{{{{{
{{{
Delta
Badger
{{{
{{{ {{
{{{{{{
{{{
Delta
Badger
PIOP Total Sulphur LevelsDelta L6 +0.3%S
X scale=1:8000Y scale=1:4000
100 100m0
19-Jul-2012
Note : Light Blue represents RC assay resultsabove 0.3% sulphur. Red represents resourceblock model filtered to show only blocksof +0.3% sulphur.Absence of any colour indicates all sulphurvalues are below 0.3%.Vertical Exageration is 2x.
Legend
1 Proposed Pit Shell
Drill Hole
RC Assay +0.3% S
Block Model +0.3% S
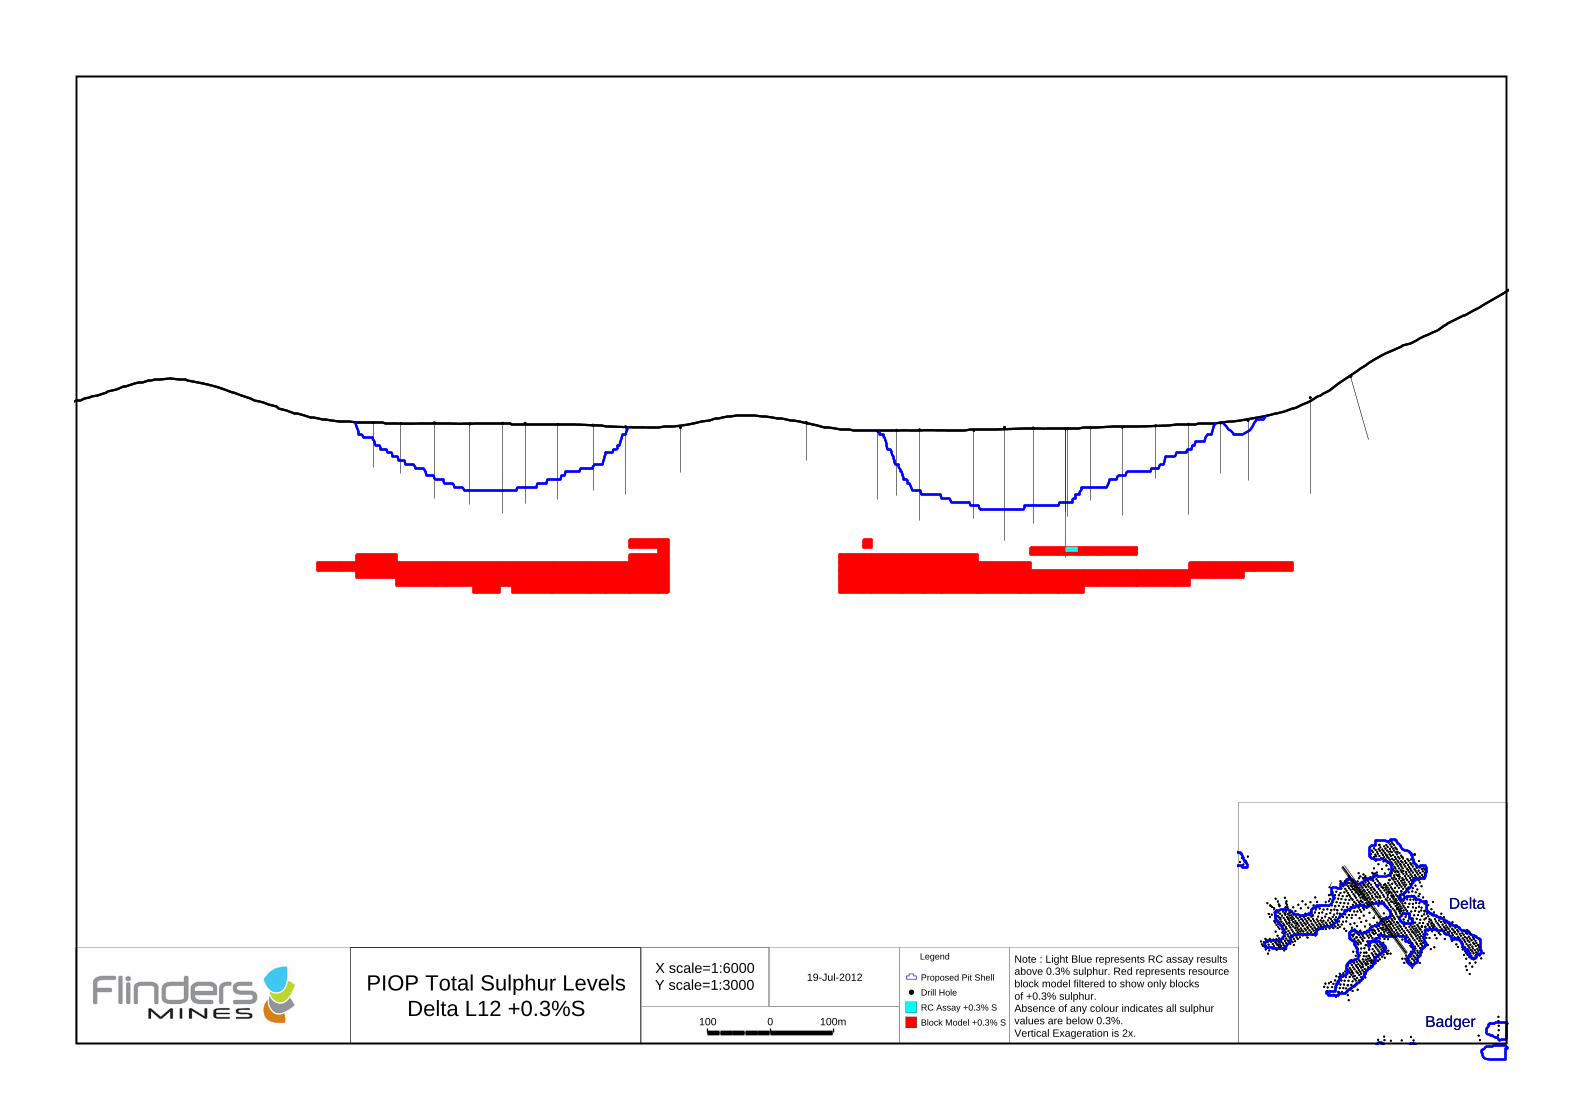
{{{
{{{ {{
{{{{{{
{{{
Delta
Badger
{{{
{{{ {{
{{{{{{
{{{
Delta
Badger
PIOP Total Sulphur LevelsDelta L12 +0.3%S
X scale=1:6000Y scale=1:3000
100 100m0
19-Jul-2012
Note : Light Blue represents RC assay resultsabove 0.3% sulphur. Red represents resourceblock model filtered to show only blocksof +0.3% sulphur.Absence of any colour indicates all sulphurvalues are below 0.3%.Vertical Exageration is 2x.
Legend
1 Proposed Pit Shell
Drill Hole
RC Assay +0.3% S
Block Model +0.3% S
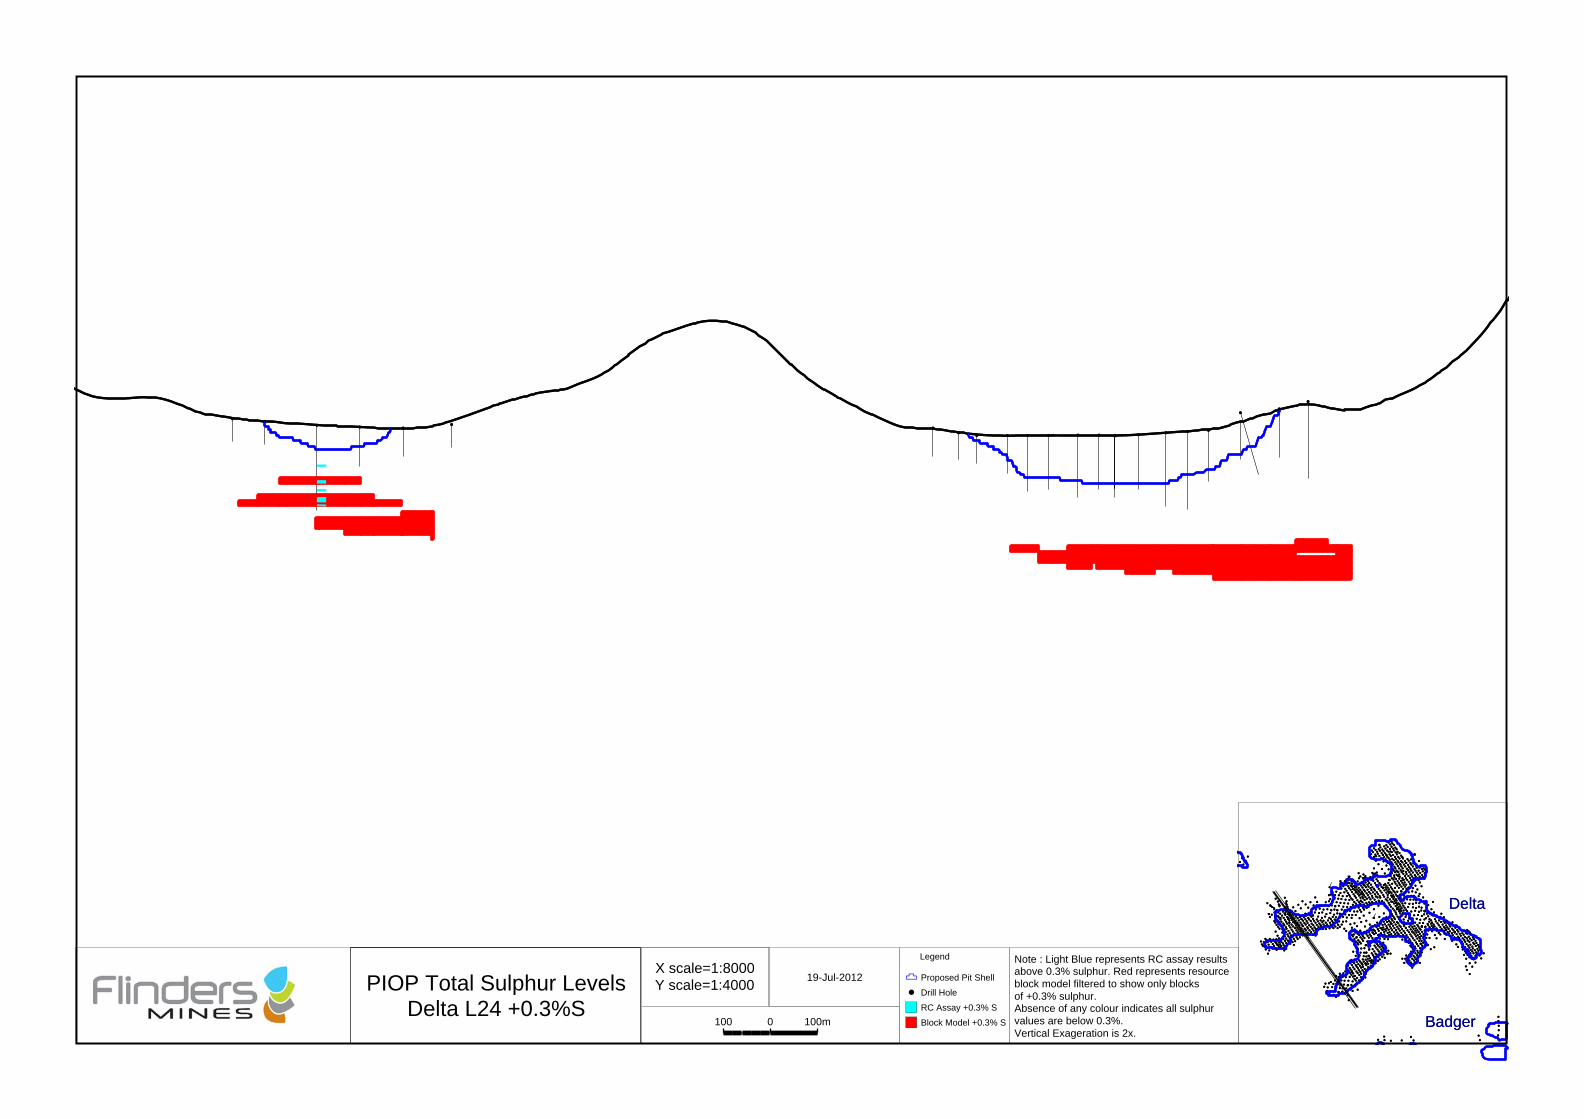
{{{
{{{ {{
{{{{{{
{{{
Delta
Badger
{{{
{{{ {{
{{{{{{
{{{
Delta
Badger
PIOP Total Sulphur LevelsDelta L24 +0.3%S
X scale=1:8000Y scale=1:4000
100 100m0
19-Jul-2012
Note : Light Blue represents RC assay resultsabove 0.3% sulphur. Red represents resourceblock model filtered to show only blocksof +0.3% sulphur.Absence of any colour indicates all sulphurvalues are below 0.3%.Vertical Exageration is 2x.
Legend
1 Proposed Pit Shell
Drill Hole
RC Assay +0.3% S
Block Model +0.3% S
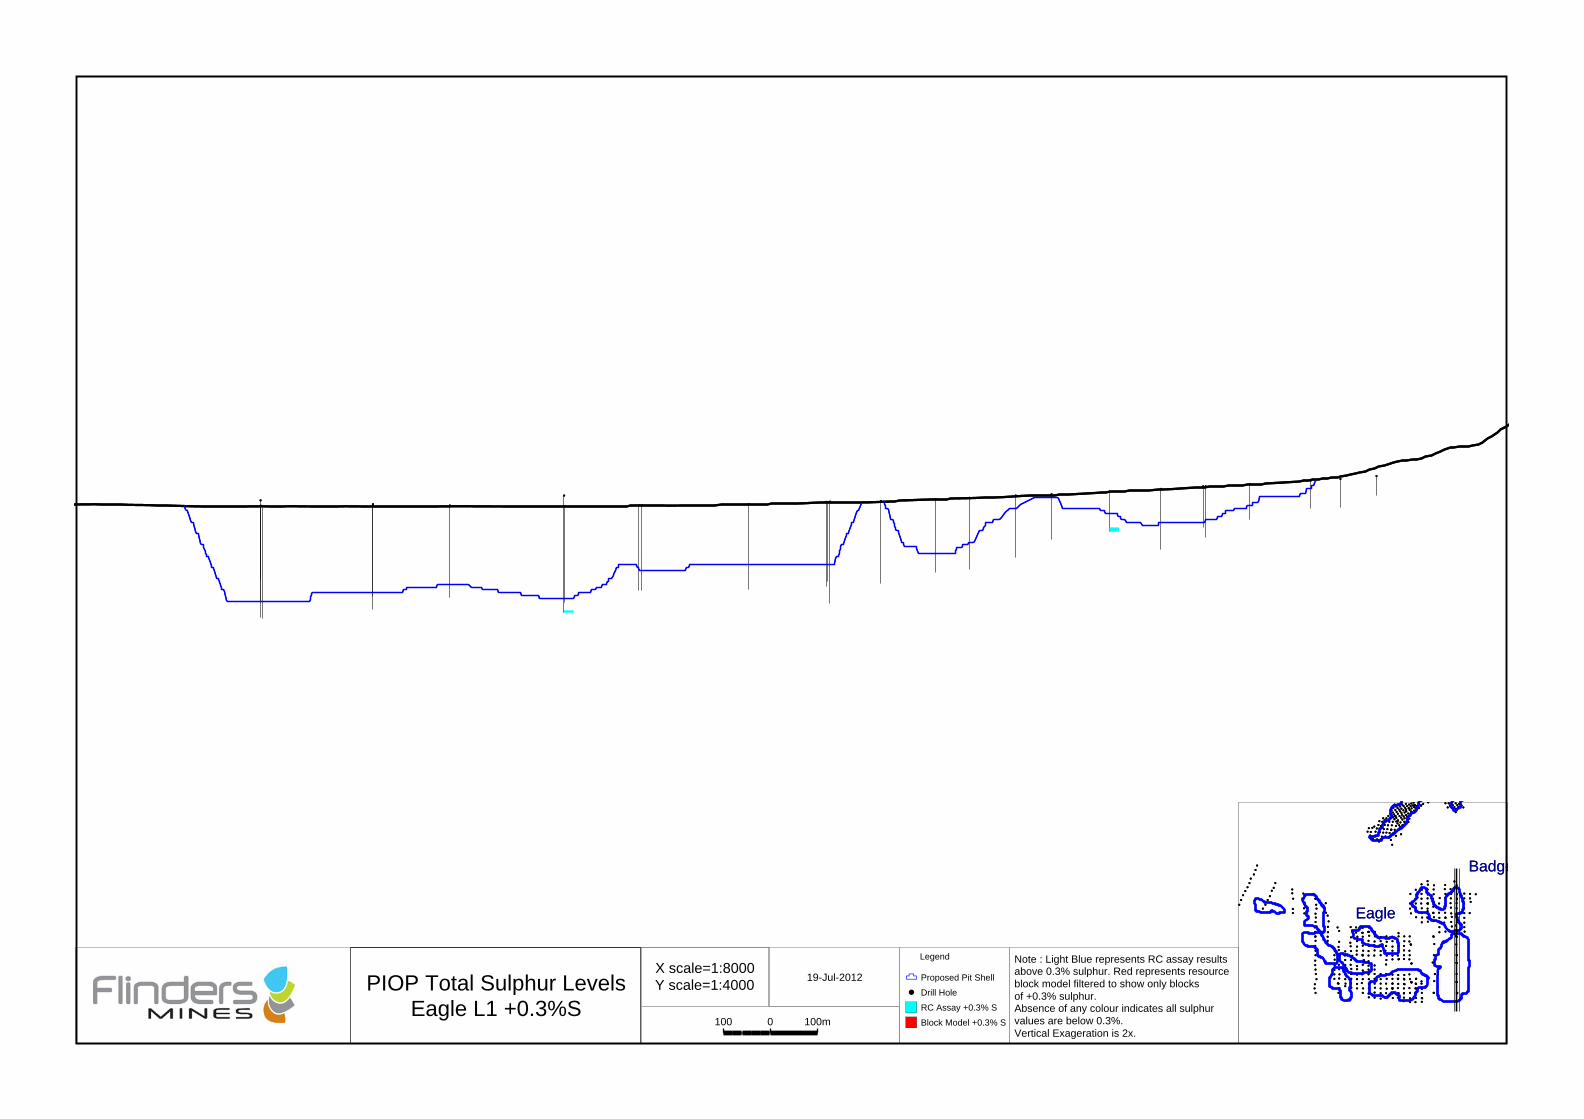
{
{
{
{
{
{
{
{{
{{
{
{
{
{
{
{
{
{
{
{
{
{{
{
{
{
{
{
{
{
{
{
{
{
{
{
{
{
{
{
{
{
{
{
{
{{
{{
{{
{
{
{
{
{
{{
{
{
{
{
{
{
{{
{
{
{
{
{
{
{
{
{
{
{
{
{
{
{
{
{
{
{
{{
{{
{
{
{
{
{
{
{{{{{
{
{
{
{
{
{
{
{
{
{
{
{
{
{
{
{
{
{
{
{
{
{
{
{{{{
{
{
{
{{
{
{{{{{{{{{{
{{{{{
{{{{{{{{{
{{{
{ {
{
{{{{{{{{{
{{{{{
{
{{{
{{{{{{{
{{
{{
{{{{{{{{
{
{{{{{{
{{
{{{
{{{{{ {
{{{{{
{{{{
{
{{ {
{
{{{ {
{{{
{{{{{{
{{{{{{{{{
{
{{{
{{{{{{{
{{{{{{{
{{{{{
{
{
{
{{{{{{
{{{{{{{
{{{{{{{{
{
{{{{{{{
{{{{{
{{
{{{{{{{{{
{{{{{{{{
{{{{
{{{
{
{
{{{{{
{
{{{{{{{{{
{{{
{{{{
{{{{{
{
{{{{{{
{
{
{
{{{{
{
{
{{
{
{{{
{
{
{{
{
{{{
{{
{Eagle
Badge
{
{
{
{
{
{
{
{{
{{
{
{
{
{
{
{
{
{
{
{
{
{{
{
{
{
{
{
{
{
{
{
{
{
{
{
{
{
{
{
{
{
{
{
{
{{
{{
{{
{
{
{
{
{
{{
{
{
{
{
{
{
{{
{
{
{
{
{
{
{
{
{
{
{
{
{
{
{
{
{
{
{
{{
{{
{
{
{
{
{
{
{{{{{
{
{
{
{
{
{
{
{
{
{
{
{
{
{
{
{
{
{
{
{
{
{
{
{{{{
{
{
{
{{
{
{{{{{{{{{{
{{{{{
{{{{{{{{{
{{{
{ {
{
{{{{{{{{{
{{{{{
{
{{{
{{{{{{{
{{
{{
{{{{{{{{
{
{{{{{{
{{
{{{
{{{{{ {
{{{{{
{{{{
{
{{ {
{
{{{ {
{{{
{{{{{{
{{{{{{{{{
{
{{{
{{{{{{{
{{{{{{{
{{{{{
{
{
{
{{{{{{
{{{{{{{
{{{{{{{{
{
{{{{{{{
{{{{{
{{
{{{{{{{{{
{{{{{{{{
{{{{
{{{
{
{
{{{{{
{
{{{{{{{{{
{{{
{{{{
{{{{{
{
{{{{{{
{
{
{
{{{{
{
{
{{
{
{{{
{
{
{{
{
{{{
{{
{Eagle
Badge
PIOP Total Sulphur LevelsEagle L1 +0.3%S
X scale=1:8000Y scale=1:4000
100 100m0
19-Jul-2012
Note : Light Blue represents RC assay resultsabove 0.3% sulphur. Red represents resourceblock model filtered to show only blocksof +0.3% sulphur.Absence of any colour indicates all sulphurvalues are below 0.3%.Vertical Exageration is 2x.
Legend
1 Proposed Pit Shell
Drill Hole
RC Assay +0.3% S
Block Model +0.3% S
{
{
{ { {{
{{
{{ {
{
{ { {{
{
{
{{
{{
{{
{
{{
{{
{
{ { {{
{{
{{ {
{
{ { {{
{
{
{{
{{
{{
{
{{
{
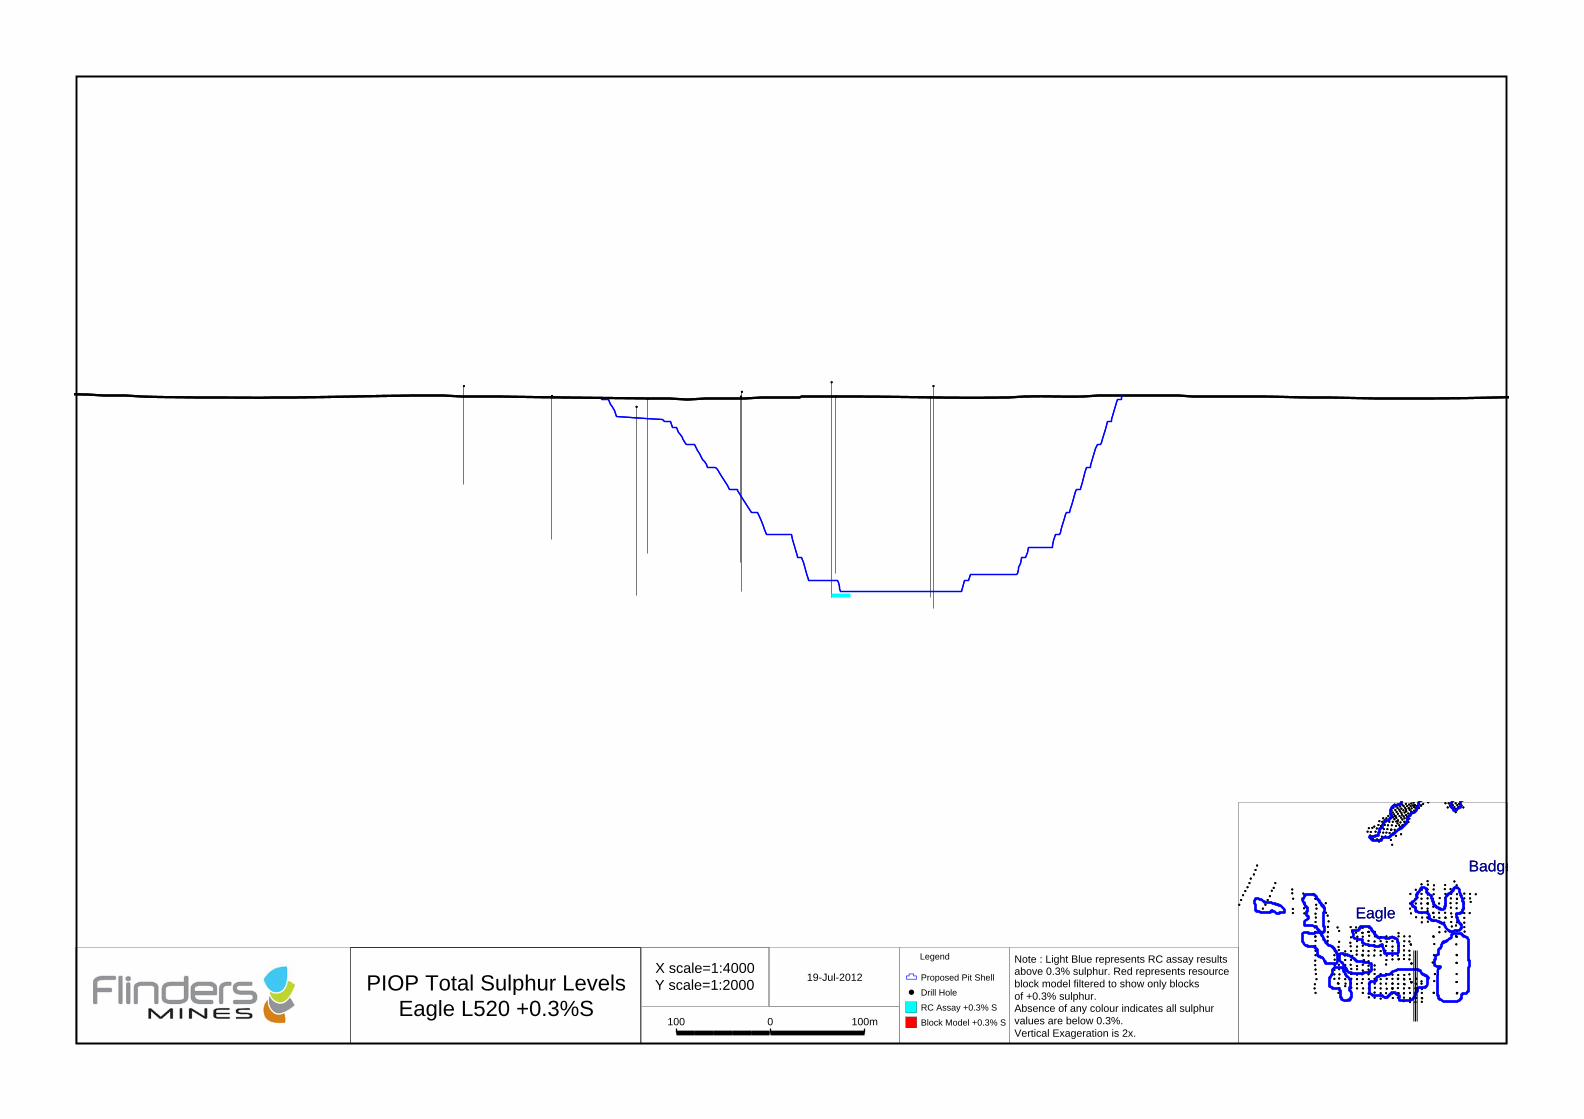
{
{
{
{
{
{
{
{{
{{
{
{
{
{
{
{
{
{
{
{
{
{{
{
{
{
{
{
{
{
{
{
{
{
{
{
{
{
{
{
{
{
{
{
{
{{
{{
{{
{
{
{
{
{
{{
{
{
{
{
{
{
{{
{
{
{
{
{
{
{
{
{
{
{
{
{
{
{
{
{
{
{
{{
{{
{
{
{
{
{
{
{{{{{
{
{
{
{
{
{
{
{
{
{
{
{
{
{
{
{
{
{
{
{
{
{
{
{{{{
{
{
{
{{
{
{{{{{{{{{{
{{{{{
{{{{{{{{{
{{{
{ {
{
{{{{{{{{{
{{{{{
{
{{{
{{{{{{{
{{
{{
{{{{{{{{
{
{{{{{{
{{
{{{
{{{{{ {
{{{{{
{{{{
{
{{ {
{
{{{ {
{{{
{{{{{{
{{{{{{{{{
{
{{{
{{{{{{{
{{{{{{{
{{{{{
{
{
{
{{{{{{
{{{{{{{
{{{{{{{{
{
{{{{{{{
{{{{{
{{
{{{{{{{{{
{{{{{{{{
{{{{
{{{
{
{
{{{{{
{
{{{{{{{{{
{{{
{{{{
{{{{{
{
{{{{{{
{
{
{
{{{{
{
{
{{
{
{{{
{
{
{{
{
{{{
{{
{Eagle
Badge
{
{
{
{
{
{
{
{{
{{
{
{
{
{
{
{
{
{
{
{
{
{{
{
{
{
{
{
{
{
{
{
{
{
{
{
{
{
{
{
{
{
{
{
{
{{
{{
{{
{
{
{
{
{
{{
{
{
{
{
{
{
{{
{
{
{
{
{
{
{
{
{
{
{
{
{
{
{
{
{
{
{
{{
{{
{
{
{
{
{
{
{{{{{
{
{
{
{
{
{
{
{
{
{
{
{
{
{
{
{
{
{
{
{
{
{
{
{{{{
{
{
{
{{
{
{{{{{{{{{{
{{{{{
{{{{{{{{{
{{{
{ {
{
{{{{{{{{{
{{{{{
{
{{{
{{{{{{{
{{
{{
{{{{{{{{
{
{{{{{{
{{
{{{
{{{{{ {
{{{{{
{{{{
{
{{ {
{
{{{ {
{{{
{{{{{{
{{{{{{{{{
{
{{{
{{{{{{{
{{{{{{{
{{{{{
{
{
{
{{{{{{
{{{{{{{
{{{{{{{{
{
{{{{{{{
{{{{{
{{
{{{{{{{{{
{{{{{{{{
{{{{
{{{
{
{
{{{{{
{
{{{{{{{{{
{{{
{{{{
{{{{{
{
{{{{{{
{
{
{
{{{{
{
{
{{
{
{{{
{
{
{{
{
{{{
{{
{Eagle
Badge
PIOP Total Sulphur LevelsEagle L520 +0.3%S
X scale=1:4000Y scale=1:2000
100 100m0
19-Jul-2012
Note : Light Blue represents RC assay resultsabove 0.3% sulphur. Red represents resourceblock model filtered to show only blocksof +0.3% sulphur.Absence of any colour indicates all sulphurvalues are below 0.3%.Vertical Exageration is 2x.
Legend
1 Proposed Pit Shell
Drill Hole
RC Assay +0.3% S
Block Model +0.3% S
{{
{
{{
{
{
{
{{
{{
{
{{
{
{
{
{{
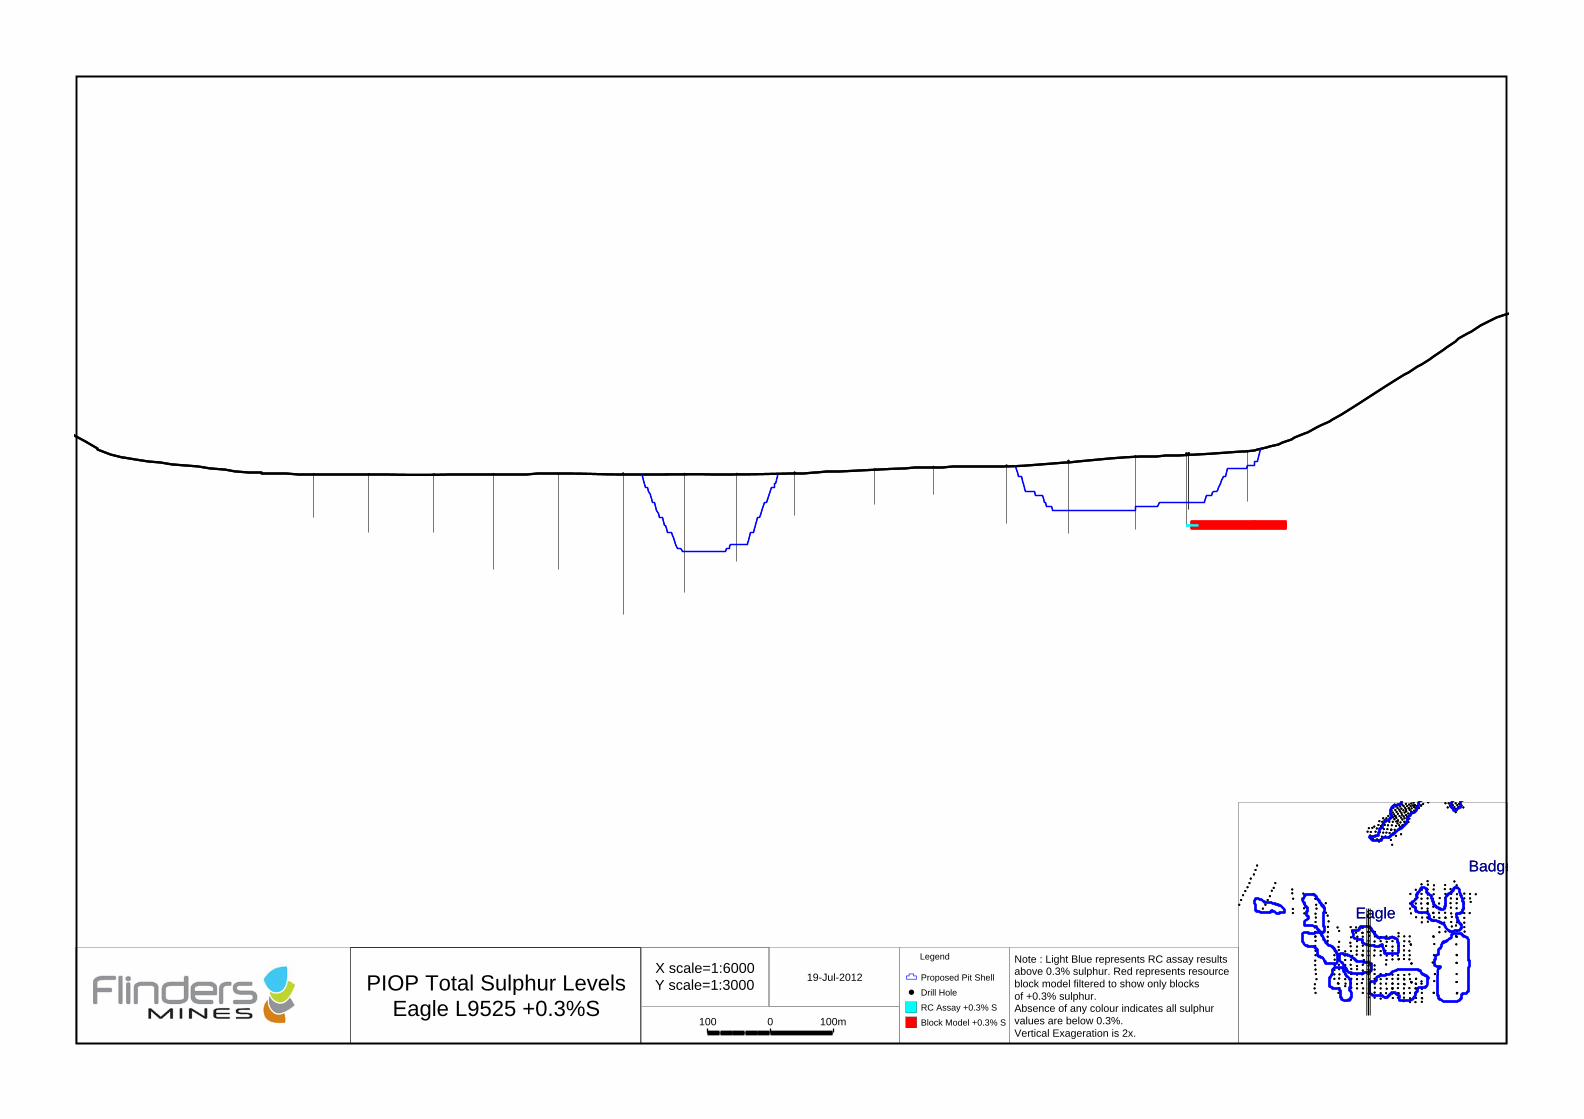
{
{
{
{
{
{
{
{{
{{
{
{
{
{
{
{
{
{
{
{
{
{{
{
{
{
{
{
{
{
{
{
{
{
{
{
{
{
{
{
{
{
{
{
{
{{
{{
{{
{
{
{
{
{
{{
{
{
{
{
{
{
{{
{
{
{
{
{
{
{
{
{
{
{
{
{
{
{
{
{
{
{
{{
{{
{
{
{
{
{
{
{{{{{
{
{
{
{
{
{
{
{
{
{
{
{
{
{
{
{
{
{
{
{
{
{
{
{{{{
{
{
{
{{
{
{{{{{{{{{{
{{{{{
{{{{{{{{{
{{{
{ {
{
{{{{{{{{{
{{{{{
{
{{{
{{{{{{{
{{
{{
{{{{{{{{
{
{{{{{{
{{
{{{
{{{{{ {
{{{{{
{{{{
{
{{ {
{
{{{ {
{{{
{{{{{{
{{{{{{{{{
{
{{{
{{{{{{{
{{{{{{{
{{{{{
{
{
{
{{{{{{
{{{{{{{
{{{{{{{{
{
{{{{{{{
{{{{{
{{
{{{{{{{{{
{{{{{{{{
{{{{
{{{
{
{
{{{{{
{
{{{{{{{{{
{{{
{{{{
{{{{{
{
{{{{{{
{
{
{
{{{{
{
{
{{
{
{{{
{
{
{{
{
{{{
{{
{Eagle
Badge
{
{
{
{
{
{
{
{{
{{
{
{
{
{
{
{
{
{
{
{
{
{{
{
{
{
{
{
{
{
{
{
{
{
{
{
{
{
{
{
{
{
{
{
{
{{
{{
{{
{
{
{
{
{
{{
{
{
{
{
{
{
{{
{
{
{
{
{
{
{
{
{
{
{
{
{
{
{
{
{
{
{
{{
{{
{
{
{
{
{
{
{{{{{
{
{
{
{
{
{
{
{
{
{
{
{
{
{
{
{
{
{
{
{
{
{
{
{{{{
{
{
{
{{
{
{{{{{{{{{{
{{{{{
{{{{{{{{{
{{{
{ {
{
{{{{{{{{{
{{{{{
{
{{{
{{{{{{{
{{
{{
{{{{{{{{
{
{{{{{{
{{
{{{
{{{{{ {
{{{{{
{{{{
{
{{ {
{
{{{ {
{{{
{{{{{{
{{{{{{{{{
{
{{{
{{{{{{{
{{{{{{{
{{{{{
{
{
{
{{{{{{
{{{{{{{
{{{{{{{{
{
{{{{{{{
{{{{{
{{
{{{{{{{{{
{{{{{{{{
{{{{
{{{
{
{
{{{{{
{
{{{{{{{{{
{{{
{{{{
{{{{{
{
{{{{{{
{
{
{
{{{{
{
{
{{
{
{{{
{
{
{{
{
{{{
{{
{Eagle
Badge
PIOP Total Sulphur LevelsEagle L9525 +0.3%S
X scale=1:6000Y scale=1:3000
100 100m0
19-Jul-2012
Note : Light Blue represents RC assay resultsabove 0.3% sulphur. Red represents resourceblock model filtered to show only blocksof +0.3% sulphur.Absence of any colour indicates all sulphurvalues are below 0.3%.Vertical Exageration is 2x.
Legend
1 Proposed Pit Shell
Drill Hole
RC Assay +0.3% S
Block Model +0.3% S
{ { { { { { { {
{{{
{{
{{
{
{{
{ { { { { { { {
{{{
{{
{{
{
{{