Embed Size (px)
Citation preview
Tufts Data Lab
1
Overlay Analysis II: Using Zonal and Extract Tools to Transfer Raster Values in ArcGIS
Created by Patrick Florance and Jonathan Gale, Edited by Kyle Monahan on March 27th, 2017
Skills covered in this Tutorial Include:
Enabling the Spatial Analyst extension
Using the Zonal Statistics Tool to tabulate areas
Using the Extraction Tool to transfer underlying raster data to points
Calculating a percent change using the Field Calculator
If you have raster data that you want to join to existing vector data, you can transfer these data in ArcMap using the Spatial Analyst extension.
For detailed instructions about working with Spatial Analyst in ArcMap 10.4, see the ArcGIS Desktop Documentation for Extraction tools and Zonal tools.
This exercise uses datasets that are available in the S: drive. For this analysis, we will be joining raster data (Land Cover in 2001 and 2012) with associated districts in Uganda. We will use this process to find the Population per Cropland Area and Percent Change in Cropland Cover. Follow the steps in the graphics below to perform zonal statistics and extract by point raster to vector overlay operations.
1. Copy the entire folder S:\Classes\DHP_207\Uganda_Overlay\ to your H: drive.
2. Check the properties of your copies folder and ensure that it is not Read Only.
3. From your H Drive, open start.mxd
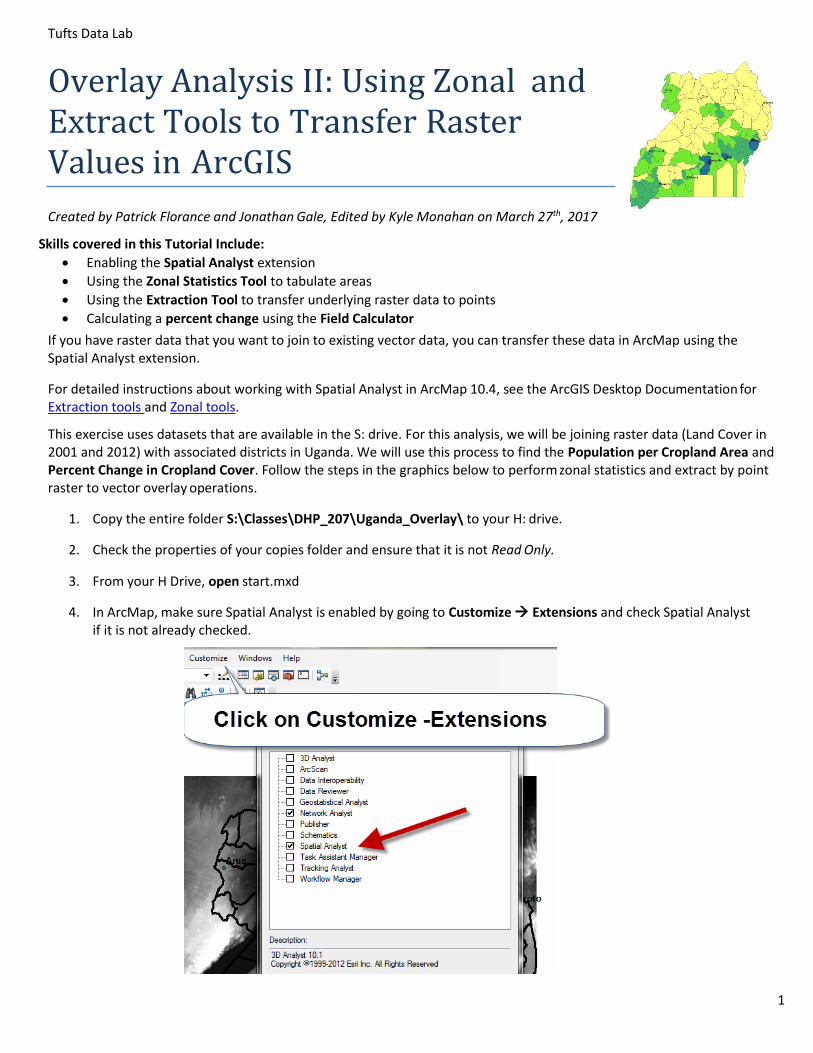
4. In ArcMap, make sure Spatial Analyst is enabled by going to Customize Extensions and check Spatial Analyst if it is not already checked.
Tufts Data Lab
2
5. Take a moment and review the different layers in the project.
6. All data layers have been projected into UTM Zone 36N. For conducting overlay analysis all data layers must be projected into the same projected coordinate system.
Transfer Gridded Population of the World data into the Uganda Districts
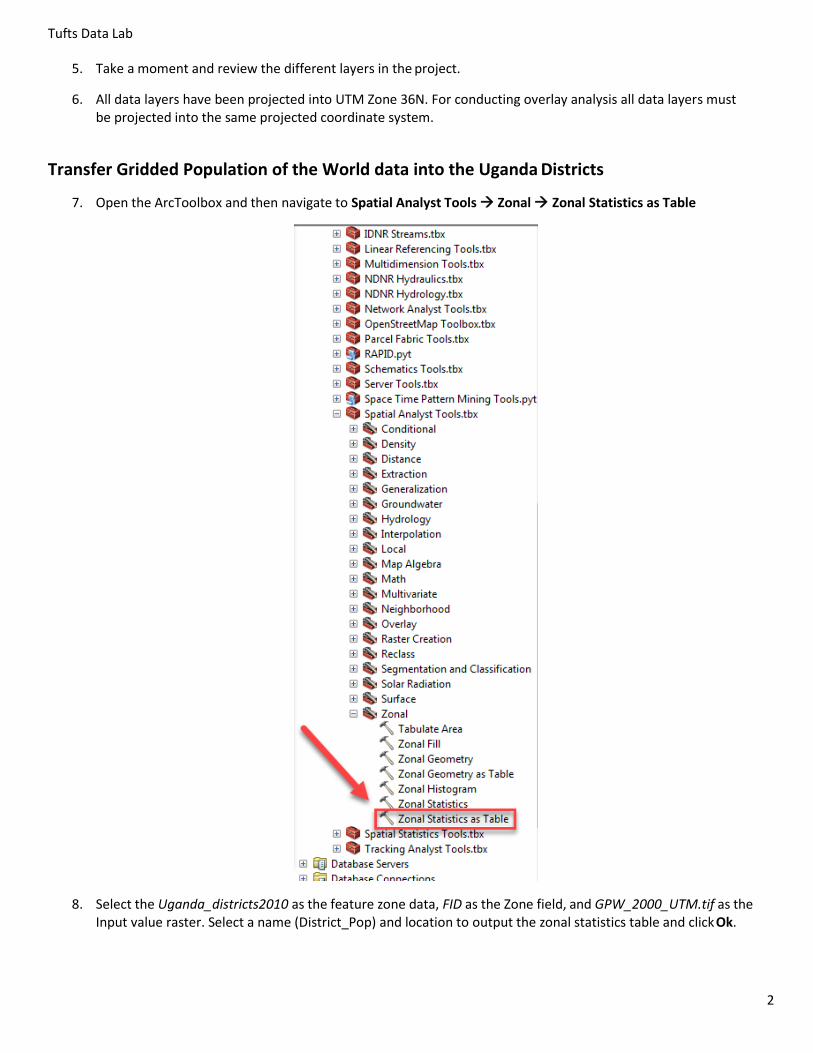
7. Open the ArcToolbox and then navigate to Spatial Analyst Tools Zonal Zonal Statistics as Table
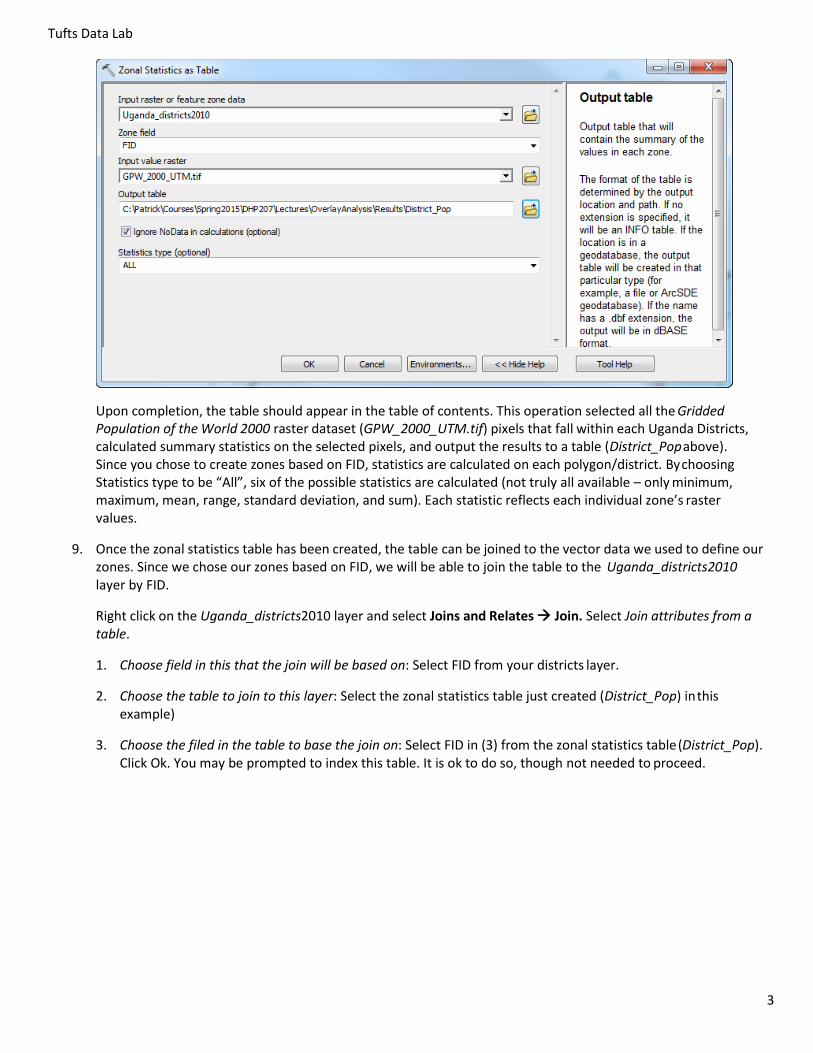
8. Select the Uganda_districts2010 as the feature zone data, FID as the Zone field, and GPW_2000_UTM.tif as the Input value raster. Select a name (District_Pop) and location to output the zonal statistics table and click Ok.
Tufts Data Lab
3
Upon completion, the table should appear in the table of contents. This operation selected all the Gridded Population of the World 2000 raster dataset (GPW_2000_UTM.tif) pixels that fall within each Uganda Districts, calculated summary statistics on the selected pixels, and output the results to a table (District_Pop above). Since you chose to create zones based on FID, statistics are calculated on each polygon/district. By choosing Statistics type to be “All”, six of the possible statistics are calculated (not truly all available – only minimum, maximum, mean, range, standard deviation, and sum). Each statistic reflects each individual zone’s raster values.
9. Once the zonal statistics table has been created, the table can be joined to the vector data we used to define our zones. Since we chose our zones based on FID, we will be able to join the table to the Uganda_districts2010 layer by FID.
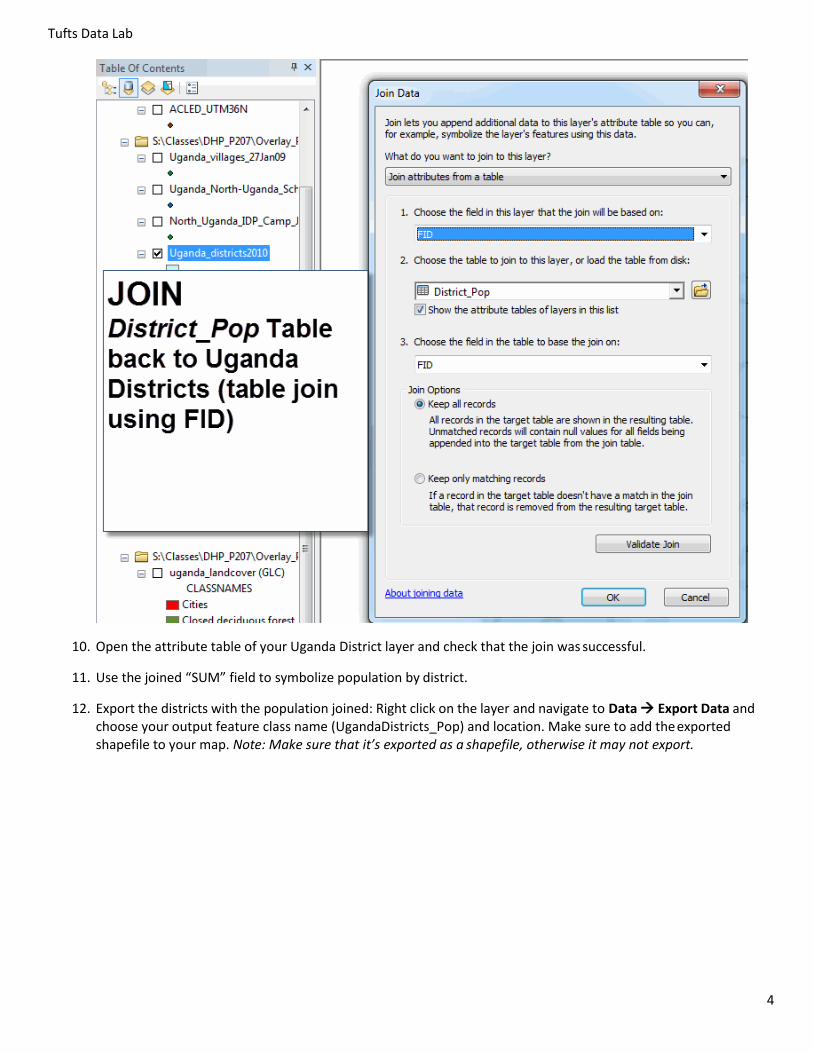
Right click on the Uganda_districts2010 layer and select Joins and Relates Join. Select Join attributes from a table.
1. Choose field in this that the join will be based on: Select FID from your districts layer.
2. Choose the table to join to this layer: Select the zonal statistics table just created (District_Pop) in this example)
3. Choose the filed in the table to base the join on: Select FID in (3) from the zonal statistics table (District_Pop). Click Ok. You may be prompted to index this table. It is ok to do so, though not needed to proceed.
Tufts Data Lab
4
10. Open the attribute table of your Uganda District layer and check that the join was successful.
11. Use the joined “SUM” field to symbolize population by district.
12. Export the districts with the population joined: Right click on the layer and navigate to Data Export Data and choose your output feature class name (UgandaDistricts_Pop) and location. Make sure to add the exported shapefile to your map. Note: Make sure that it’s exported as a shapefile, otherwise it may not export.
Tufts Data Lab
5
Transfer 2001 and 2012 Land Cover data into the Uganda Districts
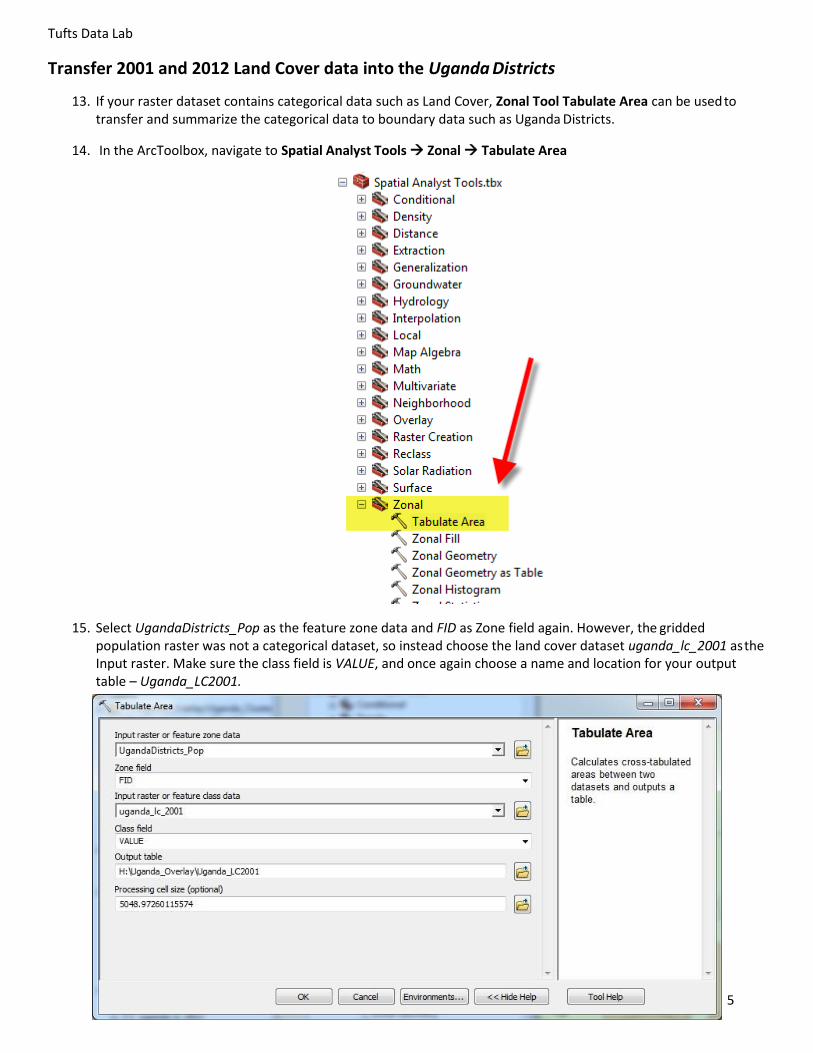
13. If your raster dataset contains categorical data such as Land Cover, Zonal Tool Tabulate Area can be used to transfer and summarize the categorical data to boundary data such as Uganda Districts.
14. In the ArcToolbox, navigate to Spatial Analyst Tools Zonal Tabulate Area
15. Select UgandaDistricts_Pop as the feature zone data and FID as Zone field again. However, the gridded population raster was not a categorical dataset, so instead choose the land cover dataset uganda_lc_2001 as the Input raster. Make sure the class field is VALUE, and once again choose a name and location for your output table – Uganda_LC2001.
Tufts Data Lab
6
16. Right click on the resulting output table Uganda_LC2001 go to Open to examine its contents. Which new fields do you see?
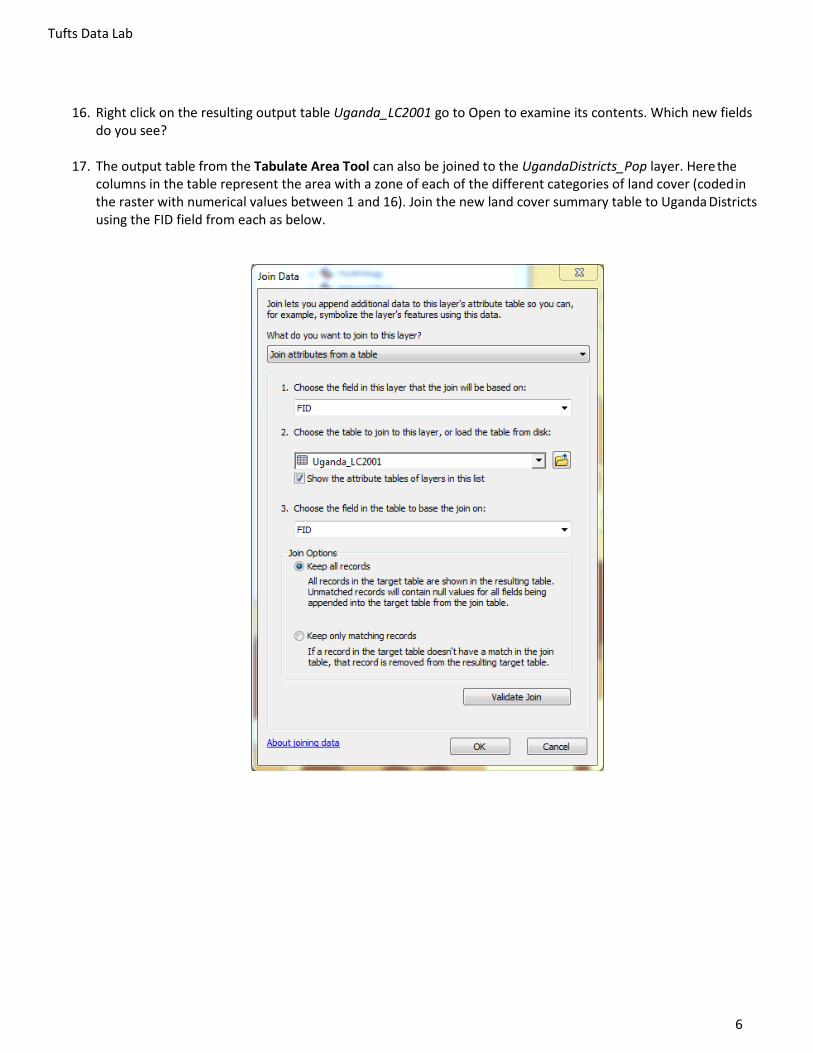
17. The output table from the Tabulate Area Tool can also be joined to the UgandaDistricts_Pop layer. Here the columns in the table represent the area with a zone of each of the different categories of land cover (coded in the raster with numerical values between 1 and 16). Join the new land cover summary table to Uganda Districts using the FID field from each as below.
Tufts Data Lab
7
18. Once the Uganda_LC2001 table has been joined to UgandaDistricts_Pop, export this layer as above. Name this shapefile UgandaDistricts_Pop_LC2001.
19. Repeat the Tabulate Area calculation with the 2012 land cover data. Select UgandaDistricts_Pop_LC2001 as the feature zone data and Zone field as FID again. Choose the land cover dataset uganda_lc_2012 as the Input raster. Make sure the class field is VALUE, and once again choose a name (Uganda_LC2012) and location for your output table.
20. Join this second table to the UgandaDistricts_Pop_LC2001 layer using FID as well.
21. Your Uganda Districts should now contain data from the Gridded Population of the World and 2001 and 2012 Land Cover. Export out the Uganda Districts to create a new shapefile embedded with joined data – UgandaDistricts_join.shp. Add this new dataset to the map.
Calculating Population per Cropland Area
One can now perform calculation on the newly transferred data. Below you will calculate the population per each cropland area for each district.
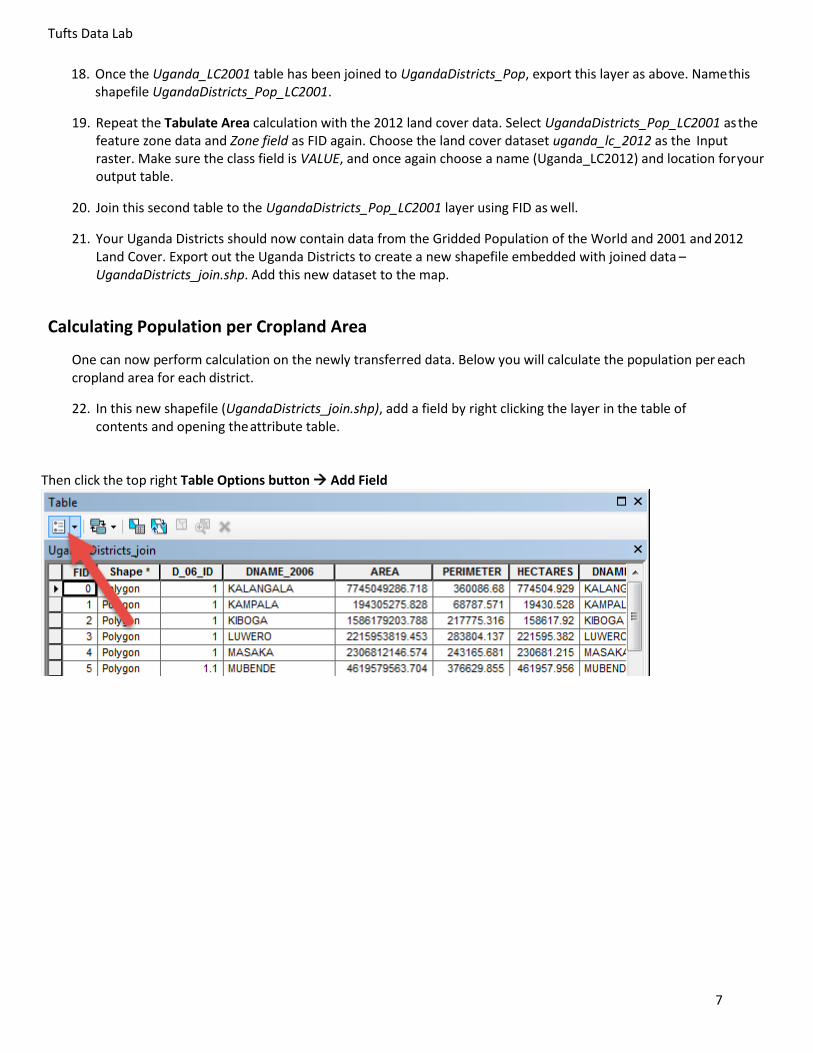
22. In this new shapefile (UgandaDistricts_join.shp), add a field by right clicking the layer in the table of contents and opening the attribute table.
Then click the top right Table Options button Add Field
Tufts Data Lab
8
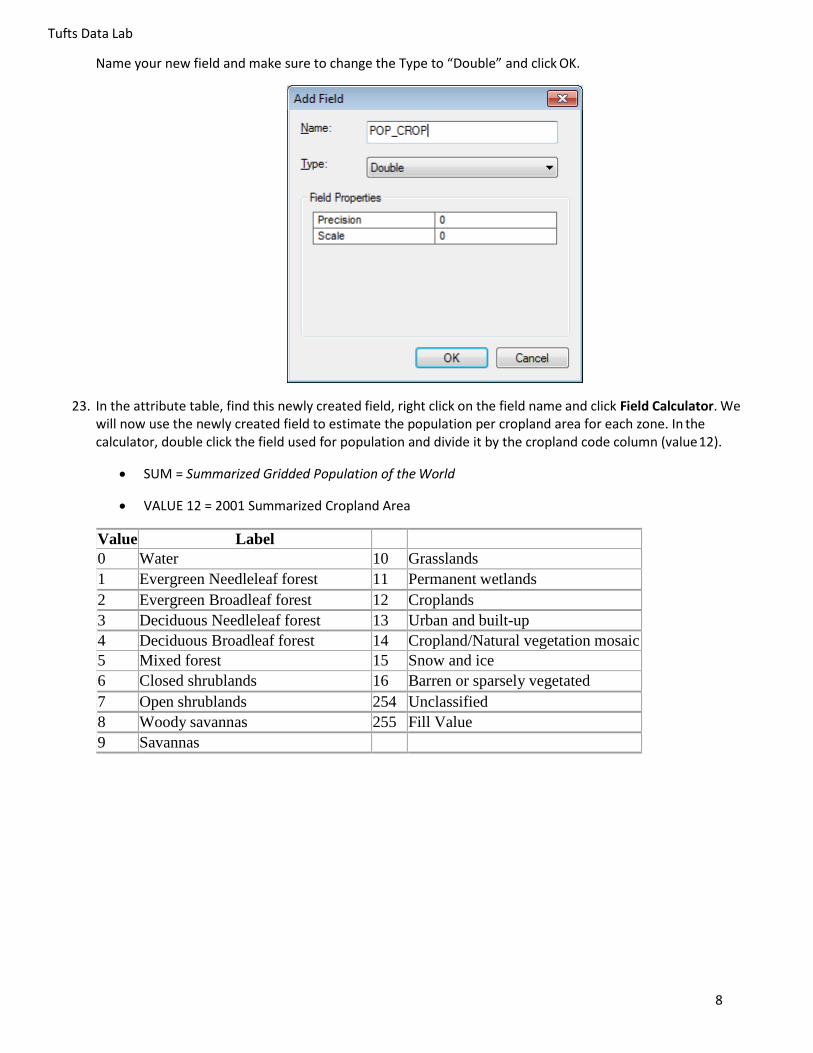
Name your new field and make sure to change the Type to “Double” and click OK.
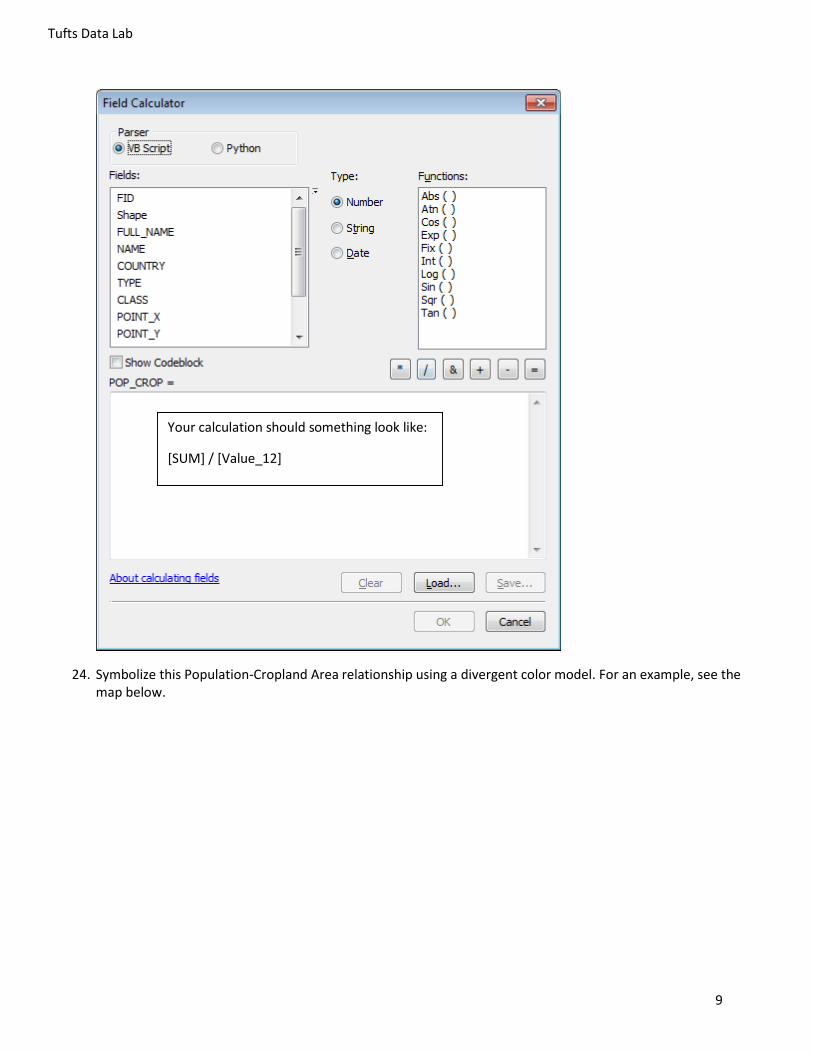
23. In the attribute table, find this newly created field, right click on the field name and click Field Calculator. We will now use the newly created field to estimate the population per cropland area for each zone. In the calculator, double click the field used for population and divide it by the cropland code column (value 12).
SUM = Summarized Gridded Population of the World
VALUE 12 = 2001 Summarized Cropland Area
Value Label
0 Water 10 Grasslands
1 Evergreen Needleleaf forest 11 Permanent wetlands
2 Evergreen Broadleaf forest 12 Croplands
3 Deciduous Needleleaf forest 13 Urban and built-up
4 Deciduous Broadleaf forest 14 Cropland/Natural vegetation mosaic
5 Mixed forest 15 Snow and ice
6 Closed shrublands 16 Barren or sparsely vegetated
7 Open shrublands 254 Unclassified
8 Woody savannas 255 Fill Value
9 Savannas
Tufts Data Lab
9
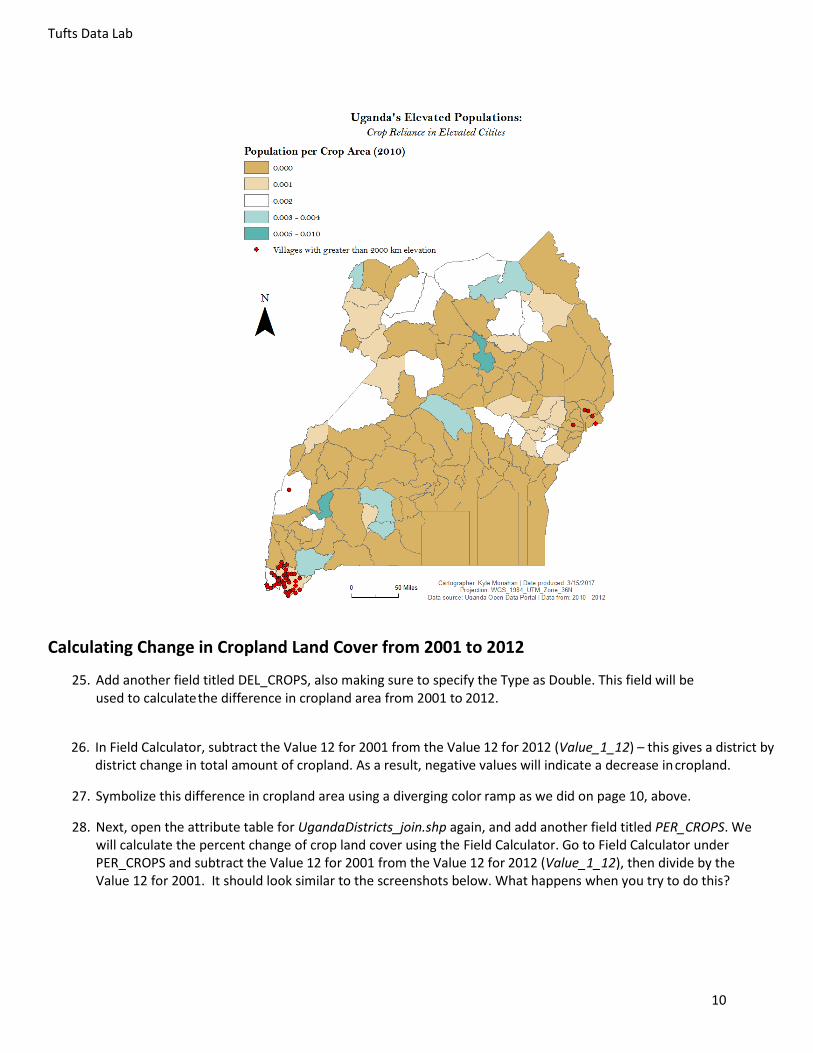
24. Symbolize this Population-Cropland Area relationship using a divergent color model. For an example, see the map below.
Your calculation should something look like:
[SUM] / [Value_12]
Tufts Data Lab
10
Calculating Change in Cropland Land Cover from 2001 to 2012
25. Add another field titled DEL_CROPS, also making sure to specify the Type as Double. This field will be used to calculate the difference in cropland area from 2001 to 2012.
26. In Field Calculator, subtract the Value 12 for 2001 from the Value 12 for 2012 (Value_1_12) – this gives a district by
district change in total amount of cropland. As a result, negative values will indicate a decrease in cropland.
27. Symbolize this difference in cropland area using a diverging color ramp as we did on page 10, above.
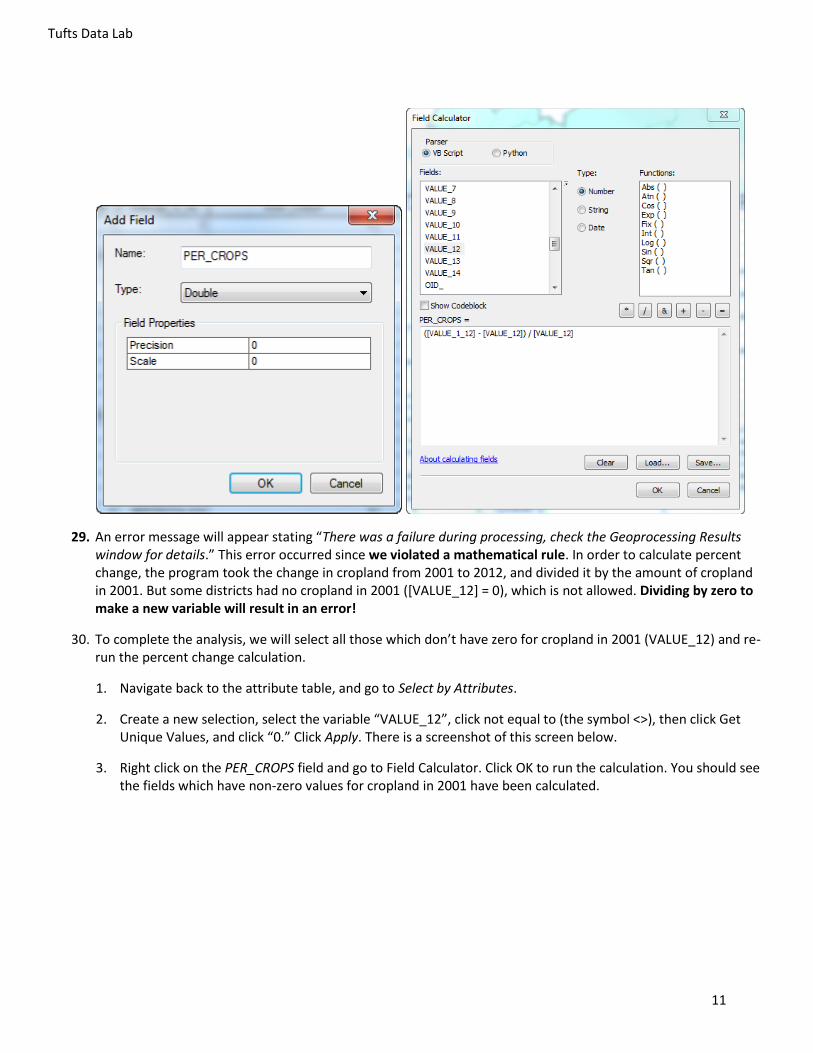
28. Next, open the attribute table for UgandaDistricts_join.shp again, and add another field titled PER_CROPS. We will calculate the percent change of crop land cover using the Field Calculator. Go to Field Calculator under PER_CROPS and subtract the Value 12 for 2001 from the Value 12 for 2012 (Value_1_12), then divide by the Value 12 for 2001. It should look similar to the screenshots below. What happens when you try to do this?
Tufts Data Lab
11
29. An error message will appear stating “There was a failure during processing, check the Geoprocessing Results window for details.” This error occurred since we violated a mathematical rule. In order to calculate percent change, the program took the change in cropland from 2001 to 2012, and divided it by the amount of cropland in 2001. But some districts had no cropland in 2001 ([VALUE_12] = 0), which is not allowed. Dividing by zero to make a new variable will result in an error!
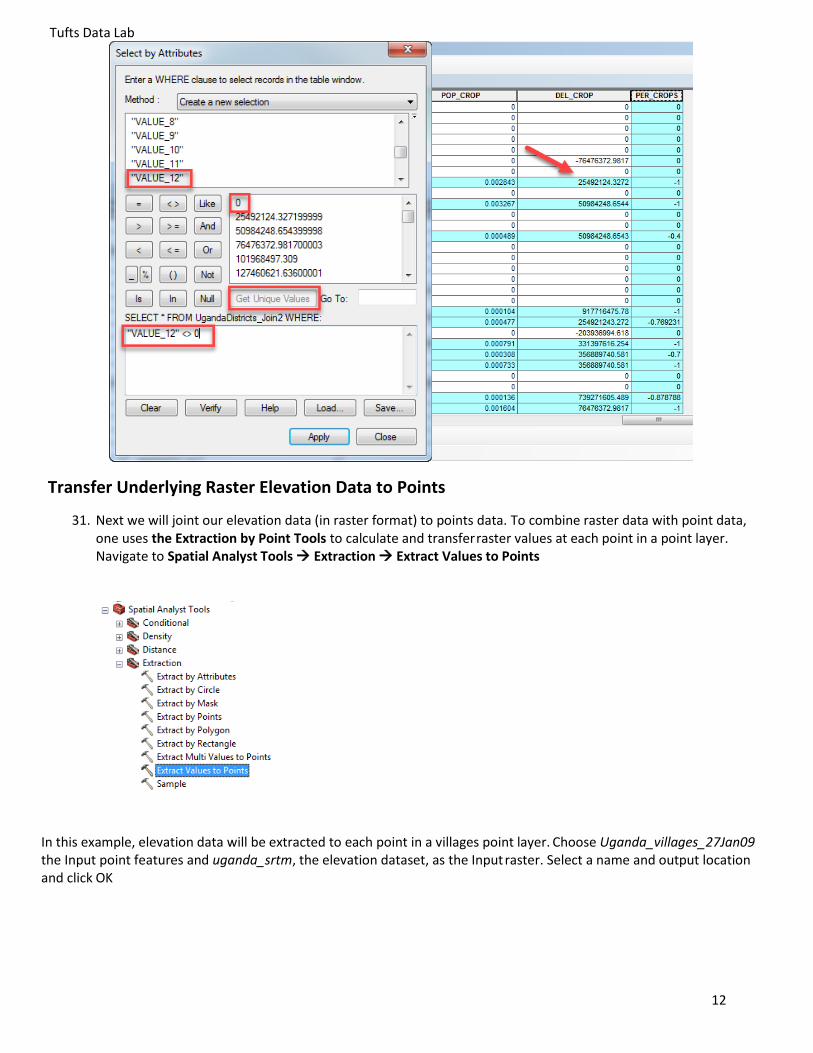
30. To complete the analysis, we will select all those which don’t have zero for cropland in 2001 (VALUE_12) and re-run the percent change calculation.
1. Navigate back to the attribute table, and go to Select by Attributes.
2. Create a new selection, select the variable “VALUE_12”, click not equal to (the symbol <>), then click Get Unique Values, and click “0.” Click Apply. There is a screenshot of this screen below.
3. Right click on the PER_CROPS field and go to Field Calculator. Click OK to run the calculation. You should see the fields which have non-zero values for cropland in 2001 have been calculated.
Tufts Data Lab
12
Transfer Underlying Raster Elevation Data to Points
31. Next we will joint our elevation data (in raster format) to points data. To combine raster data with point data, one uses the Extraction by Point Tools to calculate and transfer raster values at each point in a point layer. Navigate to Spatial Analyst Tools Extraction Extract Values to Points
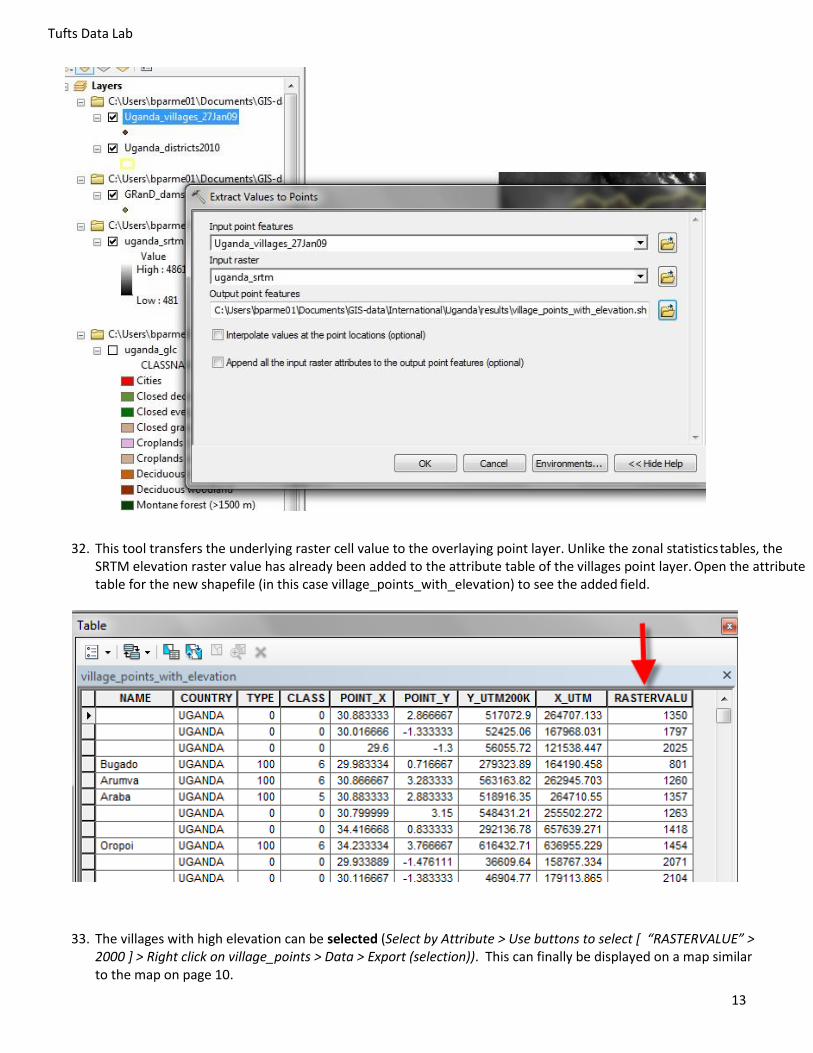
In this example, elevation data will be extracted to each point in a villages point layer. Choose Uganda_villages_27Jan09 the Input point features and uganda_srtm, the elevation dataset, as the Input raster. Select a name and output location and click OK
Tufts Data Lab
13
32. This tool transfers the underlying raster cell value to the overlaying point layer. Unlike the zonal statistics tables, the SRTM elevation raster value has already been added to the attribute table of the villages point layer. Open the attribute table for the new shapefile (in this case village_points_with_elevation) to see the added field.
33. The villages with high elevation can be selected (Select by Attribute > Use buttons to select [ “RASTERVALUE” > 2000 ] > Right click on village_points > Data > Export (selection)). This can finally be displayed on a map similar to the map on page 10.