Embed Size (px)
Citation preview

Public Exam Course Results
Geography 3202
2009-10
District 1 - Labrador
#001 - St. Peter's School, Black Tickle Grades: K-1,3-9,11-12
2007 2008 2009
Final MarkExam Mark
School
vs
Province
School
vs
District
Final
Mark
q q 58.2
64.6
61.3
Number of Students
School
District
Province
School
District
Province
World
Climate
Patterns
School
DistrictEcosystems
Land and
Water Forms
Province
Subtest
School
vs
Province
School
vs
District
Public
Exam
Mark
School
District
Province
q q
q
q
p p
q
q
50.2
5
58.8
56.3
World Geography 3202
School
District
Province
School
District
Province
Secondary &
Tertiary Activities
School
District
Written response
Units 1-5
Primary
Resource
Activities
Province
q
q
q
q
q
q
Population
Geography
School
District
Province
p p
Urban
Geography
School
District
Province
Multiple Choice
Long Answer
qppq
64.4
53.3
55.0
48.0
44.0
41.9
60.0
63.9
64.3
69.3
53.4
56.6
49.6
57.3
58.8
59.0
59.0
50.4
66.0
59.4
73.2
69.5
69.3
Average Mark, 2007-2010
2010
School data with 5 or fewer
students withheld for reasons of
confidentiality.
School data with 5 or fewer
students withheld for reasons of
confidentiality.
School data with 5 or fewer students withheld for reasons of confidentiality.
1

Public Exam Course Results
Geography 3202
2009-10
District 1 - Labrador
#001 - St. Peter's School, Black Tickle Grades: K-1,3-9,11-12
2007 2008 2009
2007 2008 2009
Final MarkExam Mark
Land and
Water
Forms
World
Climate
Patterns
Ecosystems
Primary
Resource
Activities
Secondary
& Tertiary
Activities
Written
Response
Units 1-5
Population
Geography
Urban
Geography
4 Year Public Exam (Subtest) Mark Trend 2007-2010
Difference from Provincial Mean, 2007-2010
2010
2010
School data with 5 or fewer students withheld for reasons of confidentiality.
School data with 5 or fewer students withheld for reasons of confidentiality.
2
Public Exam Course Results
Geography 3202
2009-10
District 1 - Labrador
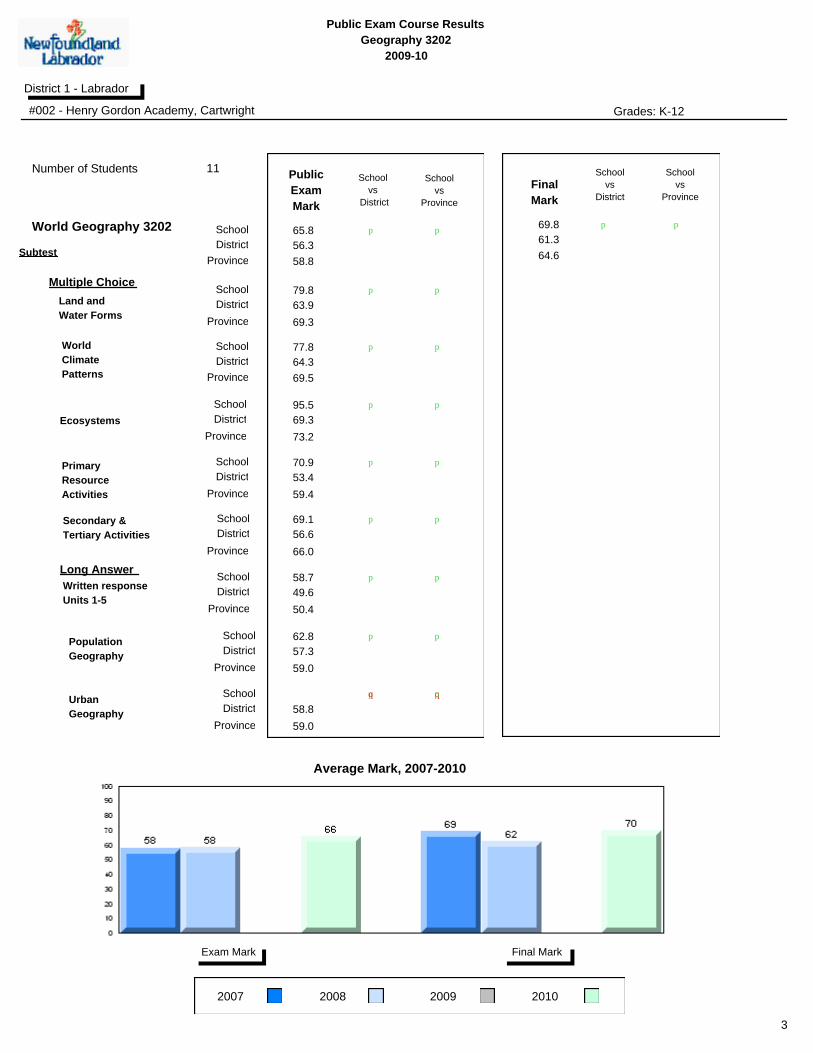
#002 - Henry Gordon Academy, Cartwright Grades: K-12
2007 2008 2009
Final MarkExam Mark
School
vs
Province
School
vs
District
Final
Mark
p p 69.8
64.6
61.3
Number of Students
School
District
Province
School
District
Province
World
Climate
Patterns
School
DistrictEcosystems
Land and
Water Forms
Province
Subtest
School
vs
Province
School
vs
District
Public
Exam
Mark
School
District
Province
p p
p
p
p
p
p
p
65.8
11
58.8
56.3
World Geography 3202
School
District
Province
School
District
Province
Secondary &
Tertiary Activities
School
District
Written response
Units 1-5
Primary
Resource
Activities
Province
p
p
p
p
p
p
Population
Geography
School
District
Province
p p
Urban
Geography
School
District
Province
Multiple Choice
Long Answer
qppq
79.8
77.8
95.5
70.9
69.1
58.7
62.8
63.9
64.3
69.3
53.4
56.6
49.6
57.3
58.8
59.0
59.0
50.4
66.0
59.4
73.2
69.5
69.3
Average Mark, 2007-2010
2010
3
Public Exam Course Results
Geography 3202
2009-10
District 1 - Labrador
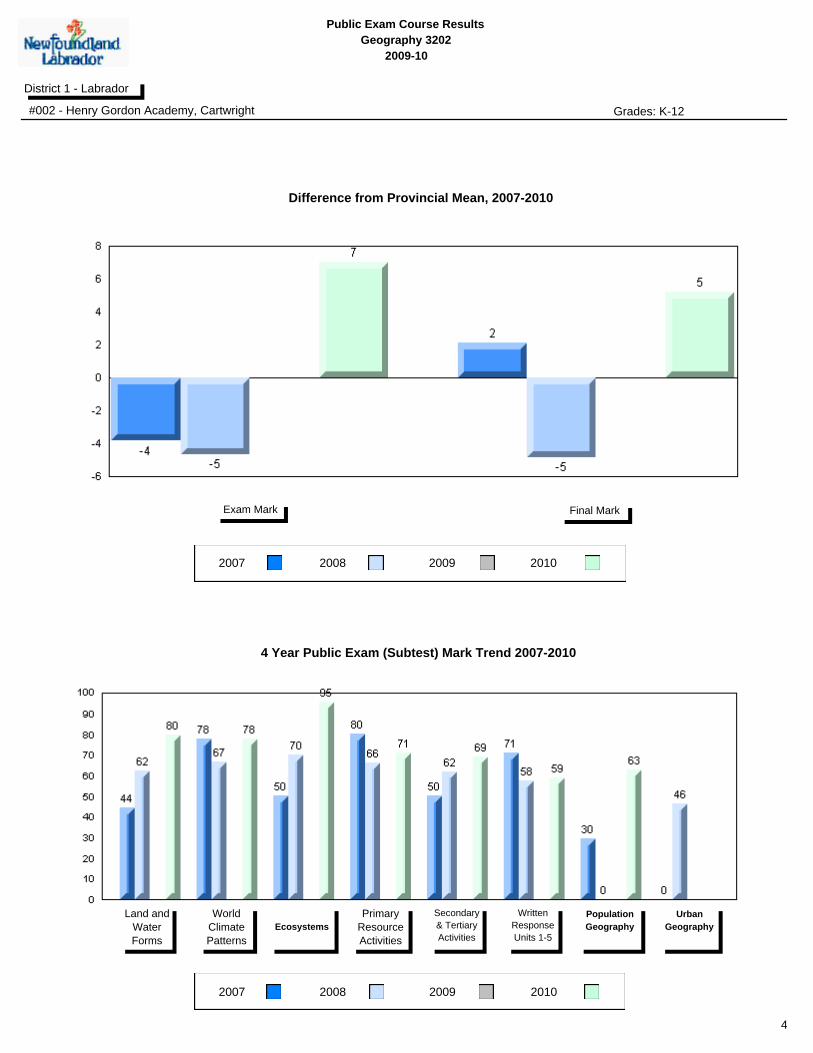
#002 - Henry Gordon Academy, Cartwright Grades: K-12
2007 2008 2009
2007 2008 2009
Final MarkExam Mark
Land and
Water
Forms
World
Climate
Patterns
Ecosystems
Primary
Resource
Activities
Secondary
& Tertiary
Activities
Written
Response
Units 1-5
Population
Geography
Urban
Geography
4 Year Public Exam (Subtest) Mark Trend 2007-2010
Difference from Provincial Mean, 2007-2010
2010
2010
4

Public Exam Course Results
Geography 3202
2009-10
District 1 - Labrador
#007 - Amos Comenius Memorial School, Hopedale Grades: K-12
2007 2008 2009
Final MarkExam Mark
School
vs
Province
School
vs
District
Final
Mark
q q 59.7
64.6
61.3
Number of Students
School
District
Province
School
District
Province
World
Climate
Patterns
School
DistrictEcosystems
Land and
Water Forms
Province
Subtest
School
vs
Province
School
vs
District
Public
Exam
Mark
School
District
Province
q q
q
p
p
p
p
q
55.3
2
58.8
56.3
World Geography 3202
School
District
Province
School
District
Province
Secondary &
Tertiary Activities
School
District
Written response
Units 1-5
Primary
Resource
Activities
Province
q
q
p p
q
q
Population
Geography
School
District
Province
p p
Urban
Geography
School
District
Province
Multiple Choice
Long Answer
qppq
66.7
61.1
87.5
70.0
50.0
27.1
61.4
63.9
64.3
69.3
53.4
56.6
49.6
57.3
58.8
59.0
59.0
50.4
66.0
59.4
73.2
69.5
69.3
Average Mark, 2007-2010
2010
School data with 5 or fewer
students withheld for reasons of
confidentiality.
School data with 5 or fewer
students withheld for reasons of
confidentiality.
School data with 5 or fewer students withheld for reasons of confidentiality.
5
Public Exam Course Results
Geography 3202
2009-10
District 1 - Labrador
#007 - Amos Comenius Memorial School, Hopedale Grades: K-12
2007 2008 2009
2007 2008 2009
Final MarkExam Mark
Land and
Water
Forms
World
Climate
Patterns
Ecosystems
Primary
Resource
Activities
Secondary
& Tertiary
Activities
Written
Response
Units 1-5
Population
Geography
Urban
Geography
4 Year Public Exam (Subtest) Mark Trend 2007-2010
Difference from Provincial Mean, 2007-2010
2010
2010
School data with 5 or fewer students withheld for reasons of confidentiality.
School data with 5 or fewer students withheld for reasons of confidentiality.
6

Public Exam Course Results
Geography 3202
2009-10
District 1 - Labrador
#010 - Menihek High School, Labrador City Grades: 8-12
2007 2008 2009
Final MarkExam Mark
School
vs
Province
School
vs
District
Final
Mark
q q 59.1
64.6
61.3
Number of Students
School
District
Province
School
District
Province
World
Climate
Patterns
School
DistrictEcosystems
Land and
Water Forms
Province
Subtest
School
vs
Province
School
vs
District
Public
Exam
Mark
School
District
Province
q q
q
q
q
q
q
q
53.4
33
58.8
56.3
World Geography 3202
School
District
Province
School
District
Province
Secondary &
Tertiary Activities
School
District
Written response
Units 1-5
Primary
Resource
Activities
Province
q
q
p q
q
q
Population
Geography
School
District
Province
q q
Urban
Geography
School
District
Province
Multiple Choice
Long Answer
qppq
53.9
58.6
66.7
53.6
48.8
47.8
55.5
63.9
64.3
69.3
53.4
56.6
49.6
57.3
58.8
59.0
59.0
50.4
66.0
59.4
73.2
69.5
69.3
Average Mark, 2007-2010
2010
7
Public Exam Course Results
Geography 3202
2009-10
District 1 - Labrador
#010 - Menihek High School, Labrador City Grades: 8-12
2007 2008 2009
2007 2008 2009
Final MarkExam Mark
Land and
Water
Forms
World
Climate
Patterns
Ecosystems
Primary
Resource
Activities
Secondary
& Tertiary
Activities
Written
Response
Units 1-5
Population
Geography
Urban
Geography
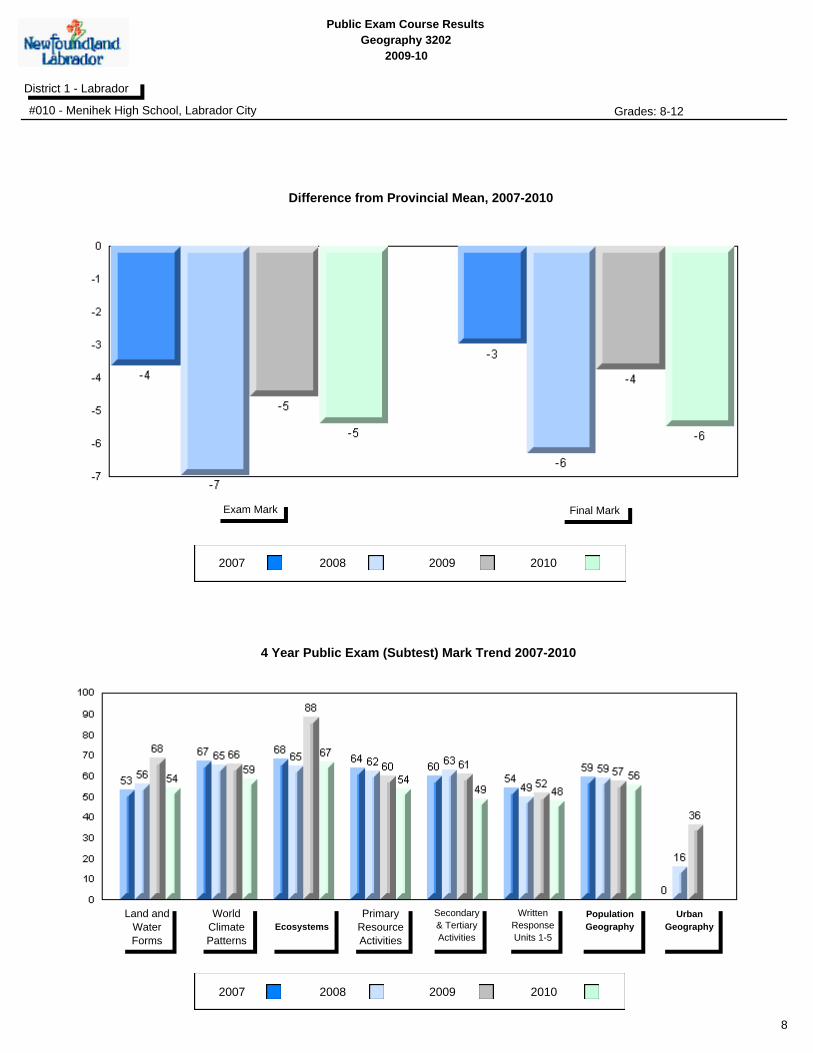
4 Year Public Exam (Subtest) Mark Trend 2007-2010
Difference from Provincial Mean, 2007-2010
2010
2010
8

Public Exam Course Results
Geography 3202
2009-10
District 1 - Labrador
#012 - J.C. Erhardt Memorial School, Makkovik Grades: K-2,4-12
2007 2008 2009
Final MarkExam Mark
School
vs
Province
School
vs
District
Final
Mark
q q 57.7
64.6
61.3
Number of Students
School
District
Province
School
District
Province
World
Climate
Patterns
School
DistrictEcosystems
Land and
Water Forms
Province
Subtest
School
vs
Province
School
vs
District
Public
Exam
Mark
School
District
Province
p p
q
p
p
p
p
q
59.0
3
58.8
56.3
World Geography 3202
School
District
Province
School
District
Province
Secondary &
Tertiary Activities
School
District
Written response
Units 1-5
Primary
Resource
Activities
Province
q
p
p
p
p
q
Population
Geography
School
District
Province
q q
Urban
Geography
School
District
Province
Multiple Choice
Long Answer
qppq
70.4
74.1
66.7
40.0
80.0
53.2
53.8
63.9
64.3
69.3
53.4
56.6
49.6
57.3
58.8
59.0
59.0
50.4
66.0
59.4
73.2
69.5
69.3
Average Mark, 2007-2010
2010
School data with 5 or fewer
students withheld for reasons of
confidentiality.
School data with 5 or fewer
students withheld for reasons of
confidentiality.
School data with 5 or fewer students withheld for reasons of confidentiality.
9

Public Exam Course Results
Geography 3202
2009-10
District 1 - Labrador
#012 - J.C. Erhardt Memorial School, Makkovik Grades: K-2,4-12
2007 2008 2009
2007 2008 2009
Final MarkExam Mark
Land and
Water
Forms
World
Climate
Patterns
Ecosystems
Primary
Resource
Activities
Secondary
& Tertiary
Activities
Written
Response
Units 1-5
Population
Geography
Urban
Geography
4 Year Public Exam (Subtest) Mark Trend 2007-2010
Difference from Provincial Mean, 2007-2010
2010
2010
School data with 5 or fewer students withheld for reasons of confidentiality.
School data with 5 or fewer students withheld for reasons of confidentiality.
10

Public Exam Course Results
Geography 3202
2009-10
District 1 - Labrador
#014 - Jens Haven Memorial, Nain Grades: K-12
2007 2008 2009
Final MarkExam Mark
School
vs
Province
School
vs
District
Final
Mark
p q 64.0
64.6
61.3
Number of Students
School
District
Province
School
District
Province
World
Climate
Patterns
School
DistrictEcosystems
Land and
Water Forms
Province
Subtest
School
vs
Province
School
vs
District
Public
Exam
Mark
School
District
Province
p q
q
p
p
p
p
q
58.0
1
58.8
56.3
World Geography 3202
School
District
Province
School
District
Province
Secondary &
Tertiary Activities
School
District
Written response
Units 1-5
Primary
Resource
Activities
Province
q
p
p
p
p
q
Population
Geography
School
District
Province
p p
Urban
Geography
School
District
Province
Multiple Choice
Long Answer
qppq
66.7
55.6
75.0
40.0
80.0
55.6
59.1
63.9
64.3
69.3
53.4
56.6
49.6
57.3
58.8
59.0
59.0
50.4
66.0
59.4
73.2
69.5
69.3
Average Mark, 2007-2010
2010
School data with 5 or fewer
students withheld for reasons of
confidentiality.
School data with 5 or fewer
students withheld for reasons of
confidentiality.
School data with 5 or fewer students withheld for reasons of confidentiality.
11

Public Exam Course Results
Geography 3202
2009-10
District 1 - Labrador
#014 - Jens Haven Memorial, Nain Grades: K-12
2007 2008 2009
2007 2008 2009
Final MarkExam Mark
Land and
Water
Forms
World
Climate
Patterns
Ecosystems
Primary
Resource
Activities
Secondary
& Tertiary
Activities
Written
Response
Units 1-5
Population
Geography
Urban
Geography
4 Year Public Exam (Subtest) Mark Trend 2007-2010
Difference from Provincial Mean, 2007-2010
2010
2010
School data with 5 or fewer students withheld for reasons of confidentiality.
School data with 5 or fewer students withheld for reasons of confidentiality.
12

Public Exam Course Results
Geography 3202
2009-10
District 1 - Labrador
#015 - Lake Melville School, North West River Grades: K-12
2007 2008 2009
Final MarkExam Mark
School
vs
Province
School
vs
District
Final
Mark
p p 77.5
64.6
61.3
Number of Students
School
District
Province
School
District
Province
World
Climate
Patterns
School
DistrictEcosystems
Land and
Water Forms
Province
Subtest
School
vs
Province
School
vs
District
Public
Exam
Mark
School
District
Province
p p
p
p
p
p
p
p
74.0
2
58.8
56.3
World Geography 3202
School
District
Province
School
District
Province
Secondary &
Tertiary Activities
School
District
Written response
Units 1-5
Primary
Resource
Activities
Province
p
p
p
p
p
p
Population
Geography
School
District
Province
qp pq
Urban
Geography
School
District
Province
Multiple Choice
Long Answer
pp
77.8
88.9
87.5
70.0
75.0
72.2
68.2
63.9
64.3
69.3
53.4
56.6
49.6
57.3
58.8
59.0
59.0
50.4
66.0
59.4
73.2
69.5
69.3
Average Mark, 2007-2010
2010
School data with 5 or fewer
students withheld for reasons of
confidentiality.
School data with 5 or fewer
students withheld for reasons of
confidentiality.
School data with 5 or fewer students withheld for reasons of confidentiality.
13

Public Exam Course Results
Geography 3202
2009-10
District 1 - Labrador
#015 - Lake Melville School, North West River Grades: K-12
2007 2008 2009
2007 2008 2009
Final MarkExam Mark
Land and
Water
Forms
World
Climate
Patterns
Ecosystems
Primary
Resource
Activities
Secondary
& Tertiary
Activities
Written
Response
Units 1-5
Population
Geography
Urban
Geography
4 Year Public Exam (Subtest) Mark Trend 2007-2010
Difference from Provincial Mean, 2007-2010
2010
2010
School data with 5 or fewer students withheld for reasons of confidentiality.
School data with 5 or fewer students withheld for reasons of confidentiality.
14

Public Exam Course Results
Geography 3202
2009-10
District 1 - Labrador
#016 - B.L. Morrison, Postville Grades: K-12
2007 2008 2009
Final MarkExam Mark
School
vs
Province
School
vs
District
Final
Mark
p p 66.0
64.6
61.3
Number of Students
School
District
Province
School
District
Province
World
Climate
Patterns
School
DistrictEcosystems
Land and
Water Forms
Province
Subtest
School
vs
Province
School
vs
District
Public
Exam
Mark
School
District
Province
q q
q
p
p
p
p
q
56.0
1
58.8
56.3
World Geography 3202
School
District
Province
School
District
Province
Secondary &
Tertiary Activities
School
District
Written response
Units 1-5
Primary
Resource
Activities
Province
q
p
p p
q
q
Population
Geography
School
District
Province
p p
Urban
Geography
School
District
Province
Multiple Choice
Long Answer
qppq
44.4
88.9
75.0
30.0
60.0
52.8
59.1
63.9
64.3
69.3
53.4
56.6
49.6
57.3
58.8
59.0
59.0
50.4
66.0
59.4
73.2
69.5
69.3
Average Mark, 2007-2010
2010
School data with 5 or fewer
students withheld for reasons of
confidentiality.
School data with 5 or fewer
students withheld for reasons of
confidentiality.
School data with 5 or fewer students withheld for reasons of confidentiality.
15

Public Exam Course Results
Geography 3202
2009-10
District 1 - Labrador
#016 - B.L. Morrison, Postville Grades: K-12
2007 2008 2009
2007 2008 2009
Final MarkExam Mark
Land and
Water
Forms
World
Climate
Patterns
Ecosystems
Primary
Resource
Activities
Secondary
& Tertiary
Activities
Written
Response
Units 1-5
Population
Geography
Urban
Geography
4 Year Public Exam (Subtest) Mark Trend 2007-2010
Difference from Provincial Mean, 2007-2010
2010
2010
School data with 5 or fewer students withheld for reasons of confidentiality.
School data with 5 or fewer students withheld for reasons of confidentiality.
16

Public Exam Course Results
Geography 3202
2009-10
District 1 - Labrador
#477 - Mealy Mountain Collegiate, Happy Valley-Goose Bay Grades: 8-12
2007 2008 2009
Final MarkExam Mark
School
vs
Province
School
vs
District
Final
Mark
q q 60.5
64.6
61.3
Number of Students
School
District
Province
School
District
Province
World
Climate
Patterns
School
DistrictEcosystems
Land and
Water Forms
Province
Subtest
School
vs
Province
School
vs
District
Public
Exam
Mark
School
District
Province
q q
q
p
p
p
q
q
55.6
42
58.8
56.3
World Geography 3202
School
District
Province
School
District
Province
Secondary &
Tertiary Activities
School
District
Written response
Units 1-5
Primary
Resource
Activities
Province
q
q
p
q
q
q
Population
Geography
School
District
Province
q q
Urban
Geography
School
District
Province
Multiple Choice
Long Answer
66.7
64.6
64.3
49.5
58.1
49.1
47.7
58.7
63.9
64.3
69.3
53.4
56.6
49.6
57.3
58.8
59.0
59.0
50.4
66.0
59.4
73.2
69.5
69.3
Average Mark, 2007-2010
2010
17
Public Exam Course Results
Geography 3202
2009-10
District 1 - Labrador
#477 - Mealy Mountain Collegiate, Happy Valley-Goose Bay Grades: 8-12
2007 2008 2009
2007 2008 2009
Final MarkExam Mark
Land and
Water
Forms
World
Climate
Patterns
Ecosystems
Primary
Resource
Activities
Secondary
& Tertiary
Activities
Written
Response
Units 1-5
Population
Geography
Urban
Geography
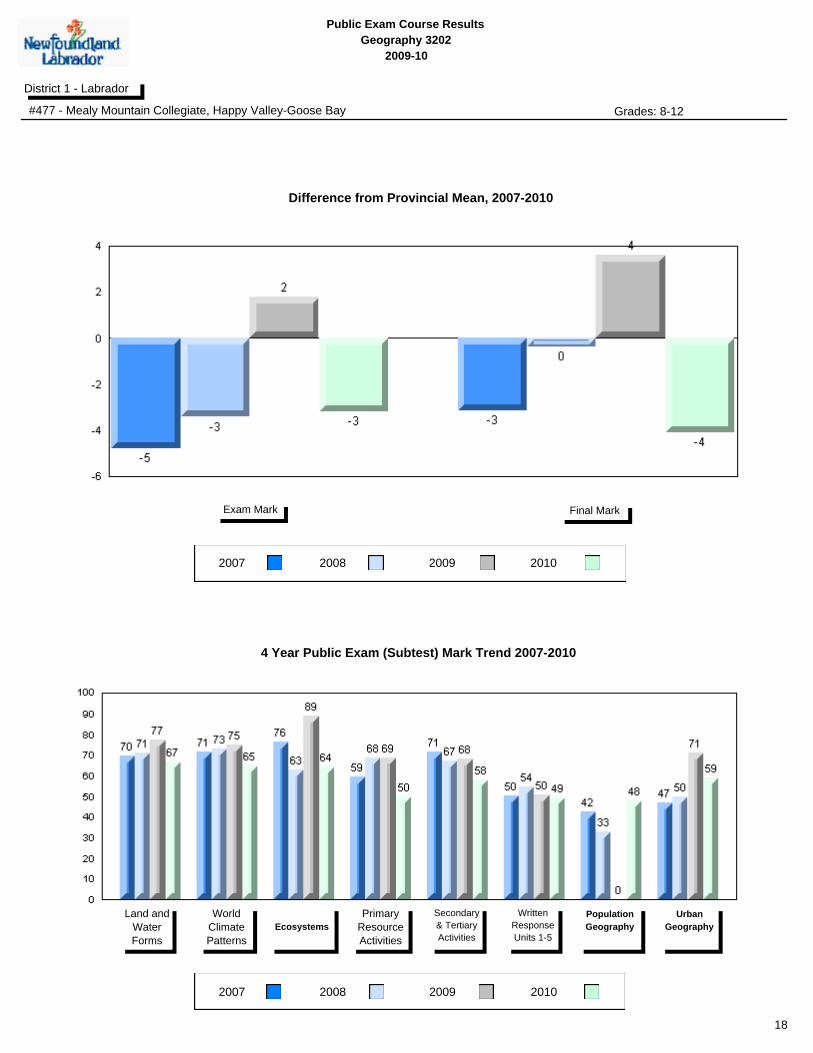
4 Year Public Exam (Subtest) Mark Trend 2007-2010
Difference from Provincial Mean, 2007-2010
2010
2010
18
Public Exam Course Results
Geography 3202
2009-10
District 2 - Western
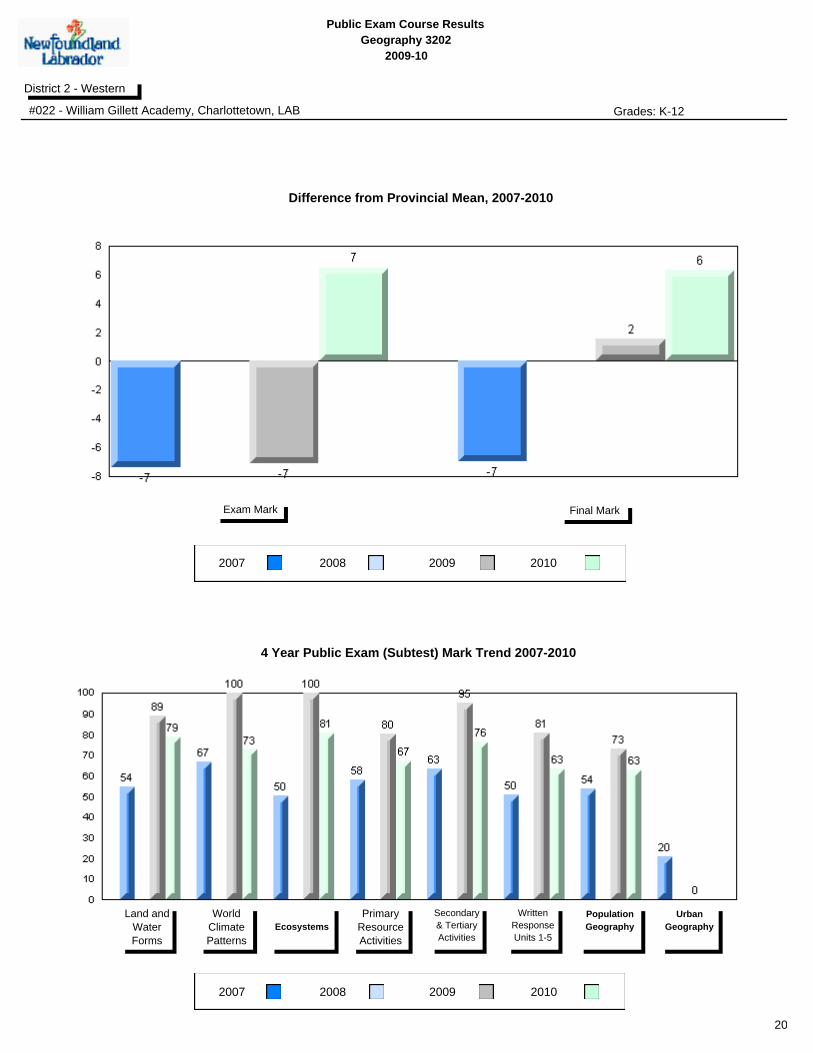
#022 - William Gillett Academy, Charlottetown, LAB Grades: K-12
2007 2008 2009
Final MarkExam Mark
School
vs
Province
School
vs
District
Final
Mark
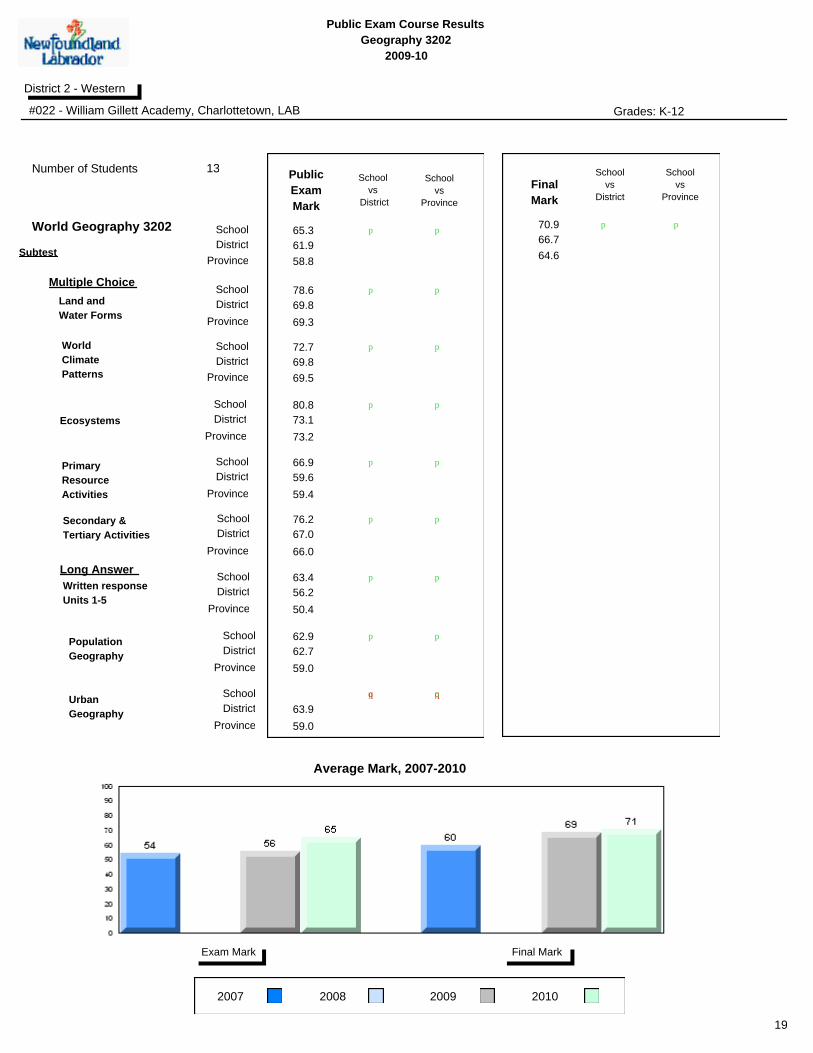
p p 70.9
64.6
66.7
Number of Students
School
District
Province
School
District
Province
World
Climate
Patterns
School
DistrictEcosystems
Land and
Water Forms
Province
Subtest
School
vs
Province
School
vs
District
Public
Exam
Mark
School
District
Province
p p
p
p
p
p
p
p
65.3
13
58.8
61.9
World Geography 3202
School
District
Province
School
District
Province
Secondary &
Tertiary Activities
School
District
Written response
Units 1-5
Primary
Resource
Activities
Province
p
p
p
p
p
p
Population
Geography
School
District
Province
p p
Urban
Geography
School
District
Province
Multiple Choice
Long Answer
qppq
78.6
72.7
80.8
66.9
76.2
63.4
62.9
69.8
69.8
73.1
59.6
67.0
56.2
62.7
63.9
59.0
59.0
50.4
66.0
59.4
73.2
69.5
69.3
Average Mark, 2007-2010
2010
19
Public Exam Course Results
Geography 3202
2009-10
District 2 - Western
#022 - William Gillett Academy, Charlottetown, LAB Grades: K-12
2007 2008 2009
2007 2008 2009
Final MarkExam Mark
Land and
Water
Forms
World
Climate
Patterns
Ecosystems
Primary
Resource
Activities
Secondary
& Tertiary
Activities
Written
Response
Units 1-5
Population
Geography
Urban
Geography
4 Year Public Exam (Subtest) Mark Trend 2007-2010
Difference from Provincial Mean, 2007-2010
2010
2010
20

Public Exam Course Results
Geography 3202
2009-10
District 2 - Western
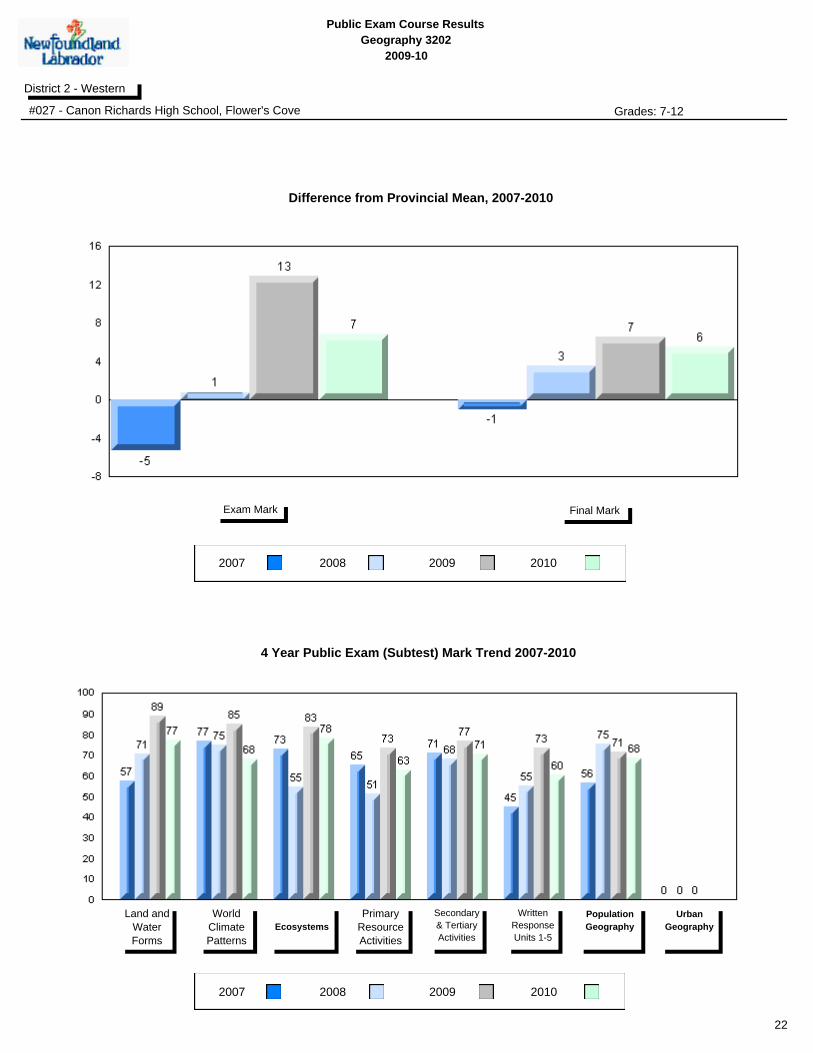
#027 - Canon Richards High School, Flower's Cove Grades: 7-12
2007 2008 2009
Final MarkExam Mark
School
vs
Province
School
vs
District
Final
Mark
p p 70.1
64.6
66.7
Number of Students
School
District
Province
School
District
Province
World
Climate
Patterns
School
DistrictEcosystems
Land and
Water Forms
Province
Subtest
School
vs
Province
School
vs
District
Public
Exam
Mark
School
District
Province
p p
q
p
p
p
p
q
65.6
16
58.8
61.9
World Geography 3202
School
District
Province
School
District
Province
Secondary &
Tertiary Activities
School
District
Written response
Units 1-5
Primary
Resource
Activities
Province
p
p
p
p
p
p
Population
Geography
School
District
Province
p p
Urban
Geography
School
District
Province
Multiple Choice
Long Answer
qppq
77.1
68.1
78.1
62.5
70.6
60.3
68.4
69.8
69.8
73.1
59.6
67.0
56.2
62.7
63.9
59.0
59.0
50.4
66.0
59.4
73.2
69.5
69.3
Average Mark, 2007-2010
2010
21
Public Exam Course Results
Geography 3202
2009-10
District 2 - Western
#027 - Canon Richards High School, Flower's Cove Grades: 7-12
2007 2008 2009
2007 2008 2009
Final MarkExam Mark
Land and
Water
Forms
World
Climate
Patterns
Ecosystems
Primary
Resource
Activities
Secondary
& Tertiary
Activities
Written
Response
Units 1-5
Population
Geography
Urban
Geography
4 Year Public Exam (Subtest) Mark Trend 2007-2010
Difference from Provincial Mean, 2007-2010
2010
2010
22

Public Exam Course Results
Geography 3202
2009-10
District 2 - Western
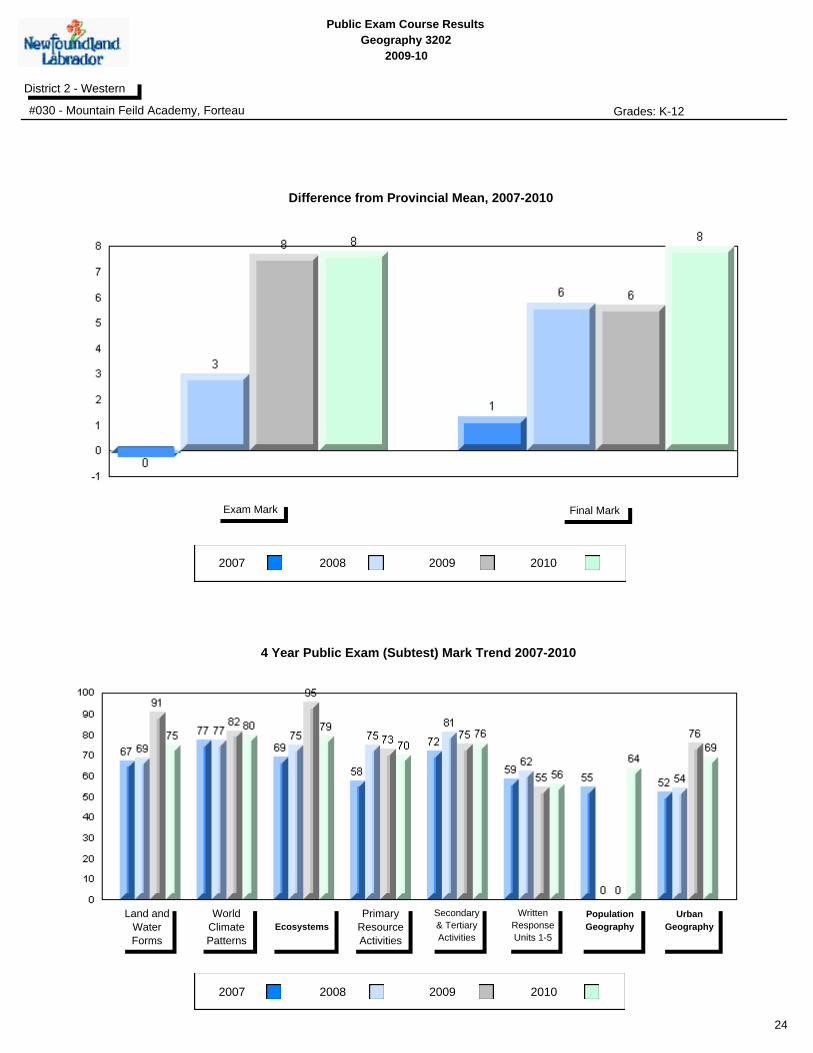
#030 - Mountain Feild Academy, Forteau Grades: K-12
2007 2008 2009
Final MarkExam Mark
School
vs
Province
School
vs
District
Final
Mark
p p 72.6
64.6
66.7
Number of Students
School
District
Province
School
District
Province
World
Climate
Patterns
School
DistrictEcosystems
Land and
Water Forms
Province
Subtest
School
vs
Province
School
vs
District
Public
Exam
Mark
School
District
Province
p p
p
p
p
p
p
p
66.6
12
58.8
61.9
World Geography 3202
School
District
Province
School
District
Province
Secondary &
Tertiary Activities
School
District
Written response
Units 1-5
Primary
Resource
Activities
Province
q
p
p
p
p
p
Population
Geography
School
District
Province
p p
Urban
Geography
School
District
Province
Multiple Choice
Long Answer
pp
75.0
79.6
79.2
70.0
75.8
56.0
63.6
69.1
69.8
69.8
73.1
59.6
67.0
56.2
62.7
63.9
59.0
59.0
50.4
66.0
59.4
73.2
69.5
69.3
Average Mark, 2007-2010
2010
23
Public Exam Course Results
Geography 3202
2009-10
District 2 - Western
#030 - Mountain Feild Academy, Forteau Grades: K-12
2007 2008 2009
2007 2008 2009
Final MarkExam Mark
Land and
Water
Forms
World
Climate
Patterns
Ecosystems
Primary
Resource
Activities
Secondary
& Tertiary
Activities
Written
Response
Units 1-5
Population
Geography
Urban
Geography
4 Year Public Exam (Subtest) Mark Trend 2007-2010
Difference from Provincial Mean, 2007-2010
2010
2010
24

Public Exam Course Results
Geography 3202
2009-10
District 2 - Western
#039 - Mary Simms All-Grade, Main Brook Grades: K-12
2007 2008 2009
Final MarkExam Mark
School
vs
Province
School
vs
District
Final
Mark
p p 69.0
64.6
66.7
Number of Students
School
District
Province
School
District
Province
World
Climate
Patterns
School
DistrictEcosystems
Land and
Water Forms
Province
Subtest
School
vs
Province
School
vs
District
Public
Exam
Mark
School
District
Province
p p
q
p
p
p
p
q
65.0
1
58.8
61.9
World Geography 3202
School
District
Province
School
District
Province
Secondary &
Tertiary Activities
School
District
Written response
Units 1-5
Primary
Resource
Activities
Province
q
p
p
p
p
p
Population
Geography
School
District
Province
p p
Urban
Geography
School
District
Province
Multiple Choice
Long Answer
qppq
55.6
77.8
100.0
90.0
80.0
52.8
63.6
69.8
69.8
73.1
59.6
67.0
56.2
62.7
63.9
59.0
59.0
50.4
66.0
59.4
73.2
69.5
69.3
Average Mark, 2007-2010
2010
School data with 5 or fewer
students withheld for reasons of
confidentiality.
School data with 5 or fewer
students withheld for reasons of
confidentiality.
School data with 5 or fewer students withheld for reasons of confidentiality.
25

Public Exam Course Results
Geography 3202
2009-10
District 2 - Western
#039 - Mary Simms All-Grade, Main Brook Grades: K-12
2007 2008 2009
2007 2008 2009
Final MarkExam Mark
Land and
Water
Forms
World
Climate
Patterns
Ecosystems
Primary
Resource
Activities
Secondary
& Tertiary
Activities
Written
Response
Units 1-5
Population
Geography
Urban
Geography
4 Year Public Exam (Subtest) Mark Trend 2007-2010
Difference from Provincial Mean, 2007-2010
2010
2010
School data with 5 or fewer students withheld for reasons of confidentiality.
School data with 5 or fewer students withheld for reasons of confidentiality.
26

Public Exam Course Results
Geography 3202
2009-10
District 2 - Western
#041 - Raymond Ward Memorial, Norman Bay Grades: 4-5,7-8,10-12
2007 2008 2009
Final MarkExam Mark
School
vs
Province
School
vs
District
Final
Mark
q q 57.0
64.6
66.7
Number of Students
School
District
Province
School
District
Province
World
Climate
Patterns
School
DistrictEcosystems
Land and
Water Forms
Province
Subtest
School
vs
Province
School
vs
District
Public
Exam
Mark
School
District
Province
q q
q
q
p p
q
q
53.0
1
58.8
61.9
World Geography 3202
School
District
Province
School
District
Province
Secondary &
Tertiary Activities
School
District
Written response
Units 1-5
Primary
Resource
Activities
Province
q
q
p p
q
q
Population
Geography
School
District
Province
qp pq
Urban
Geography
School
District
Province
Multiple Choice
Long Answer
pq
55.6
44.4
75.0
60.0
50.0
47.2
63.6
69.8
69.8
73.1
59.6
67.0
56.2
62.7
63.9
59.0
59.0
50.4
66.0
59.4
73.2
69.5
69.3
Average Mark, 2007-2010
2010
School data with 5 or fewer
students withheld for reasons of
confidentiality.
School data with 5 or fewer
students withheld for reasons of
confidentiality.
School data with 5 or fewer students withheld for reasons of confidentiality.
27

Public Exam Course Results
Geography 3202
2009-10
District 2 - Western
#041 - Raymond Ward Memorial, Norman Bay Grades: 4-5,7-8,10-12
2007 2008 2009
2007 2008 2009
Final MarkExam Mark
Land and
Water
Forms
World
Climate
Patterns
Ecosystems
Primary
Resource
Activities
Secondary
& Tertiary
Activities
Written
Response
Units 1-5
Population
Geography
Urban
Geography
4 Year Public Exam (Subtest) Mark Trend 2007-2010
Difference from Provincial Mean, 2007-2010
2010
2010
School data with 5 or fewer students withheld for reasons of confidentiality.
School data with 5 or fewer students withheld for reasons of confidentiality.
28

Public Exam Course Results
Geography 3202
2009-10
District 2 - Western
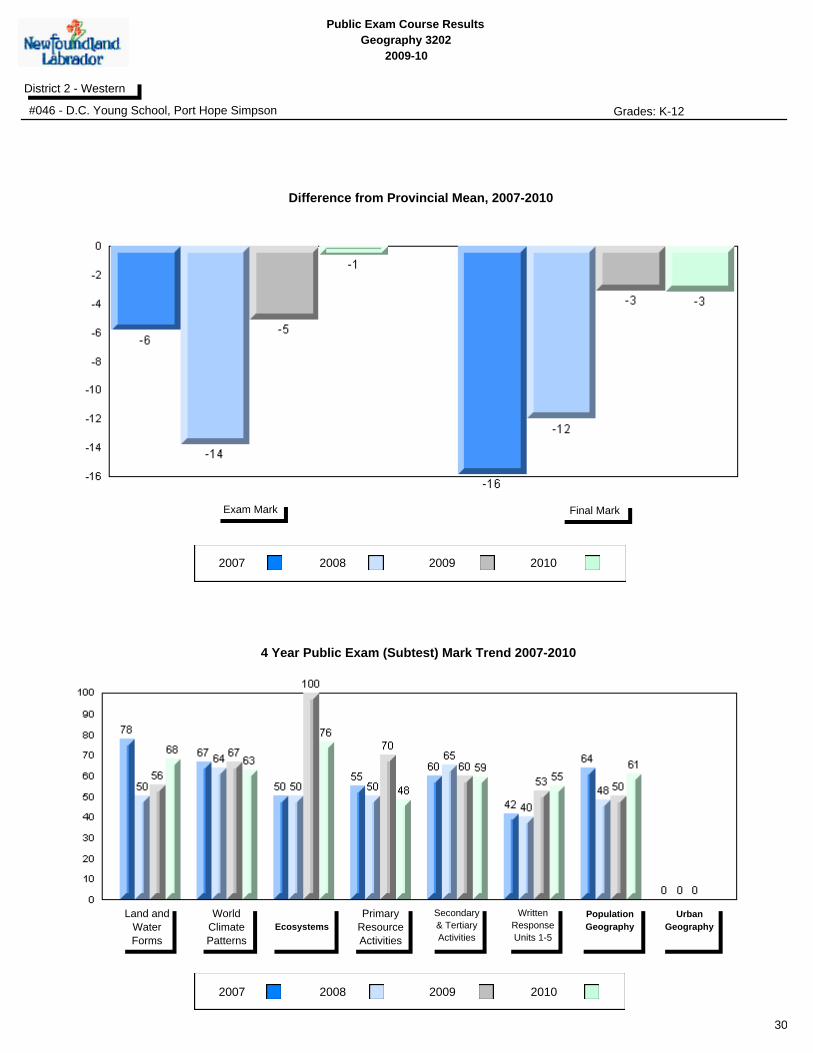
#046 - D.C. Young School, Port Hope Simpson Grades: K-12
2007 2008 2009
Final MarkExam Mark
School
vs
Province
School
vs
District
Final
Mark
q q 61.4
64.6
66.7
Number of Students
School
District
Province
School
District
Province
World
Climate
Patterns
School
DistrictEcosystems
Land and
Water Forms
Province
Subtest
School
vs
Province
School
vs
District
Public
Exam
Mark
School
District
Province
q q
q
q
p
p
p
q
58.2
23
58.8
61.9
World Geography 3202
School
District
Province
School
District
Province
Secondary &
Tertiary Activities
School
District
Written response
Units 1-5
Primary
Resource
Activities
Province
q
q
q p
q
q
Population
Geography
School
District
Province
q p
Urban
Geography
School
District
Province
Multiple Choice
Long Answer
qppq
68.1
62.8
76.1
48.3
59.1
54.8
60.7
69.8
69.8
73.1
59.6
67.0
56.2
62.7
63.9
59.0
59.0
50.4
66.0
59.4
73.2
69.5
69.3
Average Mark, 2007-2010
2010
29
Public Exam Course Results
Geography 3202
2009-10
District 2 - Western
#046 - D.C. Young School, Port Hope Simpson Grades: K-12
2007 2008 2009
2007 2008 2009
Final MarkExam Mark
Land and
Water
Forms
World
Climate
Patterns
Ecosystems
Primary
Resource
Activities
Secondary
& Tertiary
Activities
Written
Response
Units 1-5
Population
Geography
Urban
Geography
4 Year Public Exam (Subtest) Mark Trend 2007-2010
Difference from Provincial Mean, 2007-2010
2010
2010
30

Public Exam Course Results
Geography 3202
2009-10
District 2 - Western
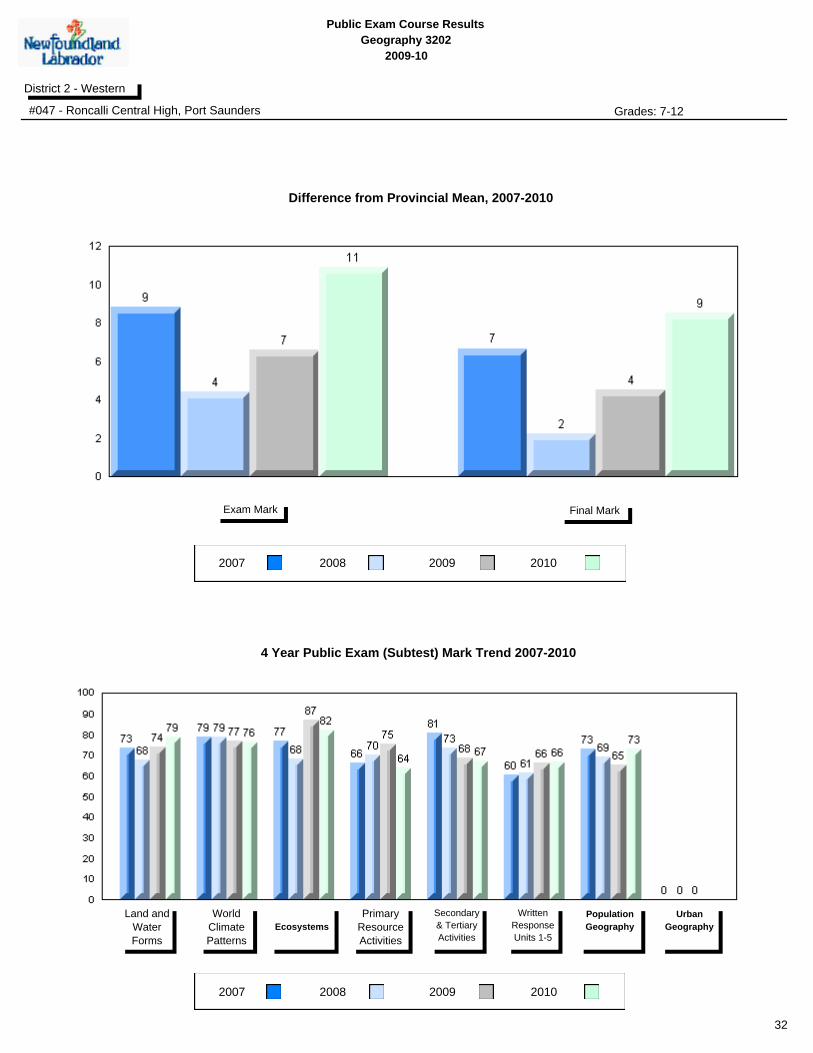
#047 - Roncalli Central High, Port Saunders Grades: 7-12
2007 2008 2009
Final MarkExam Mark
School
vs
Province
School
vs
District
Final
Mark
p p 73.1
64.6
66.7
Number of Students
School
District
Province
School
District
Province
World
Climate
Patterns
School
DistrictEcosystems
Land and
Water Forms
Province
Subtest
School
vs
Province
School
vs
District
Public
Exam
Mark
School
District
Province
p p
p
p
p
p
p
p
69.7
14
58.8
61.9
World Geography 3202
School
District
Province
School
District
Province
Secondary &
Tertiary Activities
School
District
Written response
Units 1-5
Primary
Resource
Activities
Province
p
p
p
p
p
p
Population
Geography
School
District
Province
p p
Urban
Geography
School
District
Province
Multiple Choice
Long Answer
qppq
78.6
76.2
82.1
63.6
67.1
66.4
73.0
69.8
69.8
73.1
59.6
67.0
56.2
62.7
63.9
59.0
59.0
50.4
66.0
59.4
73.2
69.5
69.3
Average Mark, 2007-2010
2010
31
Public Exam Course Results
Geography 3202
2009-10
District 2 - Western
#047 - Roncalli Central High, Port Saunders Grades: 7-12
2007 2008 2009
2007 2008 2009
Final MarkExam Mark
Land and
Water
Forms
World
Climate
Patterns
Ecosystems
Primary
Resource
Activities
Secondary
& Tertiary
Activities
Written
Response
Units 1-5
Population
Geography
Urban
Geography
4 Year Public Exam (Subtest) Mark Trend 2007-2010
Difference from Provincial Mean, 2007-2010
2010
2010
32
Public Exam Course Results
Geography 3202
2009-10
District 2 - Western
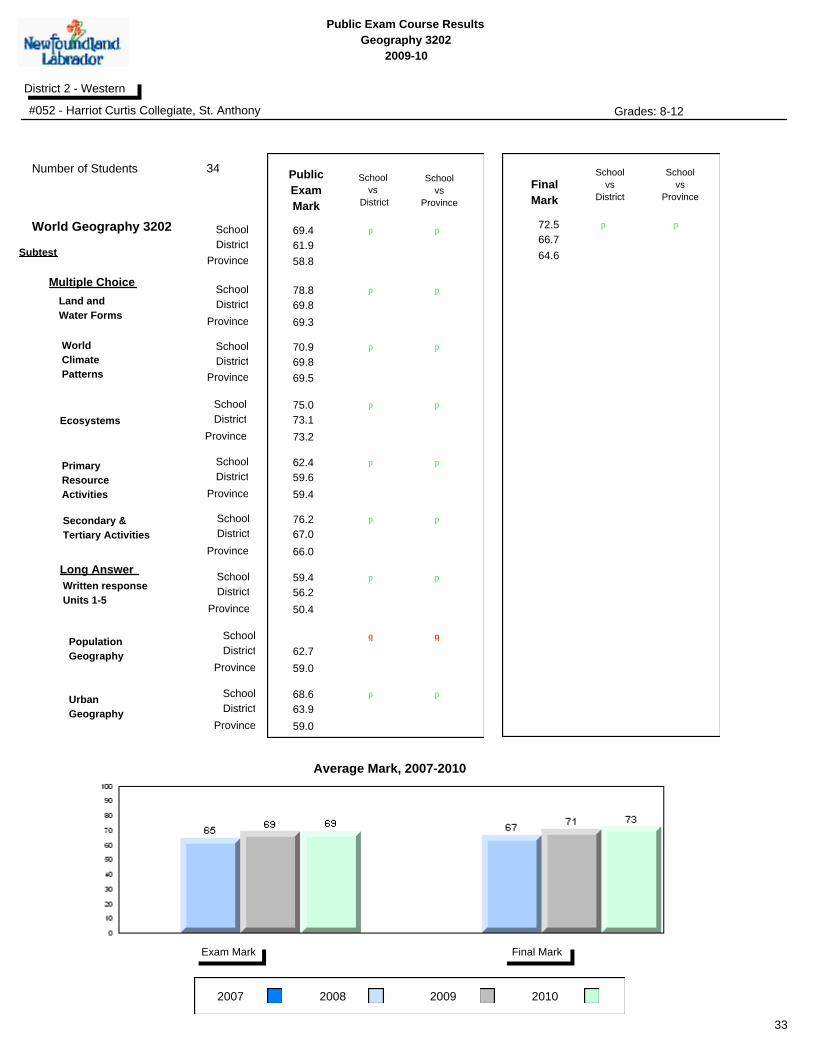
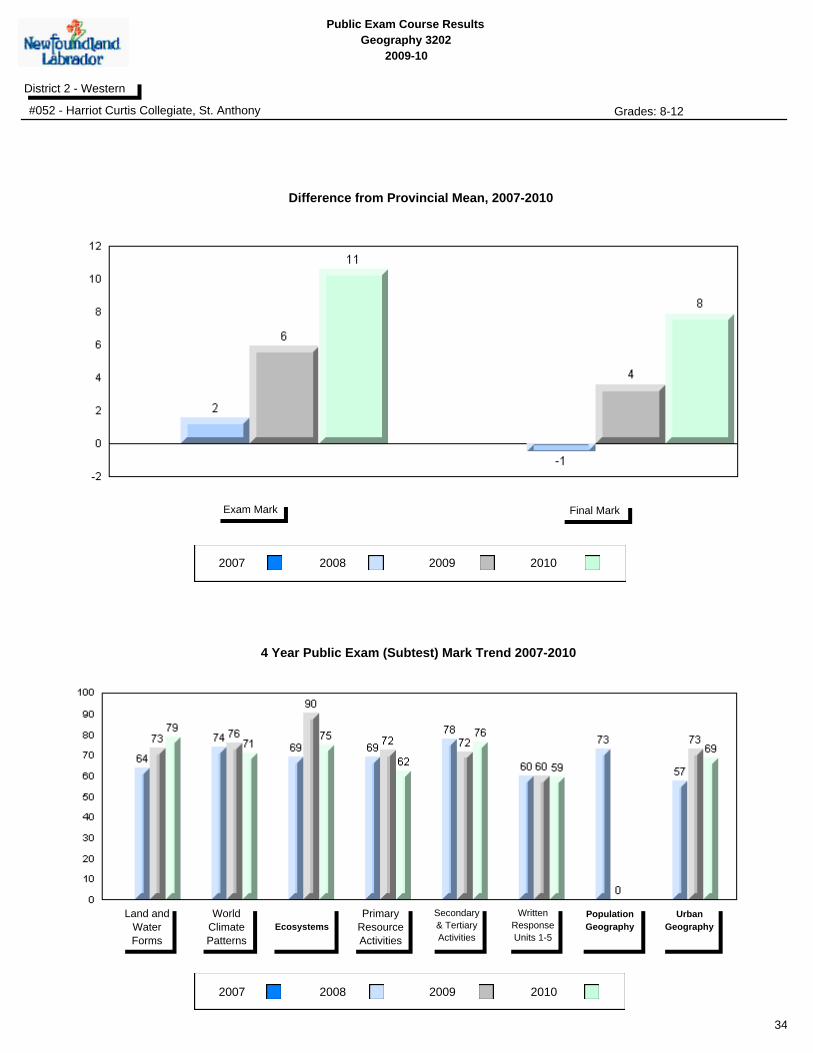
#052 - Harriot Curtis Collegiate, St. Anthony Grades: 8-12
2007 2008 2009
Final MarkExam Mark
School
vs
Province
School
vs
District
Final
Mark
p p 72.5
64.6
66.7
Number of Students
School
District
Province
School
District
Province
World
Climate
Patterns
School
DistrictEcosystems
Land and
Water Forms
Province
Subtest
School
vs
Province
School
vs
District
Public
Exam
Mark
School
District
Province
p p
p
p
p
p
p
p
69.4
34
58.8
61.9
World Geography 3202
School
District
Province
School
District
Province
Secondary &
Tertiary Activities
School
District
Written response
Units 1-5
Primary
Resource
Activities
Province
p
p
p
p
p
p
Population
Geography
School
District
Province
qp pq
Urban
Geography
School
District
Province
Multiple Choice
Long Answer
pp
78.8
70.9
75.0
62.4
76.2
59.4
68.6
69.8
69.8
73.1
59.6
67.0
56.2
62.7
63.9
59.0
59.0
50.4
66.0
59.4
73.2
69.5
69.3
Average Mark, 2007-2010
2010
33
Public Exam Course Results
Geography 3202
2009-10
District 2 - Western
#052 - Harriot Curtis Collegiate, St. Anthony Grades: 8-12
2007 2008 2009
2007 2008 2009
Final MarkExam Mark
Land and
Water
Forms
World
Climate
Patterns
Ecosystems
Primary
Resource
Activities
Secondary
& Tertiary
Activities
Written
Response
Units 1-5
Population
Geography
Urban
Geography
4 Year Public Exam (Subtest) Mark Trend 2007-2010
Difference from Provincial Mean, 2007-2010
2010
2010
34

Public Exam Course Results
Geography 3202
2009-10
District 2 - Western
#054 - St. Lewis Academy, St. Lewis Grades: K-5,7-12
2007 2008 2009
Final MarkExam Mark
School
vs
Province
School
vs
District
Final
Mark
q q 60.2
64.6
66.7
Number of Students
School
District
Province
School
District
Province
World
Climate
Patterns
School
DistrictEcosystems
Land and
Water Forms
Province
Subtest
School
vs
Province
School
vs
District
Public
Exam
Mark
School
District
Province
q q
q
q
q
q
q
q
52.0
5
58.8
61.9
World Geography 3202
School
District
Province
School
District
Province
Secondary &
Tertiary Activities
School
District
Written response
Units 1-5
Primary
Resource
Activities
Province
q
q
q
q
q
q
Population
Geography
School
District
Province
q q
Urban
Geography
School
District
Province
Multiple Choice
Long Answer
qppq
48.9
60.0
70.0
44.0
58.0
47.5
58.2
69.8
69.8
73.1
59.6
67.0
56.2
62.7
63.9
59.0
59.0
50.4
66.0
59.4
73.2
69.5
69.3
Average Mark, 2007-2010
2010
School data with 5 or fewer
students withheld for reasons of
confidentiality.
School data with 5 or fewer
students withheld for reasons of
confidentiality.
School data with 5 or fewer students withheld for reasons of confidentiality.
35

Public Exam Course Results
Geography 3202
2009-10
District 2 - Western
#054 - St. Lewis Academy, St. Lewis Grades: K-5,7-12
2007 2008 2009
2007 2008 2009
Final MarkExam Mark
Land and
Water
Forms
World
Climate
Patterns
Ecosystems
Primary
Resource
Activities
Secondary
& Tertiary
Activities
Written
Response
Units 1-5
Population
Geography
Urban
Geography
4 Year Public Exam (Subtest) Mark Trend 2007-2010
Difference from Provincial Mean, 2007-2010
2010
2010
School data with 5 or fewer students withheld for reasons of confidentiality.
School data with 5 or fewer students withheld for reasons of confidentiality.
36
Public Exam Course Results
Geography 3202
2009-10
District 2 - Western
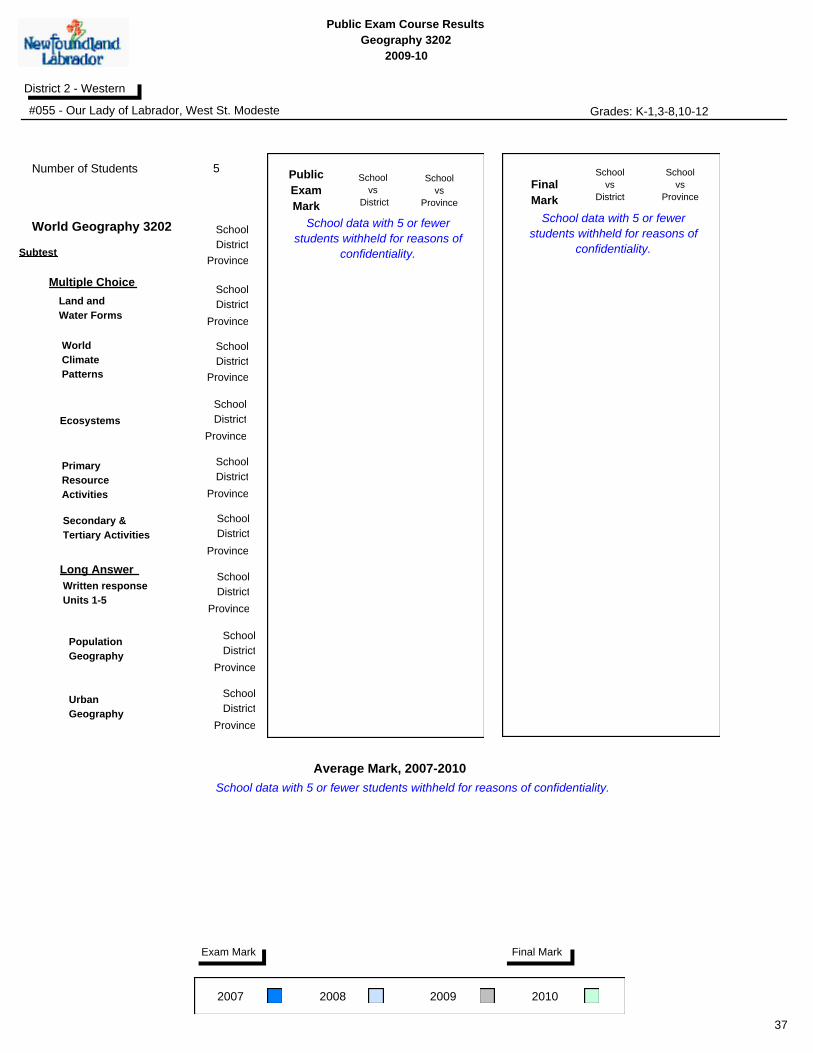
#055 - Our Lady of Labrador, West St. Modeste Grades: K-1,3-8,10-12
2007 2008 2009
Final MarkExam Mark
School
vs
Province
School
vs
District
Final
Mark
q q 50.4
64.6
66.7
Number of Students
School
District
Province
School
District
Province
World
Climate
Patterns
School
DistrictEcosystems
Land and
Water Forms
Province
Subtest
School
vs
Province
School
vs
District
Public
Exam
Mark
School
District
Province
q q
q
q
q
p
q
q
44.8
5
58.8
61.9
World Geography 3202
School
District
Province
School
District
Province
Secondary &
Tertiary Activities
School
District
Written response
Units 1-5
Primary
Resource
Activities
Province
q
q
q
q
q
q
Population
Geography
School
District
Province
q q
Urban
Geography
School
District
Province
Multiple Choice
Long Answer
62.2
48.9
60.0
52.0
40.0
36.9
46.6
50.0
69.8
69.8
73.1
59.6
67.0
56.2
62.7
63.9
59.0
59.0
50.4
66.0
59.4
73.2
69.5
69.3
Average Mark, 2007-2010
2010
School data with 5 or fewer
students withheld for reasons of
confidentiality.
School data with 5 or fewer
students withheld for reasons of
confidentiality.
School data with 5 or fewer students withheld for reasons of confidentiality.
37
Public Exam Course Results
Geography 3202
2009-10
District 2 - Western
#055 - Our Lady of Labrador, West St. Modeste Grades: K-1,3-8,10-12
2007 2008 2009
2007 2008 2009
Final MarkExam Mark
Land and
Water
Forms
World
Climate
Patterns
Ecosystems
Primary
Resource
Activities
Secondary
& Tertiary
Activities
Written
Response
Units 1-5
Population
Geography
Urban
Geography
4 Year Public Exam (Subtest) Mark Trend 2007-2010
Difference from Provincial Mean, 2007-2010
2010
2010
School data with 5 or fewer students withheld for reasons of confidentiality.
School data with 5 or fewer students withheld for reasons of confidentiality.
38
Public Exam Course Results
Geography 3202
2009-10
District 2 - Western
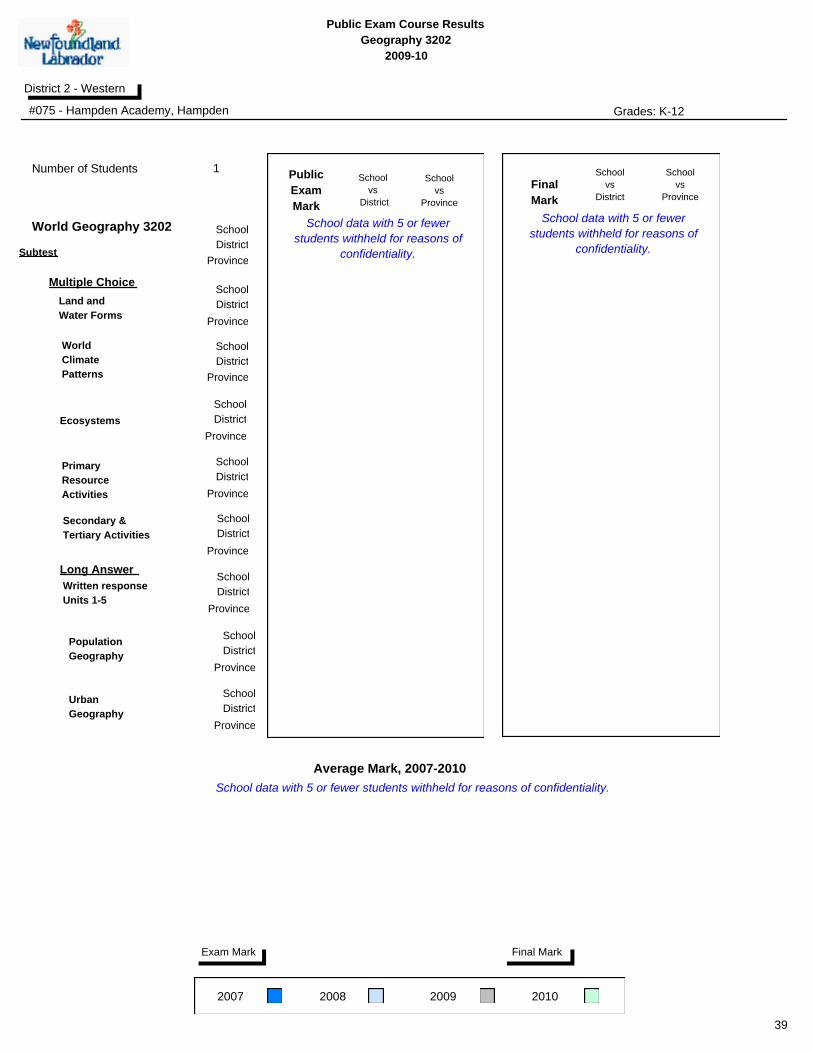
#075 - Hampden Academy, Hampden Grades: K-12
2007 2008 2009
Final MarkExam Mark
School
vs
Province
School
vs
District
Final
Mark
q q 50.0
64.6
66.7
Number of Students
School
District
Province
School
District
Province
World
Climate
Patterns
School
DistrictEcosystems
Land and
Water Forms
Province
Subtest
School
vs
Province
School
vs
District
Public
Exam
Mark
School
District
Province
q q
q
q
p p
q
q
55.0
1
58.8
61.9
World Geography 3202
School
District
Province
School
District
Province
Secondary &
Tertiary Activities
School
District
Written response
Units 1-5
Primary
Resource
Activities
Province
q
q
q
q
q
q
Population
Geography
School
District
Province
q q
Urban
Geography
School
District
Province
Multiple Choice
Long Answer
qppq
77.8
66.7
50.0
50.0
50.0
48.6
54.6
69.8
69.8
73.1
59.6
67.0
56.2
62.7
63.9
59.0
59.0
50.4
66.0
59.4
73.2
69.5
69.3
Average Mark, 2007-2010
2010
School data with 5 or fewer
students withheld for reasons of
confidentiality.
School data with 5 or fewer
students withheld for reasons of
confidentiality.
School data with 5 or fewer students withheld for reasons of confidentiality.
39

Public Exam Course Results
Geography 3202
2009-10
District 2 - Western
#075 - Hampden Academy, Hampden Grades: K-12
2007 2008 2009
2007 2008 2009
Final MarkExam Mark
Land and
Water
Forms
World
Climate
Patterns
Ecosystems
Primary
Resource
Activities
Secondary
& Tertiary
Activities
Written
Response
Units 1-5
Population
Geography
Urban
Geography
4 Year Public Exam (Subtest) Mark Trend 2007-2010
Difference from Provincial Mean, 2007-2010
2010
2010
School data with 5 or fewer students withheld for reasons of confidentiality.
School data with 5 or fewer students withheld for reasons of confidentiality.
40
Public Exam Course Results
Geography 3202
2009-10
District 2 - Western
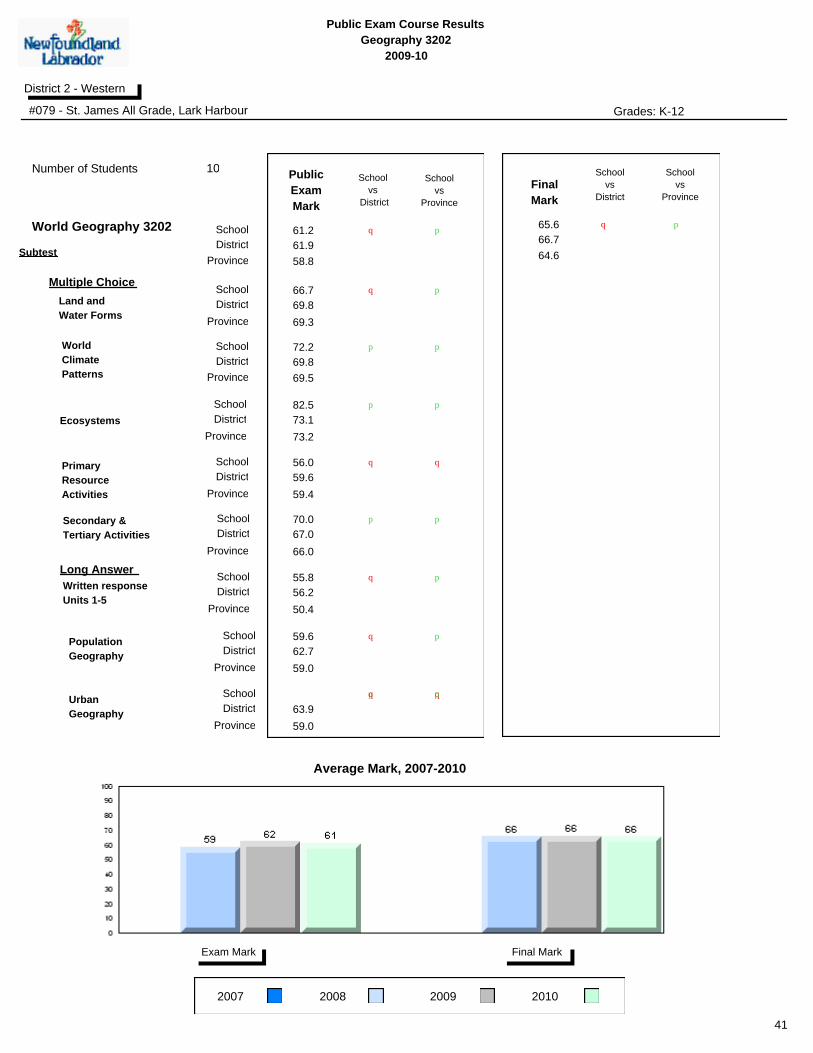
#079 - St. James All Grade, Lark Harbour Grades: K-12
2007 2008 2009
Final MarkExam Mark
School
vs
Province
School
vs
District
Final
Mark
q p 65.6
64.6
66.7
Number of Students
School
District
Province
School
District
Province
World
Climate
Patterns
School
DistrictEcosystems
Land and
Water Forms
Province
Subtest
School
vs
Province
School
vs
District
Public
Exam
Mark
School
District
Province
q p
q
p
p
p
p
p
61.2
10
58.8
61.9
World Geography 3202
School
District
Province
School
District
Province
Secondary &
Tertiary Activities
School
District
Written response
Units 1-5
Primary
Resource
Activities
Province
q
q
p p
p
q
Population
Geography
School
District
Province
q p
Urban
Geography
School
District
Province
Multiple Choice
Long Answer
qppq
66.7
72.2
82.5
56.0
70.0
55.8
59.6
69.8
69.8
73.1
59.6
67.0
56.2
62.7
63.9
59.0
59.0
50.4
66.0
59.4
73.2
69.5
69.3
Average Mark, 2007-2010
2010
41
Public Exam Course Results
Geography 3202
2009-10
District 2 - Western
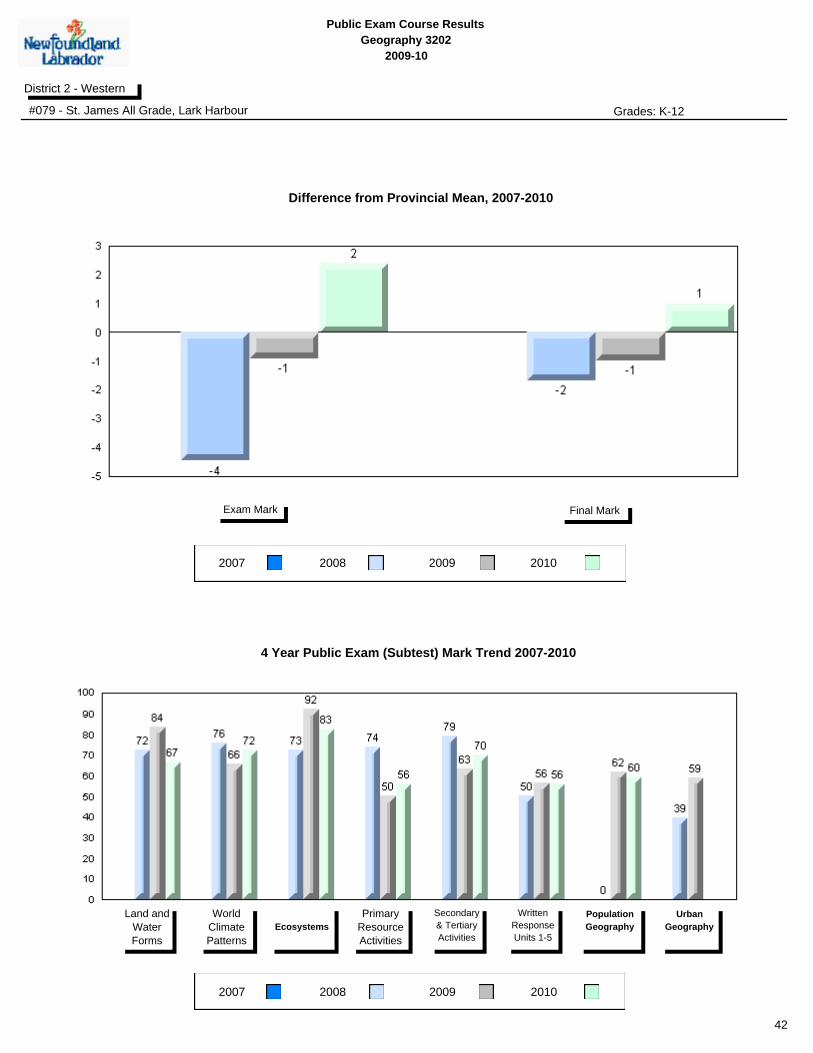
#079 - St. James All Grade, Lark Harbour Grades: K-12
2007 2008 2009
2007 2008 2009
Final MarkExam Mark
Land and
Water
Forms
World
Climate
Patterns
Ecosystems
Primary
Resource
Activities
Secondary
& Tertiary
Activities
Written
Response
Units 1-5
Population
Geography
Urban
Geography
4 Year Public Exam (Subtest) Mark Trend 2007-2010
Difference from Provincial Mean, 2007-2010
2010
2010
42

Public Exam Course Results
Geography 3202
2009-10
District 2 - Western
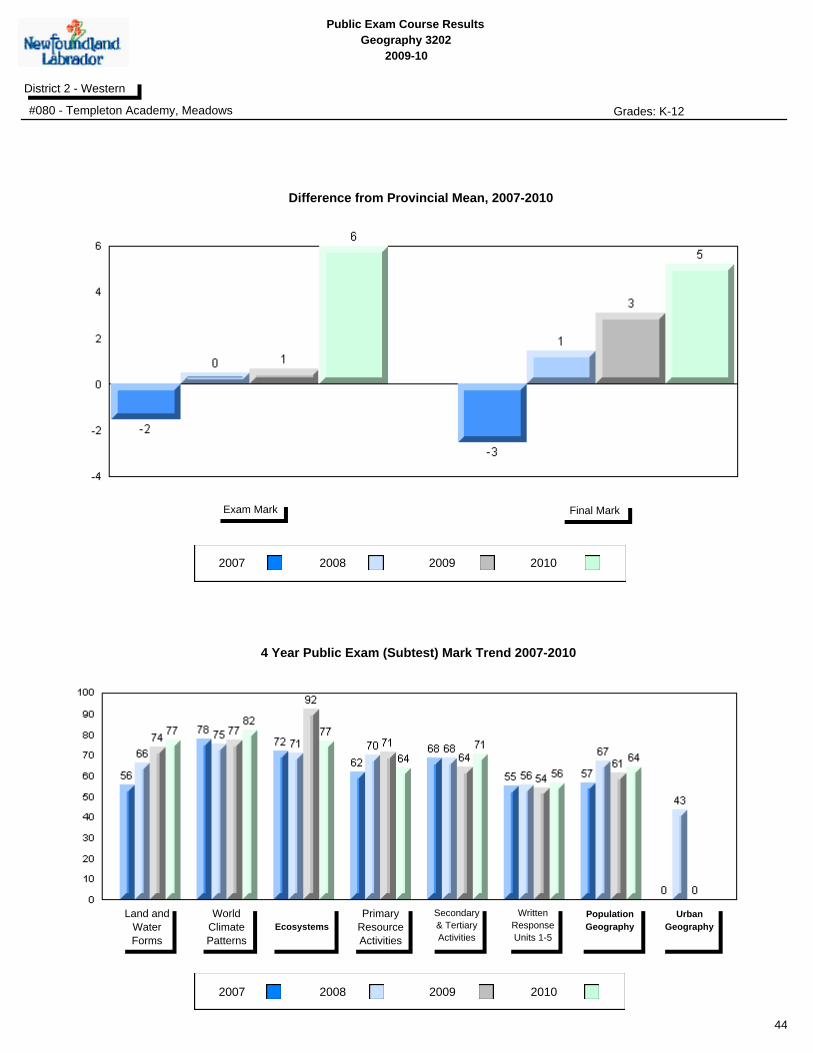
#080 - Templeton Academy, Meadows Grades: K-12
2007 2008 2009
Final MarkExam Mark
School
vs
Province
School
vs
District
Final
Mark
p p 69.8
64.6
66.7
Number of Students
School
District
Province
School
District
Province
World
Climate
Patterns
School
DistrictEcosystems
Land and
Water Forms
Province
Subtest
School
vs
Province
School
vs
District
Public
Exam
Mark
School
District
Province
p p
p
p
p
p
p
p
64.8
30
58.8
61.9
World Geography 3202
School
District
Province
School
District
Province
Secondary &
Tertiary Activities
School
District
Written response
Units 1-5
Primary
Resource
Activities
Province
p
p
p
p
p
p
Population
Geography
School
District
Province
p p
Urban
Geography
School
District
Province
Multiple Choice
Long Answer
qppq
77.4
81.9
76.7
63.7
70.7
56.5
64.4
69.8
69.8
73.1
59.6
67.0
56.2
62.7
63.9
59.0
59.0
50.4
66.0
59.4
73.2
69.5
69.3
Average Mark, 2007-2010
2010
43
Public Exam Course Results
Geography 3202
2009-10
District 2 - Western
#080 - Templeton Academy, Meadows Grades: K-12
2007 2008 2009
2007 2008 2009
Final MarkExam Mark
Land and
Water
Forms
World
Climate
Patterns
Ecosystems
Primary
Resource
Activities
Secondary
& Tertiary
Activities
Written
Response
Units 1-5
Population
Geography
Urban
Geography
4 Year Public Exam (Subtest) Mark Trend 2007-2010
Difference from Provincial Mean, 2007-2010
2010
2010
44

Public Exam Course Results
Geography 3202
2009-10
District 2 - Western
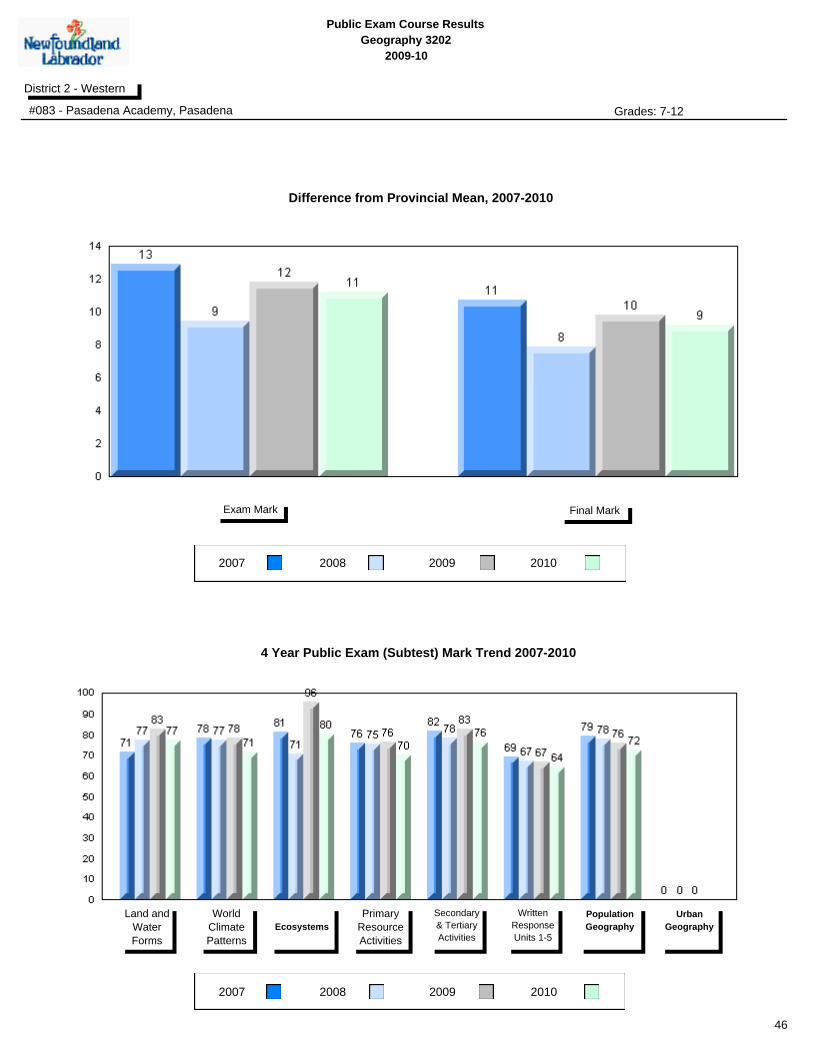
#083 - Pasadena Academy, Pasadena Grades: 7-12
2007 2008 2009
Final MarkExam Mark
School
vs
Province
School
vs
District
Final
Mark
p p 73.8
64.6
66.7
Number of Students
School
District
Province
School
District
Province
World
Climate
Patterns
School
DistrictEcosystems
Land and
Water Forms
Province
Subtest
School
vs
Province
School
vs
District
Public
Exam
Mark
School
District
Province
p p
p
p
p
p
p
p
70.0
28
58.8
61.9
World Geography 3202
School
District
Province
School
District
Province
Secondary &
Tertiary Activities
School
District
Written response
Units 1-5
Primary
Resource
Activities
Province
p
p
p
p
p
p
Population
Geography
School
District
Province
p p
Urban
Geography
School
District
Province
Multiple Choice
Long Answer
qppq
77.4
71.4
80.4
70.0
76.1
64.3
72.3
69.8
69.8
73.1
59.6
67.0
56.2
62.7
63.9
59.0
59.0
50.4
66.0
59.4
73.2
69.5
69.3
Average Mark, 2007-2010
2010
45
Public Exam Course Results
Geography 3202
2009-10
District 2 - Western
#083 - Pasadena Academy, Pasadena Grades: 7-12
2007 2008 2009
2007 2008 2009
Final MarkExam Mark
Land and
Water
Forms
World
Climate
Patterns
Ecosystems
Primary
Resource
Activities
Secondary
& Tertiary
Activities
Written
Response
Units 1-5
Population
Geography
Urban
Geography
4 Year Public Exam (Subtest) Mark Trend 2007-2010
Difference from Provincial Mean, 2007-2010
2010
2010
46

Public Exam Course Results
Geography 3202
2009-10
District 2 - Western
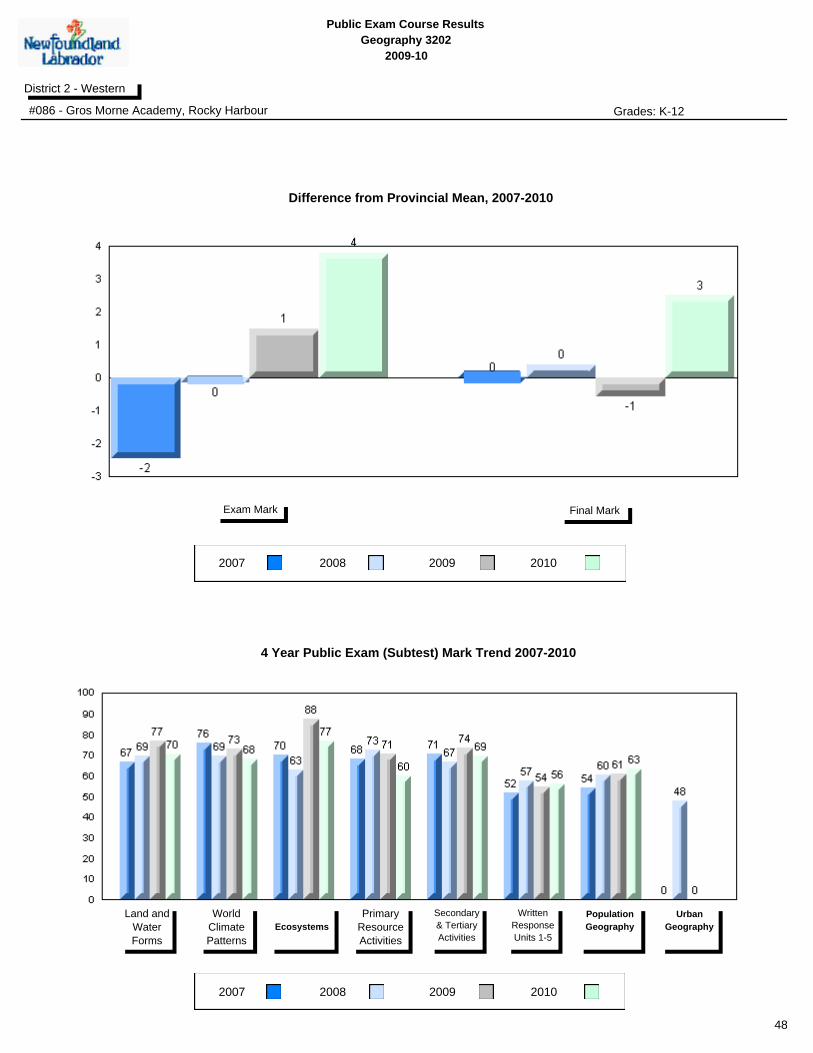
#086 - Gros Morne Academy, Rocky Harbour Grades: K-12
2007 2008 2009
Final MarkExam Mark
School
vs
Province
School
vs
District
Final
Mark
p p 67.1
64.6
66.7
Number of Students
School
District
Province
School
District
Province
World
Climate
Patterns
School
DistrictEcosystems
Land and
Water Forms
Province
Subtest
School
vs
Province
School
vs
District
Public
Exam
Mark
School
District
Province
p p
q
p
p
p
p
q
62.6
15
58.8
61.9
World Geography 3202
School
District
Province
School
District
Province
Secondary &
Tertiary Activities
School
District
Written response
Units 1-5
Primary
Resource
Activities
Province
p
p
p
p
p
p
Population
Geography
School
District
Province
p p
Urban
Geography
School
District
Province
Multiple Choice
Long Answer
qppq
70.4
68.2
76.7
60.0
69.3
56.2
63.2
69.8
69.8
73.1
59.6
67.0
56.2
62.7
63.9
59.0
59.0
50.4
66.0
59.4
73.2
69.5
69.3
Average Mark, 2007-2010
2010
47
Public Exam Course Results
Geography 3202
2009-10
District 2 - Western
#086 - Gros Morne Academy, Rocky Harbour Grades: K-12
2007 2008 2009
2007 2008 2009
Final MarkExam Mark
Land and
Water
Forms
World
Climate
Patterns
Ecosystems
Primary
Resource
Activities
Secondary
& Tertiary
Activities
Written
Response
Units 1-5
Population
Geography
Urban
Geography
4 Year Public Exam (Subtest) Mark Trend 2007-2010
Difference from Provincial Mean, 2007-2010
2010
2010
48

Public Exam Course Results
Geography 3202
2009-10
District 2 - Western
#088 - Main River Academy, Pollard's Point Grades: 1-12
2007 2008 2009
Final MarkExam Mark
School
vs
Province
School
vs
District
Final
Mark
q p 65.0
64.6
66.7
Number of Students
School
District
Province
School
District
Province
World
Climate
Patterns
School
DistrictEcosystems
Land and
Water Forms
Province
Subtest
School
vs
Province
School
vs
District
Public
Exam
Mark
School
District
Province
q q
q
p
p
p
p
q
56.7
3
58.8
61.9
World Geography 3202
School
District
Province
School
District
Province
Secondary &
Tertiary Activities
School
District
Written response
Units 1-5
Primary
Resource
Activities
Province
q
q
p p
q
q
Population
Geography
School
District
Province
q p
Urban
Geography
School
District
Province
Multiple Choice
Long Answer
qppq
74.1
66.7
83.3
60.0
50.0
49.1
60.6
69.8
69.8
73.1
59.6
67.0
56.2
62.7
63.9
59.0
59.0
50.4
66.0
59.4
73.2
69.5
69.3
Average Mark, 2007-2010
2010
School data with 5 or fewer
students withheld for reasons of
confidentiality.
School data with 5 or fewer
students withheld for reasons of
confidentiality.
School data with 5 or fewer students withheld for reasons of confidentiality.
49

Public Exam Course Results
Geography 3202
2009-10
District 2 - Western
#088 - Main River Academy, Pollard's Point Grades: 1-12
2007 2008 2009
2007 2008 2009
Final MarkExam Mark
Land and
Water
Forms
World
Climate
Patterns
Ecosystems
Primary
Resource
Activities
Secondary
& Tertiary
Activities
Written
Response
Units 1-5
Population
Geography
Urban
Geography
4 Year Public Exam (Subtest) Mark Trend 2007-2010
Difference from Provincial Mean, 2007-2010
2010
2010
School data with 5 or fewer students withheld for reasons of confidentiality.
School data with 5 or fewer students withheld for reasons of confidentiality.
50

Public Exam Course Results
Geography 3202
2009-10
District 2 - Western
#089 - Jakeman All Grade, Trout River Grades: K-12
2007 2008 2009
Final MarkExam Mark
School
vs
Province
School
vs
District
Final
Mark
q q 57.3
64.6
66.7
Number of Students
School
District
Province
School
District
Province
World
Climate
Patterns
School
DistrictEcosystems
Land and
Water Forms
Province
Subtest
School
vs
Province
School
vs
District
Public
Exam
Mark
School
District
Province
q q
q
q
q
p
q
q
49.3
4
58.8
61.9
World Geography 3202
School
District
Province
School
District
Province
Secondary &
Tertiary Activities
School
District
Written response
Units 1-5
Primary
Resource
Activities
Province
q
q
q
q
q
q
Population
Geography
School
District
Province
q q
Urban
Geography
School
District
Province
Multiple Choice
Long Answer
qppq
61.1
58.3
56.3
57.5
57.5
42.0
44.7
69.8
69.8
73.1
59.6
67.0
56.2
62.7
63.9
59.0
59.0
50.4
66.0
59.4
73.2
69.5
69.3
Average Mark, 2007-2010
2010
School data with 5 or fewer
students withheld for reasons of
confidentiality.
School data with 5 or fewer
students withheld for reasons of
confidentiality.
School data with 5 or fewer students withheld for reasons of confidentiality.
51

Public Exam Course Results
Geography 3202
2009-10
District 2 - Western
#089 - Jakeman All Grade, Trout River Grades: K-12
2007 2008 2009
2007 2008 2009
Final MarkExam Mark
Land and
Water
Forms
World
Climate
Patterns
Ecosystems
Primary
Resource
Activities
Secondary
& Tertiary
Activities
Written
Response
Units 1-5
Population
Geography
Urban
Geography
4 Year Public Exam (Subtest) Mark Trend 2007-2010
Difference from Provincial Mean, 2007-2010
2010
2010
School data with 5 or fewer students withheld for reasons of confidentiality.
School data with 5 or fewer students withheld for reasons of confidentiality.
52

Public Exam Course Results
Geography 3202
2009-10
District 2 - Western
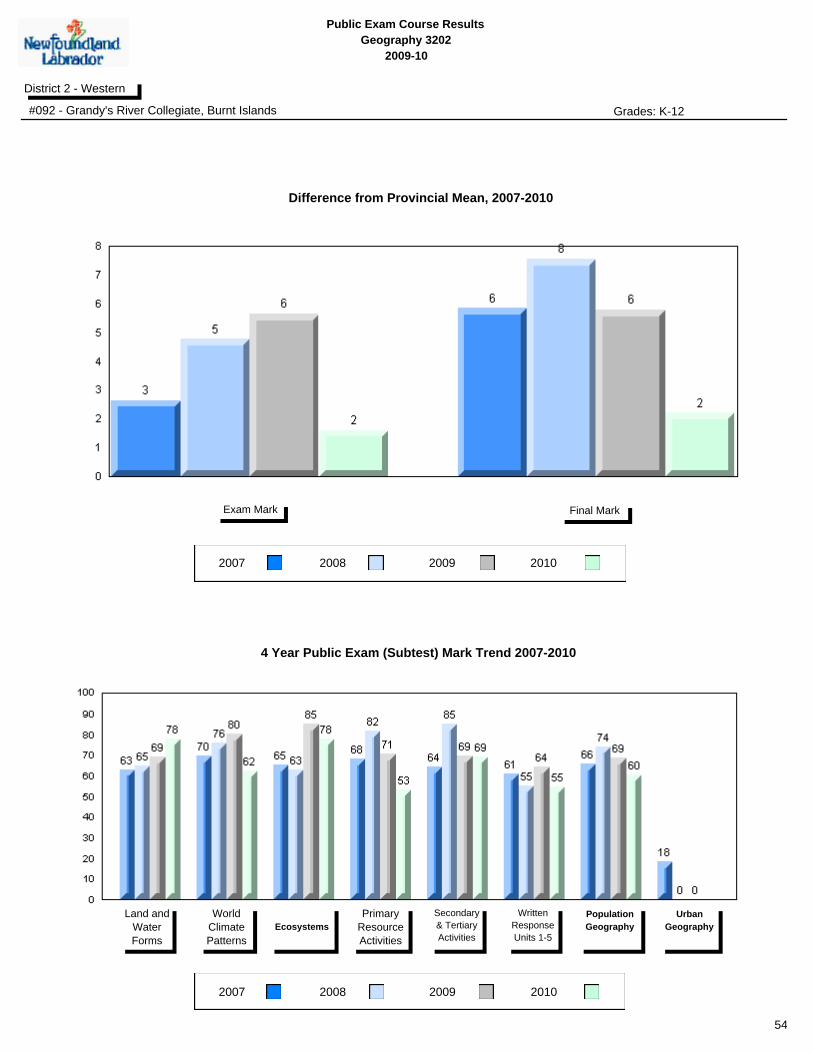
#092 - Grandy's River Collegiate, Burnt Islands Grades: K-12
2007 2008 2009
Final MarkExam Mark
School
vs
Province
School
vs
District
Final
Mark
p p 66.8
64.6
66.7
Number of Students
School
District
Province
School
District
Province
World
Climate
Patterns
School
DistrictEcosystems
Land and
Water Forms
Province
Subtest
School
vs
Province
School
vs
District
Public
Exam
Mark
School
District
Province
q p
q
p
p
p
p
q
60.4
10
58.8
61.9
World Geography 3202
School
District
Province
School
District
Province
Secondary &
Tertiary Activities
School
District
Written response
Units 1-5
Primary
Resource
Activities
Province
q
q
p p
p
q
Population
Geography
School
District
Province
q p
Urban
Geography
School
District
Province
Multiple Choice
Long Answer
qppq
77.8
62.2
77.5
53.0
69.0
54.6
60.5
69.8
69.8
73.1
59.6
67.0
56.2
62.7
63.9
59.0
59.0
50.4
66.0
59.4
73.2
69.5
69.3
Average Mark, 2007-2010
2010
53
Public Exam Course Results
Geography 3202
2009-10
District 2 - Western
#092 - Grandy's River Collegiate, Burnt Islands Grades: K-12
2007 2008 2009
2007 2008 2009
Final MarkExam Mark
Land and
Water
Forms
World
Climate
Patterns
Ecosystems
Primary
Resource
Activities
Secondary
& Tertiary
Activities
Written
Response
Units 1-5
Population
Geography
Urban
Geography
4 Year Public Exam (Subtest) Mark Trend 2007-2010
Difference from Provincial Mean, 2007-2010
2010
2010
54

Public Exam Course Results
Geography 3202
2009-10
District 2 - Western
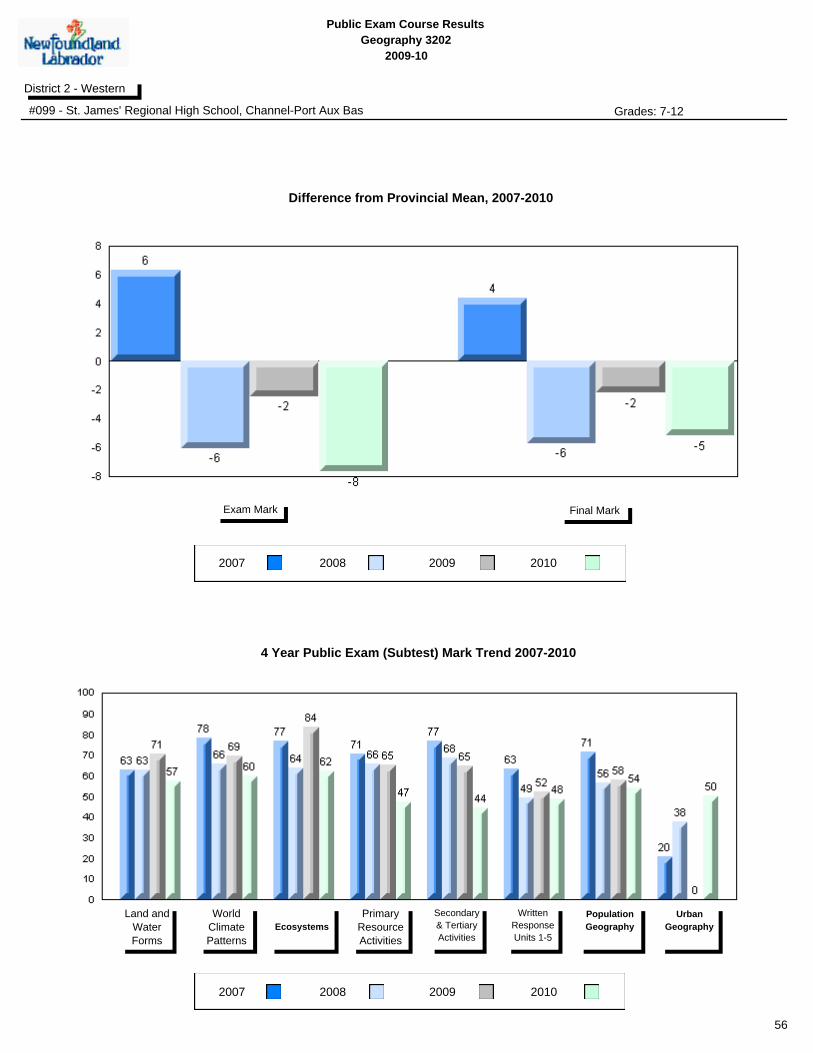
#099 - St. James' Regional High School, Channel-Port Aux Bas Grades: 7-12
2007 2008 2009
Final MarkExam Mark
School
vs
Province
School
vs
District
Final
Mark
q q 59.4
64.6
66.7
Number of Students
School
District
Province
School
District
Province
World
Climate
Patterns
School
DistrictEcosystems
Land and
Water Forms
Province
Subtest
School
vs
Province
School
vs
District
Public
Exam
Mark
School
District
Province
q q
q
q
q
q
q
q
51.1
41
58.8
61.9
World Geography 3202
School
District
Province
School
District
Province
Secondary &
Tertiary Activities
School
District
Written response
Units 1-5
Primary
Resource
Activities
Province
q
q
q
q
q
q
Population
Geography
School
District
Province
q q
Urban
Geography
School
District
Province
Multiple Choice
Long Answer
57.5
59.9
62.2
47.1
44.2
48.5
53.9
50.0
69.8
69.8
73.1
59.6
67.0
56.2
62.7
63.9
59.0
59.0
50.4
66.0
59.4
73.2
69.5
69.3
Average Mark, 2007-2010
2010
55
Public Exam Course Results
Geography 3202
2009-10
District 2 - Western
#099 - St. James' Regional High School, Channel-Port Aux Bas Grades: 7-12
2007 2008 2009
2007 2008 2009
Final MarkExam Mark
Land and
Water
Forms
World
Climate
Patterns
Ecosystems
Primary
Resource
Activities
Secondary
& Tertiary
Activities
Written
Response
Units 1-5
Population
Geography
Urban
Geography
4 Year Public Exam (Subtest) Mark Trend 2007-2010
Difference from Provincial Mean, 2007-2010
2010
2010
56

Public Exam Course Results
Geography 3202
2009-10
District 2 - Western
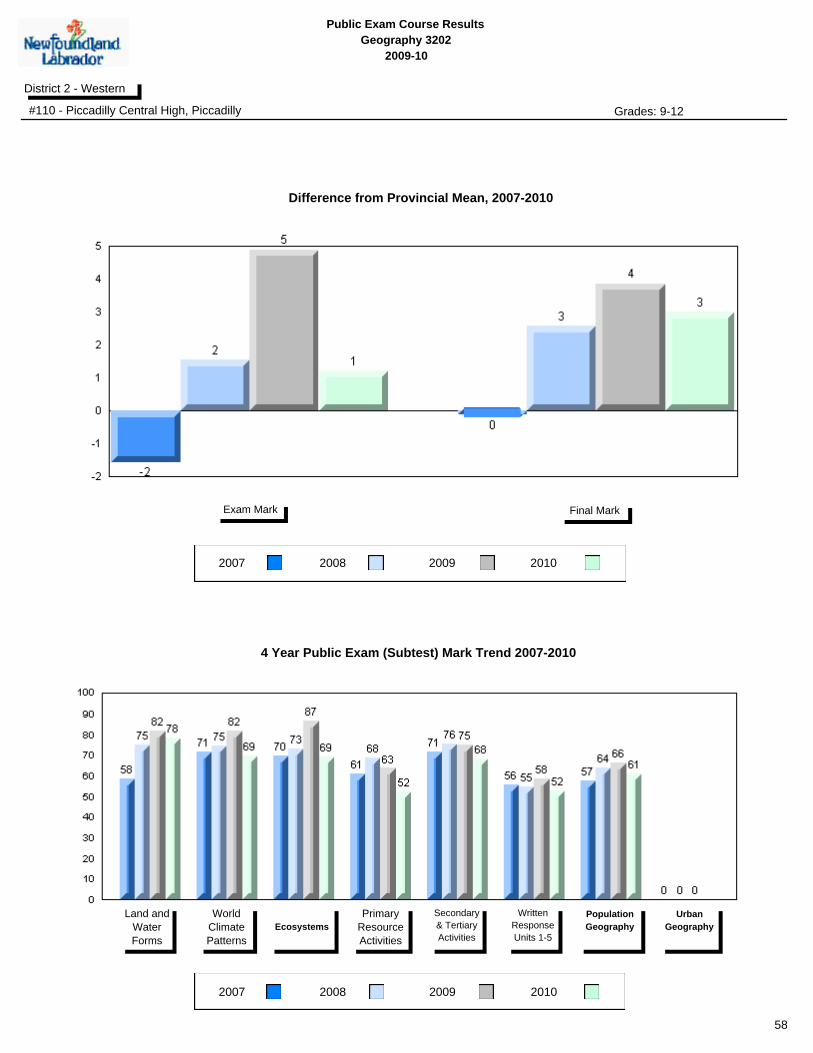
#110 - Piccadilly Central High, Piccadilly Grades: 9-12
2007 2008 2009
Final MarkExam Mark
School
vs
Province
School
vs
District
Final
Mark
p p 67.6
64.6
66.7
Number of Students
School
District
Province
School
District
Province
World
Climate
Patterns
School
DistrictEcosystems
Land and
Water Forms
Province
Subtest
School
vs
Province
School
vs
District
Public
Exam
Mark
School
District
Province
q p
q
q
p p
q
q
60.0
29
58.8
61.9
World Geography 3202
School
District
Province
School
District
Province
Secondary &
Tertiary Activities
School
District
Written response
Units 1-5
Primary
Resource
Activities
Province
q
q
p p
p
q
Population
Geography
School
District
Province
q p
Urban
Geography
School
District
Province
Multiple Choice
Long Answer
qppq
78.2
69.4
69.0
52.1
67.9
52.4
61.0
69.8
69.8
73.1
59.6
67.0
56.2
62.7
63.9
59.0
59.0
50.4
66.0
59.4
73.2
69.5
69.3
Average Mark, 2007-2010
2010
57
Public Exam Course Results
Geography 3202
2009-10
District 2 - Western
#110 - Piccadilly Central High, Piccadilly Grades: 9-12
2007 2008 2009
2007 2008 2009
Final MarkExam Mark
Land and
Water
Forms
World
Climate
Patterns
Ecosystems
Primary
Resource
Activities
Secondary
& Tertiary
Activities
Written
Response
Units 1-5
Population
Geography
Urban
Geography
4 Year Public Exam (Subtest) Mark Trend 2007-2010
Difference from Provincial Mean, 2007-2010
2010
2010
58

Public Exam Course Results
Geography 3202
2009-10
District 2 - Western
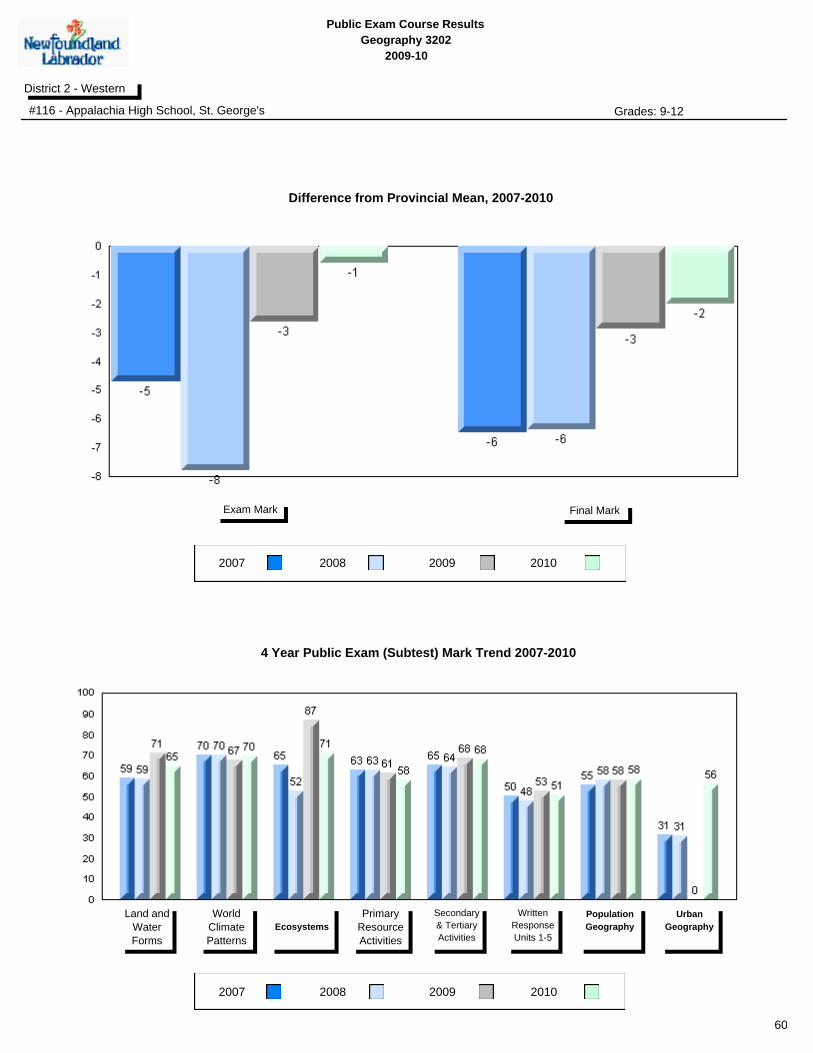
#116 - Appalachia High School, St. George's Grades: 9-12
2007 2008 2009
Final MarkExam Mark
School
vs
Province
School
vs
District
Final
Mark
q q 62.6
64.6
66.7
Number of Students
School
District
Province
School
District
Province
World
Climate
Patterns
School
DistrictEcosystems
Land and
Water Forms
Province
Subtest
School
vs
Province
School
vs
District
Public
Exam
Mark
School
District
Province
q q
q
q
q
p
p
q
58.2
37
58.8
61.9
World Geography 3202
School
District
Province
School
District
Province
Secondary &
Tertiary Activities
School
District
Written response
Units 1-5
Primary
Resource
Activities
Province
q
q
p p
p
q
Population
Geography
School
District
Province
q q
Urban
Geography
School
District
Province
Multiple Choice
Long Answer
64.6
69.7
71.0
57.8
68.1
50.8
58.2
56.1
69.8
69.8
73.1
59.6
67.0
56.2
62.7
63.9
59.0
59.0
50.4
66.0
59.4
73.2
69.5
69.3
Average Mark, 2007-2010
2010
59
Public Exam Course Results
Geography 3202
2009-10
District 2 - Western
#116 - Appalachia High School, St. George's Grades: 9-12
2007 2008 2009
2007 2008 2009
Final MarkExam Mark
Land and
Water
Forms
World
Climate
Patterns
Ecosystems
Primary
Resource
Activities
Secondary
& Tertiary
Activities
Written
Response
Units 1-5
Population
Geography
Urban
Geography
4 Year Public Exam (Subtest) Mark Trend 2007-2010
Difference from Provincial Mean, 2007-2010
2010
2010
60
Public Exam Course Results
Geography 3202
2009-10
District 2 - Western
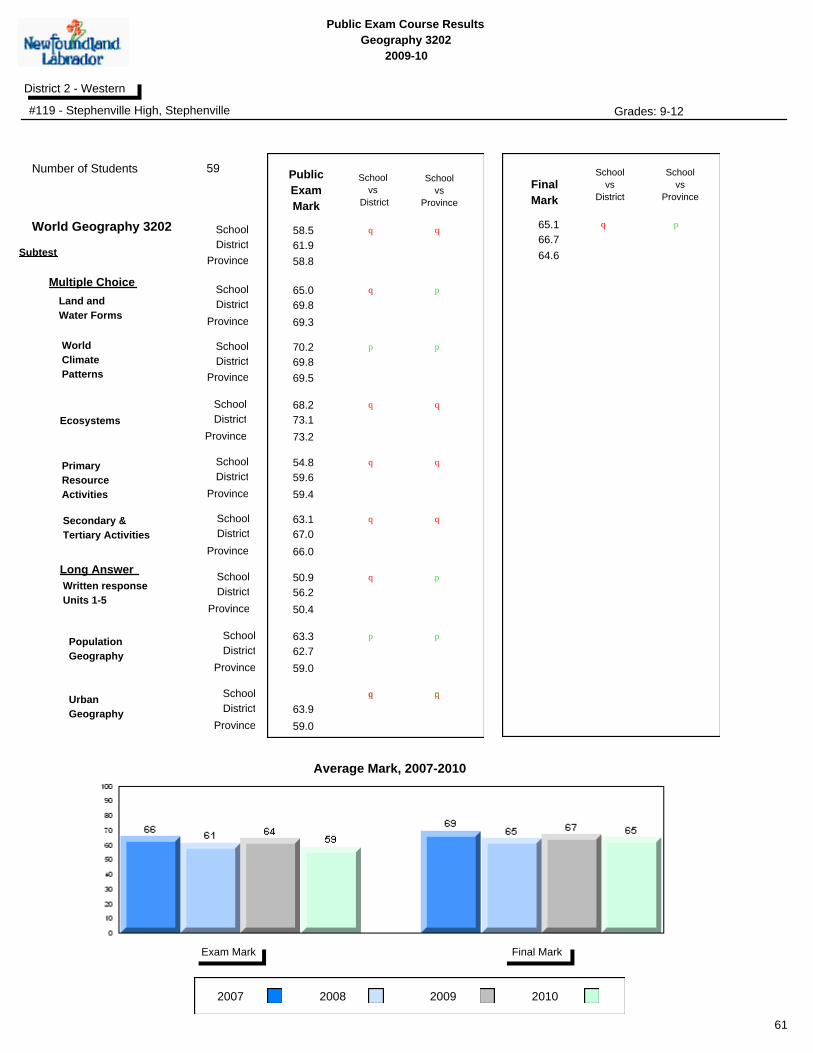
#119 - Stephenville High, Stephenville Grades: 9-12
2007 2008 2009
Final MarkExam Mark
School
vs
Province
School
vs
District
Final
Mark
q p 65.1
64.6
66.7
Number of Students
School
District
Province
School
District
Province
World
Climate
Patterns
School
DistrictEcosystems
Land and
Water Forms
Province
Subtest
School
vs
Province
School
vs
District
Public
Exam
Mark
School
District
Province
q q
q
q
p
p
p
q
58.5
59
58.8
61.9
World Geography 3202
School
District
Province
School
District
Province
Secondary &
Tertiary Activities
School
District
Written response
Units 1-5
Primary
Resource
Activities
Province
q
q
q p
q
q
Population
Geography
School
District
Province
p p
Urban
Geography
School
District
Province
Multiple Choice
Long Answer
qppq
65.0
70.2
68.2
54.8
63.1
50.9
63.3
69.8
69.8
73.1
59.6
67.0
56.2
62.7
63.9
59.0
59.0
50.4
66.0
59.4
73.2
69.5
69.3
Average Mark, 2007-2010
2010
61
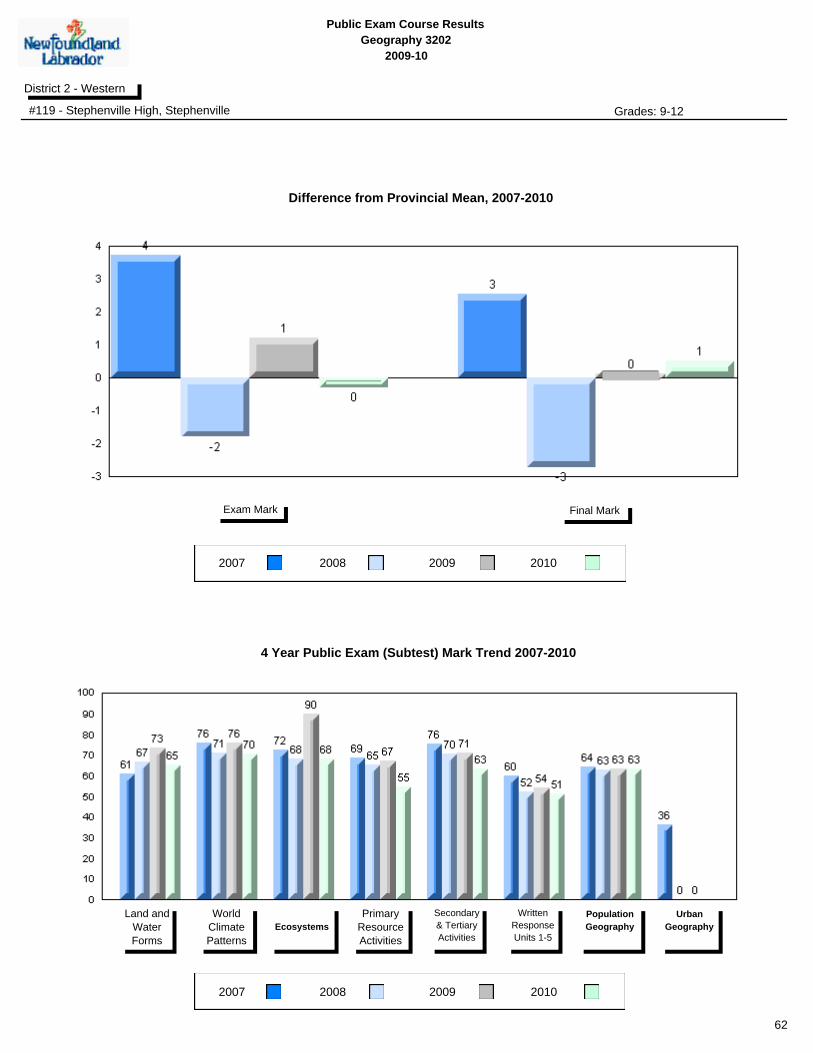
Public Exam Course Results
Geography 3202
2009-10
District 2 - Western
#119 - Stephenville High, Stephenville Grades: 9-12
2007 2008 2009
2007 2008 2009
Final MarkExam Mark
Land and
Water
Forms
World
Climate
Patterns
Ecosystems
Primary
Resource
Activities
Secondary
& Tertiary
Activities
Written
Response
Units 1-5
Population
Geography
Urban
Geography
4 Year Public Exam (Subtest) Mark Trend 2007-2010
Difference from Provincial Mean, 2007-2010
2010
2010
62

Public Exam Course Results
Geography 3202
2009-10
District 2 - Western
#387 - Bayview Regional Collegiate, St. Lunaire Grades: 7-12
2007 2008 2009
Final MarkExam Mark
School
vs
Province
School
vs
District
Final
Mark
p p 72.3
64.6
66.7
Number of Students
School
District
Province
School
District
Province
World
Climate
Patterns
School
DistrictEcosystems
Land and
Water Forms
Province
Subtest
School
vs
Province
School
vs
District
Public
Exam
Mark
School
District
Province
p p
q
p
p
p
p
q
68.9
8
58.8
61.9
World Geography 3202
School
District
Province
School
District
Province
Secondary &
Tertiary Activities
School
District
Written response
Units 1-5
Primary
Resource
Activities
Province
q
p
p
p
p
q
Population
Geography
School
District
Province
p p
Urban
Geography
School
District
Province
Multiple Choice
Long Answer
qppq
72.2
87.5
68.8
58.8
70.0
68.2
65.9
69.8
69.8
73.1
59.6
67.0
56.2
62.7
63.9
59.0
59.0
50.4
66.0
59.4
73.2
69.5
69.3
Average Mark, 2007-2010
2010
63
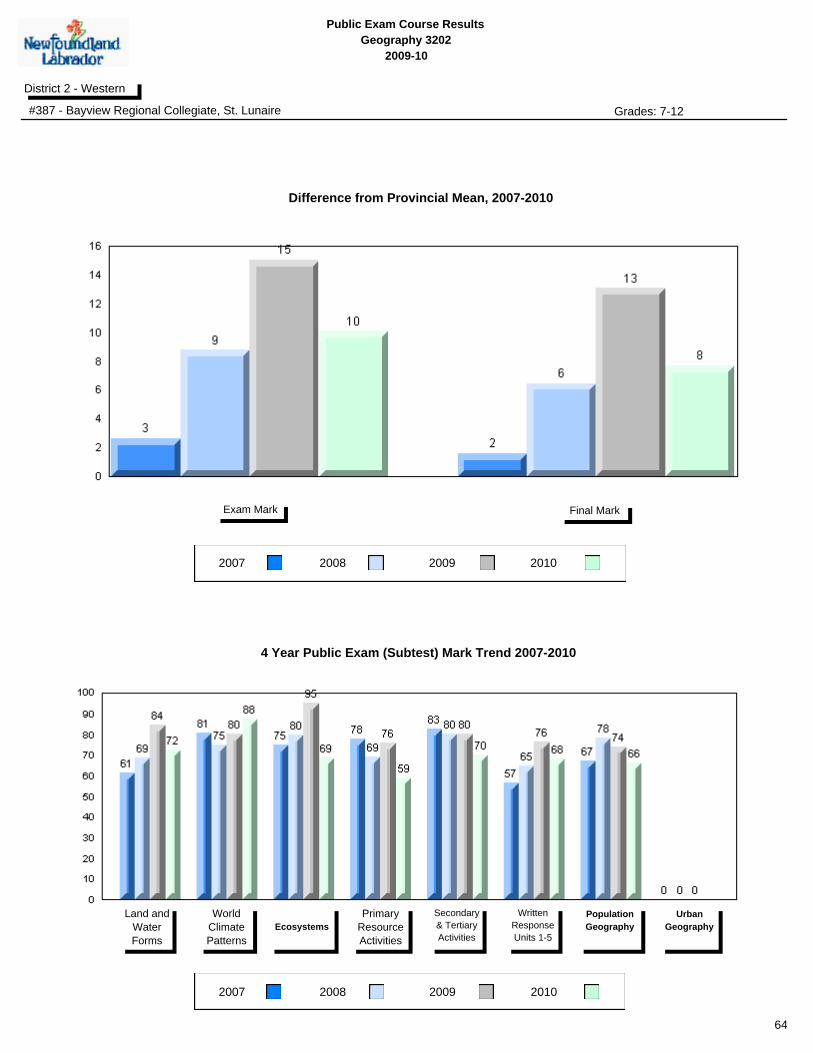
Public Exam Course Results
Geography 3202
2009-10
District 2 - Western
#387 - Bayview Regional Collegiate, St. Lunaire Grades: 7-12
2007 2008 2009
2007 2008 2009
Final MarkExam Mark
Land and
Water
Forms
World
Climate
Patterns
Ecosystems
Primary
Resource
Activities
Secondary
& Tertiary
Activities
Written
Response
Units 1-5
Population
Geography
Urban
Geography
4 Year Public Exam (Subtest) Mark Trend 2007-2010
Difference from Provincial Mean, 2007-2010
2010
2010
64

Public Exam Course Results
Geography 3202
2009-10
District 2 - Western
#388 - Long Range Academy, Cow Head Grades: K-12
2007 2008 2009
Final MarkExam Mark
School
vs
Province
School
vs
District
Final
Mark
q q 59.8
64.6
66.7
Number of Students
School
District
Province
School
District
Province
World
Climate
Patterns
School
DistrictEcosystems
Land and
Water Forms
Province
Subtest
School
vs
Province
School
vs
District
Public
Exam
Mark
School
District
Province
q q
q
q
q
p
q
q
54.2
12
58.8
61.9
World Geography 3202
School
District
Province
School
District
Province
Secondary &
Tertiary Activities
School
District
Written response
Units 1-5
Primary
Resource
Activities
Province
q
q
q
q
q
q
Population
Geography
School
District
Province
q q
Urban
Geography
School
District
Province
Multiple Choice
Long Answer
qppq
66.7
66.7
66.7
54.2
65.8
42.9
56.8
69.8
69.8
73.1
59.6
67.0
56.2
62.7
63.9
59.0
59.0
50.4
66.0
59.4
73.2
69.5
69.3
Average Mark, 2007-2010
2010
65
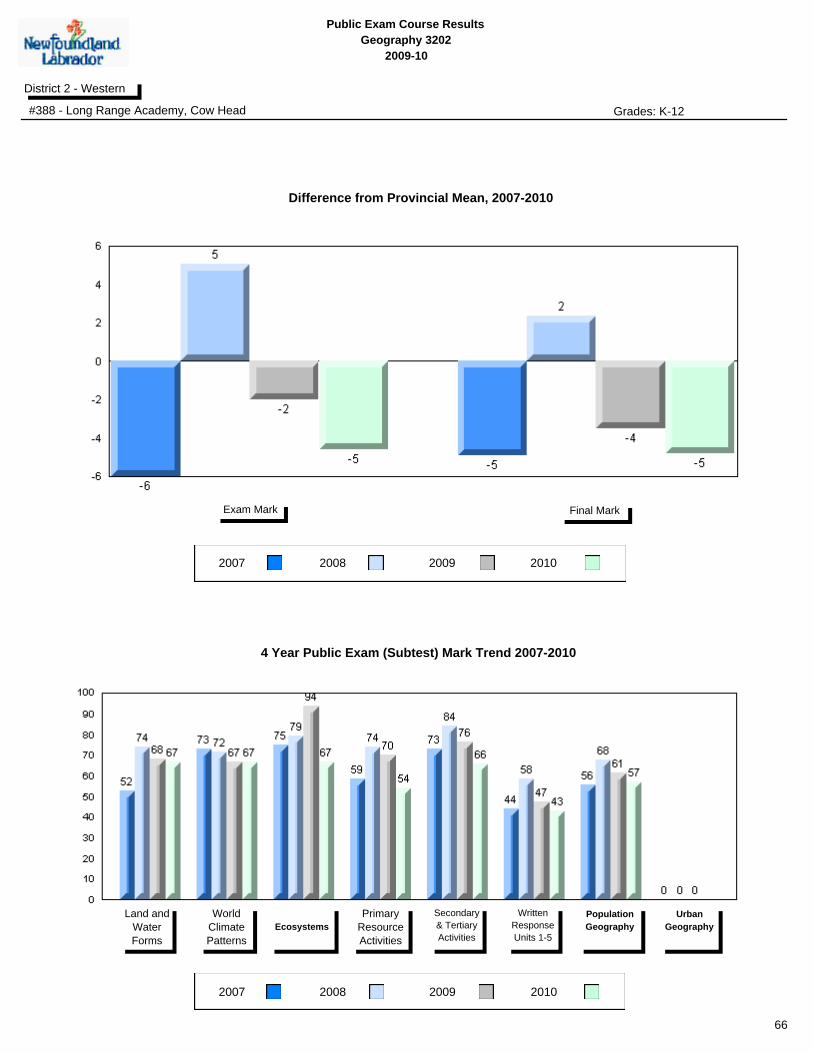
Public Exam Course Results
Geography 3202
2009-10
District 2 - Western
#388 - Long Range Academy, Cow Head Grades: K-12
2007 2008 2009
2007 2008 2009
Final MarkExam Mark
Land and
Water
Forms
World
Climate
Patterns
Ecosystems
Primary
Resource
Activities
Secondary
& Tertiary
Activities
Written
Response
Units 1-5
Population
Geography
Urban
Geography
4 Year Public Exam (Subtest) Mark Trend 2007-2010
Difference from Provincial Mean, 2007-2010
2010
2010
66

Public Exam Course Results
Geography 3202
2009-10
District 2 - Western
#390 - Elwood High School, Deer Lake Grades: 10-12
2007 2008 2009
Final MarkExam Mark
School
vs
Province
School
vs
District
Final
Mark
q p 66.6
64.6
66.7
Number of Students
School
District
Province
School
District
Province
World
Climate
Patterns
School
DistrictEcosystems
Land and
Water Forms
Province
Subtest
School
vs
Province
School
vs
District
Public
Exam
Mark
School
District
Province
q p
q
q
p
p
p
q
61.7
29
58.8
61.9
World Geography 3202
School
District
Province
School
District
Province
Secondary &
Tertiary Activities
School
District
Written response
Units 1-5
Primary
Resource
Activities
Province
q
p
p
p
p
q
Population
Geography
School
District
Province
p p
Urban
Geography
School
District
Province
Multiple Choice
Long Answer
64.4
69.0
75.9
55.5
72.1
57.8
62.8
47.7
69.8
69.8
73.1
59.6
67.0
56.2
62.7
63.9
59.0
59.0
50.4
66.0
59.4
73.2
69.5
69.3
Average Mark, 2007-2010
2010
67
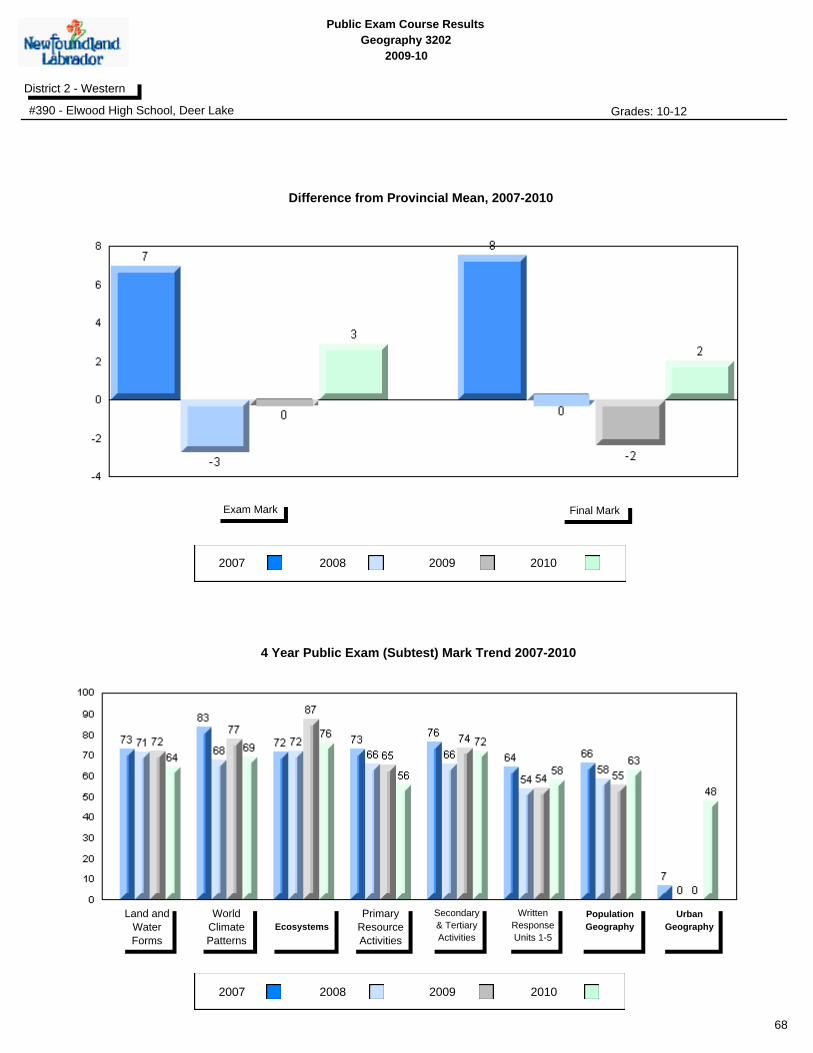
Public Exam Course Results
Geography 3202
2009-10
District 2 - Western
#390 - Elwood High School, Deer Lake Grades: 10-12
2007 2008 2009
2007 2008 2009
Final MarkExam Mark
Land and
Water
Forms
World
Climate
Patterns
Ecosystems
Primary
Resource
Activities
Secondary
& Tertiary
Activities
Written
Response
Units 1-5
Population
Geography
Urban
Geography
4 Year Public Exam (Subtest) Mark Trend 2007-2010
Difference from Provincial Mean, 2007-2010
2010
2010
68
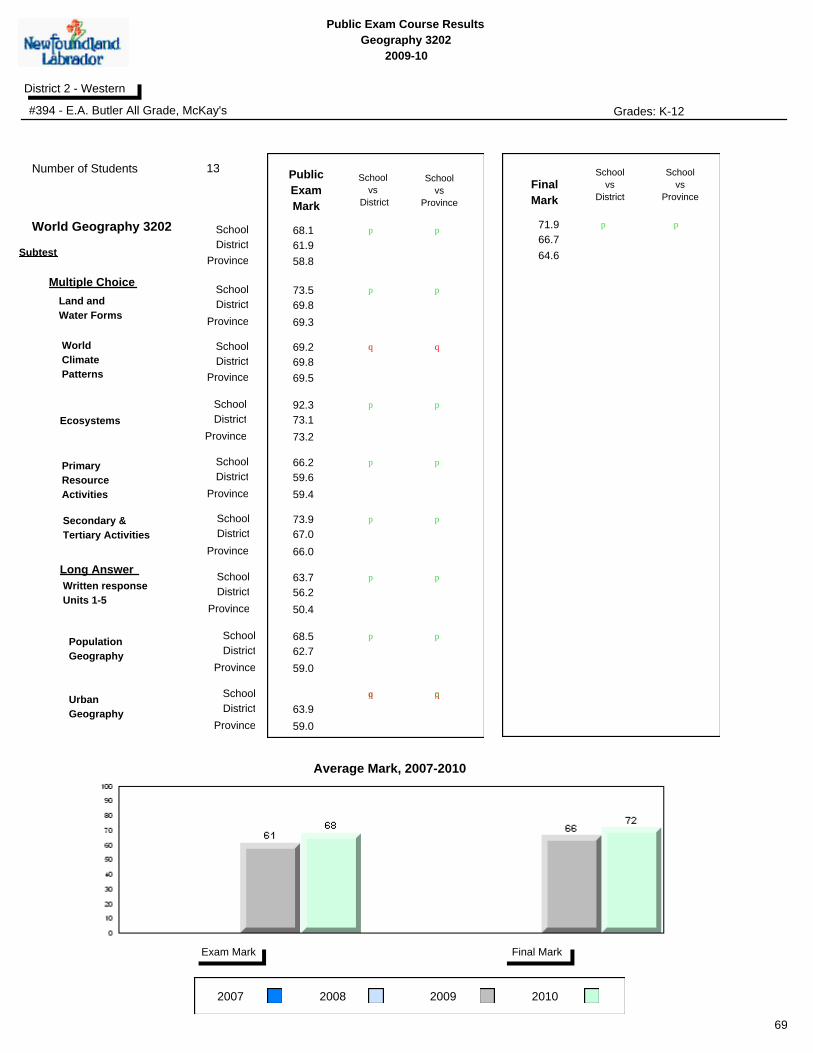
Public Exam Course Results
Geography 3202
2009-10
District 2 - Western
#394 - E.A. Butler All Grade, McKay's Grades: K-12
2007 2008 2009
Final MarkExam Mark
School
vs
Province
School
vs
District
Final
Mark
p p 71.9
64.6
66.7
Number of Students
School
District
Province
School
District
Province
World
Climate
Patterns
School
DistrictEcosystems
Land and
Water Forms
Province
Subtest
School
vs
Province
School
vs
District
Public
Exam
Mark
School
District
Province
p p
q
p
p
p
p
q
68.1
13
58.8
61.9
World Geography 3202
School
District
Province
School
District
Province
Secondary &
Tertiary Activities
School
District
Written response
Units 1-5
Primary
Resource
Activities
Province
p
p
p
p
p
p
Population
Geography
School
District
Province
p p
Urban
Geography
School
District
Province
Multiple Choice
Long Answer
qppq
73.5
69.2
92.3
66.2
73.9
63.7
68.5
69.8
69.8
73.1
59.6
67.0
56.2
62.7
63.9
59.0
59.0
50.4
66.0
59.4
73.2
69.5
69.3
Average Mark, 2007-2010
2010
69
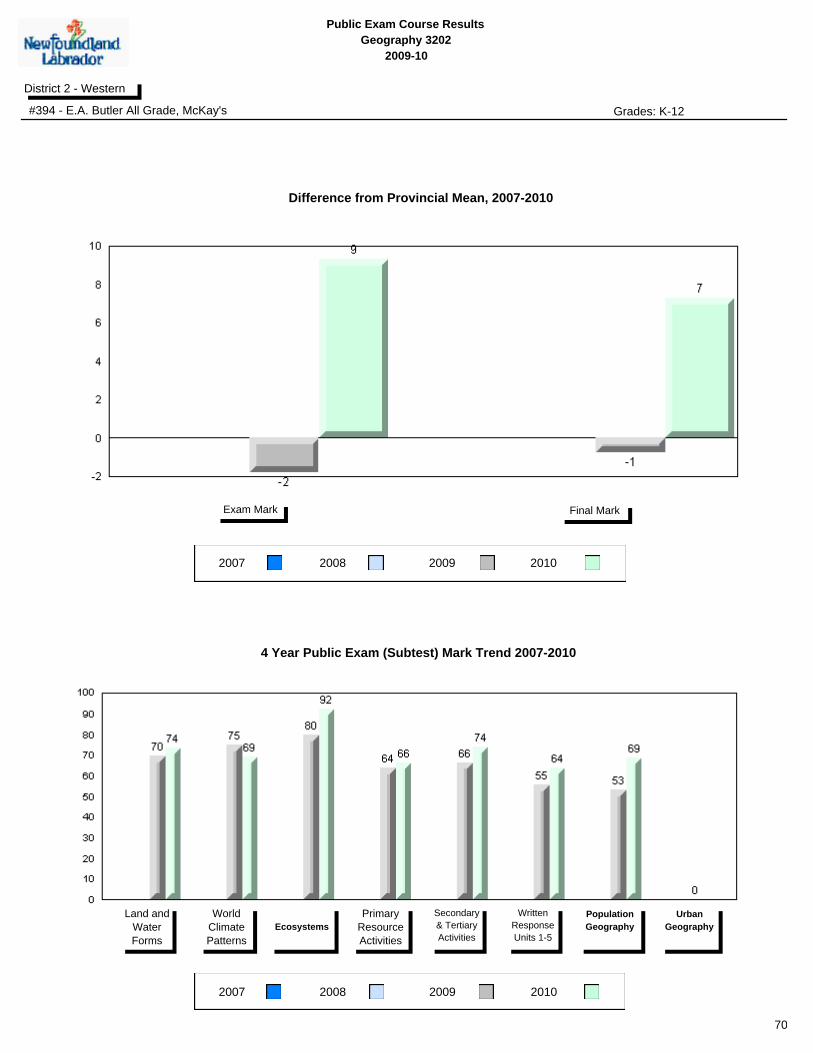
Public Exam Course Results
Geography 3202
2009-10
District 2 - Western
#394 - E.A. Butler All Grade, McKay's Grades: K-12
2007 2008 2009
2007 2008 2009
Final MarkExam Mark
Land and
Water
Forms
World
Climate
Patterns
Ecosystems
Primary
Resource
Activities
Secondary
& Tertiary
Activities
Written
Response
Units 1-5
Population
Geography
Urban
Geography
4 Year Public Exam (Subtest) Mark Trend 2007-2010
Difference from Provincial Mean, 2007-2010
2010
2010
70
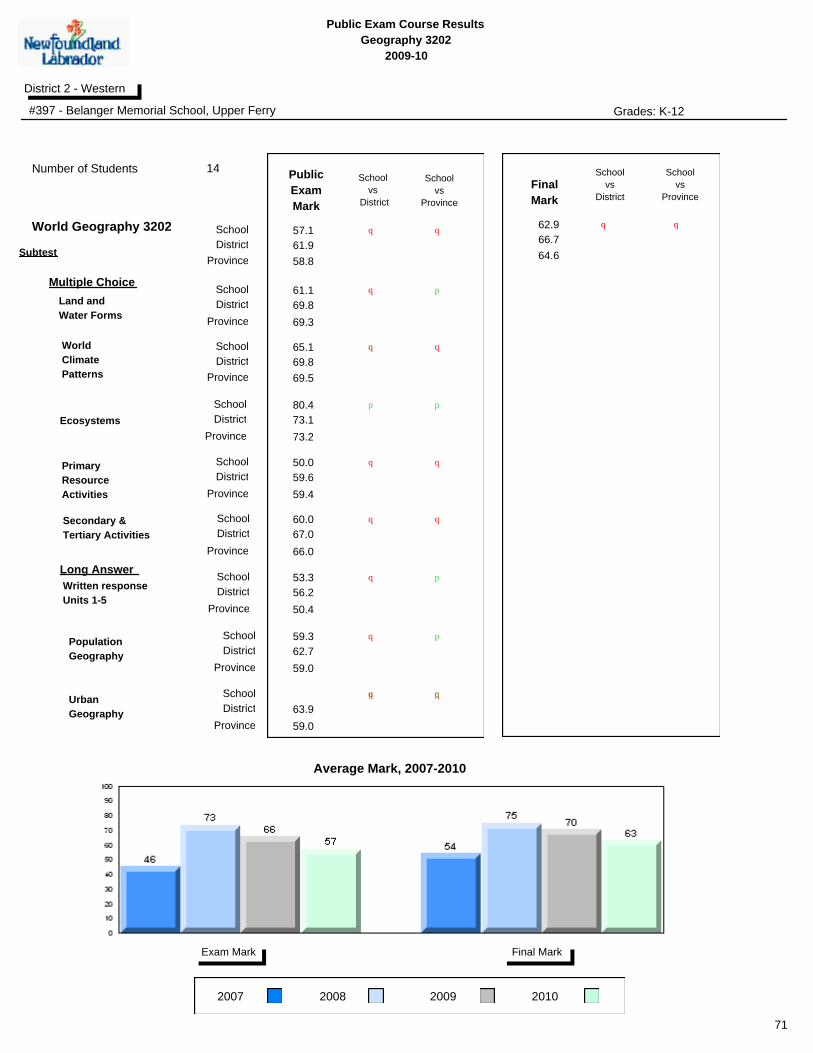
Public Exam Course Results
Geography 3202
2009-10
District 2 - Western
#397 - Belanger Memorial School, Upper Ferry Grades: K-12
2007 2008 2009
Final MarkExam Mark
School
vs
Province
School
vs
District
Final
Mark
q q 62.9
64.6
66.7
Number of Students
School
District
Province
School
District
Province
World
Climate
Patterns
School
DistrictEcosystems
Land and
Water Forms
Province
Subtest
School
vs
Province
School
vs
District
Public
Exam
Mark
School
District
Province
q q
q
q
p
p
p
q
57.1
14
58.8
61.9
World Geography 3202
School
District
Province
School
District
Province
Secondary &
Tertiary Activities
School
District
Written response
Units 1-5
Primary
Resource
Activities
Province
q
q
q p
q
q
Population
Geography
School
District
Province
q p
Urban
Geography
School
District
Province
Multiple Choice
Long Answer
qppq
61.1
65.1
80.4
50.0
60.0
53.3
59.3
69.8
69.8
73.1
59.6
67.0
56.2
62.7
63.9
59.0
59.0
50.4
66.0
59.4
73.2
69.5
69.3
Average Mark, 2007-2010
2010
71
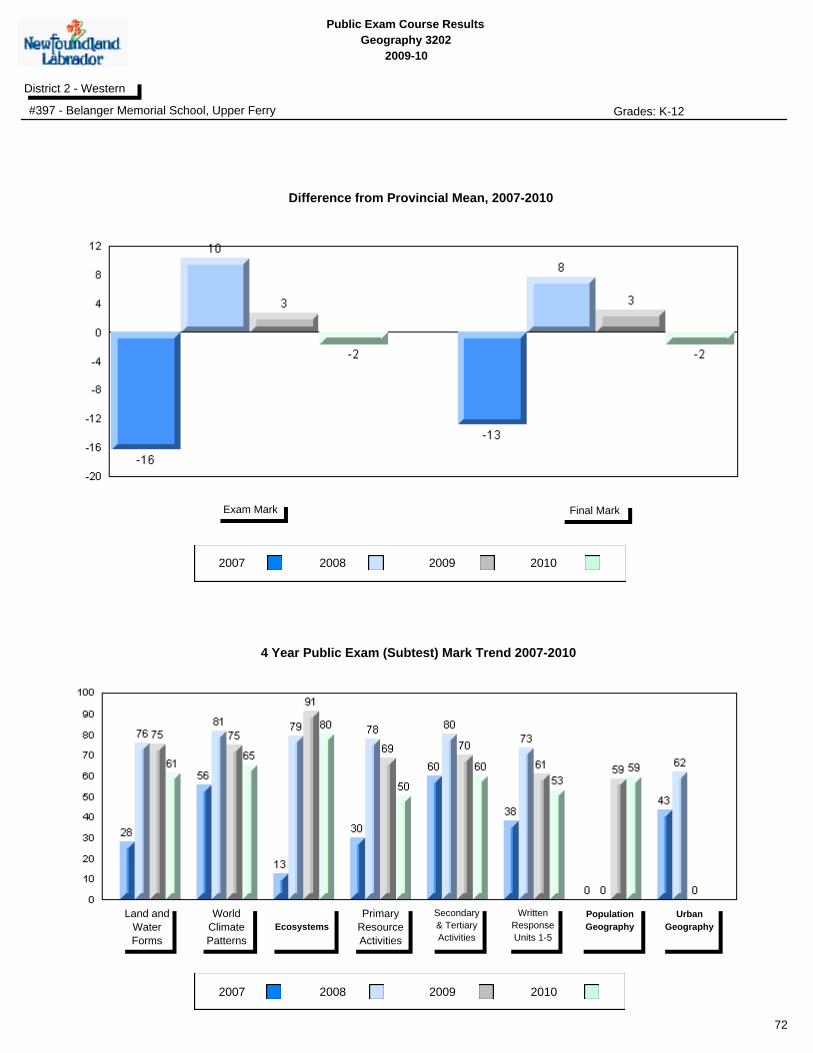
Public Exam Course Results
Geography 3202
2009-10
District 2 - Western
#397 - Belanger Memorial School, Upper Ferry Grades: K-12
2007 2008 2009
2007 2008 2009
Final MarkExam Mark
Land and
Water
Forms
World
Climate
Patterns
Ecosystems
Primary
Resource
Activities
Secondary
& Tertiary
Activities
Written
Response
Units 1-5
Population
Geography
Urban
Geography
4 Year Public Exam (Subtest) Mark Trend 2007-2010
Difference from Provincial Mean, 2007-2010
2010
2010
72
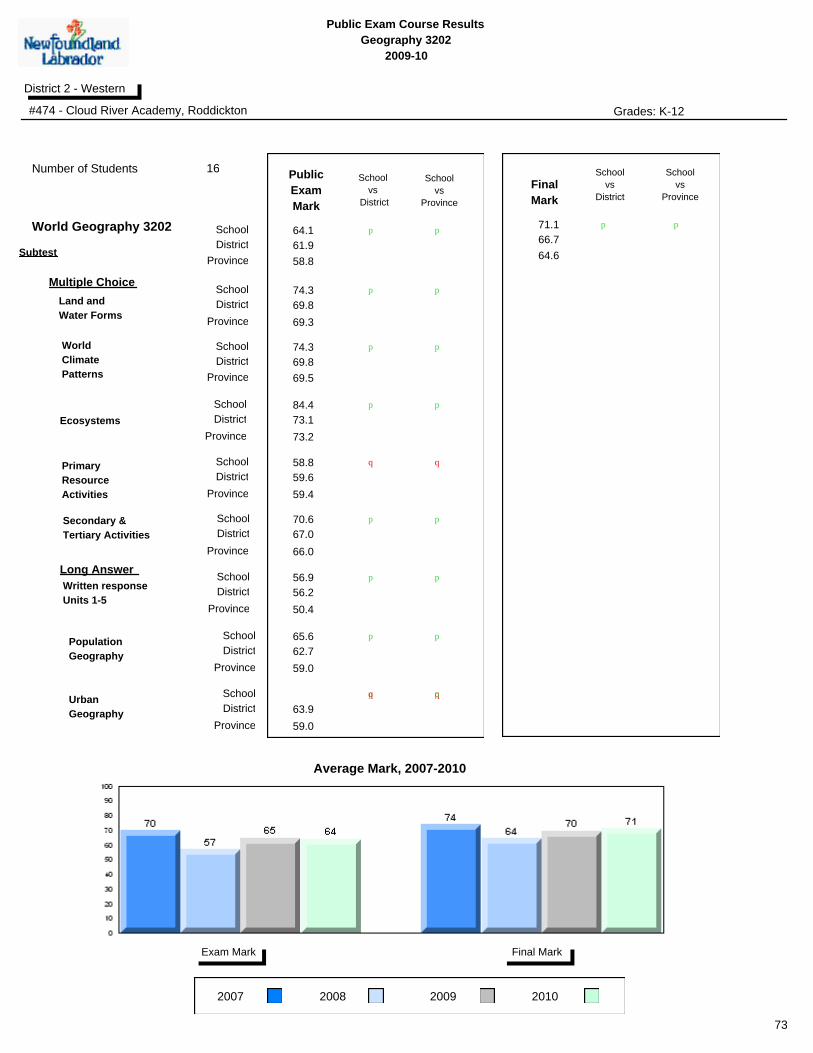
Public Exam Course Results
Geography 3202
2009-10
District 2 - Western
#474 - Cloud River Academy, Roddickton Grades: K-12
2007 2008 2009
Final MarkExam Mark
School
vs
Province
School
vs
District
Final
Mark
p p 71.1
64.6
66.7
Number of Students
School
District
Province
School
District
Province
World
Climate
Patterns
School
DistrictEcosystems
Land and
Water Forms
Province
Subtest
School
vs
Province
School
vs
District
Public
Exam
Mark
School
District
Province
p p
p
p
p
p
p
p
64.1
16
58.8
61.9
World Geography 3202
School
District
Province
School
District
Province
Secondary &
Tertiary Activities
School
District
Written response
Units 1-5
Primary
Resource
Activities
Province
q
p
p
p
p
q
Population
Geography
School
District
Province
p p
Urban
Geography
School
District
Province
Multiple Choice
Long Answer
qppq
74.3
74.3
84.4
58.8
70.6
56.9
65.6
69.8
69.8
73.1
59.6
67.0
56.2
62.7
63.9
59.0
59.0
50.4
66.0
59.4
73.2
69.5
69.3
Average Mark, 2007-2010
2010
73
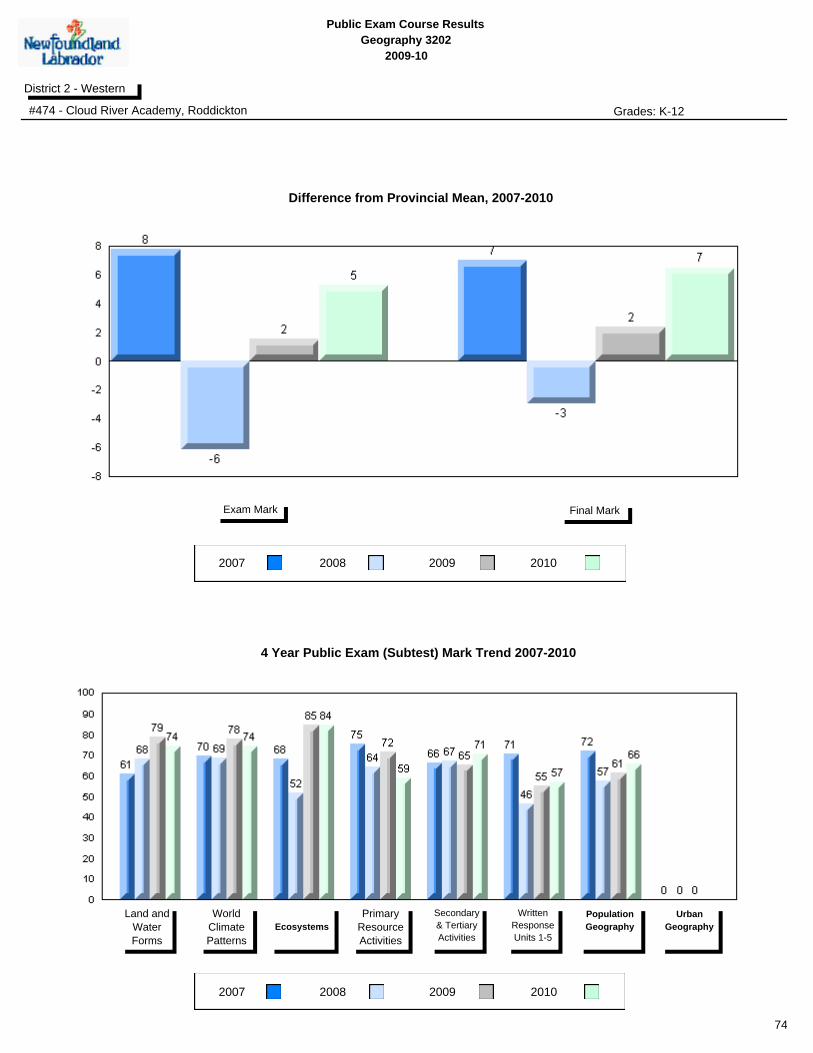
Public Exam Course Results
Geography 3202
2009-10
District 2 - Western
#474 - Cloud River Academy, Roddickton Grades: K-12
2007 2008 2009
2007 2008 2009
Final MarkExam Mark
Land and
Water
Forms
World
Climate
Patterns
Ecosystems
Primary
Resource
Activities
Secondary
& Tertiary
Activities
Written
Response
Units 1-5
Population
Geography
Urban
Geography
4 Year Public Exam (Subtest) Mark Trend 2007-2010
Difference from Provincial Mean, 2007-2010
2010
2010
74

Public Exam Course Results
Geography 3202
2009-10
District 2 - Western
#475 - Viking Trail Academy, Plum Point Grades: K-12
2007 2008 2009
Final MarkExam Mark
School
vs
Province
School
vs
District
Final
Mark
p p 66.7
64.6
66.7
Number of Students
School
District
Province
School
District
Province
World
Climate
Patterns
School
DistrictEcosystems
Land and
Water Forms
Province
Subtest
School
vs
Province
School
vs
District
Public
Exam
Mark
School
District
Province
p p
q
p
p
p
p
q
63.3
19
58.8
61.9
World Geography 3202
School
District
Province
School
District
Province
Secondary &
Tertiary Activities
School
District
Written response
Units 1-5
Primary
Resource
Activities
Province
p
p
p
p
p
p
Population
Geography
School
District
Province
q p
Urban
Geography
School
District
Province
Multiple Choice
Long Answer
qppq
71.4
71.9
71.1
63.7
70.5
59.9
61.1
69.8
69.8
73.1
59.6
67.0
56.2
62.7
63.9
59.0
59.0
50.4
66.0
59.4
73.2
69.5
69.3
Average Mark, 2007-2010
2010
75
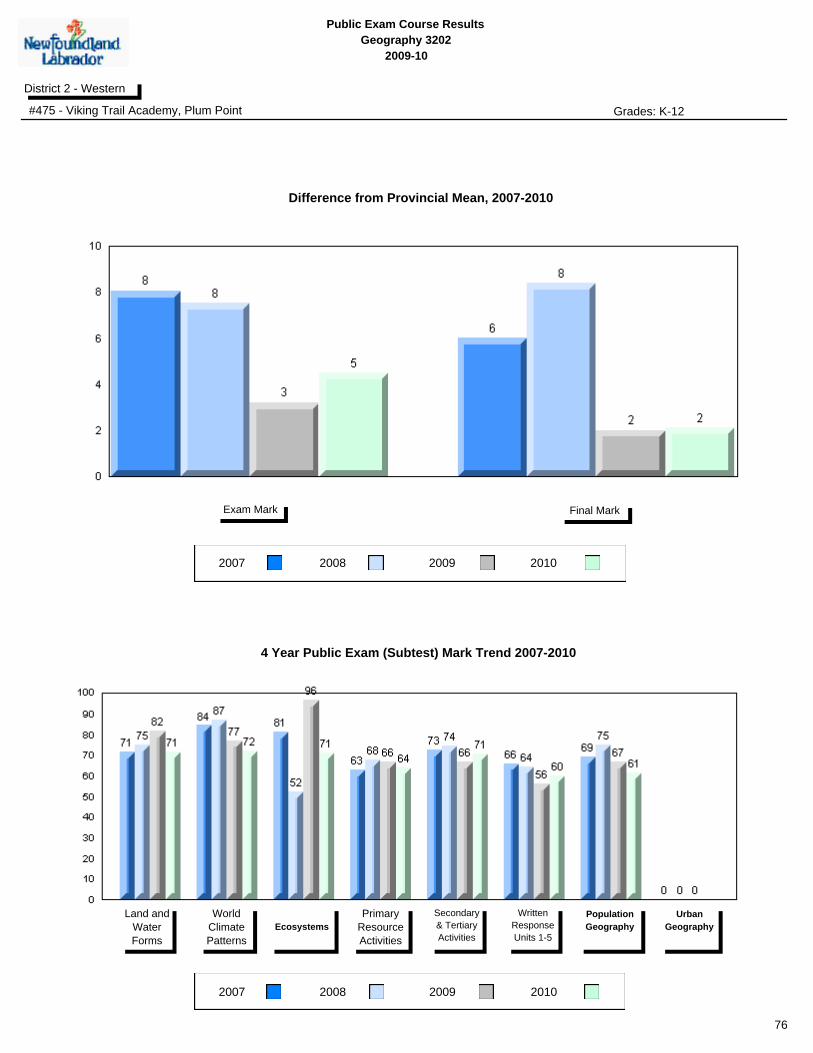
Public Exam Course Results
Geography 3202
2009-10
District 2 - Western
#475 - Viking Trail Academy, Plum Point Grades: K-12
2007 2008 2009
2007 2008 2009
Final MarkExam Mark
Land and
Water
Forms
World
Climate
Patterns
Ecosystems
Primary
Resource
Activities
Secondary
& Tertiary
Activities
Written
Response
Units 1-5
Population
Geography
Urban
Geography
4 Year Public Exam (Subtest) Mark Trend 2007-2010
Difference from Provincial Mean, 2007-2010
2010
2010
76

Public Exam Course Results
Geography 3202
2009-10
District 2 - Western
#485 - Corner Brook High School, Corner Brook Grades: 10-12
2007 2008 2009
Final MarkExam Mark
School
vs
Province
School
vs
District
Final
Mark
p p 67.1
64.6
66.7
Number of Students
School
District
Province
School
District
Province
World
Climate
Patterns
School
DistrictEcosystems
Land and
Water Forms
Province
Subtest
School
vs
Province
School
vs
District
Public
Exam
Mark
School
District
Province
p p
q
q
p
p
p
q
63.9
142
58.8
61.9
World Geography 3202
School
District
Province
School
District
Province
Secondary &
Tertiary Activities
School
District
Written response
Units 1-5
Primary
Resource
Activities
Province
p
p
p
p
p
p
Population
Geography
School
District
Province
p p
Urban
Geography
School
District
Province
Multiple Choice
Long Answer
69.2
70.7
70.4
66.1
69.2
59.7
64.0
33.3
69.8
69.8
73.1
59.6
67.0
56.2
62.7
63.9
59.0
59.0
50.4
66.0
59.4
73.2
69.5
69.3
Average Mark, 2007-2010
2010
77
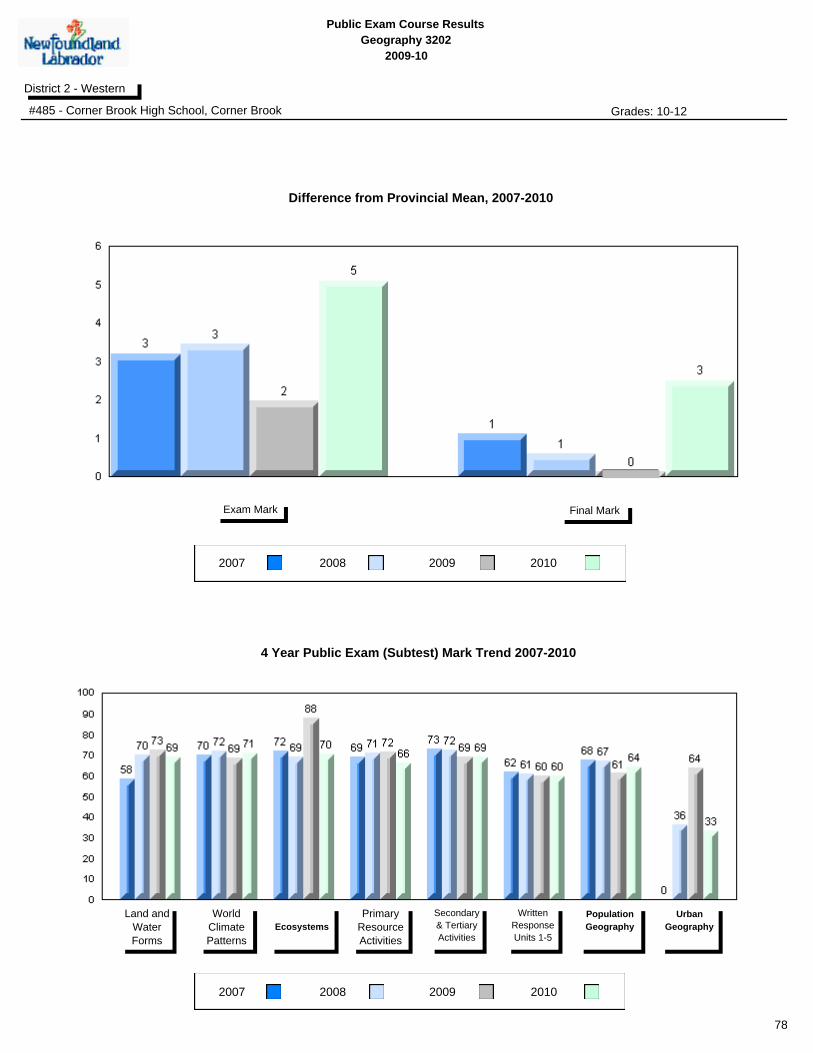
Public Exam Course Results
Geography 3202
2009-10
District 2 - Western
#485 - Corner Brook High School, Corner Brook Grades: 10-12
2007 2008 2009
2007 2008 2009
Final MarkExam Mark
Land and
Water
Forms
World
Climate
Patterns
Ecosystems
Primary
Resource
Activities
Secondary
& Tertiary
Activities
Written
Response
Units 1-5
Population
Geography
Urban
Geography
4 Year Public Exam (Subtest) Mark Trend 2007-2010
Difference from Provincial Mean, 2007-2010
2010
2010
78
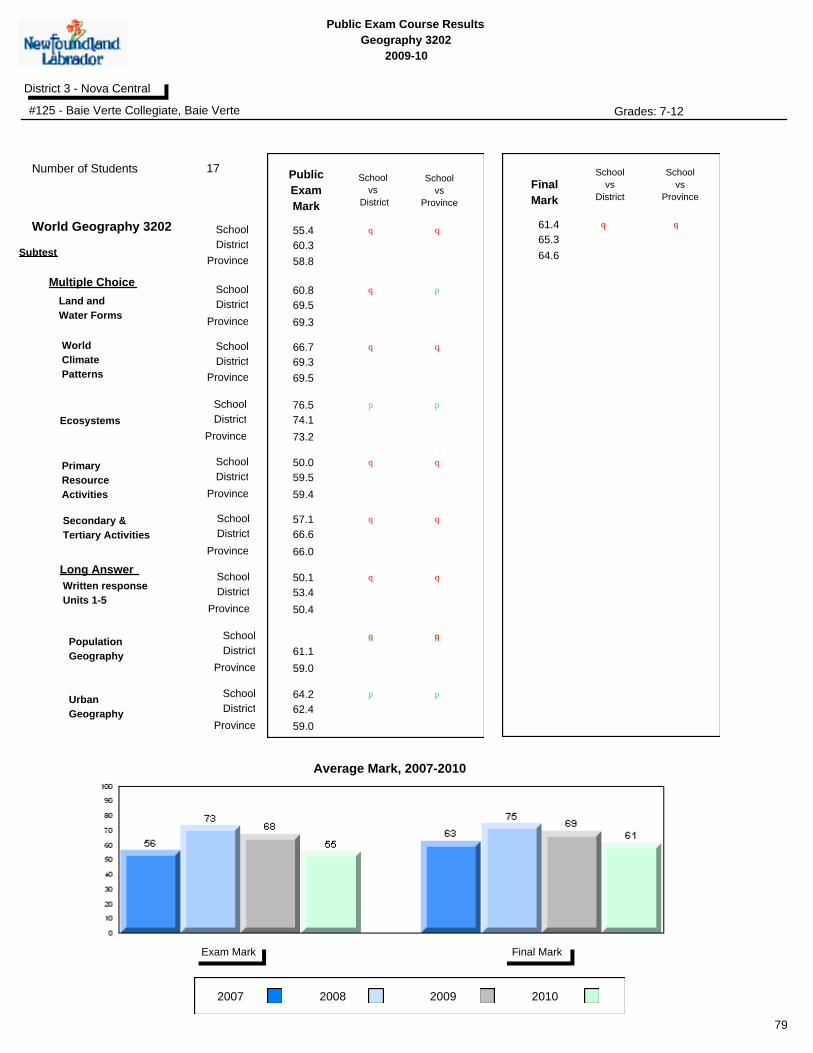
Public Exam Course Results
Geography 3202
2009-10
District 3 - Nova Central
#125 - Baie Verte Collegiate, Baie Verte Grades: 7-12
2007 2008 2009
Final MarkExam Mark
School
vs
Province
School
vs
District
Final
Mark
q q 61.4
64.6
65.3
Number of Students
School
District
Province
School
District
Province
World
Climate
Patterns
School
DistrictEcosystems
Land and
Water Forms
Province
Subtest
School
vs
Province
School
vs
District
Public
Exam
Mark
School
District
Province
q q
q
q
p
p
p
q
55.4
17
58.8
60.3
World Geography 3202
School
District
Province
School
District
Province
Secondary &
Tertiary Activities
School
District
Written response
Units 1-5
Primary
Resource
Activities
Province
q
q
q
q
q
q
Population
Geography
School
District
Province
qp pq
Urban
Geography
School
District
Province
Multiple Choice
Long Answer
pp
60.8
66.7
76.5
50.0
57.1
50.1
64.2
69.5
69.3
74.1
59.5
66.6
53.4
61.1
62.4
59.0
59.0
50.4
66.0
59.4
73.2
69.5
69.3
Average Mark, 2007-2010
2010
79
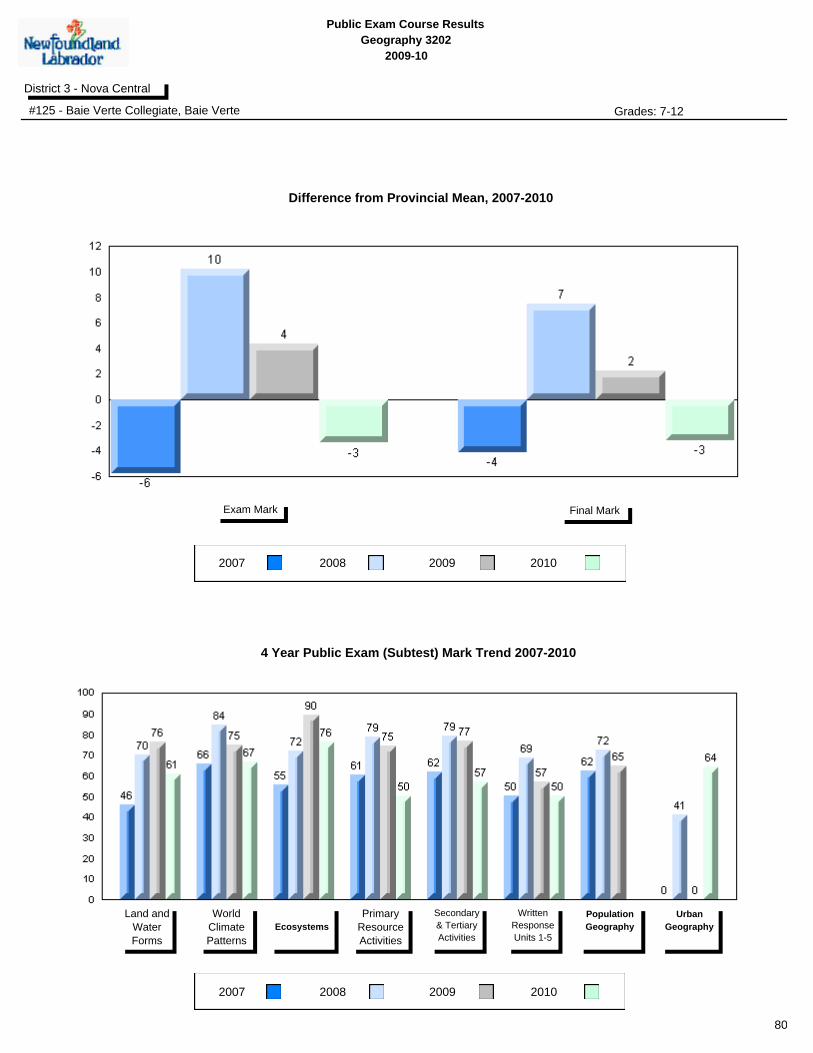
Public Exam Course Results
Geography 3202
2009-10
District 3 - Nova Central
#125 - Baie Verte Collegiate, Baie Verte Grades: 7-12
2007 2008 2009
2007 2008 2009
Final MarkExam Mark
Land and
Water
Forms
World
Climate
Patterns
Ecosystems
Primary
Resource
Activities
Secondary
& Tertiary
Activities
Written
Response
Units 1-5
Population
Geography
Urban
Geography
4 Year Public Exam (Subtest) Mark Trend 2007-2010
Difference from Provincial Mean, 2007-2010
2010
2010
80

Public Exam Course Results
Geography 3202
2009-10
District 3 - Nova Central
#132 - Botwood Collegiate, Botwood Grades: 7-12
2007 2008 2009
Final MarkExam Mark
School
vs
Province
School
vs
District
Final
Mark
q q 62.0
64.6
65.3
Number of Students
School
District
Province
School
District
Province
World
Climate
Patterns
School
DistrictEcosystems
Land and
Water Forms
Province
Subtest
School
vs
Province
School
vs
District
Public
Exam
Mark
School
District
Province
q q
q
q
p
p
p
q
57.5
44
58.8
60.3
World Geography 3202
School
District
Province
School
District
Province
Secondary &
Tertiary Activities
School
District
Written response
Units 1-5
Primary
Resource
Activities
Province
q
q
p p
p
q
Population
Geography
School
District
Province
q q
Urban
Geography
School
District
Province
Multiple Choice
Long Answer
qppq
61.4
62.9
77.3
58.0
68.4
51.6
58.2
69.5
69.3
74.1
59.5
66.6
53.4
61.1
62.4
59.0
59.0
50.4
66.0
59.4
73.2
69.5
69.3
Average Mark, 2007-2010
2010
81
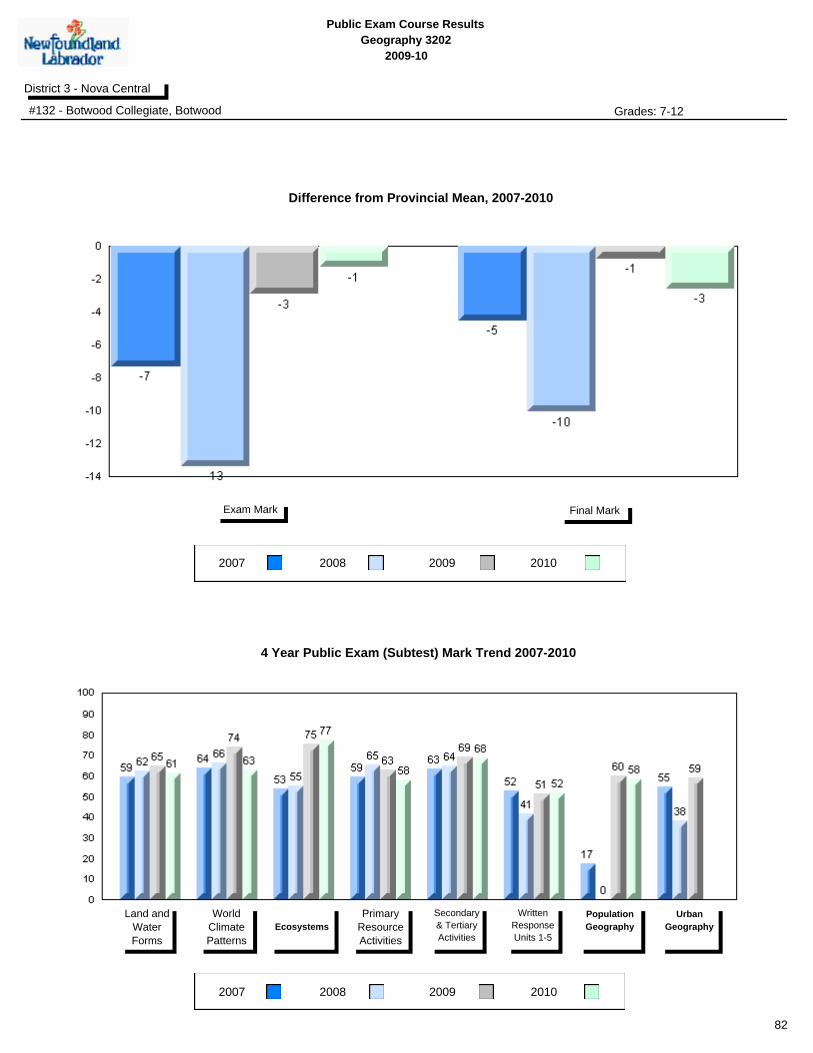
Public Exam Course Results
Geography 3202
2009-10
District 3 - Nova Central
#132 - Botwood Collegiate, Botwood Grades: 7-12
2007 2008 2009
2007 2008 2009
Final MarkExam Mark
Land and
Water
Forms
World
Climate
Patterns
Ecosystems
Primary
Resource
Activities
Secondary
& Tertiary
Activities
Written
Response
Units 1-5
Population
Geography
Urban
Geography
4 Year Public Exam (Subtest) Mark Trend 2007-2010
Difference from Provincial Mean, 2007-2010
2010
2010
82

Public Exam Course Results
Geography 3202
2009-10
District 3 - Nova Central
#149 - King Academy, Harbour Breton Grades: 7-12
2007 2008 2009
Final MarkExam Mark
School
vs
Province
School
vs
District
Final
Mark
p p 73.9
64.6
65.3
Number of Students
School
District
Province
School
District
Province
World
Climate
Patterns
School
DistrictEcosystems
Land and
Water Forms
Province
Subtest
School
vs
Province
School
vs
District
Public
Exam
Mark
School
District
Province
p p
q
p
p
p
p
p
69.0
14
58.8
60.3
World Geography 3202
School
District
Province
School
District
Province
Secondary &
Tertiary Activities
School
District
Written response
Units 1-5
Primary
Resource
Activities
Province
p
p
p
p
p
p
Population
Geography
School
District
Province
p p
Urban
Geography
School
District
Province
Multiple Choice
Long Answer
qppq
67.5
78.6
80.4
61.4
79.3
68.5
64.6
69.5
69.3
74.1
59.5
66.6
53.4
61.1
62.4
59.0
59.0
50.4
66.0
59.4
73.2
69.5
69.3
Average Mark, 2007-2010
2010
83
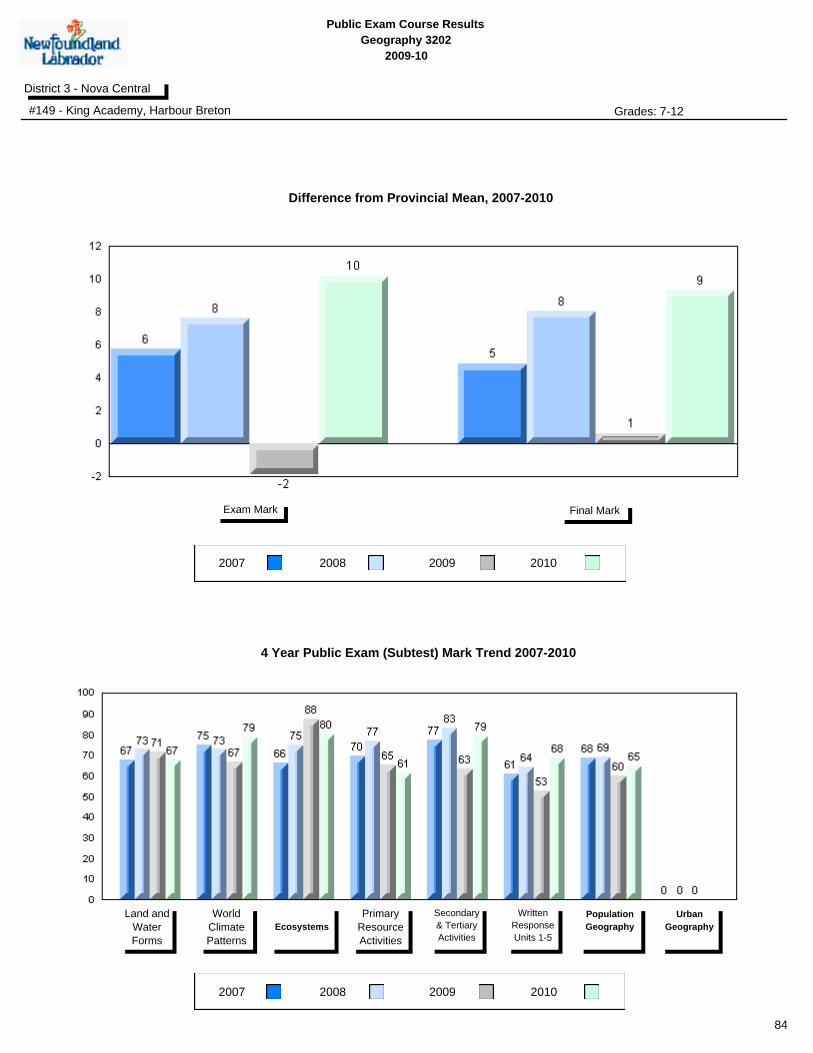
Public Exam Course Results
Geography 3202
2009-10
District 3 - Nova Central
#149 - King Academy, Harbour Breton Grades: 7-12
2007 2008 2009
2007 2008 2009
Final MarkExam Mark
Land and
Water
Forms
World
Climate
Patterns
Ecosystems
Primary
Resource
Activities
Secondary
& Tertiary
Activities
Written
Response
Units 1-5
Population
Geography
Urban
Geography
4 Year Public Exam (Subtest) Mark Trend 2007-2010
Difference from Provincial Mean, 2007-2010
2010
2010
84

Public Exam Course Results
Geography 3202
2009-10
District 3 - Nova Central
#151 - John Watkins Academy, Hermitage Grades: K-12
2007 2008 2009
Final MarkExam Mark
School
vs
Province
School
vs
District
Final
Mark
p p 74.2
64.6
65.3
Number of Students
School
District
Province
School
District
Province
World
Climate
Patterns
School
DistrictEcosystems
Land and
Water Forms
Province
Subtest
School
vs
Province
School
vs
District
Public
Exam
Mark
School
District
Province
p p
q
q
p p
q
q
67.3
6
58.8
60.3
World Geography 3202
School
District
Province
School
District
Province
Secondary &
Tertiary Activities
School
District
Written response
Units 1-5
Primary
Resource
Activities
Province
p
p
p
p
p
p
Population
Geography
School
District
Province
p p
Urban
Geography
School
District
Province
Multiple Choice
Long Answer
qppq
77.8
63.0
66.7
63.3
76.7
61.6
73.5
69.5
69.3
74.1
59.5
66.6
53.4
61.1
62.4
59.0
59.0
50.4
66.0
59.4
73.2
69.5
69.3
Average Mark, 2007-2010
2010
85
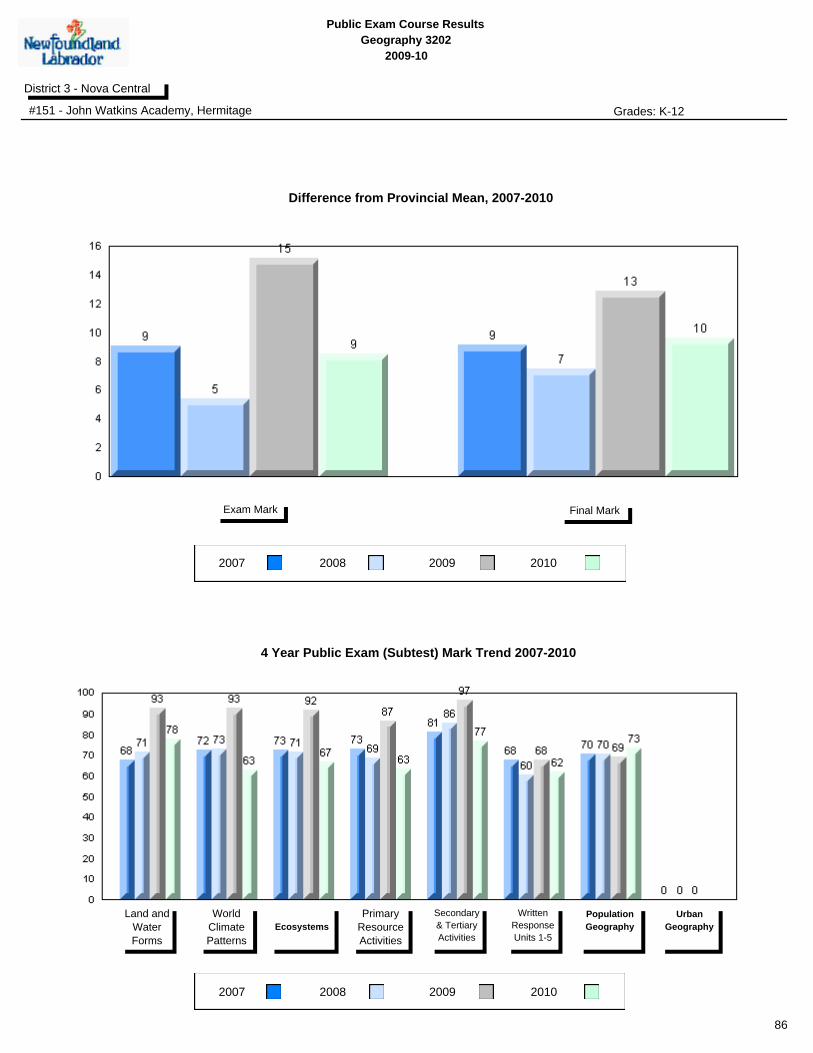
Public Exam Course Results
Geography 3202
2009-10
District 3 - Nova Central
#151 - John Watkins Academy, Hermitage Grades: K-12
2007 2008 2009
2007 2008 2009
Final MarkExam Mark
Land and
Water
Forms
World
Climate
Patterns
Ecosystems
Primary
Resource
Activities
Secondary
& Tertiary
Activities
Written
Response
Units 1-5
Population
Geography
Urban
Geography
4 Year Public Exam (Subtest) Mark Trend 2007-2010
Difference from Provincial Mean, 2007-2010
2010
2010
86

Public Exam Course Results
Geography 3202
2009-10
District 3 - Nova Central
#152 - Valmont Academy, King's Point Grades: K-12
2007 2008 2009
Final MarkExam Mark
School
vs
Province
School
vs
District
Final
Mark
q q 64.0
64.6
65.3
Number of Students
School
District
Province
School
District
Province
World
Climate
Patterns
School
DistrictEcosystems
Land and
Water Forms
Province
Subtest
School
vs
Province
School
vs
District
Public
Exam
Mark
School
District
Province
q q
q
q
p p
q
q
56.0
9
58.8
60.3
World Geography 3202
School
District
Province
School
District
Province
Secondary &
Tertiary Activities
School
District
Written response
Units 1-5
Primary
Resource
Activities
Province
q
q
q p
q
q
Population
Geography
School
District
Province
q p
Urban
Geography
School
District
Province
Multiple Choice
Long Answer
qppq
72.8
66.7
63.9
44.4
53.3
52.2
59.1
69.5
69.3
74.1
59.5
66.6
53.4
61.1
62.4
59.0
59.0
50.4
66.0
59.4
73.2
69.5
69.3
Average Mark, 2007-2010
2010
87
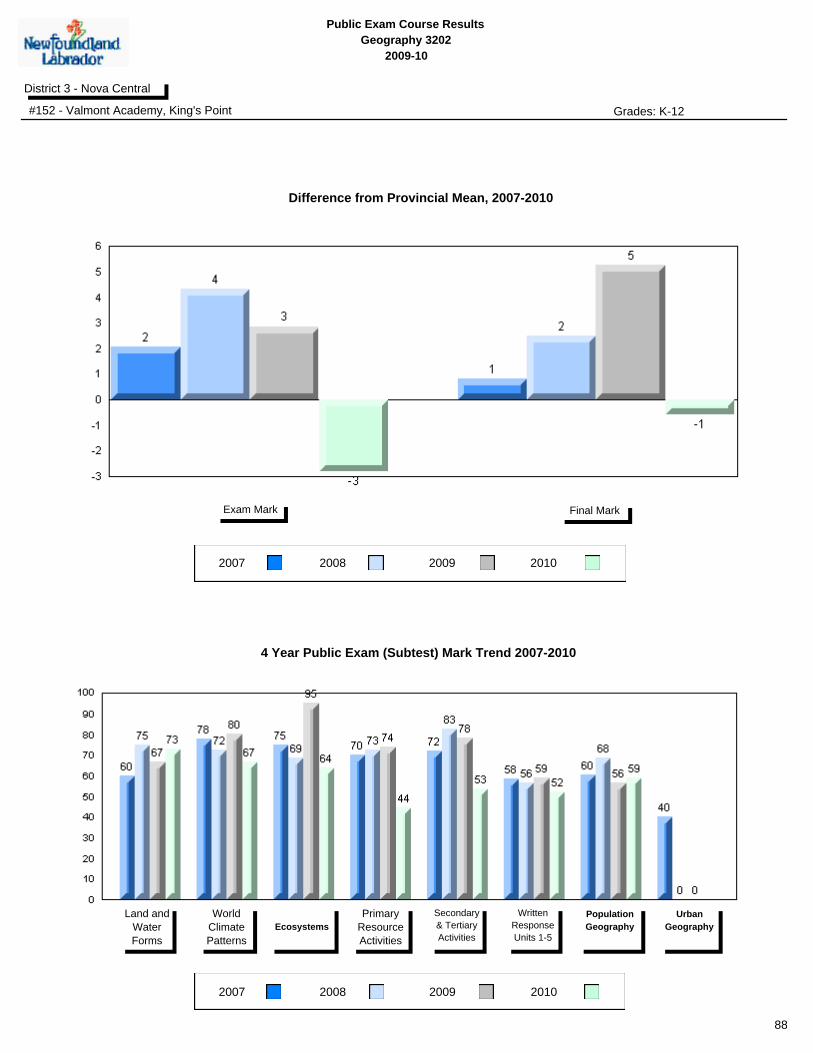
Public Exam Course Results
Geography 3202
2009-10
District 3 - Nova Central
#152 - Valmont Academy, King's Point Grades: K-12
2007 2008 2009
2007 2008 2009
Final MarkExam Mark
Land and
Water
Forms
World
Climate
Patterns
Ecosystems
Primary
Resource
Activities
Secondary
& Tertiary
Activities
Written
Response
Units 1-5
Population
Geography
Urban
Geography
4 Year Public Exam (Subtest) Mark Trend 2007-2010
Difference from Provincial Mean, 2007-2010
2010
2010
88
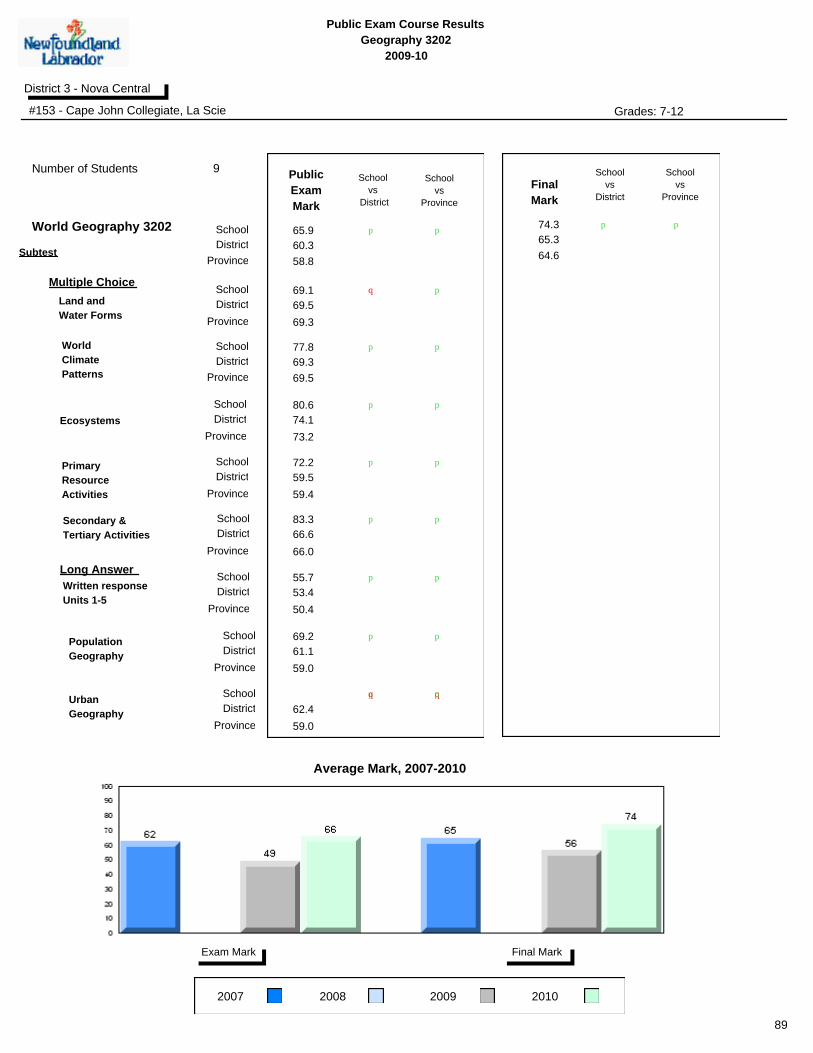
Public Exam Course Results
Geography 3202
2009-10
District 3 - Nova Central
#153 - Cape John Collegiate, La Scie Grades: 7-12
2007 2008 2009
Final MarkExam Mark
School
vs
Province
School
vs
District
Final
Mark
p p 74.3
64.6
65.3
Number of Students
School
District
Province
School
District
Province
World
Climate
Patterns
School
DistrictEcosystems
Land and
Water Forms
Province
Subtest
School
vs
Province
School
vs
District
Public
Exam
Mark
School
District
Province
p p
q
p
p
p
p
p
65.9
9
58.8
60.3
World Geography 3202
School
District
Province
School
District
Province
Secondary &
Tertiary Activities
School
District
Written response
Units 1-5
Primary
Resource
Activities
Province
p
p
p
p
p
p
Population
Geography
School
District
Province
p p
Urban
Geography
School
District
Province
Multiple Choice
Long Answer
qppq
69.1
77.8
80.6
72.2
83.3
55.7
69.2
69.5
69.3
74.1
59.5
66.6
53.4
61.1
62.4
59.0
59.0
50.4
66.0
59.4
73.2
69.5
69.3
Average Mark, 2007-2010
2010
89
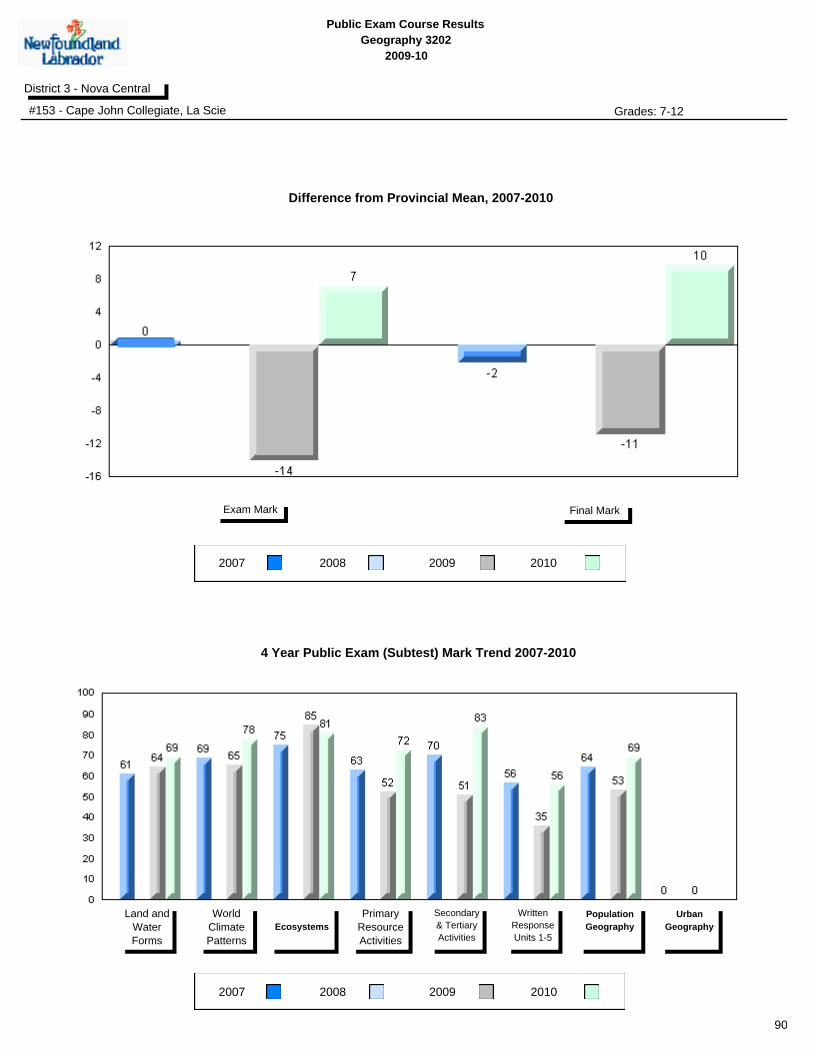
Public Exam Course Results
Geography 3202
2009-10
District 3 - Nova Central
#153 - Cape John Collegiate, La Scie Grades: 7-12
2007 2008 2009
2007 2008 2009
Final MarkExam Mark
Land and
Water
Forms
World
Climate
Patterns
Ecosystems
Primary
Resource
Activities
Secondary
& Tertiary
Activities
Written
Response
Units 1-5
Population
Geography
Urban
Geography
4 Year Public Exam (Subtest) Mark Trend 2007-2010
Difference from Provincial Mean, 2007-2010
2010
2010
90

Public Exam Course Results
Geography 3202
2009-10
District 3 - Nova Central
#156 - H.L. Strong Academy, Little Bay Islands Grades: 4,7,11-12
2007 2008 2009
Final MarkExam Mark
School
vs
Province
School
vs
District
Final
Mark
p p 83.0
64.6
65.3
Number of Students
School
District
Province
School
District
Province
World
Climate
Patterns
School
DistrictEcosystems
Land and
Water Forms
Province
Subtest
School
vs
Province
School
vs
District
Public
Exam
Mark
School
District
Province
p p
p
p
p
p
p
p
73.0
3
58.8
60.3
World Geography 3202
School
District
Province
School
District
Province
Secondary &
Tertiary Activities
School
District
Written response
Units 1-5
Primary
Resource
Activities
Province
p
p
p
p
p
p
Population
Geography
School
District
Province
p p
Urban
Geography
School
District
Province
Multiple Choice
Long Answer
qppq
88.9
81.5
91.7
66.7
83.3
64.4
74.2
69.5
69.3
74.1
59.5
66.6
53.4
61.1
62.4
59.0
59.0
50.4
66.0
59.4
73.2
69.5
69.3
Average Mark, 2007-2010
2010
School data with 5 or fewer
students withheld for reasons of
confidentiality.
School data with 5 or fewer
students withheld for reasons of
confidentiality.
School data with 5 or fewer students withheld for reasons of confidentiality.
91
Public Exam Course Results
Geography 3202
2009-10
District 3 - Nova Central
#156 - H.L. Strong Academy, Little Bay Islands Grades: 4,7,11-12
2007 2008 2009
2007 2008 2009
Final MarkExam Mark
Land and
Water
Forms
World
Climate
Patterns
Ecosystems
Primary
Resource
Activities
Secondary
& Tertiary
Activities
Written
Response
Units 1-5
Population
Geography
Urban
Geography
4 Year Public Exam (Subtest) Mark Trend 2007-2010
Difference from Provincial Mean, 2007-2010
2010
2010
School data with 5 or fewer students withheld for reasons of confidentiality.
School data with 5 or fewer students withheld for reasons of confidentiality.
92

Public Exam Course Results
Geography 3202
2009-10
District 3 - Nova Central
#158 - MSB Regional Academy, Middle Arm Grades: K-12
2007 2008 2009
Final MarkExam Mark
School
vs
Province
School
vs
District
Final
Mark
p p 70.7
64.6
65.3
Number of Students
School
District
Province
School
District
Province
World
Climate
Patterns
School
DistrictEcosystems
Land and
Water Forms
Province
Subtest
School
vs
Province
School
vs
District
Public
Exam
Mark
School
District
Province
p p
p
p
p
p
p
p
65.4
9
58.8
60.3
World Geography 3202
School
District
Province
School
District
Province
Secondary &
Tertiary Activities
School
District
Written response
Units 1-5
Primary
Resource
Activities
Province
p
p
p
p
p
p
Population
Geography
School
District
Province
p p
Urban
Geography
School
District
Province
Multiple Choice
Long Answer
qppq
80.3
74.1
83.3
61.1
71.1
57.9
65.7
69.5
69.3
74.1
59.5
66.6
53.4
61.1
62.4
59.0
59.0
50.4
66.0
59.4
73.2
69.5
69.3
Average Mark, 2007-2010
2010
93
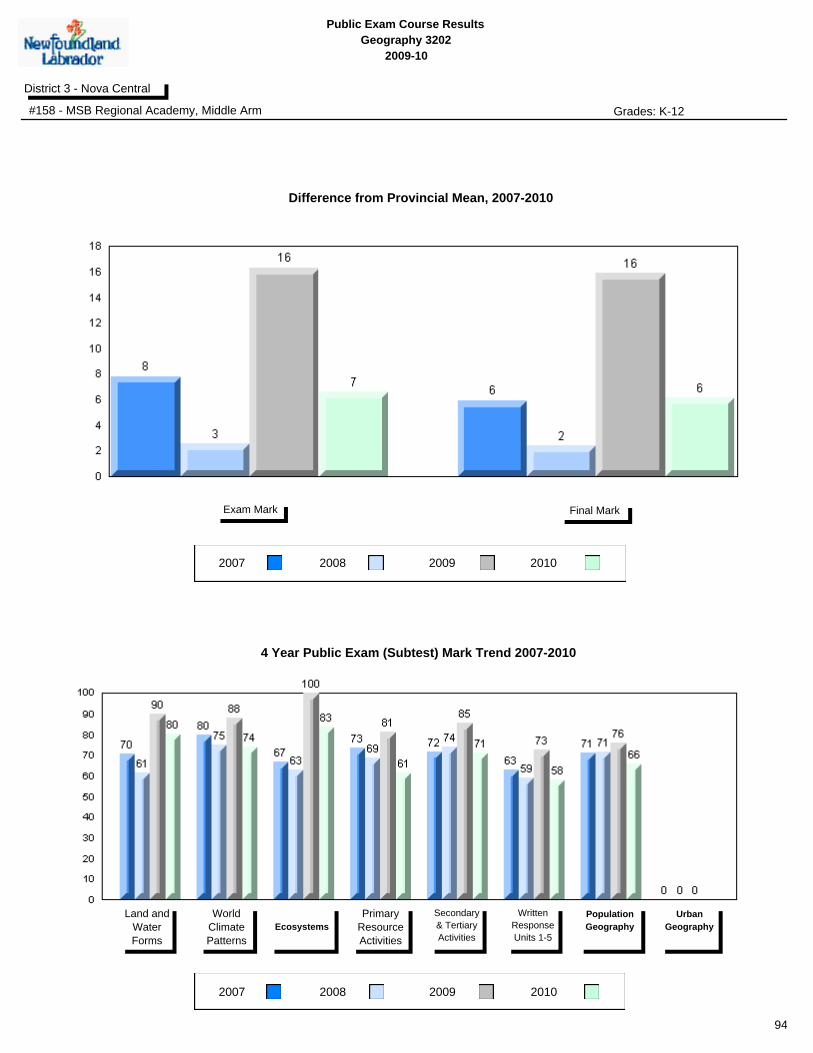
Public Exam Course Results
Geography 3202
2009-10
District 3 - Nova Central
#158 - MSB Regional Academy, Middle Arm Grades: K-12
2007 2008 2009
2007 2008 2009
Final MarkExam Mark
Land and
Water
Forms
World
Climate
Patterns
Ecosystems
Primary
Resource
Activities
Secondary
& Tertiary
Activities
Written
Response
Units 1-5
Population
Geography
Urban
Geography
4 Year Public Exam (Subtest) Mark Trend 2007-2010
Difference from Provincial Mean, 2007-2010
2010
2010
94

Public Exam Course Results
Geography 3202
2009-10
District 3 - Nova Central
#163 - Point Leamington Academy, Point Leamington Grades: K-12
2007 2008 2009
Final MarkExam Mark
School
vs
Province
School
vs
District
Final
Mark
p p 68.7
64.6
65.3
Number of Students
School
District
Province
School
District
Province
World
Climate
Patterns
School
DistrictEcosystems
Land and
Water Forms
Province
Subtest
School
vs
Province
School
vs
District
Public
Exam
Mark
School
District
Province
p p
p
p
p
p
p
p
64.1
10
58.8
60.3
World Geography 3202
School
District
Province
School
District
Province
Secondary &
Tertiary Activities
School
District
Written response
Units 1-5
Primary
Resource
Activities
Province
p
p
p
p
p
p
Population
Geography
School
District
Province
q p
Urban
Geography
School
District
Province
Multiple Choice
Long Answer
qppq
75.6
84.4
75.0
63.0
80.0
55.4
59.1
69.5
69.3
74.1
59.5
66.6
53.4
61.1
62.4
59.0
59.0
50.4
66.0
59.4
73.2
69.5
69.3
Average Mark, 2007-2010
2010
95
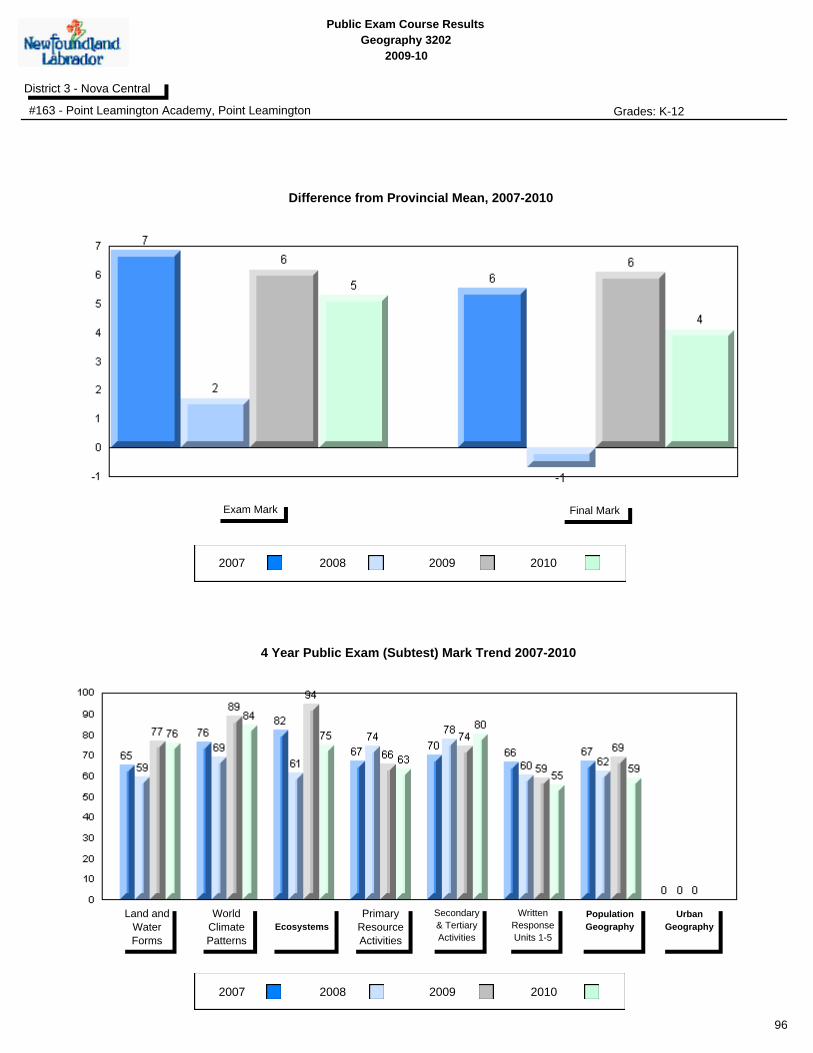
Public Exam Course Results
Geography 3202
2009-10
District 3 - Nova Central
#163 - Point Leamington Academy, Point Leamington Grades: K-12
2007 2008 2009
2007 2008 2009
Final MarkExam Mark
Land and
Water
Forms
World
Climate
Patterns
Ecosystems
Primary
Resource
Activities
Secondary
& Tertiary
Activities
Written
Response
Units 1-5
Population
Geography
Urban
Geography
4 Year Public Exam (Subtest) Mark Trend 2007-2010
Difference from Provincial Mean, 2007-2010
2010
2010
96

Public Exam Course Results
Geography 3202
2009-10
District 3 - Nova Central
#171 - Indian River High School, Springdale Grades: 7-12
2007 2008 2009
Final MarkExam Mark
School
vs
Province
School
vs
District
Final
Mark
p p 68.2
64.6
65.3
Number of Students
School
District
Province
School
District
Province
World
Climate
Patterns
School
DistrictEcosystems
Land and
Water Forms
Province
Subtest
School
vs
Province
School
vs
District
Public
Exam
Mark
School
District
Province
p p
p
p
p
p
p
p
64.2
26
58.8
60.3
World Geography 3202
School
District
Province
School
District
Province
Secondary &
Tertiary Activities
School
District
Written response
Units 1-5
Primary
Resource
Activities
Province
p
p
p
p
p
p
Population
Geography
School
District
Province
q q
Urban
Geography
School
District
Province
Multiple Choice
Long Answer
pp
78.6
78.2
76.0
64.2
75.8
54.3
48.5
65.1
69.5
69.3
74.1
59.5
66.6
53.4
61.1
62.4
59.0
59.0
50.4
66.0
59.4
73.2
69.5
69.3
Average Mark, 2007-2010
2010
97
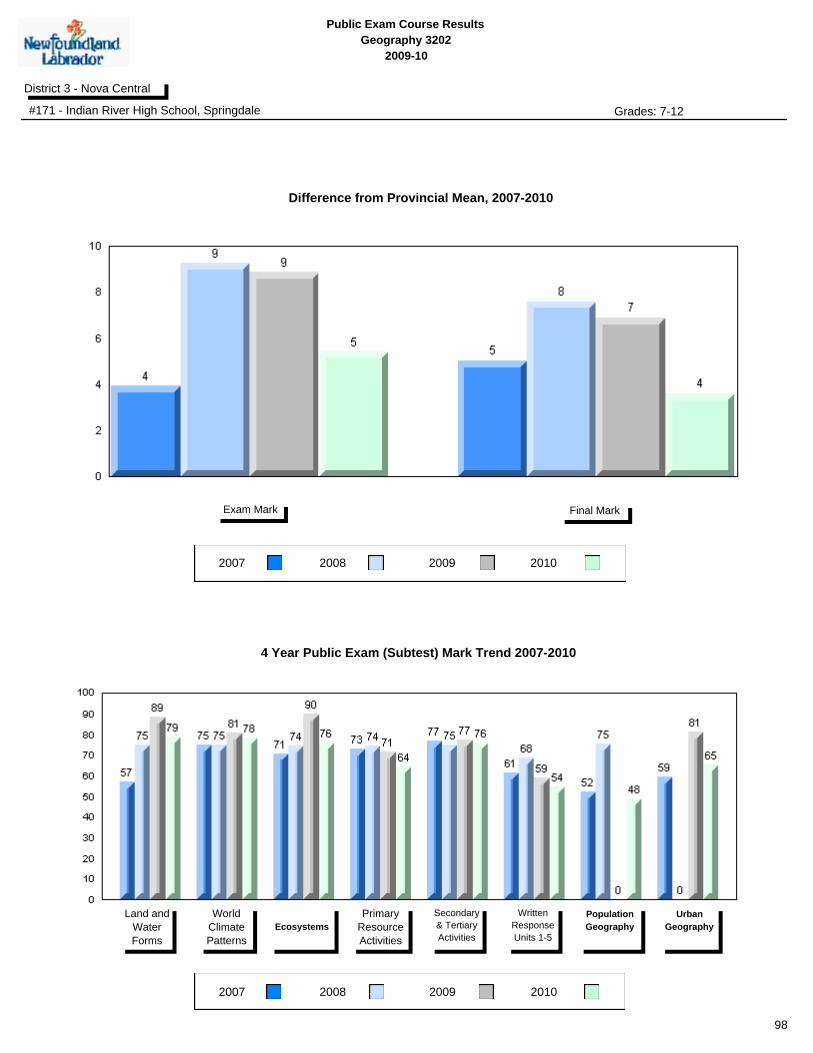
Public Exam Course Results
Geography 3202
2009-10
District 3 - Nova Central
#171 - Indian River High School, Springdale Grades: 7-12
2007 2008 2009
2007 2008 2009
Final MarkExam Mark
Land and
Water
Forms
World
Climate
Patterns
Ecosystems
Primary
Resource
Activities
Secondary
& Tertiary
Activities
Written
Response
Units 1-5
Population
Geography
Urban
Geography
4 Year Public Exam (Subtest) Mark Trend 2007-2010
Difference from Provincial Mean, 2007-2010
2010
2010
98

Public Exam Course Results
Geography 3202
2009-10
District 3 - Nova Central
#178 - Phoenix Academy, Carmanville Grades: K-12
2007 2008 2009
Final MarkExam Mark
School
vs
Province
School
vs
District
Final
Mark
q q 56.4
64.6
65.3
Number of Students
School
District
Province
School
District
Province
World
Climate
Patterns
School
DistrictEcosystems
Land and
Water Forms
Province
Subtest
School
vs
Province
School
vs
District
Public
Exam
Mark
School
District
Province
q q
q
q
q
p
p
q
49.4
16
58.8
60.3
World Geography 3202
School
District
Province
School
District
Province
Secondary &
Tertiary Activities
School
District
Written response
Units 1-5
Primary
Resource
Activities
Province
q
q
q
q
q
q
Population
Geography
School
District
Province
q q
Urban
Geography
School
District
Province
Multiple Choice
Long Answer
qppq
66.0
58.3
73.4
46.9
46.3
44.3
46.5
69.5
69.3
74.1
59.5
66.6
53.4
61.1
62.4
59.0
59.0
50.4
66.0
59.4
73.2
69.5
69.3
Average Mark, 2007-2010
2010
99
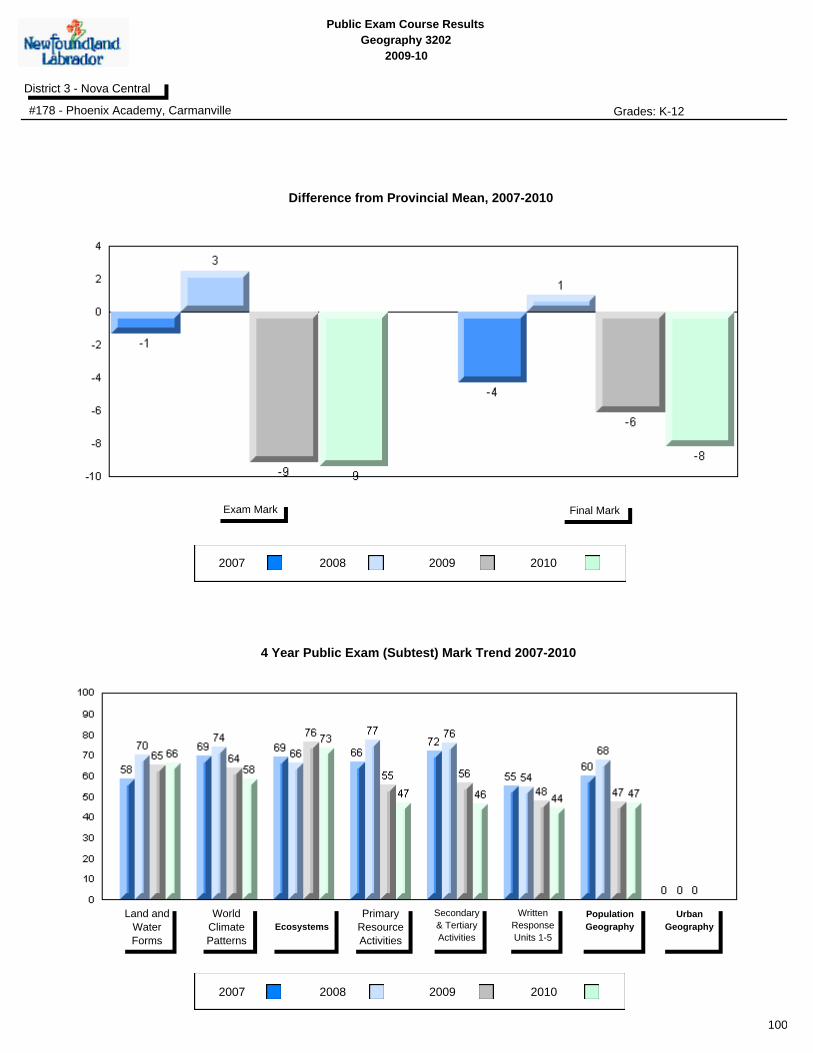
Public Exam Course Results
Geography 3202
2009-10
District 3 - Nova Central
#178 - Phoenix Academy, Carmanville Grades: K-12
2007 2008 2009
2007 2008 2009
Final MarkExam Mark
Land and
Water
Forms
World
Climate
Patterns
Ecosystems
Primary
Resource
Activities
Secondary
& Tertiary
Activities
Written
Response
Units 1-5
Population
Geography
Urban
Geography
4 Year Public Exam (Subtest) Mark Trend 2007-2010
Difference from Provincial Mean, 2007-2010
2010
2010
100

Public Exam Course Results
Geography 3202
2009-10
District 3 - Nova Central
#180 - A. R. Scammell Academy, Change Islands Grades: K-12
2007 2008 2009
Final MarkExam Mark
School
vs
Province
School
vs
District
Final
Mark
q q 57.0
64.6
65.3
Number of Students
School
District
Province
School
District
Province
World
Climate
Patterns
School
DistrictEcosystems
Land and
Water Forms
Province
Subtest
School
vs
Province
School
vs
District
Public
Exam
Mark
School
District
Province
q q
q
q
p p
q
q
54.0
1
58.8
60.3
World Geography 3202
School
District
Province
School
District
Province
Secondary &
Tertiary Activities
School
District
Written response
Units 1-5
Primary
Resource
Activities
Province
q
q
p p
q
q
Population
Geography
School
District
Province
qp pq
Urban
Geography
School
District
Province
Multiple Choice
Long Answer
qppq
55.6
55.6
75.0
50.0
80.0
47.2
69.5
69.3
74.1
59.5
66.6
53.4
61.1
62.4
59.0
59.0
50.4
66.0
59.4
73.2
69.5
69.3
Average Mark, 2007-2010
2010
School data with 5 or fewer
students withheld for reasons of
confidentiality.
School data with 5 or fewer
students withheld for reasons of
confidentiality.
School data with 5 or fewer students withheld for reasons of confidentiality.
101
Public Exam Course Results
Geography 3202
2009-10
District 3 - Nova Central
#180 - A. R. Scammell Academy, Change Islands Grades: K-12
2007 2008 2009
2007 2008 2009
Final MarkExam Mark
Land and
Water
Forms
World
Climate
Patterns
Ecosystems
Primary
Resource
Activities
Secondary
& Tertiary
Activities
Written
Response
Units 1-5
Population
Geography
Urban
Geography
4 Year Public Exam (Subtest) Mark Trend 2007-2010
Difference from Provincial Mean, 2007-2010
2010
2010
School data with 5 or fewer students withheld for reasons of confidentiality.
School data with 5 or fewer students withheld for reasons of confidentiality.
102

Public Exam Course Results
Geography 3202
2009-10
District 3 - Nova Central
#187 - Jane Collins Academy, Hare Bay Grades: 10-12
2007 2008 2009
Final MarkExam Mark
School
vs
Province
School
vs
District
Final
Mark
p p 70.3
64.6
65.3
Number of Students
School
District
Province
School
District
Province
World
Climate
Patterns
School
DistrictEcosystems
Land and
Water Forms
Province
Subtest
School
vs
Province
School
vs
District
Public
Exam
Mark
School
District
Province
p p
q
p
p
p
p
p
66.7
10
58.8
60.3
World Geography 3202
School
District
Province
School
District
Province
Secondary &
Tertiary Activities
School
District
Written response
Units 1-5
Primary
Resource
Activities
Province
p
p
p
p
p
p
Population
Geography
School
District
Province
p p
Urban
Geography
School
District
Province
Multiple Choice
Long Answer
qppq
66.7
70.0
87.5
74.0
72.0
61.8
67.3
69.5
69.3
74.1
59.5
66.6
53.4
61.1
62.4
59.0
59.0
50.4
66.0
59.4
73.2
69.5
69.3
Average Mark, 2007-2010
2010
103
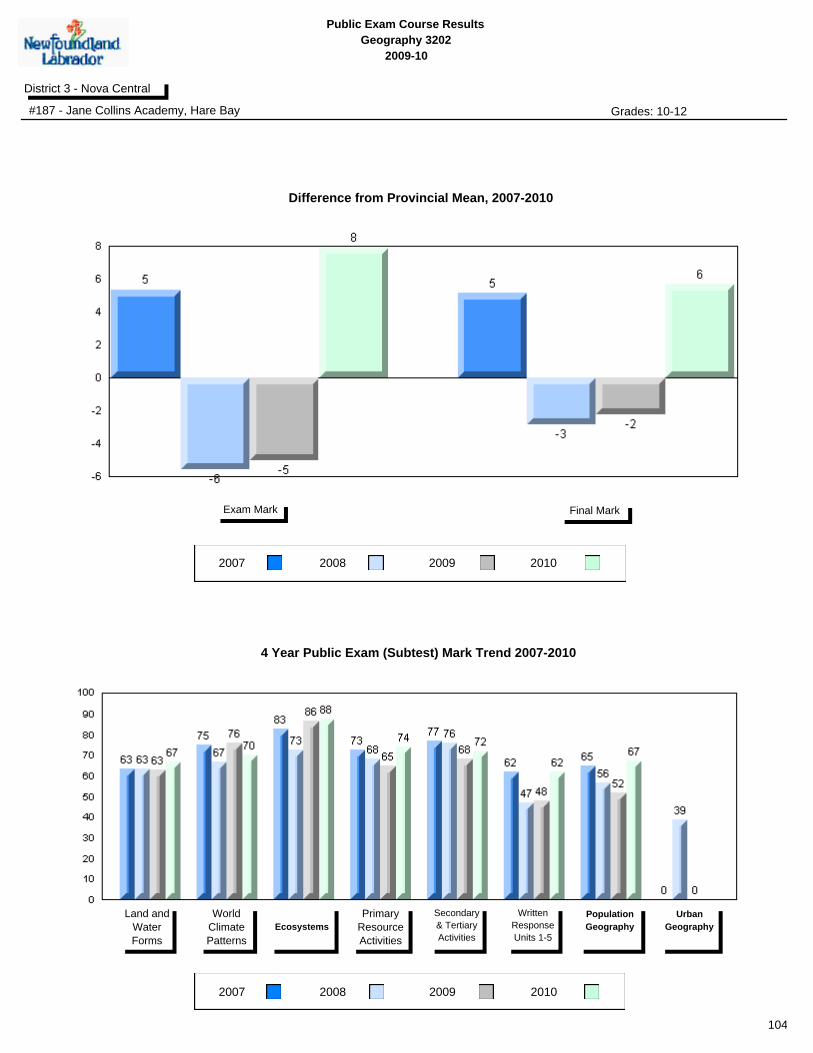
Public Exam Course Results
Geography 3202
2009-10
District 3 - Nova Central
#187 - Jane Collins Academy, Hare Bay Grades: 10-12
2007 2008 2009
2007 2008 2009
Final MarkExam Mark
Land and
Water
Forms
World
Climate
Patterns
Ecosystems
Primary
Resource
Activities
Secondary
& Tertiary
Activities
Written
Response
Units 1-5
Population
Geography
Urban
Geography
4 Year Public Exam (Subtest) Mark Trend 2007-2010
Difference from Provincial Mean, 2007-2010
2010
2010
104

Public Exam Course Results
Geography 3202
2009-10
District 3 - Nova Central
#190 - Lewisporte Collegiate, Lewisporte Grades: 10-12
2007 2008 2009
Final MarkExam Mark
School
vs
Province
School
vs
District
Final
Mark
q q 62.1
64.6
65.3
Number of Students
School
District
Province
School
District
Province
World
Climate
Patterns
School
DistrictEcosystems
Land and
Water Forms
Province
Subtest
School
vs
Province
School
vs
District
Public
Exam
Mark
School
District
Province
q q
q
p
p
p
p
p
56.3
43
58.8
60.3
World Geography 3202
School
District
Province
School
District
Province
Secondary &
Tertiary Activities
School
District
Written response
Units 1-5
Primary
Resource
Activities
Province
q
q
q
q
q
q
Population
Geography
School
District
Province
q q
Urban
Geography
School
District
Province
Multiple Choice
Long Answer
71.3
72.1
73.8
53.3
63.0
44.9
57.5
55.7
69.5
69.3
74.1
59.5
66.6
53.4
61.1
62.4
59.0
59.0
50.4
66.0
59.4
73.2
69.5
69.3
Average Mark, 2007-2010
2010
105
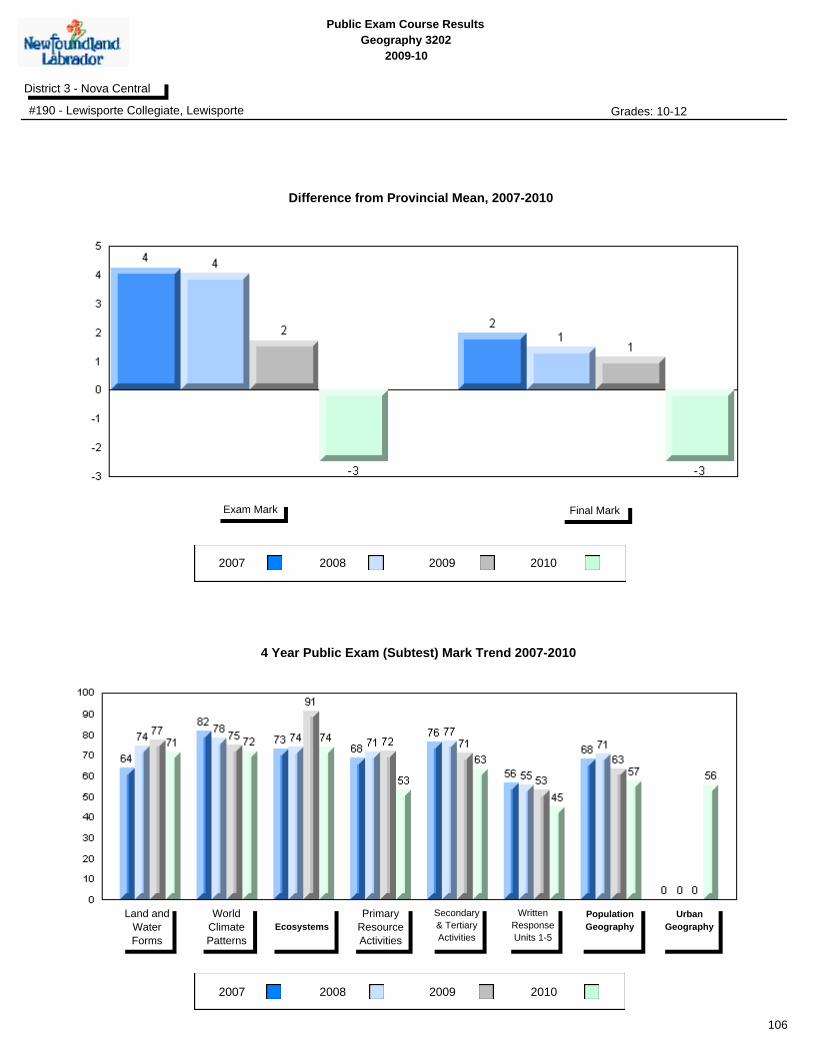
Public Exam Course Results
Geography 3202
2009-10
District 3 - Nova Central
#190 - Lewisporte Collegiate, Lewisporte Grades: 10-12
2007 2008 2009
2007 2008 2009
Final MarkExam Mark
Land and
Water
Forms
World
Climate
Patterns
Ecosystems
Primary
Resource
Activities
Secondary
& Tertiary
Activities
Written
Response
Units 1-5
Population
Geography
Urban
Geography
4 Year Public Exam (Subtest) Mark Trend 2007-2010
Difference from Provincial Mean, 2007-2010
2010
2010
106

Public Exam Course Results
Geography 3202
2009-10
District 3 - Nova Central
#194 - Gill Memorial Academy, Musgrave Harbour Grades: K-12
2007 2008 2009
Final MarkExam Mark
School
vs
Province
School
vs
District
Final
Mark
p p 68.5
64.6
65.3
Number of Students
School
District
Province
School
District
Province
World
Climate
Patterns
School
DistrictEcosystems
Land and
Water Forms
Province
Subtest
School
vs
Province
School
vs
District
Public
Exam
Mark
School
District
Province
p p
q
q
p p
q
q
63.8
10
58.8
60.3
World Geography 3202
School
District
Province
School
District
Province
Secondary &
Tertiary Activities
School
District
Written response
Units 1-5
Primary
Resource
Activities
Province
q
p
p
p
p
q
Population
Geography
School
District
Province
q p
Urban
Geography
School
District
Province
Multiple Choice
Long Answer
qppq
72.2
67.8
67.5
59.0
68.0
63.2
60.5
69.5
69.3
74.1
59.5
66.6
53.4
61.1
62.4
59.0
59.0
50.4
66.0
59.4
73.2
69.5
69.3
Average Mark, 2007-2010
2010
107
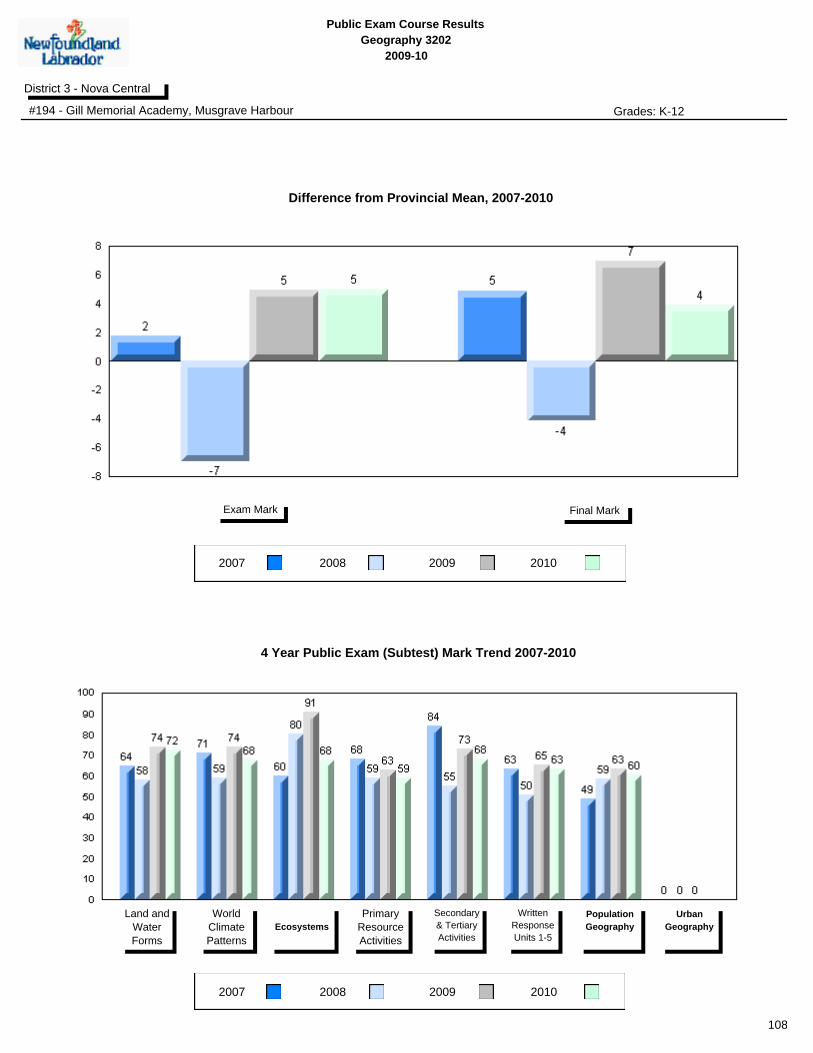
Public Exam Course Results
Geography 3202
2009-10
District 3 - Nova Central
#194 - Gill Memorial Academy, Musgrave Harbour Grades: K-12
2007 2008 2009
2007 2008 2009
Final MarkExam Mark
Land and
Water
Forms
World
Climate
Patterns
Ecosystems
Primary
Resource
Activities
Secondary
& Tertiary
Activities
Written
Response
Units 1-5
Population
Geography
Urban
Geography
4 Year Public Exam (Subtest) Mark Trend 2007-2010
Difference from Provincial Mean, 2007-2010
2010
2010
108

Public Exam Course Results
Geography 3202
2009-10
District 3 - Nova Central
#201 - J.M. Olds Collegiate, Twillingate Grades: 7-12
2007 2008 2009
Final MarkExam Mark
School
vs
Province
School
vs
District
Final
Mark
p p 70.1
64.6
65.3
Number of Students
School
District
Province
School
District
Province
World
Climate
Patterns
School
DistrictEcosystems
Land and
Water Forms
Province
Subtest
School
vs
Province
School
vs
District
Public
Exam
Mark
School
District
Province
p p
q
p
p
p
p
q
65.1
17
58.8
60.3
World Geography 3202
School
District
Province
School
District
Province
Secondary &
Tertiary Activities
School
District
Written response
Units 1-5
Primary
Resource
Activities
Province
p
p
p
p
p
p
Population
Geography
School
District
Province
qp pq
Urban
Geography
School
District
Province
Multiple Choice
Long Answer
pp
75.2
78.4
69.1
67.1
67.7
56.9
67.7
69.5
69.3
74.1
59.5
66.6
53.4
61.1
62.4
59.0
59.0
50.4
66.0
59.4
73.2
69.5
69.3
Average Mark, 2007-2010
2010
109
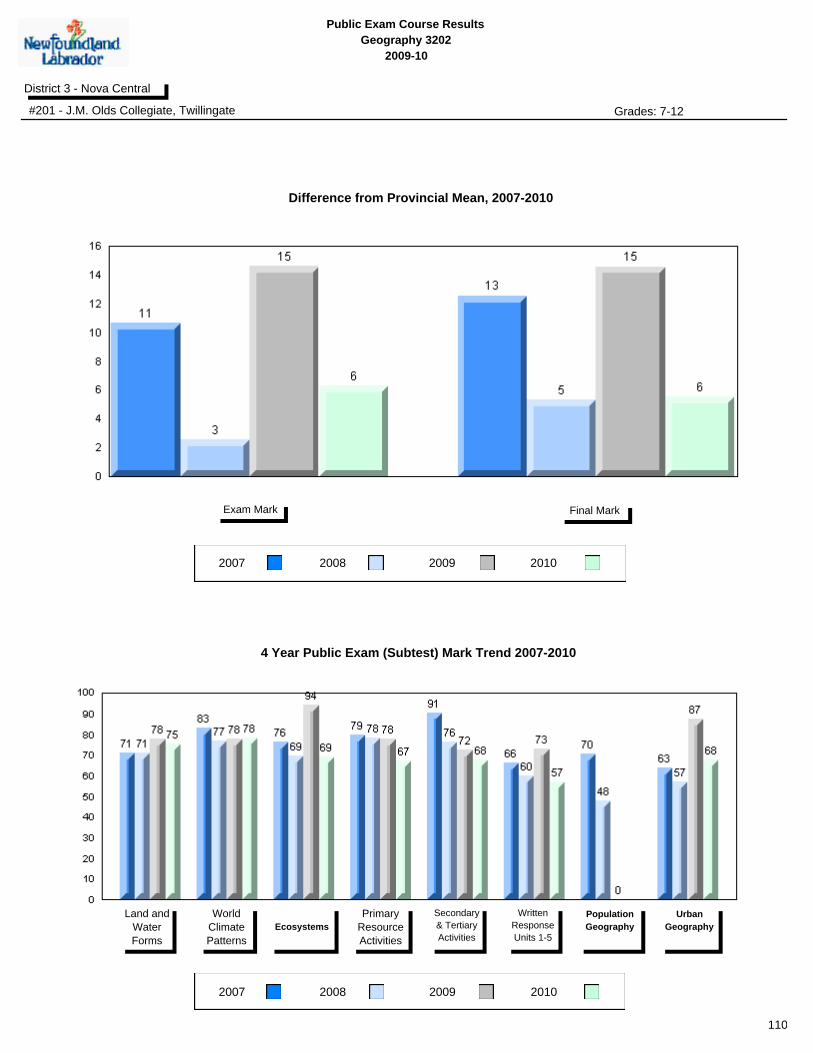
Public Exam Course Results
Geography 3202
2009-10
District 3 - Nova Central
#201 - J.M. Olds Collegiate, Twillingate Grades: 7-12
2007 2008 2009
2007 2008 2009
Final MarkExam Mark
Land and
Water
Forms
World
Climate
Patterns
Ecosystems
Primary
Resource
Activities
Secondary
& Tertiary
Activities
Written
Response
Units 1-5
Population
Geography
Urban
Geography
4 Year Public Exam (Subtest) Mark Trend 2007-2010
Difference from Provincial Mean, 2007-2010
2010
2010
110

Public Exam Course Results
Geography 3202
2009-10
District 3 - Nova Central
#204 - Lester Pearson Memorial High, Wesleyville Grades: 7-12
2007 2008 2009
Final MarkExam Mark
School
vs
Province
School
vs
District
Final
Mark
p p 72.1
64.6
65.3
Number of Students
School
District
Province
School
District
Province
World
Climate
Patterns
School
DistrictEcosystems
Land and
Water Forms
Province
Subtest
School
vs
Province
School
vs
District
Public
Exam
Mark
School
District
Province
p p
p
p
p
p
p
p
69.1
30
58.8
60.3
World Geography 3202
School
District
Province
School
District
Province
Secondary &
Tertiary Activities
School
District
Written response
Units 1-5
Primary
Resource
Activities
Province
p
p
p
p
p
p
Population
Geography
School
District
Province
p p
Urban
Geography
School
District
Province
Multiple Choice
Long Answer
qppq
78.9
76.3
82.5
66.0
78.3
61.8
70.5
69.5
69.3
74.1
59.5
66.6
53.4
61.1
62.4
59.0
59.0
50.4
66.0
59.4
73.2
69.5
69.3
Average Mark, 2007-2010
2010
111
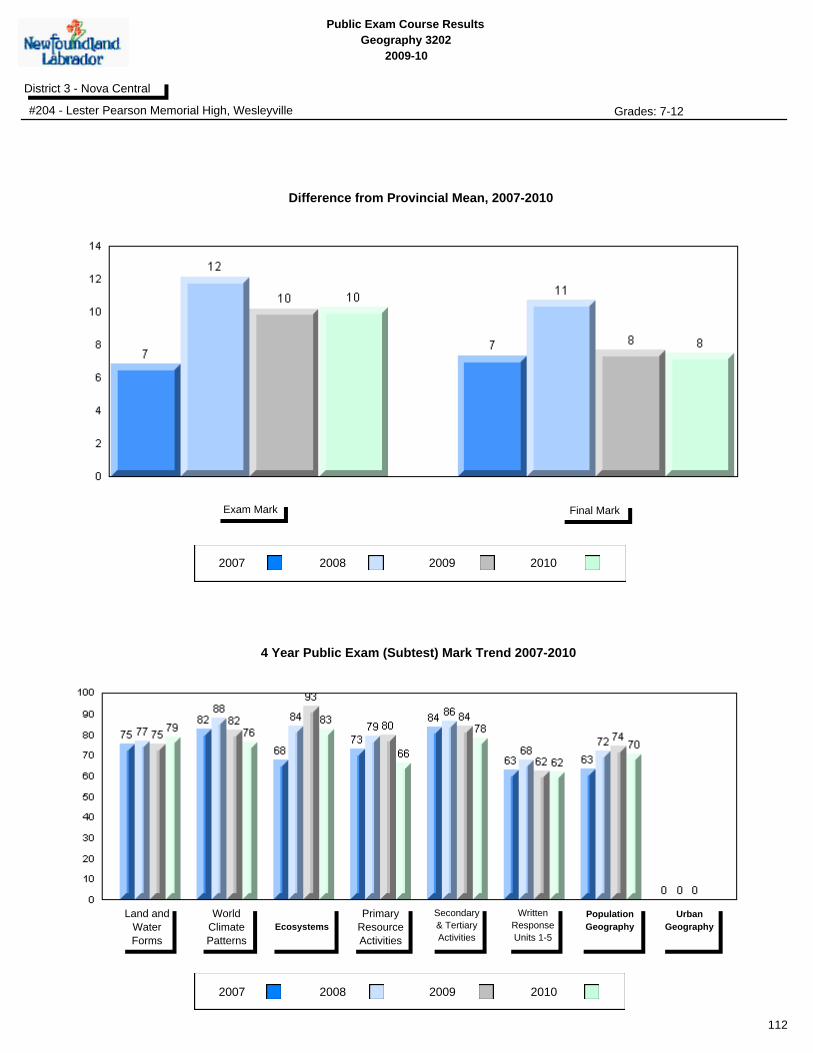
Public Exam Course Results
Geography 3202
2009-10
District 3 - Nova Central
#204 - Lester Pearson Memorial High, Wesleyville Grades: 7-12
2007 2008 2009
2007 2008 2009
Final MarkExam Mark
Land and
Water
Forms
World
Climate
Patterns
Ecosystems
Primary
Resource
Activities
Secondary
& Tertiary
Activities
Written
Response
Units 1-5
Population
Geography
Urban
Geography
4 Year Public Exam (Subtest) Mark Trend 2007-2010
Difference from Provincial Mean, 2007-2010
2010
2010
112

Public Exam Course Results
Geography 3202
2009-10
District 3 - Nova Central
#206 - Riverwood Academy, Wing's Point Grades: K-12
2007 2008 2009
Final MarkExam Mark
School
vs
Province
School
vs
District
Final
Mark
q q 58.6
64.6
65.3
Number of Students
School
District
Province
School
District
Province
World
Climate
Patterns
School
DistrictEcosystems
Land and
Water Forms
Province
Subtest
School
vs
Province
School
vs
District
Public
Exam
Mark
School
District
Province
q q
q
q
q
q
q
q
52.8
12
58.8
60.3
World Geography 3202
School
District
Province
School
District
Province
Secondary &
Tertiary Activities
School
District
Written response
Units 1-5
Primary
Resource
Activities
Province
q
q
q p
q
q
Population
Geography
School
District
Province
p p
Urban
Geography
School
District
Province
Multiple Choice
Long Answer
55.6
56.5
66.7
47.5
45.8
51.0
64.4
50.9
69.5
69.3
74.1
59.5
66.6
53.4
61.1
62.4
59.0
59.0
50.4
66.0
59.4
73.2
69.5
69.3
Average Mark, 2007-2010
2010
113
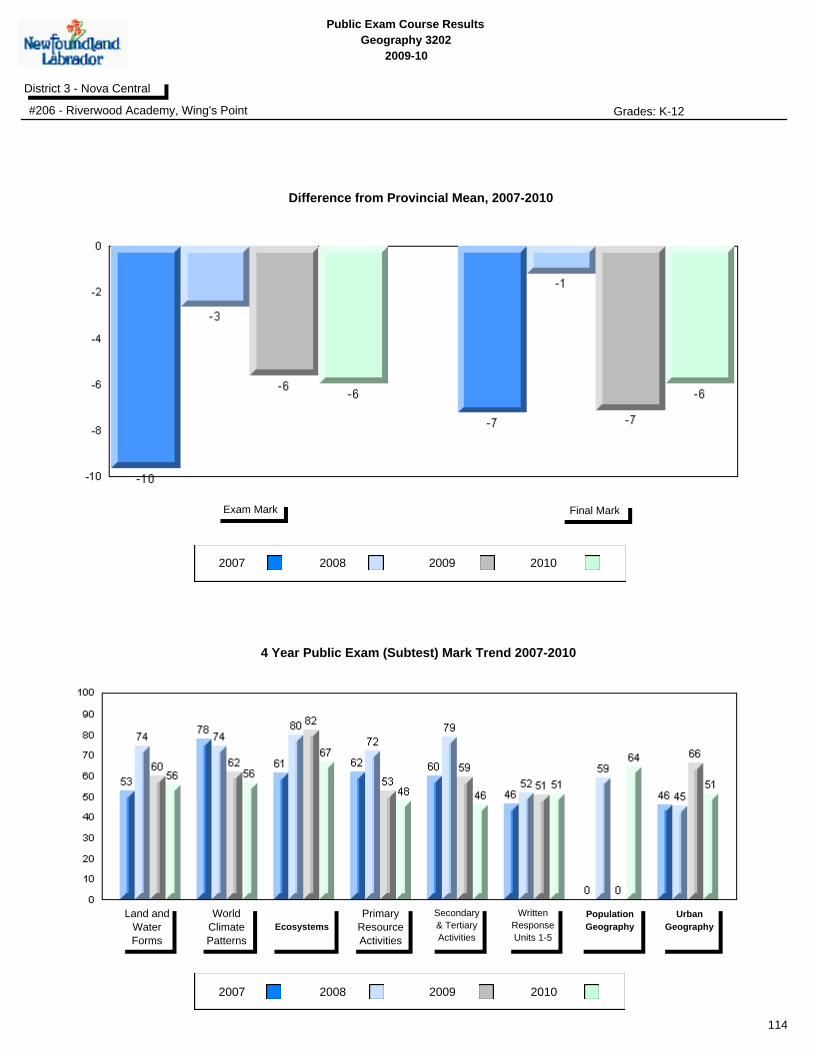
Public Exam Course Results
Geography 3202
2009-10
District 3 - Nova Central
#206 - Riverwood Academy, Wing's Point Grades: K-12
2007 2008 2009
2007 2008 2009
Final MarkExam Mark
Land and
Water
Forms
World
Climate
Patterns
Ecosystems
Primary
Resource
Activities
Secondary
& Tertiary
Activities
Written
Response
Units 1-5
Population
Geography
Urban
Geography
4 Year Public Exam (Subtest) Mark Trend 2007-2010
Difference from Provincial Mean, 2007-2010
2010
2010
114

Public Exam Course Results
Geography 3202
2009-10
District 3 - Nova Central
#402 - Leo Burke Academy, Bishop's Falls Grades: 7-12
2007 2008 2009
Final MarkExam Mark
School
vs
Province
School
vs
District
Final
Mark
q q 60.7
64.6
65.3
Number of Students
School
District
Province
School
District
Province
World
Climate
Patterns
School
DistrictEcosystems
Land and
Water Forms
Province
Subtest
School
vs
Province
School
vs
District
Public
Exam
Mark
School
District
Province
q q
q
q
p p
q
q
57.6
26
58.8
60.3
World Geography 3202
School
District
Province
School
District
Province
Secondary &
Tertiary Activities
School
District
Written response
Units 1-5
Primary
Resource
Activities
Province
q
q
q p
q
q
Population
Geography
School
District
Province
q q
Urban
Geography
School
District
Province
Multiple Choice
Long Answer
qppq
70.1
68.4
68.3
51.9
60.4
52.9
58.7
69.5
69.3
74.1
59.5
66.6
53.4
61.1
62.4
59.0
59.0
50.4
66.0
59.4
73.2
69.5
69.3
Average Mark, 2007-2010
2010
115
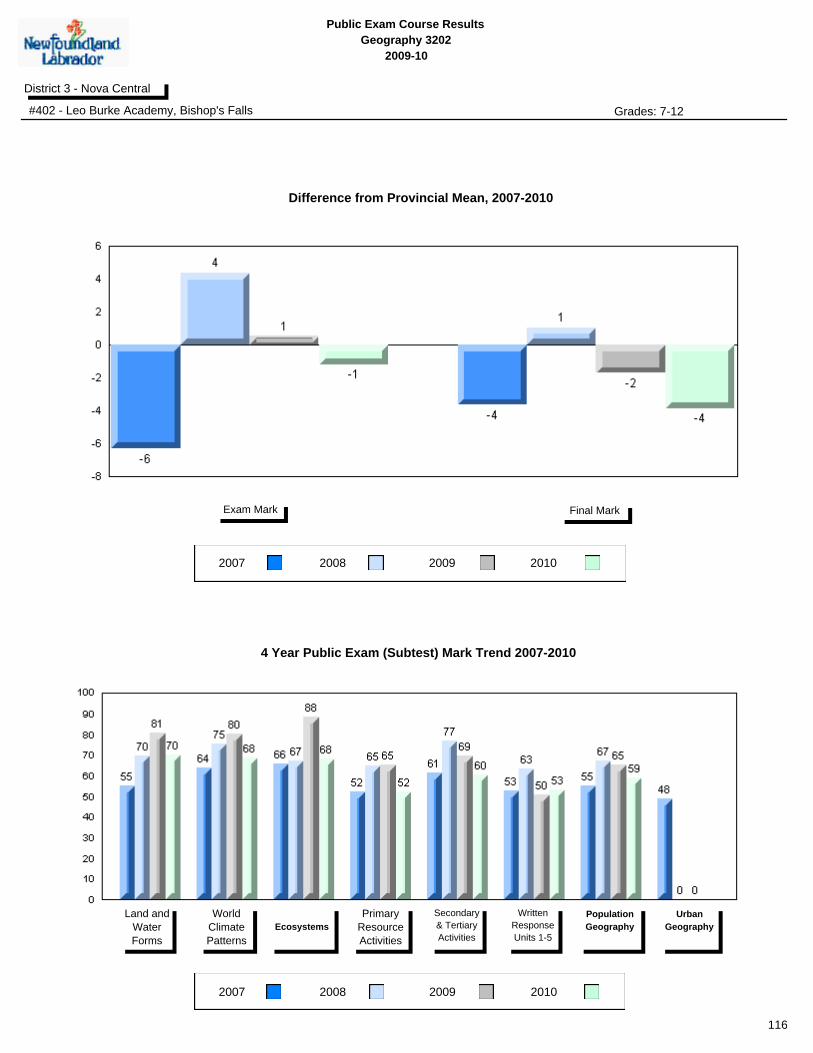
Public Exam Course Results
Geography 3202
2009-10
District 3 - Nova Central
#402 - Leo Burke Academy, Bishop's Falls Grades: 7-12
2007 2008 2009
2007 2008 2009
Final MarkExam Mark
Land and
Water
Forms
World
Climate
Patterns
Ecosystems
Primary
Resource
Activities
Secondary
& Tertiary
Activities
Written
Response
Units 1-5
Population
Geography
Urban
Geography
4 Year Public Exam (Subtest) Mark Trend 2007-2010
Difference from Provincial Mean, 2007-2010
2010
2010
116
Public Exam Course Results
Geography 3202
2009-10
District 3 - Nova Central
#405 - Cottrell's Cove Academy, Cottrell's Cove Grades: K-1,3-4,6-12
2007 2008 2009
Final MarkExam Mark
School
vs
Province
School
vs
District
Final
Mark
q q 62.2
64.6
65.3
Number of Students
School
District
Province
School
District
Province
World
Climate
Patterns
School
DistrictEcosystems
Land and
Water Forms
Province
Subtest
School
vs
Province
School
vs
District
Public
Exam
Mark
School
District
Province
q q
q
q
q
p
q
q
54.2
5
58.8
60.3
World Geography 3202
School
District
Province
School
District
Province
Secondary &
Tertiary Activities
School
District
Written response
Units 1-5
Primary
Resource
Activities
Province
q
q
p p
q
q
Population
Geography
School
District
Province
q q
Urban
Geography
School
District
Province
Multiple Choice
Long Answer
60.0
60.0
60.0
62.0
62.0
47.8
45.5
45.5
69.5
69.3
74.1
59.5
66.6
53.4
61.1
62.4
59.0
59.0
50.4
66.0
59.4
73.2
69.5
69.3
Average Mark, 2007-2010
2010
School data with 5 or fewer
students withheld for reasons of
confidentiality.
School data with 5 or fewer
students withheld for reasons of
confidentiality.
School data with 5 or fewer students withheld for reasons of confidentiality.
117

Public Exam Course Results
Geography 3202
2009-10
District 3 - Nova Central
#405 - Cottrell's Cove Academy, Cottrell's Cove Grades: K-1,3-4,6-12
2007 2008 2009
2007 2008 2009
Final MarkExam Mark
Land and
Water
Forms
World
Climate
Patterns
Ecosystems
Primary
Resource
Activities
Secondary
& Tertiary
Activities
Written
Response
Units 1-5
Population
Geography
Urban
Geography
4 Year Public Exam (Subtest) Mark Trend 2007-2010
Difference from Provincial Mean, 2007-2010
2010
2010
School data with 5 or fewer students withheld for reasons of confidentiality.
School data with 5 or fewer students withheld for reasons of confidentiality.
118

Public Exam Course Results
Geography 3202
2009-10
District 3 - Nova Central
#406 - Fitzgerald Academy, English Harbour West Grades: K-12
2007 2008 2009
Final MarkExam Mark
School
vs
Province
School
vs
District
Final
Mark
q q 61.3
64.6
65.3
Number of Students
School
District
Province
School
District
Province
World
Climate
Patterns
School
DistrictEcosystems
Land and
Water Forms
Province
Subtest
School
vs
Province
School
vs
District
Public
Exam
Mark
School
District
Province
q q
q
q
p
p
p
q
57.8
8
58.8
60.3
World Geography 3202
School
District
Province
School
District
Province
Secondary &
Tertiary Activities
School
District
Written response
Units 1-5
Primary
Resource
Activities
Province
q
q
p p
q
q
Population
Geography
School
District
Province
q q
Urban
Geography
School
District
Province
Multiple Choice
Long Answer
pq
59.7
62.5
81.3
55.0
63.8
54.3
51.5
62.1
69.5
69.3
74.1
59.5
66.6
53.4
61.1
62.4
59.0
59.0
50.4
66.0
59.4
73.2
69.5
69.3
Average Mark, 2007-2010
2010
119
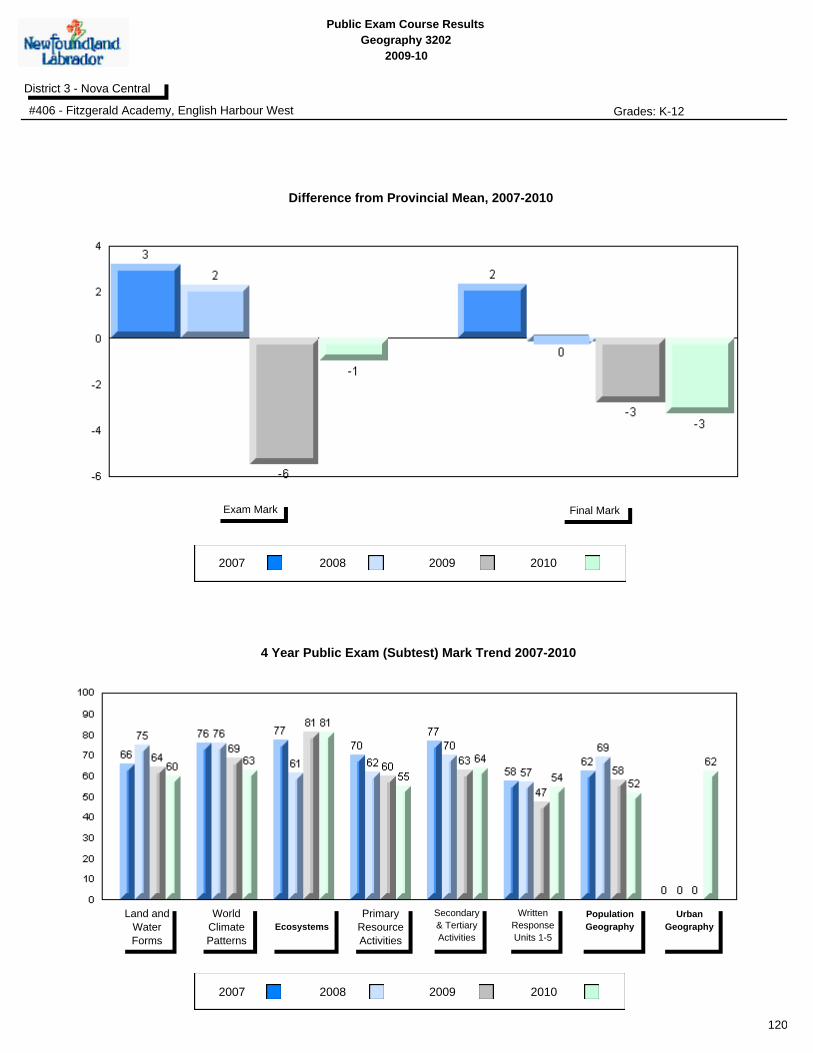
Public Exam Course Results
Geography 3202
2009-10
District 3 - Nova Central
#406 - Fitzgerald Academy, English Harbour West Grades: K-12
2007 2008 2009
2007 2008 2009
Final MarkExam Mark
Land and
Water
Forms
World
Climate
Patterns
Ecosystems
Primary
Resource
Activities
Secondary
& Tertiary
Activities
Written
Response
Units 1-5
Population
Geography
Urban
Geography
4 Year Public Exam (Subtest) Mark Trend 2007-2010
Difference from Provincial Mean, 2007-2010
2010
2010
120
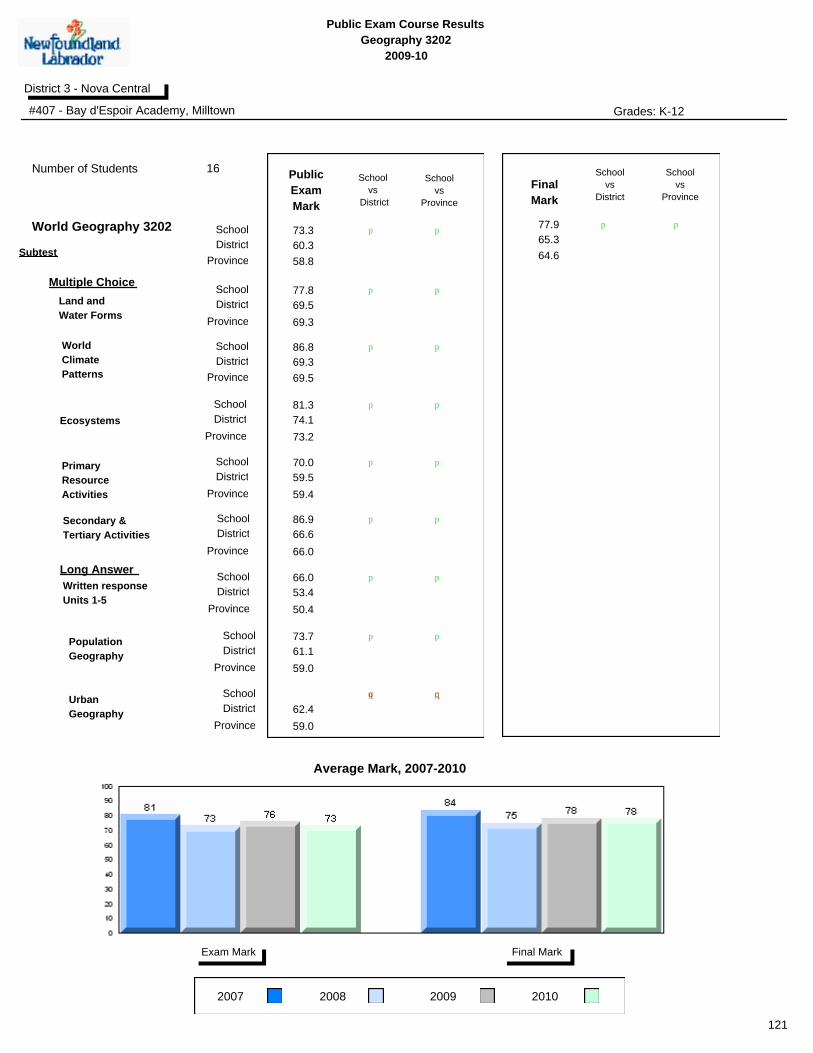
Public Exam Course Results
Geography 3202
2009-10
District 3 - Nova Central
#407 - Bay d'Espoir Academy, Milltown Grades: K-12
2007 2008 2009
Final MarkExam Mark
School
vs
Province
School
vs
District
Final
Mark
p p 77.9
64.6
65.3
Number of Students
School
District
Province
School
District
Province
World
Climate
Patterns
School
DistrictEcosystems
Land and
Water Forms
Province
Subtest
School
vs
Province
School
vs
District
Public
Exam
Mark
School
District
Province
p p
p
p
p
p
p
p
73.3
16
58.8
60.3
World Geography 3202
School
District
Province
School
District
Province
Secondary &
Tertiary Activities
School
District
Written response
Units 1-5
Primary
Resource
Activities
Province
p
p
p
p
p
p
Population
Geography
School
District
Province
p p
Urban
Geography
School
District
Province
Multiple Choice
Long Answer
qppq
77.8
86.8
81.3
70.0
86.9
66.0
73.7
69.5
69.3
74.1
59.5
66.6
53.4
61.1
62.4
59.0
59.0
50.4
66.0
59.4
73.2
69.5
69.3
Average Mark, 2007-2010
2010
121
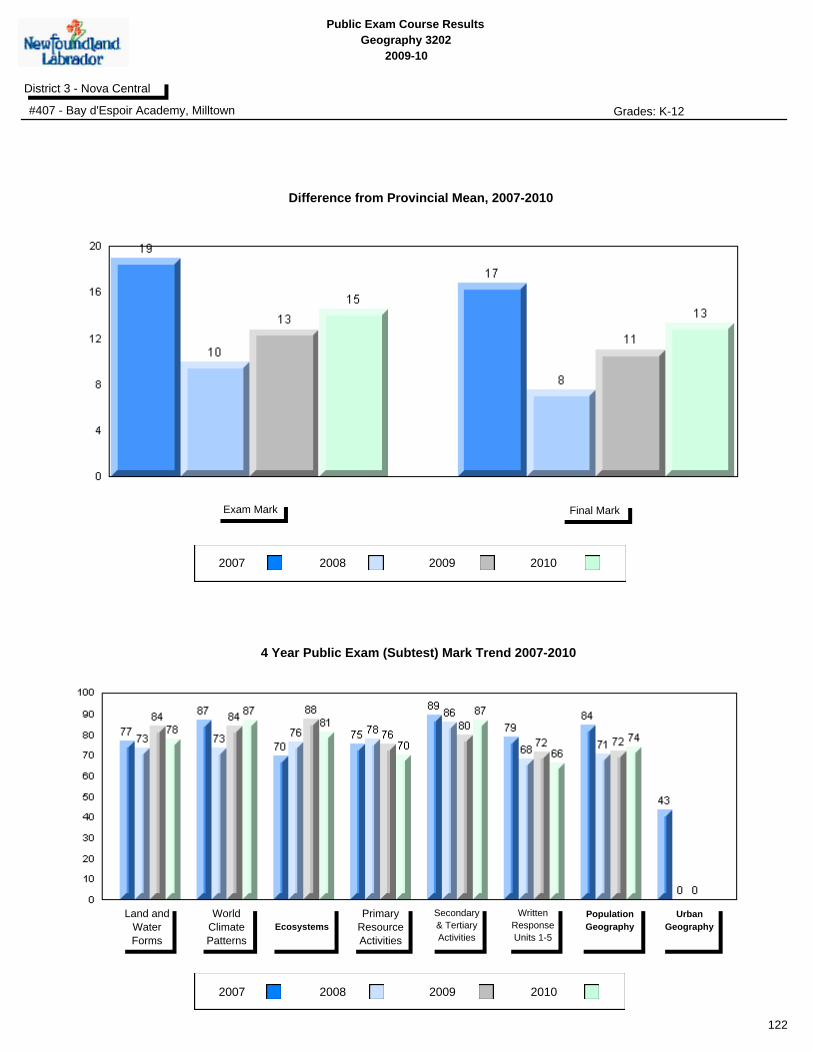
Public Exam Course Results
Geography 3202
2009-10
District 3 - Nova Central
#407 - Bay d'Espoir Academy, Milltown Grades: K-12
2007 2008 2009
2007 2008 2009
Final MarkExam Mark
Land and
Water
Forms
World
Climate
Patterns
Ecosystems
Primary
Resource
Activities
Secondary
& Tertiary
Activities
Written
Response
Units 1-5
Population
Geography
Urban
Geography
4 Year Public Exam (Subtest) Mark Trend 2007-2010
Difference from Provincial Mean, 2007-2010
2010
2010
122

Public Exam Course Results
Geography 3202
2009-10
District 3 - Nova Central
#413 - Holy Cross School Complex, Eastport Grades: K-12
2007 2008 2009
Final MarkExam Mark
School
vs
Province
School
vs
District
Final
Mark
p p 66.9
64.6
65.3
Number of Students
School
District
Province
School
District
Province
World
Climate
Patterns
School
DistrictEcosystems
Land and
Water Forms
Province
Subtest
School
vs
Province
School
vs
District
Public
Exam
Mark
School
District
Province
p p
q
p
p
p
p
p
63.2
13
58.8
60.3
World Geography 3202
School
District
Province
School
District
Province
Secondary &
Tertiary Activities
School
District
Written response
Units 1-5
Primary
Resource
Activities
Province
q
p
p
p
p
q
Population
Geography
School
District
Province
p p
Urban
Geography
School
District
Province
Multiple Choice
Long Answer
pp
65.0
70.9
82.7
66.9
64.6
55.0
63.1
77.3
69.5
69.3
74.1
59.5
66.6
53.4
61.1
62.4
59.0
59.0
50.4
66.0
59.4
73.2
69.5
69.3
Average Mark, 2007-2010
2010
123
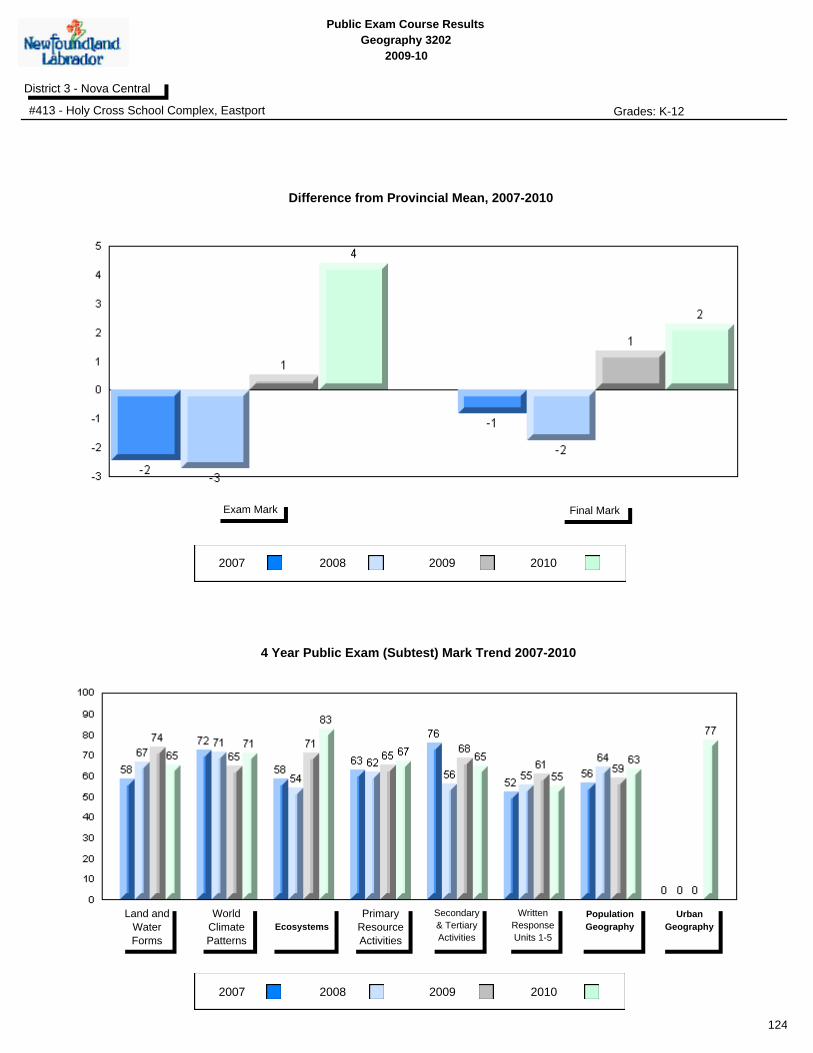
Public Exam Course Results
Geography 3202
2009-10
District 3 - Nova Central
#413 - Holy Cross School Complex, Eastport Grades: K-12
2007 2008 2009
2007 2008 2009
Final MarkExam Mark
Land and
Water
Forms
World
Climate
Patterns
Ecosystems
Primary
Resource
Activities
Secondary
& Tertiary
Activities
Written
Response
Units 1-5
Population
Geography
Urban
Geography
4 Year Public Exam (Subtest) Mark Trend 2007-2010
Difference from Provincial Mean, 2007-2010
2010
2010
124

Public Exam Course Results
Geography 3202
2009-10
District 3 - Nova Central
#414 - Fogo Island Central Academy, Fogo Island Grades: K-12
2007 2008 2009
Final MarkExam Mark
School
vs
Province
School
vs
District
Final
Mark
p p 76.2
64.6
65.3
Number of Students
School
District
Province
School
District
Province
World
Climate
Patterns
School
DistrictEcosystems
Land and
Water Forms
Province
Subtest
School
vs
Province
School
vs
District
Public
Exam
Mark
School
District
Province
p p
p
p
p
p
p
p
73.1
18
58.8
60.3
World Geography 3202
School
District
Province
School
District
Province
Secondary &
Tertiary Activities
School
District
Written response
Units 1-5
Primary
Resource
Activities
Province
p
p
p
p
p
p
Population
Geography
School
District
Province
p p
Urban
Geography
School
District
Province
Multiple Choice
Long Answer
qppq
79.0
85.2
80.6
71.7
82.8
65.3
74.0
69.5
69.3
74.1
59.5
66.6
53.4
61.1
62.4
59.0
59.0
50.4
66.0
59.4
73.2
69.5
69.3
Average Mark, 2007-2010
2010
125
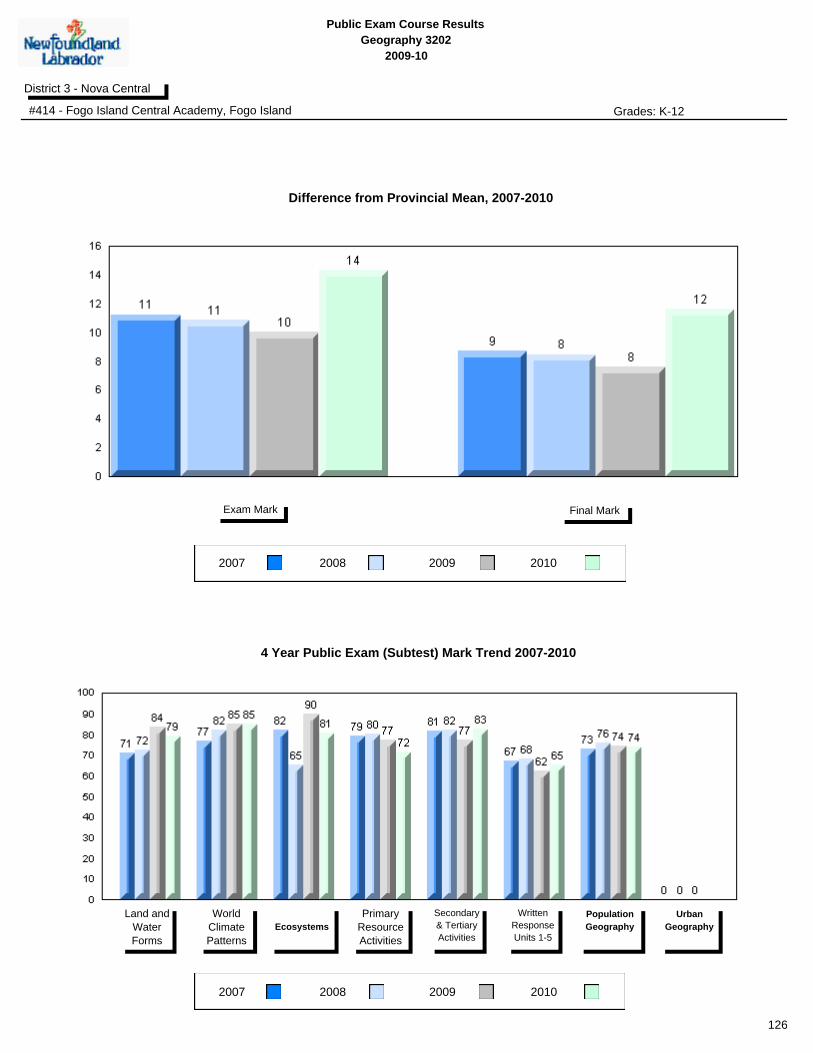
Public Exam Course Results
Geography 3202
2009-10
District 3 - Nova Central
#414 - Fogo Island Central Academy, Fogo Island Grades: K-12
2007 2008 2009
2007 2008 2009
Final MarkExam Mark
Land and
Water
Forms
World
Climate
Patterns
Ecosystems
Primary
Resource
Activities
Secondary
& Tertiary
Activities
Written
Response
Units 1-5
Population
Geography
Urban
Geography
4 Year Public Exam (Subtest) Mark Trend 2007-2010
Difference from Provincial Mean, 2007-2010
2010
2010
126

Public Exam Course Results
Geography 3202
2009-10
District 3 - Nova Central
#416 - Smallwood Academy, Gambo Grades: K-12
2007 2008 2009
Final MarkExam Mark
School
vs
Province
School
vs
District
Final
Mark
p p 70.3
64.6
65.3
Number of Students
School
District
Province
School
District
Province
World
Climate
Patterns
School
DistrictEcosystems
Land and
Water Forms
Province
Subtest
School
vs
Province
School
vs
District
Public
Exam
Mark
School
District
Province
p p
q
p
p
p
p
q
65.6
19
58.8
60.3
World Geography 3202
School
District
Province
School
District
Province
Secondary &
Tertiary Activities
School
District
Written response
Units 1-5
Primary
Resource
Activities
Province
p
p
p
p
p
p
Population
Geography
School
District
Province
p p
Urban
Geography
School
District
Province
Multiple Choice
Long Answer
qppq
76.0
74.9
69.7
66.8
74.2
56.0
69.9
69.5
69.3
74.1
59.5
66.6
53.4
61.1
62.4
59.0
59.0
50.4
66.0
59.4
73.2
69.5
69.3
Average Mark, 2007-2010
2010
127
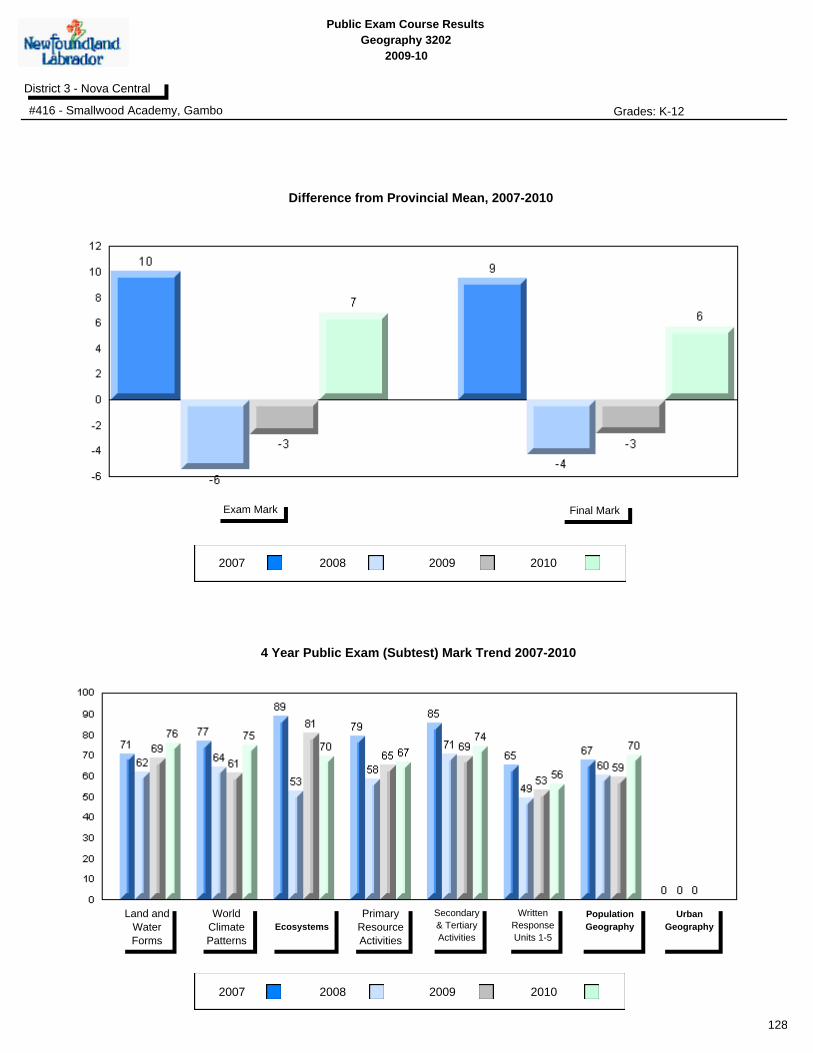
Public Exam Course Results
Geography 3202
2009-10
District 3 - Nova Central
#416 - Smallwood Academy, Gambo Grades: K-12
2007 2008 2009
2007 2008 2009
Final MarkExam Mark
Land and
Water
Forms
World
Climate
Patterns
Ecosystems
Primary
Resource
Activities
Secondary
& Tertiary
Activities
Written
Response
Units 1-5
Population
Geography
Urban
Geography
4 Year Public Exam (Subtest) Mark Trend 2007-2010
Difference from Provincial Mean, 2007-2010
2010
2010
128

Public Exam Course Results
Geography 3202
2009-10
District 3 - Nova Central
#418 - Gander Collegiate, Gander Grades: 10-12
2007 2008 2009
Final MarkExam Mark
School
vs
Province
School
vs
District
Final
Mark
q q 58.3
64.6
65.3
Number of Students
School
District
Province
School
District
Province
World
Climate
Patterns
School
DistrictEcosystems
Land and
Water Forms
Province
Subtest
School
vs
Province
School
vs
District
Public
Exam
Mark
School
District
Province
q q
q
q
q
p
q
q
52.2
36
58.8
60.3
World Geography 3202
School
District
Province
School
District
Province
Secondary &
Tertiary Activities
School
District
Written response
Units 1-5
Primary
Resource
Activities
Province
q
q
q
q
q
q
Population
Geography
School
District
Province
q q
Urban
Geography
School
District
Province
Multiple Choice
Long Answer
65.4
55.3
61.8
53.1
53.9
46.0
52.5
50.0
69.5
69.3
74.1
59.5
66.6
53.4
61.1
62.4
59.0
59.0
50.4
66.0
59.4
73.2
69.5
69.3
Average Mark, 2007-2010
2010
129
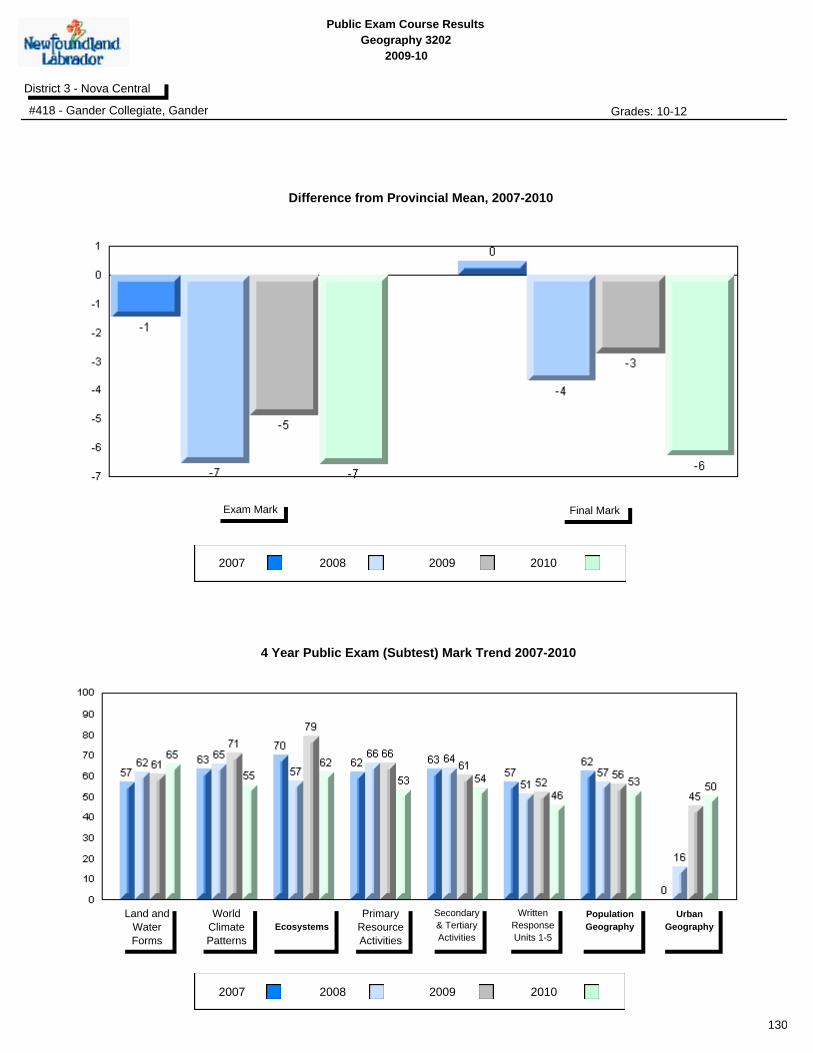
Public Exam Course Results
Geography 3202
2009-10
District 3 - Nova Central
#418 - Gander Collegiate, Gander Grades: 10-12
2007 2008 2009
2007 2008 2009
Final MarkExam Mark
Land and
Water
Forms
World
Climate
Patterns
Ecosystems
Primary
Resource
Activities
Secondary
& Tertiary
Activities
Written
Response
Units 1-5
Population
Geography
Urban
Geography
4 Year Public Exam (Subtest) Mark Trend 2007-2010
Difference from Provincial Mean, 2007-2010
2010
2010
130

Public Exam Course Results
Geography 3202
2009-10
District 3 - Nova Central
#422 - Glovertown Academy, Glovertown Grades: K-12
2007 2008 2009
Final MarkExam Mark
School
vs
Province
School
vs
District
Final
Mark
q q 63.5
64.6
65.3
Number of Students
School
District
Province
School
District
Province
World
Climate
Patterns
School
DistrictEcosystems
Land and
Water Forms
Province
Subtest
School
vs
Province
School
vs
District
Public
Exam
Mark
School
District
Province
q p
q
q
q
p
q
q
59.9
22
58.8
60.3
World Geography 3202
School
District
Province
School
District
Province
Secondary &
Tertiary Activities
School
District
Written response
Units 1-5
Primary
Resource
Activities
Province
q
q
p p
q
q
Population
Geography
School
District
Province
p p
Urban
Geography
School
District
Province
Multiple Choice
Long Answer
qppq
65.7
62.1
68.2
58.2
59.1
55.0
63.1
69.5
69.3
74.1
59.5
66.6
53.4
61.1
62.4
59.0
59.0
50.4
66.0
59.4
73.2
69.5
69.3
Average Mark, 2007-2010
2010
131
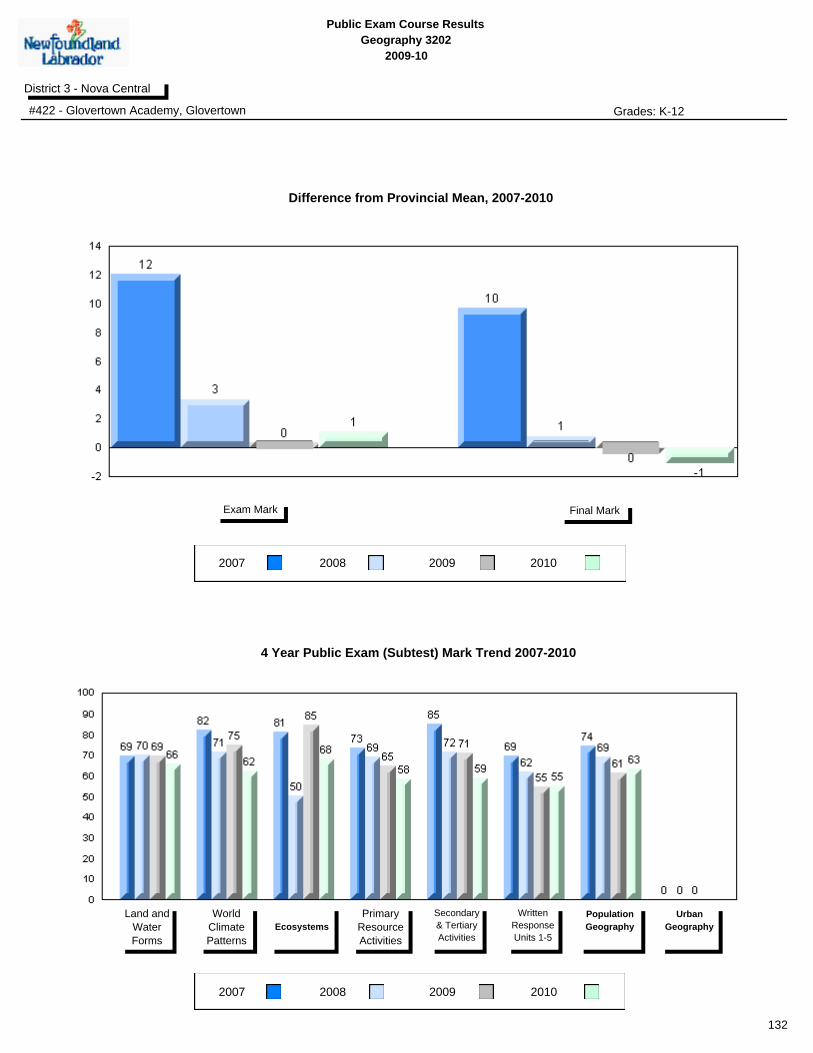
Public Exam Course Results
Geography 3202
2009-10
District 3 - Nova Central
#422 - Glovertown Academy, Glovertown Grades: K-12
2007 2008 2009
2007 2008 2009
Final MarkExam Mark
Land and
Water
Forms
World
Climate
Patterns
Ecosystems
Primary
Resource
Activities
Secondary
& Tertiary
Activities
Written
Response
Units 1-5
Population
Geography
Urban
Geography
4 Year Public Exam (Subtest) Mark Trend 2007-2010
Difference from Provincial Mean, 2007-2010
2010
2010
132

Public Exam Course Results
Geography 3202
2009-10
District 3 - Nova Central
#478 - New World Island Academy, Summerford Grades: K-12
2007 2008 2009
Final MarkExam Mark
School
vs
Province
School
vs
District
Final
Mark
q p 64.7
64.6
65.3
Number of Students
School
District
Province
School
District
Province
World
Climate
Patterns
School
DistrictEcosystems
Land and
Water Forms
Province
Subtest
School
vs
Province
School
vs
District
Public
Exam
Mark
School
District
Province
q p
q
q
q
p
q
q
59.9
32
58.8
60.3
World Geography 3202
School
District
Province
School
District
Province
Secondary &
Tertiary Activities
School
District
Written response
Units 1-5
Primary
Resource
Activities
Province
q
p
p
p
p
p
Population
Geography
School
District
Province
p p
Urban
Geography
School
District
Province
Multiple Choice
Long Answer
qppq
65.6
60.1
71.9
62.5
66.3
53.4
63.9
69.5
69.3
74.1
59.5
66.6
53.4
61.1
62.4
59.0
59.0
50.4
66.0
59.4
73.2
69.5
69.3
Average Mark, 2007-2010
2010
133
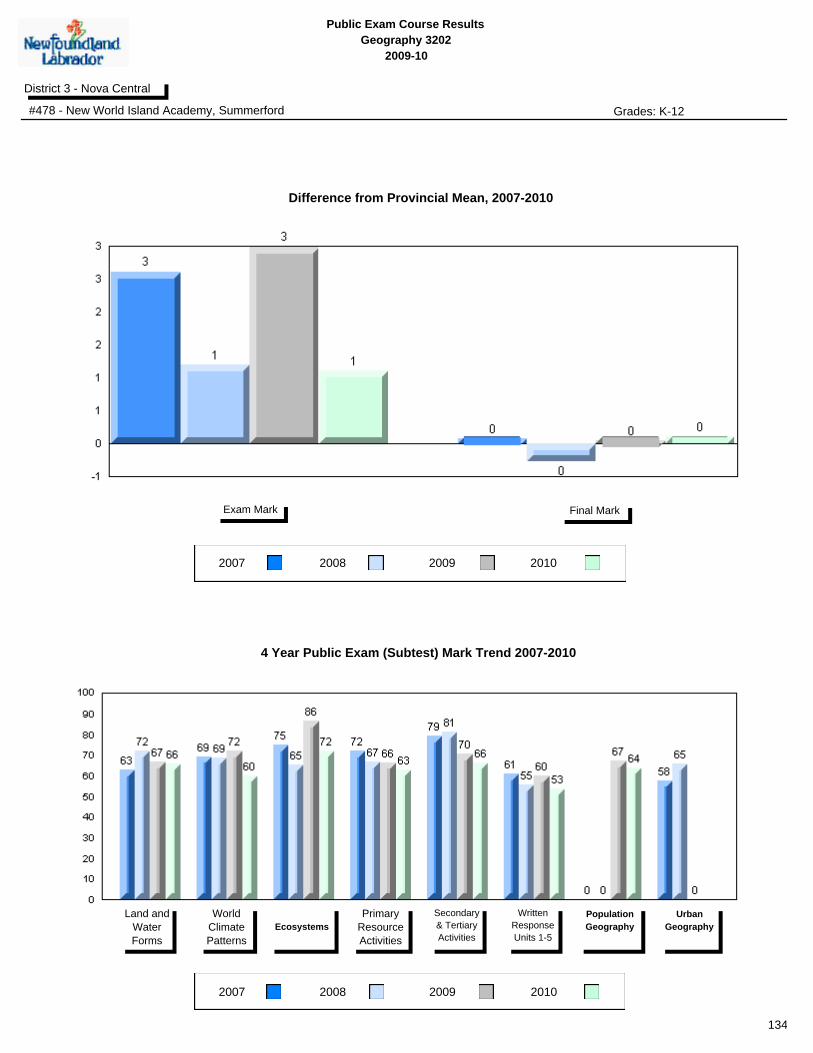
Public Exam Course Results
Geography 3202
2009-10
District 3 - Nova Central
#478 - New World Island Academy, Summerford Grades: K-12
2007 2008 2009
2007 2008 2009
Final MarkExam Mark
Land and
Water
Forms
World
Climate
Patterns
Ecosystems
Primary
Resource
Activities
Secondary
& Tertiary
Activities
Written
Response
Units 1-5
Population
Geography
Urban
Geography
4 Year Public Exam (Subtest) Mark Trend 2007-2010
Difference from Provincial Mean, 2007-2010
2010
2010
134

Public Exam Course Results
Geography 3202
2009-10
District 3 - Nova Central
#480 - Exploits Valley High, Grand Falls-Windsor Grades: 10-12
2007 2008 2009
Final MarkExam Mark
School
vs
Province
School
vs
District
Final
Mark
q q 61.2
64.6
65.3
Number of Students
School
District
Province
School
District
Province
World
Climate
Patterns
School
DistrictEcosystems
Land and
Water Forms
Province
Subtest
School
vs
Province
School
vs
District
Public
Exam
Mark
School
District
Province
q q
q
p
p
p
p
q
55.1
61
58.8
60.3
World Geography 3202
School
District
Province
School
District
Province
Secondary &
Tertiary Activities
School
District
Written response
Units 1-5
Primary
Resource
Activities
Province
q
q
q
q
q
q
Population
Geography
School
District
Province
q q
Urban
Geography
School
District
Province
Multiple Choice
Long Answer
67.6
69.4
74.6
57.7
62.0
46.3
52.9
34.1
69.5
69.3
74.1
59.5
66.6
53.4
61.1
62.4
59.0
59.0
50.4
66.0
59.4
73.2
69.5
69.3
Average Mark, 2007-2010
2010
135
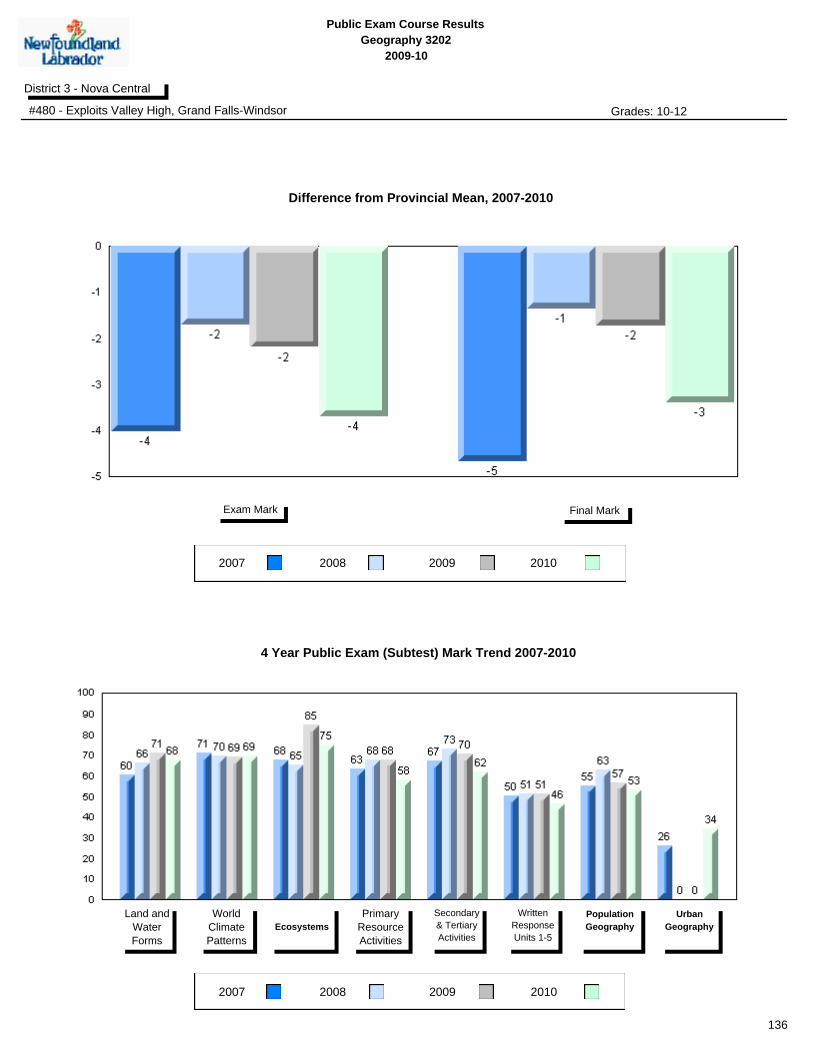
Public Exam Course Results
Geography 3202
2009-10
District 3 - Nova Central
#480 - Exploits Valley High, Grand Falls-Windsor Grades: 10-12
2007 2008 2009
2007 2008 2009
Final MarkExam Mark
Land and
Water
Forms
World
Climate
Patterns
Ecosystems
Primary
Resource
Activities
Secondary
& Tertiary
Activities
Written
Response
Units 1-5
Population
Geography
Urban
Geography
4 Year Public Exam (Subtest) Mark Trend 2007-2010
Difference from Provincial Mean, 2007-2010
2010
2010
136
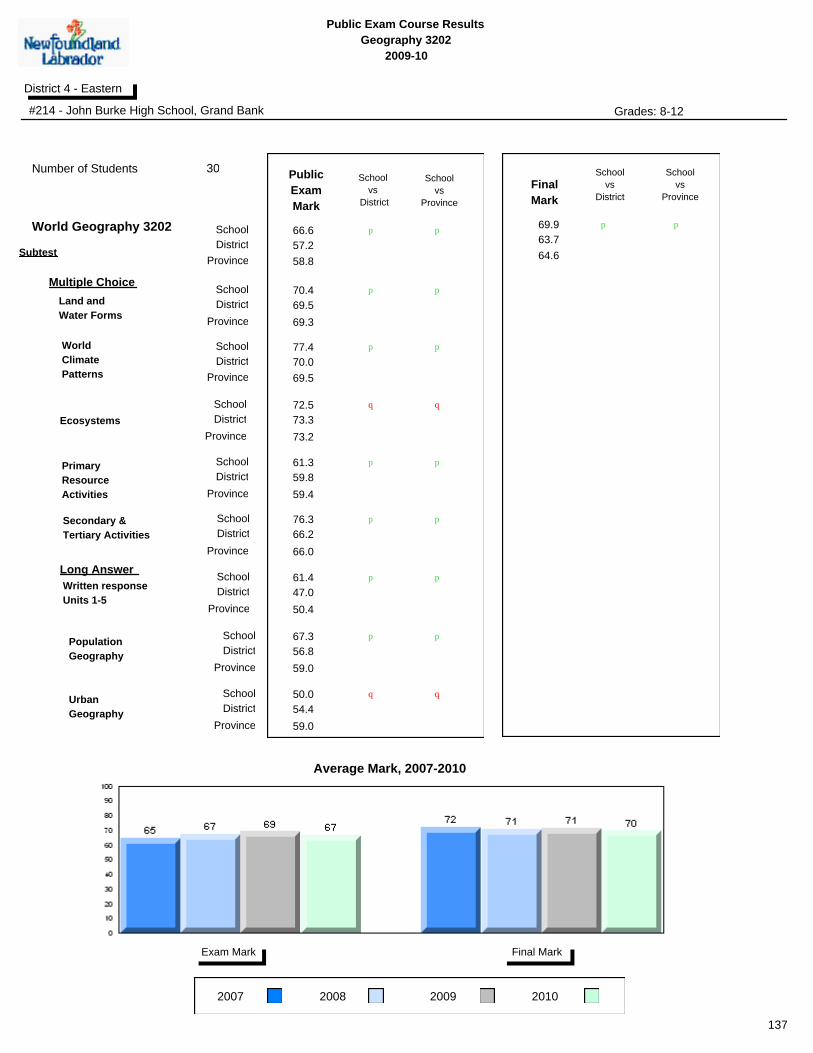
Public Exam Course Results
Geography 3202
2009-10
District 4 - Eastern
#214 - John Burke High School, Grand Bank Grades: 8-12
2007 2008 2009
Final MarkExam Mark
School
vs
Province
School
vs
District
Final
Mark
p p 69.9
64.6
63.7
Number of Students
School
District
Province
School
District
Province
World
Climate
Patterns
School
DistrictEcosystems
Land and
Water Forms
Province
Subtest
School
vs
Province
School
vs
District
Public
Exam
Mark
School
District
Province
p p
q
p
p
p
p
q
66.6
30
58.8
57.2
World Geography 3202
School
District
Province
School
District
Province
Secondary &
Tertiary Activities
School
District
Written response
Units 1-5
Primary
Resource
Activities
Province
p
p
p
p
p
p
Population
Geography
School
District
Province
p p
Urban
Geography
School
District
Province
Multiple Choice
Long Answer
70.4
77.4
72.5
61.3
76.3
61.4
67.3
50.0
69.5
70.0
73.3
59.8
66.2
47.0
56.8
54.4
59.0
59.0
50.4
66.0
59.4
73.2
69.5
69.3
Average Mark, 2007-2010
2010
137
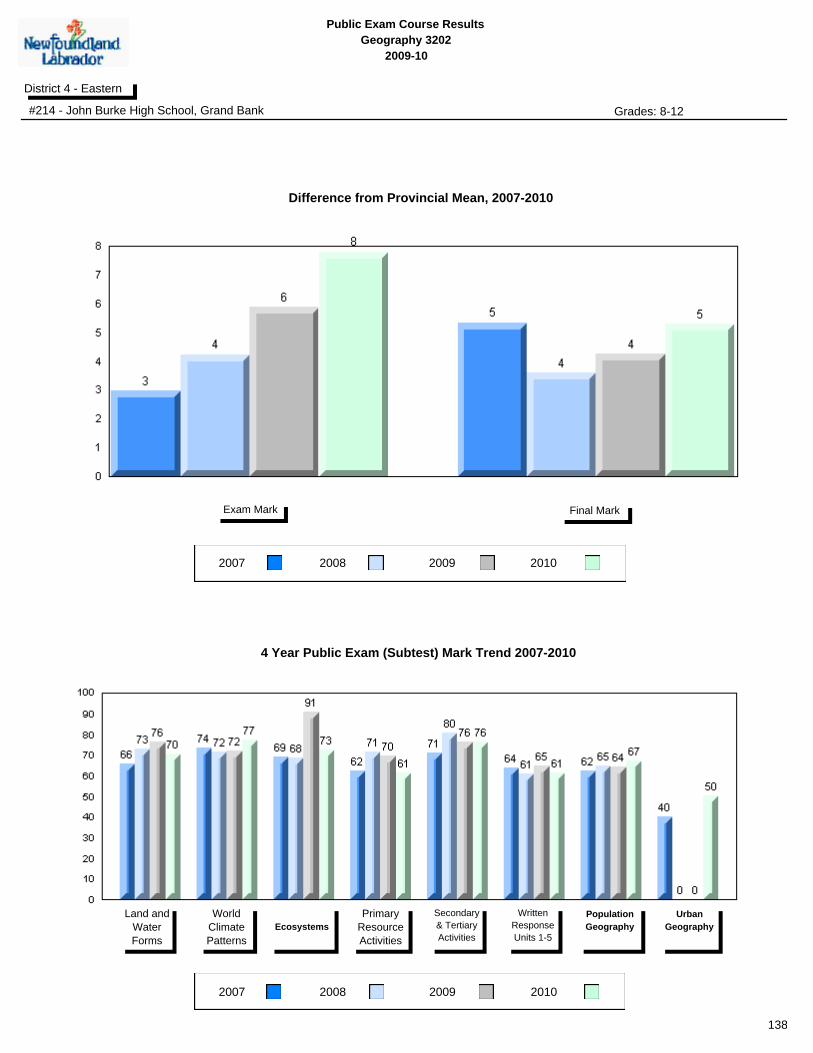
Public Exam Course Results
Geography 3202
2009-10
District 4 - Eastern
#214 - John Burke High School, Grand Bank Grades: 8-12
2007 2008 2009
2007 2008 2009
Final MarkExam Mark
Land and
Water
Forms
World
Climate
Patterns
Ecosystems
Primary
Resource
Activities
Secondary
& Tertiary
Activities
Written
Response
Units 1-5
Population
Geography
Urban
Geography
4 Year Public Exam (Subtest) Mark Trend 2007-2010
Difference from Provincial Mean, 2007-2010
2010
2010
138

Public Exam Course Results
Geography 3202
2009-10
District 4 - Eastern
#218 - St. Joseph's Academy, Lamaline Grades: K-12
2007 2008 2009
Final MarkExam Mark
School
vs
Province
School
vs
District
Final
Mark
p p 67.2
64.6
63.7
Number of Students
School
District
Province
School
District
Province
World
Climate
Patterns
School
DistrictEcosystems
Land and
Water Forms
Province
Subtest
School
vs
Province
School
vs
District
Public
Exam
Mark
School
District
Province
p p
p
p
p
p
p
p
64.2
10
58.8
57.2
World Geography 3202
School
District
Province
School
District
Province
Secondary &
Tertiary Activities
School
District
Written response
Units 1-5
Primary
Resource
Activities
Province
p
p
p
p
p
p
Population
Geography
School
District
Province
p p
Urban
Geography
School
District
Province
Multiple Choice
Long Answer
qppq
70.0
72.2
77.5
73.0
82.0
52.8
64.7
69.5
70.0
73.3
59.8
66.2
47.0
56.8
54.4
59.0
59.0
50.4
66.0
59.4
73.2
69.5
69.3
Average Mark, 2007-2010
2010
139
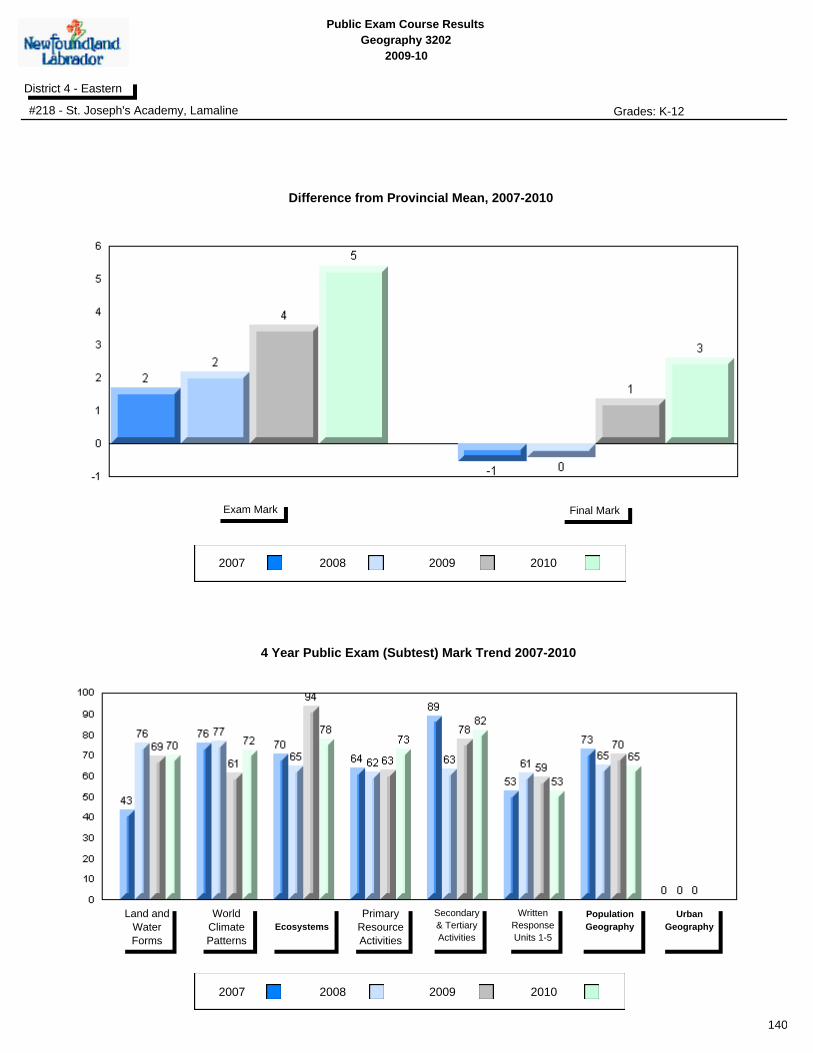
Public Exam Course Results
Geography 3202
2009-10
District 4 - Eastern
#218 - St. Joseph's Academy, Lamaline Grades: K-12
2007 2008 2009
2007 2008 2009
Final MarkExam Mark
Land and
Water
Forms
World
Climate
Patterns
Ecosystems
Primary
Resource
Activities
Secondary
& Tertiary
Activities
Written
Response
Units 1-5
Population
Geography
Urban
Geography
4 Year Public Exam (Subtest) Mark Trend 2007-2010
Difference from Provincial Mean, 2007-2010
2010
2010
140
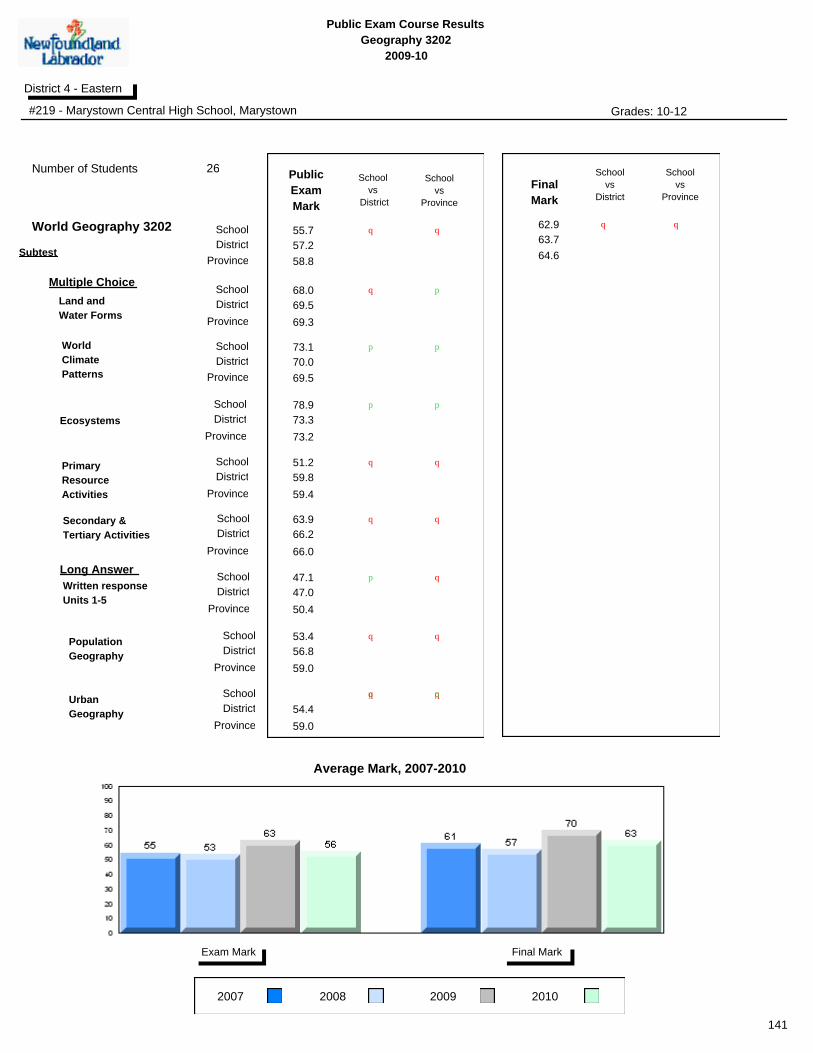
Public Exam Course Results
Geography 3202
2009-10
District 4 - Eastern
#219 - Marystown Central High School, Marystown Grades: 10-12
2007 2008 2009
Final MarkExam Mark
School
vs
Province
School
vs
District
Final
Mark
q q 62.9
64.6
63.7
Number of Students
School
District
Province
School
District
Province
World
Climate
Patterns
School
DistrictEcosystems
Land and
Water Forms
Province
Subtest
School
vs
Province
School
vs
District
Public
Exam
Mark
School
District
Province
q q
q
p
p
p
p
p
55.7
26
58.8
57.2
World Geography 3202
School
District
Province
School
District
Province
Secondary &
Tertiary Activities
School
District
Written response
Units 1-5
Primary
Resource
Activities
Province
q
q
p
q
q
q
Population
Geography
School
District
Province
q q
Urban
Geography
School
District
Province
Multiple Choice
Long Answer
qppq
68.0
73.1
78.9
51.2
63.9
47.1
53.4
69.5
70.0
73.3
59.8
66.2
47.0
56.8
54.4
59.0
59.0
50.4
66.0
59.4
73.2
69.5
69.3
Average Mark, 2007-2010
2010
141
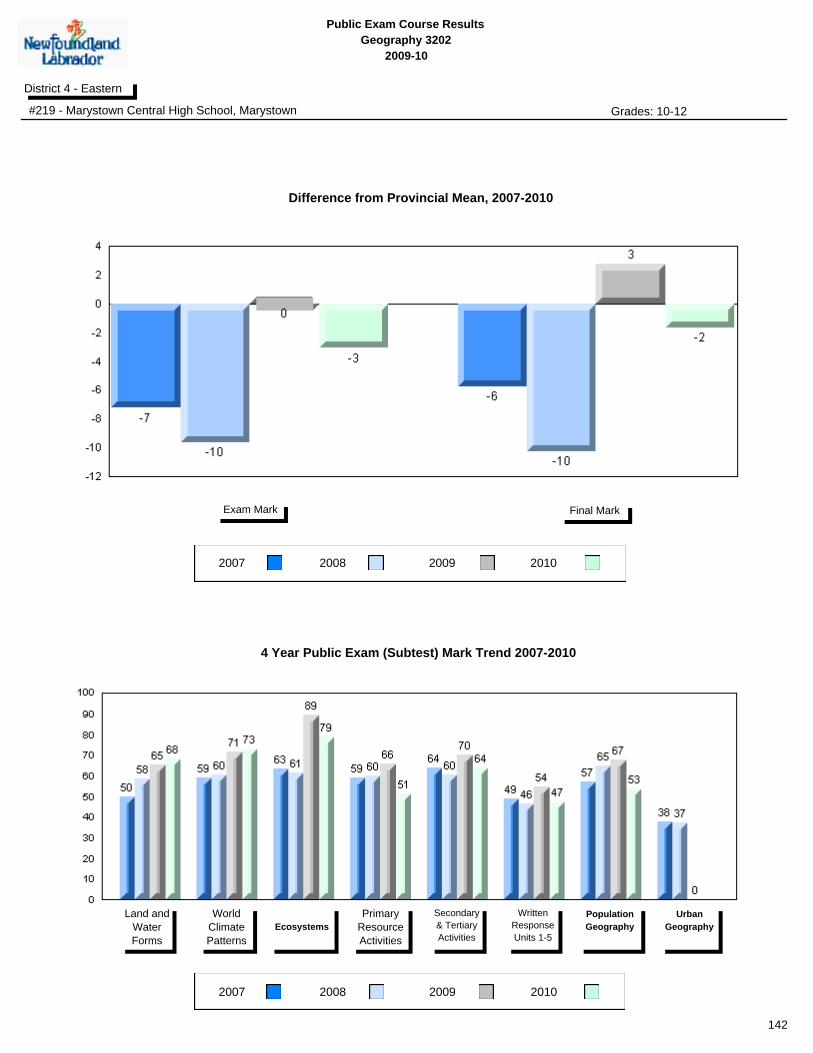
Public Exam Course Results
Geography 3202
2009-10
District 4 - Eastern
#219 - Marystown Central High School, Marystown Grades: 10-12
2007 2008 2009
2007 2008 2009
Final MarkExam Mark
Land and
Water
Forms
World
Climate
Patterns
Ecosystems
Primary
Resource
Activities
Secondary
& Tertiary
Activities
Written
Response
Units 1-5
Population
Geography
Urban
Geography
4 Year Public Exam (Subtest) Mark Trend 2007-2010
Difference from Provincial Mean, 2007-2010
2010
2010
142

Public Exam Course Results
Geography 3202
2009-10
District 4 - Eastern
#223 - Christ the King School, Rushoon Grades: K-12
2007 2008 2009
Final MarkExam Mark
School
vs
Province
School
vs
District
Final
Mark
p p 84.0
64.6
63.7
Number of Students
School
District
Province
School
District
Province
World
Climate
Patterns
School
DistrictEcosystems
Land and
Water Forms
Province
Subtest
School
vs
Province
School
vs
District
Public
Exam
Mark
School
District
Province
p p
p
p
p
p
p
p
79.0
1
58.8
57.2
World Geography 3202
School
District
Province
School
District
Province
Secondary &
Tertiary Activities
School
District
Written response
Units 1-5
Primary
Resource
Activities
Province
p
p
p
p
p
p
Population
Geography
School
District
Province
p p
Urban
Geography
School
District
Province
Multiple Choice
Long Answer
qppq
88.9
88.9
100.0
70.0
80.0
77.8
68.2
69.5
70.0
73.3
59.8
66.2
47.0
56.8
54.4
59.0
59.0
50.4
66.0
59.4
73.2
69.5
69.3
Average Mark, 2007-2010
2010
School data with 5 or fewer
students withheld for reasons of
confidentiality.
School data with 5 or fewer
students withheld for reasons of
confidentiality.
School data with 5 or fewer students withheld for reasons of confidentiality.
143

Public Exam Course Results
Geography 3202
2009-10
District 4 - Eastern
#223 - Christ the King School, Rushoon Grades: K-12
2007 2008 2009
2007 2008 2009
Final MarkExam Mark
Land and
Water
Forms
World
Climate
Patterns
Ecosystems
Primary
Resource
Activities
Secondary
& Tertiary
Activities
Written
Response
Units 1-5
Population
Geography
Urban
Geography
4 Year Public Exam (Subtest) Mark Trend 2007-2010
Difference from Provincial Mean, 2007-2010
2010
2010
School data with 5 or fewer students withheld for reasons of confidentiality.
School data with 5 or fewer students withheld for reasons of confidentiality.
144
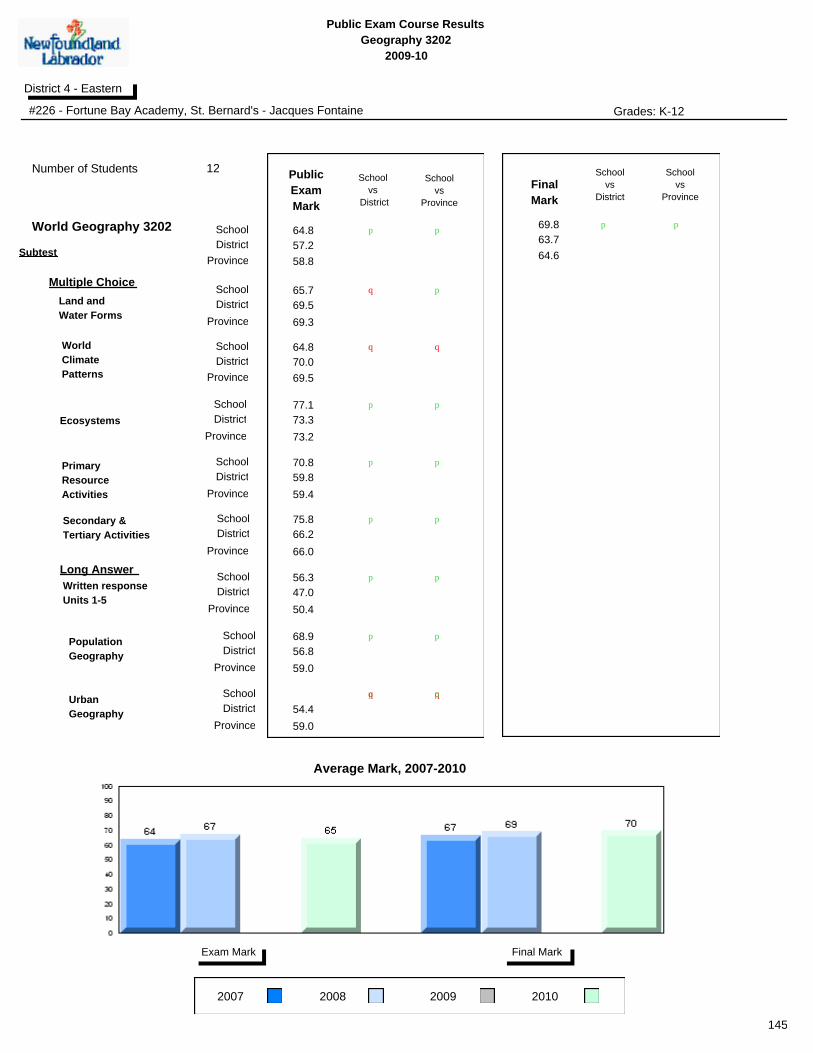
Public Exam Course Results
Geography 3202
2009-10
District 4 - Eastern
#226 - Fortune Bay Academy, St. Bernard's - Jacques Fontaine Grades: K-12
2007 2008 2009
Final MarkExam Mark
School
vs
Province
School
vs
District
Final
Mark
p p 69.8
64.6
63.7
Number of Students
School
District
Province
School
District
Province
World
Climate
Patterns
School
DistrictEcosystems
Land and
Water Forms
Province
Subtest
School
vs
Province
School
vs
District
Public
Exam
Mark
School
District
Province
p p
q
q
p
p
p
q
64.8
12
58.8
57.2
World Geography 3202
School
District
Province
School
District
Province
Secondary &
Tertiary Activities
School
District
Written response
Units 1-5
Primary
Resource
Activities
Province
p
p
p
p
p
p
Population
Geography
School
District
Province
p p
Urban
Geography
School
District
Province
Multiple Choice
Long Answer
qppq
65.7
64.8
77.1
70.8
75.8
56.3
68.9
69.5
70.0
73.3
59.8
66.2
47.0
56.8
54.4
59.0
59.0
50.4
66.0
59.4
73.2
69.5
69.3
Average Mark, 2007-2010
2010
145
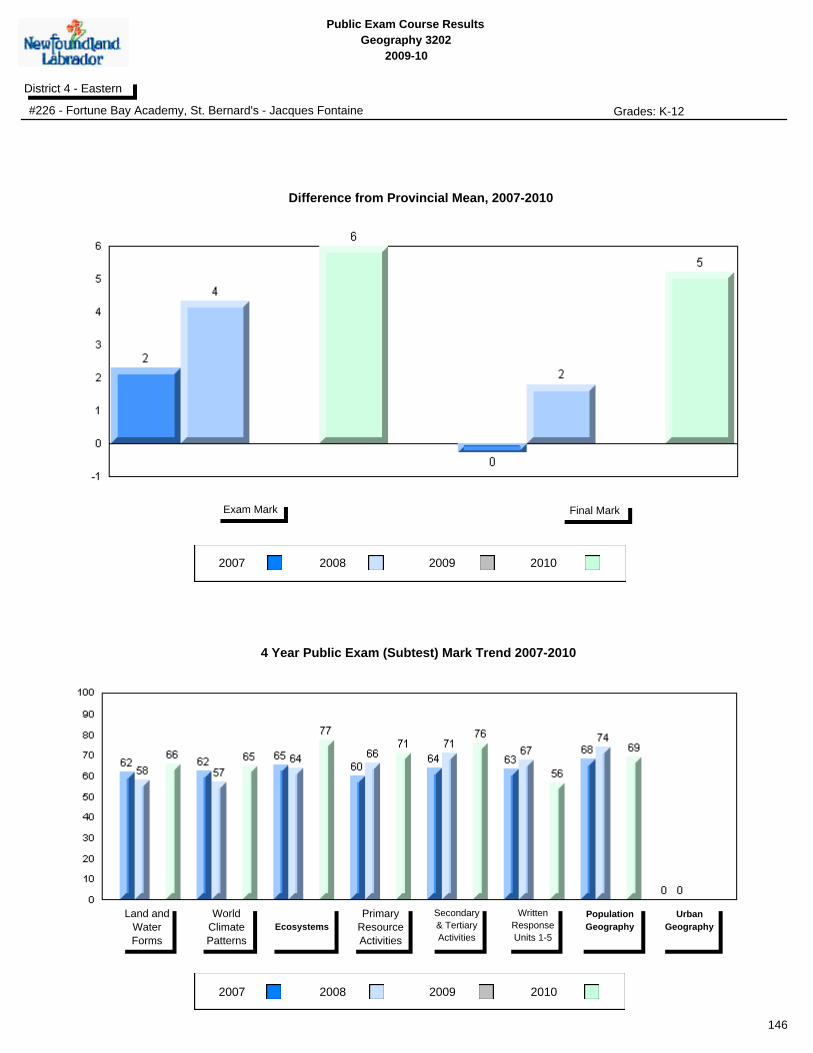
Public Exam Course Results
Geography 3202
2009-10
District 4 - Eastern
#226 - Fortune Bay Academy, St. Bernard's - Jacques Fontaine Grades: K-12
2007 2008 2009
2007 2008 2009
Final MarkExam Mark
Land and
Water
Forms
World
Climate
Patterns
Ecosystems
Primary
Resource
Activities
Secondary
& Tertiary
Activities
Written
Response
Units 1-5
Population
Geography
Urban
Geography
4 Year Public Exam (Subtest) Mark Trend 2007-2010
Difference from Provincial Mean, 2007-2010
2010
2010
146

Public Exam Course Results
Geography 3202
2009-10
District 4 - Eastern
#228 - St. Lawrence Academy, St. Lawrence Grades: K-12
2007 2008 2009
Final MarkExam Mark
School
vs
Province
School
vs
District
Final
Mark
p p 67.2
64.6
63.7
Number of Students
School
District
Province
School
District
Province
World
Climate
Patterns
School
DistrictEcosystems
Land and
Water Forms
Province
Subtest
School
vs
Province
School
vs
District
Public
Exam
Mark
School
District
Province
p p
q
q
q
p
q
q
62.8
20
58.8
57.2
World Geography 3202
School
District
Province
School
District
Province
Secondary &
Tertiary Activities
School
District
Written response
Units 1-5
Primary
Resource
Activities
Province
q
p
p
p
p
q
Population
Geography
School
District
Province
p p
Urban
Geography
School
District
Province
Multiple Choice
Long Answer
qppq
69.4
68.9
70.0
56.5
68.0
53.6
67.3
69.5
70.0
73.3
59.8
66.2
47.0
56.8
54.4
59.0
59.0
50.4
66.0
59.4
73.2
69.5
69.3
Average Mark, 2007-2010
2010
147
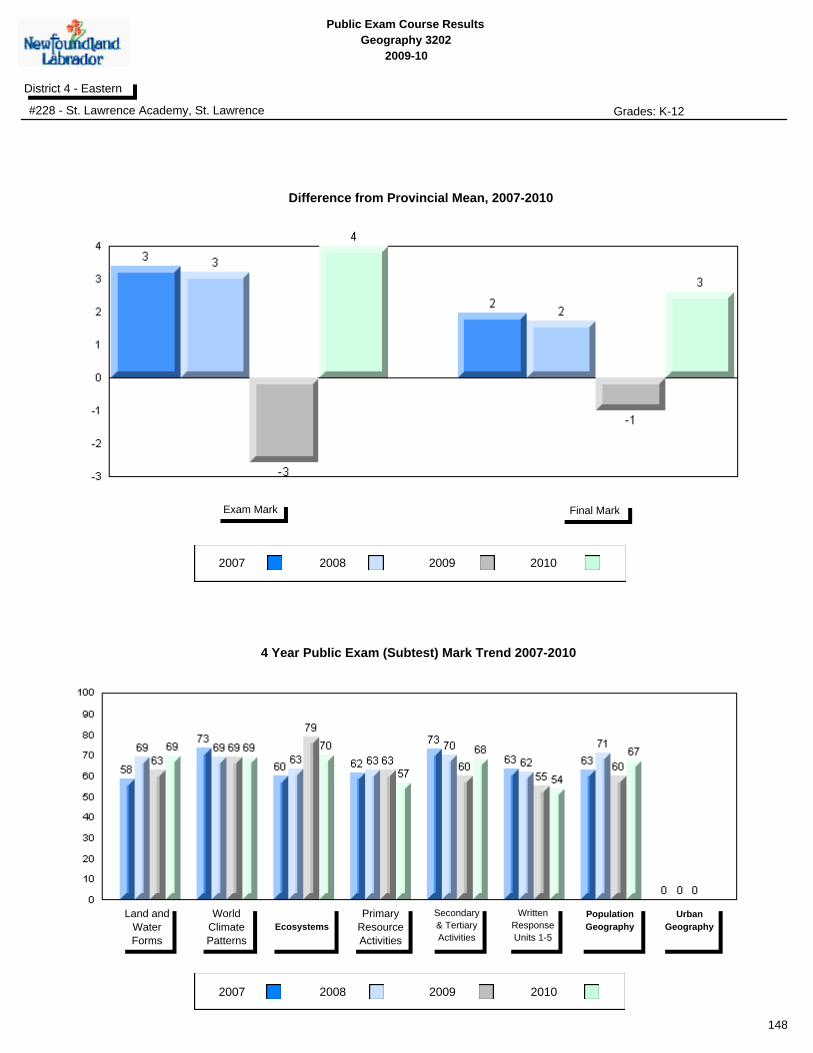
Public Exam Course Results
Geography 3202
2009-10
District 4 - Eastern
#228 - St. Lawrence Academy, St. Lawrence Grades: K-12
2007 2008 2009
2007 2008 2009
Final MarkExam Mark
Land and
Water
Forms
World
Climate
Patterns
Ecosystems
Primary
Resource
Activities
Secondary
& Tertiary
Activities
Written
Response
Units 1-5
Population
Geography
Urban
Geography
4 Year Public Exam (Subtest) Mark Trend 2007-2010
Difference from Provincial Mean, 2007-2010
2010
2010
148

Public Exam Course Results
Geography 3202
2009-10
District 4 - Eastern
#229 - St. Joseph's All Grade, Terrenceville Grades: K-12
2007 2008 2009
Final MarkExam Mark
School
vs
Province
School
vs
District
Final
Mark
p p 67.7
64.6
63.7
Number of Students
School
District
Province
School
District
Province
World
Climate
Patterns
School
DistrictEcosystems
Land and
Water Forms
Province
Subtest
School
vs
Province
School
vs
District
Public
Exam
Mark
School
District
Province
p p
q
p
p
p
p
q
61.8
18
58.8
57.2
World Geography 3202
School
District
Province
School
District
Province
Secondary &
Tertiary Activities
School
District
Written response
Units 1-5
Primary
Resource
Activities
Province
q
p
p
p
p
q
Population
Geography
School
District
Province
p p
Urban
Geography
School
District
Province
Multiple Choice
Long Answer
qppq
70.4
68.5
79.2
55.6
76.1
56.0
62.1
69.5
70.0
73.3
59.8
66.2
47.0
56.8
54.4
59.0
59.0
50.4
66.0
59.4
73.2
69.5
69.3
Average Mark, 2007-2010
2010
149
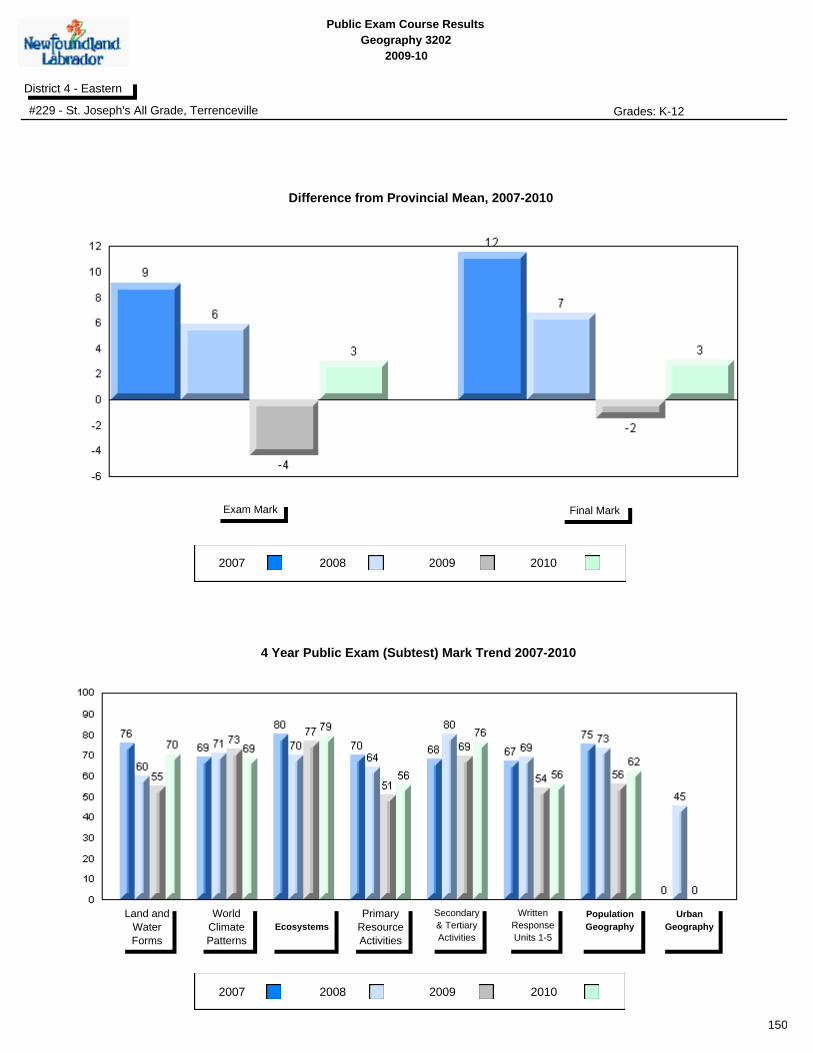
Public Exam Course Results
Geography 3202
2009-10
District 4 - Eastern
#229 - St. Joseph's All Grade, Terrenceville Grades: K-12
2007 2008 2009
2007 2008 2009
Final MarkExam Mark
Land and
Water
Forms
World
Climate
Patterns
Ecosystems
Primary
Resource
Activities
Secondary
& Tertiary
Activities
Written
Response
Units 1-5
Population
Geography
Urban
Geography
4 Year Public Exam (Subtest) Mark Trend 2007-2010
Difference from Provincial Mean, 2007-2010
2010
2010
150
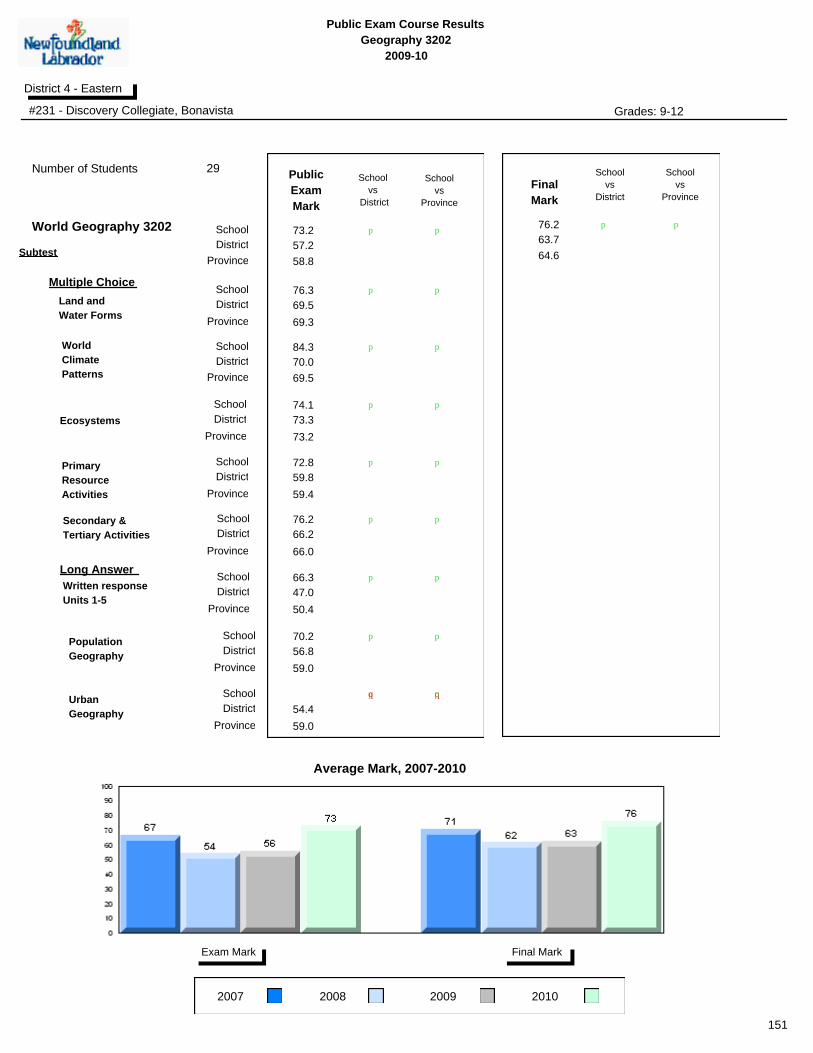
Public Exam Course Results
Geography 3202
2009-10
District 4 - Eastern
#231 - Discovery Collegiate, Bonavista Grades: 9-12
2007 2008 2009
Final MarkExam Mark
School
vs
Province
School
vs
District
Final
Mark
p p 76.2
64.6
63.7
Number of Students
School
District
Province
School
District
Province
World
Climate
Patterns
School
DistrictEcosystems
Land and
Water Forms
Province
Subtest
School
vs
Province
School
vs
District
Public
Exam
Mark
School
District
Province
p p
p
p
p
p
p
p
73.2
29
58.8
57.2
World Geography 3202
School
District
Province
School
District
Province
Secondary &
Tertiary Activities
School
District
Written response
Units 1-5
Primary
Resource
Activities
Province
p
p
p
p
p
p
Population
Geography
School
District
Province
p p
Urban
Geography
School
District
Province
Multiple Choice
Long Answer
qppq
76.3
84.3
74.1
72.8
76.2
66.3
70.2
69.5
70.0
73.3
59.8
66.2
47.0
56.8
54.4
59.0
59.0
50.4
66.0
59.4
73.2
69.5
69.3
Average Mark, 2007-2010
2010
151
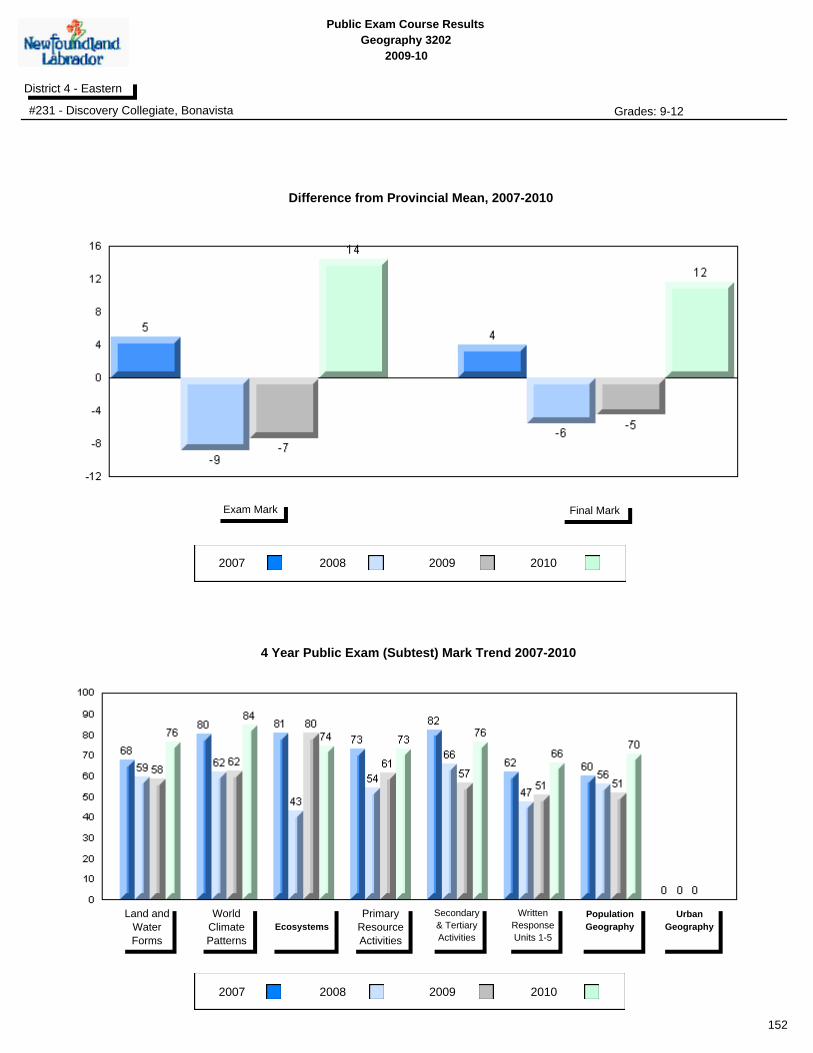
Public Exam Course Results
Geography 3202
2009-10
District 4 - Eastern
#231 - Discovery Collegiate, Bonavista Grades: 9-12
2007 2008 2009
2007 2008 2009
Final MarkExam Mark
Land and
Water
Forms
World
Climate
Patterns
Ecosystems
Primary
Resource
Activities
Secondary
& Tertiary
Activities
Written
Response
Units 1-5
Population
Geography
Urban
Geography
4 Year Public Exam (Subtest) Mark Trend 2007-2010
Difference from Provincial Mean, 2007-2010
2010
2010
152

Public Exam Course Results
Geography 3202
2009-10
District 4 - Eastern
#235 - Clarenville High School, Clarenville Grades: 9-12
2007 2008 2009
Final MarkExam Mark
School
vs
Province
School
vs
District
Final
Mark
p p 67.0
64.6
63.7
Number of Students
School
District
Province
School
District
Province
World
Climate
Patterns
School
DistrictEcosystems
Land and
Water Forms
Province
Subtest
School
vs
Province
School
vs
District
Public
Exam
Mark
School
District
Province
p p
p
p
p
p
p
p
61.2
45
58.8
57.2
World Geography 3202
School
District
Province
School
District
Province
Secondary &
Tertiary Activities
School
District
Written response
Units 1-5
Primary
Resource
Activities
Province
p
p
p
p
p
q
Population
Geography
School
District
Province
qp pq
Urban
Geography
School
District
Province
Multiple Choice
Long Answer
pp
77.5
73.3
77.8
64.4
74.9
49.6
60.0
69.5
70.0
73.3
59.8
66.2
47.0
56.8
54.4
59.0
59.0
50.4
66.0
59.4
73.2
69.5
69.3
Average Mark, 2007-2010
2010
153
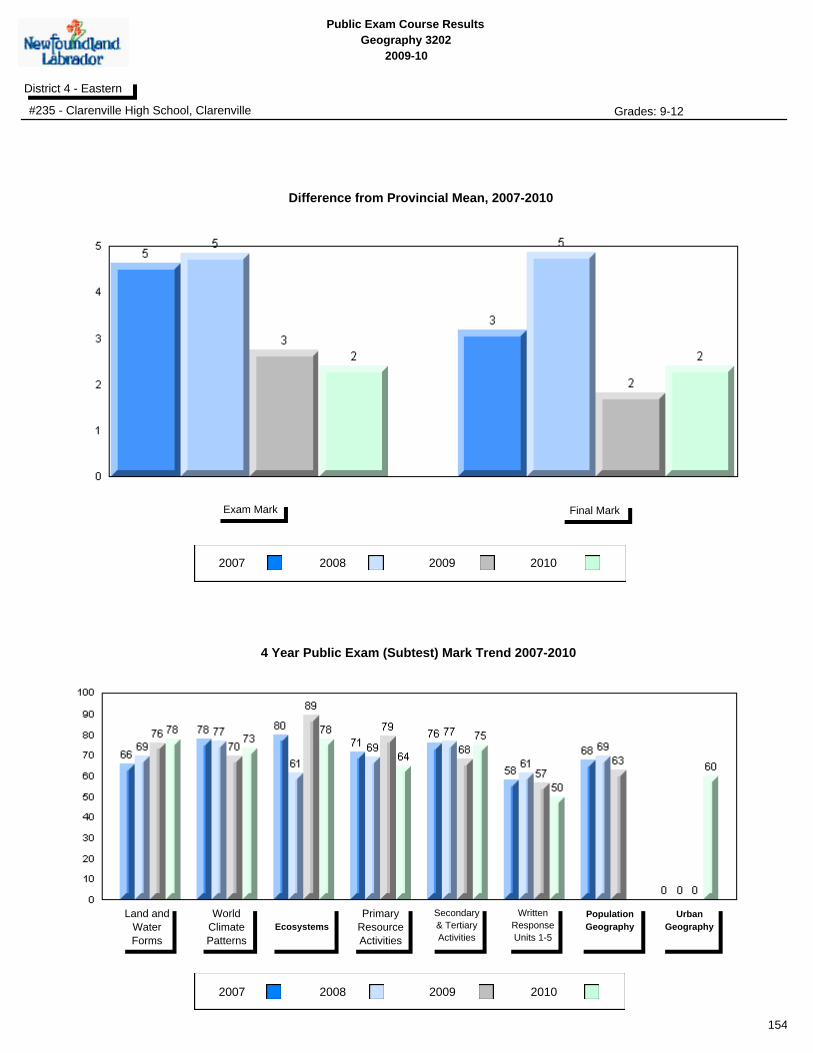
Public Exam Course Results
Geography 3202
2009-10
District 4 - Eastern
#235 - Clarenville High School, Clarenville Grades: 9-12
2007 2008 2009
2007 2008 2009
Final MarkExam Mark
Land and
Water
Forms
World
Climate
Patterns
Ecosystems
Primary
Resource
Activities
Secondary
& Tertiary
Activities
Written
Response
Units 1-5
Population
Geography
Urban
Geography
4 Year Public Exam (Subtest) Mark Trend 2007-2010
Difference from Provincial Mean, 2007-2010
2010
2010
154

Public Exam Course Results
Geography 3202
2009-10
District 4 - Eastern
#242 - Random Island Academy, Hickman's Harbour Grades: K-12
2007 2008 2009
Final MarkExam Mark
School
vs
Province
School
vs
District
Final
Mark
p p 65.2
64.6
63.7
Number of Students
School
District
Province
School
District
Province
World
Climate
Patterns
School
DistrictEcosystems
Land and
Water Forms
Province
Subtest
School
vs
Province
School
vs
District
Public
Exam
Mark
School
District
Province
p q
q
q
p
p
p
q
57.2
10
58.8
57.2
World Geography 3202
School
District
Province
School
District
Province
Secondary &
Tertiary Activities
School
District
Written response
Units 1-5
Primary
Resource
Activities
Province
q
p
p
p
q
q
Population
Geography
School
District
Province
p p
Urban
Geography
School
District
Province
Multiple Choice
Long Answer
65.6
61.1
87.5
56.0
71.0
48.5
59.3
40.9
69.5
70.0
73.3
59.8
66.2
47.0
56.8
54.4
59.0
59.0
50.4
66.0
59.4
73.2
69.5
69.3
Average Mark, 2007-2010
2010
155
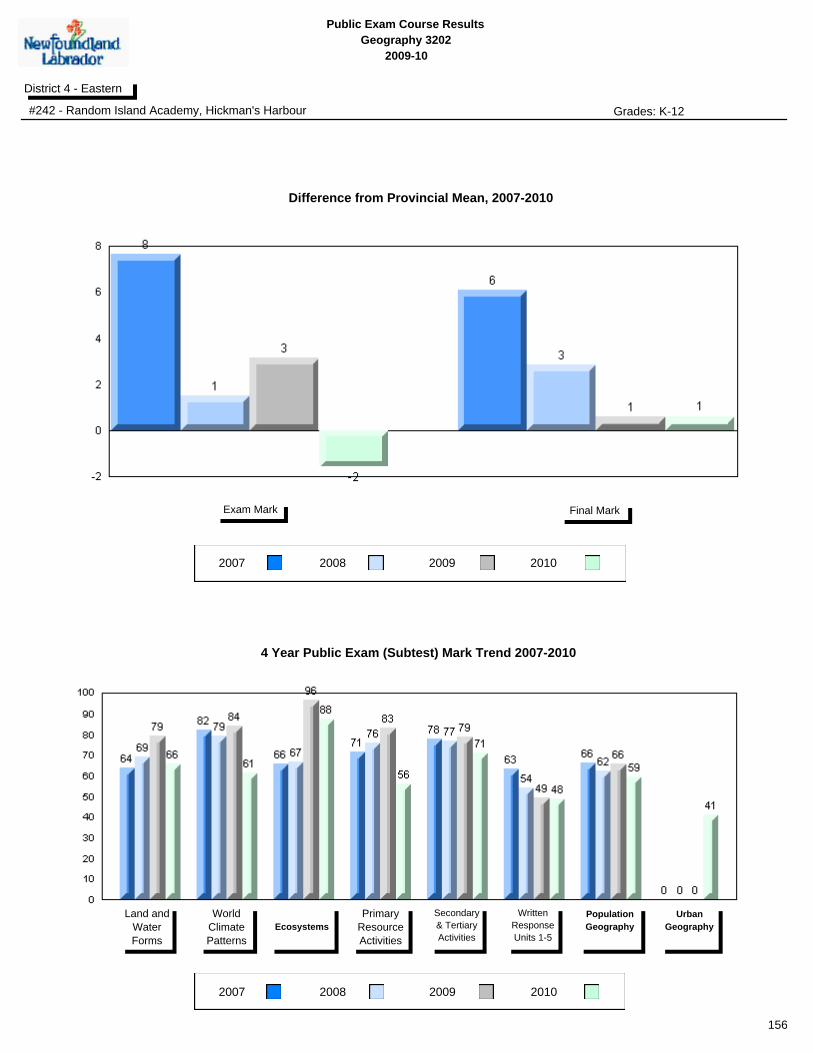
Public Exam Course Results
Geography 3202
2009-10
District 4 - Eastern
#242 - Random Island Academy, Hickman's Harbour Grades: K-12
2007 2008 2009
2007 2008 2009
Final MarkExam Mark
Land and
Water
Forms
World
Climate
Patterns
Ecosystems
Primary
Resource
Activities
Secondary
& Tertiary
Activities
Written
Response
Units 1-5
Population
Geography
Urban
Geography
4 Year Public Exam (Subtest) Mark Trend 2007-2010
Difference from Provincial Mean, 2007-2010
2010
2010
156

Public Exam Course Results
Geography 3202
2009-10
District 4 - Eastern
#246 - Swift Current Academy, Swift Current Grades: K-12
2007 2008 2009
Final MarkExam Mark
School
vs
Province
School
vs
District
Final
Mark
q q 55.8
64.6
63.7
Number of Students
School
District
Province
School
District
Province
World
Climate
Patterns
School
DistrictEcosystems
Land and
Water Forms
Province
Subtest
School
vs
Province
School
vs
District
Public
Exam
Mark
School
District
Province
q q
q
q
p p
q
q
47.6
5
58.8
57.2
World Geography 3202
School
District
Province
School
District
Province
Secondary &
Tertiary Activities
School
District
Written response
Units 1-5
Primary
Resource
Activities
Province
q
q
p p
q
q
Population
Geography
School
District
Province
q q
Urban
Geography
School
District
Province
Multiple Choice
Long Answer
qppq
40.0
68.9
85.0
60.0
48.0
35.8
51.1
69.5
70.0
73.3
59.8
66.2
47.0
56.8
54.4
59.0
59.0
50.4
66.0
59.4
73.2
69.5
69.3
Average Mark, 2007-2010
2010
School data with 5 or fewer
students withheld for reasons of
confidentiality.
School data with 5 or fewer
students withheld for reasons of
confidentiality.
School data with 5 or fewer students withheld for reasons of confidentiality.
157

Public Exam Course Results
Geography 3202
2009-10
District 4 - Eastern
#246 - Swift Current Academy, Swift Current Grades: K-12
2007 2008 2009
2007 2008 2009
Final MarkExam Mark
Land and
Water
Forms
World
Climate
Patterns
Ecosystems
Primary
Resource
Activities
Secondary
& Tertiary
Activities
Written
Response
Units 1-5
Population
Geography
Urban
Geography
4 Year Public Exam (Subtest) Mark Trend 2007-2010
Difference from Provincial Mean, 2007-2010
2010
2010
School data with 5 or fewer students withheld for reasons of confidentiality.
School data with 5 or fewer students withheld for reasons of confidentiality.
158
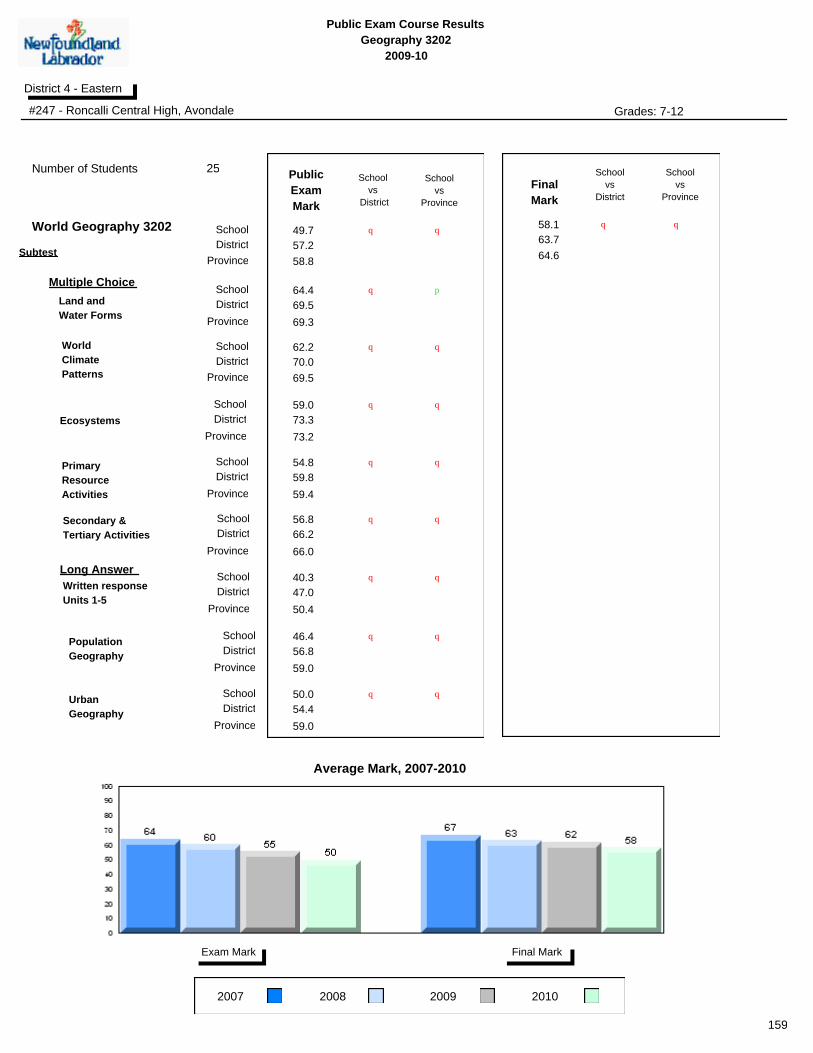
Public Exam Course Results
Geography 3202
2009-10
District 4 - Eastern
#247 - Roncalli Central High, Avondale Grades: 7-12
2007 2008 2009
Final MarkExam Mark
School
vs
Province
School
vs
District
Final
Mark
q q 58.1
64.6
63.7
Number of Students
School
District
Province
School
District
Province
World
Climate
Patterns
School
DistrictEcosystems
Land and
Water Forms
Province
Subtest
School
vs
Province
School
vs
District
Public
Exam
Mark
School
District
Province
q q
q
q
q
p
q
q
49.7
25
58.8
57.2
World Geography 3202
School
District
Province
School
District
Province
Secondary &
Tertiary Activities
School
District
Written response
Units 1-5
Primary
Resource
Activities
Province
q
q
q
q
q
q
Population
Geography
School
District
Province
q q
Urban
Geography
School
District
Province
Multiple Choice
Long Answer
64.4
62.2
59.0
54.8
56.8
40.3
46.4
50.0
69.5
70.0
73.3
59.8
66.2
47.0
56.8
54.4
59.0
59.0
50.4
66.0
59.4
73.2
69.5
69.3
Average Mark, 2007-2010
2010
159
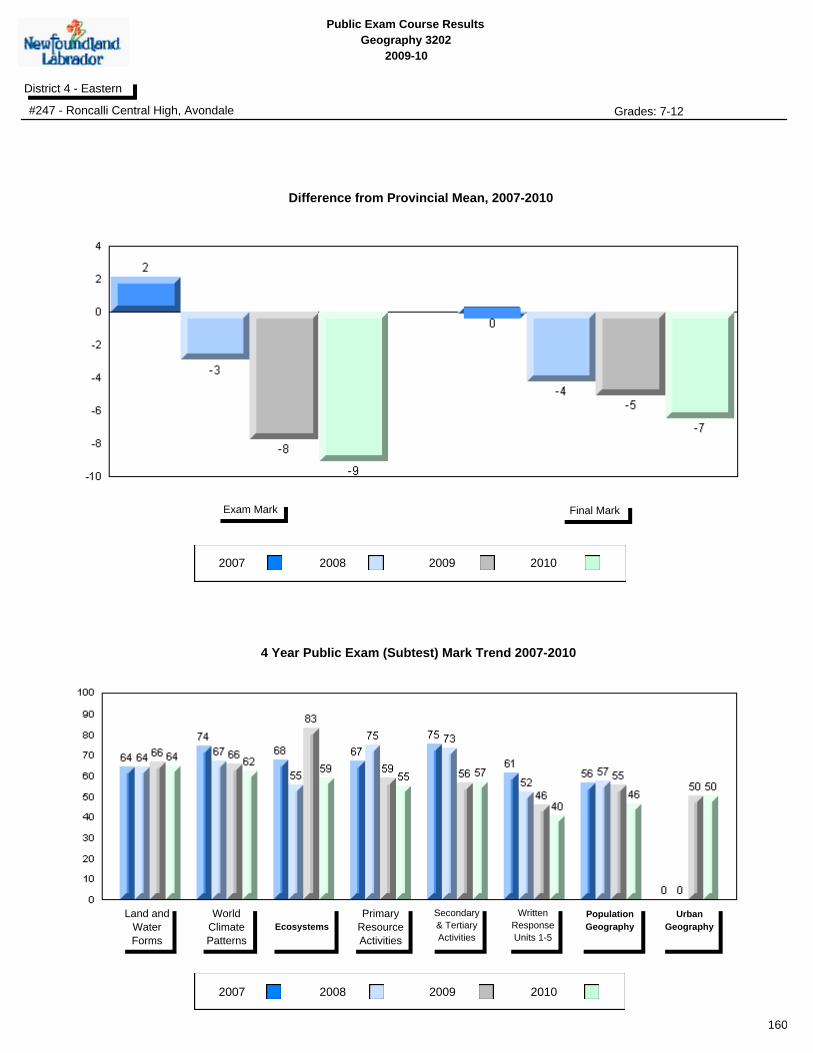
Public Exam Course Results
Geography 3202
2009-10
District 4 - Eastern
#247 - Roncalli Central High, Avondale Grades: 7-12
2007 2008 2009
2007 2008 2009
Final MarkExam Mark
Land and
Water
Forms
World
Climate
Patterns
Ecosystems
Primary
Resource
Activities
Secondary
& Tertiary
Activities
Written
Response
Units 1-5
Population
Geography
Urban
Geography
4 Year Public Exam (Subtest) Mark Trend 2007-2010
Difference from Provincial Mean, 2007-2010
2010
2010
160
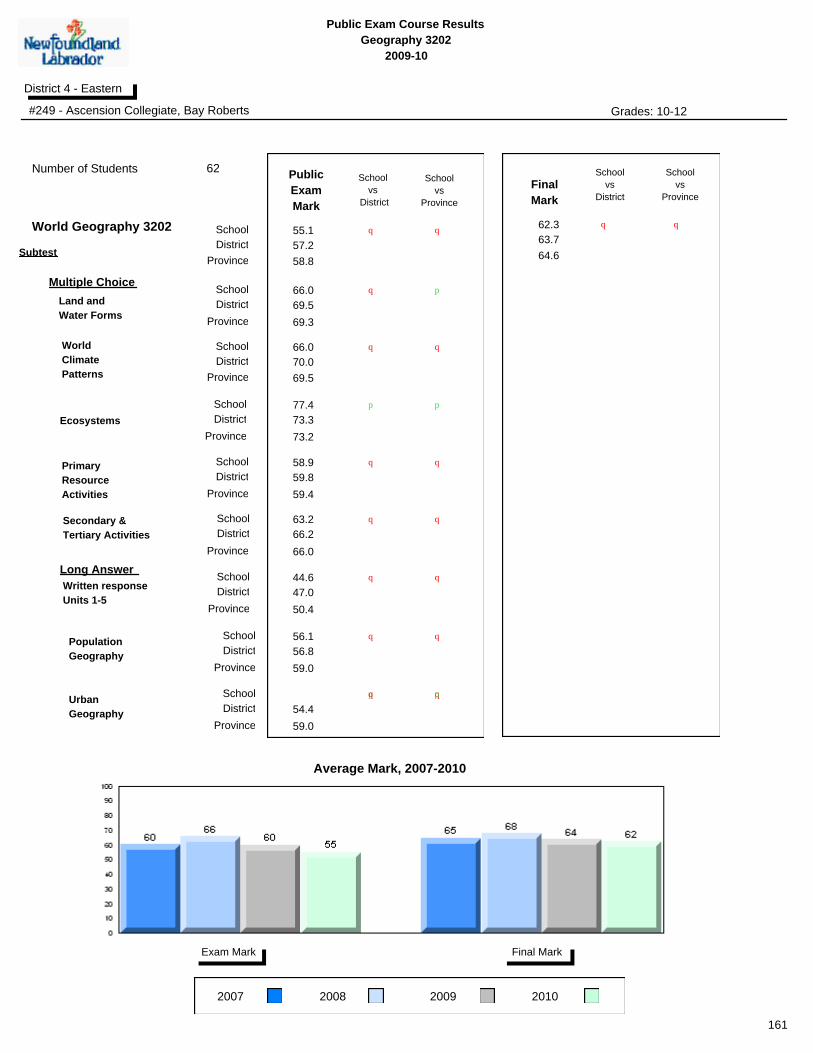
Public Exam Course Results
Geography 3202
2009-10
District 4 - Eastern
#249 - Ascension Collegiate, Bay Roberts Grades: 10-12
2007 2008 2009
Final MarkExam Mark
School
vs
Province
School
vs
District
Final
Mark
q q 62.3
64.6
63.7
Number of Students
School
District
Province
School
District
Province
World
Climate
Patterns
School
DistrictEcosystems
Land and
Water Forms
Province
Subtest
School
vs
Province
School
vs
District
Public
Exam
Mark
School
District
Province
q q
q
q
p
p
p
q
55.1
62
58.8
57.2
World Geography 3202
School
District
Province
School
District
Province
Secondary &
Tertiary Activities
School
District
Written response
Units 1-5
Primary
Resource
Activities
Province
q
q
q
q
q
q
Population
Geography
School
District
Province
q q
Urban
Geography
School
District
Province
Multiple Choice
Long Answer
qppq
66.0
66.0
77.4
58.9
63.2
44.6
56.1
69.5
70.0
73.3
59.8
66.2
47.0
56.8
54.4
59.0
59.0
50.4
66.0
59.4
73.2
69.5
69.3
Average Mark, 2007-2010
2010
161
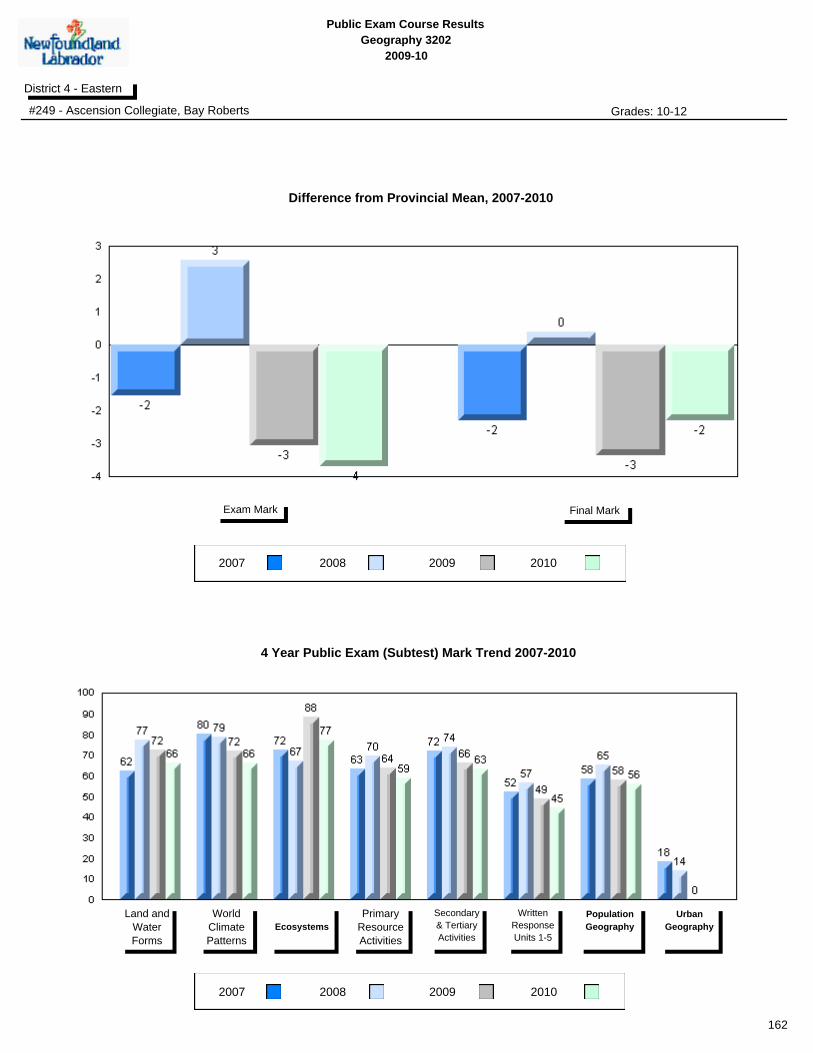
Public Exam Course Results
Geography 3202
2009-10
District 4 - Eastern
#249 - Ascension Collegiate, Bay Roberts Grades: 10-12
2007 2008 2009
2007 2008 2009
Final MarkExam Mark
Land and
Water
Forms
World
Climate
Patterns
Ecosystems
Primary
Resource
Activities
Secondary
& Tertiary
Activities
Written
Response
Units 1-5
Population
Geography
Urban
Geography
4 Year Public Exam (Subtest) Mark Trend 2007-2010
Difference from Provincial Mean, 2007-2010
2010
2010
162

Public Exam Course Results
Geography 3202
2009-10
District 4 - Eastern
#253 - Carbonear Collegiate, Carbonear Grades: 10-12
2007 2008 2009
Final MarkExam Mark
School
vs
Province
School
vs
District
Final
Mark
q q 59.2
64.6
63.7
Number of Students
School
District
Province
School
District
Province
World
Climate
Patterns
School
DistrictEcosystems
Land and
Water Forms
Province
Subtest
School
vs
Province
School
vs
District
Public
Exam
Mark
School
District
Province
q q
q
q
p p
q
q
51.7
52
58.8
57.2
World Geography 3202
School
District
Province
School
District
Province
Secondary &
Tertiary Activities
School
District
Written response
Units 1-5
Primary
Resource
Activities
Province
q
q
q
q
q
q
Population
Geography
School
District
Province
q q
Urban
Geography
School
District
Province
Multiple Choice
Long Answer
qppq
71.2
68.6
66.8
57.5
60.4
38.7
51.3
69.5
70.0
73.3
59.8
66.2
47.0
56.8
54.4
59.0
59.0
50.4
66.0
59.4
73.2
69.5
69.3
Average Mark, 2007-2010
2010
163
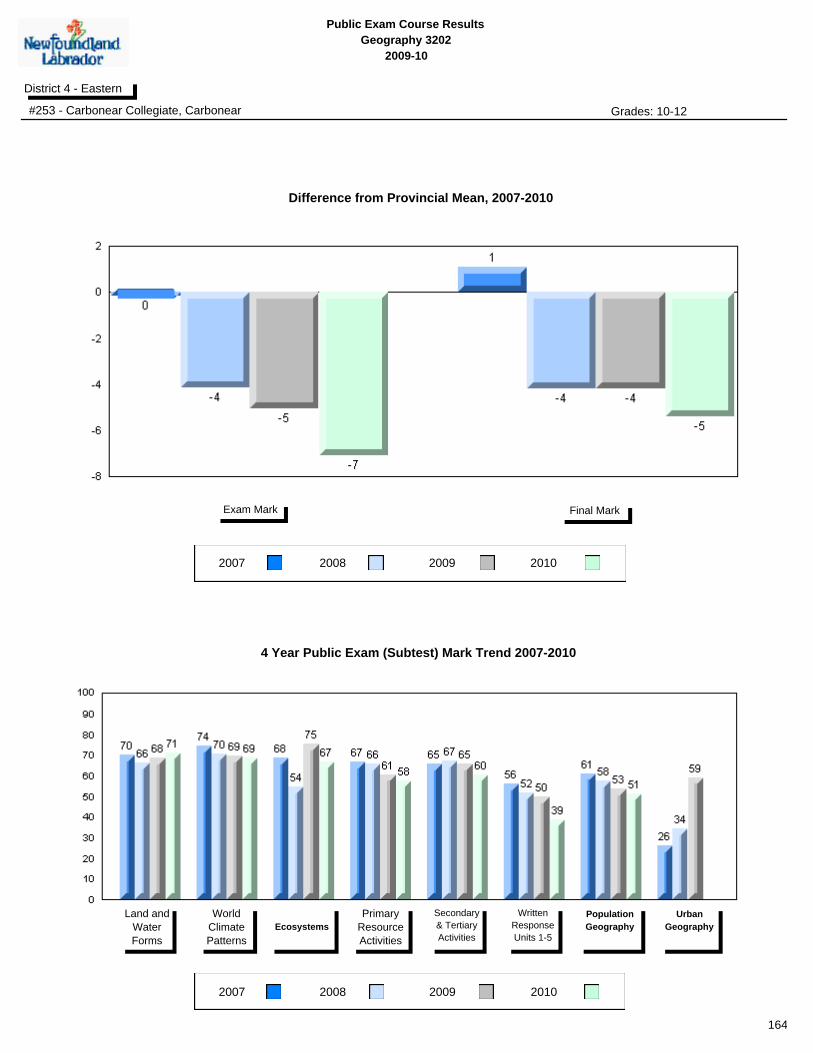
Public Exam Course Results
Geography 3202
2009-10
District 4 - Eastern
#253 - Carbonear Collegiate, Carbonear Grades: 10-12
2007 2008 2009
2007 2008 2009
Final MarkExam Mark
Land and
Water
Forms
World
Climate
Patterns
Ecosystems
Primary
Resource
Activities
Secondary
& Tertiary
Activities
Written
Response
Units 1-5
Population
Geography
Urban
Geography
4 Year Public Exam (Subtest) Mark Trend 2007-2010
Difference from Provincial Mean, 2007-2010
2010
2010
164

Public Exam Course Results
Geography 3202
2009-10
District 4 - Eastern
#274 - St. Catherine's Academy, Mount Carmel Grades: K-12
2007 2008 2009
Final MarkExam Mark
School
vs
Province
School
vs
District
Final
Mark
q q 58.1
64.6
63.7
Number of Students
School
District
Province
School
District
Province
World
Climate
Patterns
School
DistrictEcosystems
Land and
Water Forms
Province
Subtest
School
vs
Province
School
vs
District
Public
Exam
Mark
School
District
Province
q q
q
q
q
q
q
q
49.8
8
58.8
57.2
World Geography 3202
School
District
Province
School
District
Province
Secondary &
Tertiary Activities
School
District
Written response
Units 1-5
Primary
Resource
Activities
Province
q
q
q
q
q
q
Population
Geography
School
District
Province
q q
Urban
Geography
School
District
Province
Multiple Choice
Long Answer
qppq
55.6
61.1
68.8
58.8
55.0
39.9
50.6
69.5
70.0
73.3
59.8
66.2
47.0
56.8
54.4
59.0
59.0
50.4
66.0
59.4
73.2
69.5
69.3
Average Mark, 2007-2010
2010
165
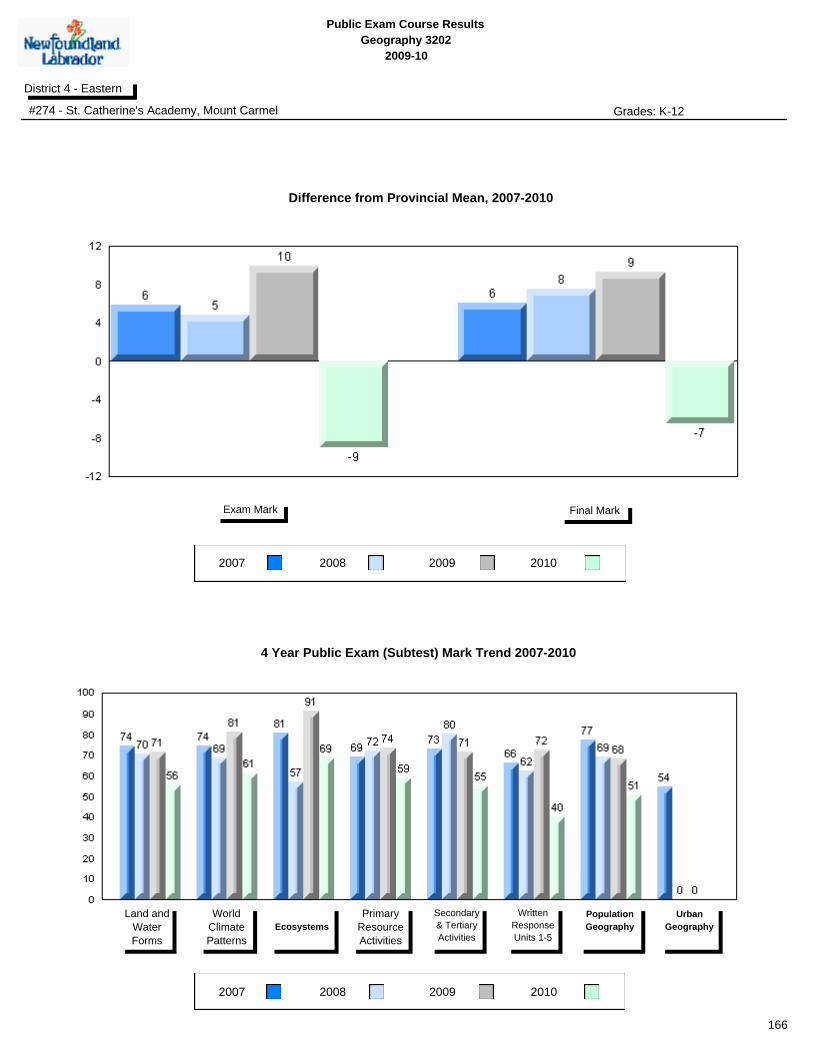
Public Exam Course Results
Geography 3202
2009-10
District 4 - Eastern
#274 - St. Catherine's Academy, Mount Carmel Grades: K-12
2007 2008 2009
2007 2008 2009
Final MarkExam Mark
Land and
Water
Forms
World
Climate
Patterns
Ecosystems
Primary
Resource
Activities
Secondary
& Tertiary
Activities
Written
Response
Units 1-5
Population
Geography
Urban
Geography
4 Year Public Exam (Subtest) Mark Trend 2007-2010
Difference from Provincial Mean, 2007-2010
2010
2010
166
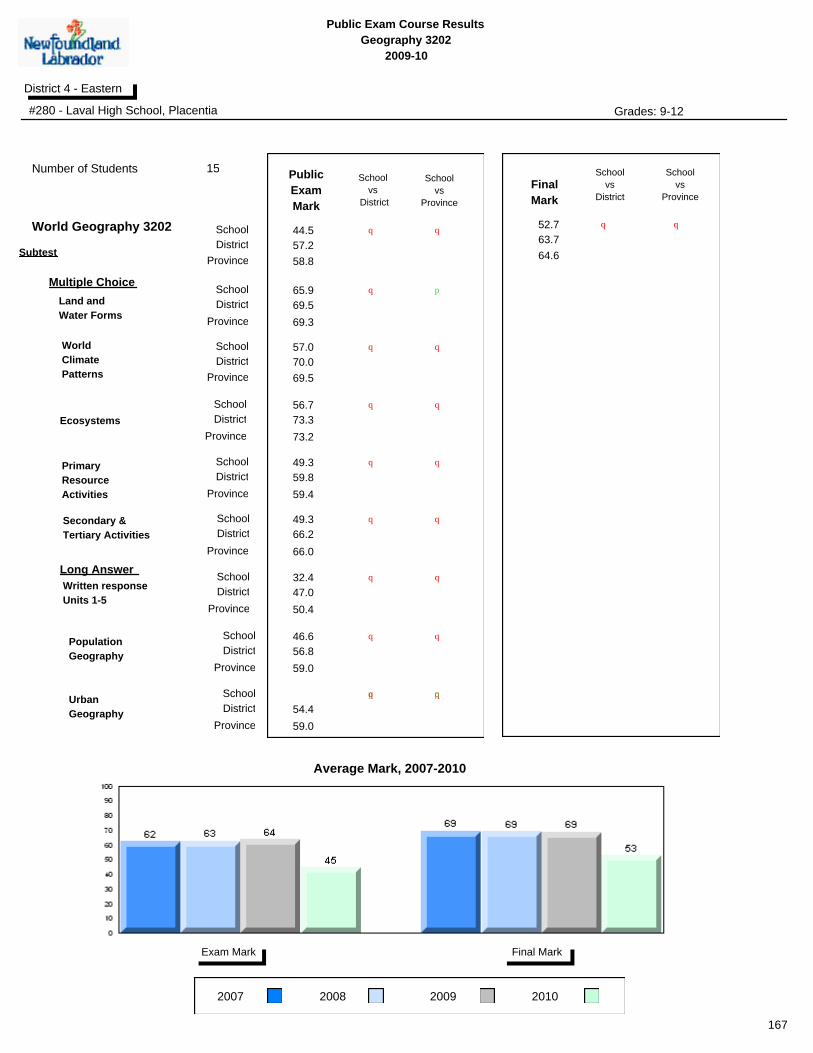
Public Exam Course Results
Geography 3202
2009-10
District 4 - Eastern
#280 - Laval High School, Placentia Grades: 9-12
2007 2008 2009
Final MarkExam Mark
School
vs
Province
School
vs
District
Final
Mark
q q 52.7
64.6
63.7
Number of Students
School
District
Province
School
District
Province
World
Climate
Patterns
School
DistrictEcosystems
Land and
Water Forms
Province
Subtest
School
vs
Province
School
vs
District
Public
Exam
Mark
School
District
Province
q q
q
q
q
p
q
q
44.5
15
58.8
57.2
World Geography 3202
School
District
Province
School
District
Province
Secondary &
Tertiary Activities
School
District
Written response
Units 1-5
Primary
Resource
Activities
Province
q
q
q
q
q
q
Population
Geography
School
District
Province
q q
Urban
Geography
School
District
Province
Multiple Choice
Long Answer
qppq
65.9
57.0
56.7
49.3
49.3
32.4
46.6
69.5
70.0
73.3
59.8
66.2
47.0
56.8
54.4
59.0
59.0
50.4
66.0
59.4
73.2
69.5
69.3
Average Mark, 2007-2010
2010
167
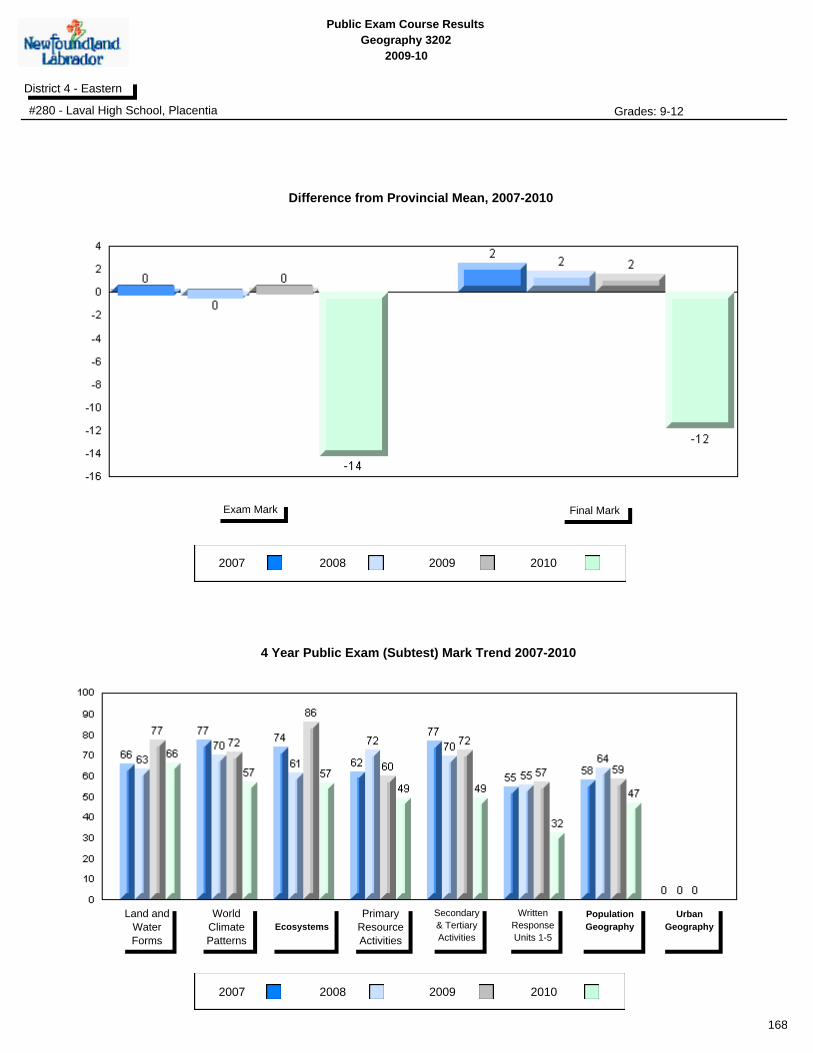
Public Exam Course Results
Geography 3202
2009-10
District 4 - Eastern
#280 - Laval High School, Placentia Grades: 9-12
2007 2008 2009
2007 2008 2009
Final MarkExam Mark
Land and
Water
Forms
World
Climate
Patterns
Ecosystems
Primary
Resource
Activities
Secondary
& Tertiary
Activities
Written
Response
Units 1-5
Population
Geography
Urban
Geography
4 Year Public Exam (Subtest) Mark Trend 2007-2010
Difference from Provincial Mean, 2007-2010
2010
2010
168

Public Exam Course Results
Geography 3202
2009-10
District 4 - Eastern
#287 - Dunne Memorial Academy, St. Mary's Grades: K-12
2007 2008 2009
Final MarkExam Mark
School
vs
Province
School
vs
District
Final
Mark
p p 74.4
64.6
63.7
Number of Students
School
District
Province
School
District
Province
World
Climate
Patterns
School
DistrictEcosystems
Land and
Water Forms
Province
Subtest
School
vs
Province
School
vs
District
Public
Exam
Mark
School
District
Province
p p
q
p
p
p
p
q
67.5
17
58.8
57.2
World Geography 3202
School
District
Province
School
District
Province
Secondary &
Tertiary Activities
School
District
Written response
Units 1-5
Primary
Resource
Activities
Province
p
p
p
p
p
p
Population
Geography
School
District
Province
p p
Urban
Geography
School
District
Province
Multiple Choice
Long Answer
qppq
81.7
79.7
72.1
72.9
81.8
54.8
68.6
69.5
70.0
73.3
59.8
66.2
47.0
56.8
54.4
59.0
59.0
50.4
66.0
59.4
73.2
69.5
69.3
Average Mark, 2007-2010
2010
169
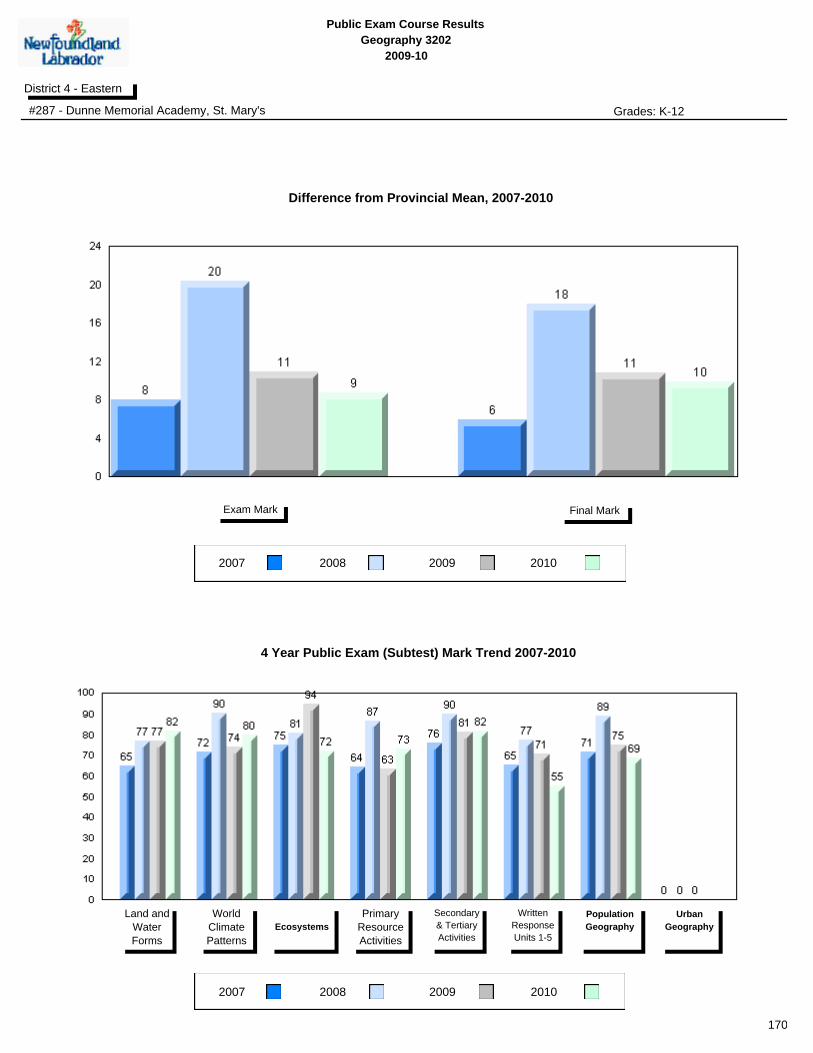
Public Exam Course Results
Geography 3202
2009-10
District 4 - Eastern
#287 - Dunne Memorial Academy, St. Mary's Grades: K-12
2007 2008 2009
2007 2008 2009
Final MarkExam Mark
Land and
Water
Forms
World
Climate
Patterns
Ecosystems
Primary
Resource
Activities
Secondary
& Tertiary
Activities
Written
Response
Units 1-5
Population
Geography
Urban
Geography
4 Year Public Exam (Subtest) Mark Trend 2007-2010
Difference from Provincial Mean, 2007-2010
2010
2010
170
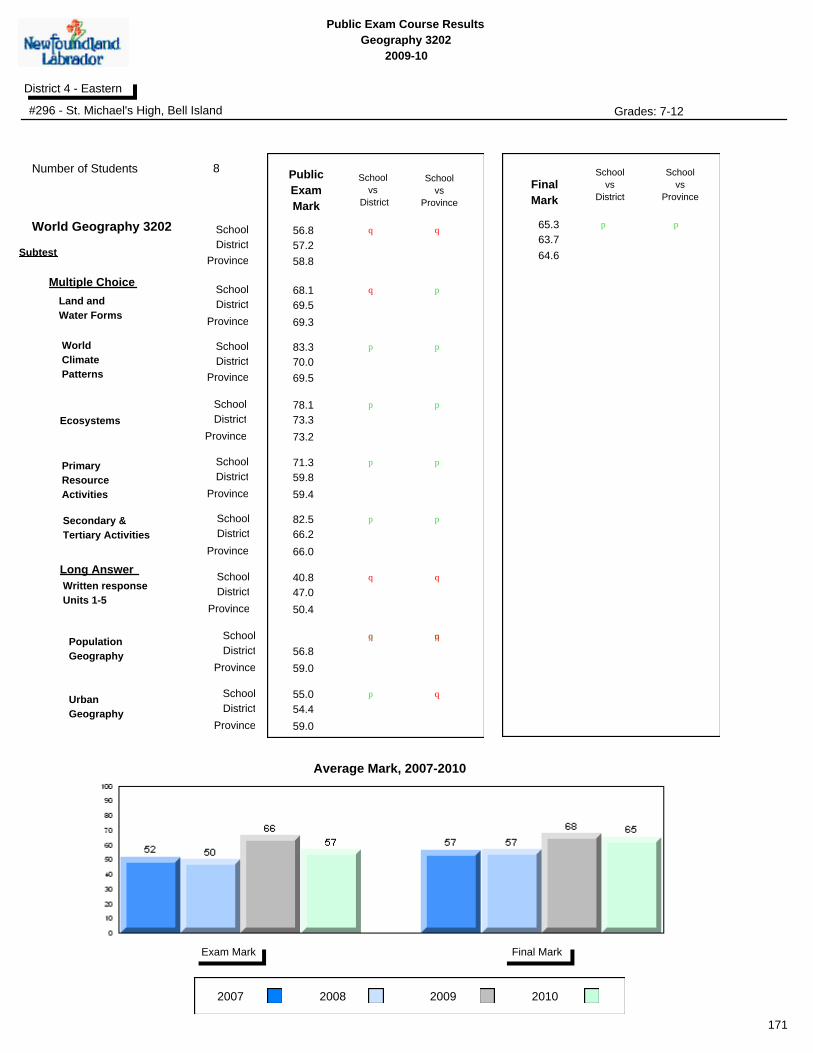
Public Exam Course Results
Geography 3202
2009-10
District 4 - Eastern
#296 - St. Michael's High, Bell Island Grades: 7-12
2007 2008 2009
Final MarkExam Mark
School
vs
Province
School
vs
District
Final
Mark
p p 65.3
64.6
63.7
Number of Students
School
District
Province
School
District
Province
World
Climate
Patterns
School
DistrictEcosystems
Land and
Water Forms
Province
Subtest
School
vs
Province
School
vs
District
Public
Exam
Mark
School
District
Province
q q
q
p
p
p
p
p
56.8
8
58.8
57.2
World Geography 3202
School
District
Province
School
District
Province
Secondary &
Tertiary Activities
School
District
Written response
Units 1-5
Primary
Resource
Activities
Province
q
p
p
p
p
q
Population
Geography
School
District
Province
qp pq
Urban
Geography
School
District
Province
Multiple Choice
Long Answer
qp
68.1
83.3
78.1
71.3
82.5
40.8
55.0
69.5
70.0
73.3
59.8
66.2
47.0
56.8
54.4
59.0
59.0
50.4
66.0
59.4
73.2
69.5
69.3
Average Mark, 2007-2010
2010
171
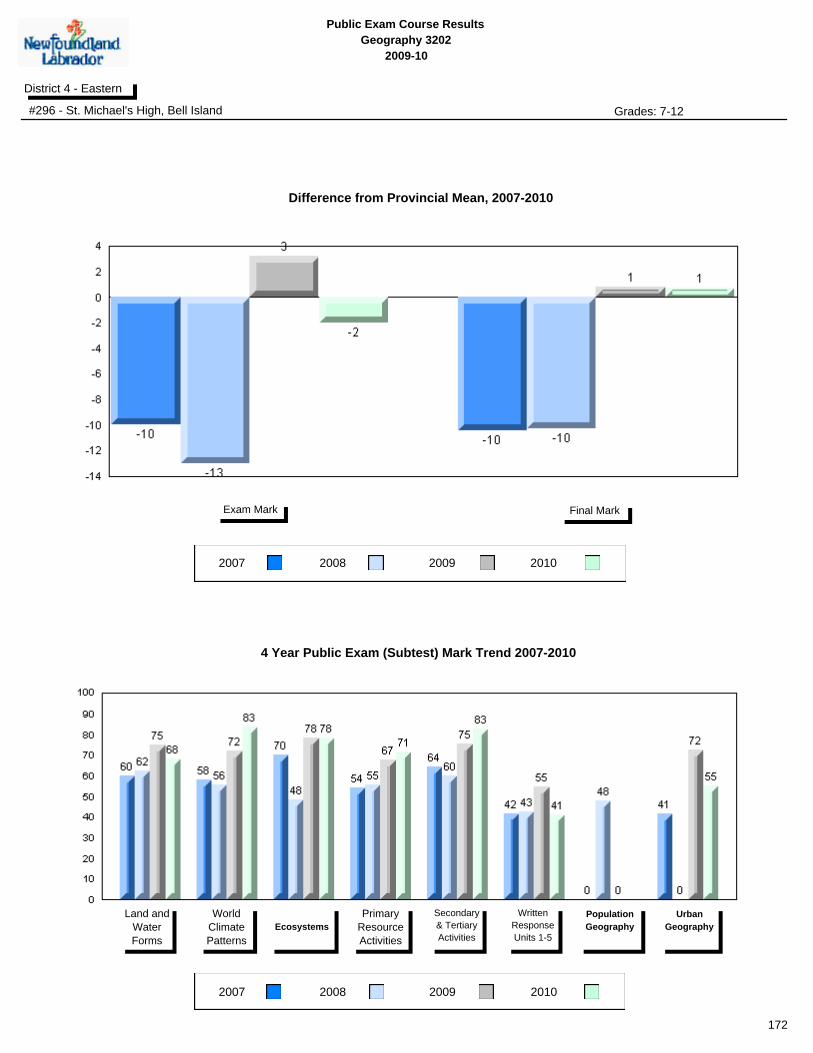
Public Exam Course Results
Geography 3202
2009-10
District 4 - Eastern
#296 - St. Michael's High, Bell Island Grades: 7-12
2007 2008 2009
2007 2008 2009
Final MarkExam Mark
Land and
Water
Forms
World
Climate
Patterns
Ecosystems
Primary
Resource
Activities
Secondary
& Tertiary
Activities
Written
Response
Units 1-5
Population
Geography
Urban
Geography
4 Year Public Exam (Subtest) Mark Trend 2007-2010
Difference from Provincial Mean, 2007-2010
2010
2010
172

Public Exam Course Results
Geography 3202
2009-10
District 4 - Eastern
#302 - Queen Elizabeth Regional High, Conception Bay South ( Grades: 10-12
2007 2008 2009
Final MarkExam Mark
School
vs
Province
School
vs
District
Final
Mark
p q 64.1
64.6
63.7
Number of Students
School
District
Province
School
District
Province
World
Climate
Patterns
School
DistrictEcosystems
Land and
Water Forms
Province
Subtest
School
vs
Province
School
vs
District
Public
Exam
Mark
School
District
Province
q q
p
p
p
p
p
p
56.1
81
58.8
57.2
World Geography 3202
School
District
Province
School
District
Province
Secondary &
Tertiary Activities
School
District
Written response
Units 1-5
Primary
Resource
Activities
Province
q
q
p p
q
q
Population
Geography
School
District
Province
p q
Urban
Geography
School
District
Province
Multiple Choice
Long Answer
71.6
72.6
74.1
58.0
67.0
43.3
56.8
31.8
69.5
70.0
73.3
59.8
66.2
47.0
56.8
54.4
59.0
59.0
50.4
66.0
59.4
73.2
69.5
69.3
Average Mark, 2007-2010
2010
173
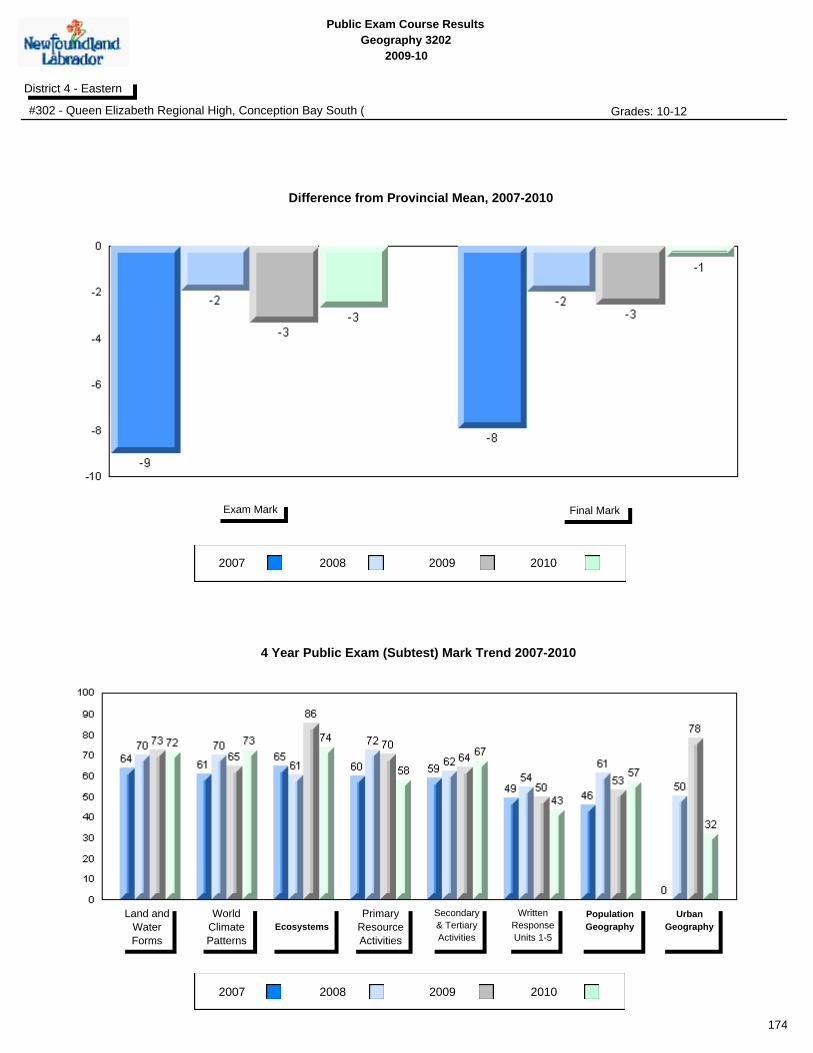
Public Exam Course Results
Geography 3202
2009-10
District 4 - Eastern
#302 - Queen Elizabeth Regional High, Conception Bay South ( Grades: 10-12
2007 2008 2009
2007 2008 2009
Final MarkExam Mark
Land and
Water
Forms
World
Climate
Patterns
Ecosystems
Primary
Resource
Activities
Secondary
& Tertiary
Activities
Written
Response
Units 1-5
Population
Geography
Urban
Geography
4 Year Public Exam (Subtest) Mark Trend 2007-2010
Difference from Provincial Mean, 2007-2010
2010
2010
174

Public Exam Course Results
Geography 3202
2009-10
District 4 - Eastern
#304 - Holy Spirit High, Conception Bay South (Manuels) Grades: 9-12
2007 2008 2009
Final MarkExam Mark
School
vs
Province
School
vs
District
Final
Mark
q q 58.8
64.6
63.7
Number of Students
School
District
Province
School
District
Province
World
Climate
Patterns
School
DistrictEcosystems
Land and
Water Forms
Province
Subtest
School
vs
Province
School
vs
District
Public
Exam
Mark
School
District
Province
q q
q
q
q
p
q
q
50.5
49
58.8
57.2
World Geography 3202
School
District
Province
School
District
Province
Secondary &
Tertiary Activities
School
District
Written response
Units 1-5
Primary
Resource
Activities
Province
q
q
q
q
q
q
Population
Geography
School
District
Province
q q
Urban
Geography
School
District
Province
Multiple Choice
Long Answer
60.1
61.9
70.9
54.5
60.2
40.6
50.9
43.6
69.5
70.0
73.3
59.8
66.2
47.0
56.8
54.4
59.0
59.0
50.4
66.0
59.4
73.2
69.5
69.3
Average Mark, 2007-2010
2010
175
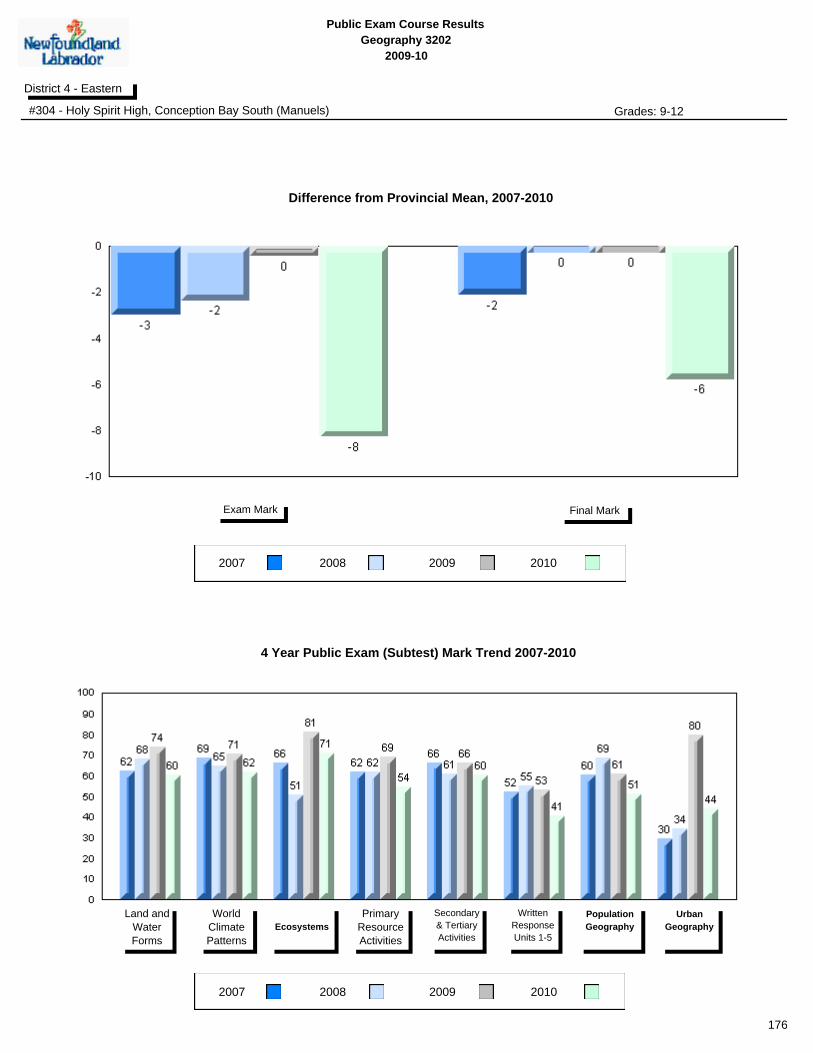
Public Exam Course Results
Geography 3202
2009-10
District 4 - Eastern
#304 - Holy Spirit High, Conception Bay South (Manuels) Grades: 9-12
2007 2008 2009
2007 2008 2009
Final MarkExam Mark
Land and
Water
Forms
World
Climate
Patterns
Ecosystems
Primary
Resource
Activities
Secondary
& Tertiary
Activities
Written
Response
Units 1-5
Population
Geography
Urban
Geography
4 Year Public Exam (Subtest) Mark Trend 2007-2010
Difference from Provincial Mean, 2007-2010
2010
2010
176
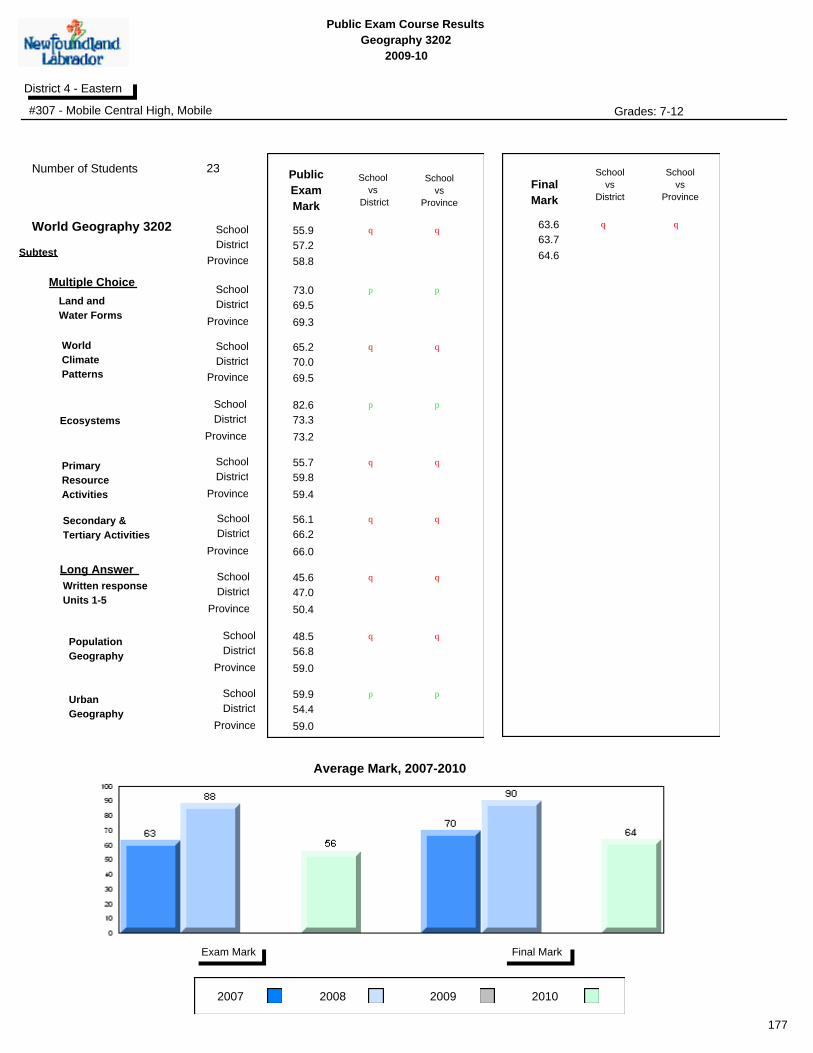
Public Exam Course Results
Geography 3202
2009-10
District 4 - Eastern
#307 - Mobile Central High, Mobile Grades: 7-12
2007 2008 2009
Final MarkExam Mark
School
vs
Province
School
vs
District
Final
Mark
q q 63.6
64.6
63.7
Number of Students
School
District
Province
School
District
Province
World
Climate
Patterns
School
DistrictEcosystems
Land and
Water Forms
Province
Subtest
School
vs
Province
School
vs
District
Public
Exam
Mark
School
District
Province
q q
q
p
p
p
p
q
55.9
23
58.8
57.2
World Geography 3202
School
District
Province
School
District
Province
Secondary &
Tertiary Activities
School
District
Written response
Units 1-5
Primary
Resource
Activities
Province
q
q
q
q
q
q
Population
Geography
School
District
Province
q q
Urban
Geography
School
District
Province
Multiple Choice
Long Answer
pp
73.0
65.2
82.6
55.7
56.1
45.6
48.5
59.9
69.5
70.0
73.3
59.8
66.2
47.0
56.8
54.4
59.0
59.0
50.4
66.0
59.4
73.2
69.5
69.3
Average Mark, 2007-2010
2010
177
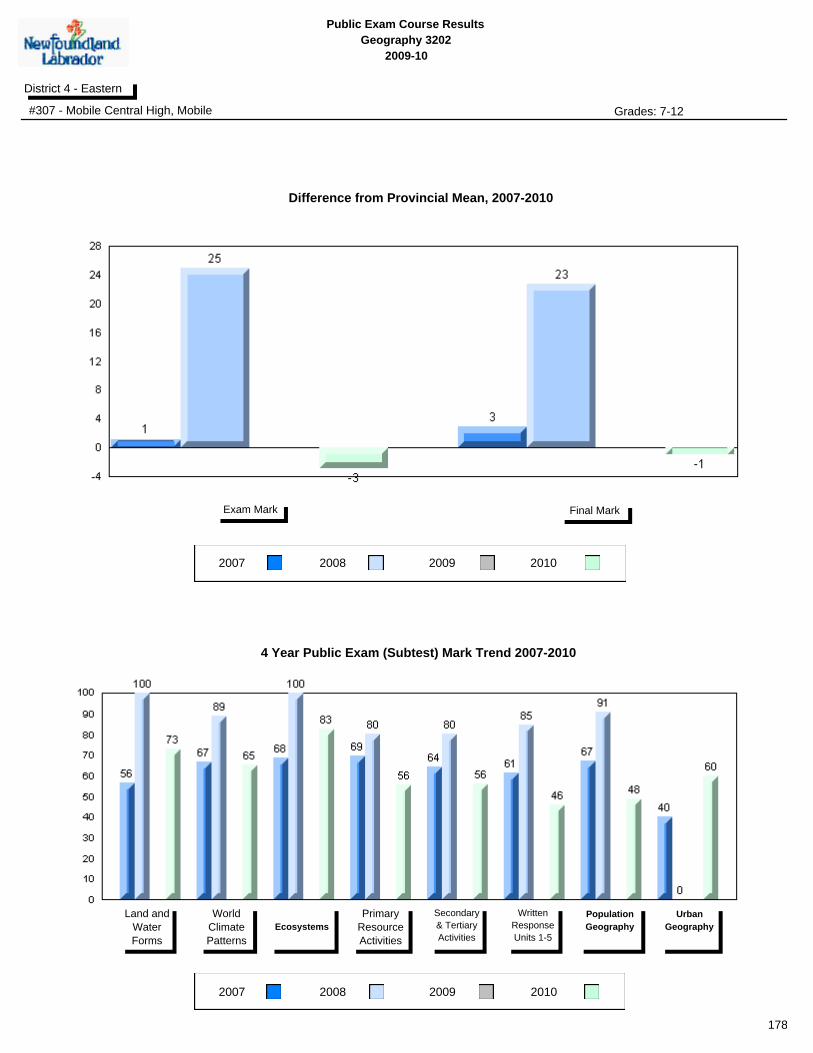
Public Exam Course Results
Geography 3202
2009-10
District 4 - Eastern
#307 - Mobile Central High, Mobile Grades: 7-12
2007 2008 2009
2007 2008 2009
Final MarkExam Mark
Land and
Water
Forms
World
Climate
Patterns
Ecosystems
Primary
Resource
Activities
Secondary
& Tertiary
Activities
Written
Response
Units 1-5
Population
Geography
Urban
Geography
4 Year Public Exam (Subtest) Mark Trend 2007-2010
Difference from Provincial Mean, 2007-2010
2010
2010
178

Public Exam Course Results
Geography 3202
2009-10
District 4 - Eastern
#311 - Mount Pearl Senior High, Mount Pearl Grades: 10-12
2007 2008 2009
Final MarkExam Mark
School
vs
Province
School
vs
District
Final
Mark
p p 66.7
64.6
63.7
Number of Students
School
District
Province
School
District
Province
World
Climate
Patterns
School
DistrictEcosystems
Land and
Water Forms
Province
Subtest
School
vs
Province
School
vs
District
Public
Exam
Mark
School
District
Province
p p
q
p
p
p
p
q
62.8
84
58.8
57.2
World Geography 3202
School
District
Province
School
District
Province
Secondary &
Tertiary Activities
School
District
Written response
Units 1-5
Primary
Resource
Activities
Province
p
p
p
p
p
p
Population
Geography
School
District
Province
p p
Urban
Geography
School
District
Province
Multiple Choice
Long Answer
73.8
77.3
72.0
63.2
73.0
54.3
61.6
52.3
69.5
70.0
73.3
59.8
66.2
47.0
56.8
54.4
59.0
59.0
50.4
66.0
59.4
73.2
69.5
69.3
Average Mark, 2007-2010
2010
179
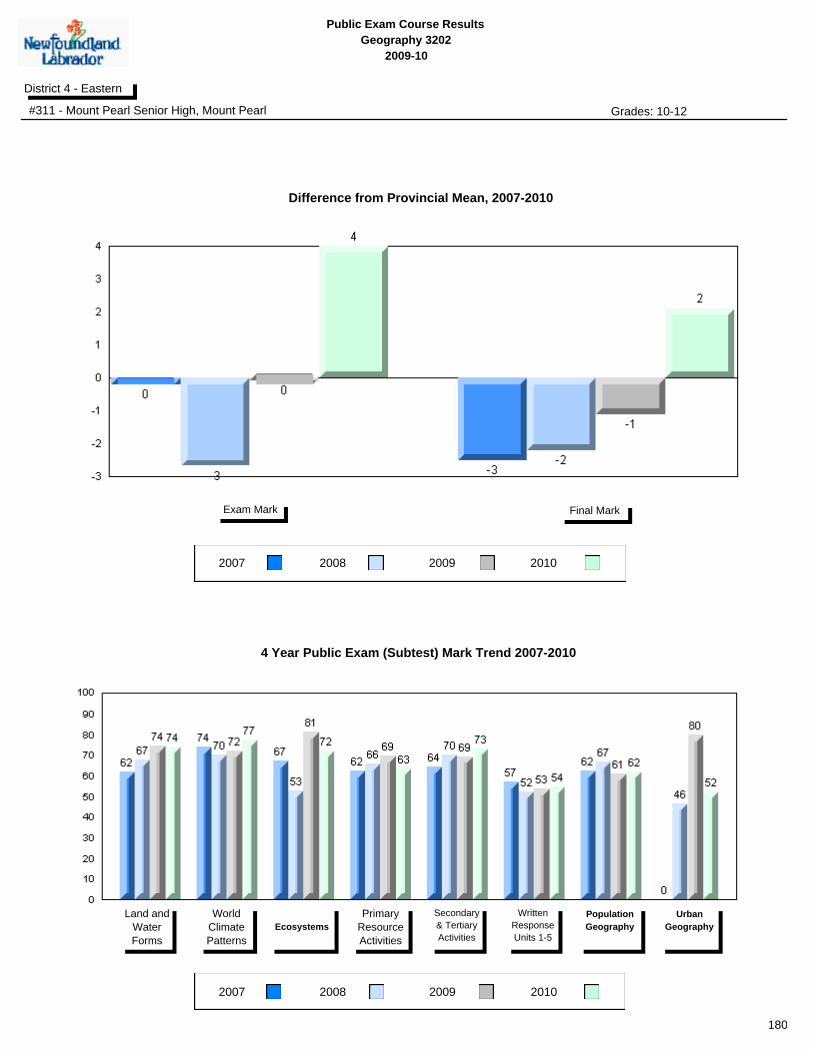
Public Exam Course Results
Geography 3202
2009-10
District 4 - Eastern
#311 - Mount Pearl Senior High, Mount Pearl Grades: 10-12
2007 2008 2009
2007 2008 2009
Final MarkExam Mark
Land and
Water
Forms
World
Climate
Patterns
Ecosystems
Primary
Resource
Activities
Secondary
& Tertiary
Activities
Written
Response
Units 1-5
Population
Geography
Urban
Geography
4 Year Public Exam (Subtest) Mark Trend 2007-2010
Difference from Provincial Mean, 2007-2010
2010
2010
180

Public Exam Course Results
Geography 3202
2009-10
District 4 - Eastern
#313 - O'Donel High School, Mount Pearl Grades: 10-12
2007 2008 2009
Final MarkExam Mark
School
vs
Province
School
vs
District
Final
Mark
p p 67.4
64.6
63.7
Number of Students
School
District
Province
School
District
Province
World
Climate
Patterns
School
DistrictEcosystems
Land and
Water Forms
Province
Subtest
School
vs
Province
School
vs
District
Public
Exam
Mark
School
District
Province
p p
q
p
p
p
p
q
60.5
144
58.8
57.2
World Geography 3202
School
District
Province
School
District
Province
Secondary &
Tertiary Activities
School
District
Written response
Units 1-5
Primary
Resource
Activities
Province
p
p
p
p
p
q
Population
Geography
School
District
Province
p q
Urban
Geography
School
District
Province
Multiple Choice
Long Answer
74.7
74.9
72.9
66.2
71.5
49.4
58.5
51.8
69.5
70.0
73.3
59.8
66.2
47.0
56.8
54.4
59.0
59.0
50.4
66.0
59.4
73.2
69.5
69.3
Average Mark, 2007-2010
2010
181
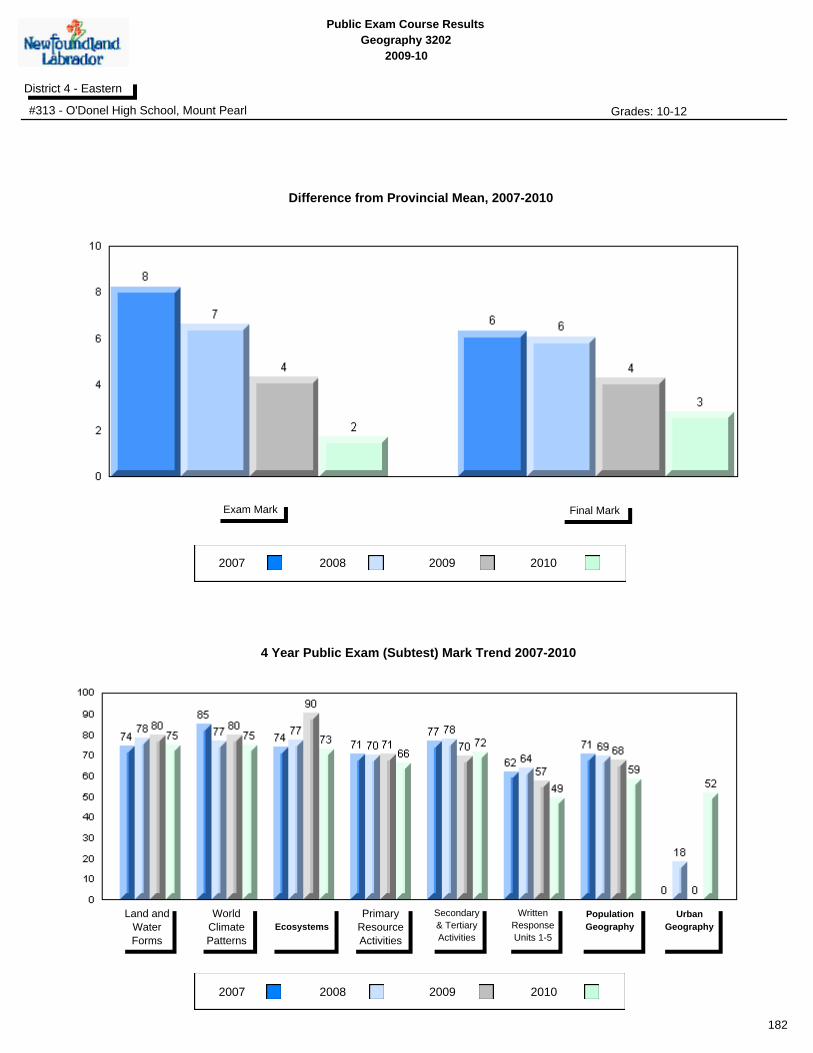
Public Exam Course Results
Geography 3202
2009-10
District 4 - Eastern
#313 - O'Donel High School, Mount Pearl Grades: 10-12
2007 2008 2009
2007 2008 2009
Final MarkExam Mark
Land and
Water
Forms
World
Climate
Patterns
Ecosystems
Primary
Resource
Activities
Secondary
& Tertiary
Activities
Written
Response
Units 1-5
Population
Geography
Urban
Geography
4 Year Public Exam (Subtest) Mark Trend 2007-2010
Difference from Provincial Mean, 2007-2010
2010
2010
182

Public Exam Course Results
Geography 3202
2009-10
District 4 - Eastern
#327 - Bishops College High, St. John's Grades: 10-12
2007 2008 2009
Final MarkExam Mark
School
vs
Province
School
vs
District
Final
Mark
q q 56.3
64.6
63.7
Number of Students
School
District
Province
School
District
Province
World
Climate
Patterns
School
DistrictEcosystems
Land and
Water Forms
Province
Subtest
School
vs
Province
School
vs
District
Public
Exam
Mark
School
District
Province
q q
q
q
q
p
q
q
47.5
70
58.8
57.2
World Geography 3202
School
District
Province
School
District
Province
Secondary &
Tertiary Activities
School
District
Written response
Units 1-5
Primary
Resource
Activities
Province
q
q
q
q
q
q
Population
Geography
School
District
Province
q q
Urban
Geography
School
District
Province
Multiple Choice
Long Answer
59.8
61.0
67.1
50.1
56.9
37.0
50.3
52.3
69.5
70.0
73.3
59.8
66.2
47.0
56.8
54.4
59.0
59.0
50.4
66.0
59.4
73.2
69.5
69.3
Average Mark, 2007-2010
2010
183
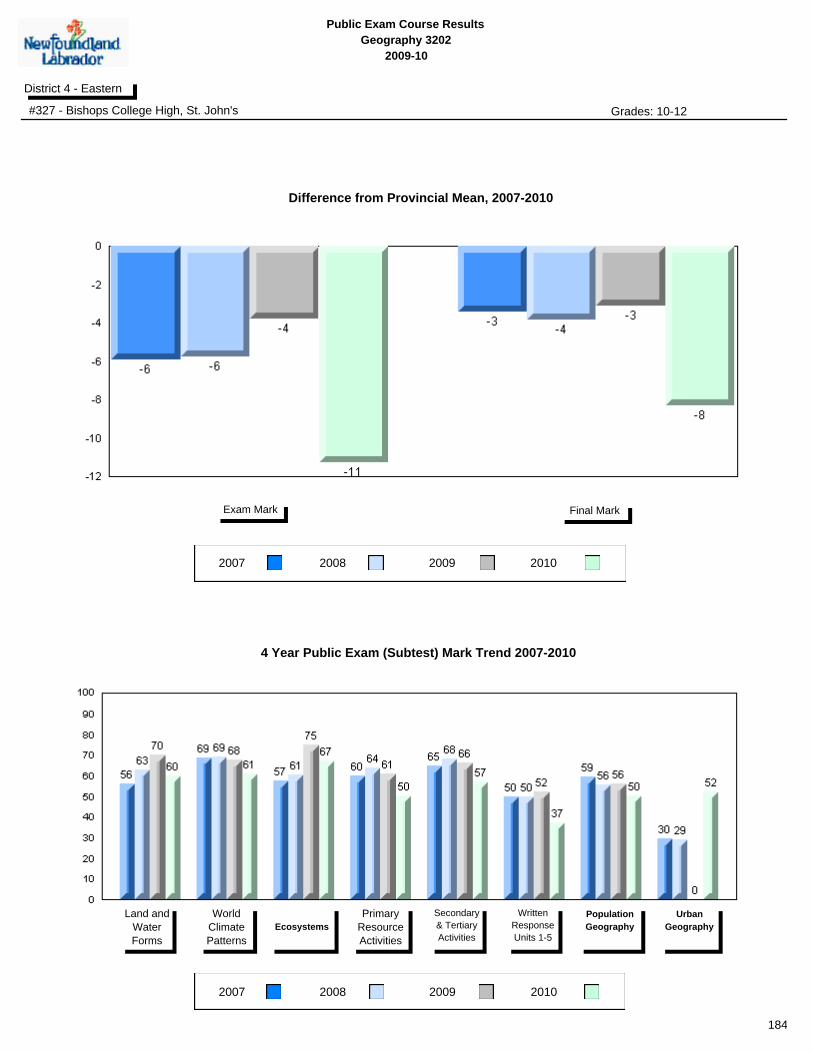
Public Exam Course Results
Geography 3202
2009-10
District 4 - Eastern
#327 - Bishops College High, St. John's Grades: 10-12
2007 2008 2009
2007 2008 2009
Final MarkExam Mark
Land and
Water
Forms
World
Climate
Patterns
Ecosystems
Primary
Resource
Activities
Secondary
& Tertiary
Activities
Written
Response
Units 1-5
Population
Geography
Urban
Geography
4 Year Public Exam (Subtest) Mark Trend 2007-2010
Difference from Provincial Mean, 2007-2010
2010
2010
184
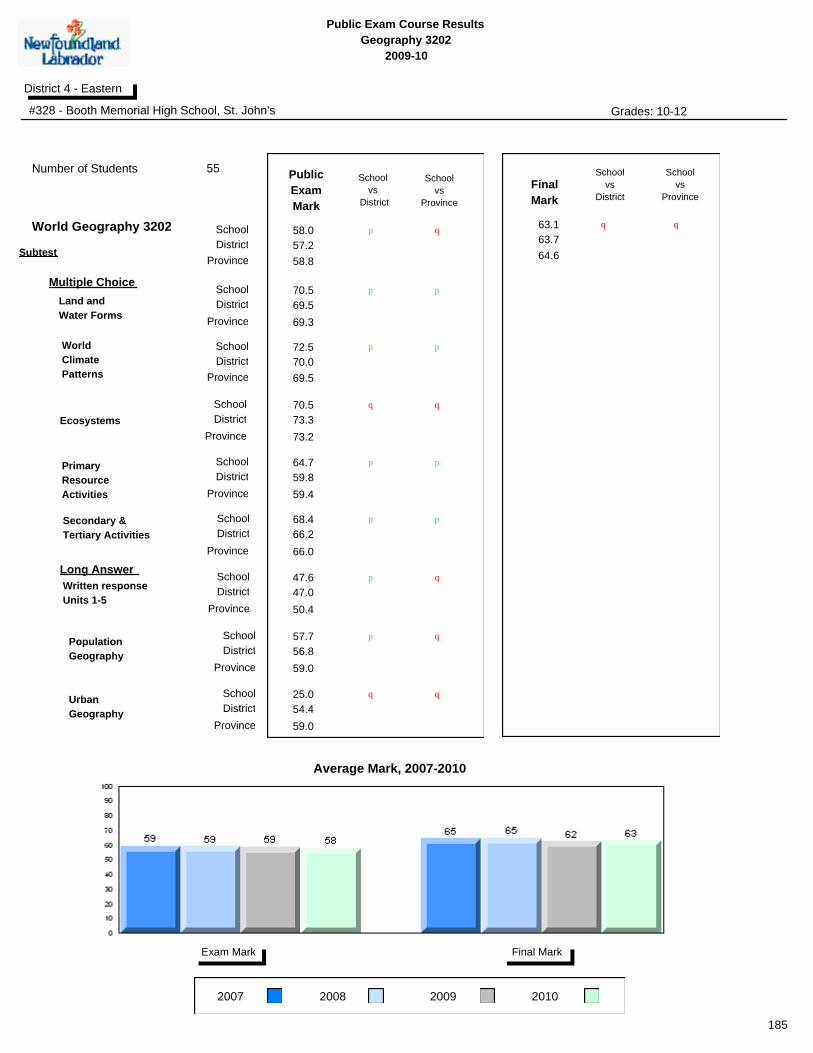
Public Exam Course Results
Geography 3202
2009-10
District 4 - Eastern
#328 - Booth Memorial High School, St. John's Grades: 10-12
2007 2008 2009
Final MarkExam Mark
School
vs
Province
School
vs
District
Final
Mark
q q 63.1
64.6
63.7
Number of Students
School
District
Province
School
District
Province
World
Climate
Patterns
School
DistrictEcosystems
Land and
Water Forms
Province
Subtest
School
vs
Province
School
vs
District
Public
Exam
Mark
School
District
Province
p q
q
p
p
p
p
q
58.0
55
58.8
57.2
World Geography 3202
School
District
Province
School
District
Province
Secondary &
Tertiary Activities
School
District
Written response
Units 1-5
Primary
Resource
Activities
Province
p
p
p
p
p
q
Population
Geography
School
District
Province
p q
Urban
Geography
School
District
Province
Multiple Choice
Long Answer
70.5
72.5
70.5
64.7
68.4
47.6
57.7
25.0
69.5
70.0
73.3
59.8
66.2
47.0
56.8
54.4
59.0
59.0
50.4
66.0
59.4
73.2
69.5
69.3
Average Mark, 2007-2010
2010
185
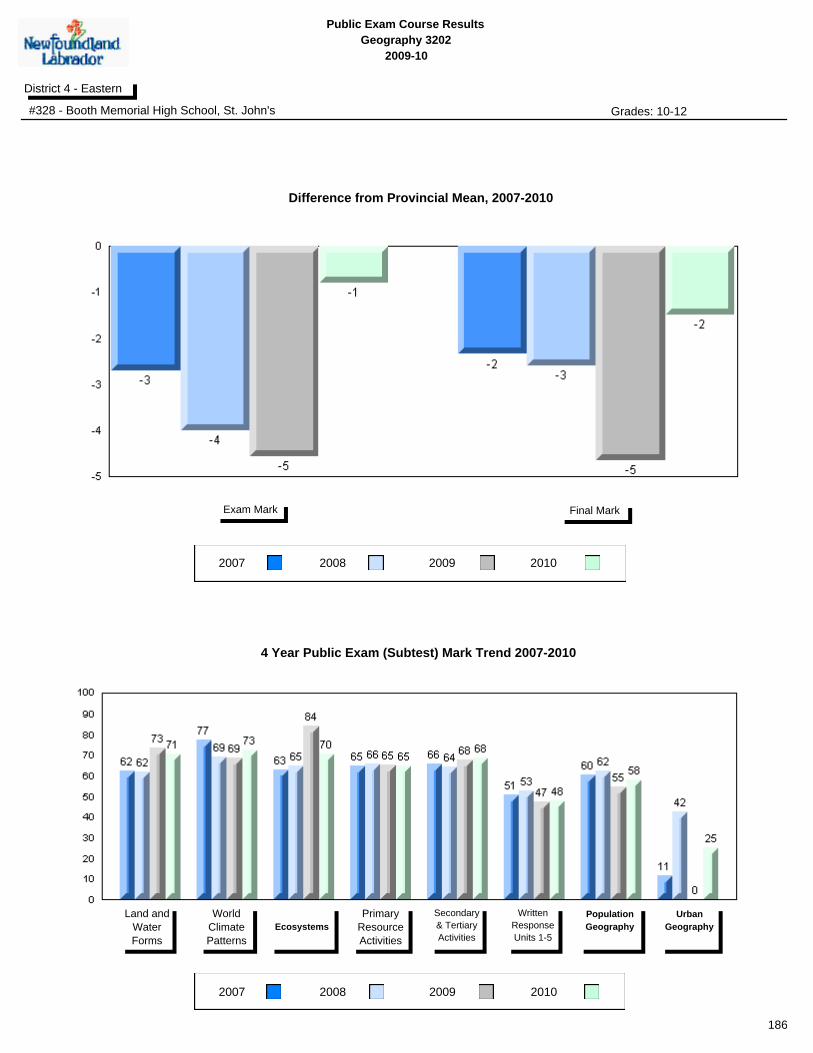
Public Exam Course Results
Geography 3202
2009-10
District 4 - Eastern
#328 - Booth Memorial High School, St. John's Grades: 10-12
2007 2008 2009
2007 2008 2009
Final MarkExam Mark
Land and
Water
Forms
World
Climate
Patterns
Ecosystems
Primary
Resource
Activities
Secondary
& Tertiary
Activities
Written
Response
Units 1-5
Population
Geography
Urban
Geography
4 Year Public Exam (Subtest) Mark Trend 2007-2010
Difference from Provincial Mean, 2007-2010
2010
2010
186

Public Exam Course Results
Geography 3202
2009-10
District 4 - Eastern
#336 - Gonzaga Regional High, St. John's Grades: 10-12
2007 2008 2009
Final MarkExam Mark
School
vs
Province
School
vs
District
Final
Mark
p p 65.6
64.6
63.7
Number of Students
School
District
Province
School
District
Province
World
Climate
Patterns
School
DistrictEcosystems
Land and
Water Forms
Province
Subtest
School
vs
Province
School
vs
District
Public
Exam
Mark
School
District
Province
p p
p
p
p
p
p
p
59.6
99
58.8
57.2
World Geography 3202
School
District
Province
School
District
Province
Secondary &
Tertiary Activities
School
District
Written response
Units 1-5
Primary
Resource
Activities
Province
p
p
p
p
p
q
Population
Geography
School
District
Province
p p
Urban
Geography
School
District
Province
Multiple Choice
Long Answer
qp
72.8
72.4
75.8
60.5
67.4
49.8
60.0
54.6
69.5
70.0
73.3
59.8
66.2
47.0
56.8
54.4
59.0
59.0
50.4
66.0
59.4
73.2
69.5
69.3
Average Mark, 2007-2010
2010
187
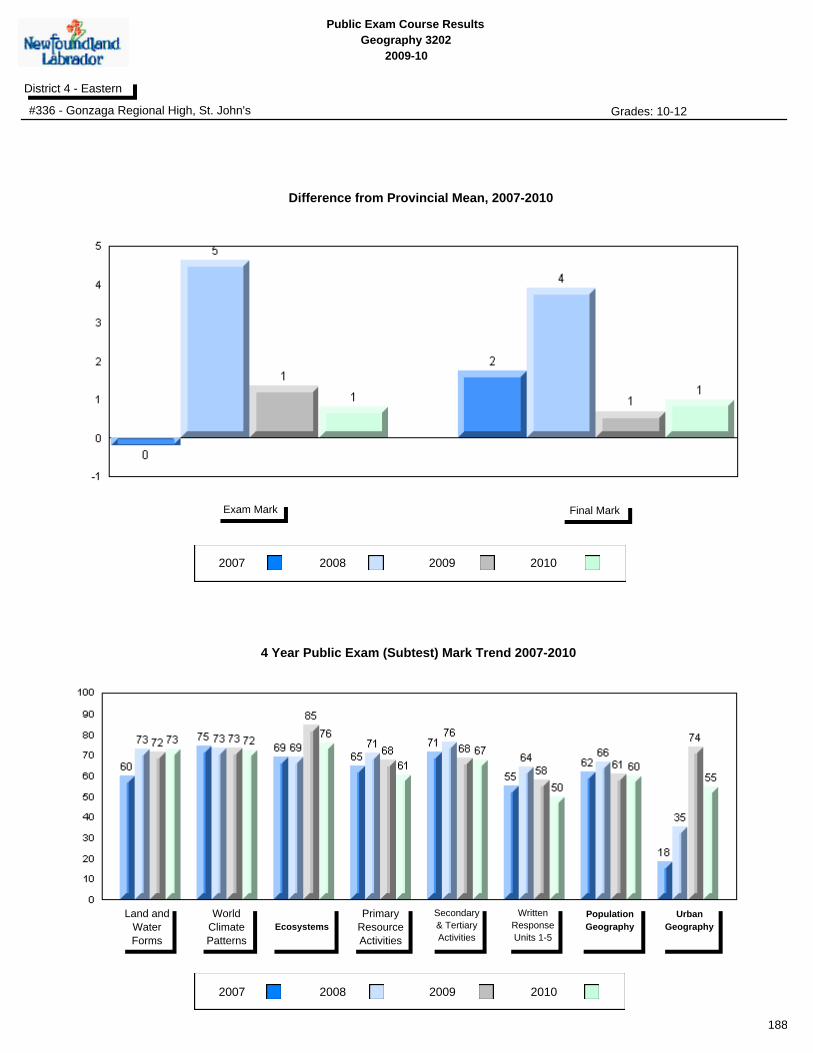
Public Exam Course Results
Geography 3202
2009-10
District 4 - Eastern
#336 - Gonzaga Regional High, St. John's Grades: 10-12
2007 2008 2009
2007 2008 2009
Final MarkExam Mark
Land and
Water
Forms
World
Climate
Patterns
Ecosystems
Primary
Resource
Activities
Secondary
& Tertiary
Activities
Written
Response
Units 1-5
Population
Geography
Urban
Geography
4 Year Public Exam (Subtest) Mark Trend 2007-2010
Difference from Provincial Mean, 2007-2010
2010
2010
188

Public Exam Course Results
Geography 3202
2009-10
District 4 - Eastern
#340 - Holy Heart of Mary Regional High, St. John's Grades: 10-12
2007 2008 2009
Final MarkExam Mark
School
vs
Province
School
vs
District
Final
Mark
q q 58.9
64.6
63.7
Number of Students
School
District
Province
School
District
Province
World
Climate
Patterns
School
DistrictEcosystems
Land and
Water Forms
Province
Subtest
School
vs
Province
School
vs
District
Public
Exam
Mark
School
District
Province
q q
q
q
q
p
q
q
51.8
128
58.8
57.2
World Geography 3202
School
District
Province
School
District
Province
Secondary &
Tertiary Activities
School
District
Written response
Units 1-5
Primary
Resource
Activities
Province
q
q
q
q
q
q
Population
Geography
School
District
Province
q q
Urban
Geography
School
District
Province
Multiple Choice
Long Answer
66.2
64.6
67.8
53.4
57.3
41.4
53.5
41.4
69.5
70.0
73.3
59.8
66.2
47.0
56.8
54.4
59.0
59.0
50.4
66.0
59.4
73.2
69.5
69.3
Average Mark, 2007-2010
2010
189
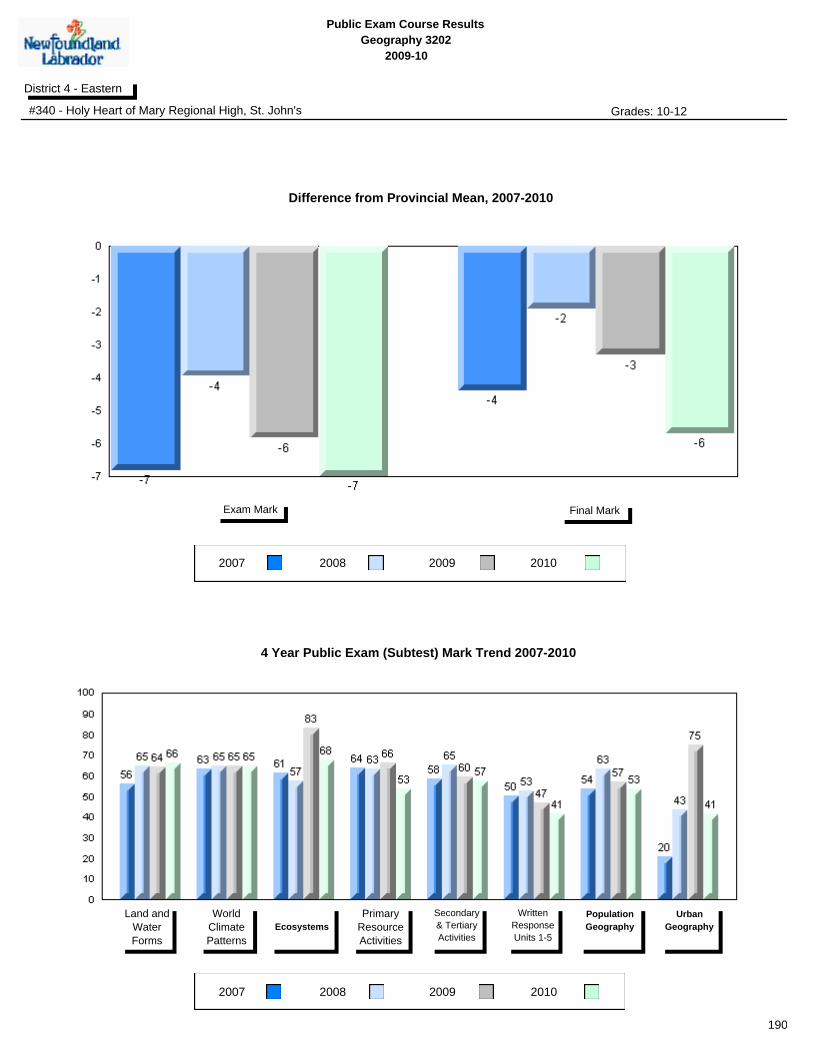
Public Exam Course Results
Geography 3202
2009-10
District 4 - Eastern
#340 - Holy Heart of Mary Regional High, St. John's Grades: 10-12
2007 2008 2009
2007 2008 2009
Final MarkExam Mark
Land and
Water
Forms
World
Climate
Patterns
Ecosystems
Primary
Resource
Activities
Secondary
& Tertiary
Activities
Written
Response
Units 1-5
Population
Geography
Urban
Geography
4 Year Public Exam (Subtest) Mark Trend 2007-2010
Difference from Provincial Mean, 2007-2010
2010
2010
190
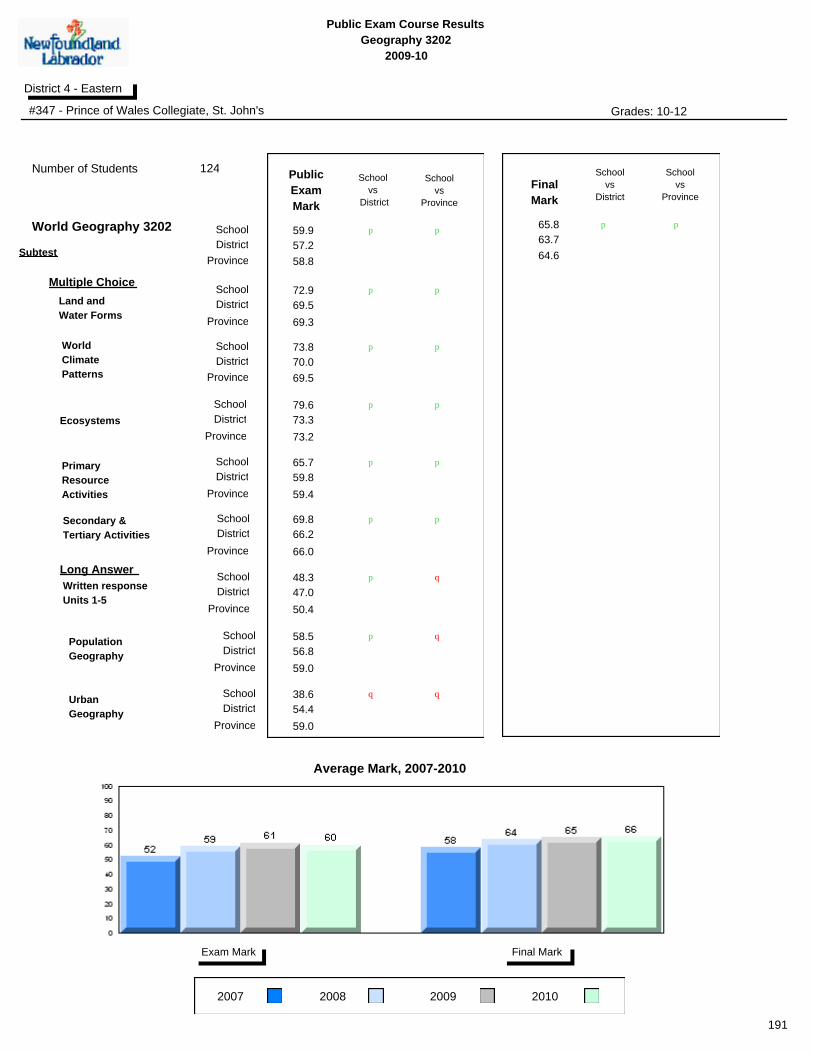
Public Exam Course Results
Geography 3202
2009-10
District 4 - Eastern
#347 - Prince of Wales Collegiate, St. John's Grades: 10-12
2007 2008 2009
Final MarkExam Mark
School
vs
Province
School
vs
District
Final
Mark
p p 65.8
64.6
63.7
Number of Students
School
District
Province
School
District
Province
World
Climate
Patterns
School
DistrictEcosystems
Land and
Water Forms
Province
Subtest
School
vs
Province
School
vs
District
Public
Exam
Mark
School
District
Province
p p
p
p
p
p
p
p
59.9
124
58.8
57.2
World Geography 3202
School
District
Province
School
District
Province
Secondary &
Tertiary Activities
School
District
Written response
Units 1-5
Primary
Resource
Activities
Province
p
p
p
p
p
q
Population
Geography
School
District
Province
p q
Urban
Geography
School
District
Province
Multiple Choice
Long Answer
72.9
73.8
79.6
65.7
69.8
48.3
58.5
38.6
69.5
70.0
73.3
59.8
66.2
47.0
56.8
54.4
59.0
59.0
50.4
66.0
59.4
73.2
69.5
69.3
Average Mark, 2007-2010
2010
191
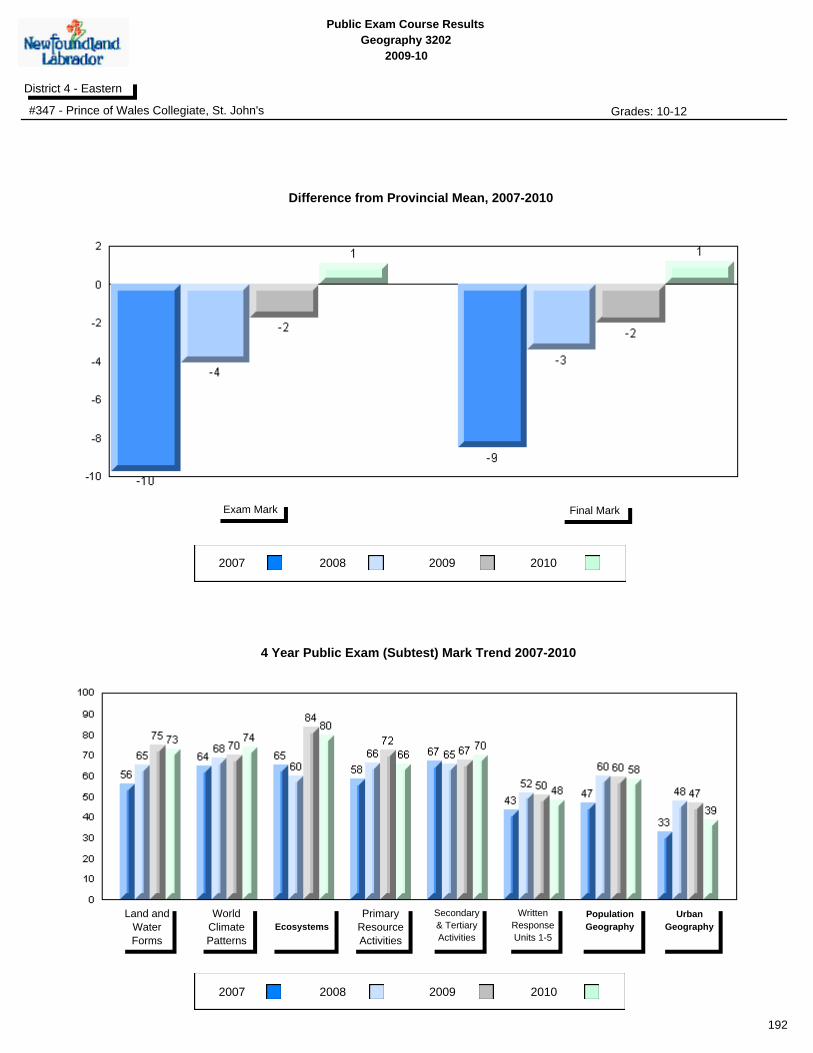
Public Exam Course Results
Geography 3202
2009-10
District 4 - Eastern
#347 - Prince of Wales Collegiate, St. John's Grades: 10-12
2007 2008 2009
2007 2008 2009
Final MarkExam Mark
Land and
Water
Forms
World
Climate
Patterns
Ecosystems
Primary
Resource
Activities
Secondary
& Tertiary
Activities
Written
Response
Units 1-5
Population
Geography
Urban
Geography
4 Year Public Exam (Subtest) Mark Trend 2007-2010
Difference from Provincial Mean, 2007-2010
2010
2010
192

Public Exam Course Results
Geography 3202
2009-10
District 4 - Eastern
#354 - St. Kevin's High, St. John's (Goulds) Grades: 10-12
2007 2008 2009
Final MarkExam Mark
School
vs
Province
School
vs
District
Final
Mark
q q 60.9
64.6
63.7
Number of Students
School
District
Province
School
District
Province
World
Climate
Patterns
School
DistrictEcosystems
Land and
Water Forms
Province
Subtest
School
vs
Province
School
vs
District
Public
Exam
Mark
School
District
Province
q q
q
q
q
p
q
q
53.4
50
58.8
57.2
World Geography 3202
School
District
Province
School
District
Province
Secondary &
Tertiary Activities
School
District
Written response
Units 1-5
Primary
Resource
Activities
Province
q
q
q
q
q
q
Population
Geography
School
District
Province
q q
Urban
Geography
School
District
Province
Multiple Choice
Long Answer
qppq
66.0
68.4
72.5
56.0
58.0
44.3
51.9
69.5
70.0
73.3
59.8
66.2
47.0
56.8
54.4
59.0
59.0
50.4
66.0
59.4
73.2
69.5
69.3
Average Mark, 2007-2010
2010
193
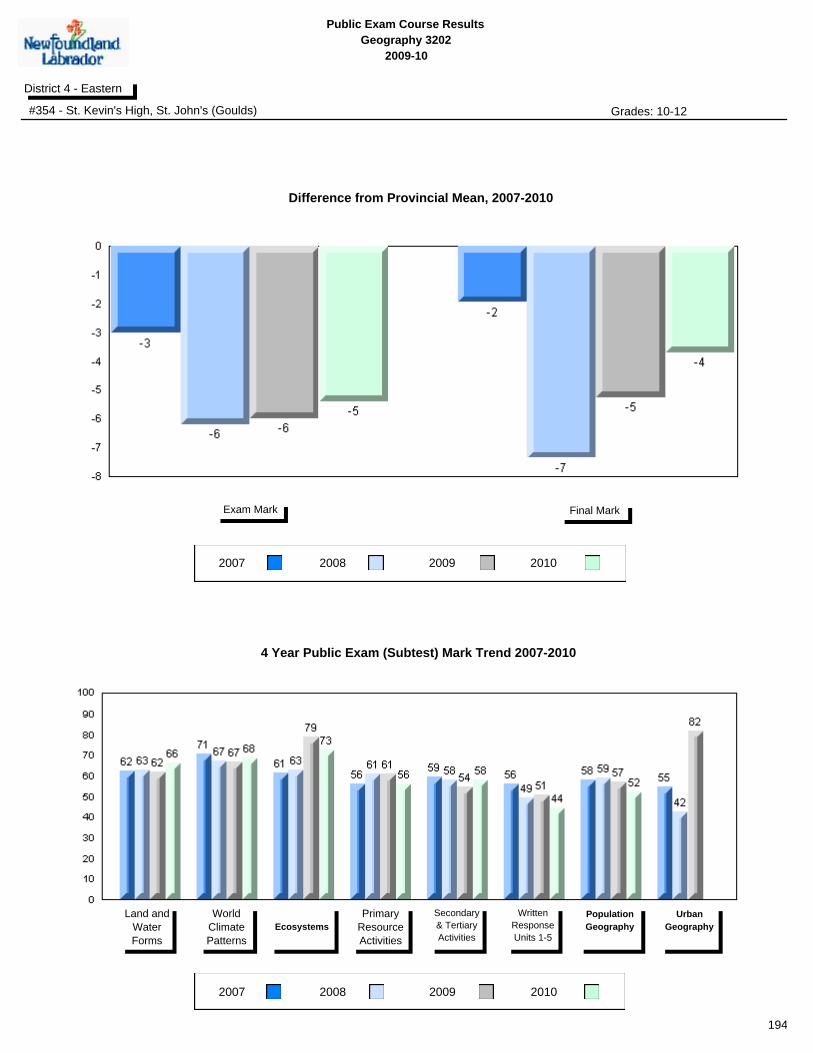
Public Exam Course Results
Geography 3202
2009-10
District 4 - Eastern
#354 - St. Kevin's High, St. John's (Goulds) Grades: 10-12
2007 2008 2009
2007 2008 2009
Final MarkExam Mark
Land and
Water
Forms
World
Climate
Patterns
Ecosystems
Primary
Resource
Activities
Secondary
& Tertiary
Activities
Written
Response
Units 1-5
Population
Geography
Urban
Geography
4 Year Public Exam (Subtest) Mark Trend 2007-2010
Difference from Provincial Mean, 2007-2010
2010
2010
194

Public Exam Course Results
Geography 3202
2009-10
District 4 - Eastern
#368 - Holy Trinity High, Torbay Grades: 7-12
2007 2008 2009
Final MarkExam Mark
School
vs
Province
School
vs
District
Final
Mark
p q 64.3
64.6
63.7
Number of Students
School
District
Province
School
District
Province
World
Climate
Patterns
School
DistrictEcosystems
Land and
Water Forms
Province
Subtest
School
vs
Province
School
vs
District
Public
Exam
Mark
School
District
Province
q q
q
q
p
p
p
q
56.2
56
58.8
57.2
World Geography 3202
School
District
Province
School
District
Province
Secondary &
Tertiary Activities
School
District
Written response
Units 1-5
Primary
Resource
Activities
Province
q
q
p
q
q
q
Population
Geography
School
District
Province
p q
Urban
Geography
School
District
Province
Multiple Choice
Long Answer
65.7
62.3
76.8
57.5
64.3
47.1
57.7
47.1
69.5
70.0
73.3
59.8
66.2
47.0
56.8
54.4
59.0
59.0
50.4
66.0
59.4
73.2
69.5
69.3
Average Mark, 2007-2010
2010
195
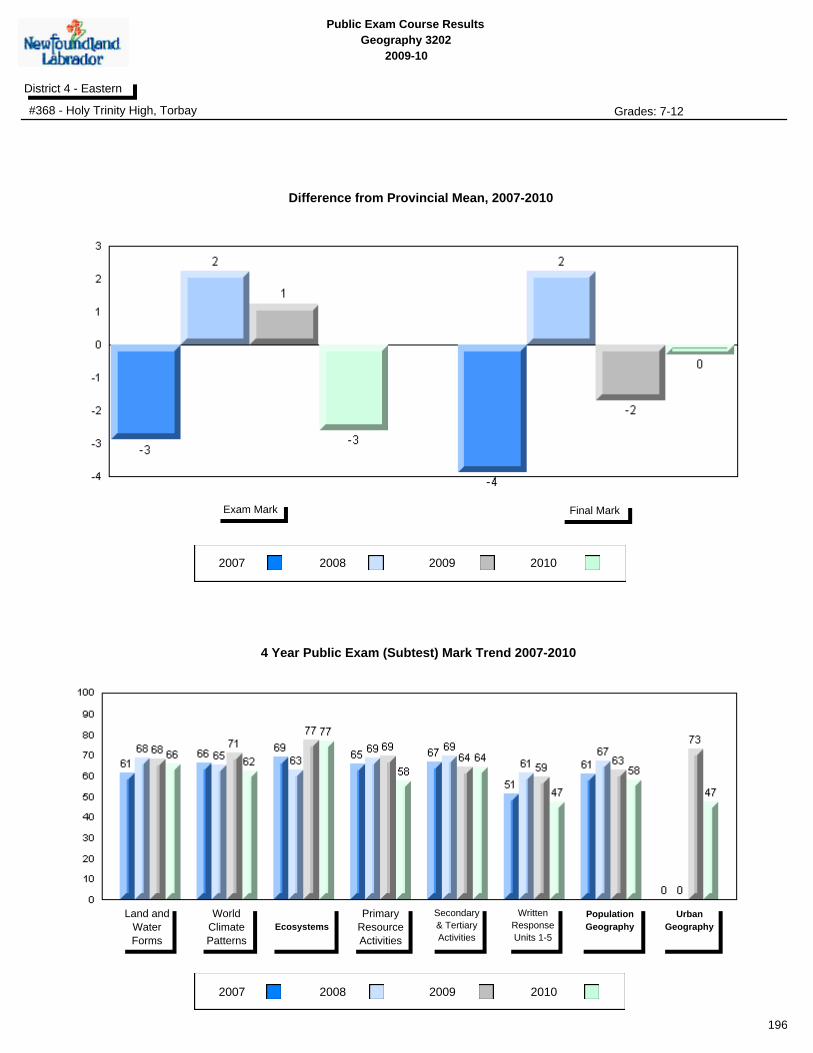
Public Exam Course Results
Geography 3202
2009-10
District 4 - Eastern
#368 - Holy Trinity High, Torbay Grades: 7-12
2007 2008 2009
2007 2008 2009
Final MarkExam Mark
Land and
Water
Forms
World
Climate
Patterns
Ecosystems
Primary
Resource
Activities
Secondary
& Tertiary
Activities
Written
Response
Units 1-5
Population
Geography
Urban
Geography
4 Year Public Exam (Subtest) Mark Trend 2007-2010
Difference from Provincial Mean, 2007-2010
2010
2010
196

Public Exam Course Results
Geography 3202
2009-10
District 4 - Eastern
#427 - Holy Name of Mary Academy, Lawn Grades: K-12
2007 2008 2009
Final MarkExam Mark
School
vs
Province
School
vs
District
Final
Mark
q q 38.0
64.6
63.7
Number of Students
School
District
Province
School
District
Province
World
Climate
Patterns
School
DistrictEcosystems
Land and
Water Forms
Province
Subtest
School
vs
Province
School
vs
District
Public
Exam
Mark
School
District
Province
q q
q
q
p p
q
q
43.0
1
58.8
57.2
World Geography 3202
School
District
Province
School
District
Province
Secondary &
Tertiary Activities
School
District
Written response
Units 1-5
Primary
Resource
Activities
Province
q
q
q
q
q
q
Population
Geography
School
District
Province
q q
Urban
Geography
School
District
Province
Multiple Choice
Long Answer
qppq
77.8
66.7
50.0
40.0
50.0
29.2
40.9
69.5
70.0
73.3
59.8
66.2
47.0
56.8
54.4
59.0
59.0
50.4
66.0
59.4
73.2
69.5
69.3
Average Mark, 2007-2010
2010
School data with 5 or fewer
students withheld for reasons of
confidentiality.
School data with 5 or fewer
students withheld for reasons of
confidentiality.
School data with 5 or fewer students withheld for reasons of confidentiality.
197

Public Exam Course Results
Geography 3202
2009-10
District 4 - Eastern
#427 - Holy Name of Mary Academy, Lawn Grades: K-12
2007 2008 2009
2007 2008 2009
Final MarkExam Mark
Land and
Water
Forms
World
Climate
Patterns
Ecosystems
Primary
Resource
Activities
Secondary
& Tertiary
Activities
Written
Response
Units 1-5
Population
Geography
Urban
Geography
4 Year Public Exam (Subtest) Mark Trend 2007-2010
Difference from Provincial Mean, 2007-2010
2010
2010
School data with 5 or fewer students withheld for reasons of confidentiality.
School data with 5 or fewer students withheld for reasons of confidentiality.
198

Public Exam Course Results
Geography 3202
2009-10
District 4 - Eastern
#430 - St. Mark's School, King's Cove Grades: K-12
2007 2008 2009
Final MarkExam Mark
School
vs
Province
School
vs
District
Final
Mark
q q 46.0
64.6
63.7
Number of Students
School
District
Province
School
District
Province
World
Climate
Patterns
School
DistrictEcosystems
Land and
Water Forms
Province
Subtest
School
vs
Province
School
vs
District
Public
Exam
Mark
School
District
Province
q q
q
q
q
q
q
q
51.0
1
58.8
57.2
World Geography 3202
School
District
Province
School
District
Province
Secondary &
Tertiary Activities
School
District
Written response
Units 1-5
Primary
Resource
Activities
Province
q
p
p
p
p
q
Population
Geography
School
District
Province
qp pq
Urban
Geography
School
District
Province
Multiple Choice
Long Answer
qppq
55.6
66.7
50.0
70.0
70.0
40.3
69.5
70.0
73.3
59.8
66.2
47.0
56.8
54.4
59.0
59.0
50.4
66.0
59.4
73.2
69.5
69.3
Average Mark, 2007-2010
2010
School data with 5 or fewer
students withheld for reasons of
confidentiality.
School data with 5 or fewer
students withheld for reasons of
confidentiality.
School data with 5 or fewer students withheld for reasons of confidentiality.
199

Public Exam Course Results
Geography 3202
2009-10
District 4 - Eastern
#430 - St. Mark's School, King's Cove Grades: K-12
2007 2008 2009
2007 2008 2009
Final MarkExam Mark
Land and
Water
Forms
World
Climate
Patterns
Ecosystems
Primary
Resource
Activities
Secondary
& Tertiary
Activities
Written
Response
Units 1-5
Population
Geography
Urban
Geography
4 Year Public Exam (Subtest) Mark Trend 2007-2010
Difference from Provincial Mean, 2007-2010
2010
2010
School data with 5 or fewer students withheld for reasons of confidentiality.
School data with 5 or fewer students withheld for reasons of confidentiality.
200
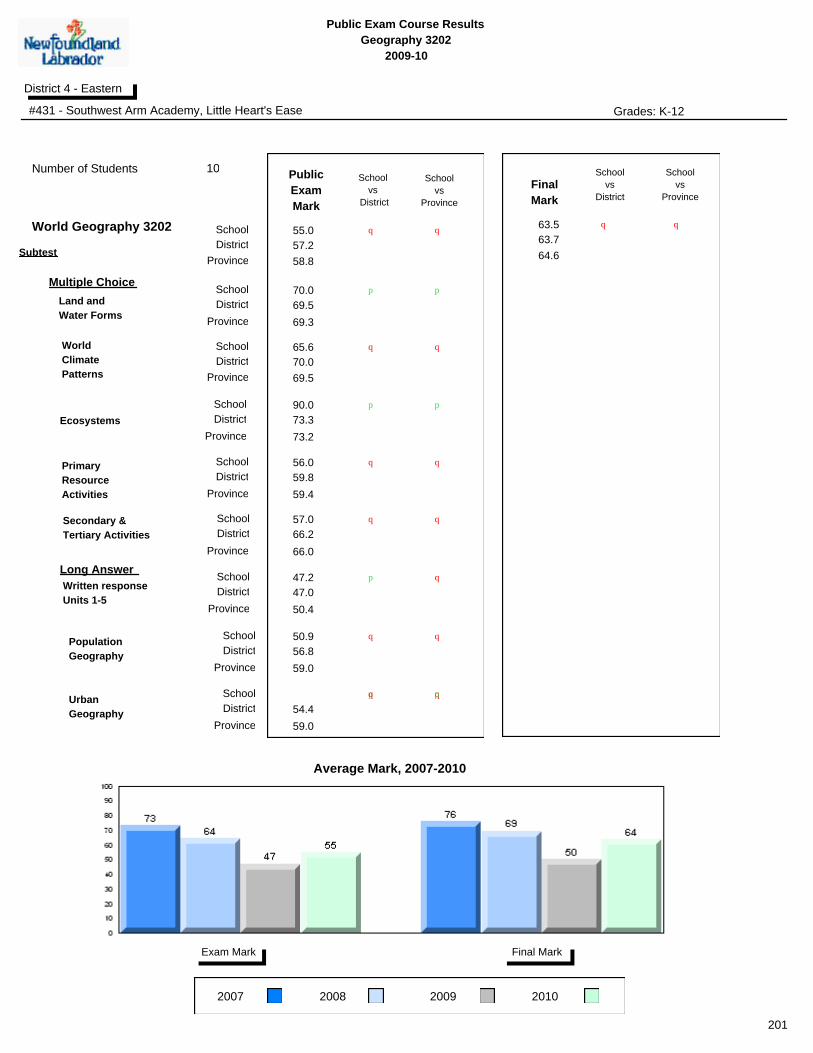
Public Exam Course Results
Geography 3202
2009-10
District 4 - Eastern
#431 - Southwest Arm Academy, Little Heart's Ease Grades: K-12
2007 2008 2009
Final MarkExam Mark
School
vs
Province
School
vs
District
Final
Mark
q q 63.5
64.6
63.7
Number of Students
School
District
Province
School
District
Province
World
Climate
Patterns
School
DistrictEcosystems
Land and
Water Forms
Province
Subtest
School
vs
Province
School
vs
District
Public
Exam
Mark
School
District
Province
q q
q
p
p
p
p
q
55.0
10
58.8
57.2
World Geography 3202
School
District
Province
School
District
Province
Secondary &
Tertiary Activities
School
District
Written response
Units 1-5
Primary
Resource
Activities
Province
q
q
p
q
q
q
Population
Geography
School
District
Province
q q
Urban
Geography
School
District
Province
Multiple Choice
Long Answer
qppq
70.0
65.6
90.0
56.0
57.0
47.2
50.9
69.5
70.0
73.3
59.8
66.2
47.0
56.8
54.4
59.0
59.0
50.4
66.0
59.4
73.2
69.5
69.3
Average Mark, 2007-2010
2010
201
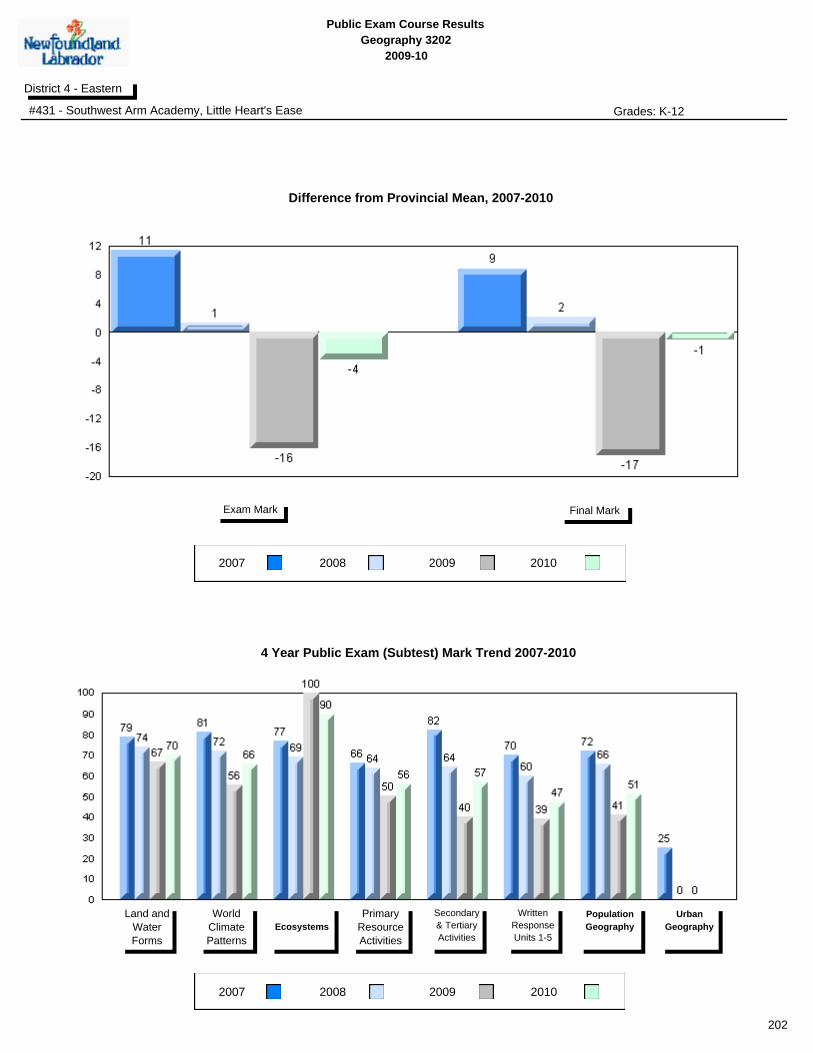
Public Exam Course Results
Geography 3202
2009-10
District 4 - Eastern
#431 - Southwest Arm Academy, Little Heart's Ease Grades: K-12
2007 2008 2009
2007 2008 2009
Final MarkExam Mark
Land and
Water
Forms
World
Climate
Patterns
Ecosystems
Primary
Resource
Activities
Secondary
& Tertiary
Activities
Written
Response
Units 1-5
Population
Geography
Urban
Geography
4 Year Public Exam (Subtest) Mark Trend 2007-2010
Difference from Provincial Mean, 2007-2010
2010
2010
202
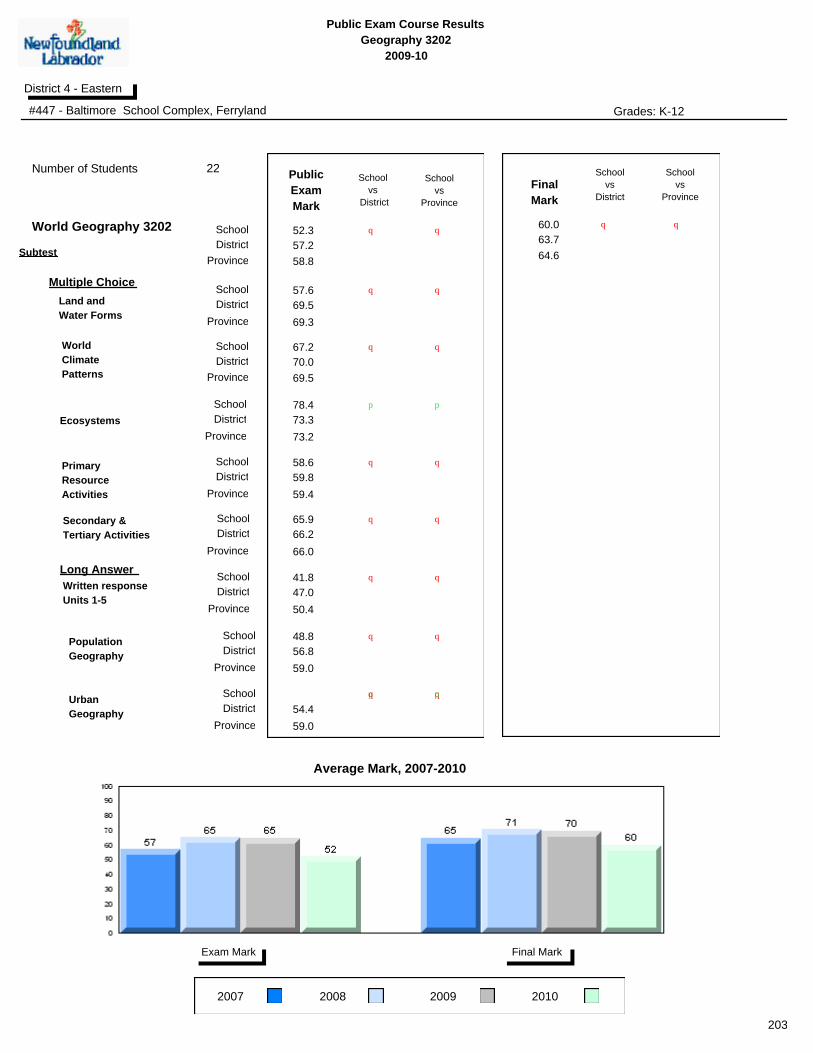
Public Exam Course Results
Geography 3202
2009-10
District 4 - Eastern
#447 - Baltimore School Complex, Ferryland Grades: K-12
2007 2008 2009
Final MarkExam Mark
School
vs
Province
School
vs
District
Final
Mark
q q 60.0
64.6
63.7
Number of Students
School
District
Province
School
District
Province
World
Climate
Patterns
School
DistrictEcosystems
Land and
Water Forms
Province
Subtest
School
vs
Province
School
vs
District
Public
Exam
Mark
School
District
Province
q q
q
q
p p
q
q
52.3
22
58.8
57.2
World Geography 3202
School
District
Province
School
District
Province
Secondary &
Tertiary Activities
School
District
Written response
Units 1-5
Primary
Resource
Activities
Province
q
q
q
q
q
q
Population
Geography
School
District
Province
q q
Urban
Geography
School
District
Province
Multiple Choice
Long Answer
qppq
57.6
67.2
78.4
58.6
65.9
41.8
48.8
69.5
70.0
73.3
59.8
66.2
47.0
56.8
54.4
59.0
59.0
50.4
66.0
59.4
73.2
69.5
69.3
Average Mark, 2007-2010
2010
203
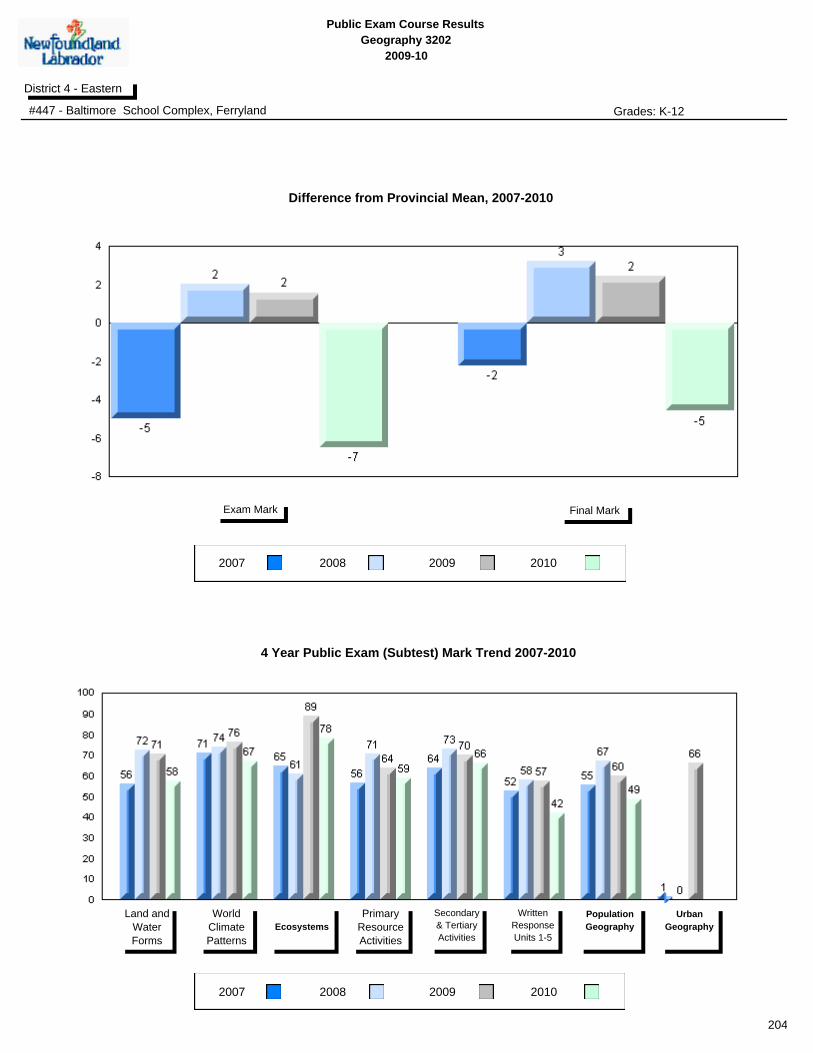
Public Exam Course Results
Geography 3202
2009-10
District 4 - Eastern
#447 - Baltimore School Complex, Ferryland Grades: K-12
2007 2008 2009
2007 2008 2009
Final MarkExam Mark
Land and
Water
Forms
World
Climate
Patterns
Ecosystems
Primary
Resource
Activities
Secondary
& Tertiary
Activities
Written
Response
Units 1-5
Population
Geography
Urban
Geography
4 Year Public Exam (Subtest) Mark Trend 2007-2010
Difference from Provincial Mean, 2007-2010
2010
2010
204

Public Exam Course Results
Geography 3202
2009-10
District 4 - Eastern
#464 - Crescent Collegiate, Blaketown Grades: 7-12
2007 2008 2009
Final MarkExam Mark
School
vs
Province
School
vs
District
Final
Mark
q q 61.3
64.6
63.7
Number of Students
School
District
Province
School
District
Province
World
Climate
Patterns
School
DistrictEcosystems
Land and
Water Forms
Province
Subtest
School
vs
Province
School
vs
District
Public
Exam
Mark
School
District
Province
q q
q
q
q
p
q
q
57.0
43
58.8
57.2
World Geography 3202
School
District
Province
School
District
Province
Secondary &
Tertiary Activities
School
District
Written response
Units 1-5
Primary
Resource
Activities
Province
q
q
p
q
q
q
Population
Geography
School
District
Province
q q
Urban
Geography
School
District
Province
Multiple Choice
Long Answer
qppq
68.2
69.0
70.9
57.9
65.6
48.2
54.5
69.5
70.0
73.3
59.8
66.2
47.0
56.8
54.4
59.0
59.0
50.4
66.0
59.4
73.2
69.5
69.3
Average Mark, 2007-2010
2010
205
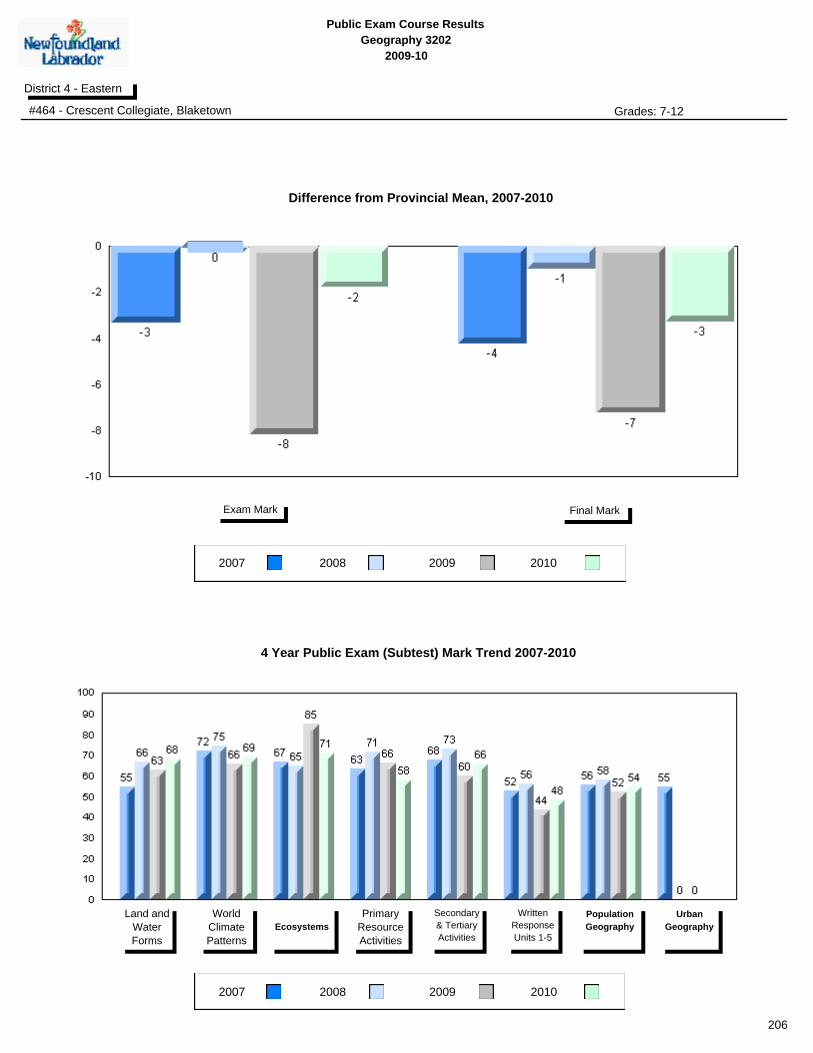
Public Exam Course Results
Geography 3202
2009-10
District 4 - Eastern
#464 - Crescent Collegiate, Blaketown Grades: 7-12
2007 2008 2009
2007 2008 2009
Final MarkExam Mark
Land and
Water
Forms
World
Climate
Patterns
Ecosystems
Primary
Resource
Activities
Secondary
& Tertiary
Activities
Written
Response
Units 1-5
Population
Geography
Urban
Geography
4 Year Public Exam (Subtest) Mark Trend 2007-2010
Difference from Provincial Mean, 2007-2010
2010
2010
206

Public Exam Course Results
Geography 3202
2009-10
District 4 - Eastern
#476 - Baccalieu Collegiate, Old Perlican Grades: 7-12
2007 2008 2009
Final MarkExam Mark
School
vs
Province
School
vs
District
Final
Mark
p p 68.3
64.6
63.7
Number of Students
School
District
Province
School
District
Province
World
Climate
Patterns
School
DistrictEcosystems
Land and
Water Forms
Province
Subtest
School
vs
Province
School
vs
District
Public
Exam
Mark
School
District
Province
p p
q
q
q
p
q
q
62.5
6
58.8
57.2
World Geography 3202
School
District
Province
School
District
Province
Secondary &
Tertiary Activities
School
District
Written response
Units 1-5
Primary
Resource
Activities
Province
q
p
p
p
p
q
Population
Geography
School
District
Province
p p
Urban
Geography
School
District
Province
Multiple Choice
Long Answer
qppq
68.5
64.8
70.8
50.0
80.0
60.9
59.1
69.5
70.0
73.3
59.8
66.2
47.0
56.8
54.4
59.0
59.0
50.4
66.0
59.4
73.2
69.5
69.3
Average Mark, 2007-2010
2010
207
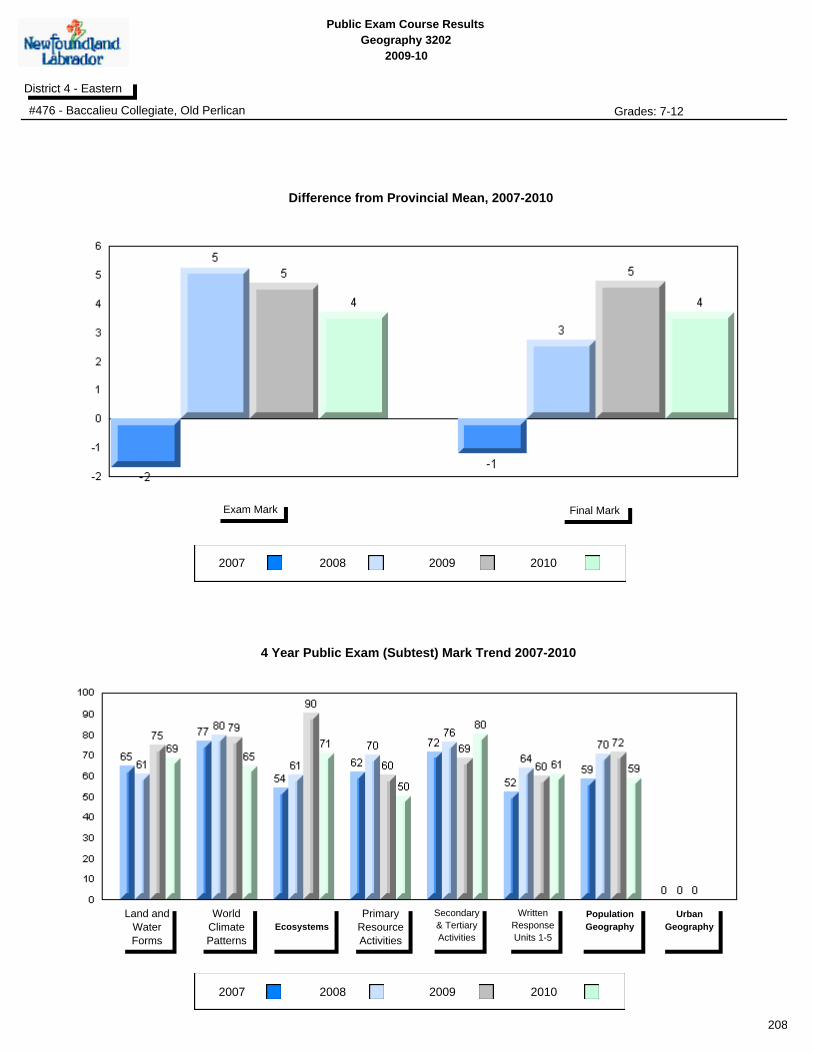
Public Exam Course Results
Geography 3202
2009-10
District 4 - Eastern
#476 - Baccalieu Collegiate, Old Perlican Grades: 7-12
2007 2008 2009
2007 2008 2009
Final MarkExam Mark
Land and
Water
Forms
World
Climate
Patterns
Ecosystems
Primary
Resource
Activities
Secondary
& Tertiary
Activities
Written
Response
Units 1-5
Population
Geography
Urban
Geography
4 Year Public Exam (Subtest) Mark Trend 2007-2010
Difference from Provincial Mean, 2007-2010
2010
2010
208

Public Exam Course Results
Geography 3202
2009-10
District 4 - Eastern
#924 - Tricentia Academy, Arnold's Cove Grades: K-12
2007 2008 2009
Final MarkExam Mark
School
vs
Province
School
vs
District
Final
Mark
p p 66.9
64.6
63.7
Number of Students
School
District
Province
School
District
Province
World
Climate
Patterns
School
DistrictEcosystems
Land and
Water Forms
Province
Subtest
School
vs
Province
School
vs
District
Public
Exam
Mark
School
District
Province
p p
q
p
p
p
p
q
59.2
20
58.8
57.2
World Geography 3202
School
District
Province
School
District
Province
Secondary &
Tertiary Activities
School
District
Written response
Units 1-5
Primary
Resource
Activities
Province
q
p
p
p
p
q
Population
Geography
School
District
Province
q q
Urban
Geography
School
District
Province
Multiple Choice
Long Answer
qppq
70.6
68.3
73.8
58.5
71.5
51.4
56.4
69.5
70.0
73.3
59.8
66.2
47.0
56.8
54.4
59.0
59.0
50.4
66.0
59.4
73.2
69.5
69.3
Average Mark, 2007-2010
2010
209
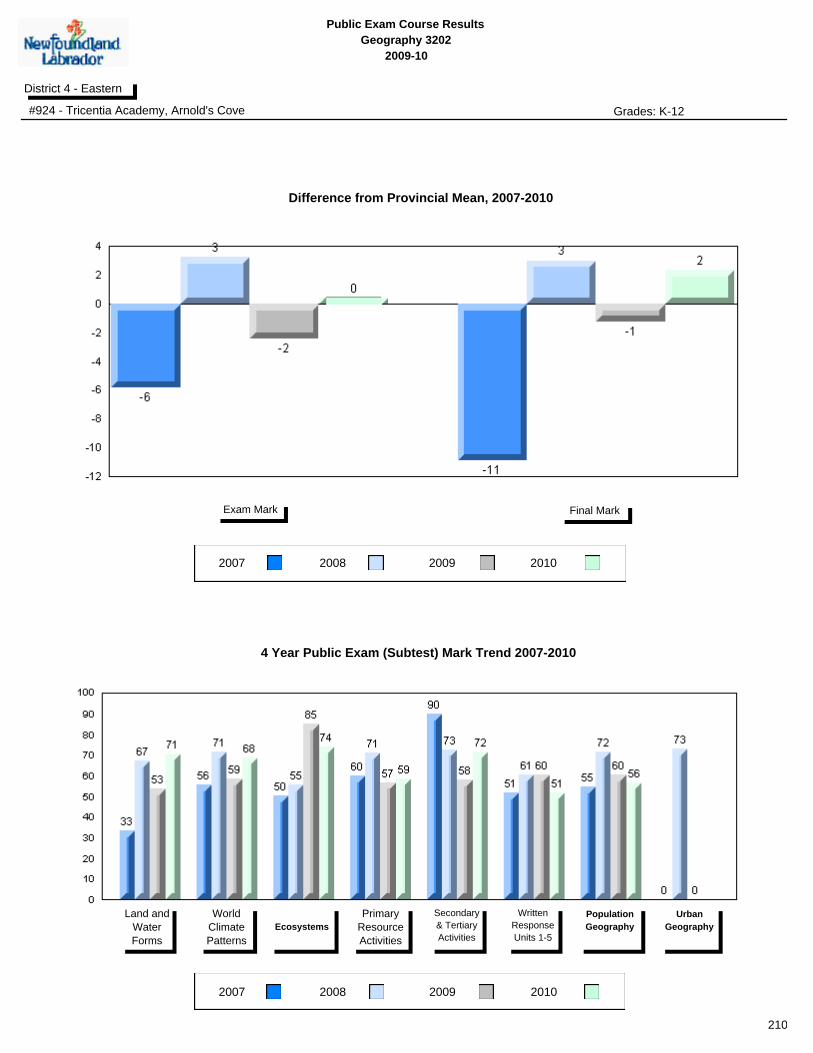
Public Exam Course Results
Geography 3202
2009-10
District 4 - Eastern
#924 - Tricentia Academy, Arnold's Cove Grades: K-12
2007 2008 2009
2007 2008 2009
Final MarkExam Mark
Land and
Water
Forms
World
Climate
Patterns
Ecosystems
Primary
Resource
Activities
Secondary
& Tertiary
Activities
Written
Response
Units 1-5
Population
Geography
Urban
Geography
4 Year Public Exam (Subtest) Mark Trend 2007-2010
Difference from Provincial Mean, 2007-2010
2010
2010
210

Public Exam Course Results
Geography 3202
2009-10
District 803 - Private
#374 - Brother T. I. Murphy, St. John's Grades: Other
2007 2008 2009
Final MarkExam Mark
School
vs
Province
School
vs
District
Final
Mark
p q 61.5
64.6
61.5
Number of Students
School
District
Province
School
District
Province
World
Climate
Patterns
School
DistrictEcosystems
Land and
Water Forms
Province
Subtest
School
vs
Province
School
vs
District
Public
Exam
Mark
School
District
Province
p q
p
p
p
p
q
q
52.4
12
58.8
52.4
World Geography 3202
School
District
Province
School
District
Province
Secondary &
Tertiary Activities
School
District
Written response
Units 1-5
Primary
Resource
Activities
Province
q
p
p
q
q
q
Population
Geography
School
District
Province
p q
Urban
Geography
School
District
Province
Multiple Choice
Long Answer
qppq
63.9
65.7
64.6
55.0
58.3
41.1
58.5
62.4
65.0
61.5
51.5
58.5
40.3
56.0
59.0
59.0
50.4
66.0
59.4
73.2
69.5
69.3
Average Mark, 2007-2010
2010
211
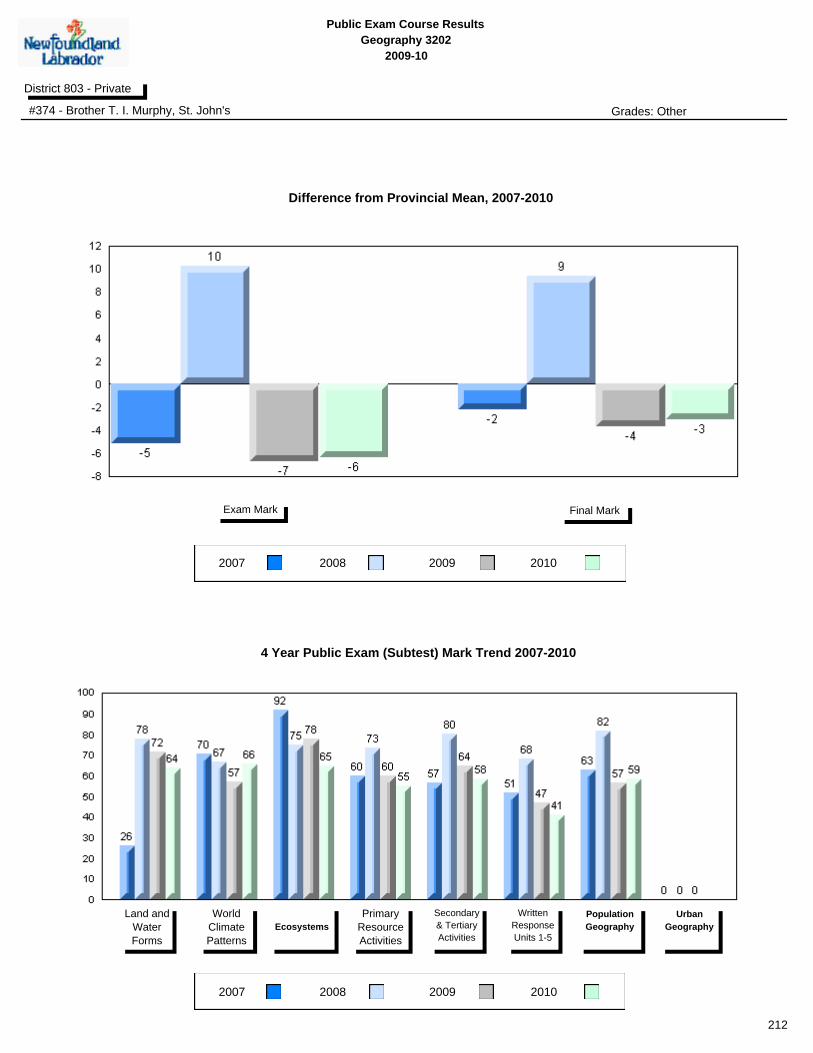
Public Exam Course Results
Geography 3202
2009-10
District 803 - Private
#374 - Brother T. I. Murphy, St. John's Grades: Other
2007 2008 2009
2007 2008 2009
Final MarkExam Mark
Land and
Water
Forms
World
Climate
Patterns
Ecosystems
Primary
Resource
Activities
Secondary
& Tertiary
Activities
Written
Response
Units 1-5
Population
Geography
Urban
Geography
4 Year Public Exam (Subtest) Mark Trend 2007-2010
Difference from Provincial Mean, 2007-2010
2010
2010
212

Public Exam Course Results
Geography 3202
2009-10
District 804 - Native Federal
#376 - Se't Anneway Kegnamogwom, Conne River Grades: K-12
2007 2008 2009
Final MarkExam Mark
School
vs
Province
School
vs
District
Final
Mark
p q 48.9
64.6
48.9
Number of Students
School
District
Province
School
District
Province
World
Climate
Patterns
School
DistrictEcosystems
Land and
Water Forms
Province
Subtest
School
vs
Province
School
vs
District
Public
Exam
Mark
School
District
Province
p q
p
p
p
q
q
q
41.3
11
58.8
41.3
World Geography 3202
School
District
Province
School
District
Province
Secondary &
Tertiary Activities
School
District
Written response
Units 1-5
Primary
Resource
Activities
Province
p
p
p
q
q
q
Population
Geography
School
District
Province
p q
Urban
Geography
School
District
Province
Multiple Choice
Long Answer
qp
46.5
53.5
70.5
46.4
42.7
33.6
36.9
49.2
46.5
53.5
70.5
46.4
42.7
33.6
36.9
49.2
59.0
59.0
50.4
66.0
59.4
73.2
69.5
69.3
Average Mark, 2007-2010
2010
213
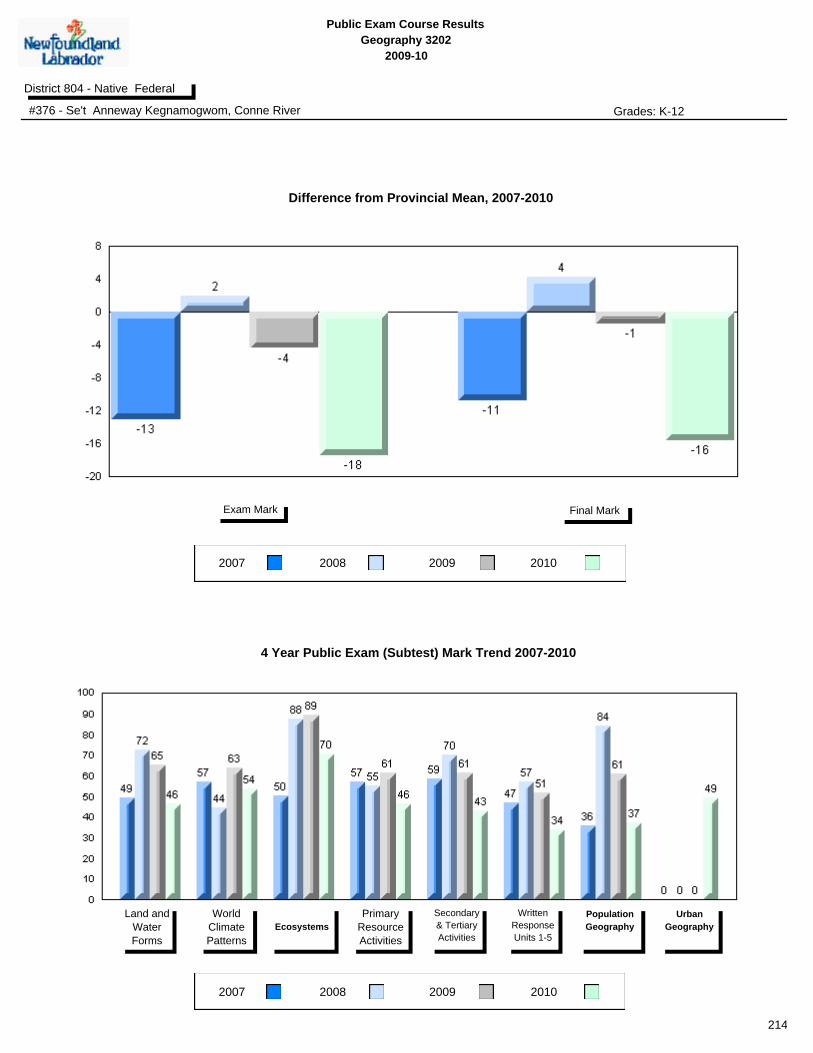
Public Exam Course Results
Geography 3202
2009-10
District 804 - Native Federal
#376 - Se't Anneway Kegnamogwom, Conne River Grades: K-12
2007 2008 2009
2007 2008 2009
Final MarkExam Mark
Land and
Water
Forms
World
Climate
Patterns
Ecosystems
Primary
Resource
Activities
Secondary
& Tertiary
Activities
Written
Response
Units 1-5
Population
Geography
Urban
Geography
4 Year Public Exam (Subtest) Mark Trend 2007-2010
Difference from Provincial Mean, 2007-2010
2010
2010
214