Embed Size (px)
Citation preview
Geography and climate
Statistical Yearbook 2011
Geography and climate
Geography
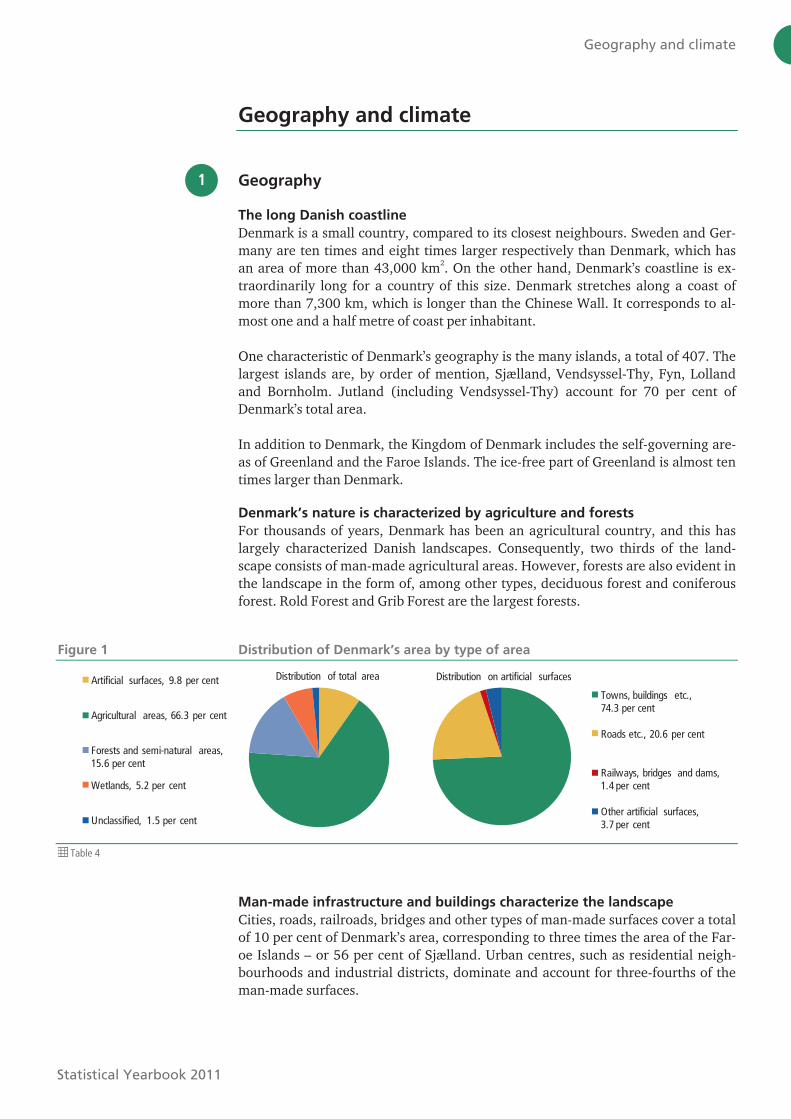
The long Danish coastline
Denmark is a small country, compared to its closest neighbours. Sweden and Ger-
many are ten times and eight times larger respectively than Denmark, which has
an area of more than 43,000 km2. On the other hand, Denmark’s coastline is ex-
traordinarily long for a country of this size. Denmark stretches along a coast of
more than 7,300 km, which is longer than the Chinese Wall. It corresponds to al-
most one and a half metre of coast per inhabitant.
One characteristic of Denmark’s geography is the many islands, a total of 407. The
largest islands are, by order of mention, Sjælland, Vendsyssel-Thy, Fyn, Lolland
and Bornholm. Jutland (including Vendsyssel-Thy) account for 70 per cent of
Denmark’s total area.
In addition to Denmark, the Kingdom of Denmark includes the self-governing are-
as of Greenland and the Faroe Islands. The ice-free part of Greenland is almost ten
times larger than Denmark.
Denmark’s nature is characterized by agriculture and forests
For thousands of years, Denmark has been an agricultural country, and this has
largely characterized Danish landscapes. Consequently, two thirds of the land-
scape consists of man-made agricultural areas. However, forests are also evident in
the landscape in the form of, among other types, deciduous forest and coniferous
forest. Rold Forest and Grib Forest are the largest forests.
Figure 1 Distribution of Denmark’s area by type of area
Artificial surfaces, 9.8 per cent
Agricultural areas, 66.3 per cent
Forests and semi-natural areas, 15.6 per cent
Wetlands, 5.2 per cent
Unclassified, 1.5 per cent
Distribution of total area
Towns, buildings etc., 74.3 per cent
Roads etc., 20.6 per cent
Railways, bridges and dams, 1.4 per cent
Other artificial surfaces, 3.7 per cent
Distribution on artificial surfaces
Table 4
Man-made infrastructure and buildings characterize the landscape
Cities, roads, railroads, bridges and other types of man-made surfaces cover a total
of 10 per cent of Denmark’s area, corresponding to three times the area of the Far-
oe Islands – or 56 per cent of Sjælland. Urban centres, such as residential neigh-
bourhoods and industrial districts, dominate and account for three-fourths of the
man-made surfaces.
1
Microsoft Word − 01 Geography and climate.doc (X:100.0%, Y:100.0%) Created by Grafikhuset Publi PDF.
Geography and climate
Statistical Yearbook 2011
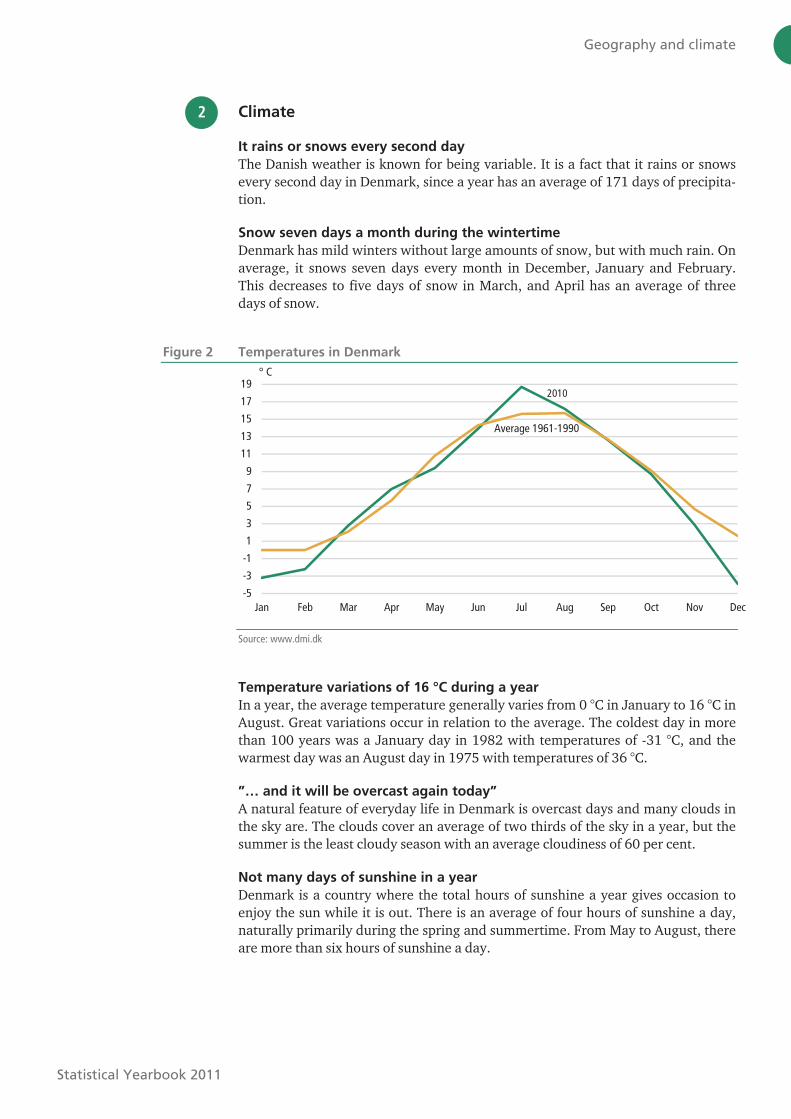
Climate
It rains or snows every second day
The Danish weather is known for being variable. It is a fact that it rains or snows
every second day in Denmark, since a year has an average of 171 days of precipita-
tion.
Snow seven days a month during the wintertime
Denmark has mild winters without large amounts of snow, but with much rain. On
average, it snows seven days every month in December, January and February.
This decreases to five days of snow in March, and April has an average of three
days of snow.
Figure 2 Temperatures in Denmark
-5
-3
-1
1
3
5
7
9
11
13
15
17
19
Jan Feb Mar Apr May Jun Jul Aug Sep Oct Nov Dec
° C
Average 1961-1990
2010
Source: www.dmi.dk
Temperature variations of 16 °C during a year
In a year, the average temperature generally varies from 0 °C in January to 16 °C in
August. Great variations occur in relation to the average. The coldest day in more
than 100 years was a January day in 1982 with temperatures of -31 °C, and the
warmest day was an August day in 1975 with temperatures of 36 °C.
”… and it will be overcast again today”
A natural feature of everyday life in Denmark is overcast days and many clouds in
the sky are. The clouds cover an average of two thirds of the sky in a year, but the
summer is the least cloudy season with an average cloudiness of 60 per cent.
Not many days of sunshine in a year
Denmark is a country where the total hours of sunshine a year gives occasion to
enjoy the sun while it is out. There is an average of four hours of sunshine a day,
naturally primarily during the spring and summertime. From May to August, there
are more than six hours of sunshine a day.
2
Microsoft Word − 01 Geography and climate.doc (X:100.0%, Y:100.0%) Created by Grafikhuset Publi PDF.
Geography and climate
Statistical Yearbook 2011
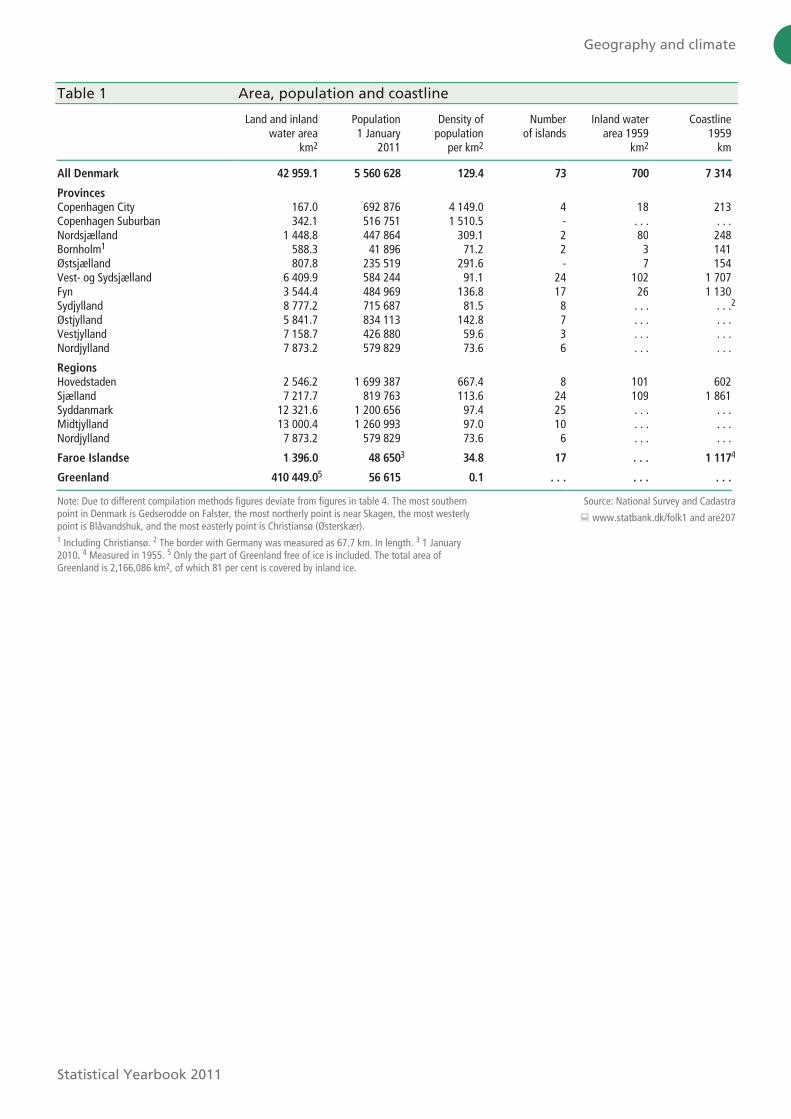
Table 1 Area, population and coastline
Land and inland water area
km2
Population 1 January
2011
Density of population
per km2
Number of islands
Inland water area 1959
km2
Coastline 1959
km
All Denmark 42 959.1 5 560 628 129.4 73 700 7 314
Provinces Copenhagen City 167.0 692 876 4 149.0 4 18 213 Copenhagen Suburban 342.1 516 751 1 510.5 - . . . . . . Nordsjælland 1 448.8 447 864 309.1 2 80 248 Bornholm1 588.3 41 896 71.2 2 3 141 Østsjælland 807.8 235 519 291.6 - 7 154 Vest- og Sydsjælland 6 409.9 584 244 91.1 24 102 1 707 Fyn 3 544.4 484 969 136.8 17 26 1 130 Sydjylland 8 777.2 715 687 81.5 8 . . . . . .2
Østjylland 5 841.7 834 113 142.8 7 . . . . . . Vestjylland 7 158.7 426 880 59.6 3 . . . . . . Nordjylland 7 873.2 579 829 73.6 6 . . . . . .
Regions Hovedstaden 2 546.2 1 699 387 667.4 8 101 602 Sjælland 7 217.7 819 763 113.6 24 109 1 861 Syddanmark 12 321.6 1 200 656 97.4 25 . . . . . . Midtjylland 13 000.4 1 260 993 97.0 10 . . . . . . Nordjylland 7 873.2 579 829 73.6 6 . . . . . .
Faroe Islandse 1 396.0 48 6503 34.8 17 . . . 1 1174
Greenland 410 449.05 56 615 0.1 . . . . . . . . .
Note: Due to different compilation methods figures deviate from figures in table 4. The most southern point in Denmark is Gedserodde on Falster, the most northerly point is near Skagen, the most westerly point is Blåvandshuk, and the most easterly point is Christiansø (Østerskær). 1 Including Christiansø. 2 The border with Germany was measured as 67.7 km. In length. 3 1 January 2010. 4 Measured in 1955. 5 Only the part of Greenland free of ice is included. The total area of Greenland is 2,166,086 km2, of which 81 per cent is covered by inland ice.
Source: National Survey and Cadastra
� www.statbank.dk/folk1 and are207
Microsoft Word − Table 001.docx (X:100.0%, Y:100.0%) Created by Grafikhuset Publi PDF.
Geography and climate
Statistical Yearbook 2011
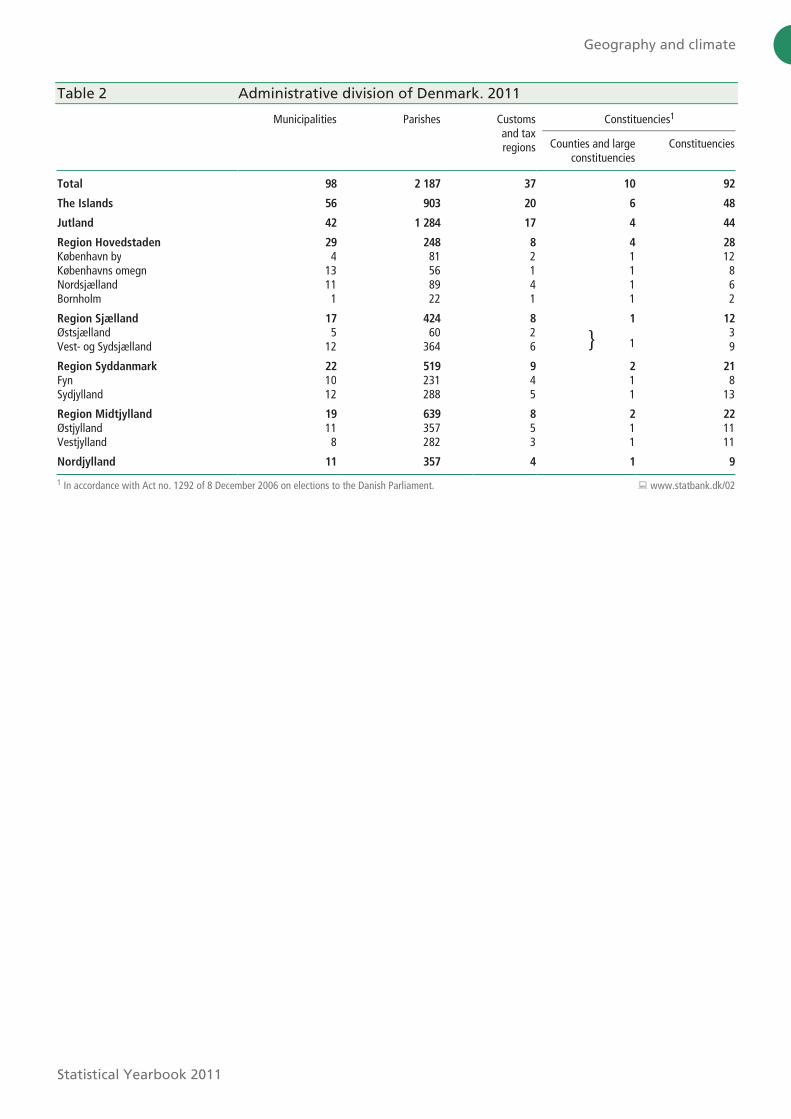
Table 2 Administrative division of Denmark. 2011
Municipalities Parishes Customs and tax regions
Constituencies1
Counties and large constituencies
Constituencies
Total 98 2 187 37 10 92
The Islands 56 903 20 6 48
Jutland 42 1 284 17 4 44
Region Hovedstaden 29 248 8 4 28
København by 4 81 2 1 12 Københavns omegn 13 56 1 1 8 Nordsjælland 11 89 4 1 6 Bornholm 1 22 1 1 2
Region Sjælland 17 424 8 1 12
Østsjælland 5 60 2 } 1 3
Vest- og Sydsjælland 12 364 6 9
Region Syddanmark 22 519 9 2 21
Fyn 10 231 4 1 8
Sydjylland 12 288 5 1 13
Region Midtjylland 19 639 8 2 22
Østjylland 11 357 5 1 11 Vestjylland 8 282 3 1 11
Nordjylland 11 357 4 1 9
1 In accordance with Act no. 1292 of 8 December 2006 on elections to the Danish Parliament. � www.statbank.dk/02
Microsoft Word − Table 002.docx (X:100.0%, Y:100.0%) Created by Grafikhuset Publi PDF.
Geography and climate
Statistical Yearbook 2011
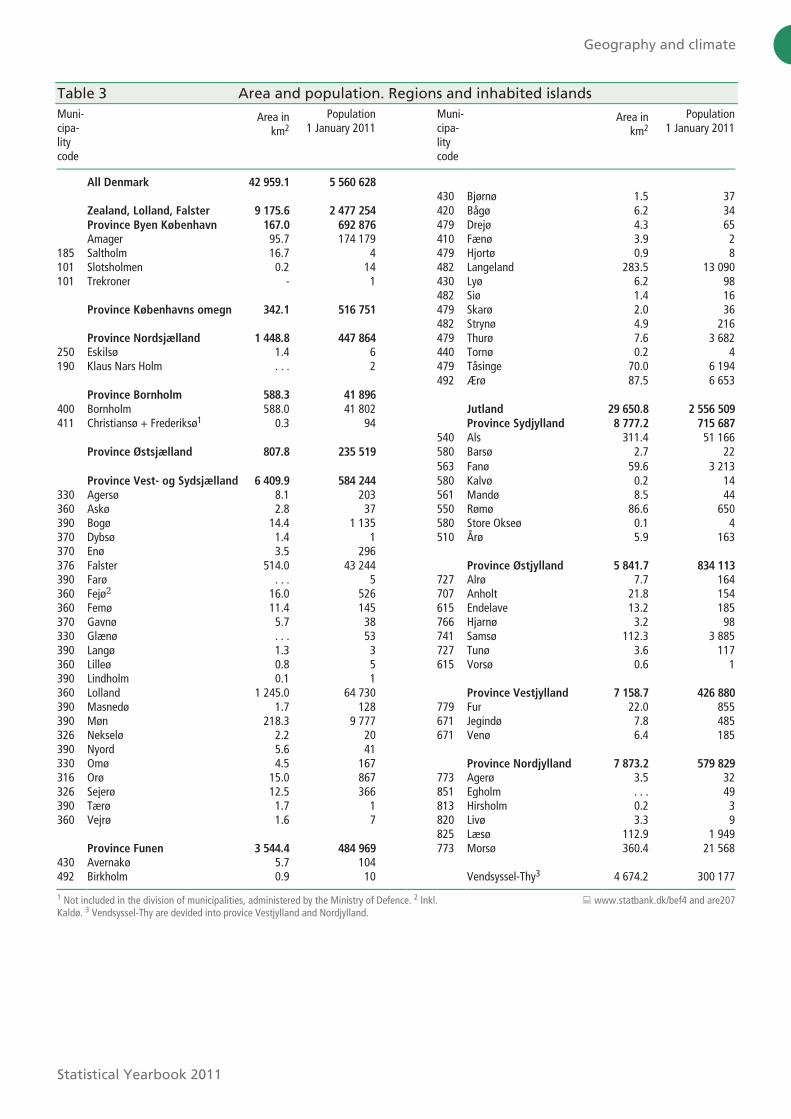
Table 3 Area and population. Regions and inhabited islands
Muni-cipa-lity code
Area in km2
Population 1 January 2011
Muni-cipa-lity code
Area in km2
Population 1 January 2011
All Denmark 42 959.1 5 560 628
430 Bjørnø 1.5 37 Zealand, Lolland, Falster 9 175.6 2 477 254 420 Bågø 6.2 34 Province Byen København 167.0 692 876 479 Drejø 4.3 65 Amager 95.7 174 179 410 Fænø 3.9 2 185 Saltholm 16.7 4 479 Hjortø 0.9 8 101 Slotsholmen 0.2 14 482 Langeland 283.5 13 090 101 Trekroner - 1 430 Lyø 6.2 98 482 Siø 1.4 16 Province Københavns omegn 342.1 516 751 479 Skarø 2.0 36 482 Strynø 4.9 216 Province Nordsjælland 1 448.8 447 864 479 Thurø 7.6 3 682
250 Eskilsø 1.4 6 440 Tornø 0.2 4 190 Klaus Nars Holm . . . 2 479 Tåsinge 70.0 6 194 492 Ærø 87.5 6 653 Province Bornholm 588.3 41 896 400 Bornholm 588.0 41 802 Jutland 29 650.8 2 556 509
411 Christiansø + Frederiksø1 0.3 94 Province Sydjylland 8 777.2 715 687 540 Als 311.4 51 166 Province Østsjælland 807.8 235 519 580 Barsø 2.7 22 563 Fanø 59.6 3 213 Province Vest- og Sydsjælland 6 409.9 584 244 580 Kalvø 0.2 14 330 Agersø 8.1 203 561 Mandø 8.5 44 360 Askø 2.8 37 550 Rømø 86.6 650 390 Bogø 14.4 1 135 580 Store Okseø 0.1 4 370 Dybsø 1.4 1 510 Årø 5.9 163 370 Enø 3.5 296 376 Falster 514.0 43 244 Province Østjylland 5 841.7 834 113 390 Farø . . . 5 727 Alrø 7.7 164 360 Fejø2 16.0 526 707 Anholt 21.8 154 360 Femø 11.4 145 615 Endelave 13.2 185 370 Gavnø 5.7 38 766 Hjarnø 3.2 98 330 Glænø . . . 53 741 Samsø 112.3 3 885 390 Langø 1.3 3 727 Tunø 3.6 117 360 Lilleø 0.8 5 615 Vorsø 0.6 1 390 Lindholm 0.1 1 360 Lolland 1 245.0 64 730 Province Vestjylland 7 158.7 426 880 390 Masnedø 1.7 128 779 Fur 22.0 855 390 Møn 218.3 9 777 671 Jegindø 7.8 485 326 Nekselø 2.2 20 671 Venø 6.4 185 390 Nyord 5.6 41 330 Omø 4.5 167 Province Nordjylland 7 873.2 579 829 316 Orø 15.0 867 773 Agerø 3.5 32 326 Sejerø 12.5 366 851 Egholm . . . 49
390 Tærø 1.7 1 813 Hirsholm 0.2 3 360 Vejrø 1.6 7 820 Livø 3.3 9 825 Læsø 112.9 1 949 Province Funen 3 544.4 484 969 773 Morsø 360.4 21 568 430 Avernakø 5.7 104 492 Birkholm 0.9 10 Vendsyssel-Thy3 4 674.2 300 177
1 Not included in the division of municipalities, administered by the Ministry of Defence. 2 Inkl. Kaldø. 3 Vendsyssel-Thy are devided into provice Vestjylland and Nordjylland.
� www.statbank.dk/bef4 and are207
Microsoft Word − Table 003.docx (X:100.0%, Y:100.0%) Created by Grafikhuset Publi PDF.
Geography and climate
Statistical Yearbook 2011
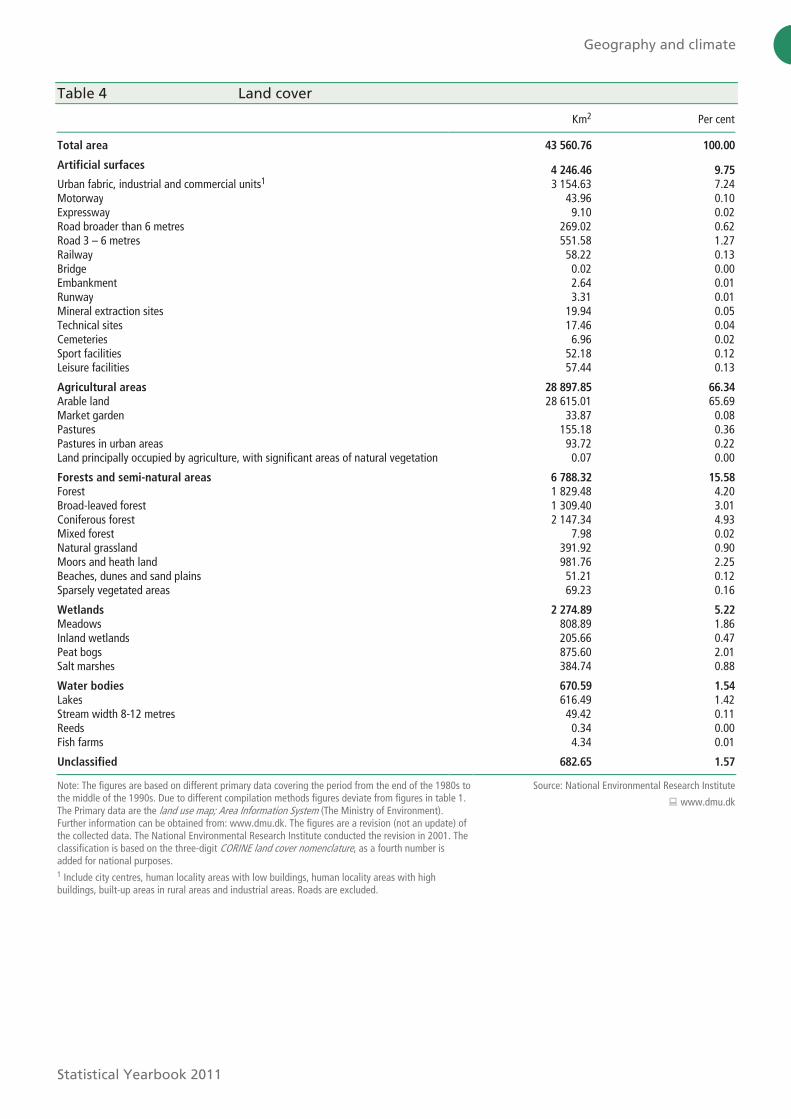
Table 4 Land cover
Km2 Per cent
Total area 43 560.76 100.00
Artificial surfaces 4 246.46 9.75
Urban fabric, industrial and commercial units1 3 154.63 7.24 Motorway 43.96 0.10 Expressway 9.10 0.02 Road broader than 6 metres 269.02 0.62 Road 3 – 6 metres 551.58 1.27 Railway 58.22 0.13 Bridge 0.02 0.00 Embankment 2.64 0.01 Runway 3.31 0.01 Mineral extraction sites 19.94 0.05 Technical sites 17.46 0.04 Cemeteries 6.96 0.02 Sport facilities 52.18 0.12 Leisure facilities 57.44 0.13
Agricultural areas 28 897.85 66.34
Arable land 28 615.01 65.69 Market garden 33.87 0.08 Pastures 155.18 0.36 Pastures in urban areas 93.72 0.22 Land principally occupied by agriculture, with significant areas of natural vegetation 0.07 0.00
Forests and semi-natural areas 6 788.32 15.58
Forest 1 829.48 4.20 Broad-leaved forest 1 309.40 3.01 Coniferous forest 2 147.34 4.93 Mixed forest 7.98 0.02 Natural grassland 391.92 0.90 Moors and heath land 981.76 2.25 Beaches, dunes and sand plains 51.21 0.12 Sparsely vegetated areas 69.23 0.16
Wetlands 2 274.89 5.22
Meadows 808.89 1.86 Inland wetlands 205.66 0.47 Peat bogs 875.60 2.01 Salt marshes 384.74 0.88
Water bodies 670.59 1.54
Lakes 616.49 1.42 Stream width 8-12 metres 49.42 0.11 Reeds 0.34 0.00 Fish farms 4.34 0.01
Unclassified 682.65 1.57
Note: The figures are based on different primary data covering the period from the end of the 1980s to the middle of the 1990s. Due to different compilation methods figures deviate from figures in table 1. The Primary data are the land use map; Area Information System (The Ministry of Environment). Further information can be obtained from: www.dmu.dk. The figures are a revision (not an update) of the collected data. The National Environmental Research Institute conducted the revision in 2001. The classification is based on the three-digit CORINE land cover nomenclature, as a fourth number is added for national purposes. 1 Include city centres, human locality areas with low buildings, human locality areas with high buildings, built-up areas in rural areas and industrial areas. Roads are excluded.
Source: National Environmental Research Institute
� www.dmu.dk
Microsoft Word − Table 004.docx (X:100.0%, Y:100.0%) Created by Grafikhuset Publi PDF.
Geography and climate
Statistical Yearbook 2011
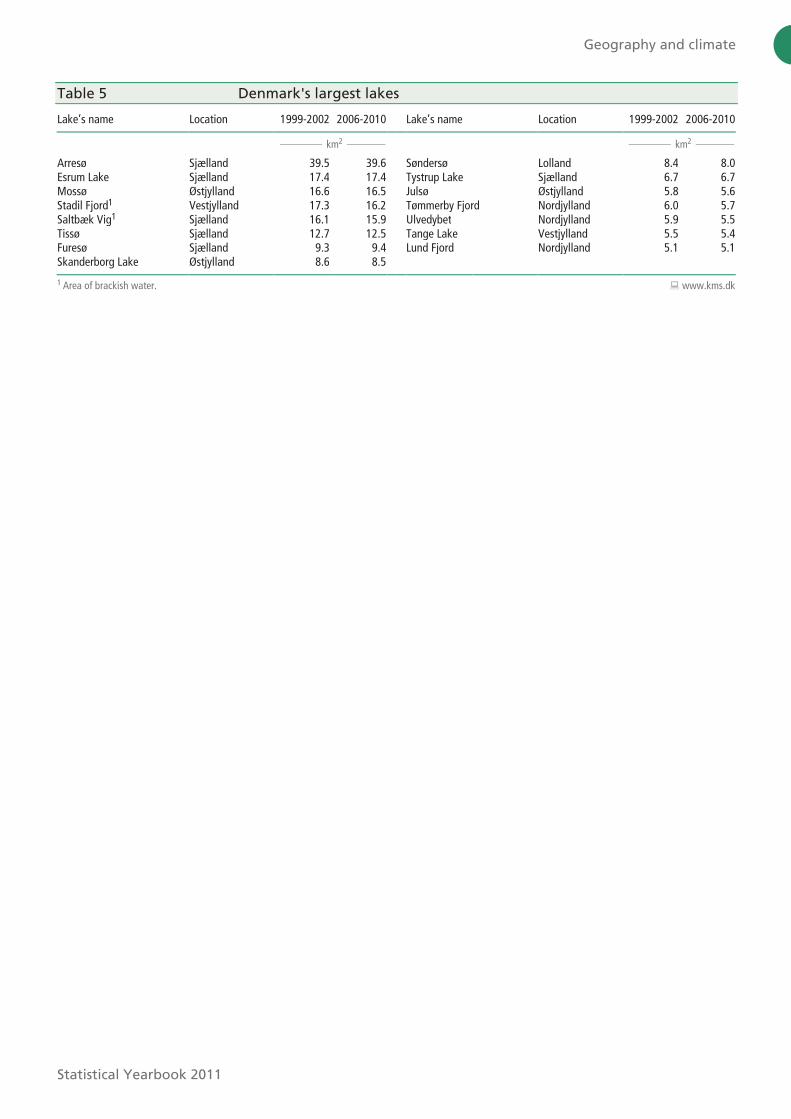
Table 5 Denmark's largest lakes
Lake’s name Location 1999-2002 2006-2010 Lake’s name Location 1999-2002 2006-2010
km2 km2
Arresø Sjælland 39.5 39.6 Søndersø Lolland 8.4 8.0 Esrum Lake Sjælland 17.4 17.4 Tystrup Lake Sjælland 6.7 6.7 Mossø Østjylland 16.6 16.5 Julsø Østjylland 5.8 5.6 Stadil Fjord1 Vestjylland 17.3 16.2 Tømmerby Fjord Nordjylland 6.0 5.7 Saltbæk Vig1 Sjælland 16.1 15.9 Ulvedybet Nordjylland 5.9 5.5 Tissø Sjælland 12.7 12.5 Tange Lake Vestjylland 5.5 5.4 Furesø Sjælland 9.3 9.4 Lund Fjord Nordjylland 5.1 5.1 Skanderborg Lake Østjylland 8.6 8.5
1 Area of brackish water. � www.kms.dk
Microsoft Word − Table 005.docx (X:100.0%, Y:100.0%) Created by Grafikhuset Publi PDF.
Geography and climate
Statistical Yearbook 2011
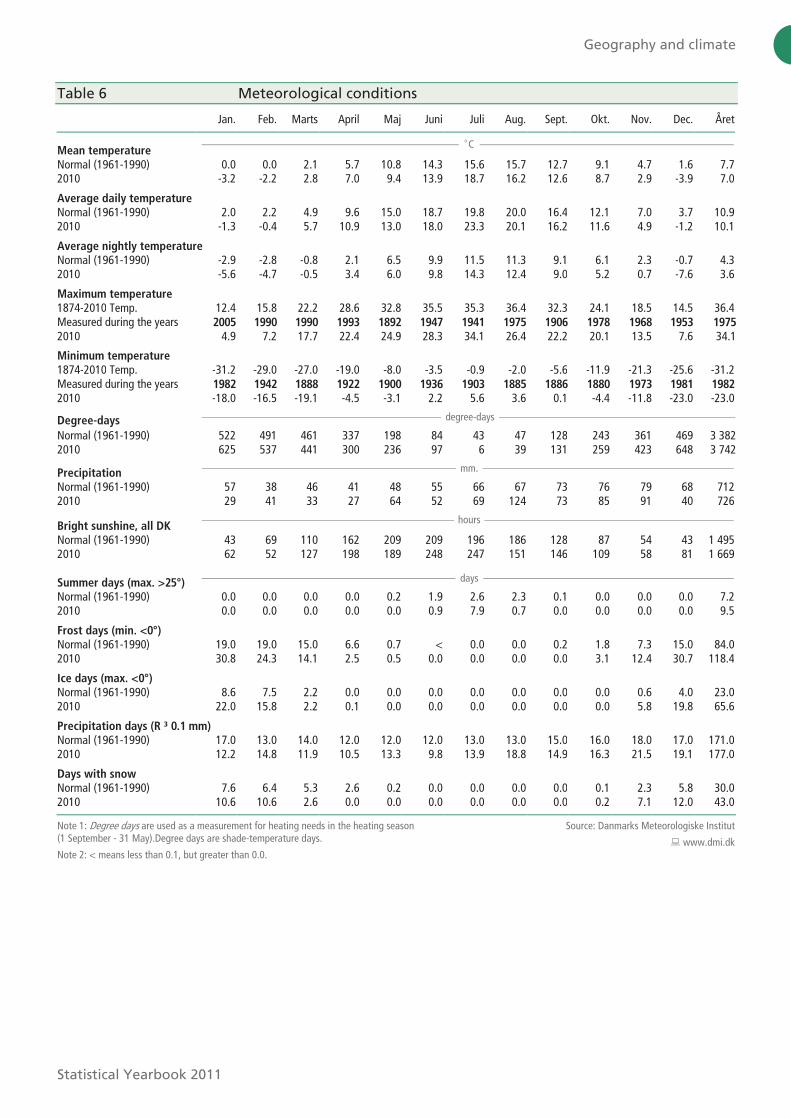
Table 6 Meteorological conditions
Jan. Feb. Marts April Maj Juni Juli Aug. Sept. Okt. Nov. Dec. Året
Mean temperature o C
Normal (1961-1990) 0.0 0.0 2.1 5.7 10.8 14.3 15.6 15.7 12.7 9.1 4.7 1.6 7.7 2010 -3.2 -2.2 2.8 7.0 9.4 13.9 18.7 16.2 12.6 8.7 2.9 -3.9 7.0
Average daily temperature
Normal (1961-1990) 2.0 2.2 4.9 9.6 15.0 18.7 19.8 20.0 16.4 12.1 7.0 3.7 10.9 2010 -1.3 -0.4 5.7 10.9 13.0 18.0 23.3 20.1 16.2 11.6 4.9 -1.2 10.1
Average nightly temperature Normal (1961-1990) -2.9 -2.8 -0.8 2.1 6.5 9.9 11.5 11.3 9.1 6.1 2.3 -0.7 4.3 2010 -5.6 -4.7 -0.5 3.4 6.0 9.8 14.3 12.4 9.0 5.2 0.7 -7.6 3.6
Maximum temperature 1874-2010 Temp. 12.4 15.8 22.2 28.6 32.8 35.5 35.3 36.4 32.3 24.1 18.5 14.5 36.4 Measured during the years 2005 1990 1990 1993 1892 1947 1941 1975 1906 1978 1968 1953 1975
2010 4.9 7.2 17.7 22.4 24.9 28.3 34.1 26.4 22.2 20.1 13.5 7.6 34.1
Minimum temperature 1874-2010 Temp. -31.2 -29.0 -27.0 -19.0 -8.0 -3.5 -0.9 -2.0 -5.6 -11.9 -21.3 -25.6 -31.2 Measured during the years 1982 1942 1888 1922 1900 1936 1903 1885 1886 1880 1973 1981 1982
2010 -18.0 -16.5 -19.1 -4.5 -3.1 2.2 5.6 3.6 0.1 -4.4 -11.8 -23.0 -23.0
Degree-days degree-days
Normal (1961-1990) 522 491 461 337 198 84 43 47 128 243 361 469 3 382 2010 625 537 441 300 236 97 6 39 131 259 423 648 3 742
Precipitation mm.
Normal (1961-1990) 57 38 46 41 48 55 66 67 73 76 79 68 712 2010 29 41 33 27 64 52 69 124 73 85 91 40 726
Bright sunshine, all DK hours
Normal (1961-1990) 43 69 110 162 209 209 196 186 128 87 54 43 1 495 2010 62 52 127 198 189 248 247 151 146 109 58 81 1 669
Summer days (max. >25°) days
Normal (1961-1990) 0.0 0.0 0.0 0.0 0.2 1.9 2.6 2.3 0.1 0.0 0.0 0.0 7.2 2010 0.0 0.0 0.0 0.0 0.0 0.9 7.9 0.7 0.0 0.0 0.0 0.0 9.5
Frost days (min. <0°) Normal (1961-1990) 19.0 19.0 15.0 6.6 0.7 < 0.0 0.0 0.2 1.8 7.3 15.0 84.0 2010 30.8 24.3 14.1 2.5 0.5 0.0 0.0 0.0 0.0 3.1 12.4 30.7 118.4
Ice days (max. <0°) Normal (1961-1990) 8.6 7.5 2.2 0.0 0.0 0.0 0.0 0.0 0.0 0.0 0.6 4.0 23.0 2010 22.0 15.8 2.2 0.1 0.0 0.0 0.0 0.0 0.0 0.0 5.8 19.8 65.6
Precipitation days (R ³ 0.1 mm) Normal (1961-1990) 17.0 13.0 14.0 12.0 12.0 12.0 13.0 13.0 15.0 16.0 18.0 17.0 171.0 2010 12.2 14.8 11.9 10.5 13.3 9.8 13.9 18.8 14.9 16.3 21.5 19.1 177.0
Days with snow Normal (1961-1990) 7.6 6.4 5.3 2.6 0.2 0.0 0.0 0.0 0.0 0.1 2.3 5.8 30.0 2010 10.6 10.6 2.6 0.0 0.0 0.0 0.0 0.0 0.0 0.2 7.1 12.0 43.0
Note 1: Degree days are used as a measurement for heating needs in the heating season (1 September - 31 May).Degree days are shade-temperature days.
Note 2: < means less than 0.1, but greater than 0.0.
Source: Danmarks Meteorologiske Institut
� www.dmi.dk
Microsoft Word − Table 006.docx (X:100.0%, Y:100.0%) Created by Grafikhuset Publi PDF.