Embed Size (px)
Citation preview
1
Geometrical Modelling of 3D Woven Reinforcements for Polymer
Composites: Prediction of Fabric Permeability and Composite Mechanical
Properties
Xuesen Zeng, Louise P. Brown, Andreas Endruweit*, Mikhail Matveev, Andrew C. Long
Faculty of Engineering – Division of Materials, Mechanics & Structures,
University of Nottingham, University Park, Nottingham, NG7 2RD, U.K. *corresponding author. [email protected], fax 0044 (0)115 9513800
Abstract
For a 3D orthogonal carbon fibre weave, geometrical parameters characterising the unit
cell were quantified using micro-Computed Tomography and image analysis. Novel
procedures for generation of unit cell models, reflecting systematic local variations in yarn
paths and yarn cross-sections, and discretisation into voxels for numerical analysis were
implemented in TexGen. Resin flow during reinforcement impregnation was simulated using
Computational Fluid Dynamics to predict the in-plane permeability. With increasing degree
of local refinement of the geometrical models, agreement of the predicted permeabilities with
experimental data improved significantly. A significant effect of the binder configuration at
the fabric surfaces on the permeability was observed. In-plane tensile properties of
composites predicted using mechanical finite element analysis showed good quantitative
agreement with experimental results. Accurate modelling of the fabric surface layers
predicted a reduction of the composite strength, particularly in the direction of yarns with
crimp caused by compression at binder cross-over points.
Keywords: A. 3-Dimensional reinforcement, B. Mechanical properties, C. Numerical
analysis, E. Resin flow
2
1. Introduction
In thick composite components, multiple thin layers of fabrics with two-dimensional (2D)
architectures can be replaced by thick three-dimensional (3D) fibrous structures as
reinforcements. As discussed by Mouritz et al. [1], 3D textile processes, in particular highly
versatile weaving processes, allow the near net-shape manufacture of reinforcements with
complex geometries. 3D woven reinforcements consist typically of layers of aligned non-
crimp yarns with alternating orientation along the fabric weft and warp directions, and
additional binder yarns, which follow paths through the fabric thickness and hold the non-
crimp layers together.
In composites, the non-crimp yarns in each fabric layer show generally better axial
mechanical properties than the crimped yarns in most 2D reinforcements. The presence of
binder yarns provides toughness and resistance to delamination but tends to reduce
mechanical in-plane properties compared to purely uni-directionally aligned layers. However,
mechanical in-plane properties of composites were found to be higher for 3D woven
reinforcements than for multi-layer plain weave reinforcement [2, 3]. For the case of
frequently used 3D orthogonal woven reinforcements, the mechanical properties of
composites have been addressed in detail in a variety of studies. The in-plane stiffness and
strength have been investigated experimentally, analytically and numerically, e.g. by Tan et
al. [4, 5]. Carvelli et al. [6] characterised the fatigue behaviour in tension. The response to
static and impact transverse loading was studied, e.g. by Luo et al. [7]. Mohamed and Wetzel
[8] described in detail the influence of the variation of fabric parameters on the properties of a
component.
Regarding reinforcement processing properties, forming of an orthogonal weave was
characterised by Carvelli et al. [9] in terms of in-plane biaxial tension and shear behaviour.
Due to increased thickness and the through-thickness fixation of the yarns, the drapability of
3
3D woven reinforcements, i.e. the formability to doubly-curved surfaces, tends to be reduced
compared to 2D fabrics. However, this is less relevant, since the reinforcements can be
manufactured to near net-shape [1]. On the other hand, the reinforcement compressibility is
highly relevant, since it determines the fibre volume fraction in the reinforcement. This
affects the reinforcement impregnation with a liquid resin system in Liquid Composite
Moulding (LCM) processes, which are particularly suited for the manufacture of thick
components with 3D woven reinforcements, and the mechanical properties of the finished
component. Some data for a 3D fabric, suggesting significantly higher stiffness in
compression than for a random mat, were given by Parnas et al. [10]. Potluri and Sagar [11]
studied the compaction behaviour of several fabrics with interlacing weaving patterns in more
detail and applied an energy minimisation technique to compaction modelling, which
generally showed good agreement with experimental results. Endruweit and Long [12]
observed experimentally that local reduction of the gap height between the fibre bundles is
significant in compression of an angle-interlock weave with offset of layers. On the other
hand, the main compression mechanism for an orthogonal weave was found to be compaction
of the fibre bundles. This results in higher compressibility for the angle-interlock weave than
for the orthogonal weave.
The flow of liquid resin during fabric impregnation in LCM processes is more complex
than in thin fibrous structures because of the presence of additional through-thickness yarns.
Information on impregnation behaviour, characterised by the reinforcement permeability, is
sparse for 3D reinforcements. Experimental data published by Parnas et al. [10] suggest that
the in-plane and through-thickness permeabilities of 3D woven fabrics are in the same order
of magnitude as those of 2D fabrics at similar fibre volume fractions. Elsewhere, it was
suggested that 3D orthogonal woven fabrics have significantly higher in-plane permeability
than 2D fabrics (woven and knitted) at identical fibre volume fraction [13]. Numerical
4
predictions of the permeability of an orthogonal weave by Ngo and Tamma [14] indicated
that the in-plane permeability is high compared to the through-thickness permeability, and
qualitative agreement with experimental observations was found. Song et al. [15] predicted
the permeability tensor for a 3D braided textile (similar to an interlacing weave). While they
also found higher values for the in-plane than for the through-thickness permeability,
experimental results were overestimated by significant margins. Endruweit and Long [12]
modelled the influence of inter-yarn gap widths and the pattern and dimensions of binder
yarns on the in-plane permeabilities of 3D woven fabrics. Experimental data suggested that
in-plane permeabilities reflect the reduction of inter-yarn gap spaces during fabric
compaction. Through-thickness permeabilities were found to be enhanced by through-
thickness channels formed around the binder yarns.
A major challenge in predicting the processing and performance characteristics of
composite materials is the complex hierarchical structure and its local variation, in particular
if 3D woven reinforcements are used. This is reflected in growing research efforts for meso-
scale geometry characterisation [16-19] and modelling [20-23]. This study aims at
experimental quantification of representative geometrical parameters for a 3D woven fabric
and generation of unit cell models at a high level of geometrical detail, including systematic
local variations in yarn paths and yarn cross-sections. Based on these models, numerical
methods are implemented to predict the reinforcement permeability and the mechanical
performance of the finished composite.
2. Geometrical characterisation
As an example, a carbon fibre orthogonal weave with the specifications listed in Table 1
was characterised in this study. The internal geometry of the fabric was characterised at
different compaction levels by X-ray micro-Computed Tomography (-CT) analysis. A
Phoenix Nanotom (GE Sensing & Inspection Technologies GmbH) was used for µ-CT
5
scanning of small samples, which were slightly larger than unit cell size of the 3D woven
reinforcement. While the dry fabric was scanned at no compaction, composite specimens
were produced to allow the deformed geometry in the compressed fabric to be captured. To
obtain good image contrast for carbon fibre composites, which show low X-ray energy
absorption, the power was set to a voltage of 40 keV and a current of 240 µA, and a
Molybdenum target (emitting radiation at a relatively small wavelength, which is absorbed by
low-density materials) was used. The image resolution is between 7 µm and 20 µm,
depending on the geometrical dimensions of the scan sample.
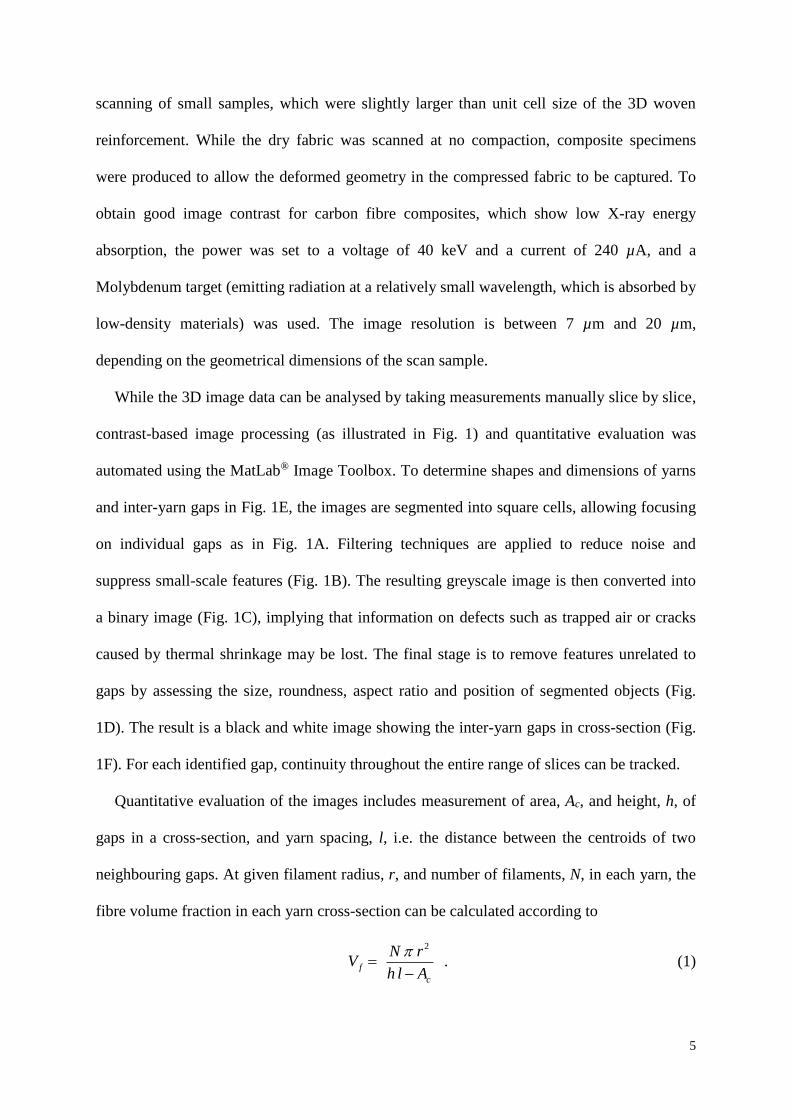
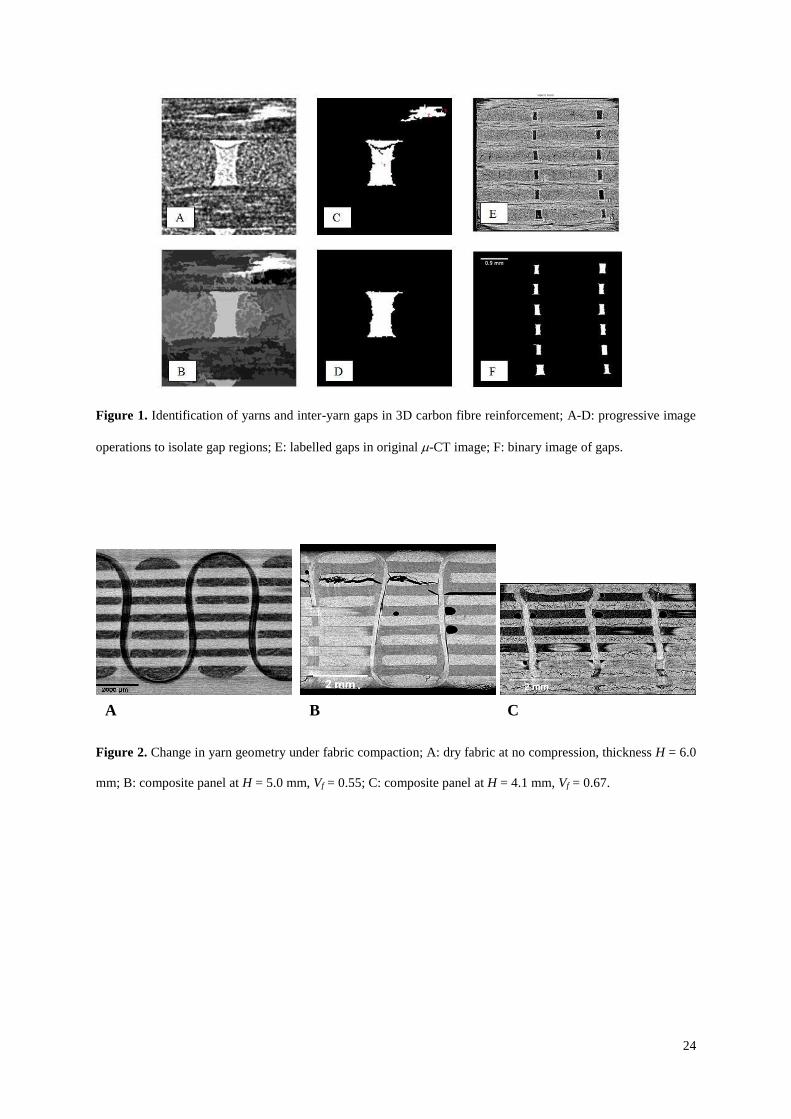
While the 3D image data can be analysed by taking measurements manually slice by slice,
contrast-based image processing (as illustrated in Fig. 1) and quantitative evaluation was
automated using the MatLab® Image Toolbox. To determine shapes and dimensions of yarns
and inter-yarn gaps in Fig. 1E, the images are segmented into square cells, allowing focusing
on individual gaps as in Fig. 1A. Filtering techniques are applied to reduce noise and
suppress small-scale features (Fig. 1B). The resulting greyscale image is then converted into
a binary image (Fig. 1C), implying that information on defects such as trapped air or cracks
caused by thermal shrinkage may be lost. The final stage is to remove features unrelated to
gaps by assessing the size, roundness, aspect ratio and position of segmented objects (Fig.
1D). The result is a black and white image showing the inter-yarn gaps in cross-section (Fig.
1F). For each identified gap, continuity throughout the entire range of slices can be tracked.
Quantitative evaluation of the images includes measurement of area, Ac, and height, h, of
gaps in a cross-section, and yarn spacing, l, i.e. the distance between the centroids of two
neighbouring gaps. At given filament radius, r, and number of filaments, N, in each yarn, the
fibre volume fraction in each yarn cross-section can be calculated according to
c
fAlh
rNV
2 . (1)
6
To measure gaps in weft and warp directions, the 3D images are re-sliced and analysed in
each direction. Data for composites at two different fibre volume fractions, i.e. thicknesses,
H, are listed in Table 2.
3. Geometrical modelling
3.1 General considerations
Reliable numerical analysis of reinforcement processing properties and composite
mechanical performance requires accurate description of the reinforcement geometry. Since
detailed modelling of full-size fabric specimens is not realistic, the fabric architecture is
represented by a unit cell, by definition the smallest repetitive (by translation) unit in a fabric.
Since yarns in a fabric are not perfectly fixated but have some mobility, all textiles tend to
exhibit some degree of stochastic variability. Thus, unit cell modelling always implies
idealised approximation of the exact geometry. Here, image analysis indicates that the degree
of geometric variability in the 3D woven reinforcement is relatively low (Table 2), at similar
level as observed by Desplentere et al. [24]. Thus, unit cell modelling can be expected to give
a relatively accurate approximation of the actual (local) architecture.
To take experimentally observed variabilities into account, Desplentere et al. [24] used
series of unit cell models with standardised geometry and varying dimensions as input for
Monte-Carlo simulations of mechanical properties. This study aims to identify the dominant
geometrical features in the 3D woven reinforcement and deduce a generic set of rules to
generate input parameters for the unit cell model. The fundamental steps of textile geometry
modelling and mesh generation for numerical analysis using the software TexGen [25, 26]
will be discussed in the following.
3.2 Yarn paths and crimp
Yarn paths are modelled in TexGen by interpolating a number of appropriately positioned
master nodes using cubic Bézier splines to ensure the periodic continuity of yarn paths in a
7
unit cell. In an orthogonal weave, paths for non-crimp warp and weft yarns can be treated as
straight parallel lines at constant spacing. Exceptions are the surface layers of weft yarns,
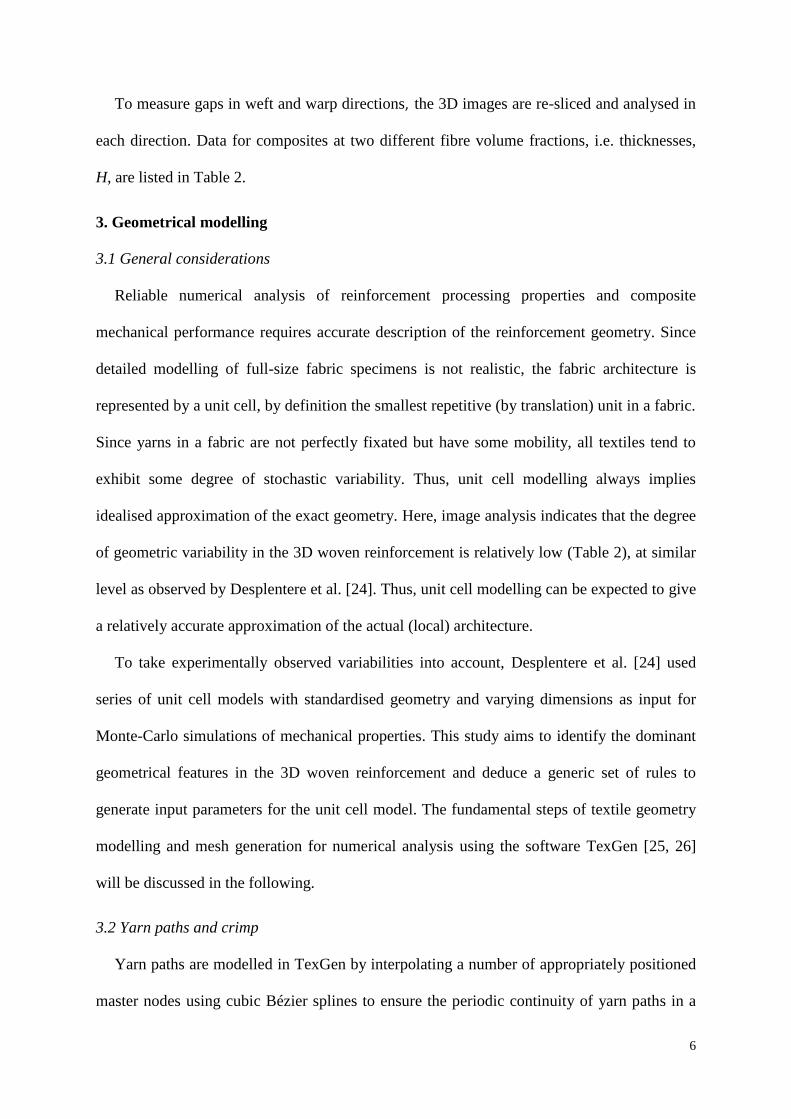
where crimp is introduced as the fabric compaction level increases (Fig. 2). The magnitude of
crimp in the weft yarns at crossover points with the binder corresponds to the local thickness
of the compressed binder yarn, modelled in TexGen by offsetting the through-thickness
coordinate of the corresponding master node on the weft yarn.
The path of the binder yarn varies considerably with increasing compaction level as
illustrated in Fig. 2. For uncompressed fabric, the binder has slight S-shaped curvature (Fig.
2A). At low compaction levels, the total fabric thickness is reduced, resulting in increased
curvature of the binder (Fig. 2B). At high compaction levels, warp and weft yarns are
flattened and widened, reducing inter-yarn gap spaces. This imposes geometrical constraints
for the binder yarn, which is straightened in the fabric, and, since the total length does not
change, forms loops in the surface layers of weft yarns (Fig. 2C).
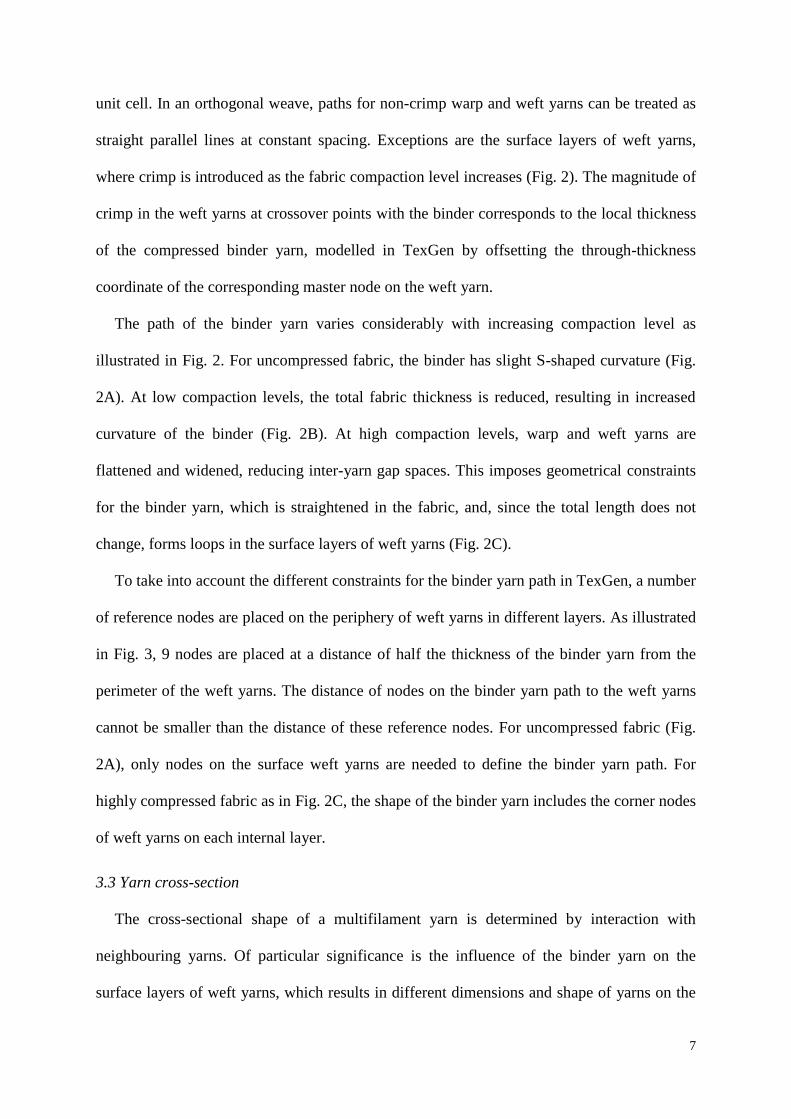
To take into account the different constraints for the binder yarn path in TexGen, a number
of reference nodes are placed on the periphery of weft yarns in different layers. As illustrated
in Fig. 3, 9 nodes are placed at a distance of half the thickness of the binder yarn from the
perimeter of the weft yarns. The distance of nodes on the binder yarn path to the weft yarns
cannot be smaller than the distance of these reference nodes. For uncompressed fabric (Fig.
2A), only nodes on the surface weft yarns are needed to define the binder yarn path. For
highly compressed fabric as in Fig. 2C, the shape of the binder yarn includes the corner nodes
of weft yarns on each internal layer.
3.3 Yarn cross-section
The cross-sectional shape of a multifilament yarn is determined by interaction with
neighbouring yarns. Of particular significance is the influence of the binder yarn on the
surface layers of weft yarns, which results in different dimensions and shape of yarns on the
8
fabric surfaces and the internal layers (Table 2). This is also reflected in the differences in Vf
for the surface layers and internal layers observed by Karahan et al. [17]. In TexGen, yarn
cross-sections are approximated by power-ellipses, special cases of a superellipse [27], which
are described by points (x, y) with
10)2cos(2
)( w
x (2)
and
15.0if))2(sin(2
5.00if)2(sin2)(
n
n
h
h
y . (3)
Here, the exponent, n, describes the shape of the power-ellipse, w is the yarn width, h is the
yarn height, and the parameter indicates the angular coordinate at the ellipse centre relative
to the major axis.
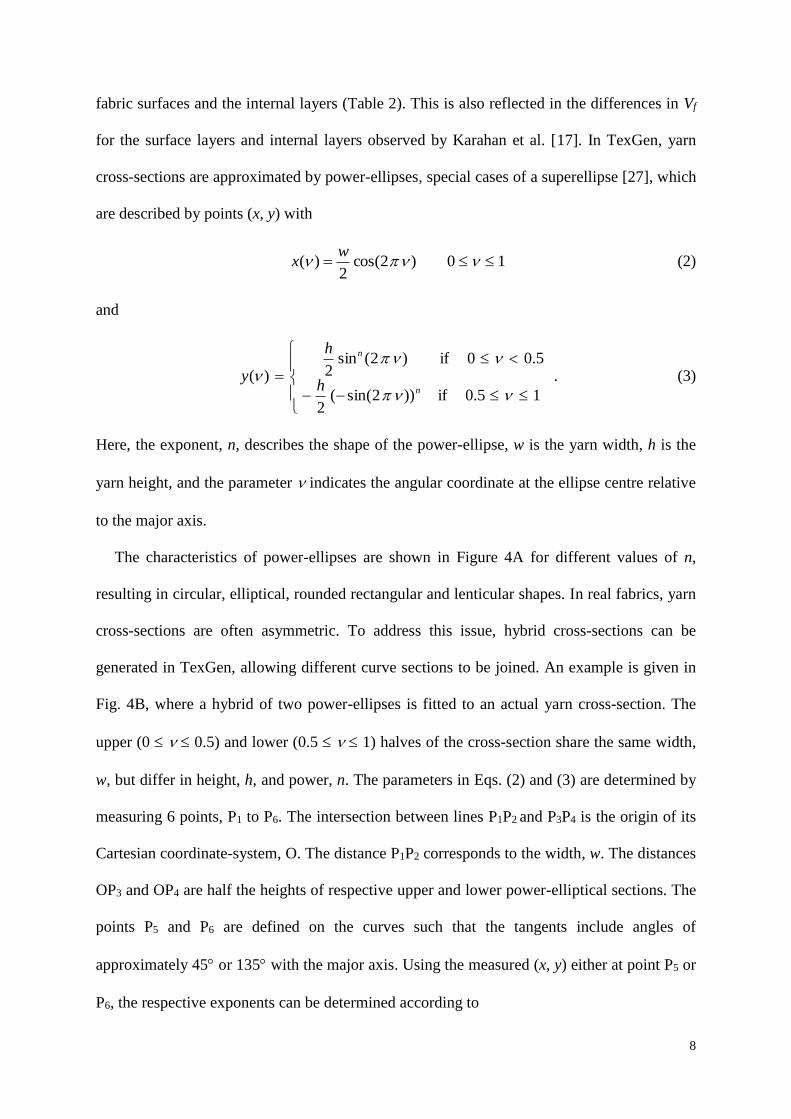
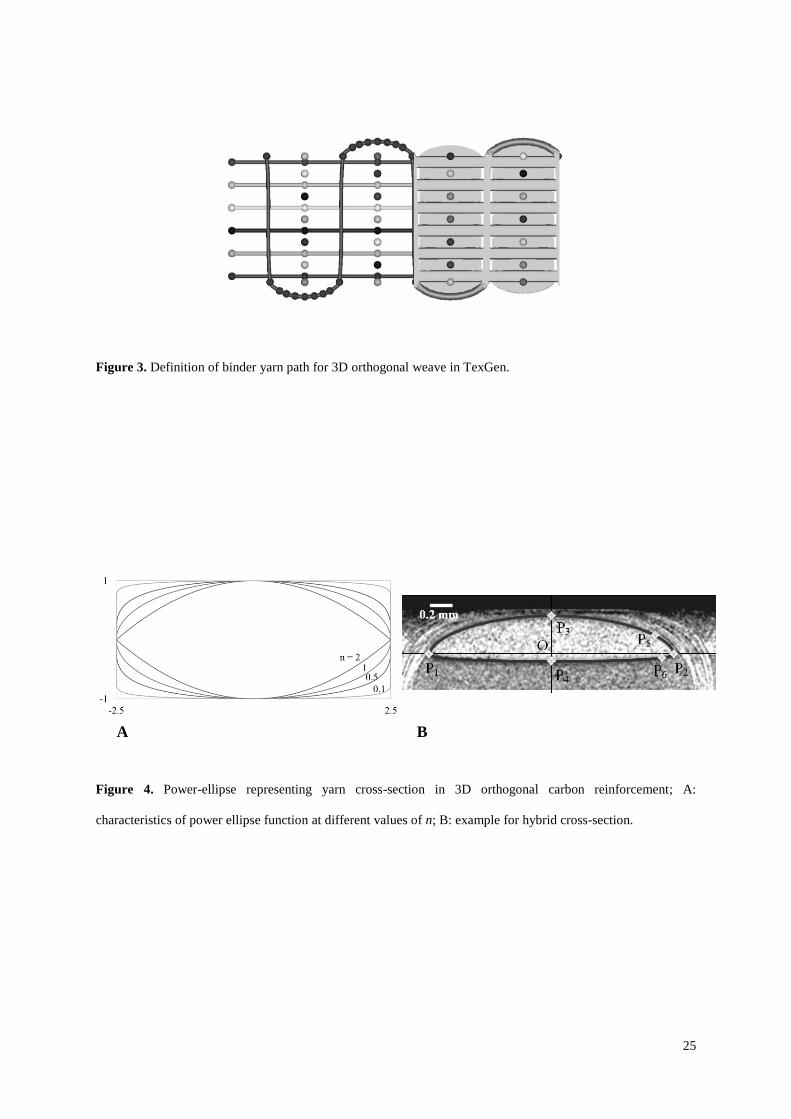
The characteristics of power-ellipses are shown in Figure 4A for different values of n,
resulting in circular, elliptical, rounded rectangular and lenticular shapes. In real fabrics, yarn
cross-sections are often asymmetric. To address this issue, hybrid cross-sections can be
generated in TexGen, allowing different curve sections to be joined. An example is given in
Fig. 4B, where a hybrid of two power-ellipses is fitted to an actual yarn cross-section. The
upper (0 0.5) and lower (0.5 1) halves of the cross-section share the same width,
w, but differ in height, h, and power, n. The parameters in Eqs. (2) and (3) are determined by
measuring 6 points, P1 to P6. The intersection between lines P1P2 and P3P4 is the origin of its
Cartesian coordinate-system, O. The distance P1P2 corresponds to the width, w. The distances
OP3 and OP4 are half the heights of respective upper and lower power-elliptical sections. The
points P5 and P6 are defined on the curves such that the tangents include angles of
approximately 45 or 135 with the major axis. Using the measured (x, y) either at point P5 or
P6, the respective exponents can be determined according to
9
2)/2(1log
)/2(log2
wx
hyn
. (4)
3.4 Unit cell
While the fabric architecture is defined by the parameters listed in Table 1, the input
parameters for generating a unit cell model are specified in Table 2. The basic structure of the
yarn paths can be generated automatically using the “3D wizard” in TexGen. A series of
dialogs allow entry of number of warp and weft yarns, as well as the number of layers of each
and the ratio of binder to warp yarns. The width, height, spacing and cross-sectional shape
can be specified for each set of yarns. A weave pattern dialog allows specification of the
weave pattern, and then the fabric is automatically generated with nodes on the yarn paths at
each crossover point between warp or binder yarns and weft yarns. Extra nodes are
positioned along the binder yarns to follow the contour of the outer weft yarns as described in
Section 3.2.
The geometric definitions of the yarn paths and cross-sections described in Sections 3.2
and 3.3 were implemented manually as refinements for the models used to generate the
results shown in the following sections. For simplification, it was assumed that all yarns other
than weft yarns on the fabric surfaces, which were refined locally by introducing crimp and
variable cross-sections at crossover points with binder yarns, have constant cross-section and
constant spacing along the yarn axes.
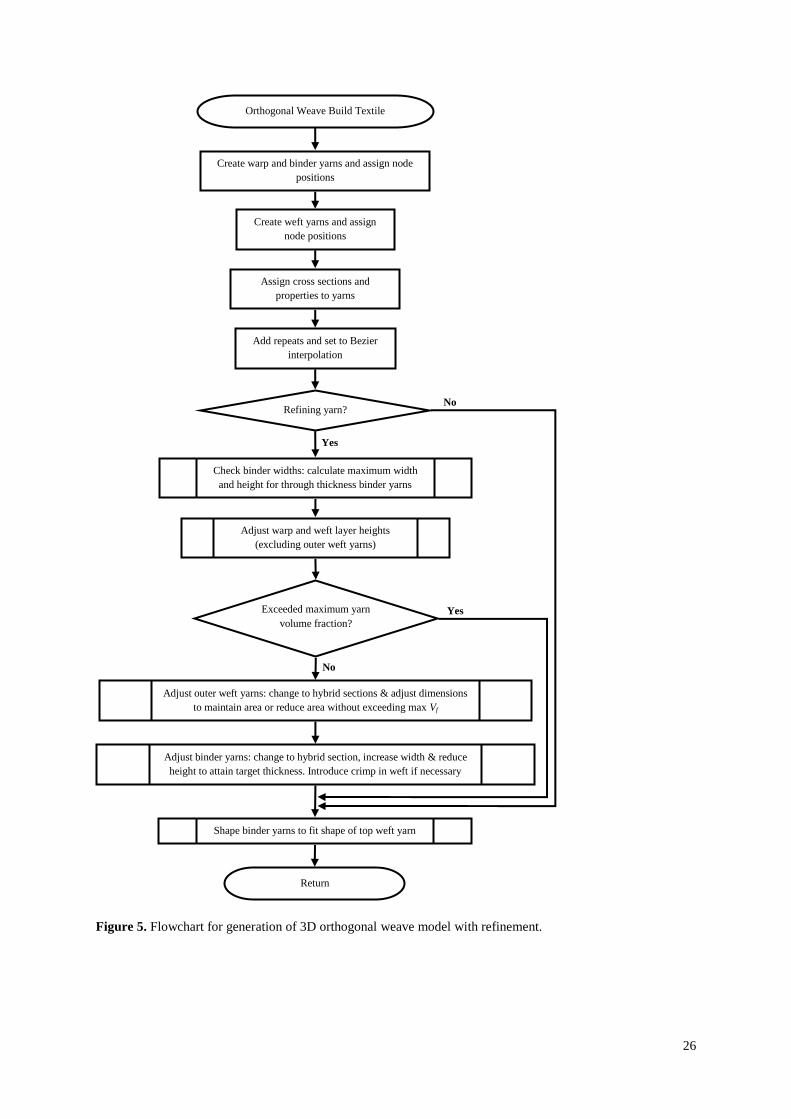
Subsequent to the results obtained using these manual refinements, a ‘refine’ option has
been developed in TexGen to implement the refinements automatically. An additional
parameter, target fabric thickness, is specified after which the TexGen software adjusts the
yarns, following the process shown in the flowchart in Fig. 5. Throughout the process, the
volume fractions of the yarns are monitored so that they are maintained within realistic limits.
Intersections in the model are also minimised by the process which constrains yarns to the
10
areas available and shapes the binder yarns to follow the contour of the outer weft yarns. The
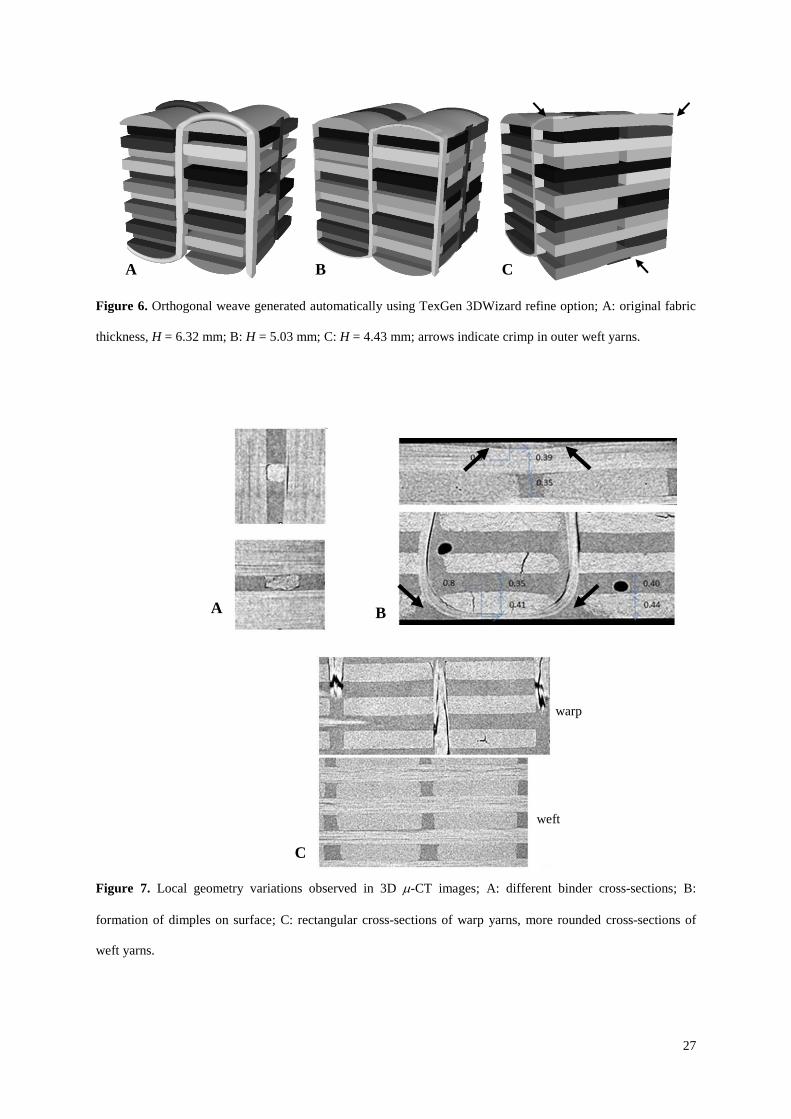
fabrics generated using this automatic refinement with the data given in Tables 1 and 2 are
shown in Fig. 6. Figure 6A shows the orthogonal weave with the refine option selected but no
change to the initial fabric thickness of 6.32 mm. The refinement here is limited to the binder
yarns and the outer weft yarns. Figures 6B and 6C show the fabric compacted to thicknesses
of 5.03 mm and 4.43 mm. Figure 6C shows the addition of a small amount of crimp in the
outer weft yarn, necessary to achieve this degree of compaction. This is also observed
experimentally, e.g. in the -CT image in Fig. 7B. Comparison with the µ-CT images shows
that TexGen is capable of automatically modelling the geometry realistically down to a fabric
thickness of 5.03 mm (Vf = 0.55). At a higher compaction level (thickness 4.43 mm),
deviations between the automatically generated TexGen model and the real geometry occur,
noticeably in the surface yarn cross-sections. The refine option is available as part of the
release version of the TexGen software but does still require validation for a larger range of
3D fabrics.
3.5 Discretisation
In unit cell models of textile fabrics, discretisation for numerical analysis is relatively
straightforward for yarns. However, inter-yarn spaces, which represent the main flow
domains in analysis of impregnating resin flow and resin-only zones in mechanical analysis
of composite performance, tend to have complex geometries. Particular problems are caused
by very small inter-yarn spaces, which can have a significant effect on the properties and thus
are not negligible. These geometries are hard to discretise by conformal meshing. Thus,
TexGen was used for automated voxel meshing of the unit cell domain, i.e. the domain was
discretised into a regular hexahedral grid, where properties of either yarns or gaps were
assigned to voxels depending on the centre point locations. While previous studies for
prediction of fabric permeability based on Computational Fluid Dynamics (CFD) [28-30] and
11
analysis of composite mechanical properties [31, 32] proved the robustness of voxel meshing,
it was also shown that uniform meshing may result in computational inefficiency and that the
solution may be mesh-dependent. In this study, minimum mesh densities for analysis of
permeabilities and mechanical properties were chosen based on convergence tests.
4. Fabric permeability analysis
4.1 Flow modelling
To analyse resin flow during reinforcement impregnation in composites processing,
steady-state laminar flow of an incompressible Newtonian fluid was simulated on the domain
of the unit cell of the 3D weave. Flow through inter-yarn gaps was modelled as Navier-
Stokes flow, while flow in yarns, modelled as porous media, was assumed to be governed by
Darcy’s law. For the latter case, axial and transverse yarn permeabilities as input parameters
were calculated using Gebart’s analytical model for hexagonal fibre packing [33]. The
filament diameter was assumed to be 7 m.
At all permeable interfaces, conservation of fluid mass and momentum was ensured. At the
interfaces between porous yarns and inter-yarn flow channels, where the problem of coupling
Navier-Stokes flow and Darcy flow occurs, fluid pressure and the normal component of the
flow velocity were assumed to be continuous. The component of the fluid velocity tangential
to the yarn surface was also assumed to be continuous (no-slip boundary), which is justified
since inter-yarn gap spaces are approximately one order of magnitude larger than pore spaces
in the yarns [34]. Use of a slip boundary condition (Beavers-Joseph boundary condition [35])
would be essential if the dimensions of inter-yarn gaps were comparable to the dimensions of
intra-yarn pores. In this case, slip at the yarn surface would contribute to the permeability of
the fabric, which would be implied to be extremely tightly woven. However, this effect is
negligible for typical textile reinforcements. Translational periodic constraints, applied
together with a flow-driving pressure drop, were set on opposite boundary faces of the textile
12
unit cell domain in weft and warp direction to represent a continuous reinforcement. No-slip
wall boundary conditions were specified at the impermeable top and bottom faces of the
domain to simulate flow along the mould surfaces during in-plane fabric impregnation. The
fluid was assumed to be incompressible with constant viscosity.
The equations describing the flow problem were solved using the CFD code ANSYS®
CFX 12.0 on a hexahedral voxel mesh, where properties of either the flow channel domain or
yarn volume were attributed to the voxels. The saturated in-plane permeability in warp and
weft direction as well as the saturated through-thickness permeability was calculated based
on Darcy’s law from the average pressure drop across the unit cell and the flow rate obtained
from the CFD simulation of flow in the respective directions, implying a process of
volumetric homogenisation. The sensitivity of the CFD calculations to the mesh density was
assessed based on convergence of the predicted in-plane permeability for the 3D weave at 25
× 25 × 25 voxels (warp × weft × thickness), 50 × 50 × 50 voxels, 100 × 100 × 100 voxels,
and 200 × 200 × 200 voxels. To obtain a reasonable balance between computation time and
accuracy, the number of voxels was chosen as 50 × 50 × 50 for the unit cell mesh. It was also
observed that flow velocities are typically three orders of magnitude smaller in the yarns than
in the inter-yarn gaps, suggesting that flow in the gaps dominates the permeability for this
material.
4.2 Results and discussion
To assess the sensitivity of permeability prediction to the level of detail in geometrical
textile modelling, unit cell models for a given fibre volume fraction (H = 5.0 mm, Vf = 0.55)
were refined incrementally as described in Section 3. The geometrical variations considered
in modelling are illustrated in Fig. 7. As a starting point, a unit cell of the orthogonal weave
was generated with straight yarns and constant elliptical cross-sections (average dimensions
based on data in Table 2). Successively, varying binder cross-sections (Fig. 7A), deformation
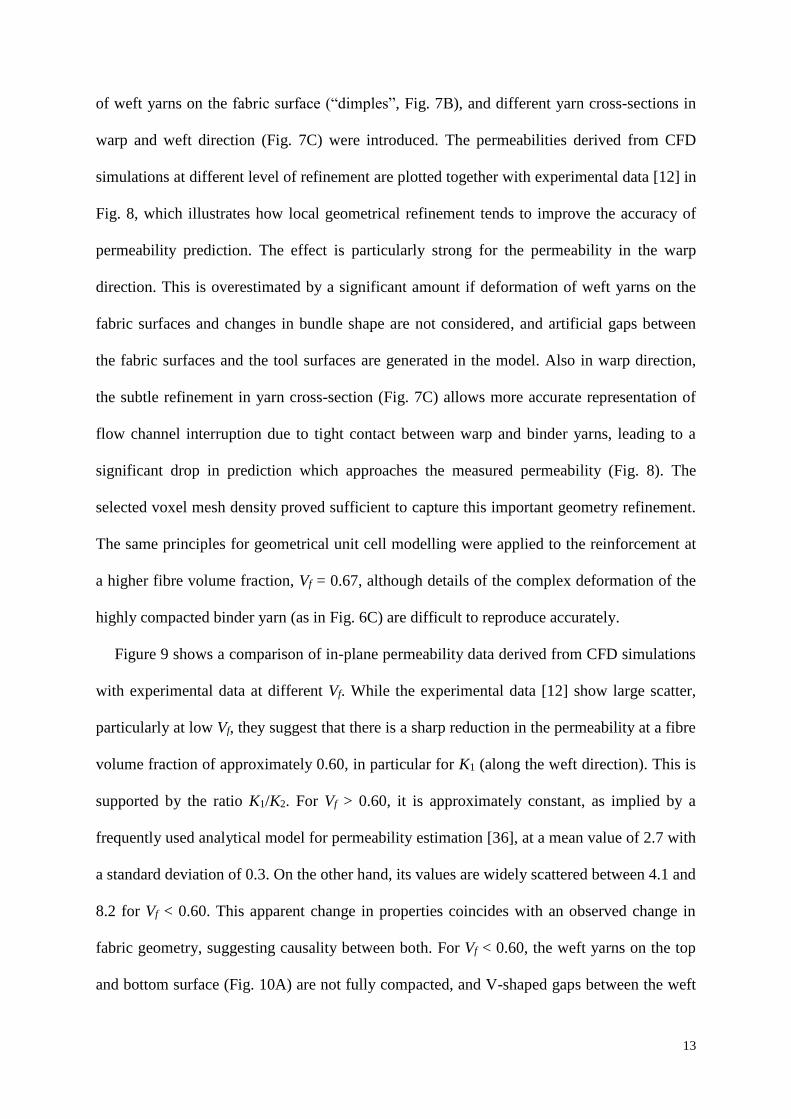
13
of weft yarns on the fabric surface (“dimples”, Fig. 7B), and different yarn cross-sections in
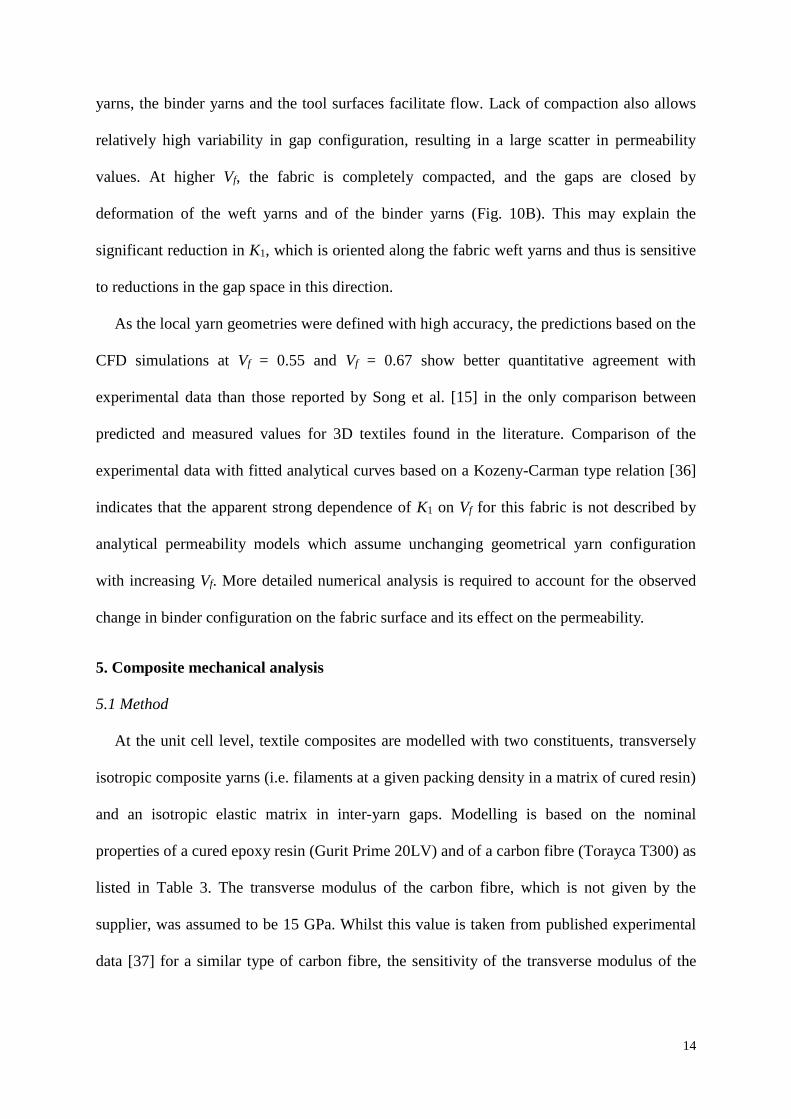
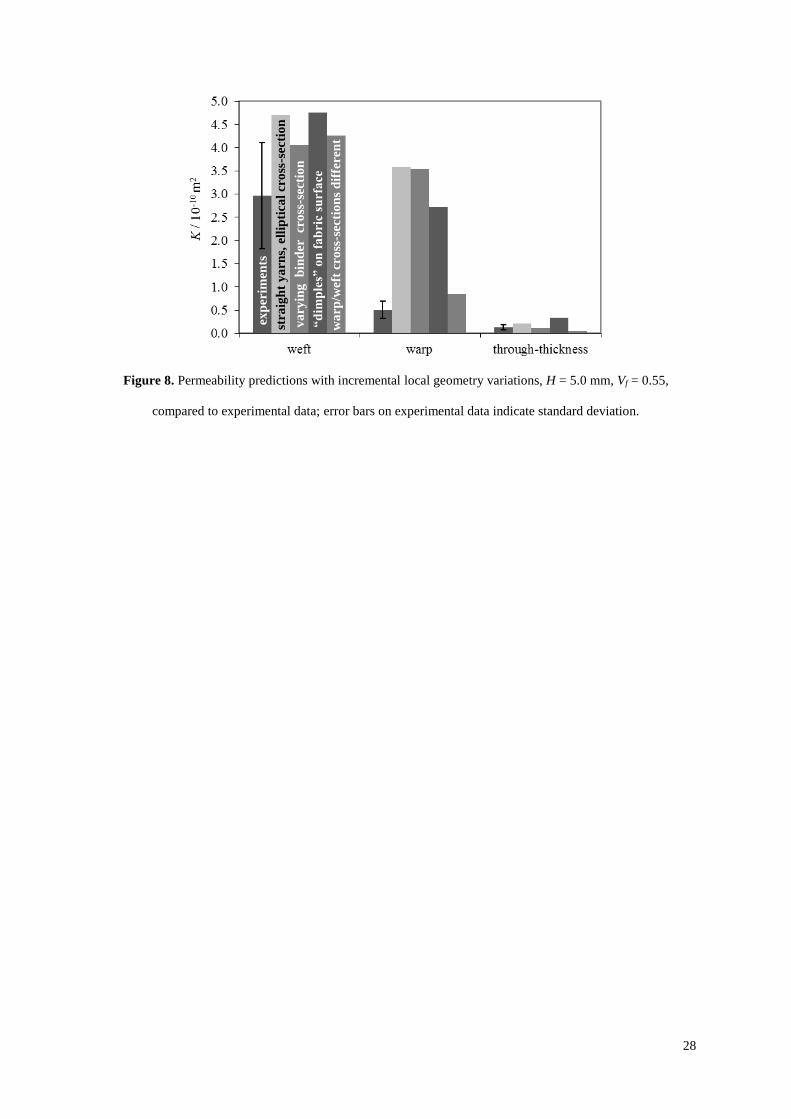
warp and weft direction (Fig. 7C) were introduced. The permeabilities derived from CFD
simulations at different level of refinement are plotted together with experimental data [12] in
Fig. 8, which illustrates how local geometrical refinement tends to improve the accuracy of
permeability prediction. The effect is particularly strong for the permeability in the warp
direction. This is overestimated by a significant amount if deformation of weft yarns on the
fabric surfaces and changes in bundle shape are not considered, and artificial gaps between
the fabric surfaces and the tool surfaces are generated in the model. Also in warp direction,
the subtle refinement in yarn cross-section (Fig. 7C) allows more accurate representation of
flow channel interruption due to tight contact between warp and binder yarns, leading to a
significant drop in prediction which approaches the measured permeability (Fig. 8). The
selected voxel mesh density proved sufficient to capture this important geometry refinement.
The same principles for geometrical unit cell modelling were applied to the reinforcement at
a higher fibre volume fraction, Vf = 0.67, although details of the complex deformation of the
highly compacted binder yarn (as in Fig. 6C) are difficult to reproduce accurately.
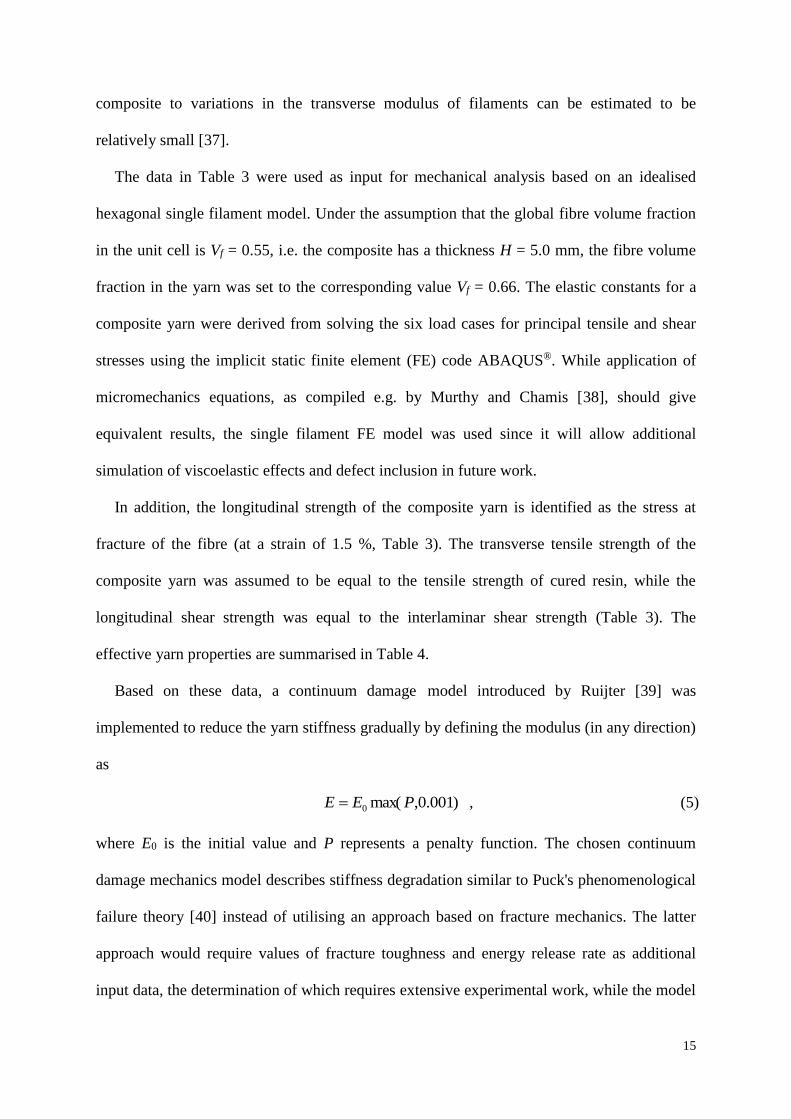
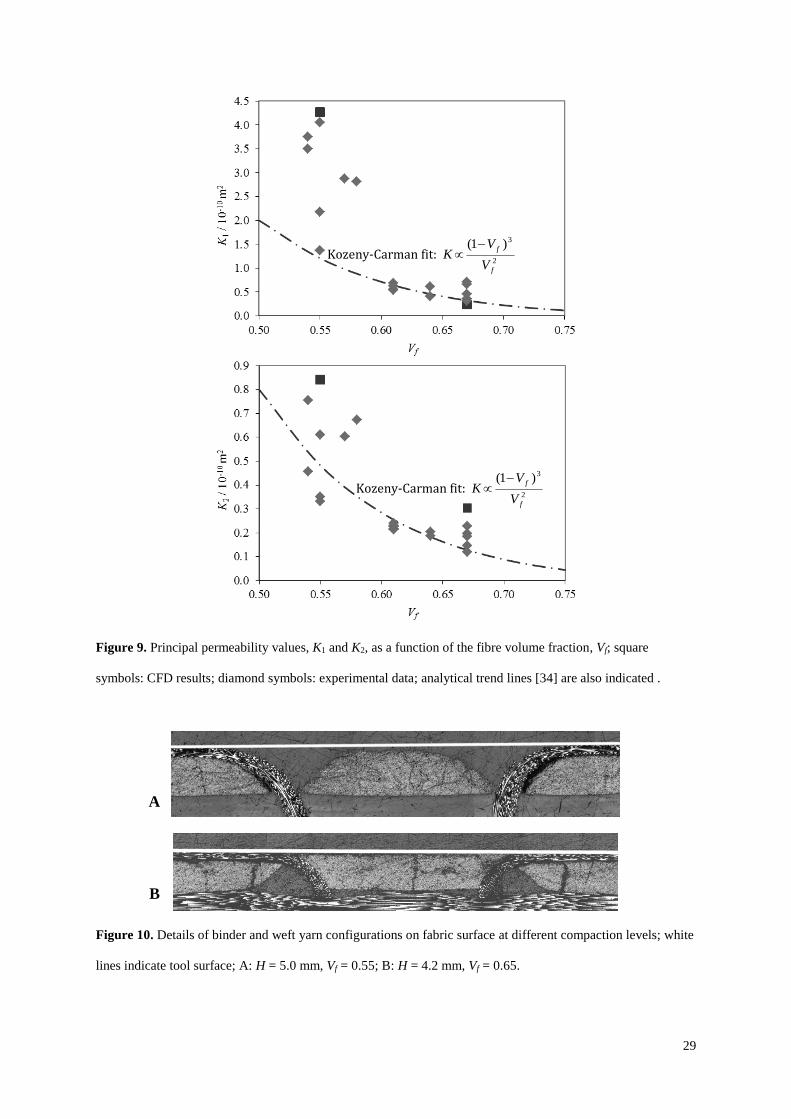
Figure 9 shows a comparison of in-plane permeability data derived from CFD simulations
with experimental data at different Vf. While the experimental data [12] show large scatter,
particularly at low Vf, they suggest that there is a sharp reduction in the permeability at a fibre
volume fraction of approximately 0.60, in particular for K1 (along the weft direction). This is
supported by the ratio K1/K2. For Vf > 0.60, it is approximately constant, as implied by a
frequently used analytical model for permeability estimation [36], at a mean value of 2.7 with
a standard deviation of 0.3. On the other hand, its values are widely scattered between 4.1 and
8.2 for Vf < 0.60. This apparent change in properties coincides with an observed change in
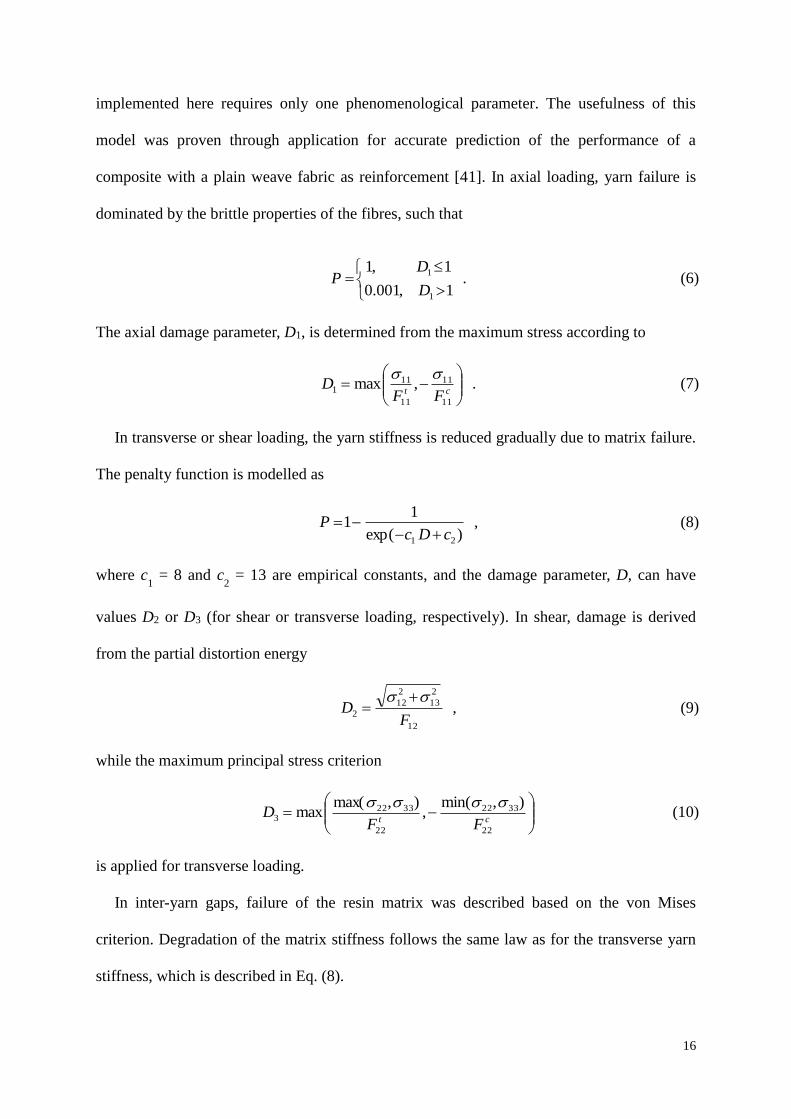
fabric geometry, suggesting causality between both. For Vf < 0.60, the weft yarns on the top
and bottom surface (Fig. 10A) are not fully compacted, and V-shaped gaps between the weft
14
yarns, the binder yarns and the tool surfaces facilitate flow. Lack of compaction also allows
relatively high variability in gap configuration, resulting in a large scatter in permeability
values. At higher Vf, the fabric is completely compacted, and the gaps are closed by
deformation of the weft yarns and of the binder yarns (Fig. 10B). This may explain the
significant reduction in K1, which is oriented along the fabric weft yarns and thus is sensitive
to reductions in the gap space in this direction.
As the local yarn geometries were defined with high accuracy, the predictions based on the
CFD simulations at Vf = 0.55 and Vf = 0.67 show better quantitative agreement with
experimental data than those reported by Song et al. [15] in the only comparison between
predicted and measured values for 3D textiles found in the literature. Comparison of the
experimental data with fitted analytical curves based on a Kozeny-Carman type relation [36]
indicates that the apparent strong dependence of K1 on Vf for this fabric is not described by
analytical permeability models which assume unchanging geometrical yarn configuration
with increasing Vf. More detailed numerical analysis is required to account for the observed
change in binder configuration on the fabric surface and its effect on the permeability.
5. Composite mechanical analysis
5.1 Method
At the unit cell level, textile composites are modelled with two constituents, transversely
isotropic composite yarns (i.e. filaments at a given packing density in a matrix of cured resin)
and an isotropic elastic matrix in inter-yarn gaps. Modelling is based on the nominal
properties of a cured epoxy resin (Gurit Prime 20LV) and of a carbon fibre (Torayca T300) as
listed in Table 3. The transverse modulus of the carbon fibre, which is not given by the
supplier, was assumed to be 15 GPa. Whilst this value is taken from published experimental
data [37] for a similar type of carbon fibre, the sensitivity of the transverse modulus of the
15
composite to variations in the transverse modulus of filaments can be estimated to be
relatively small [37].
The data in Table 3 were used as input for mechanical analysis based on an idealised
hexagonal single filament model. Under the assumption that the global fibre volume fraction
in the unit cell is Vf = 0.55, i.e. the composite has a thickness H = 5.0 mm, the fibre volume
fraction in the yarn was set to the corresponding value Vf = 0.66. The elastic constants for a
composite yarn were derived from solving the six load cases for principal tensile and shear
stresses using the implicit static finite element (FE) code ABAQUS®. While application of
micromechanics equations, as compiled e.g. by Murthy and Chamis [38], should give
equivalent results, the single filament FE model was used since it will allow additional
simulation of viscoelastic effects and defect inclusion in future work.
In addition, the longitudinal strength of the composite yarn is identified as the stress at
fracture of the fibre (at a strain of 1.5 %, Table 3). The transverse tensile strength of the
composite yarn was assumed to be equal to the tensile strength of cured resin, while the
longitudinal shear strength was equal to the interlaminar shear strength (Table 3). The
effective yarn properties are summarised in Table 4.
Based on these data, a continuum damage model introduced by Ruijter [39] was
implemented to reduce the yarn stiffness gradually by defining the modulus (in any direction)
as
)001.0,max(0 PEE , (5)
where E0 is the initial value and P represents a penalty function. The chosen continuum
damage mechanics model describes stiffness degradation similar to Puck's phenomenological
failure theory [40] instead of utilising an approach based on fracture mechanics. The latter
approach would require values of fracture toughness and energy release rate as additional
input data, the determination of which requires extensive experimental work, while the model
16
implemented here requires only one phenomenological parameter. The usefulness of this
model was proven through application for accurate prediction of the performance of a
composite with a plain weave fabric as reinforcement [41]. In axial loading, yarn failure is
dominated by the brittle properties of the fibres, such that
1,001.0
1,1
1
1
D
DP . (6)
The axial damage parameter, D1, is determined from the maximum stress according to
ct FFD
11
11
11
111 ,max
. (7)
In transverse or shear loading, the yarn stiffness is reduced gradually due to matrix failure.
The penalty function is modelled as
)exp(
11
21 cDcP
, (8)
where c1 = 8 and c
2 = 13 are empirical constants, and the damage parameter, D, can have
values D2 or D3 (for shear or transverse loading, respectively). In shear, damage is derived
from the partial distortion energy
12
2
13
2
12
2F
D
, (9)
while the maximum principal stress criterion
ct FFD
22
3322
22
33223
),min(,
),max(max
(10)
is applied for transverse loading.
In inter-yarn gaps, failure of the resin matrix was described based on the von Mises
criterion. Degradation of the matrix stiffness follows the same law as for the transverse yarn
stiffness, which is described in Eq. (8).
17
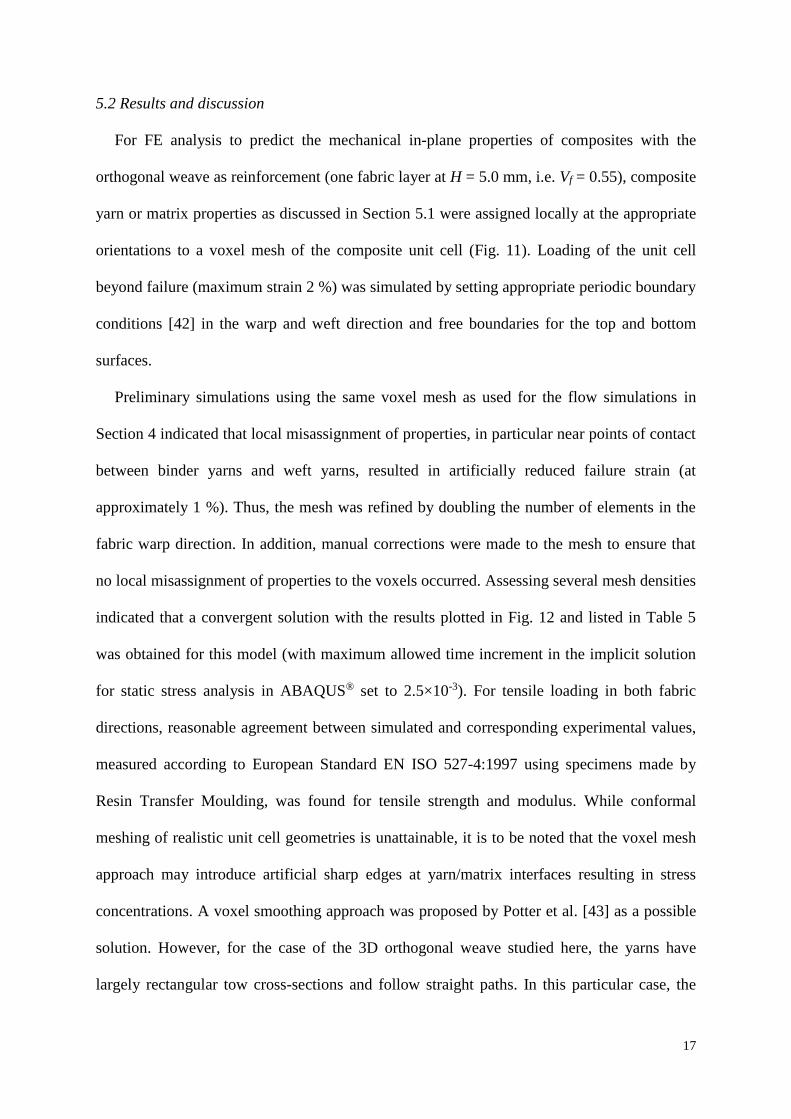
5.2 Results and discussion
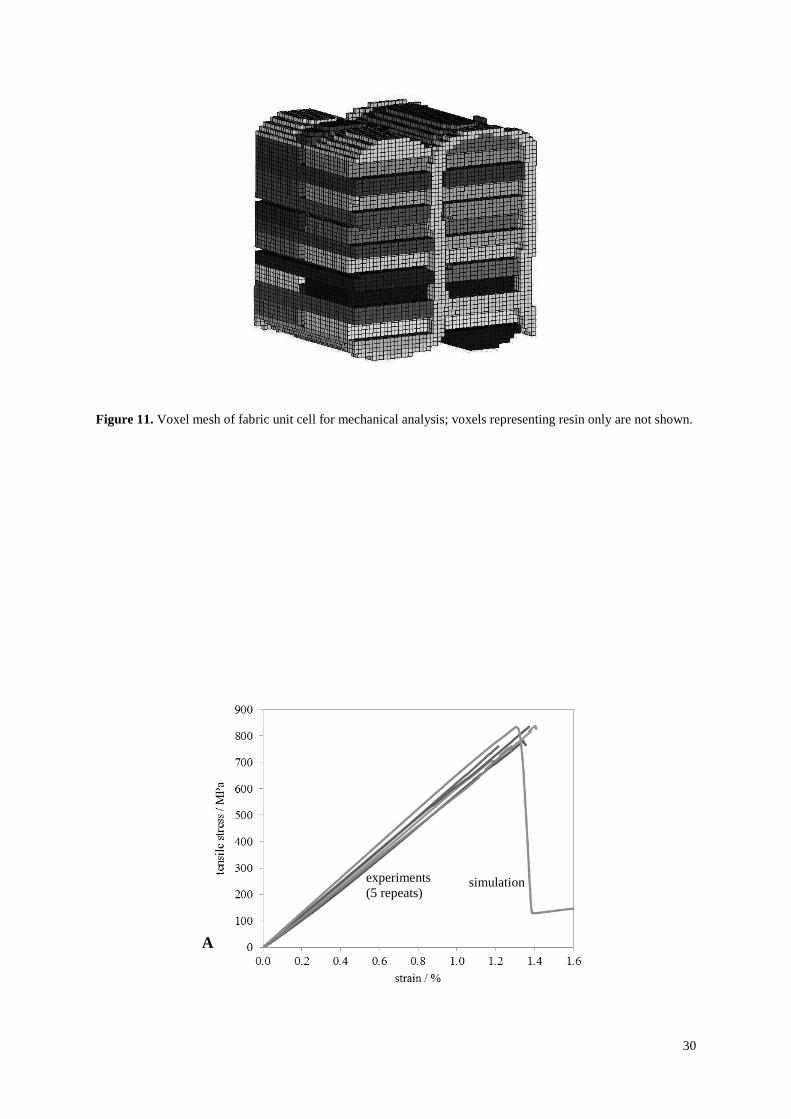
For FE analysis to predict the mechanical in-plane properties of composites with the
orthogonal weave as reinforcement (one fabric layer at H = 5.0 mm, i.e. Vf = 0.55), composite
yarn or matrix properties as discussed in Section 5.1 were assigned locally at the appropriate
orientations to a voxel mesh of the composite unit cell (Fig. 11). Loading of the unit cell
beyond failure (maximum strain 2 %) was simulated by setting appropriate periodic boundary
conditions [42] in the warp and weft direction and free boundaries for the top and bottom
surfaces.
Preliminary simulations using the same voxel mesh as used for the flow simulations in
Section 4 indicated that local misassignment of properties, in particular near points of contact
between binder yarns and weft yarns, resulted in artificially reduced failure strain (at
approximately 1 %). Thus, the mesh was refined by doubling the number of elements in the
fabric warp direction. In addition, manual corrections were made to the mesh to ensure that
no local misassignment of properties to the voxels occurred. Assessing several mesh densities
indicated that a convergent solution with the results plotted in Fig. 12 and listed in Table 5
was obtained for this model (with maximum allowed time increment in the implicit solution
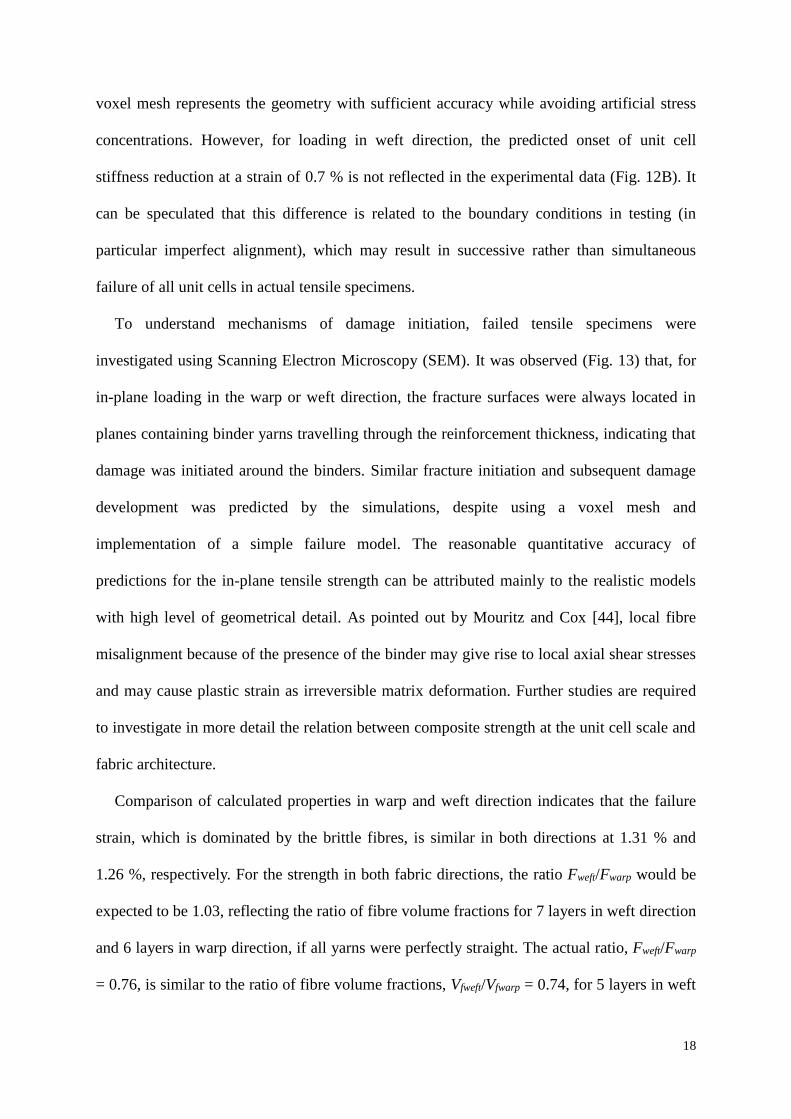
for static stress analysis in ABAQUS® set to 2.5×10⁻³). For tensile loading in both fabric
directions, reasonable agreement between simulated and corresponding experimental values,
measured according to European Standard EN ISO 527-4:1997 using specimens made by
Resin Transfer Moulding, was found for tensile strength and modulus. While conformal
meshing of realistic unit cell geometries is unattainable, it is to be noted that the voxel mesh
approach may introduce artificial sharp edges at yarn/matrix interfaces resulting in stress
concentrations. A voxel smoothing approach was proposed by Potter et al. [43] as a possible
solution. However, for the case of the 3D orthogonal weave studied here, the yarns have
largely rectangular tow cross-sections and follow straight paths. In this particular case, the
18
voxel mesh represents the geometry with sufficient accuracy while avoiding artificial stress
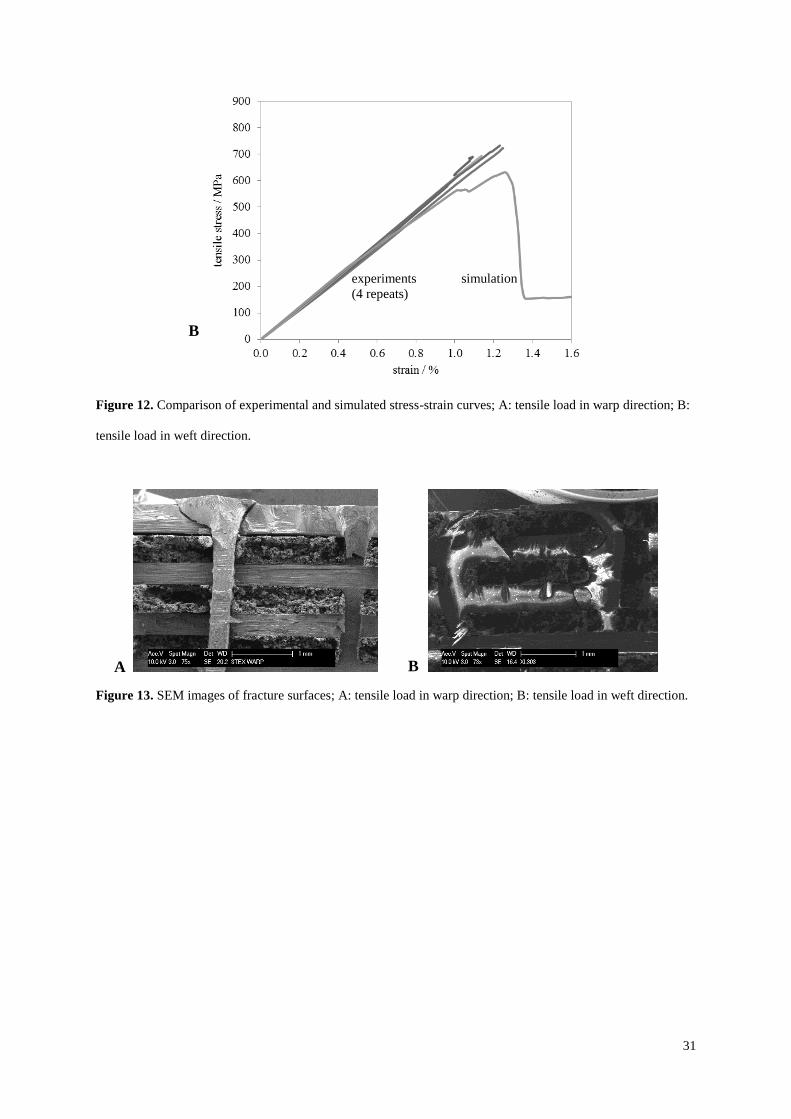
concentrations. However, for loading in weft direction, the predicted onset of unit cell
stiffness reduction at a strain of 0.7 % is not reflected in the experimental data (Fig. 12B). It
can be speculated that this difference is related to the boundary conditions in testing (in
particular imperfect alignment), which may result in successive rather than simultaneous
failure of all unit cells in actual tensile specimens.
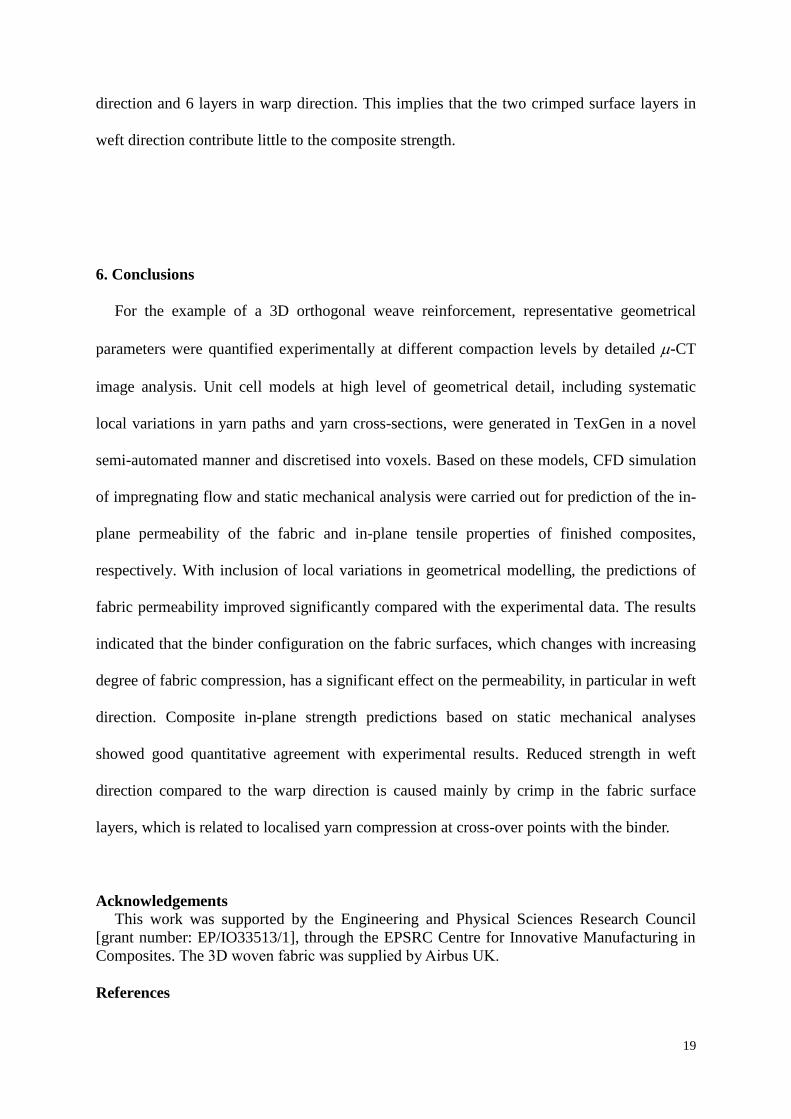
To understand mechanisms of damage initiation, failed tensile specimens were
investigated using Scanning Electron Microscopy (SEM). It was observed (Fig. 13) that, for
in-plane loading in the warp or weft direction, the fracture surfaces were always located in
planes containing binder yarns travelling through the reinforcement thickness, indicating that
damage was initiated around the binders. Similar fracture initiation and subsequent damage
development was predicted by the simulations, despite using a voxel mesh and
implementation of a simple failure model. The reasonable quantitative accuracy of
predictions for the in-plane tensile strength can be attributed mainly to the realistic models
with high level of geometrical detail. As pointed out by Mouritz and Cox [44], local fibre
misalignment because of the presence of the binder may give rise to local axial shear stresses
and may cause plastic strain as irreversible matrix deformation. Further studies are required
to investigate in more detail the relation between composite strength at the unit cell scale and
fabric architecture.
Comparison of calculated properties in warp and weft direction indicates that the failure
strain, which is dominated by the brittle fibres, is similar in both directions at 1.31 % and
1.26 %, respectively. For the strength in both fabric directions, the ratio Fweft/Fwarp would be
expected to be 1.03, reflecting the ratio of fibre volume fractions for 7 layers in weft direction
and 6 layers in warp direction, if all yarns were perfectly straight. The actual ratio, Fweft/Fwarp
= 0.76, is similar to the ratio of fibre volume fractions, Vfweft/Vfwarp = 0.74, for 5 layers in weft
19
direction and 6 layers in warp direction. This implies that the two crimped surface layers in
weft direction contribute little to the composite strength.
6. Conclusions
For the example of a 3D orthogonal weave reinforcement, representative geometrical
parameters were quantified experimentally at different compaction levels by detailed -CT
image analysis. Unit cell models at high level of geometrical detail, including systematic
local variations in yarn paths and yarn cross-sections, were generated in TexGen in a novel
semi-automated manner and discretised into voxels. Based on these models, CFD simulation
of impregnating flow and static mechanical analysis were carried out for prediction of the in-
plane permeability of the fabric and in-plane tensile properties of finished composites,
respectively. With inclusion of local variations in geometrical modelling, the predictions of
fabric permeability improved significantly compared with the experimental data. The results
indicated that the binder configuration on the fabric surfaces, which changes with increasing
degree of fabric compression, has a significant effect on the permeability, in particular in weft
direction. Composite in-plane strength predictions based on static mechanical analyses
showed good quantitative agreement with experimental results. Reduced strength in weft
direction compared to the warp direction is caused mainly by crimp in the fabric surface
layers, which is related to localised yarn compression at cross-over points with the binder.
Acknowledgements
This work was supported by the Engineering and Physical Sciences Research Council
[grant number: EP/IO33513/1], through the EPSRC Centre for Innovative Manufacturing in
Composites. The 3D woven fabric was supplied by Airbus UK.
References
20
1. Mouritz AP, Bannister MK, Falzon PJ, Leong KH. Review of applications for advanced three-dimensional
fibre textile composites. Compos Part A-Appl S 1999; 30(12): 1445-1461.
2. Lomov SV, Bogdanovich AE, Ivanov DS, Mungalov D, Karahan M, Verpoest I. A comparative study of
tensile properties of non-crimp 3D orthogonal weave and multi-layer plain weave E-glass composites. Part
1: Materials, methods and principal results. Compos Part A-Appl S 2009; 40(8): 1134–1143.
3. Ivanov DS, Lomov SV, Bogdanovich AE, Karahan M, Verpoest I. A comparative study of tensile
properties of non-crimp 3D orthogonal weave and multi-layer plain weave E-glass composites. Part 2:
Comprehensive experimental results. Compos Part A-Appl S 2009; 40(8): 1144-1157.
4. Tan P, Tong L, Steven GP, Ishikawa T. Behavior of 3D orthogonal woven CFRP composites. Part I.
Experimental investigation. Compos Part A-Appl S 2000; 31(3): 259-271.
5. Tan P, Tong L, Steven GP. Behavior of 3D orthogonal woven CFRP composites. Part II. FEA and
analytical modeling approaches. Compos Part A-Appl S 2000; 31(3): 273-281.
6. Carvelli V, Gramellini G, Lomov SV, Bogdanovich AE, Mungalov DD, Verpoest I. Fatigue behaviour of
non-crimp 3D orthogonal weave and multi-layer plain weave E-glass reinforced composites. Compos Sci
Technol 2010; 70(14): 2068-2076.
7. Luo Y, Lv L, Sun B, Qiu Y, Gu B. Transverse impact behavior and energy absorption of three-dimensional
orthogonal hybrid woven composites. Compos Struct 2007; 81(2): 202-209.
8. Mohamed MH, Wetzel KK. 3D Woven Carbon/Glass Hybrid Spar Cap for Wind Turbine Rotor Blade, J
Sol Energ - T ASME 2006; 128(4): 562-573.
9. Carvelli V, Pazmino J, Lomov SV, Verpoest I. Deformability of a non-crimp 3D orthogonal weave E-glass
composite reinforcement. Compos Sci Technol 2012; 73: 9-18.
10. Parnas RS, Flynn KM, Dal-Favero ME. A Permeability Database for Composites Manufacturing. Polym
Composite 1997; 18(5): 623-633.
11. Potluri P, Sagar TV. Compaction modelling of textile preforms for composite structures. Compos Struct
2008; 86(1-3): 177-185.
12. Endruweit A, Long AC. Analysis of Compressibility and Permeability of Selected 3D Woven
Reinforcements. J Compos Mater 2010; 44(24): 2833-2862.
13. Mohamed M. 3D Woven Carbon-Glass Hybrid Wind Turbine Blades. In: Wind Turbine Blade Workshop,
Albuquerque, 2004.
14. Ngo ND, Tamma KK. Complex three-dimensional microstructural permeability prediction of porous
fibrous media with and without compaction. Int J Numer Meth Eng 2004; 60(10): 1741-1757.
15. Song YS, Chung K, Kang TJ, Youn JR. Prediction of permeability tensor for three dimensional circular
braided preform by applying a finite volume method to a unit cell. Compos Sci Technol 2004; 64(10-11):
1629-1636.
16. Bale H, Blacklock M, Begley MR, Marshall DB, Cox BN, Ritchie RO, Kerans R. Characterizing Three-
Dimensional Textile Ceramic Composites Using Synchrotron X-Ray Micro-Computed-Tomography. J Am
Ceram Soc 2012; 95(1): 392-402.
17. Karahan M, Lomov SV, Bogdanovich AE, Mungalov D, Verpoest I. Internal geometry evaluation of non-
crimp 3D orthogonal woven carbon fabric composite. Compos Part A-Appl S 2010; 41(9): 1301–1311.
18. Badel P, Vidal-Salle E, Maire E, Boisse P. Simulation and tomography analysis of textile composite
reinforcement deformation at the mesoscopic scale. Compos Sci Technol 2008; 68(12): 2433-2440.
19. Mahadik Y, Brown KAR, Hallett S.R. Characterisation of 3D woven composite internal architecture and
effect of compaction. Compos Part A-Appl S 2010; 41(7): 872-880.
20. Blacklock M, Bale H, Begley M, Cox B. Generating virtual textile composite specimens using statistical
data from micro-computed tomography: 1D tow representations for the Binary Model. J Mech Phys Solids
2012; 60(3): 451-470.
21. Loix F, Badel P, Orgéas L, Geindreau C, Boisse P. Woven fabric permeability: From textile deformation to
fluid flow mesoscale simulations. Compos Sci Technol 2008; 68(7-8): 1624-1630.
22. Mahadik Y, Hallett SR. Finite element modelling of tow geometry in 3D woven fabrics. Compos Part A-
Appl S 2010; 41(9): 1192-1200.
23. Tsukrov I, Bayraktar H, Giovinazzo M, Goering J, Gross T, Fruscello M, Martinsson L. Finite Element
Modeling to Predict Cure-Induced Microcracking in Three-Dimensional Woven Composites. Int J
Fracture 2011; 172(2): 209-216.
24. Desplentere F, Lomov S, Woerdeman D, Verpoest I, Wevers M, Bogdanovich A. Micro-CT
characterization of variability in 3D textile architecture. Compos Sci Technol 2005; 65(13): 1920-1930.
25. Long AC, Brown LP. Modelling the geometry of textile reinforcements for composites: TexGen. In:
Boisse, editor. Composite reinforcements for optimum performance. Cambridge: Woodhead Publishing,
2011. p. 239-264.
26. TexGen (Version 3.5.2). University of Nottingham; 2012. <http://texgen.sourceforge.net> [viewed
27.09.2012].
21
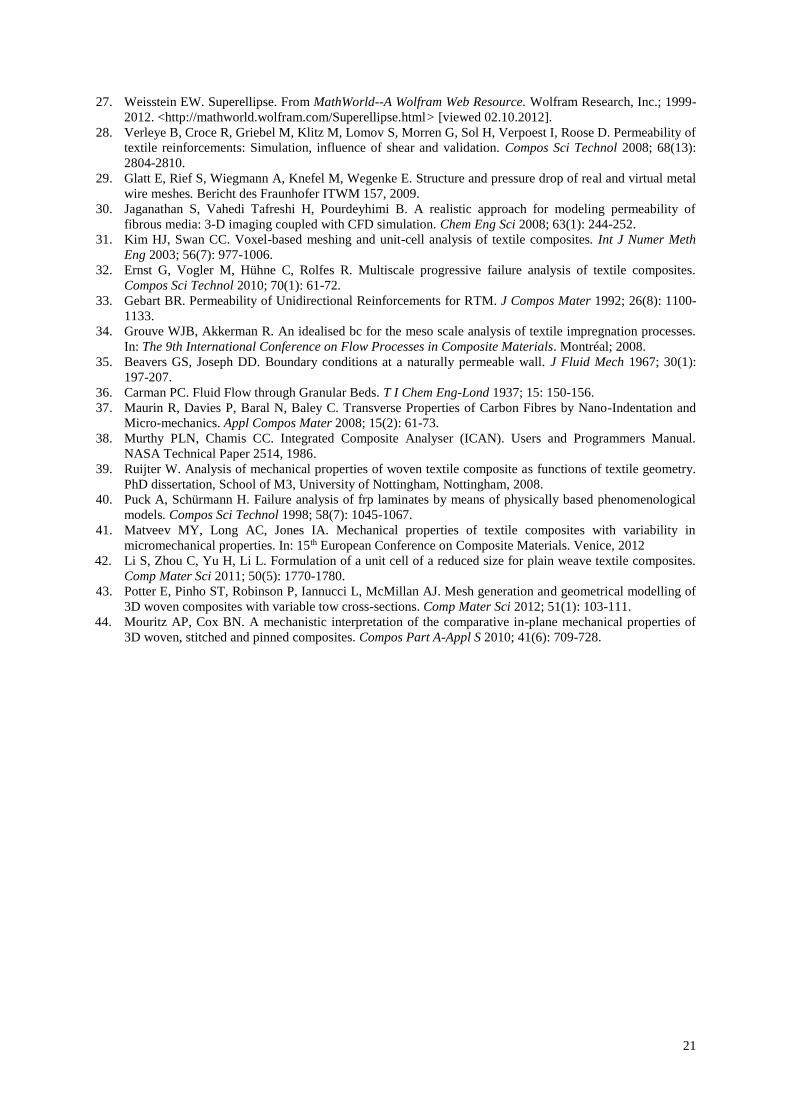
27. Weisstein EW. Superellipse. From MathWorld--A Wolfram Web Resource. Wolfram Research, Inc.; 1999-
2012. <http://mathworld.wolfram.com/Superellipse.html> [viewed 02.10.2012].
28. Verleye B, Croce R, Griebel M, Klitz M, Lomov S, Morren G, Sol H, Verpoest I, Roose D. Permeability of
textile reinforcements: Simulation, influence of shear and validation. Compos Sci Technol 2008; 68(13):
2804-2810.
29. Glatt E, Rief S, Wiegmann A, Knefel M, Wegenke E. Structure and pressure drop of real and virtual metal
wire meshes. Bericht des Fraunhofer ITWM 157, 2009.
30. Jaganathan S, Vahedi Tafreshi H, Pourdeyhimi B. A realistic approach for modeling permeability of
fibrous media: 3-D imaging coupled with CFD simulation. Chem Eng Sci 2008; 63(1): 244-252.
31. Kim HJ, Swan CC. Voxel-based meshing and unit-cell analysis of textile composites. Int J Numer Meth
Eng 2003; 56(7): 977-1006.
32. Ernst G, Vogler M, Hühne C, Rolfes R. Multiscale progressive failure analysis of textile composites.
Compos Sci Technol 2010; 70(1): 61-72.
33. Gebart BR. Permeability of Unidirectional Reinforcements for RTM. J Compos Mater 1992; 26(8): 1100-
1133.
34. Grouve WJB, Akkerman R. An idealised bc for the meso scale analysis of textile impregnation processes.
In: The 9th International Conference on Flow Processes in Composite Materials. Montréal; 2008.
35. Beavers GS, Joseph DD. Boundary conditions at a naturally permeable wall. J Fluid Mech 1967; 30(1):
197-207.
36. Carman PC. Fluid Flow through Granular Beds. T I Chem Eng-Lond 1937; 15: 150-156.
37. Maurin R, Davies P, Baral N, Baley C. Transverse Properties of Carbon Fibres by Nano-Indentation and
Micro-mechanics. Appl Compos Mater 2008; 15(2): 61-73.
38. Murthy PLN, Chamis CC. Integrated Composite Analyser (ICAN). Users and Programmers Manual.
NASA Technical Paper 2514, 1986.
39. Ruijter W. Analysis of mechanical properties of woven textile composite as functions of textile geometry.
PhD dissertation, School of M3, University of Nottingham, Nottingham, 2008.
40. Puck A, Schürmann H. Failure analysis of frp laminates by means of physically based phenomenological
models. Compos Sci Technol 1998; 58(7): 1045-1067.
41. Matveev MY, Long AC, Jones IA. Mechanical properties of textile composites with variability in
micromechanical properties. In: 15th European Conference on Composite Materials. Venice, 2012
42. Li S, Zhou C, Yu H, Li L. Formulation of a unit cell of a reduced size for plain weave textile composites.
Comp Mater Sci 2011; 50(5): 1770-1780.
43. Potter E, Pinho ST, Robinson P, Iannucci L, McMillan AJ. Mesh generation and geometrical modelling of
3D woven composites with variable tow cross-sections. Comp Mater Sci 2012; 51(1): 103-111.
44. Mouritz AP, Cox BN. A mechanistic interpretation of the comparative in-plane mechanical properties of
3D woven, stitched and pinned composites. Compos Part A-Appl S 2010; 41(6): 709-728.
22
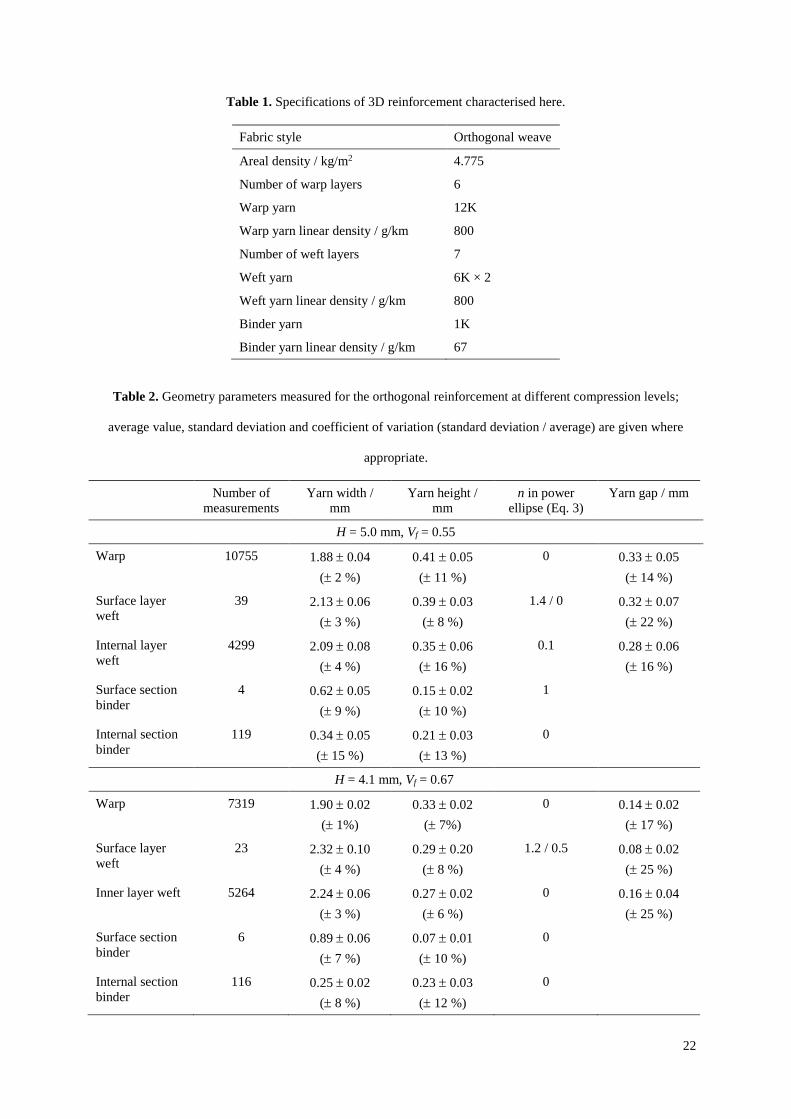
Table 1. Specifications of 3D reinforcement characterised here.
Fabric style Orthogonal weave
Areal density / kg/m2 4.775
Number of warp layers 6
Warp yarn 12K
Warp yarn linear density / g/km 800
Number of weft layers 7
Weft yarn 6K × 2
Weft yarn linear density / g/km 800
Binder yarn 1K
Binder yarn linear density / g/km 67
Table 2. Geometry parameters measured for the orthogonal reinforcement at different compression levels;
average value, standard deviation and coefficient of variation (standard deviation / average) are given where
appropriate.
Number of
measurements
Yarn width /
mm
Yarn height /
mm
n in power
ellipse (Eq. 3)
Yarn gap / mm
H = 5.0 mm, Vf = 0.55
Warp 10755 1.88 0.04
( 2 %)
0.41 0.05
( 11 %)
0 0.33 0.05
( 14 %)
Surface layer
weft
39 2.13 0.06
( 3 %)
0.39 0.03
( 8 %)
1.4 / 0 0.32 0.07
( 22 %)
Internal layer
weft
4299 2.09 0.08
( 4 %)
0.35 0.06
( 16 %)
0.1 0.28 0.06
( 16 %)
Surface section
binder
4 0.62 0.05
( 9 %)
0.15 0.02
( 10 %)
1
Internal section
binder
119 0.34 0.05
( 15 %)
0.21 0.03
( 13 %)
0
H = 4.1 mm, Vf = 0.67
Warp 7319 1.90 0.02
( 1%)
0.33 0.02
( 7%)
0 0.14 0.02
( 17 %)
Surface layer
weft
23 2.32 0.10
( 4 %)
0.29 0.20
( 8 %)
1.2 / 0.5 0.08 0.02
( 25 %)
Inner layer weft 5264 2.24 0.06
( 3 %)
0.27 0.02
( 6 %)
0 0.16 0.04
( 25 %)
Surface section
binder
6 0.89 0.06
( 7 %)
0.07 0.01
( 10 %)
0
Internal section
binder
116 0.25 0.02
( 8 %)
0.23 0.03
( 12 %)
0
23
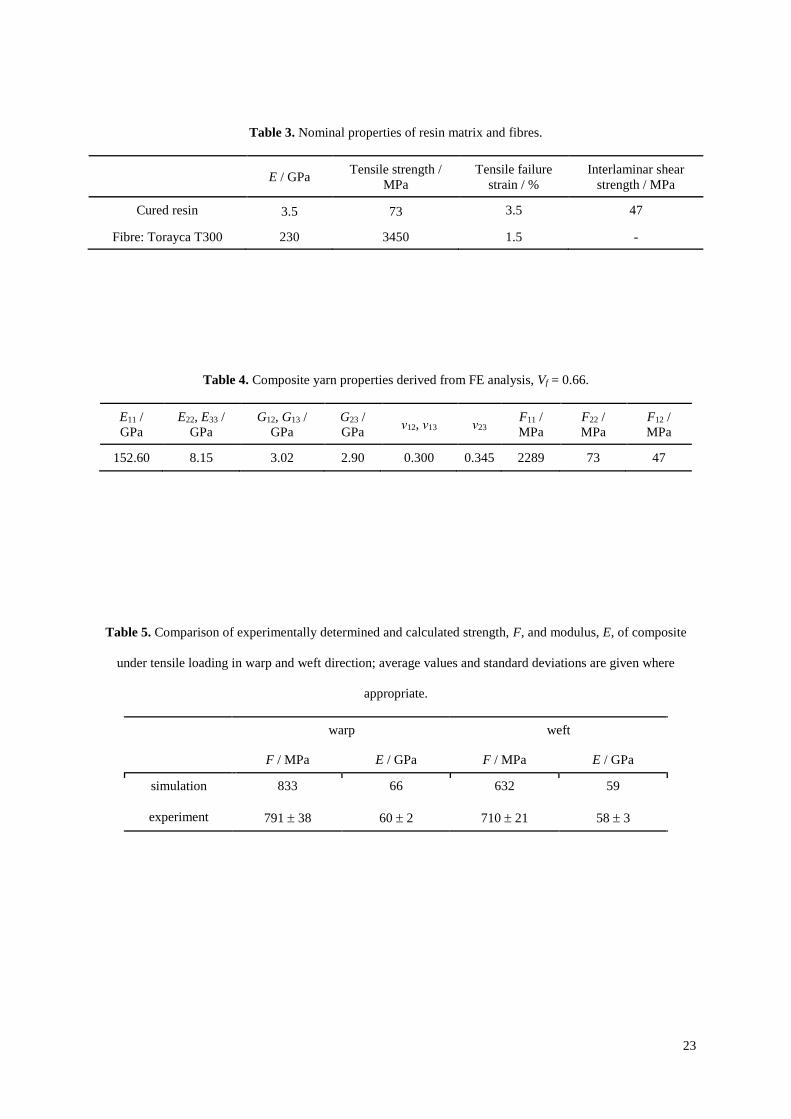
Table 3. Nominal properties of resin matrix and fibres.
E / GPa
Tensile strength /
MPa
Tensile failure
strain / %
Interlaminar shear
strength / MPa
Cured resin 3.5 73 3.5 47
Fibre: Torayca T300 230 3450 1.5 -
Table 4. Composite yarn properties derived from FE analysis, Vf = 0.66.
E11 /
GPa
E22, E33 /
GPa
G12, G13 /
GPa
G23 /
GPa ν12, ν13 ν23
F11 /
MPa
F22 /
MPa
F12 /
MPa
152.60 8.15 3.02 2.90 0.300 0.345 2289 73 47
Table 5. Comparison of experimentally determined and calculated strength, F, and modulus, E, of composite
under tensile loading in warp and weft direction; average values and standard deviations are given where
appropriate.
warp weft
F / MPa E / GPa F / MPa E / GPa
simulation 833 66 632 59
experiment 791 38 60 2 710 21 58 3
24
Figure 1. Identification of yarns and inter-yarn gaps in 3D carbon fibre reinforcement; A-D: progressive image
operations to isolate gap regions; E: labelled gaps in original -CT image; F: binary image of gaps.
Figure 2. Change in yarn geometry under fabric compaction; A: dry fabric at no compression, thickness H = 6.0
mm; B: composite panel at H = 5.0 mm, Vf = 0.55; C: composite panel at H = 4.1 mm, Vf = 0.67.
A B C
25
Figure 3. Definition of binder yarn path for 3D orthogonal weave in TexGen.
Figure 4. Power-ellipse representing yarn cross-section in 3D orthogonal carbon reinforcement; A:
characteristics of power ellipse function at different values of n; B: example for hybrid cross-section.
A B
26
Figure 5. Flowchart for generation of 3D orthogonal weave model with refinement.
Orthogonal Weave Build Textile
Create warp and binder yarns and assign node
positions
Create weft yarns and assign
node positions
Assign cross sections and
properties to yarns
Add repeats and set to Bezier
interpolation
Refining yarn?
Check binder widths: calculate maximum width
and height for through thickness binder yarns
Adjust warp and weft layer heights
(excluding outer weft yarns)
Exceeded maximum yarn
volume fraction?
Adjust outer weft yarns: change to hybrid sections & adjust dimensions
to maintain area or reduce area without exceeding max Vf
Adjust binder yarns: change to hybrid section, increase width & reduce
height to attain target thickness. Introduce crimp in weft if necessary
Shape binder yarns to fit shape of top weft yarn
Return
No
Yes
Yes
No
27
Figure 6. Orthogonal weave generated automatically using TexGen 3DWizard refine option; A: original fabric
thickness, H = 6.32 mm; B: H = 5.03 mm; C: H = 4.43 mm; arrows indicate crimp in outer weft yarns.
Figure 7. Local geometry variations observed in 3D -CT images; A: different binder cross-sections; B:
formation of dimples on surface; C: rectangular cross-sections of warp yarns, more rounded cross-sections of
weft yarns.
A B
C
warp
weft
A B C
28
Figure 8. Permeability predictions with incremental local geometry variations, H = 5.0 mm, Vf = 0.55,
compared to experimental data; error bars on experimental data indicate standard deviation.
exp
erim
ents
stra
igh
t y
arn
s, e
llip
tica
l cro
ss-s
ecti
on
va
ryin
g
bin
der
cr
oss
-sec
tio
n
“d
imp
les”
on
fa
bri
c su
rfa
ce
wa
rp/w
eft
cro
ss-s
ecti
on
s d
iffe
ren
t
29
Figure 9. Principal permeability values, K1 and K2, as a function of the fibre volume fraction, Vf; square
symbols: CFD results; diamond symbols: experimental data; analytical trend lines [34] are also indicated .
Figure 10. Details of binder and weft yarn configurations on fabric surface at different compaction levels; white
lines indicate tool surface; A: H = 5.0 mm, Vf = 0.55; B: H = 4.2 mm, Vf = 0.65.
Kozeny-Carman fit: 2
3)1(
f
f
V
VK
Kozeny-Carman fit: 2
3)1(
f
f
V
VK
A
B
30
Figure 11. Voxel mesh of fabric unit cell for mechanical analysis; voxels representing resin only are not shown.
simulation experiments
(5 repeats)
A
31
Figure 12. Comparison of experimental and simulated stress-strain curves; A: tensile load in warp direction; B:
tensile load in weft direction.
Figure 13. SEM images of fracture surfaces; A: tensile load in warp direction; B: tensile load in weft direction.
experiments (4 repeats)
simulation
B
A B