Embed Size (px)
Citation preview
GEOMORPHIC ASSESSMENT OF THECORTE MADERA CREEK WATERSHED
MARIN COUNTY, CALIFORNIA
FINAL REPORT
December 31, 2000
Matt SmeltzerJames ReillyDavid Dawdy
STETSON ENGINEERS INC.San Rafael and West Covina, California
Mesa, Arizona
Stetson Engineers Inc. i Corte Madera Creek WatershedGeomorphic Assessment
ACKNOWLEDGMENTS
Stetson Engineers would like to thank the following institutions for assistance during thisstudy: Marin County Flood Control District (MCFCD), the Friends of Corte Madera CreekWatershed (FCMCW, or Friends), Marin Municipal Water District (MMWD), Marin CountyOpen Space District (MCOSD), the Natural Heritage Institute, the San Francisco District of theArmy Corps of Engineers (COE), the City of San Anselmo, the Town of Ross, the Departmentsof Landscape Architecture and Environmental Planning, and Geology at the University ofCalifornia at Berkeley, the Regional Water Quality Control Board (RWQCB) Region 2 and theEnvironmental Protection Agency Region 9, the Town of Ross, the San Francisco Bay EstuaryInstitute, and the Department of Geology at the University of California at Davis.
James Reilly managed this project for Stetson Engineers. Stephanie Lapine led historicaldata collection. Matt Smeltzer led field surveys, sediment size distribution analyses, and reportpreparation. David Dawdy, consulting hydrologist, prepared bedload sediment transport modelsand reported on model results. Eve Kliszewski, consulting riparian ecologist, providedassistance with study design and volunteer monitoring protocol development. Steven Plunkettand Wilfredo Ventura aided field surveys, and Doug Williamson and John Gowan preparedgraphics. Jason Alexander and Bryan Adams helped compile the report.
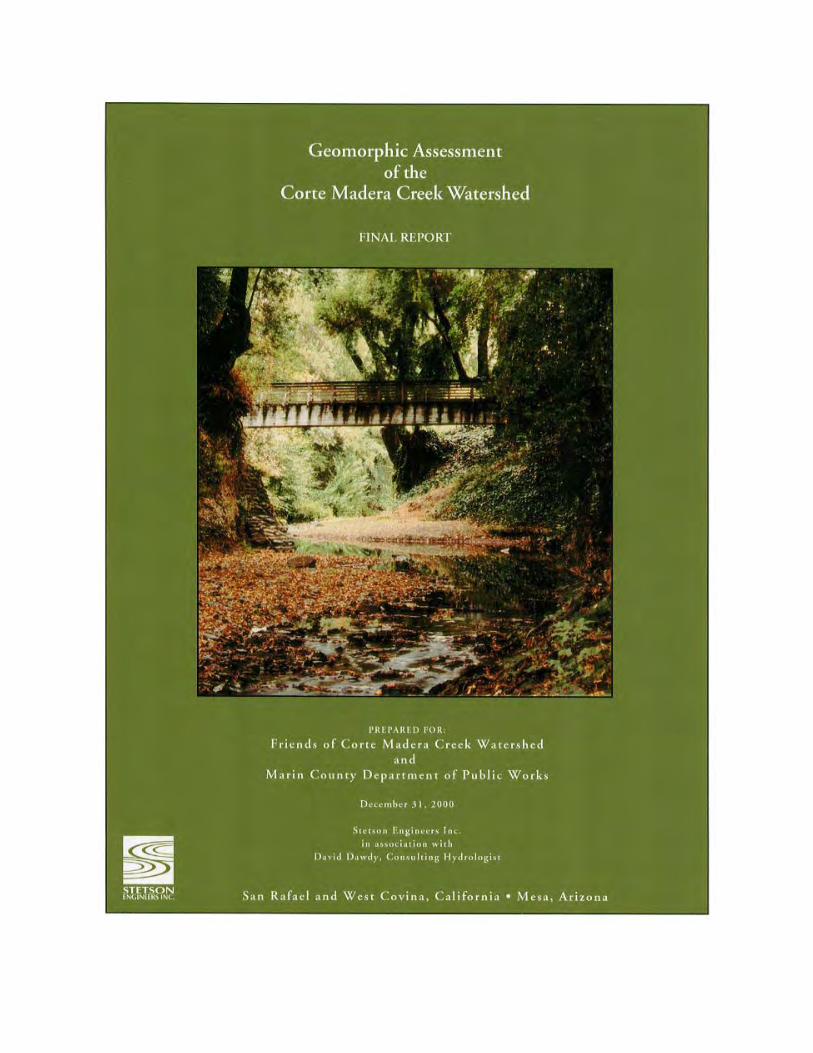
Special thanks are due to MCFCD for surveying benchmark elevations and lendingsurveying equipment, and MMWD and MCOSD for providing information about uplandhillslope management problem sites in the watershed. Thanks are also due to Leonard Sklar andMatt Kondolf, UC Berkeley, for lending technical equipment. Matt Kondolf, UC Berkeley,Andre Lehre, Humboldt State University, Dennis Odion, MMWD, and Mike Napolitano,RWQCB, provided useful technical comments on a preliminary draft of this report. LaurelCollins at the SF Bay Estuary Institute shared Novato Creek watershed assessment results,provided several useful review comments helping relate study results to the Novato Creek casestudy, and helped outline the breadth of potential restoration projects in related public meetings. Liz Lewis, MCFCD, provided a field overview of recent and potential bank stabilization projectsthroughout the watershed. Gregory Andrew, MMWD, provided field assessments of salmonidhabitat typing and suitability at representative sites in the basin. Scott Nicholson, COE, provideduseful comments on preliminary study results and useful references to historical data. CharlesKennard of San Anselmo provided the photograph of San Anselmo Creek reproduced on thereport cover.
Many other colleagues and volunteers that offered professional opinions, data, anecdotalaccounts, technical equipment, and field assistance, included: Rachel Abrams, CayminAckerman, Rich Arik, Paul Bakke, Bruce Baum, Barry Brilliant, Peggy Burt, Bryn Carter, JohnCain, Penny Clark, Adrian Custer, Laurel Collins, Carole D’Alessio, Ryan Barth, PascualBenito, George Davidson, Bill Dietrich, Jerry Draper, Randy Dobson, Peter Downs, AnthonyFalzone, Bill Firth, Sister Mary Forabaschi, Paul Frank, Charlie Goodman, Sandy Guldman,Cathy Hanson, Barry Hecht, Don Hobbs, Bill Hogan, Al Jones, Steve Katz, Jessica Kaufman,Charlie Kennard, Lisa Kimball, Kaeja Klempan, Eric Larsen, Cheryl Lee, Gary Leo, LunaLeopold, Charlotte Levin, Jim McDermott, Eric McGuire, Caty McKenna, Mark Miglio, JasonNutt, Dennis Odion, Jonathan Owens, Janet Parrish, Danielle Partee, Andy Peri, Alice Rich, J.
Stetson Engineers Inc. ii Corte Madera Creek WatershedGeomorphic Assessment
David Rogers, Lee Ross, Dana Roxon, Brian Sanford, Erich Seamon, Richard Slusher, DavidSmith, Rebekah Snodgrass-Grant, Scott Stoller, Michael Swezy, Louis Vaccaro, Sasha Vitomski,Richard Wheeler, Dyan Whyte, John Wooley, and the crew at Marin Stables.
Stetson Engineers would also like to the thank citizens living along creeks in the CorteMadera Creek watershed that allowed us to survey the creek in their backyards and sharedanecdotal information on channel changes, including: Edmond and Carol Avis, WilliamBachman, Mario Baffico, Teresa Balestriere, Kathleen Bray, James Carroll, Jo L. Carson, BeckyE. Carter, Timothy Coffing, Arnold and Tekla Cohn, Helene Cooperman, Tom Cronin, Richardand Patricia Daly, Karen S. Dann, Brett Enclade, Fairfax Lumber, Romney M. Fennell, CharlotteFlanagan, Beryle and Diane Franklin, Carol Foster, Francois S. Gassies, Claudia A. Gibson,Walter and Ann Gillespie, Charlie Goodman, Robert S. Green, Daniel Gumm, Virginia T. Hall,C. Wray Humphrey, Sandra Handsher, Bonnie Hays, Daniel and Lori Hennessey, Nicholas andLilas Ivanoff, Darcy Jarrett, Albert and Susanne Jones, Andrew and Ann Jones, Charles King,Leona Lepage, Candace A. Killman, David and Sharon Litwin, Suzanne M. Mack, John andSusan Marlowe, Joseph and Margaret McGuire, Douglas Moore, Karkabi Naaim, Rainer Neal,Frederick Nelson, Robert and Kathleene Norwood, Linda Parker, David Ramsay, John A. Reed,Joel Renbaum, Betsy W. Robinson, Eugenia Roth, Dianne H. Schoen, Robin and Ktalia Simon,William Simonson, Gunard Solberg, John R. Templeton, The Lark Creek Inn, Carolyn J. Truner,David and Ellen Turner, Dennis Unterman, Louis and Jean Vaccaro, Dora Williams, AdelaideWilson, Kevin and Heidi Woods, and Carol Crane Yandell.
Stetson Engineers Inc. iii Corte Madera Creek WatershedGeomorphic Assessment
TABLE OF CONTENTS
ACKNOWLEDGMENTS........................................................................................................................................... I
TABLE OF CONTENTS ......................................................................................................................................... III
LIST OF TABLES......................................................................................................................................................V
LIST OF FIGURES.................................................................................................................................................. VI
LIST OF APPENDICES ....................................................................................................................................... VIII
TECHNICAL INFORMATION.............................................................................................................................. IX
EXECUTIVE SUMMARY ........................................................................................................................................X
1. INTRODUCTION..............................................................................................................................................1
2. TECHNICAL BACKGROUND AND HISTORICAL ANALYSIS...............................................................2
2.1. DESCRIPTION OF THE CORTE MADERA CREEK WATERSHED AND ITS HOLOCENE CHANNEL EVOLUTION.........22.2. CHANGES IN AQUATIC AND RIPARIAN HABITAT CREATING PROCESSES AND CONDITIONS CAUSED BY RECENTCHANNEL ENTRENCHMENT .......................................................................................................................................42.3. EVIDENCE OF HOLOCENE VALLEY ALLUVIATION AND RECENT CHANNEL ENTRENCHMENT IN MARINCOUNTY WATERSHEDS..............................................................................................................................................52.4. DISTINGUISHING BETWEEN PROBABLE CAUSES OF RECENT CHANNEL ENTRENCHMENT IN THE CORTEMADERA CREEK WATERSHED ...................................................................................................................................7
2.4.1. Short-term Climate Variation ................................................................................................................72.4.2. Sea Level Decline...................................................................................................................................82.4.3. Naturally Unstable Sediment Transport Regime ...................................................................................82.4.4. Modified Land Use.................................................................................................................................8
2.5. NATURAL GEOMORPHIC RECOVERY OF THE CORTE MADERA CREEK WATERSHED’S ENTRENCHED ALLUVIALCHANNEL NETWORK ...............................................................................................................................................112.6. SEDIMENT YIELDS AND A PRELIMINARY SEDIMENT BUDGET FOR THE CORTE MADERA CREEK WATERSHED12
3. THE INFLUENCE OF HISTORICAL DATA SOURCES AND DATA GAPS ON STUDY APPROACH15
3.1. HYDROLOGY, SEDIMENT TRANSPORT, AND SEDIMENT YIELD DATA.............................................................153.1.1. Hydrology Data ...................................................................................................................................153.1.2. Sediment Transport Data and Sediment Yield Estimates .....................................................................153.1.3. Channel Sediment Dredging Records ..................................................................................................163.1.4. Reservoir Sedimentation Data and Dredging Records ........................................................................173.1.5. Hillslope Process Rate Data ................................................................................................................183.1.6. Regional Sediment Transport, Yield, and Budget Estimates from Other Studies.................................19
3.2. HISTORICAL CHANNEL PLANFORM AND CROSS-SECTION GEOMETRY DATA .................................................193.2.1. Historical Aerial Photography.............................................................................................................193.2.2. Historical Bed Elevation and Cross-section Data ...............................................................................203.2.3. Historical Longitudinal Profile Data...................................................................................................223.2.4. Historical Ground Photography ..........................................................................................................223.2.5. Historical Maps ...................................................................................................................................233.2.6. Historical Accounts..............................................................................................................................23
4. SEDIMENT BUDGET METHODS ...............................................................................................................25
Stetson Engineers Inc. iv Corte Madera Creek WatershedGeomorphic Assessment
4.1. MEASURING HISTORICAL CHANGES IN CHANNEL GEOMETRY .......................................................................254.2. ESTIMATING SEDIMENT YIELD BY NET CHANNEL BED AND BANK EROSION .................................................254.3. ESTIMATING SUBWATERSHED BEDLOAD SEDIMENT LOADS AND YIELDS ......................................................264.4. ESTIMATING TOTAL BEDLOAD SEDIMENT BUDGET AT ROSS .........................................................................27
5. RESULTS .........................................................................................................................................................28
5.1. ESTIMATED SEDIMENT YIELD BY NET BED AND BANK EROSION ...................................................................285.2. ESTIMATED SUBWATERSHED BEDLOAD SEDIMENT YIELDS ...........................................................................285.3. ESTIMATED SEDIMENT BUDGET AND CALIBRATED YIELD ESTIMATE AT ROSS ..............................................295.4. HISTORICAL CHANNEL BED INCISION AND AGGRADATION RATES ...................................................................30
6. DISCUSSION ...................................................................................................................................................31
6.1. ESTIMATED BEDLOAD SEDIMENT BUDGET AND YIELD AT ROSS....................................................................316.2. PROBLEM SUBWATERSHEDS...........................................................................................................................326.3. IMPLICATIONS OF RESULTS FOR FLOOD MANAGEMENT GOALS .....................................................................346.4. IMPLICATIONS OF RESULTS FOR WATERSHED AND HABITAT RESTORATION GOALS ......................................34
7. REFERENCES CITED ...................................................................................................................................37
8. TABLES............................................................................................................................................................43
9. FIGURES........................................................................................................................................................LII
Stetson Engineers Inc. v Corte Madera Creek WatershedGeomorphic Assessment
LIST OF TABLES*Tables 4-12 are appended to the end of the document.
TABLE PAGE
Executive Summary Table xiv
Table 1 Possible Causal Modes of Channel Entrenchment 7
Table 2 Estimated Sediment Budget for Van Duzen River Watershed At Bridgeville 13
Table 3 Preliminary Conceptual Sediment Budget for Corte Madera Creek Watershed atRoss 14
Table 4 Estimated average annual sediment yield by net channel bed andbank erosion in the alluvial channel network above Ross, 1976-1999 Tables*
Table 5 Estimated average annual bedload sediment yield from major CorteMadera Creek subwatersheds
Table 6 Sediment extracted from Corte Madera Creek channel bed in vicinityof Lagunitas Road Bridge at Ross, 1987-1999
Table 7 Sediment extracted from channel bed in the vicinity of College of MarinBridge at Kentfield, 1972-1998
Table 8 Preliminary estimated sediment budget for Corte Madera CreekWatershed at Ross, 1976-1999
Table 9 Comparison of estimated sediment yields and budget to other sedimentyield and budget studies in the region
Table 10 Summary of existing suspended and bedload sediment yield data fornorthern California Coast Range watersheds
Table 11 Comparison of estimated channel incision and channel bank retreatrates with results of other studies in the region
Table 12 Comparison of relative subwatershed sediment yields with results ofother sediment yield and budget studies in the region
Stetson Engineers Inc. vi Corte Madera Creek WatershedGeomorphic Assessment
LIST OF FIGURES* All figures are appended to the end of the document.
Figure 1 Location of Corte Madera Creek Watershed .............................................. Figures*
Figure 2 Corte Madera Creek Watershed and major subwatersheds
Figure 3 Schematic view of pre-entrenchment and post-entrenchment ripariancorridor in lower alluvial channel network
Figure 4 Average annual precipitation distribution
Figure 5 Average annual hydrograph at Ross Gage, 1951-1993
Figure 6 Alluvial channel network, upland-alluvial channel network transitions, andapproximate drainage density
Figure 7 (omitted)
Figure 8 (omitted)
Figure 9 Longitudinal profile of the mainstem Corte Madera - San Anselmo Creek
Figure 10 Historical channel geometry and channel bed elevation fluctuation at Ross Gage
Figure 11 Head of cattle in Marin County, 1830 - 1910
Figure 12 Historical distribution of livestock grazing
Figure 13 Historical distribution of forested versus grassland, grass-oak woodland, orchaparral vegetation cover and urban land uses
Figure 14 Schematic pre-urbanization and post-urbanization flood hydrographs
Figure 15 Conceptual timeline of land use, peak runoff, sediment yield, and channelresponses in the Corte Madera Creek Watershed, 1800-2100
Figure 16 Conceptual representation of natural geomorphic recovery of Corte MaderaCreek’s entrenched alluvial channel network
Figure 17 Generalized geology map
Figure 18 Preliminary sediment budget
LIST OF FIGURES (CONT.)
Stetson Engineers Inc. vii Corte Madera Creek WatershedGeomorphic Assessment
Figure 19 Locations of modeled subwatershed outlet sites
Figure 20 Landslide distribution
Figure 21 Gully distribution
Figure 22 Percent hillslope distribution
Figure 23 Locations and descriptions of typical active upland sediment sources and erosion management problems
Figure 24 Geologic terrain types ranging from highest to lowest landslide frequency andhillslope instability
Figure 25 Underlying geologic type and vegetative cover
Figure 26 Measured historical channel bed elevation changes in alluvial channel network,1976-1999
Stetson Engineers Inc. viii Corte Madera Creek WatershedGeomorphic Assessment
LIST OF APPENDICES
(The appendices are included in a separate electronic document. The names of the appendicesare provided here for reference.)
Appendix A Aerial Photography of the Corte Madera Creek Watershed
Appendix B Descriptions of Upland Sediment Management Problems
Appendix C Bedload Sediment Yield Modeling Methods
Appendix D Survey Benchmark Elevations and Descriptions
Appendix E Subwatershed Outlet Channel Survey Data
Appendix F Surface Sediment Size Distribution Data
Appendix G Subsurface Sediment Size Distribution Data
Appendix H Uncalibrated Subwatershed Outlet Stage-Discharge Rating Curves
Appendix I Bibliography of Historical Maps, Photographs, and other Accounts
Appendix J Methodology for Assessment of the Suitability of Candidate Sites forImplementation of Infiltration Enhancement Measures
Appendix K Conceptual Streambank Stabilization Measures for a Hypothetical Case Study
Appendix L Conceptual Floodplain Restoration Measures for a Hypothetical Case Study
Stetson Engineers Inc. ix Corte Madera Creek WatershedGeomorphic Assessment
TECHNICAL INFORMATION
This report is intended to provide interested citizens as well as environmental scientistsand engineers with accessible information on historical and present watershed processes. Everyattempt has been made to avoid excessive use of technical jargon, without also sacrificingprecise technical meaning and concise presentation. Useful definitions and technical informationwere reserved for this section of the report.
The study distinguishes the upland channel network from the alluvial channel network(Figure 6) for the sediment budgeting purposes. The upland channel network is defined as zero-,first-, second-, and third-order channels rising in steep upland areas where the mainstemchannels are cut in colluvium (primarily landslide and earthflow deposits from upslope) in steepv-shaped canyons. By this definition, upland channels do not have floodplains. The alluvialchannel network includes mainstem channels and downstream portions of tributary channels cutin the valley fill alluvium deposited during the Holocene by debris flows and overbank floodingon the valley flat. Alluvial channels occupy u-shaped valleys with active floodplains (i.e.,flooded at least once every several years) or abandoned floodplains (terraces). Upland-alluvialchannel transitions occur at the first point moving downstream where alluvium is present in thechannel banks, where mainstem channels leave the confinement of v-shaped valleys, tolower-gradient u-shaped valleys flanked with active or abandoned floodplains (Figure 6).
The study refers to channel entrenchment that occurred throughout the alluvial channelnetwork in response to land use changes associated with European settlement of the region. Entrenchment, or incision, is the lowering, or degradation, of the bed elevation of a stream bychannel bed erosion. Channel aggradation refers to increasing channel bed elevation by netdeposition of sediment on the bed over time.
The study focusses its analysis and discussion of sediment transport on the portion of thesediment load carried by streams that travels along the channel bed in intermittent contact withthe bed, such as by rolling, and skipping along the bed. This portion of the sediment load isreferred to as bedload, as distinguished the finer sediment material that is carried within thewater column, or suspended load. Bedload is an important management issue, as it is thematerial that is deposited in the flood control channel at Ross.
This report uses the English units system to maintain consistency with historical datasources, including various COE analyses. Some useful metric conversions are as follows:
1 square mile (sq. mi.) = 2.56 square kilometers (km2)1 cubic yard (yard) = 0.917 cubic meters (m2)1 cubic yard (yard) = 1.35 english tons (tons)1 english ton (ton) = 0.91 metric tonnes (t)
1 english ton per square mile (tons/sq.mi.) = 0.355 metric tonnes/square kilometer (t/km2) 1 cubic foot per second (cfs) = 0.028 cubic meters per second (cms)
Stetson Engineers Inc. x Corte Madera Creek WatershedGeomorphic Assessment
EXECUTIVE SUMMARY
Sand and gravel deposition in the flood control channel downstream from Ross creates acommon perception that the Corte Madera Creek watershed produces an unnaturally highsediment yield. Channel widening and local bank failures throughout the watershed’s alluvialchannel network also create a common perception that channel bank erosion produces asignificant portion of the sediment yield. Sand and gravel comprise the coarse portion ofsediment inflow at Ross, or the ‘bedload’. Sand and gravel bedload deposition in the floodcontrol channel significantly reduces its flood control performance. For this reason, estimatingthe amount and sources of bedload sediment inflow at Ross is of particular concern to this study.
This study presents a preliminary estimated bedload sediment budget for Corte MaderaCreek at Ross and evaluates whether or not the sediment load at Ross is unnaturally high. Tofocus possible future remedial efforts, this study also evaluates whether or not channel erosioncontributes a significant portion of the sediment yield. The budget accounts for sedimentgenerated by net channel bed and bank erosion along the alluvial channel network, and sedimentgenerated by fluvial transport from unregulated upland areas above Ross (about two square milesof the Ross Creek subwatershed is regulated by Phoenix Reservoir). The budget provides apreliminary, uncalibrated estimate of total sediment yield at Ross that can be compared topublished COE sediment yield estimates at Ross and sediment yields measured or estimated forother comparable watersheds in the region.
This study also presents an independent bedload sediment inflow estimate at Rossobtained from a Parker-Klingeman sediment transport model calibrated with available existingUSGS bedload transport data. This yield value can be compared to this study’s sediment budgetestimates, COE bedload inflow estimates, and other regional data.
Sediment Budget Methods
To quantify the upland sediment budget components, the Parker-Klingeman bedloadtransport model was used to estimate bedload sediment yield from ten major Corte MaderaCreek subwatersheds. Seven of the major subwatersheds contribute sediment from 72 percent ofthe unregulated drainage area above Ross. The study also substituted Parker-Klingeman shearvalues with USFS shear values to provide a range of estimated values. The sediment budgetallows comparison of sediment contribution per unit drainage area for various upland sourceareas in the watershed. This study also produced qualitative sediment yield classification mapsbased on existing USGS landslide habitat and slope stability data to provide independentpredictions of relative subwatershed sediment yields.
To quantify sediment contribution from the alluvial zone, this study resurveyed 44historical channel cross-sections and historical channel bed elevations compiled from 1976FEMA and HUD Flood Insurance Study records. These comparative data combined withextensive field observations provided average values of net channel bed lowering and channel

Stetson Engineers Inc. xi Corte Madera Creek WatershedGeomorphic Assessment
bank retreat from which sediment yield by both channel bed and channel bank erosion in theentire alluvial channel network could be estimated for 1976-1999. Thus, the budget also allowssediment yield by channel bed and bank erosion to be compared to sediment yield by fluvialtransport from aggregate hillslope sediment sources in the surrounding upland areas.
Sediment Budget Results
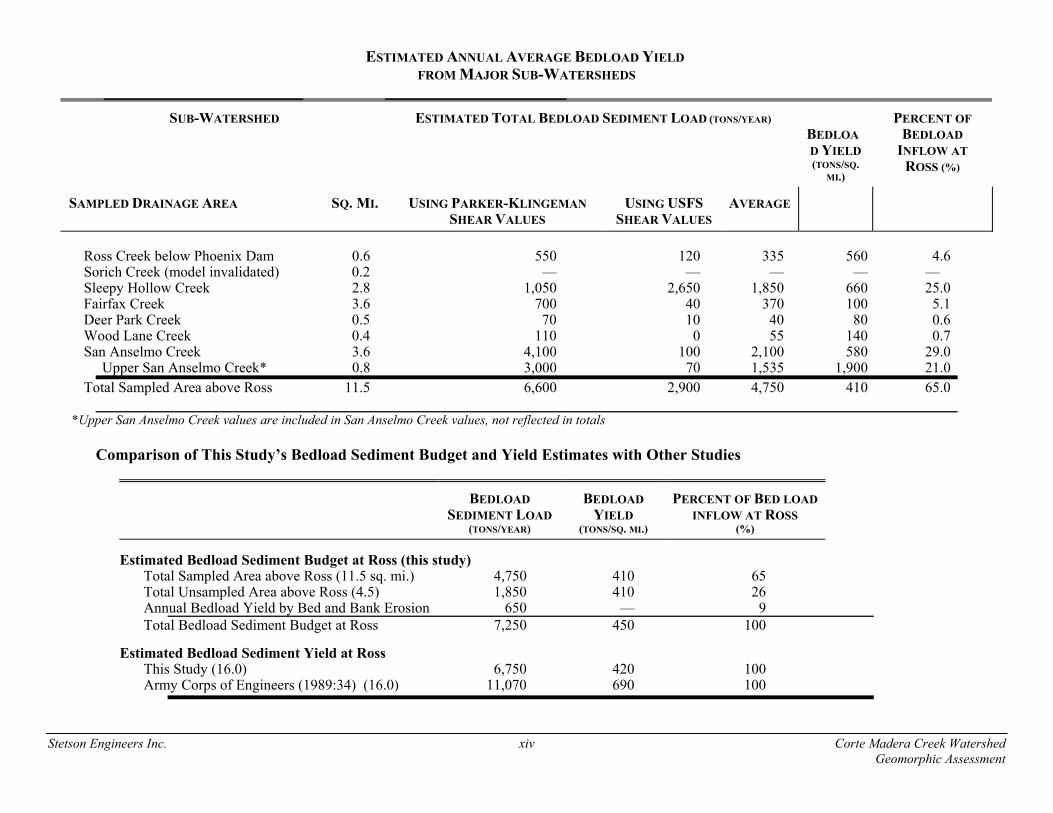
This study’s uncalibrated sediment budget estimates that the Corte Madera CreekWatershed supplies about 7,250 tons of bedload each year to the reach above Ross. Thecalibrated Parker-Klingeman sediment transport model estimated average bedload sedimentinflow at Ross is about 6,750 tons/year. Using an average of the two results, the study estimatesthat about 7,000 tons/year of bedload are delivered to Ross, or about 450 tons/sq.mi./year.
This range of estimated values is about 45 percent greater than Lehre’s (1982) detailedestimate for the Lone Tree Creek basin (240 tons/sq.mi./year), a comparable basin insouthwestern Marin County with fewer upland roads and less precipitation. Due to persistentupland land use impacts, namely increased drainage density caused by 19th century logging andgrazing, the Corte Madera Creek watershed's bedload sediment yield can be considered to beunnaturally high. If the natural background rate were estimated conservatively to be 350 tons/sq.mi./year, than the human-induced increase in bedload inflow at Ross would be about 1,600tons/year.
This study’s estimates of bedload inflow at Ross are about 40 percent less than the11,070 tons/year value the COE’s 1989 sediment transport model predicted for average bedloadsediment inflow at Ross. It should be noted that this study’s bedload sediment yield estimatesare expected to be about 10 percent less than the COE’s model prediction, because this study’sestimate did not include ‘very fine’ and ‘fine’ sand size fractions that were included in COE’sbedload inflow prediction. Thus, this study’s prediction is about 20-30 percent less than COE’sestimate.
This study’s bedload yield estimates are also about 40 percent less than values estimatedin the Eel River watershed, which can be considered upper limit values due to a greater degree ofmelange deformation and tectonic uplift, and continuing upland land use impacts. Yields fromthe Eel River basin are among the highest in western North America. The COE’s yield estimateis closer to upper limit values measured in the Eel River basin than this study’s estimate, orresults from other studies in the region.
Sediment Sources in the Watershed
This study’s sediment budget estimated that channel bed and bank erosion in thewatershed’s alluvial channel network generated about 9 percent of the total bedload sedimentload at Ross, for 1976-1999. Observed average channel bed incision and bank retreat rateestimates were comparable to average values reported in the existing studies of comparablewatersheds (i.e. Novato Creek and Walker Creek). Fluvial transport from upland channelnetworks generated about 91 percent of the total sediment yield at Ross. This 91:9 ratio of
Stetson Engineers Inc. xii Corte Madera Creek WatershedGeomorphic Assessment
upland/channel bank sediment sources is comparable to results of detailed sediment budgetscompiled for other Marin County watersheds and Eel River tributaries.
Total elimination of bank erosion and systemic channel widening throughout the alluvialchannel network would probably reduce bedload sediment delivery to Ross by as much as about430 tons/yr, only 6 percent of the total bedload delivered to Ross. Total elimination of theadditional sediment supply by restoration of problem sediment sources and improved hillslopemanagement practices would probably reduce bedload sediment delivered to Ross by as much asabout 1,600 tons/yr, or about 20% of the annual bedload inflow.
This study indicates that the San Anselmo Creek and Sleepy Hollow Creeksubwatersheds contribute about 29 percent and 26 percent, respectively, of the total bedloadsediment inflow at Ross. Detailed sediment budget studies of northern California CoastRange watersheds indicate that the sediment source mechanisms dominating long-term averagesediment yield are landsliding and earthflows. Thus, the frequency of mass wasting canprobably be considered a suitable surrogate for long-term average bedload sediment yield in theCorte Madera Creek watershed. Available interpretive USGS maps of potential hillslopeinstability and landslide frequency show that greatest potential hillslope instability and landslidefrequency occurs in the San Anselmo Creek and Sleepy Hollow Creek subwatersheds. Fieldreconnaissance also provided evidence that these subwatersheds produce relatively largesediment yields.
Other studies have shown that underlying geologic type is one of the strongest influenceson hillslope and total sediment yield. Kelsey (1980) showed that rolling-to-hummocky grasslandand grass-oak woodland-covered Franciscan melange slopes can produce about 30 times moresediment per square mile than steep, forested sandstone and shale slopes. The San AnselmoCreek and Sleepy Hollow Creek subwatersheds have a greater percentage of grassland, grass-oakwoodland, and chaparral-covered melange slopes than other Corte Madera Creek subwatersheds. Forested sandstone slopes occur primarily in the Larkspur Creek, Tamalpais Creek, and RossCreek subwatersheds above Phoenix Lake, and substantial portions of the Fairfax Creeksubwatershed.
Present Trajectory of Channel Change
This study also evaluated the present state and trajectory of the channel’s naturalgeomorphic recovery from recent channel entrenchment. Corte Madera Creek’s alluvial channelnetwork became moderately to deeply entrenched in the Holocene valley fill in about 1850-1910,abandoning its pre-entrenchment floodplain. Rapid channel entrenchment was evidently inpartial response to logging and increasing livestock grazing intensity from the middle to late1800s, coinciding with a period of somewhat greater than normal precipitation. After about1910, numerous natural bedrock and human infrastructural grade controls outcropped in thechannel bed, slowed the channel incision rate, and accelerated channel widening. Naturalgeomorphic recovery processes that recover aquatic and riparian habitat lost during channelentrenchment are operating in the Corte Madera Creek watershed, including: progressiveupstream channel aggradation in the lower portion of the mainstem Corte Madera Creek, and
Stetson Engineers Inc. xiii Corte Madera Creek WatershedGeomorphic Assessment
channel bed level stabilization, channel widening, inset floodplain formation, and pool-riffledevelopment in the middle and upper portions of the alluvial channel network.
Progressive upstream channel aggradation evidently ceased in about 1964. Ongoingchannel widening, and inset floodplain formation in the middle and upper portion of the alluvialchannel network indicate that natural geomorphic recovery processes are ongoing butincomplete in the Corte Madera Creek watershed. However, constraints imposed byurbanization of the pre-entrenchment floodplain limit the rate of natural habitat improvementboth by preventing channel widening with bank protection and flood control structures, androuting storm water directly into the channel network from impermeable surfaces. As a priority,projects intended to improve flood control and/or aquatic and riparian habitat andhabitat-supporting processes and flood control should seek opportunities, where possible, toincrease active channel width rather than strictly prevent bed incision or bank retreat. This studypresents a conceptual demonstration floodplain restoration/construction project design for ahypothetical site in the watershed with sufficient undeveloped land adjacent to the channel. Thisstudy also presents a conceptual design for streambank stabilization for a hypothetical site whereresidential and commercial development prevent extensive floodplain restoration/construction.
This study also presents a methodology and preliminary suitability mapping to implementsite stormwater retention/drainage best management practices that would increase alluvialgroundwater storage and summer low flow discharges in the watershed. Discontinuous surfaceflow during the summer low-flow season is an important limiting factor for salmonid habitat.
Stetson Engineers Inc. xiv Corte Madera Creek WatershedGeomorphic Assessment
ESTIMATED ANNUAL AVERAGE BEDLOAD YIELD FROM MAJOR SUB-WATERSHEDS
SUB-WATERSHED ESTIMATED TOTAL BEDLOAD SEDIMENT LOAD (TONS/YEAR)BEDLOAD YIELD(TONS/SQ.
MI.)
PERCENT OFBEDLOAD
INFLOW ATROSS (%)
SAMPLED DRAINAGE AREA SQ. MI. USING PARKER-KLINGEMANSHEAR VALUES
USING USFSSHEAR VALUES
AVERAGE
Ross Creek below Phoenix Dam 0.6 550 120 335 560 4.6Sorich Creek (model invalidated) 0.2 — — — — —Sleepy Hollow Creek 2.8 1,050 2,650 1,850 660 25.0Fairfax Creek 3.6 700 40 370 100 5.1Deer Park Creek 0.5 70 10 40 80 0.6Wood Lane Creek 0.4 110 0 55 140 0.7San Anselmo Creek 3.6 4,100 100 2,100 580 29.0 Upper San Anselmo Creek* 0.8 3,000 70 1,535 1,900 21.0Total Sampled Area above Ross 11.5 6,600 2,900 4,750 410 65.0
*Upper San Anselmo Creek values are included in San Anselmo Creek values, not reflected in totals
Comparison of This Study’s Bedload Sediment Budget and Yield Estimates with Other Studies
BEDLOADSEDIMENT LOAD
(TONS/YEAR)
BEDLOADYIELD
(TONS/SQ. MI.)
PERCENT OF BED LOADINFLOW AT ROSS
(%)
Estimated Bedload Sediment Budget at Ross (this study)Total Sampled Area above Ross (11.5 sq. mi.) 4,750 410 65Total Unsampled Area above Ross (4.5) 1,850 410 26Annual Bedload Yield by Bed and Bank Erosion 650 — 9Total Bedload Sediment Budget at Ross 7,250 450 100
Estimated Bedload Sediment Yield at RossThis Study (16.0) 6,750 420 100Army Corps of Engineers (1989:34) (16.0) 11,070 690 100
Stetson Engineers Inc. 1 Corte Madera Creek WatershedGeomorphic Assessment
1. INTRODUCTION
Stetson Engineers, in association with David Dawdy, consulting hydrologist, prepared ageomorphic assessment of the Corte Madera Creek watershed for the Friends of Corte MaderaCreek and the Marin County Flood Control District. The assessment was intended to documenthistorical and ongoing channel changes, infer historical resulting changes in aquatic and riparianhabitat, and evaluate the average annual bedload sediment yield from various majorsubwatersheds. Understanding the distribution of major sediment source areas in the watershed,and the trajectory of ongoing channel changes, are important for outlining and prioritizingdemonstration projects intended to reduce excess watershed sediment yield, improve aquatic andriparian habitat, and improve flood management. An Executive Summary is provided at thebeginning of this report.
Section 2 summarizes historical changes in channel form (particularly channelentrenchment), and associated changes in habitat-creating geomorphic processes, and resultingaquatic and riparian habitat. Channel entrenchment is attributed to specific historicalhuman-induced and natural changes in peak runoff. Evidence of ongoing natural post-entrenchment geomorphic recovery processes is summarized, and the trajectory of future channelchange is discussed. Section 3 summarizes the results of existing data collection, identifyingdata gaps, as well as data that were useful to the present study. Sections 2 and 3 together providean historical and technical background for justifying the scope of the study’s applied fieldsurveys, sediment yield modeling, and sediment budget estimates. These sections also providebackground for properly interpreting the study’s results.
Section 4 summarizes field survey and modeling methods used in this study. Additionaltechnical notes are contained in the report’s appendices. Section 5 contains results of sedimentbudget estimates and independent sediment yield estimates for Corte Madera Creek at Ross. These results provide bedload inflow estimates and average watershed and subwatershedsediment yield values that can be compared to results of other studies. Comparisons are drawnin Section 5 and Section 6. Section 6 also discusses implications and reliability of study results,and identifies “problem subwatersheds”. Implications for the study results for floodmanagement and habitat restoration goals are emphasized. Study conclusions are contained inthe Executive Summary.
Appendix J presents a methodology and preliminary suitability mapping to implementsite stormwater retention/drainage best management practices that would increase alluvialgroundwater storage and summer low flow discharges in the watershed. Appendix K presents aconceptual design for streambank stabilization for a hypothetical site where residential andcommercial development prevent extensive floodplain restoration/construction. Appendix Lpresents a conceptual demonstration floodplain restoration/construction project design ispresented for a hypothetical site in the watershed with sufficient undeveloped land adjacent tothe channel.
Stetson Engineers Inc. 2 Corte Madera Creek WatershedGeomorphic Assessment
2. TECHNICAL BACKGROUND AND HISTORICAL ANALYSIS
2.1. DESCRIPTION OF THE CORTE MADERA CREEK WATERSHED AND ITSHOLOCENE CHANNEL EVOLUTION.
Marin County occupies a portion of the northern California Coast Range surrounded bythe Pacific Ocean on the west and the San Francisco Bay on the southeast (Figure 1). Thelandscape is typified by small watersheds draining steep, thinly mantled, forested and grasslandslopes. Steep upland channels collect and flow through relatively steep, narrow, clayey andgravelly valley flats resting in deep folds in the terrain, and finally into broad salt marshestuaries. The landscape is underlain by a highly deformed accumulation of pre-Cretaceouscontinental margin deposits (primarily marine sedimentary sandstones and shales) of theFranciscan Formation (Figure 17). Watersheds in this geologic province typically producesediment yields among the highest in North America (Judson and Ritter 1964, Brown and Ritter1971, Knott 1971, Janda 1975, Brown 1975).
Corte Madera Creek drains a 28-sq. mi. area of eastern Marin County (Figure 1). Itswestern boundary is formed by a steep, forested ridge running northwest from the East Peak ofMt. Tamalpais (elevation 2,671 ft) to Pine Mountain and then north-northeast to Loma Alta(elevation 1,592 ft). San Anselmo, Fairfax, and Sleepy Hollow Creeks rise along these ridgesand drain steep upland areas onto relatively steep and laterally confined alluvial valley flats;these creeks combine as San Anselmo Creek in Ross Valley at San Anselmo (Figure 2). SanAnselmo Creek then flows southeast through Ross Valley along the Cretaceous sandstone ridgerunning southeast along the eastern edge of the basin. Several minor intermittent tributaries riseon the grassland and grass-oak woodland-covered hills along the northern and eastern edges ofthe basin. Ross Creek is a major tributary to San Anselmo Creek at Ross. The channel is calledCorte Madera Creek from the Ross Creek confluence to San Francisco Bay Estuary. It drainsinto a tidal salt marsh at Kentfield, and then into San Francisco Bay near Corte Madera. Larkspur Creek and Tamalpais Creek are the only major tributaries to Corte Madera Creek thatenter downstream from the tidal influenced zone’s upstream limit at Kentfield and the USGSGage at Ross.
Corte Madera Creek watershed’s steep relief, high sediment yield, continuing tectonicuplift and faulting, variable and fire-prone vegetative cover, active hillslope processes, and itssemi-arid Mediterranean climate punctuated by occasionally severe cyclonic rainstorms, allcontribute to its dynamic and spectacular natural environment. About 83 percent of total annualprecipitation in the basin occurs as rain in the five months between November 1 and April 1(COE 1961). Average annual rainfall varies from about 48 inches along its southwestern edge toabout 34 inches along its northeastern edge (Figure 4). Distribution of total rainfall across thewatershed area during individual large storms varies between storms. Total rainfall is greater inthe southwestern portion of the basin than the northeastern portion, as Loma Alta and the PilotKnob/Ross Hill/Bald Hill areas (Figure 2) typically receive the greatest total precipitation duringlarge storms (COE 1961). The Pilot Knob area near Ross and Kentfield often reports the highestprecipitation of any station in the San Francisco Bay Area.
Stetson Engineers Inc. 3 Corte Madera Creek WatershedGeomorphic Assessment
The only USGS stream flow gage in the basin is above the tidal influenced zone at Ross(Figure 2). The Ross Gage captures an 18.3-sq. mi. portion of the 28-sq. mi. basin (COE 1961). The USGS measured mean daily flow at the Ross Gage from 1951 until it was discontinued in1993. The Marin County Flood Control District maintained the gage after 1993. The largestdischarge of record at Ross (about 6,000 cfs) occurred in January 1982. Only about 6 percent oftotal annual precipitation occurs in the five months between May 1 and October 1 (COE 1961). Summer base flow is low and discontinuous throughout the channel network during normal anddry years (Figure 5). For example, the Friends of Corte Madera Creek (1997) reported therewere at least 25 no-flow days per year at Ross, averaging 69 no-flow days per year in 1988-1993. Year-round shallow ground-water discharge maintains discontinuous surface flow atisolated locations throughout the watershed. Rich (2000) details recent field investigations ofdiscontinuous surface flow.
During the rainy season, intermittent stream channels and gullies rise in upland zero-order subbasins with drainage areas greater than about 0.01 square miles (about 5 acres; Figure6). Upland mainstem stream channels are typically narrow, shallow, straight, steep, bouldercascade and step-pool channels cut in bedrock, colluvium, and landslide and debris flowdeposits, sometimes along active faults. Overland and channelized fluvial sediment transport,downslope soil creep, landslides, earthflows, and debris flows transport sediment from hillslopesto mainstem upland channels. Underlying bedrock resistance and longitudinal and lateral (cross-valley) faulting control the long-term downcutting rate in upland stream channels; but episodesof local channel aggradation by landslide and debris flow deposition controls short-term changesin local stream slope, in-channel sediment storage, and shallow ground-water discharge. Between episodes of channel aggradation, headward knick point channel bed and bank erosion isgradual. Debris flows are the principal agent of channel bed and bank erosion in the uplandchannel network.
Following the Pleistocene-Holocene transition (about 10,000 - 12,000 years BP),increasing sediment yield, rising sea level, and continuing tectonic uplift caused lower portionsof eroding v-shaped upland valleys in Marin County watersheds to fill with sediment(Montgomery 1999), creating u-shaped valleys. The present depth to bedrock in Corte MaderaCreek alluvial channel network varies from zero ft (by definition) at upland-alluvial transitionsto about 40 ft near the upstream limit of the tidal influenced zone at Kentfield (COE 1961;Figure 9). Within the tidal zone, depth of bay mud and alluvium above bedrock increases fromabout 40 ft at Kentfield to about 147 ft at Highway 101 near the basin outlet (COE 1961). Sealevel elevation rose about 16 ft since 5,000 BP (Haible 1980), and about 300 ft from the onset ofthe Holocene to the present (Rice et al. 1976). Holocene sea level rise probably influencedvalley filling and valley flat slope in the alluvial channel network approximately below the Cityof San Anselmo. The present alluvial channel network is comprised of relatively steep, straight,pool-riffle, step-pool, and plane-bed channel segments laterally confined in a straight and locallymeandering channel network moderately to deeply entrenched in the Holocene valley fill. Causes and effects of recent channel entrenchment are discussed below.
Stetson Engineers Inc. 4 Corte Madera Creek WatershedGeomorphic Assessment
2.2. CHANGES IN AQUATIC AND RIPARIAN HABITAT CREATING PROCESSES ANDCONDITIONS CAUSED BY RECENT CHANNEL ENTRENCHMENT
Corte Madera Creek watershed’s entrenched alluvial channel network sustains lessaquatic and riparian habitat than the pre-entrenchment channel network. By inference, thepre-entrenchment channel was a straight and locally meandering, relatively shallow,sand-and-gravel, pool-riffle and plane-bed channel with sand-and-gravel point bars. Lateralchannel migration associated with active channel meandering eroded loose alluvial channelbanks and deposited gravel transported from upland areas on accreting inside point bars. Lateralchannel migration eroded woody debris into the channel, and point bar accretion provided newlocations for pioneer riparian plants to establish and survive. Overbank flooding deposited finesediment over a wide zone on the valley flat during floods. This way, channel meandering andfloodplain deposition maintained aquatic habitat complexity and a wide and diverse ripariancorridor. The shallow ground-water table recharged by subsurface inflow from beneath themountain fronts and tributary channels flowing over the clay-rich alluvium supported seasonalfloodplain wetlands on the valley flat (Figure 3, Figure 16).
The pre-entrenchment channel network was probably also braided locally and shiftedbetween main channels by channel avulsion during high flows. Such channel forms andprocesses are typical for streams draining Coast Range Franciscan sandstone and melangewatersheds in the semi-arid Mediterranean climate zone (Hecht 1994, Kondolf et al. in press).
Lateral migration, floodplain deposition, channel avulsion, and woody debris recruitmentwere arrested when the channel cut deeply into the valley fill. The present channel is similar inplan form as the pre-entrenchment channel, but active channel width and riparian corridor widthwere reduced throughout the alluvial channel network (Figure 3). Entrenchment increased theflood capacity of the channel; much of the alluvial channel network contains the ‘50-year flood’(HUD 1976). Thus, the channel abandoned the pre-entrenchment floodplain on the valley flat. Entrenchment also drew down the shallow alluvial ground-water table, further reducing riparian,seasonal floodplain wetland and vernal pool habitat on the valley flat (Figure 3).
Entrenchment also increased flow velocity and channel bed and bank shear stress byconfining flood flows. Increased velocities and shear stresses during high discharges preventsreestablishment of gravel bars and pool-riffle bed morphology similar to the pre-entrenchmentconditions. Narrow, fixed gravel bars dominate the channel bed. Unnaturally high, coarsegrained gravel bars throughout the alluvial portion of Fairfax Creek and San Anselmo Creekappear to have been deposited during deep, confined flood flows. These elevated, coarse, well-drained gravel deposits enabled riparian trees to establish and mature within the channel. Reinforcement by mature tree root systems prevented significant erosion during recent, largerfloods; the reinforced ‘flood bars’ act as resistant inset channel banks, further reducing activechannel width and further preventing inset floodplain and pool-riffle development as well asincreasing flooding potential.
The majority of deep substrate pools are lateral scour pools where high flows impingeobliquely on (and create helical flow patterns along) resistant channel banks, tree roots,
Stetson Engineers Inc. 5 Corte Madera Creek WatershedGeomorphic Assessment
floodwalls, and rip-rap. The density and connectivity of these substrate pools is probably muchless than for pre-entrenchment substrate pools, assuming the pre-entrenchment channel formsupported pool density associated with theoretically normal pool-riffle spacing of about 4-7channel widths.
2.3. EVIDENCE OF HOLOCENE VALLEY ALLUVIATION AND RECENT CHANNELENTRENCHMENT IN MARIN COUNTY WATERSHEDS
Valley filling in northern coastal California began near the Pleistocene-Holocenetransition, consistent with the post-glacial valley filling and entrenchment sequence in other partsof California and North America (Montgomery 1999, Harvey et al. 1999a). Radiocarbon (14C)dates of basal gravel contacts in the San Francisco Bay Region showed that regional valleyfilling began with the late Pleistocene-Holocene transition, about 10,000-12,000 years BP(Montgomery 1999).1
Haible (1980) used radiocarbon dating and detailed surveys of exposed channel banksediment stratigraphy in the Walker Creek basin in northwestern Marin County to show thatHolocene valley filling evidently occurred in a single episode (Figure 1).2 Haible speculated thatHolocene alluviation was followed by two recent but distinct channel entrenchment periods. Thefirst phase of channel entrenchment in the high terrace forming the valley flat may have begun inabout AD 1720. The second phase of entrenchment indicated by remnants of an inner terracemay have begun in about 1915. Grazing in the Walker Creek basin began in about 1820 andgrazing and landscape denudation became most intense in about 1900.
1 Haible (1980) dated one sample of wood from a clayey lens "estimated to be in lower half of basal gravel
member", the lower member of valley fill in the Walker Creek basin, northwestern Marin County. Although thesingle sample was not extracted from near bedrock-basal gravel contacts, Haible (1980) assigned the 5,000 yearsBP date to the onset of alluviation in Walker Creek. It is likely, however, that valley alluviation in the Walker Creekbasin began 10,000-12,000 years BP, consistent with regional observations. Radiocarbon dates of more numeroussamples taken from near the bedrock-basal gravel contact would probably verify this.
2 Haible (1980) identified two prominent Holocene alluvial units in the Walker Creek valley fill. The lowermember was a cross-bedded gravel deposit about 5 ft thick overlying bedrock, and the upper member was a massivebrown sand deposit about 6 to 20 ft thick. A similar Holocene valley fill stratigraphic sequence is exposed in thechannel banks in Ross Valley.
Stetson Engineers Inc. 6 Corte Madera Creek WatershedGeomorphic Assessment
Collins (1998) also concluded that two recent but distinct channel entrenchment periodsoccurred in the lower Novato Creek watershed in northeastern Marin County (Figure 1). Thefirst phase evidently began in about 1835 associated with the onset of livestock grazing in the1820s, and the second phase began in the 1950s following construction of Stafford Dam. Collinsinferred individual periods of channel entrenchment from the rooting elevation of tree-ring datedriparian trees. A number of even-aged trees rooted on an abandoned inset terrace just below thevalley flat elevation were estimated to have been established in about 1835, and a number ofeven-aged trees rooted on a lower inset terrace were estimated to have begun growth in the1950s.
Riparian trees in the Corte Madera Creek watershed exhibit similar rooting elevation-agestructure as Collins (1998) observed in the Novato Creek basin. Riparian trees greater than 100years in age are invariably rooted on the valley flat or high on the channel banks just below thevalley flat. Riparian trees approximately 50 years in age, primarily Alder (Alnus), are rooted onsurfaces of high, coarse-grained gravel bars evidently formed during the 1955 flood, orconsistent elevations on channel banks. Assuming that the 50-year old trees were in factestablished on surfaces of bars deposited in the 1955 flood,3 rather than on an abandonedfloodplain elevation as Collins concluded was the case for lower Novato Creek, the rootingelevation-age structure in the Corte Madera Creek watershed suggests that a single period ofchannel entrenchment began more than 100 years BP and continued to the present.
Montgomery (1999) used radiocarbon dates of progressively shallower valley fill inTennessee Valley in southwestern Marin County (Figure 1), to show that valley filling began atthe beginning of the Holocene, and that episodic valley aggradation continued from the earlyHolocene to the present. Montgomery presented geomorphic evidence showing that a singleepisode of rapid channel entrenchment occurred in Tennessee Valley between 1855 and 1907,followed by minor valley aggradation and relative channel stability since 1907. Tennesseevalley was intensively grazed in 1855-1892, but less intensively in 1892-1972.
In summary, the available regional sedimentological data indicate that valley fillingbegan about 10,000-12,000 years BP and continued to the present. Many researchers attributerecent regional channel entrenchment to increased livestock grazing intensity during the latterhalf of the 1800s, coinciding with a number of wetter than average water years (Montgomery1999, Collins 1998, Haible 1980, Wahrhaftig and Wagner 1972, Zumwalt 1972). Montgomery(1999) hypothesized that channel response to intense grazing at the turn-of-the-century wouldcontinue for hundreds of years. In the Corte Madera Creek watershed, these ongoing responsesappear to include: (1) incremental channel head advance in the highest reaches of the drainagenetwork; (2) decreasingly rapid channel bed incision and bank erosion in the upper alluvialchannel network; and (3) decreasingly rapid channel bed aggradation in lower reaches of thewatershed.
3 Long-term creek neighbors on Fairfax Creek recall that the channel bed was devoid of riparian trees in
the mid-1950s and remember that the alders in the channel established at about that time (Louis Vaccaro, pers.comm., 1999).
Stetson Engineers Inc. 7 Corte Madera Creek WatershedGeomorphic Assessment
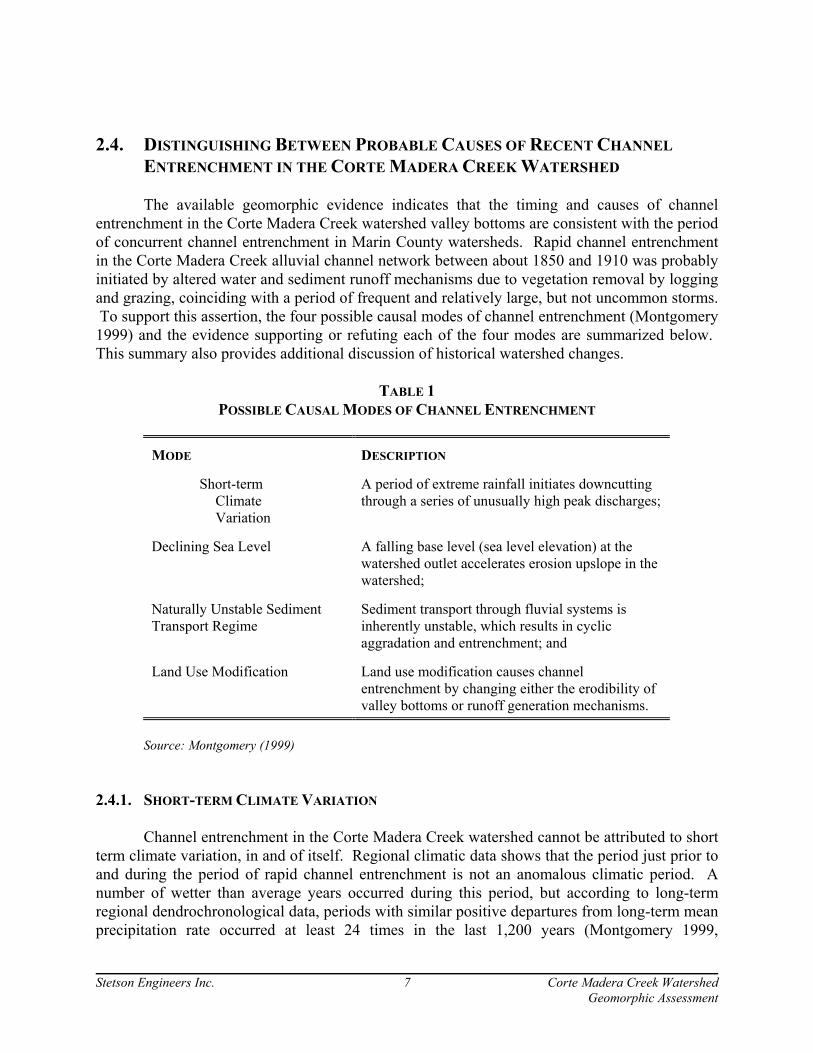
2.4. DISTINGUISHING BETWEEN PROBABLE CAUSES OF RECENT CHANNELENTRENCHMENT IN THE CORTE MADERA CREEK WATERSHED
The available geomorphic evidence indicates that the timing and causes of channelentrenchment in the Corte Madera Creek watershed valley bottoms are consistent with the periodof concurrent channel entrenchment in Marin County watersheds. Rapid channel entrenchmentin the Corte Madera Creek alluvial channel network between about 1850 and 1910 was probablyinitiated by altered water and sediment runoff mechanisms due to vegetation removal by loggingand grazing, coinciding with a period of frequent and relatively large, but not uncommon storms. To support this assertion, the four possible causal modes of channel entrenchment (Montgomery1999) and the evidence supporting or refuting each of the four modes are summarized below. This summary also provides additional discussion of historical watershed changes.
TABLE 1POSSIBLE CAUSAL MODES OF CHANNEL ENTRENCHMENT
MODE DESCRIPTION
Short-termClimateVariation
A period of extreme rainfall initiates downcuttingthrough a series of unusually high peak discharges;
Declining Sea Level A falling base level (sea level elevation) at thewatershed outlet accelerates erosion upslope in thewatershed;
Naturally Unstable SedimentTransport Regime
Sediment transport through fluvial systems isinherently unstable, which results in cyclicaggradation and entrenchment; and
Land Use Modification Land use modification causes channelentrenchment by changing either the erodibility ofvalley bottoms or runoff generation mechanisms.
Source: Montgomery (1999)
2.4.1. SHORT-TERM CLIMATE VARIATION
Channel entrenchment in the Corte Madera Creek watershed cannot be attributed to shortterm climate variation, in and of itself. Regional climatic data shows that the period just prior toand during the period of rapid channel entrenchment is not an anomalous climatic period. Anumber of wetter than average years occurred during this period, but according to long-termregional dendrochronological data, periods with similar positive departures from long-term meanprecipitation rate occurred at least 24 times in the last 1,200 years (Montgomery 1999,
Stetson Engineers Inc. 8 Corte Madera Creek WatershedGeomorphic Assessment
Graumilch 1993). High peak flows associated with these wet years were probably a contributingcause, but not the principal cause, of channel entrenchment.
2.4.2. SEA LEVEL DECLINE
Channel entrenchment in the Corte Madera Creek watershed cannot be attributed todeclining sea level. Sea level elevation rose about 16 ft since 5,000 BP (Haible 1980), and about300 ft since about 12,000 BP (Rice et al. 1996:41).
2.4.3. NATURALLY UNSTABLE SEDIMENT TRANSPORT REGIME
Channel entrenchment in the Corte Madera Creek watershed cannot be attributed to itsnaturally unstable sediment transport regime, in and of itself. Extensive field reconnaissanceduring this study did not reveal evidence of cyclic entrenchment and aggradation in the CorteMadera Creek watershed. Regional sedimentological evidence indicates that cyclicentrenchment and aggradation did not occur in Marin County watersheds. The Holocene wastypified by continuous valley aggradation from the Pleistocene-Holocene transition to thepresent period of rapid channel entrenchment. Rapid channel entrenchment was caused byincreased peak runoff and sediment yield not associated with natural cyclic variation in sedimentyield and transport. Land use modifications, such as the introduction of intense livestockgrazing, generally increase peak runoff and sediment yields significantly more than naturalclimatic and sediment transport variation. For example, Prosser and Dietrich (1995) simulatedthe effect of grazing by clipping vegetation within experimental test sites on grassland hillslopesin Tennessee Valley, western Marin County (Figure 1). They found that critical, or minimumnecessary, shear stress for eroding soil particles by overland flow entrainment decreased 3 to 9times following clipping, a level of change they concluded was greater than climate influencesalone generally affects. This experiment demonstrated that the short-term effects of humanactions generally dominate the influence of long-term natural processes on runoff and sedimentregimes. Other experiments have demonstrated this for impacts on water and sediment runoffmechanisms related to agriculture, construction, logging, and wildfire suppression.
2.4.4. MODIFIED LAND USEThe available evidence supports only the hypothesis that rapid channel entrenchment in
the Corte Madera Creek watershed was caused by land use changes, especially logging andincreasingly intense livestock grazing in the late 1800s (Figure 11). These rapid land usechanges coincided with a number of wetter than average but not uncommon water years (Figure15).4 Logging and intense grazing alter vegetation cover, soil permeability, soil moisturecapacity, and drainage density so as to increase instantaneous peak flow and sediment discharge,which increases channel depth and channel slope by progressive upstream downcutting andheadcut advance extending throughout the affected drainage basin.
Overview of Land Use Modifications
4 Flooding occurred in Marin County in 1861, 1862, 1879, 1881, 1890, and 1895 (Montgomery 1999).
Stetson Engineers Inc. 9 Corte Madera Creek WatershedGeomorphic Assessment
Corte Madera is Spanish for “cut wood”; virtually all of the trees in the watershed wereharvested in the middle 1800s, either for timber or firewood (D. Odion, MMWD, pers. comm.,10/12/99). Spanish Land Grant Ranchos subdivided Marin County. Redwood and fir areas wereentirely logged for timber. Oak woodland and chaparral areas were harvested for firewood, andintervening prairies were grazed by sheep or dairy cattle. Marin County Ranchos providedfirewood to heat homes in San Francisco. The Spanish Land Grant Rancho located at the presenttown of Mill Valley and the surrounding watershed was named “Corte Madera del Presidio” --essentially, in this case, “fire wood for the Presidio”.
A considerable amount of timber was also cut from the hillslopes surrounding MillValley. Firewood from the Corte Madera Creek watershed was exported via Kentfield Landing. Baltimore Canyon (the Larkspur Creek subwatershed) was named for the timber sawmilltransported to Larkspur from Baltimore, Maryland, by sailboat around Cape Horn in 1849;sawyers harvested old-growth redwood forests from the lower slopes of Mt. Tamalpais inLarkspur Creek, Tamalpais Creek, and Ross Creek basins in short order. A contemporarydocument concluded that “the principal forest tracts now uncut [in Marin County] are in theLagunitas Canyon and at Pt. Reyes. The whole slope of Tamalpais in early days was more orless wooded, but by far the greater portion has been denuded. There are about 15,000 acres [23sq. mi.] of available timber remaining, nearly all of which is in the above localities” (Alley,Bowen & Co. 1880:90).
The distribution of pre-European forested areas and vegetation types in the Corte MaderaCreek watershed is approximated by the present distribution of vegetation types in the basin,both being controlled by microclimate and soil type. Thus, the historical distribution of loggingand firewood harvesting activities can be estimated by the present distribution of suitablevegetation types. Similarly, the historical distribution of livestock grazing during the 1800s andearly 1900s can be estimated by the present distribution of grass-oak woodland and grasslandvegetation types (Figure 12). The most extensive oak savanna and grassland areas in the RanchoCanada de Herrera were in the Sleepy Hollow Creek and Sorich Creek basins; dairy ranchespersisted in these basins into the middle 1900s. Ranches in the Greenbrae and Laurel Canyonareas along the eastern edge of the basin were urbanized earlier (Figure 13). Virtually all of thevalley flats and immediately adjacent hillslopes were certainly grazed, including valley flats inthe San Anselmo, Carey Camp, Wood Lane, Deer Park, Fairfax, Bothin, Iron Spring, Tamalpais,and Larkspur Creek basins. Upland areas in Fairfax, San Anselmo, Wood Lane, Deer Park andRoss Creek basins were also certainly grazed, including areas surrounding Loma Alta, WhiteHill, Happersberger Point, Sky Ranch, Bald Hill, and Ross Hill. The Porteous Ranch occupiedthe Phoenix Lake basin. A portion of the Lewiz Ranch on the eastern slope of Loma Alta is theonly area in the basin that is still grazed (Location 19 in Figure 23).
Forest harvesting and intense grazing modifies or temporarily removes vegetative coverthat would reduce and delay fluvial transport of rainfall and sediment to major river channelsduring rainstorms. An intensely logged or grazed landscape thus transports more water andmore sediment to the channel network more quickly. The effect is increased instantaneous peakrunoff for a given storm. Concentrated runoff initiates channel head advance, gullying, and
Stetson Engineers Inc. 10 Corte Madera Creek WatershedGeomorphic Assessment
drainage network expansion, all of which reinforce increased runoff peaks and fluvial transportof sediment from hillsides to the alluvial channel network.
A contemporary civil engineer reported that livestock grazing “has been so close andcontinuous, that the forage plants and grasses have nearly disappeared” (Manson 1899:300, ascited in Montgomery 1999). Manson (1899) attributed rapid channel erosion in northernCalifornia Coast Range valleys to grazing practices intensifying near the end of the 1800s. Manson wrote:
When man, actuated by greed or ignorance, or a combination of the two, destroysthe protection which nature spreads over rolling and mountain areas, he turnsloose agencies which soon pass beyond his control. The protecting agent isvegetation, and whether in the form of forests, brush, or forage plants and grasses,the balance between it and denuding forces is easily tipped, when the inexorablelaw of gravity unchecked by myriad blades of grass, by leaves, roots, andvegetable mold, gullies the hillside, strips the mountain slope, converts rivuletinto the torrent, and causes the steady flow of the river to become alternately adevastating flood or a parched sand-bed. When once this balance has beendestroyed, man cannot turn back the torrent and bid it flow once more a living andlife-giving stream.
Natural runoff processes probably reestablished in part by the early to middle 1900s asportions of the basin reforested. Natural runoff mechanisms also were partially restored ingrassland areas of the basin as grazing intensity gradually reduced in the early to middle 1900s,but many of the grazed areas were rapidly urbanized. Natural runoff mechanisms in steep and/orprotected grassland, chaparral, and oak savanna areas, not urbanized in the middle to late 1900s,have more completely restored, but drainage network expansion and gullying have notcompletely reversed, and shallow-rooted annual European grasses have replaced deep-rootednative perennial bunch grasses. Thus, it is reasonable to presume that the present watershedsediment yield by hillslope processes is greater than for the pre-European watershed condition.
Although natural runoff mechanisms partially recovered in forested areas, and to a lesserextent in grazing areas protected from urbanization, any reduction in instantaneous peak runoffwas offset by the reinforcing effect of urbanization (Figure 14). Urbanization further increasesdrainage density by replacing natural runoff routes with impermeable surfaces, streets andstormwater drains. Urbanization also reinforces increased rainfall runoff by suppressing thenatural wildfire regime. When fires do occur, they are hotter and thus remove more vegetativecover and cause greater increases in soil impermeability, particularly in chaparral areas.5 Urbanization can also induce catastrophic local sediment inputs by causing local landslides,
5 Urbanization suppresses the frequency and extent of wildfires, which increases the density of so-calledladder fuel materials above the groundcover and below the canopy (routine wildfires suppress ladder fuel densityand are a fundamental ecological process supporting some plant communities, such as chapparal). The result isfewer and less extensive but more intense wildfires, which can produce rapid sediment delivery to the channelnetwork (De Bano 1969).
Stetson Engineers Inc. 11 Corte Madera Creek WatershedGeomorphic Assessment
gullying, or debris flows by concentrating overland flow and road-cutting on hillslopes. Landsliding into upland channels is the principal sediment source mechanism in northernCalifornia Coast Range watersheds. Human actions that increase landslide frequency ormagnitude therefore can substantially increase watershed sediment yield compared to natural,pre-disturbance yields.
Corte Madera Creek rainfall runoff peaks can probably be reduced if measures are takento increase on-site stormwater retention in urbanized areas (Figure 15). However, a highproportion of clay-rich alluvium and local saturation of the alluvial fill during the rainy seasonlimits the potential feasibility and effectiveness of stormwater retention at many sites in thewatershed. A methodology for identifying and evaluating suitability of candidate demonstrationproject sites is outlined in Appendix J.
2.5. NATURAL GEOMORPHIC RECOVERY OF THE CORTE MADERA CREEKWATERSHED’S ENTRENCHED ALLUVIAL CHANNEL NETWORK
Entrenchment is a common geomorphic response to increased peak runoff and sediment
yields initiated by intense landscape disturbance; entrenchment enables the channel to transportincreased sediment load by increasing flow velocities and channel gradient. Natural geomorphicrecovery of entrenched channels occurs primarily by these geomorphic processes: As sedimentload decreases following the period of intense disturbance, channel gradient generally decreasesby progressive upstream channel aggradation in the lower portion of the watershed, progressiveheadward channel incision in the upland reaches, and relative channel bed stabilization, channelwidening and increased channel meandering in the middle reaches.
Following entrenchment, larger and larger floods were entirely contained in the deepenedchannel, and more and more excess hydraulic energy eroded the channel bed and banks. Thispositive feedback mechanism prevents recovery of the pre-entrenchment channel form. Entrenched channels rarely re-occupy their pre-entrenchment floodplain. Rather, entrenchedchannels typically remain entrenched, but reach a more stable bed elevation (channel depth) andchannel slope, and then widen (Schumm 1999, Figure 16).
Widening further increases flood capacity, but also reduces maximum flow velocity andbed and bank shear stress by reducing average flow depth and velocity during floods. Wideningalso allows some channel meandering to occur, which further reduces channel gradient. Increased width, increased meandering, and decreased gradient allow inset floodplain formationand pool-riffle development within the entrenched channel; active floodplain formation andpool-riffle development also indicate that the natural geomorphic recovery processes areunderway.
The process of systematic channel widening can be expected to continue at or near itspresent rate for at least several more decades or hundreds of years, until the active channel widthapproaches its pre-entrenchment value (Figure 3). Then, the plan form boundaries of the activechannel will become more stable, and habitat-creating processes will occur within entrenched
Stetson Engineers Inc. 12 Corte Madera Creek WatershedGeomorphic Assessment
channel that can sustain riparian and aquatic habitat values that are comparable to those formerlysustained by the pre-entrenchment channel (Figure 16).
2.6. SEDIMENT YIELDS AND A PRELIMINARY SEDIMENT BUDGET FOR THECORTE MADERA CREEK WATERSHED
Sediment load is the measured or estimated amount of sediment flowing past a designatedlocation in the channel network from its contributing watershed drainage area. Sediment load iscomprised of bedload, suspended sediment load, and washload (dissolved sediment). Sedimentyield is the rate of sediment passing from the outlet of a designated drainage basin per unitdrainage area, e.g. reported in units such as tons/sq.mi./year. The USGS commonly measuressediment yield at flow gaging stations by periodically sampling bedload and suspended sedimentload passing the gage for a range of discharges. Average yield is calculated by integrating over afrequency distribution of discharge from the long-term record. Sediment yield can also beaccurately measured for areas draining into reservoirs that trap 100 percent or some knownpercentage of the total incoming sediment load; yield is calculated by measuring the reduction inreservoir storage capacity caused by sediment deposition in the reservoir over a known timeperiod. Published estimates of sediment yield are available for many drainage basins aboveUSGS stream gaging stations and dams throughout the U.S. These data show that the basin’sunderlying geologic type strongly influences average annual sediment yield for a given drainagebasin area.
USGS or reservoir sediment yield data are often not available at the outlet of the drainagearea of interest. In the absence of data, as is the case with the USGS gage at Ross, sedimentyield can be reasonably estimated by empirical relations between sediment size distributionpresent on and beneath the channel bed and sediment transport (e.g., Parker and Klingeman1982), integrated over a probability function of discharge at the site.6 Estimates of sedimentyield for a given drainage basin should be compared to measured sediment yields for basins withthe similar underlying geology, or basins in the same geologic province.
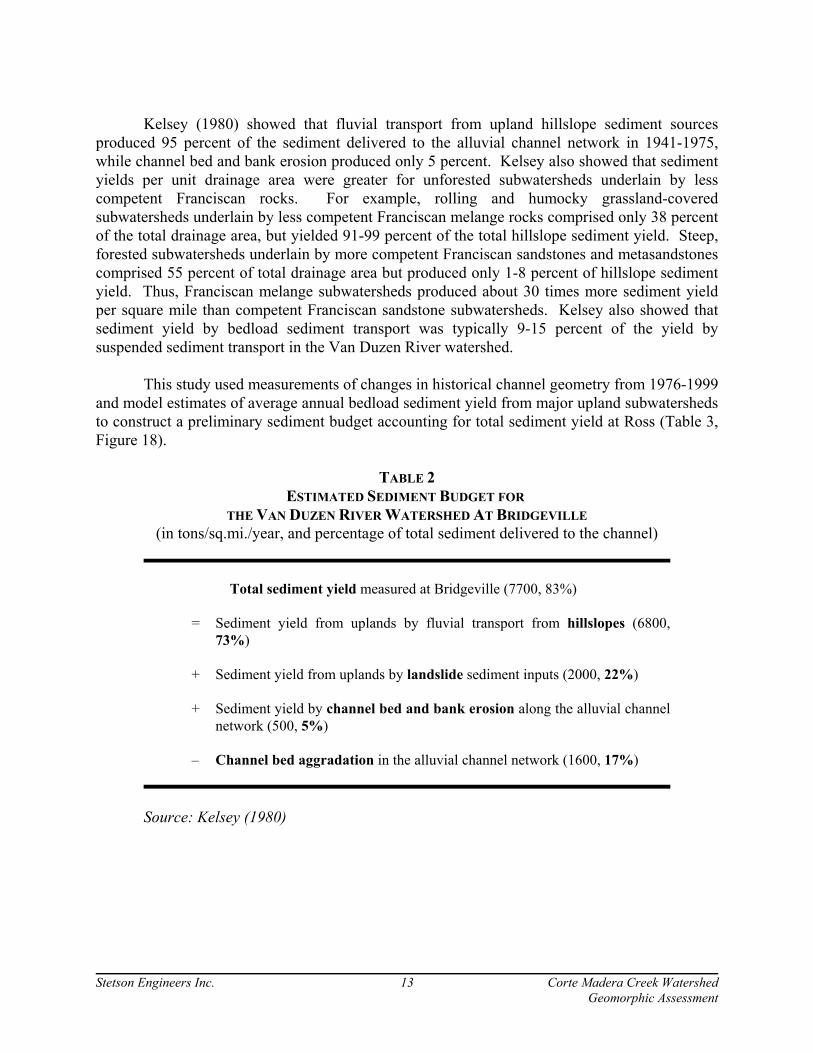
A sediment budget is an accounting procedure that adds and subtracts sediment sourcerates and sediment sink rates identified in the drainage area to account for the measured orestimated total sediment yield at its outlet. For example, Kelsey (1980) constructed a detailed1941-1975 sediment budget for the Van Duzen River in Humboldt County that distinguishessediment sources and sinks accounting for measured sediment yield at the basin outlet atBridgeville (Table 2).
6 Using measurements of the size distribution of sediment present on and below the channel bed, the rate of
bedload sediment transport is calculated for each of a range of modeled discharges. Bedload sediment transportrates are multiplied by the probability that those discharges occur at the site (often extrapolated from a nearby flowgage record and corrected for drainage area and orographic effects). Integrating over the data and addingestimated suspended sediment component generates an estimate of the average annual sediment yield at the site.
Stetson Engineers Inc. 13 Corte Madera Creek WatershedGeomorphic Assessment
Kelsey (1980) showed that fluvial transport from upland hillslope sediment sourcesproduced 95 percent of the sediment delivered to the alluvial channel network in 1941-1975,while channel bed and bank erosion produced only 5 percent. Kelsey also showed that sedimentyields per unit drainage area were greater for unforested subwatersheds underlain by lesscompetent Franciscan rocks. For example, rolling and humocky grassland-coveredsubwatersheds underlain by less competent Franciscan melange rocks comprised only 38 percentof the total drainage area, but yielded 91-99 percent of the total hillslope sediment yield. Steep,forested subwatersheds underlain by more competent Franciscan sandstones and metasandstonescomprised 55 percent of total drainage area but produced only 1-8 percent of hillslope sedimentyield. Thus, Franciscan melange subwatersheds produced about 30 times more sediment yieldper square mile than competent Franciscan sandstone subwatersheds. Kelsey also showed thatsediment yield by bedload sediment transport was typically 9-15 percent of the yield bysuspended sediment transport in the Van Duzen River watershed.
This study used measurements of changes in historical channel geometry from 1976-1999and model estimates of average annual bedload sediment yield from major upland subwatershedsto construct a preliminary sediment budget accounting for total sediment yield at Ross (Table 3,Figure 18).
TABLE 2ESTIMATED SEDIMENT BUDGET FOR
THE VAN DUZEN RIVER WATERSHED AT BRIDGEVILLE(in tons/sq.mi./year, and percentage of total sediment delivered to the channel)
Total sediment yield measured at Bridgeville (7700, 83%)
= Sediment yield from uplands by fluvial transport from hillslopes (6800,73%)
+ Sediment yield from uplands by landslide sediment inputs (2000, 22%)
+ Sediment yield by channel bed and bank erosion along the alluvial channelnetwork (500, 5%)
– Channel bed aggradation in the alluvial channel network (1600, 17%)
Source: Kelsey (1980)
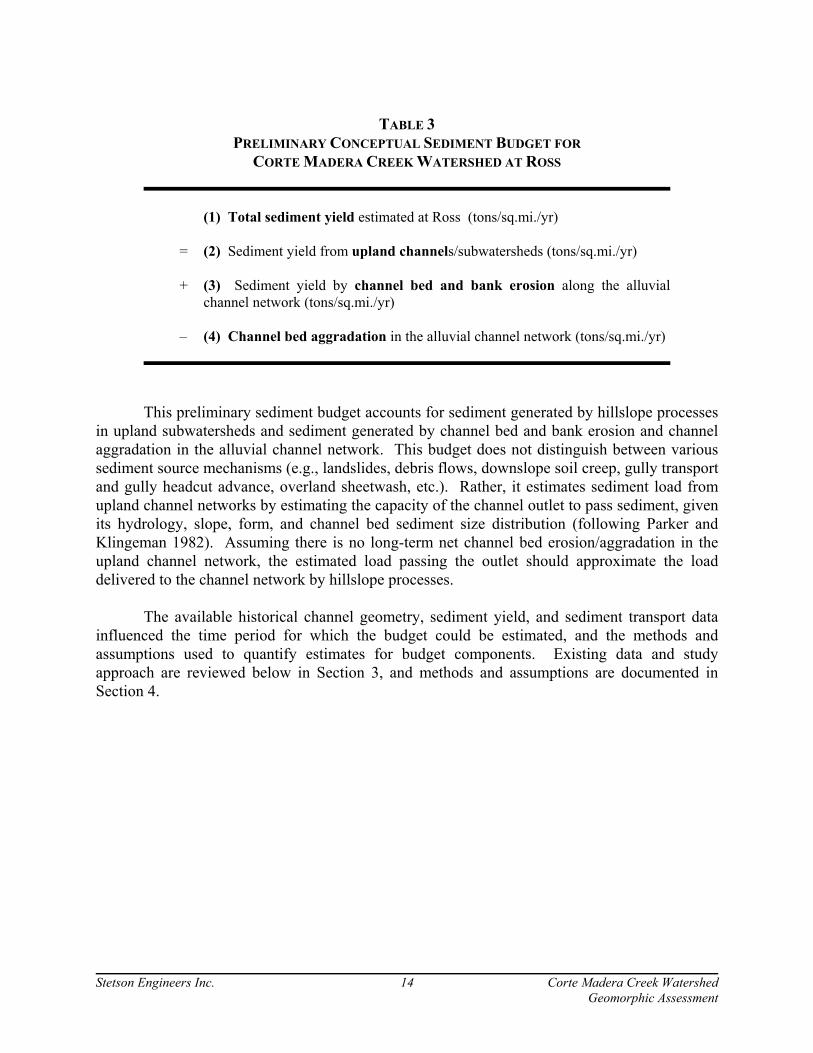
Stetson Engineers Inc. 14 Corte Madera Creek WatershedGeomorphic Assessment
TABLE 3PRELIMINARY CONCEPTUAL SEDIMENT BUDGET FOR
CORTE MADERA CREEK WATERSHED AT ROSS
(1) Total sediment yield estimated at Ross (tons/sq.mi./yr)
= (2) Sediment yield from upland channels/subwatersheds (tons/sq.mi./yr)
+ (3) Sediment yield by channel bed and bank erosion along the alluvialchannel network (tons/sq.mi./yr)
– (4) Channel bed aggradation in the alluvial channel network (tons/sq.mi./yr)
This preliminary sediment budget accounts for sediment generated by hillslope processesin upland subwatersheds and sediment generated by channel bed and bank erosion and channelaggradation in the alluvial channel network. This budget does not distinguish between varioussediment source mechanisms (e.g., landslides, debris flows, downslope soil creep, gully transportand gully headcut advance, overland sheetwash, etc.). Rather, it estimates sediment load fromupland channel networks by estimating the capacity of the channel outlet to pass sediment, givenits hydrology, slope, form, and channel bed sediment size distribution (following Parker andKlingeman 1982). Assuming there is no long-term net channel bed erosion/aggradation in theupland channel network, the estimated load passing the outlet should approximate the loaddelivered to the channel network by hillslope processes.
The available historical channel geometry, sediment yield, and sediment transport datainfluenced the time period for which the budget could be estimated, and the methods andassumptions used to quantify estimates for budget components. Existing data and studyapproach are reviewed below in Section 3, and methods and assumptions are documented inSection 4.
Stetson Engineers Inc. 15 Corte Madera Creek WatershedGeomorphic Assessment
3. THE INFLUENCE OF HISTORICAL DATA SOURCES ANDDATA GAPS ON STUDY APPROACH
Section 3.1 reviews hydrology, sediment transport, and sediment yield data useful forestimating sediment yield by various generating mechanisms in the watershed. Section 3.1.6reviews existing regional data useful for comparing to this study’s results, such as sedimenttransport and sediment yield data from comparable watersheds are summarized in tablesappended to the end of this report. Section 3.2 reviews historical channel geometry data, photos,and other accounts useful for quantifying sediment yield by channel bed and bank erosion in thealluvial channel network.
3.1. HYDROLOGY, SEDIMENT TRANSPORT, AND SEDIMENT YIELD DATA
3.1.1. HYDROLOGY DATAIn January 1951, the USGS began mean daily flow measurements about 300 ft upstream
of the Lagunitas Road Bridge in Ross (Figure 2). The USGS published mean daily flows andmonthly and annual summary data for this gage, Corte Madera Creek at Ross, no. 11460000,until it was discontinued in September 1993. (MCFCD maintained the gage after 1993). TheUSGS reported that the records were “poor” for some water years. Inaccurate flow records wereprobably caused by progressive channel bed aggradation at the gage since it was constructed(Figure 10). Although the bed level elevation has recently stabilized, historical fluctuationsprobably continually caused the stage-discharge relation from which the USGS calculated meandaily flow to change. The gage also does not record a portion of extremely high flows thatoverflow onto streets parallel to Corte Madera Creek. We used mean daily discharges for theentire period of USGS records (1951-1993) to prepare a flow frequency distribution used in ourmodel estimates of sediment yield by sediment transport past the Ross Gage. We apportionedthe flow frequency distribution by subwatershed drainage area to produce distributions used insubwatershed sediment yield estimates.
3.1.2. SEDIMENT TRANSPORT DATA AND SEDIMENT YIELD ESTIMATES
Sediment transport measurements can be used to calibrate analytical sediment transportmodels for estimating sediment yields and constructing sediment budgets. The USGS publisheddaily suspended sediment concentration data at the Ross Gage for 1978, 1979, and 1980, andseveral bedload transport measurements in 1978. The EPA (1985) published suspended andbedload sediment size distribution and estimated yield data at the Ross Gage for 1978-1980(COE 1987). These are the only published historical sediment transport measurements for thewatershed. We calculated total suspended and bedload sediment yields for these water yearsdirectly from these USGS published data and included these results in our summary comparisonsof regional sediment yield data and results of this study (Table 10). We also used these data tocalibrate the Parker-Klingeman bedload transport model which we used to estimate annualaverage bedload transport at the Ross Gage.
Stetson Engineers Inc. 16 Corte Madera Creek WatershedGeomorphic Assessment
Referring to the USGS sediment transport data for 1978-1980, COE (1989:19) noted that“Measured sediment inflow data for Corte Madera Creek are inadequate to determine a reliablesediment inflow rating curve for the entire range of discharges considered in this study.” However, based partly on these data and EPA (1985) sediment size distribution data, a 1989COE sediment transport model estimated the average annual bedload sediment yield at the RossGage was about 8,200 cubic yards or 11,070 tons (COE 1989:34). The COE includes very finesand and fine sand size fractions (0.062-0.250 mm) estimated to pass the gage in the bedloadsediment yield (COE 1989:31). This study’s sediment transport model assumed sediment lessthan 0.250 mm would be transported past the gage as suspended load rather than bedload. TheCOE model should therefore estimate total sediment yield at Ross to be about 10 percent greaterthan our model results. Noting this difference, we included the COE bedload yield estimate inour comparisons of bedload and total sediment yield estimates at Ross Gage.
3.1.3. CHANNEL SEDIMENT DREDGING RECORDS
Repeated channel sediment dredging records can provide estimates of sediment inflow. The Town of Ross extracted sediment in the vicinity of Lagunitas Road Bridge each year since1987, except 1990 and 1992 (Charlie Goodman, Town of Ross, pers. comm., 2000). These datado not provide a direct measurement or reliable independent estimate of total bedload sedimentyield at Ross because only a portion of the bedload transport past Ross is deposited in theextraction reach below the bridge. We obtained these data to provide a lower limit estimate ofbedload sediment inflow at the Ross Gage, about 300 feet upstream from the extraction site. These data do not include sediment size distribution for the extracted materials. According tointerviews conducted during the course of this study, there was not channel dredging before theTown of Ross started in 1987.
We also obtained data for sediment extracted by the COE and MCFCD from the floodcontrol channel in the vicinity of College of Marin Bridge in 1972, 1986, and 1998 (Jason Nutt,MCFCD, pers. comm., 2000). These data indicate that a small portion of the annual sedimenttransport was extracted by these dredging activities. The data did not include an estimate ofsediment volume extracted by COE in 1972. If these data exist, they might provide an annualdeposition value, as the flood control channel was completed in 1971.
Various investigators have collected bed sediment samples from the flood controlchannel and analyzed sediment size distribution (e.g., Shepherd 1987). However, most of thesedata have not been published. The COE probably also holds related data not obtained during thisstudy. The complete set of sediment extraction and size distribution data was not compiled inthis study. Regardless, these data describe the portion of inflowing material deposited at Ross,and not the entire load, and therefore would only provide an extreme lower limit for sedimentyield estimates at Ross.
MMWD dredges approximately 100 yards of bed material along Wood Lane Creek at thesubwatershed outlet site (at Marin Stables) in order to prevent sediment deposition fromblocking culverts immediately below the site. The volume of sediment potentially trapped in theexcavation is in the approximate range of estimated annual bedload sediment yield at the site. Itmay be possible to roughly calibrate Wood Lane Creek subwatershed sediment yield estimates
Stetson Engineers Inc. 17 Corte Madera Creek WatershedGeomorphic Assessment
developed as part of this study with annual extraction and refilling data. We surveyed the post-excavation bathymetry of the trap in order to estimate refilling by repeated surveys, and re-surveyed the bathymetry twice during the 1999-2000 winter rainy season.
Marin County Open Space District (MCOSD) annually excavates sediment pluggingmore than about 60 culverts along the Southern Marin Line fire road below Corte Madera Ridge(Brian Sanford, MCOSD, pers. comm., 1999). If data were kept to estimate the total excavationvolume, they could provide a lower limit estimate of sediment yield from Corte Madera Ridgeabove the Southern Marin Line fire road (Site no. 2 in Figure 23). Such an estimate wouldprobably reasonably represent the lower limit of sediment yield for those sediment sizes abovethe dominant size class represented in the excavated material, but would not accurately accountfor the yield of finer sediment not efficiently trapped by the Southern Marin Line road-cut. Ambrosia beetle infestation is likely to cause substantial die-off of tan oak on Corte MaderaRidge (D. Odion, MMWD, pers. comm., 1999). Monitoring sediment yield above the road-cutmight allow an estimate of any increased sediment yield caused by the beetle infestation overtime.
3.1.4. RESERVOIR SEDIMENTATION DATA AND DREDGING RECORDS
Reservoir sedimentation rates can provide an accurate estimate of long-term averagesediment inflow from the drainage area contributing to the reservoir. Calculated sediment yieldcan be compared to estimated sediment yields in other comparable portions of the basin. Phoenix Dam was built ca. 1913 to impound runoff from 2.3 square miles of the upper RossCreek subwatershed for water supply (Figure 2). However, long-term sedimentation rates cannotbe calculated for the upper Ross Creek subwatershed because MMWD does not hold as-built orcontemporary bathymetric maps of the reservoir (Dana Roxon, MMWD, pers. comm., 1999). The volume of Phoenix Lake, and changes in its volume, cannot be accurately calculated withoutrepeat bathymetric surveys. These surveys are not anticipated, because sedimentation is notconsidered a problem for Phoenix Lake; MMWD is updating its reservoir capacity database andmonitoring program in Lake Nicasio and other watersheds (Dana Roxon, pers. comm., 1999),evidently where sediment yield is greater, and/or demand for reservoir capacity is greater.
MMWD reportedly dredged an unknown volume of Phoenix Creek delta deposits fromthe reservoir. The volume extracted would not provide an accurate measurement of long-termaverage sediment yield from the Phoenix Creek subwatershed, because original bathymetric datais not available.
There are several smaller reservoirs and check dams in the watershed that have alreadycompletely filled with sediment, preventing calculation of short-term sediment yields. Forexample, a dam on Bill Williams Creek just upstream from Phoenix Lake is completely filledwith sediment. MCOSD installed a series of boulder check dams to slow downcutting near theoutlet of Carey Camp Creek in the San Anselmo Creek subwatershed that filled in with sedimentin approximately two winters (Brian Sanford, MCOSD, pers. comm., 1999). Westbrae Dam onFairfax Creek is completely filled with sediment. Lower limits for bedload sediment yield fromBill Williams, Carey Camp, and upper Fairfax Creek could potentially be estimated if data were
Stetson Engineers Inc. 18 Corte Madera Creek WatershedGeomorphic Assessment
obtained for these filled reservoirs describing sediment volume, dam construction date, and thedate reservoir filled.
3.1.5. HILLSLOPE PROCESS RATE DATADetailed sediment budget studies generally indicate that sediment transported to the
channel network by landsliding and earthflows dominate total sediment yield in northernCalifornia Coast Range watersheds underlain by Franciscan melange. Thus, quantifying annualsediment yield from the various discrete hillslope sediment production mechanisms is oftenimportant not only for understanding where the sediment is coming from, but also where andhow best to improve upland management practices in order to reduce sediment yield.
Hillslopes transport sediment to upland channels by landsliding, earthflows, fluvialtransport in gullies, gully headcut advance, downslope soil creep, and overland sheetwash. Detailed sequential aerial photographic interpretation combined with rather extensive ground-truthing can be sufficient to roughly quantify annual yields from some of these discrete sourcemechanisms. More accurately quantifying annual yields additionally requires longer-term fieldmonitoring using a variety of office and field methods, such as those described by Reid andDunne (1996). Inevitably however, accurate estimates are naturally confounded by the episodicnature of hillslope sediment contributions in Coast Range watersheds. For example, Kelsey(1980) attributed 21 percent of the total sediment yield for 1941-1975 to landsliding thatoccurred in 1964. Therefore, aerial photo interpretation and field monitoring must capture arepresentative portion of the long-term record in order to produce accurate average yieldestimates. These methods are also confounded because the view of the ground surface ispartially obstructed in forested watersheds.
Quantitative hillslope process rate data were not available for any portion of the CorteMadera Creek watershed. This study did not attempt to quantify sediment yields by discretehillslope sediment source mechanisms. Rather, this study estimated sediment yield from uplandchannel networks by sediment transport modeling. The amount of sediment passing uplandsubwatershed outlet sites is approximately the same as the amount of sediment delivered toupland channels from hillslopes, because upland channels are cut entirely in colluvial materialsderived from upslope or bedrock; there is virtually no long-term sediment storage in the channelor floodplain. Partially owing to channel entrenchment, there is little if any alluvial depositionon the channel bed, floodplains, or terraces within the modeled subwatershed areas. Furthermore, the channel dimensions and slope at the subwatershed outlet sites reflectdimensional adjustment to the prevailing sediment load. It follows that the channel dimensionscan reflect adjustment to recent episodes of catastrophic sediment inputs, such as may have beencontributed by 1981-1982 (Figure 20), and so produce model results that overestimate the long-term average sediment yield.
Although quantitative hillslope sediment yield data were not available, the USGS andother resource agencies have published several detailed geologic maps showing the distributionof landslides, gullies, earthflows, and soil creep zones interpreted from aerial photographs for allor part of the watershed. We compiled many of these data and produced maps covering thewatershed area. USGS and other agencies also published qualitative maps showing relative
Stetson Engineers Inc. 19 Corte Madera Creek WatershedGeomorphic Assessment
hillslope stability for all or part of the watershed according to aerial photo interpretation ofapproximate landsliding and earthflow frequency, slope, and detailed field assessment ofunderlying geology. However, none of these analyses included quantitative estimates oflandslide and earthflow frequency, or downslope creep rate, from which hillslope sediment yieldcould be roughly estimated. Field reconnaissance also revealed general limitations of theexisting maps for this purpose. For example, reconnaissance invariably revealed that publishedgully maps underestimated the gully distribution and density.
Because landslide and earthflow contributions probably dominate the long term averagesediment yield of the watershed, a watershed map was produced showing the distribution ofUSGS hillslope stability and landslide frequency estimates in the watershed (Figure 24). Thismap shows the relative distribution of hillslope sediment yield approximated by USGS data toprovide an independent qualitative estimate of relative sediment yield from the major CorteMadera Creek subwatersheds. 3.1.6. REGIONAL SEDIMENT TRANSPORT, YIELD, AND BUDGET ESTIMATES FROM OTHER
STUDIES
Sediment transport and yield data from comparable watersheds in the region can be usedto provide upper and lower limits to constrain preliminary uncalibrated sediment transport andyield estimates. We compiled available transport and yield data for watersheds underlain byhighly deformed Franciscan melange rock types, such as the Van Duzen River and the greaterEel River watershed to provide an upper limit for estimates made in this study. Owing toextremely high tectonic uplift rates, intense shearing and melange deformation, exacerbated byperiods of intense landscape disturbance by logging, long-term average sediment yields in theEel River are among the highest in the western United States (Judson and Ritter 1964). MarinCounty watersheds undergo a lesser but still significant uplift rate, and are lower on thecontinuum of melange deformation. We also compiled available data for less urbanized MarinCounty watersheds to provide a lower limit for estimates made in this study, such as Lehre’s(1982) 1971-1974 sediment budget for Lone Tree Creek in southwestern Marin County (Figure1). We also compared this study’s budget results to those of Lehre (1982), Collins (1998), andHaible (1980) regarding the relative percentage of total sediment yield generated by channel bedand bank erosion in Marin County watersheds. Comparisons to regional studies are made insummary data tables presented in the study results.
3.2. HISTORICAL CHANNEL PLANFORM AND CROSS-SECTION GEOMETRY DATA
3.2.1. HISTORICAL AERIAL PHOTOGRAPHY
Sequential aerial photography can often be used to assess and sometimes accuratelymeasure channel plan form and riparian vegetation changes, depending on scale and viewobstruction by vegetation cover. Air photos can also be used to characterize and map hillslopestability, landslide activity, logging and upland road building activities, gully formation andgully headcut advance as discussed briefly in Section 3.1.5. We reviewed 1946, 1960, and 1996stereo aerial photography of the Corte Madera watershed held in the UC Berkeley Earth Sciences
Stetson Engineers Inc. 20 Corte Madera Creek WatershedGeomorphic Assessment
Library. Scale and other attributes of these and other available aerial photographs covering thewatershed are tabulated in Appendix A.
Small air photo scale, dense riparian forest canopy cover, and dense urbanizationprevented making reliable measurements or qualitative observations of historical changes inchannel plan form, channel bed form, and aquatic and riparian habitat. Regardless, geomorphicreasoning would suggest that there have been no measurable changes in channel plan form afterthe period of rapid channel entrenchment began in about 1850. The earliest aerial photos, from1946, were made after the valley flat was nearly entirely urbanized. This prevents accurateassessment of pre-disturbance riparian conditions, or meaningful measurements of riparian zonewidth changes. An exception is the Sleepy Hollow Creek subwatershed. The 1946 air photospre-date urbanization of the Canada de Herrera ranch lands along the north and south forks ofSleepy Hollow Creek. The photos indicate heavy grazing impacts on the hillslopes and valleyflats. Very little riparian vegetation was established along upper Sleepy Hollow Creek in 1946.
3.2.2. HISTORICAL BED ELEVATION AND CROSS-SECTION DATA
Historical cross-section survey data can be compared to current survey data to accuratelymeasure changes in channel bed elevation and channel width caused by net channel bed incision(aggradation minus degradation) and channel widening. The rate of change in bed elevation andwidth can be calculated by dividing these measured changes by the period of years betweenmeasurements. Sediment yield generated by net channel bed and bank erosion can then beestimated by multiplying the average cross-sectional area change for all resurveyed sites in thewatershed by the length of the affected channels. We searched for historical cross-sectional datafor these purposes, including as-built bridge documents and bridge foundation inspection andrepair records, and historical topographic and cross-sectional survey data for drainage andflooding studies.
We requested bridge records from municipal and county officials, but obtained noinformation regarding potential sources of these data. We searched mixed historical records heldby the City of San Anselmo Public Works Department. This search only revealed variousflooding management studies for Sleepy Hollow Creek and San Anselmo Creek showingschematic cross-sections not suitable for resurveying. We also obtained general anecdotalinformation that most other bridge foundations were culverted or ‘box’ bridge foundations andso did not experience undercutting (George Davidson, City of San Anselmo, Public WorksDepartment, pers. comm., 1999). An exception was a historic bridge in downtown San Anselmo. We viewed ca. 1913 as-built cross-section data for the bridge at the San Anselmo DPW. Thecross-section data was not suitable for dimensional comparison with repeat survey data, but fieldreconnaissance showed that there had been no significant channel bed elevation change at thebridge since 1913. The contact between channel bed and bridge foundation was similar to thatshown in the as-built cross-section.
MCFCD provided a detailed photogrametric topographic map (2 ft contour interval) ofRoss Creek and Corte Madera Creek performed by Clair A. Hill and Associates in 1966. Themap included tens of cross-sectional surveys demonstrating relatively good resolution. However, obtaining lateral control for resurveying the unmonumented cross-sectional surveys
Stetson Engineers Inc. 21 Corte Madera Creek WatershedGeomorphic Assessment
would have been cost prohibitive. We made spot checks of channel width at various locationsthat revealed no significant channel widening, and reoccupied the longitudinal profile in a reachof Ross Creek from its mouth to Shady Lane Bridge, about 300 ft upstream that showed minornet channel aggradation. Based on these observations, we did not pursue extensive and costlyreoccupations of these historical cross-sections.
At the onset of the study, we assumed the most extensive and consistent historical cross-section data set would be contained in 1971-1976 HUD and FEMA Flood Insurance Study (FIS)records. These studies employed hydraulic model input data from the incorporated portion of thealluvial channel network. We obtained all of the available FIS records from Baker Services inAlexandria, Virginia, and exhaustively searched them for original cross-section field surveynotes and/or HEC-2 input data used in (FIS) hydraulic modeling. Many of the records werepoorly preserved as third- and fourth-generation 1970s xerox copies, or microfiche copies ofthose. The records were determined to be incomplete. HEC-2 input data were redundant andincomplete for individual FIS studies. Much of the backup data is presumed to have becomemisplaced while it was held by the USGS in Menlo Park (David Dawdy, consulting hydrologist,pers. comm., 1999).
We were able to identify potentially reliable cross-section survey data for several cross-sections on Deer Park Creek, Larkspur Creek, Sorich Creek, and Fairfax Creek from 1971-1976. We conducted field reconnaissance of these sites to identify addresses of creek neighbors forobtaining advance permission to resurvey the cross-sections, but, in so doing, invariably foundproblems preventing accurate or fruitful comparisons. All of the Sorich Creek cross-sectionswere surveyed across reinforced sections of the creek and would not be expected to showchannel incision. All of the Deer Park Creek cross-sections were surveyed prior to denseurbanization of the portion of Deer Park Creek below Meerna Ave. In many cases historicalcross-section sites were covered with homes, with the creek confined in an underground culvert. The Fairfax Creek and Larkspur Creek cross-sections traversed sections of the creek with one orboth creek banks reinforced by rip-rap and flood walls of various generations and ages, andabsence of lateral control often prevented useful resurveying. Lateral control was also absentfrom the cross-sectional profiles we were able to obtain from HEC-2 input data. Based on ourdata search results and field reconnaissance of the sites, we determined that systematicmeasurement of channel widening rates could not be accomplished by repeat cross-sectionsurveys. We compiled observations of tree-root scour along channel banks duringreconnaissance of survey sites to provide an estimate of channel widening rate absent surveydata.
We also obtained historical cross-section surveys of the Ross Gage from 1951, and datasummarizing bed elevation changes at the gage over time. We resurveyed the Ross Gage cross-section in January 2000, and compared this to historical cross-sectional geometry. We alsosuperimposed an idealized ‘equilibrium’ channel cross-section for the Ross Gage based on LunaLeopold’s channel dimensions contained in an unpublished data manuscript in the WaterResources Center Archives at UC Berkeley (Figure 10). This demonstrated the differencebetween the existing entrenched channel condition and ‘equilibrium’ channel conditions based
Stetson Engineers Inc. 22 Corte Madera Creek WatershedGeomorphic Assessment
on Leopold’s regression relations for SF Bay Area channels with the same drainage area (Dunneand Leopold 1978).
3.2.3. HISTORICAL LONGITUDINAL PROFILE DATA
Although the available FIS study backup data did not provide necessary and sufficientdata for measuring changes in cross-sectional area, the FIS studies contained relatively detailedlongitudinal profile data with an approximate vertical accuracy of 0.1 ft. We resurveyed 44 spotchannel bed elevations distributed throughout the incorporated alluvial channel network tomeasure changes in bed elevation from 1976 to 1999. No long profile data were available forLarkspur Creek, Tamalpais Creek, Ross Creek, Deer Park Creek, and Wood Lane Creek. However, as described above, we also resurveyed a portion of the long profile of Ross Creekinterpreted from 1966 topographic maps. We did not resurvey spot elevations along SorichCreek because the channel was heavily reinforced at the time of the historical survey.
3.2.4. HISTORICAL GROUND PHOTOGRAPHY
Historical ground photos can often be used to characterize historical habitat attributes andmeasure changes in channel depth and width by direct comparison with photos and field surveys(Smeltzer and Kondolf in preparation). However, our literature review at University ofCalifornia, Berkeley libraries did not reveal historical ground photographs of the watershed. Area historical libraries probably hold historical photograph collections containing at leastseveral useful historical photos of Corte Madera Creek and its tributaries that were not reviewedin this study. It would be useful for FCMCW volunteers to review public historical photocollections for individual photos that show channel depth relative to fixed elevations, ripariantree rooting elevations, or channel bed and bank conditions. Also, the FCMCW should considermaking a public request for area families to review their private collections for photos showingthese attributes. Some of the citations contained in Appendix I may contain ground photos of thechannel network.
We encountered low-quality photographs made of various bridges from the bed of SanAnselmo Creek, Sleepy Hollow Creek, and Corte Madera Creek contained in various floodmanagement reports (e.g., Hoffman and Albritton 1970). These photographs were intended toshow bridge openings and were not useful for measuring changes in channel width and depth. Ingeneral, these and other 1970s photographs reviewed during this study did not show anymeasurable undercutting of bridge foundations, consistent with present field observations of thesame locations.
A circa 1927 ground photograph showing the channel bed near the Lagunitas Roadbridge in Ross indicates that the channel bed elevation was several feet lower than it is today(Scott Nicholson, COE, pers. comm., 2000). We did not obtain or review this photograph duringthis study. This information is consistent with the hypothesis that the majority of channeldowncutting was complete by about 1910, and that the lower portion of the channel network has
Stetson Engineers Inc. 23 Corte Madera Creek WatershedGeomorphic Assessment
experienced channel aggradation since that time. Figure 10 shows that channel aggradationmeasured at the USGS gage (about 300 ft upstream from the Lagunitas Road bridge) evidentlyceased after about 1964.
3.2.5. HISTORICAL MAPSHistorical maps are often useful for characterizing general historical riparian conditions
and channel migration, and sometimes measuring changes in channel plan form. We reviewedseveral historical maps of Marin County dating back to ca. 1840 held in the Bancroft Library atthe University of California at Berkeley. Most of the earliest maps were intended to show theboundaries of Spanish Land Grant Ranchos, such as Canada de Herrera in the northern portion ofthe Corte Madera Creek watershed. The earliest maps were very schematic and did notaccurately characterize the channel network. Unfortunately, the detailed US Coast and GeodeticSurvey (USC&GS) maps made during the 1850s of southeastern and western Marin Countycoastal areas evidently do not cover any portion of the Corte Madera Creek watershed. Thesemaps generally included somewhat accurate representations of channel plan form and width,including the extent of near-channel riparian trees.
We also reviewed privately published maps of Marin County from 1860, 1898, 1910,1914, 1925. These maps generally showed the progression of railroad and roadway constructionin the watershed, but did not include useful data on channel changes or grazing area distribution. We used the extent of urbanization indicated in the 1910 map in conjunction with the lateraccurate series of USGS 7.5’ topographic quadrangles to show the progression of urbanization inFigure 13. We reviewed USGS quads from 1954, 1980, and 1993. USGS quads did not showchannel plan form changes or historical riparian forest cover. We used USGS quads to mapforested and open vegetation cover types in preparation of Figure 12, Figure 13, and Figure 25.
3.2.6. HISTORICAL ACCOUNTSHistorical accounts, memoirs, and regional historical summaries sometimes provide
useful data concerning the early channel plan form and dimensions, although these scant gemsare usually buried amidst hundreds of pages of unrelated information, or must be inferred fromindirect evidence.
William Brewer traversed eastern Marin County in about 1861, but his publishedaccounts were limited to his experiences at the Spanish Mission at San Rafael and observationsof Mt. Tamalpais. Alley, Bowen & Co. published an early history of Marin County in 1880 thatfailed to include any information regarding Corte Madera Creek or its tributaries. Otherhistorical accounts not reviewed in this study may provide data on the pre-entrenchment channeland floodplain conditions. A number of promising historical accounts are listed in Appendix I. FCMCW should consider identifying volunteers to search remaining sources for references tocreek conditions.
Creek neighbors encountered during field surveys and reconnaissance provided us withdescriptive accounts of historical channel changes in the creek adjacent their homes. Many of
Stetson Engineers Inc. 24 Corte Madera Creek WatershedGeomorphic Assessment
these data were used in the preparation of this report. FCMCW should consider distributing avoluntary survey to creek neighbors soliciting this information for the entire urbanized channelnetwork. A fluvial geomorphologist could review responses to identify interesting accountsworthy of follow up site visits. This process could potentially uncover useful historical channelchange data this study did not obtain.
Stetson Engineers Inc. 25 Corte Madera Creek WatershedGeomorphic Assessment
4. SEDIMENT BUDGET METHODS
4.1. MEASURING HISTORICAL CHANGES IN CHANNEL GEOMETRY
Limitations of existing historical channel plan form and channel geometry data weresummarized in Section 3.2. Channel bed elevation changes were estimated by surveying 44 spotelevations along San Anselmo Creek, Sleepy Hollow Creek, and Fairfax Creek to replicatelongitudinal profile data contained in 1976 FIS studies. Spot elevations coinciding with the 1966topographic survey of Ross Creek were surveyed, and channel bed width and estimated terraceheight were recorded at each of the 44 survey sites.
We conducted a field reconnaissance of these potential survey sites and listed creekneighbor addresses for obtaining necessary permission from creek neighbors. With volunteerassistance, the channel elevations were surveyed with an auto-level referenced to knownelevations where available, and otherwise referenced to arbitrary elevations on bridgefoundations or bridge decks, manhole covers, or fire hydrants. We provided a list describingarbitrary benchmarks we established at 19 locations in the watershed to MCFCD. MCFCDdetermined elevations of these benchmarks to within +/- 0.1 ft above mean sea level (NGVD29)(Don Hobbs, MCFCD, pers. comm., 2000). These benchmark descriptions and elevations aretabulated in Appendix D. Benchmark elevations determined by MCFCD were used to calculatepresent channel bed elevations. The 1999 spot elevations were plotted on a longitudinal profilemap adapted from complete 1976 FIS records to show the longitudinal distribution of elevationsamples and channel incision. We tabulated average values of channel bed incision forindividual tributaries and aggregate values for the alluvial channel network.
4.2. ESTIMATING SEDIMENT YIELD BY NET CHANNEL BED AND BANK EROSION
Measured channel elevation change was multiplied by the measured channel bed width toestimate cross-sectional area change by net channel bed erosion from 1976-1999 at each of the44 historical data sampling sites. Sediment yield by net channel bed erosion in the alluvialchannel network for 1976-1999 was estimated by multiplying the average change in cross-sectional area for each major tributary by its total alluvial length.
To provide an upper limit estimate of sediment yield by bank erosion for the same timeperiod in the absence of systematic channel cross-section data comparison, we estimated that oneof the two channel banks retreated a total of 2 feet from 1976-1999. This constitutes aconservative, upper limit value of bank retreat because the maximum lateral root scourmeasurement of all point measurements in the watershed was about 2 ft. Average cross-sectionalarea change by bank erosion was calculated at each of the 44 sites by multiplying 2 ft of bankretreat by the measured terrace height. We then estimated sediment yield by bank erosion in thealluvial channel network for approximately 1976-1999 by multiplying the resulting averagechange in cross-sectional area for each major tributary by its total alluvial length.
Stetson Engineers Inc. 26 Corte Madera Creek WatershedGeomorphic Assessment
4.3. ESTIMATING SUBWATERSHED BEDLOAD SEDIMENT LOADS AND YIELDS
Characteristic reaches were selected along each of ten major Corte Madera Creektributaries to serve as subwatershed outlet sites for modeling bedload sediment transport andestimating average annual bedload sediment yields. Three types of data necessary for modeldevelopment were collected with volunteer assistance. First, bed surface sediment sizedistribution data were collected by the ‘pebble count’ method (Wolman 1954). This entailedmeasuring the length of the median axis of about 300 clasts randomly selected from the bedsurface and calculating the sediment size distribution at each site. The bed sediment sizedistribution determines how rough the bed is, and thus, the resistance to stream flow passingover the bed. Bed roughness is thus a necessary input variable for hydraulic model estimates ofwater depth and energy slope for a given discharge.
Topographic data were collected for three to seven cross-sections along each selectedreach as further input data for the hydraulic model. We surveyed the cross-sections about twochannel widths apart with an auto-level referenced to arbitrary benchmarks on nearby bridgedecks. Subwatershed outlet channel survey data are contained in Appendix E. The cross-sectionand roughness data were used with a Corps of Engineers hydraulic model (HEC-2) to develop astage-discharge relation for one of the cross-sections in each reach and to estimate the energyslope of the stream at a chosen cross-section. Appendix H presehnts resutling uncalibratedstage-discharge relations. The energy slope and flow depth determine the given discharge’scapacity to transport sediment along the bed at the site.
The stage-discharge relation and the cross-section data were used with a third type ofdata collected, subsurface or sub-pavement sediment size distribution, to estimate the sedimentdischarge passing each subwatershed outlet for a given discharge. We used the Parker-Klingeman (P-K) sediment transport model (Parker and Klingeman 1982) to calculate sedimentdischarge over the range of modeled flows. We also substituted P-K shear values (determinedfor a large data set collected on Oak Creek, Oregon) with alternate shear values developed by theUSFS in recent studies in the North Umpqua basin (Paul Bakke, USFS, Klamath Falls, pers.comm., 1999) to provide comparative results. Summary values were obtained by averaging P-Kand USFS results. Average values are for general overview purposes only, and should bedistinguished from individual model results.
Total average annual bedload sediment yield was calculated by integrating results over aflow frequency distribution estimated for each subwatershed. The flow frequency distributionwas estimated by directly apportioning the mean daily flow frequency distribution calculated forthe flow of record at Ross by subwatershed drainage area. A detailed description of sedimenttransport modeling methods is contained in Appendix C, and sediment size distribution dataanalyses are contained in Appendix F and Appendix G.
It is important to note that these sediment transport model results are estimates of thechannel’s capacity to transport sediment. The Parker-Klingeman model assumes that the channelhas adjusted so that the input of sediment is carried through the reach. The armor layer ofpavement forms on the surface so that the input is equal to the output of bedload. The subsurface
Stetson Engineers Inc. 27 Corte Madera Creek WatershedGeomorphic Assessment
size distribution more closely approximates the distribution of the bedload, whereas the surfacematerial is considerably coarser.
4.4. ESTIMATING TOTAL BEDLOAD SEDIMENT BUDGET AT ROSS
Estimated bedload loads were summarized for the seven subwatershed areas above Ross(11.5 sq.mi.) to compile a preliminary estimated total sediment budget at Ross (Table 3, Figure18). Using a ratio calculated from 1978-1980 USGS sediment transport measurements at Rossand other regional values (Table 10), we assumed that bedload comprised 10 percent of total(bedload and suspended load) sediment yield. We then estimated bedload and suspendedsediment yield for the unsampled drainage area above Ross (4.5 sq. mi.), assuming that theaverage yield rate from subwatershed estimates applied uniformly to the unsampled area. To thissubtotal, we added estimated yield by net channel bed and bank erosion in the alluvial channelnetwork above Ross (Table 4). The results of preliminary sediment budget compilation aresummarized in Table 5 and Table 8, and in the Executive Summary.
To provide an independent estimate of the total sediment budget at Ross, bedloadsediment inflow was estimated at the Ross Gage with the Parker-Klingeman model, withmethods similar to subwatershed bedload sediment transport modeling methods described insection 4.3. We used available USGS sediment transport measurements for 1978-1980 toproduce a calibrated bedload sediment discharge rating curve. We estimated average annualbedload sediment discharge by integrating over the flow frequency distribution calculated overthe entire period of record.
Results of the calibrated yield model at Ross were compared to results of the sedimentbudget estimate at Ross, and to USGS sediment transport measurements, COE estimates,documented gravel extraction rates at Ross, and available regional sediment yield and budgetdata for comparable watersheds.
Stetson Engineers Inc. 28 Corte Madera Creek WatershedGeomorphic Assessment
5. RESULTS
5.1. ESTIMATED SEDIMENT YIELD BY NET BED AND BANK EROSION
Repeat channel bed elevation measurements show that the average channel bed loweringrate in the alluvial channel network was 0.04 ft/yr for 1976-1999 (Table 4). Figure 26 shows thedistribution and elevation of samples, and Figure 9 shows the distribution of sample sites withinthe entire mainstem of Corte Madera Creek - San Anselmo Creek longitudinal profile. Thisstudy estimated average bank retreat was 2 lateral feet per longitudinal foot in the alluvialchannel network for the same period. These estimated channel bed incision and bank retreatrates compare well with estimates obtained in other Marin County watershed assessments (Table11).
Based on historical channel geometry changes measured in this study, the estimatedbedload sediment yield by total net channel bed and bank erosion in the alluvial channel networkis about 670 tons per year for 1976-1999 (Table 4). Bank erosion generated about 430 tons/yearof bedload, and bed incision generated about 240 tons/year.
5.2. ESTIMATED SUBWATERSHED BEDLOAD SEDIMENT YIELDS
This study’s uncalibrated sediment transport modeling, using USFS and P-K shearvalues, respectively, indicates that sampled upland areas contribute between about 2,900 and6,600 tons of bedload to the channel network above Ross per year (Table 5). Averaging P-K andUSFS transport estimates indicates that sampled areas produce about 4,750 tons/year, or 410tons/sq.mi./yr (Executive Summary Table). This range of bedload yield values is greater thanestimates for other, less urbanized Marin County watersheds. Lehre (1982), e.g., estimated thatLone Tree Creek basin in southwestern Marin County (Figure 1) produces about 240tons/sq.mi./year. The Lone Tree Creek basin receives less precipitation than Corte MaderaCreek watershed (Figure 4), has fewer upland roads, and is not urbanized.
This study’s uncalibrated subwatershed bedload sediment transport model results7
indicate that the San Anselmo Creek and Sleepy Hollow Creek subwatersheds produce about25% and 29%, respectively, of the total bedload sediment inflow at Ross (Table 5, ExecutiveSummary Table). Independent qualitative relative sediment yield classification methods basedon existing USGS landslide habitat and slope stability mapping also suggest that San AnselmoCreek and Sleepy Hollow Creek produce greater sediment yields by hillslope processes persquare mile than other Corte Madera Creek subwatersheds (Figure 24). Detailed sedimentbudget studies in Marin County and Eel River tributaries have shown that sediment yield bylandslides, earthflows, and downslope soil creep dominate long-term total sediment yields
7 The estimated average annual bedload sediment yields are semi-quantitative only, because they are the
results from an uncalibrated model. That is, there were no bedload measurements made in the field to verify themodel results.
Stetson Engineers Inc. 29 Corte Madera Creek WatershedGeomorphic Assessment
(Lehre 1982, Kelsey 1980). These studies have also shown that underlying geologic type is oneof the strongest influences on hillslope and total sediment yield. Kelsey (1980) showed thatrolling-to-hummocky grassland and grass-oak woodland covered Franciscan melange slopesproduce about 30 times more sediment per square mile than steep, forested sandstone and shaleslopes. The San Anselmo Creek and Sleepy Hollow Creek subwatersheds have a greaterpercentage of grassland, grass-oak woodland, and chaparral-covered melange slopes than otherCorte Madera Creek subwatersheds (Figure 25).8 Forested sandstone slopes occur primarily inthe Larkspur Creek, Tamalpais Creek, and Ross Creek subwatersheds above Phoenix Lake, andsubstantial areas in the Fairfax Creek subwatershed.
Maximum estimated yield was for the upper portion of the San Anselmo Creeksubwatershed (up to 3,000 tons/sq.mi./yr). However, this value is still much less than maximumvalues Kelsey (1980) measured in comparable small Van Duzen River subbasins (Table 12).
5.3. ESTIMATED SEDIMENT BUDGET AND CALIBRATED YIELD ESTIMATE ATROSS
This study’s uncalibrated sediment budget suggests that between about 4,700 and 9,800tons/yr of bedload are transported to the channel network above Ross each year (Table 8). Theaveraged sediment budget estimate is about 7,250 tons/yr, or about 450 tons/sq.mi./yr (ExecutiveSummary Table). The averaged sediment budget estimates that bed and bank erosion generateabout 9 percent of the total sediment yield at Ross, and fluvial transport from the upland channelnetwork generates about 91 percent of the total. This 91:9 ratio is comparable to other detailedsediment budget studies reviewed in this report (Table 9). Lehre (1982) estimated the ratio wasabout 94:6 in the Lone Tree Creek basin, and Kelsey (1980) estimated the ratio was about 95:5in the Van Duzen River basin. The budget roughly estimates that about 6 percent of the totalsediment yield at Ross is generated by channel bank erosion (Table 8). This values iscomparable to Lehre’s (1982) results for Lone Tree Creek basin (2 percent) and Kelsey’s (1980)results for the Van Duzen River basin (5 percent) (Table 9).
8 Figure 25 is partly based on the generalized geology of Blake et al 1974. Subsequent to the preparation
of the generalized watershed geology map after Blake et al. (1974) (Figure 17), and Figure 25, discrepancies wererevealed between Blake et al. (1974) and Smith et al. (1976). Smith et al. (1976) is the more accurate geology map,but it does not include MMWD lands comprising the larger portion of the Ross Creek, Deer Park Creek, Wood LaneCreek, and San Anselmo Creek subwatersheds. The primary overall difference not reflected in Figure 17, thus alsonot in Figure 25, is the dominance of upper Cretaceous sandstone and shale in the Larkspur, Tamalpais, and RossCreek subwatersheds, where Blake et al. (1974) showed these areas were underlain by Franciscan melange.
Stetson Engineers Inc. 30 Corte Madera Creek WatershedGeomorphic Assessment
The estimated budget also demonstrates that annual average gravel extraction rates nearLagunitas Road Bridge (665 tons/yr) and College of Marin Bridge (about 1000 tons/yr) provideextreme lower limit estimates of the bedload sediment inflow rate at Ross (Table 6, Table 7).
Application of the Parker-Klingeman sediment transport model at Ross, and calibrationwith USGS sediment transport data, provided an independent total annual bedload sedimentinflow estimate of about 6,750 tons/yr (Executive Summary Table).
5.4. HISTORICAL CHANNEL BED INCISION AND AGGRADATION RATES
Historical analysis suggested that channel network entrenchment uncovered numerousresistant bedrock and stiff clay outcrops causing the bed incision rate to decrease beginning inabout 1910. Assuming entrenchment began in about 1850, the average annual channel bedincision rate was about 0.20 ft/year for 1850-1910. This study showed that average channel bedlowering rate in the alluvial channel network was 0.04 ft/yr for 1976-1999 (Table 4). Table 4and Figure 26 show that recent bed incision was greater on Fairfax Creek (0.06 ft/yr) and SanAnselmo Creek (0.05 ft/yr) than Sleepy Hollow Creek (0.02 ft/yr). Survey data showed that thelower portion of Ross Creek has aggraded about 0.02 ft/yr during the same period.
This study measured aggradation of about 0.08 ft/yr in the lower portion of the watershed(at the Ross Gage) from 1951-1999. Gage records show that bed aggradation rate evidentlyslowed after about 1964; the bed aggraded about 0.27 ft/yr from 1951-1964 (Figure 10). A circa1927 ground photograph showing the channel bed near the Lagunitas Road bridge in Rossindicates that the channel bed elevation was several feet lower than it is today (Scott Nicholson,COE, pers. comm., 2000). This information is consistent with the hypothesis that the majority ofchannel downcutting was complete by about 1910, and that the lower portion of the channelnetwork has experienced channel aggradation since that time. In an assessment of Novato Creekchannel processes, Collins (1998) also observed that channel downcutting rates were higherupstream than downstream. Haible (1980) documented 4 ft of aggradation in the lower portionof Walker Creek basin for 1915-1975 (0.07 ft/yr).
This study also observed systemic channel widening and local bank erosion throughoutthe alluvial channel network. This study estimated a conservative upper limit value for averageannual channel widening of about 0.1 ft/year for approximately 1976-1999.
Stetson Engineers Inc. 31 Corte Madera Creek WatershedGeomorphic Assessment
6. DISCUSSION
6.1. ESTIMATED BEDLOAD SEDIMENT BUDGET AND YIELD AT ROSS
Using an average between calibrated yield results (6,750 ton/year) and the average of therange of uncalibrated budget results (7,250 tons/year), this study indicates that average annualbedload sediment inflow at Ross is about 7,000 tons/yr. This estimate is about 40 percent lessthan the Army Corps of Engineers (1989) estimate of 11,070 tons/yr. However, the COE modelincluded transport of 'very fine sand' and 'fine sand' (0.0625 - 0.250 mm) in its bedload estimate,and this study did not. This study's estimates can thus be expected to be about 10-20 percent lessthan COE estimate. This study's estimate can be considered about 20-30 percent less thanCOE’s estimate.
This study indicates that Corte Madera Creek's bedload sediment yield is about 45percent greater than an estimate for Lone Tree Creek, a comparable, but less urbanized westernMarin County watershed (Figure 1). Corte Madera Creek watershed's greater yield can probablybe primarily attributed to its greater intensity of historical land use impacts, greater density ofupland roads, and greater peak and average annual precipitation along its western boundary(Figure 4) (A. Lehre, HSU, pers. comm., 2000).
This study estimates that Corte Madera Creek's bedload sediment yield is about 40percent less than values estimated in the Van Duzen River basin and other parts of the Eel Riverbasin (Table 9, Table 10). The Van Duzen River and Eel River values can be considered upperlimit values due to a greater degree of melange deformation and tectonic uplift, and continuingupland land use impacts. Yields from the Eel River basin are among the highest in westernNorth America (Judson and Ritter 1964). The COE’s estimated yield at Ross is closer to upperlimit values measured for the Van Duzen River in the Eel River basin than this study’s estimatedyield at Ross.
Due to persistent upland land use impacts, the Corte Madera Creek watershed's bedloadsediment yield can be considered to be unnaturally high. This study did not estimate its naturalbackground yield. However, it is probably greater than the estimate for Lone Tree Creek (240 tons/sq. mi./year) and less than this study's estimate (about 450 tons/sq. mi./year). If the naturalbackground rate were estimated to be 350 tons/sq. mi./year, than the human-induced increase inbedload inflow at Ross would be about 1,600 tons/year.
As with any model application, this study’s results must be considered estimates, andshould be calibrated with bedload sediment transport measurements over a range of discharges atsubwatershed outlet sites. Bedload transport measurements were not included in the scope ofthis study, but we collected a bedload sample at the Upper San Anselmo Creek subwatershedoutlet site, about 106 ft upstream from the Cascade Creek confluence during the receding limb ofa rainstorm on January 23, 2000. The mass of this isolated sample was about 50 percent lessthan the model prediction for bedload transport. However, the channel bed pavement was not
Stetson Engineers Inc. 32 Corte Madera Creek WatershedGeomorphic Assessment
fully mobilized during the low measured discharge. As is to be expected from the operation ofthe model, larger sizes were not moving, or were moving at such small rates that none weresampled. The size distribution of the bedload for each discharge is controlled by the exponent inthe Parker-Klingeman model. As the discharge increases, the distribution of the bedloadapproaches that of the subsurface material. For lower discharges, the distribution of the bedloadis much finer than that of the subsurface material. Thus, for calibration of the model a range ofdischarges must be sampled.
We also resurveyed the bathymetry of a sediment trap excavated at the Wood Lane Creeksubwatershed outlet site at Marin Stables on February 2, 2000, and February 21, 2000. By thelatter date, approximately 75-100 tons of bedload was trapped in the excavation. Marin Stablespersonnel estimate that comparable excavations fill completely about every other year. Thisstudy estimated that the Wood Lane Creek subwatershed is about 110 tons/yr. Theseobservations suggest that the transport model is relatively accurate for the Wood Lane Creekoutlet. More accurate collection of future excavation data at the site could be used to furtherultimately calibrate the model. In general, as discussed above, more extensive and intensivesediment sampling will be required to calibrate this study’s sediment transport model results.
6.2. PROBLEM SUBWATERSHEDSThis study indicates that the San Anselmo Creek and Sleepy Hollow Creek
subwatersheds contribute about 29 percent and 26 percent, respectively, of the total bedloadsediment inflow at Ross (Executive Summary Table). San Anselmo Creek and Sleepy HollowCreek generate about 580 and 660 tons/sq.mi./year, respectively. These yield values arecomparable to, but less than, upper limit values estimated in the Van Duzen River basin. TheRoss Creek and Fairfax Creek subwatersheds are underlain by a combination of Franciscanmelange and more resistant Cretaceous sandstones and shales (Figure 25), and generate onlyabout 10 percent of the total bedload yield.
Detailed sediment budget studies of northern California Coast Range watersheds indicatethat the sediment source mechanisms dominating long-term average sediment yield arelandsliding and earthflows. Thus, the frequency of mass wasting can probably be considered asuitable surrogate for long-term average bedload sediment yield in the Corte Madera Creekwatershed. Available interpretive USGS maps of potential hillslope instability and landslidefrequency show that greatest potential hillslope instability and landslide frequency occurs in theSan Anselmo Creek and Sleepy Hollow Creek subwatersheds (Figure 24).
Aerial photographs from 1946 show the impact of intense grazing in the Sleepy HollowCreek subwatershed. Hummocky grassland-covered hillslopes show evidence of deep-seatedslumps and downslope soil creep. Minor zero-order tributaries form incised channels just belowridge lines and cut across valley flats to join main channels. Terracettes are evident on thepresent hillslopes. The primary sediment source mechanisms in the Sleepy Hollow Creeksubwatershed are probably active hillslope processes at the upstream limits of the North Forkand the South Fork (Figure 20). The melange rock mass is evidently highly deformed andmechanically weak in the vicinity of Loma Alta. Field reconnaissance in the upper north forkrevealed large earthflow deposits covering the channel and locally active erosion of earthflow
Stetson Engineers Inc. 33 Corte Madera Creek WatershedGeomorphic Assessment
deposits. Field reconnaissance also revealed minor fire damage and active gullying in thesandstone-underlain chaparral area on the northeastern edge of the subwatershed, and manyactive earthflows along its eastern edge.
Our field reconnaissance showed that neither fork of upper Sleepy Hollow Creek is deeplyentrenched, which may be explained by numerous bedrock and stiff clay outcrops observed inthe bed and the high upland sediment supply. The mainstem becomes moderately to deeplyentrenched at or just below a constriction in the valley width. A shallow bedrock outcropassociated with this constriction may account for the relatively low entrenchment ratio upstream. Numerous bedrock outcrops also regulate channel downcutting rate in the lower portion ofSleepy Hollow Creek. This study showed that its recent downcutting rate was lower than forSan Anselmo Creek and Fairfax Creek.
The San Anselmo Creek is also underlain by very highly deformed Franciscan melangerock mass, as indicated by the dense metamorphic rock outcrops and complex fault patterns(Smith et al. 1976). Using P-K shear values, the estimated bedload yield from the Upper SanAnselmo Creek subwatershed was much greater per square mile than San Anselmo Creek as awhole. Indeed, the upper portions of San Anselmo Creek, Cascade Creek, Pine Creek, andCarey Camp Creek are extremely deformed and steep (Figure 22), and evidently receivesignificant sediment contributions from landsliding and earthflows (Figure 20). Presence ofchaparral areas might elevate sediment yield from the San Anselmo Creek subwatershed. Rice(1982) found that chaparral areas produce up to 640 tons/sq.mi./year of sediment by dry ravelprocesses, in the absence of intense rainfall. Rice (1982) also measured sediment yield rates upto 17,871 tons/sq. mi. in the three months following fire in a chaparral area.
Fire road and pipeline access road construction and maintenance probably also elevatesediment production in the San Anselmo Creek subwatershed. For example, MCOSD andMMWD identified a redundant, high-maintenance fire road network below Blue Ridge (Site no.29 in Figure 23, Appendix B) and a poorly maintained fire road on the ridge crest separating theUpper San Anselmo Creek and Cascade Creek canyons (Site no. 12 in Figure 23, Appendix B). Sediment contributions by landslides are particularly large and numerous in the San AnselmoCreek subwatershed. As an example, a large but not uncommon landslide deposit can be seen onthe right bank about 300 ft downstream from the Canyon Road Bridge.
Listing Sleepy Hollow Creek and San Anselmo Creek as the primary problemsubwatersheds is not to say that other areas in the watershed do not contribute significantamounts of sediment. For example, the upper reaches of Fairfax Creek draining the southernhillslopes of Loma Alta probably produce sediment yields comparable per square mile to theeastern slopes of Loma Alta in Sleepy Hollow Creek subwatershed. Modeling of sediment yieldfrom Sorich Creek was prevented by invalid hydraulic model results evidently associated withchannel steepness and longitudinal profile irregularities. However, Sorich Creek probablyproduces as much, if not more than the sediment yield per square mile of Sleepy Hollow Creek.
Portions of the upper Ross Creek subwatershed, although relatively well-forested andunderlain by sandstones (not mapped correctly by Blake et al. 1974), are very steep andundoubtedly produce high sediment supplies. The southwestern slopes of Bald Hill are intensely
Stetson Engineers Inc. 34 Corte Madera Creek WatershedGeomorphic Assessment
deformed and obviously produce very high local sediment supplies. However, these sedimentsources are upstream from Phoenix Reservoir, and thus are inconsequential as they do notcontribute to sediment inflow at Ross.
6.3. IMPLICATIONS OF RESULTS FOR FLOOD MANAGEMENT GOALS
Coarse sediment deposition in the flood control channel downstream of Ross reduces itsflood control performance by reducing its volumetric capacity and increasing channel bedroughness. The COE recently proposed constructing a sedimentation basin at Lagunitas Roadbridge in Ross that is expected to reduce the median sediment size of sediment despositeddownstream by preferentially trapping the coarsest fractions of the incoming bedload. Thiswould increase the channel's conveyance capacity by reducing channel bed roughness. TheTown of Ross has extracted about 670 tons/yr by gravel bar skimming beneath Lagunitas Roadbridge almost every year since 1987. This activity has a similar but less significant effect thanthe proposed sedimentation basin.
This study indicates that upland areas generate about 7,000 tons/yr of incoming bedload,while net channel bed incision and bank erosion contribute about 240 and 430 tons/yr,respectively. Therefore, total elimination of bank erosion and systemic channel wideningthroughout the alluvial channel network would probably reduce bedload sediment delivery toRoss by as much as about 430 tons/yr, only 6 percent of the total bedload delivered to Ross.
If Corte Madera Creek's natural background sediment yield rate is conservatively estimatedto be 350 tons/sq. mi./yr, than the bedload inflow at Ross attributable to persistant land useimpacts would be about 1,600 tons/yr. Almost all of this additional sediment is generated inupland areas, with a majority evidently coming from uplands in the San Anselmo and SleepyHollow Creek subwatersheds. Total elimination of the additional sediment supply by restorationof problem sediment sources and improved hillslope management practices would probably,over time, reduce bedload sediment delivered to Ross by as much as about 1,600 tons/yr, orabout 20% of the annual bedload inflow.
Watershed sediment management actions in the adjacent San Geronimo Creek basin haveevidently reduced bedload supply measured at the Town of Lagunitas since 1990 (J. Owens,Balance Hydrologics, pers. comm., 2000). These efforts have also evidently reduced thepercentage of fine sediment in the channel bed. This may be a benefit to aquatic habitat (e.g., byincreasing salmonid spawning success), but has also led to channel bed coarsening. Anyproposed efforts to reduce sediment supply from uplands in the Corte Madera Creek watershedshould consider the potential for causing local or systemic bed coarsening which may potentiallyboth offset any benefit to salmonid spawning suitability and reduce performance of the floodcontrol channel.
6.4. IMPLICATIONS OF RESULTS FOR WATERSHED AND HABITAT RESTORATIONGOALS
Stetson Engineers Inc. 35 Corte Madera Creek WatershedGeomorphic Assessment
Natural geomorphic responses to channel entrenchment operate in the Corte Madera Creekwatershed. A period of progressive upstream channel aggradation occurred in the lower portionof the watershed, evidently ending in about 1964. About 4 ft of channel bed aggradationoccurred at the Ross Gage from 1951 to 1964. Anecdotal evidence suggests that channel bedaggradation was ongoing from about 1910 to 1964. These observations are consistent withgeomorphic responses observed in other entrenched Marin County streams. Collins (1998)observed that channel downcutting rates were less in the lower portion of the watershed. Haible(1980) documented 4 ft of bed aggradation in the lower reaches of Walker Creek for 1915-1975.
Systemic channel widening and local bank erosion are still active in the upper portion ofthe alluvial channel network. Channel widening is a natural geomorphic response to channelentrenchment that accelerates following bed elevation stabilization (Schumm 1999). Channelwidening is a natural recovery process that recovers aquatic and riparian habitat lost duringchannel entrenchment by allowing active inset floodplain sedimentation, increased channelmeandering, woody debris recruitment, and pool-riffle channel bed morphology development. Geomorphic reasoning would suggest that the process of local and systemic channel wideningcan be expected to continue at or near its present rate for at least several more decades orhundreds of years, until the entrenched channel’s active channel width approaches its pre-entrenchment active channel width. Then, the plan form of active channel boundaries willbecome more stable, and more natural geomorphic and floodplain processes will occur withinthe widened, entrenched channel that can sustain riparian and aquatic habitat values that arecomparable to those supported by the pre-entrenchment channel (Figure 16).
There are active inset floodplains at a number of locations in the watershed where theentrenched channel was wide enough or became wide enough following entrenchment to allowdeposition and storage of relatively fine gravels, particularly at inside bends of widenedentrenched meanders. Some pool-riffle development has also occurred, but narrow channelconfinement limits its extent. Notably, systemic watershed-wide channel entrenchment did notconfine the channel and reduce active channel width at some isolated locations in the watershed,such as an approximately 400-ft reach of Fairfax Creek within Andi Peri Park. Channelmeanders, floodplain processes, and gravel bar and pool-riffle development are largely intact atthese sites.
However, nearly the entire alluvial channel network is unnaturally narrow and closelyurbanized. Urbanization reinforces the channel entrenchment process by routing storm waterfrom hillsides and the valley flat directly into stream channels. Urbanization of the abandonedfloodplain also prevents recovery by the associated construction of bank protection and floodcontrol structures to prevent channel widening and progressive upstream aggradation andfloodplain recovery. About 50 percent of the basin’s channel banks are artificially reinforced toprevent channel widening by bank erosion (Friends of Corte Madera Creek Watershed 1997). Inaddition, residential and commercial landowners filled the channel margins to increase propertyacreage. In general, these structures impede natural geomorphic recovery of the channel.
Observed bed level stabilization, channel widening, and inset floodplain formation indicatethat natural geomorphic recovery processes are ongoing but incomplete and impeded by artificial
Stetson Engineers Inc. 36 Corte Madera Creek WatershedGeomorphic Assessment
bank stabilization in the Corte Madera Creek watershed. As a priority, projects intended toimprove flood control and/or aquatic and riparian habitat and habitat-supporting processes andflood control should seek opportunities, where possible, to increase active channel width. Conceptual demonstration project designs for floodplain restoration (for a hypothetical sitewhere widening is possible) and streambank stabilization (for a hypothetical site wherewidening is not possible) are outlined in Appendix L and Appendix K, respectively.
As noted above regarding flood management implications, any proposed efforts to reducesediment supply from uplands in the Corte Madera Creek watershed should consider thepotential for causing local or systemic channel bed coarsening. Numerous grade controlsthroughout the alluvial channel network would probably prevent systemic channel incision fromproceeding at more than the average rate measured in this study (0.04 ft/yr). Any local channelbed incision would probably only marginally reduce habitat values already significantly reducedby 1850-1910 channel entrenchment. Reduced gravel supply could, for example, further reducebedform development and aquatic habitat complexity, and decrease substrate pool density. Reduced watershed sediment supply may also reduce the percentage of fine sediment in thechannel bed, as has been observed on San Geronimo Creek. However, the presence of finesediment in the channel bed is not necessarily a limiting factor for fish populations in the CorteMadera Creek watershed (A. Rich, pers. comm., 1999).
Stetson Engineers Inc. 37 Corte Madera Creek WatershedGeomorphic Assessment
7. REFERENCES CITED
Alley, Bowen & Co. 1880. History of Marin County California, including its geography,geology, topography and climatography, together with a record of the Mexican grants,names of pioneers, and a complete political history. San Francisco, CA: Alley, Bowen &Co., Bancroft Library Collection, University of California, Berkeley.
Brewer, W.H. 1949. Up and down California in 1860-1864. Berkeley CA: University ofCalifornia Press.
Brown, W.M. 1975. Sediment transport, turbidity, channel configuration and possible effects ofimpoundment of the Mad River, Humboldt County, California. USGS Water ResourcesInvestigation 26-75, 63 pp.
Brown, W.M. and L.E. Jackson. 1973. Erosional and depositional provinces and sedimenttransport in the south and central part of the San Francisco Bay region, California. USGSInterpretive Report 3.
_________. 1974. Sediment Source and Deposition Sites and Erosional and DepositionalProvinces, Marin and Sonoma Counties, California. USGS Miscellaneous Field StudiesMap MF-625.
Brown, W.M. and J.R. Ritter. 1971. Sediment transport and turbidity in the Eel River Basin,California. USGS Water-Supply Paper 1986, 70 pp.
Collins, L. 1998. Sediment sources and fluvial geomorphic processes of Lower Navato CreekWatershed. Report to Marin County Flood Control and Water Conservation District, July1998.
Clair A. Hill and Associates. 1966. Corte Madera Creek Topographic Maps, Ross to SanAnselmo, contour interval 2 ft, scale 1 in. = 40 ft. Prepared for US Army Corps ofEngineers.
Daetwyler, C.C. 1950. Marine Geology of Tomales Bay. Report to Scripps Institute ofOceanography and to Pacific Marine Station.
Davenport, C.W. 1984. An analysis of slope failures in eastern Marin County, California,resulting from the January 3rd and 4th, 1982 storm. California Dept. of Conservation,Division of Mines and Geology. DMG open-file report 84-22 SF.
Dawdy, D.R., W.C. Wang, and P. Basdekas. 1999. Calibration of the Parker-Klingemas modelwith variable shear. In: A.W. Jayawardena, J.H.W. Lee, and Z.Y. Wang, eds., RiverSedimentation: Proceedings of the Seventh International Symposium on River
Stetson Engineers Inc. 38 Corte Madera Creek WatershedGeomorphic Assessment
Sedimentation, Hong Kong, China, December 16-18, 1998, pp. 753-756.DeBano, L.F. 1969. The relationship between heat treatment and water repellency in soils. In:
Proceedings of the symposium on water-repellent soils, Riverside, CA, pp. 265-279.
Dunne, T. and L.B. Leopold. 1978. Water in environmental planning. San Francisco, California:W.H. Freeman.
Ellen, S.D., D.M. Peterson, and G.O. Reid. 1982. Map showing areas susceptible to differenthazards from shallow landsliding, Marin County and adjacent parts of Sonoma County,California. USGS Miscellaneous Field Studies Map MF-1406.
Ellen, S.D. et al. 1997. Map showing principal debris flow source areas in Marin County,California. USGS Open-File Report 97-745.
Emmett, W.W. and H.R. Seitz. 1974. Suspended and bedload sediment transport in the Snakeand Clearwater Rivers in the vicinity of Lewiston, Idaho, July 1973 through July 1974.USGS Basic Data Report, 76 pp.
Federal Emergency Management Agency. 1980. Flood Insurance Study, Town of Ross,California, Marin County, 15 pp.
_________. 1983. Flood Insurance Study, City of Larkspur, California, Marin County. 18 pp.
Friends of Corte Madera Creek Watershed. 1997. Background for Long-Range Planning; CorteMadera Creek Watershed, February 25, 1997 (reprinted November 1998).
Graumilch, L. 1993. A 1000-year record of temperature and precipitation in the Sierra Nevada.Quaternary Research 39:249-55.
Haible, W.W. 1980. Holocene profile changes along a California Coastal Stream. Earth SurfaceProcesses and Landforms 5:249-264.
Harvey, A.M., P.E. Wigand, and S.G. Wells. 1999a. Response of alluvial fan systems to latePleistocene to Holocene climatic transition: contrasts between margins of pluvial LakesLahontan and Mojave, Nevada and California, USA. Catena 36:255-281.
Harvey, A.M., P.G. Silva, A.E. Mather, J.L. Goy, M. Stokes, and C. Zazo. 1999b. The impact ofQuaternary sea-level and climatic change on coastal alluvial fans in the Cabo de Gataranges, southeast Spain. Geomorphology 28:1-22.
Hawley, N.L. and B.L. Jones. 1969. Sediment yield of coastal basins in northern California.USGS Water Resources Division Open-File Report, 19 p.
Hecht, B. 1994. South of the spotted owl: restoration strategies for episodic channels and
Stetson Engineers Inc. 39 Corte Madera Creek WatershedGeomorphic Assessment
riparian corridors in central California. In: D.M. Kent and J.T. Zenter, eds., WesternWetlands: Selected Proceedings of the 1993 Conference of the Society of WetlandScientists, pps. 104-117.
Herd, D.G. and E.J. Helley. 1977. Faults with quaternary displacement, northwestern SanFrancisco Bay region. USGS Miscellaneous Field Studies Map MF-818.
Hereford, R. 1983. Entrenchment and widening of the Upper San Pedro River, Arizona. Geol.Soc. Amer. Special Paper 282. 46 p.
Hoffman and Albritton. 1970. Minimum drainage study, Sleepy Hollow Creek. Report to theCity of San Anselmo.
Janda, R.J. 1966. Pleistocene history and hydrology of the upper San Joaquin River. Ph.D.Dissertation, University of California, Berkeley.
Janda, R.J. et al. 1975. Watershed conditions in the drainage basin of Redwood Creek, HumboldtCounty, California, as of 1973. USGS Open-File Report 75-568, 267 pp.
Judson, S., and D.F. Ritter. 1964. Rates of regional denudation in the United States. Journal ofGeophysical Research 69(16):3395-3401.
Kelsey, H.M. 1980. A sediment budget and an analysis of geomorphic process in the Van DuzenRiver Basin, northern coastal California, 1941-1975. Geol. Soc. Amer. Bull. Part 2. Vol.91. Pp. 1119-1216.
_________. 1982. Hillslope evolution and sediment movement in a forested headwater basin,Van Duzen River, north coastal California. In: F.J. Swanson, R.J. Janda, T. Dunne, andD.N. Swanson, eds., Sediment Budgets and Routing in Forested Drainage Basins. UnitedStates Department of Agriculture, Forest Service General Technical Report, PNW-141,165 p.
Kondolf, G.M. and W.V.G. Matthews. 1991. Unmeasured residuals in sediment budgets: acautionary note. Water Resources Research 27(9):2483-2486.
Kondolf, G.M. and W.V.G. Matthews. 1993. Management of coarse sediment on regulatedrivers. Davis CA: University of California Water Resources Center Report no. 80.
Kondolf, G.M., M.W. Smeltzer, and S.L. Railsback. (in press) Design and performance of areconstructed channel project in a California gravel-bedded stream. Accepted forpublication in Environmental Management.
Knott, J.M. 1971. Sedimentation in the Middle Fork Eel River basin, California. USGS WaterResource Division Open-File Report, 60 pp.
Stetson Engineers Inc. 40 Corte Madera Creek WatershedGeomorphic Assessment
Larson, K.R. and R.C. Sidle. 1980. Erosion and Sedimentation Data Catalog of the PacificNorthwest, September 1980.
Lehre, A.K. 1982. Sediment mobilization and production from a small mountain catchment: Lone Tree Creek, Marin County, California. Ph.D. dissertation, University of California,Berkeley.
_________. 1982. Sediment Budget of a small Coast Range drainage basin in North CentralCalifornia. In: F.J. Swanson, R.J. Janda, T. Dunne, and D.N. Swanson, eds., SedimentBudgets and Routing in Forested Drainage Basins. USDA, Forest Service GeneralTechnical Report PNW-141, pp. 67-77
Leopold, L.B. (undated.) unpublished manuscript containing hydraulic geometry data for gagingstations in San Francisco Bay Area. Available in the Water Resources Center Archives,412 O’Brien Hall, University of California, Berkeley.
Limerinos, J. T. 1970. Determination of the Manning Coefficient from Measured Bed Roughnessin Natural Channels, U. S. Geological Survey Water Supply Paper 1898-B.
Manson, M. 1899. Observations on the denudation of vegetation - A suggested remedy forCalifornia. Sierra Club Bulletin 2:295-311.
Milhous, R.T. 1973. Sediment transport in a gravel-bottomed stream. Ph.D. dissertation, OregonState University, Corvallis, Oregon.
Montgomery, D.R. 1999. Erosional processes at an abrupt channel head: implications forchannel entrenchment and discontinuous gully formation. In: S.E. Darby and A. Simon,eds., Incised River Channels: Processes, Forms, Engineering and Management.Chichester, UK: John Wiley & Sons.
Parker, G. 1990. Surface-based bedload transport relation for gravel rivers. Journal of HydraulicResearch 28(4):417-436.
Parker, G. and P.C. Klingeman. 1982. On Why Gravel Bed Streams Are Paved. Water ResourcesResearch 18(5):1409-1423.
Parker, G., P.C. Klingeman, and D.G. McLean. 1982. Bedload and size distribution in pavedgravel-bed streams. Journal of the American Society of Civil Engineers 108 (HY4):544-571.
Prosser, I.P. and W.E. Dietrich. 1995. Field experiments on erosion by overland flow and theirimplication for a digital terrain model of channel initiation. Water Resources Research31:2867-2876.
Stetson Engineers Inc. 41 Corte Madera Creek WatershedGeomorphic Assessment
Reid, L.M. and T. Dunne. 1996. Rapid evaluation of sediment budgets. Catena Verlag, 164 pp.
Rice, R.M. 1982. Sedimentation in the Chaparral. In: F.J. Swanson, R.J. Janda, T. Dunne, andD.N. Swanson, eds., Sediment Budgets and Routing in Forested Drainage Basins.USDA, Forest Service General Technical Report PNW-141, pp. 39-49.
Rice, S.J., T.C. Smith, and R.G. Strand. 1976. Geology for planning: central and southeasternMarin County, California. California Division of Mines and Geology Open File Report76-2.
Rich, A.A. 2000. Fishery Resources Conditions of the Corte Madera Creek Watershed, MarinCounty, California. Prepared for Friends of Corte Madera Creek Watershed by A.A.Rich and Associates, San Anselmo, California, November 10, 2000.
Riley, A.L. 1998. Restoring Streams in Cities. Covelo CA: Island Press.
Royston, Hanamato, Beck and Beck, Inc. 1977. Corte Madera Creek: A Flood Control Study,Marin County, California. Prepared for the Department of the Army, San FranciscoDistrict, Corps of Engineers.
Schumm, S.A. 1999. Causes and Controls of Channel Incision. In: S.E. Darby and A. Simon,eds., Incised River Channels: Processes, Forms, Engineering and Management.Chichester, UK: John Wiley & Sons.
Schumm, S.A., M.D. Harvey, and C.C. Watson. 1984. Incised Channels: Morphology, Dynamicsand Control. Littleton CO: Water Resources Publications.
Shepherd, A. 1987. Corte Madera Creek particle size distribution analysis. Unpublished report,including HEC-2 data appendix.
Simon, A. and C.R. Hupp. 1986. Channel evolution in modified Tennessee channels. In:Proceeding of the Fourth Federal Interagency Sedimentation Conference, Volume 2.Washington, D.C.: US Government Printing Office, 5-71 to 5-82.
Smeltzer, M.W. and G.M. Kondolf. in preparation. Historical Geomorphic Analysis of theOwens River Gorge. For submission to Catena.
United States Army Corps of Engineers (COE). 1961. Survey Report for Flood Control andAllied Purposes, Corte Madera Creek, Marin County, California. Department of theArmy, San Francisco District.
_________. 1987. Final Supplemental Environmental Impact Statement, Corte Madera CreekFlood Control Project Unit No. 4, Marin County, California. Department of the Army,
Stetson Engineers Inc. 42 Corte Madera Creek WatershedGeomorphic Assessment
Sacramento District.
_________. 1989. Sedimentation Study, Corte Madera Creek Flood Control Project, MarinCounty, California. Prepared for Sacramento District COE, by R.R. Copeland and W.A.Thomas, COE Hydraulics Laboratory, Vicksburg, Mississippi, January 1989.
_________. 2000. Corte Madera Flood Control Project Alternative Screening ConferenceDocument, Draft 2. Prepared by San Francisco District COE, January 2000.
COE, USEPA, BCDC, SFBRWQCB, SWRCB. 1978. Long-term management strategy for BayArea Dredged Material. Final Environmental Impact Statement, Environmental ImpactReport.
United States Department of Housing and Urban Development. 1977. Flood Insurance Study,City of San Anselmo, California, Marin County. 14 pp.
_________. 1977. Flood Insurance Study, Town of Fairfax, California, Marin County. 13 pp.
Porterfield, G. 1980. Sediment Transport of Streams Tributary to San Francisco, San Pablo, andSuisun Bays, California, 1906-66. US Geologic Survey, Water Resources Investigations80-64.
United States Geologic Survey. 1978. Surface water supply data, Volume 2.
United States Geologic Survey. 1979. Surface water supply data, Volume 2.
United States Geologic Survey. 1980. Surface water supply data, Volume 2.
Wahrhaftig, C. and J.R. Wagner. 1972. The geologic setting of Tomales Bay. In: R. Corwin, ed.,Tomales Bay Environmental Study. Washington, D.C., the Conservation Foundation.
Westworth, C.M. and V.A. Frizzell. 1975. Reconnaissance landslide map of parts of Marin andSonoma counties, California. Menlo Park: USGS Open-file report 75-281.
Wiberg, P.L. and J.D. Smith. 1987. Calculations of the Critical Shear Stress for Motion ofUniform and Heterogeneous Sediments. Water Resources Research 23(8):1471-1480.1
Wolman, G.M. 1954. A method of sampling coarse river-bed material. Transactions, AmericanGeophysical Union 35:951-956.
Zumwalt, C.W. 1972. Consideration of vegetation and soils on the Tomales Bay Watershed. In:R. Corwin, ed., Tomales Bay Environmental Study. Washington, D.C., the ConservationFoundation.
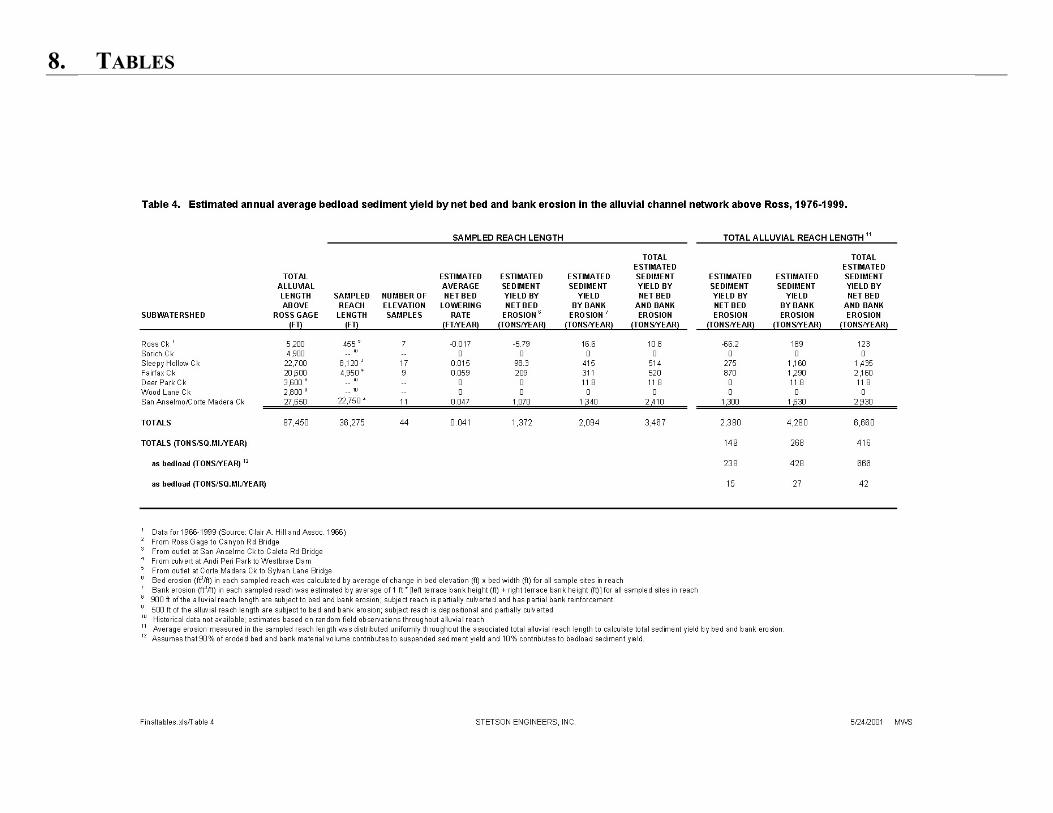
8. TABLES
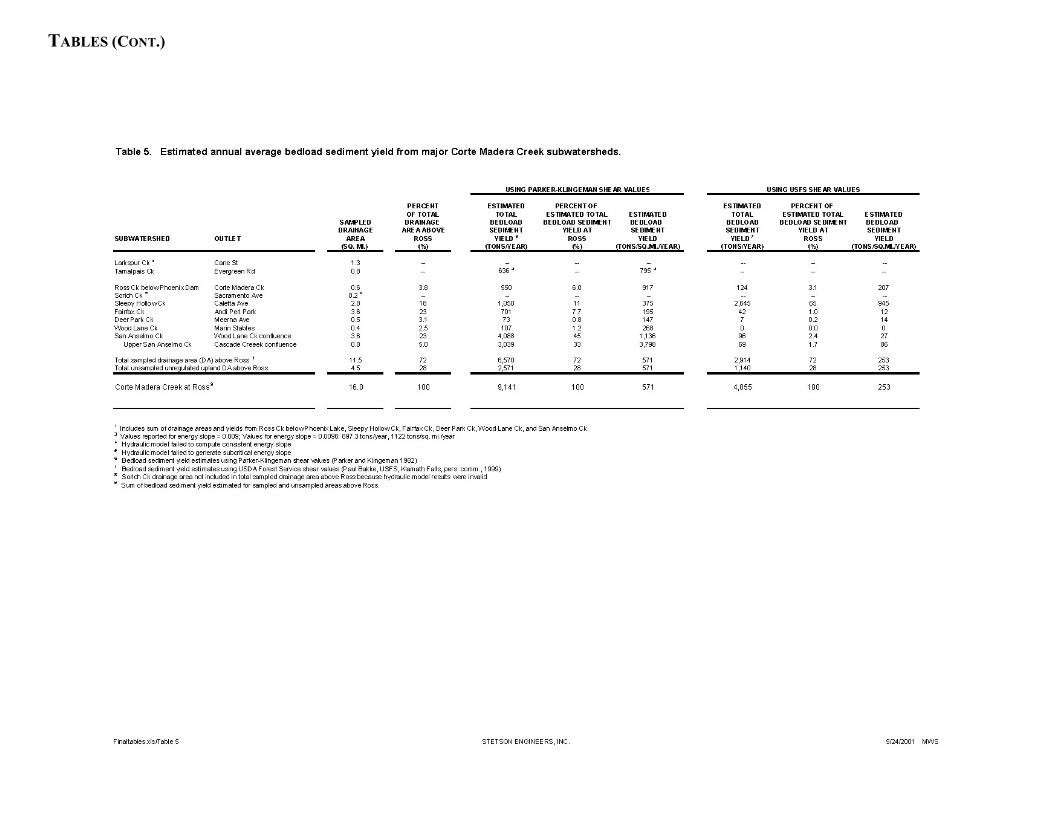
TABLES (CONT.)
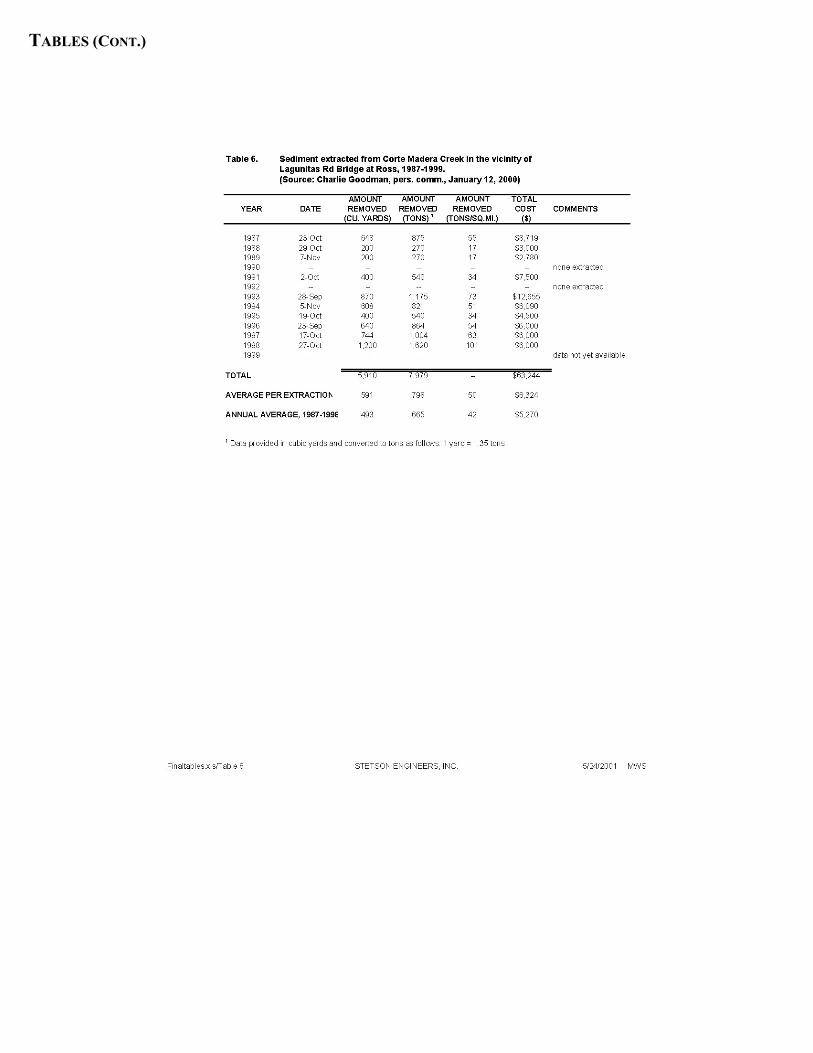
TABLES (CONT.)
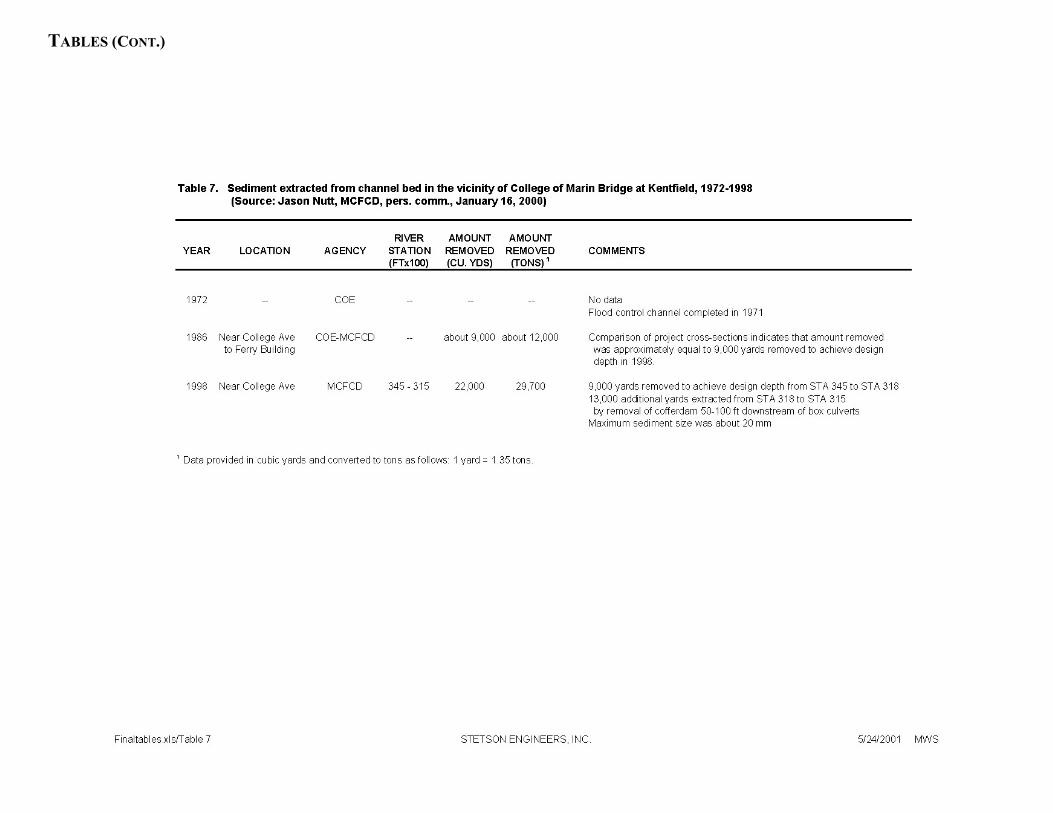
TABLES (CONT.)
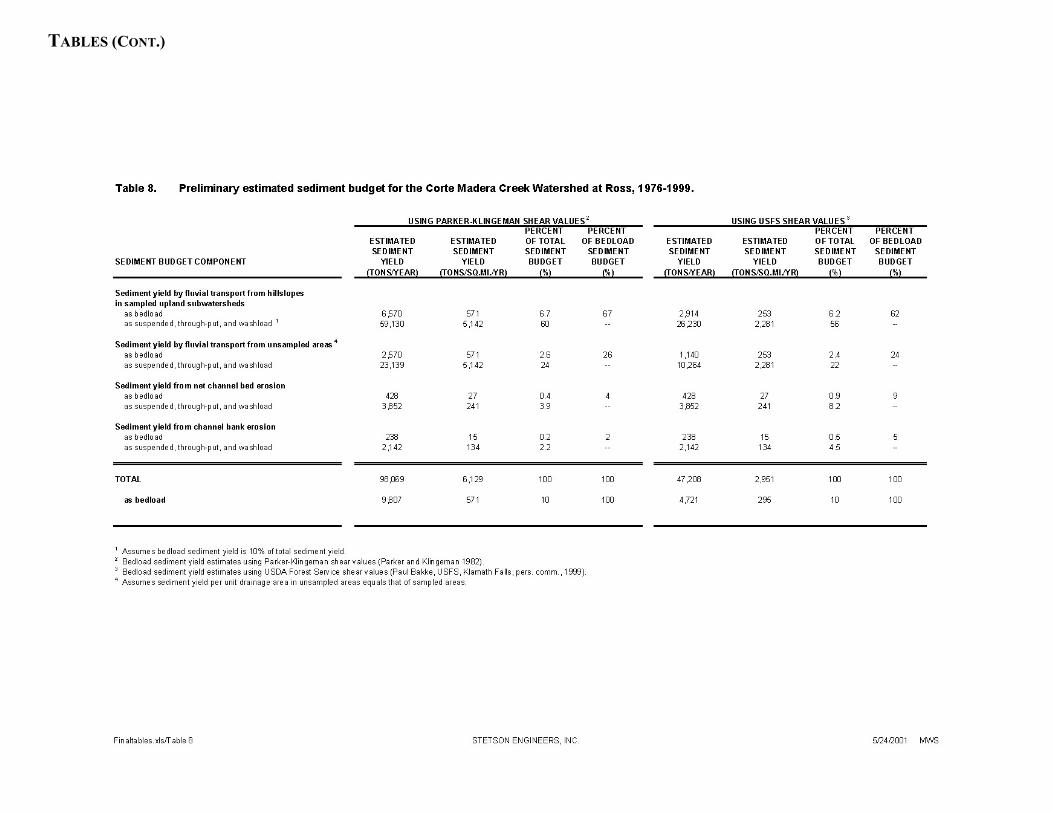
TABLES (CONT.)
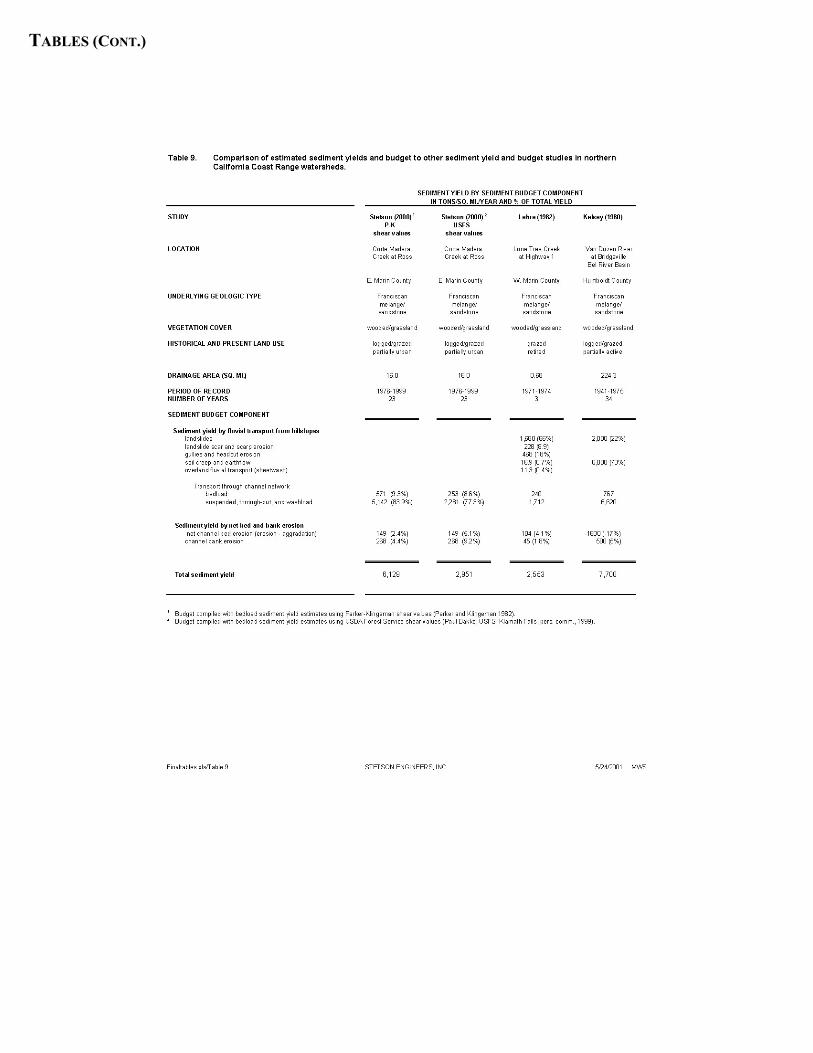
TABLES (CONT.)
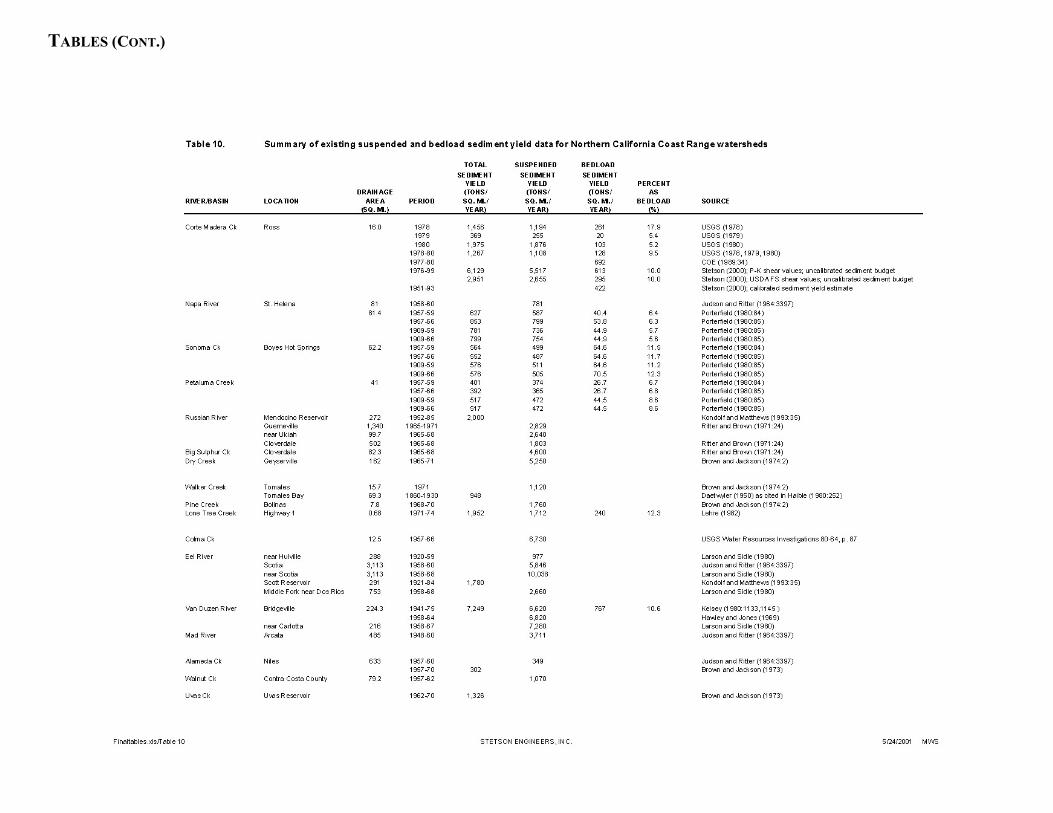
TABLES (CONT.)
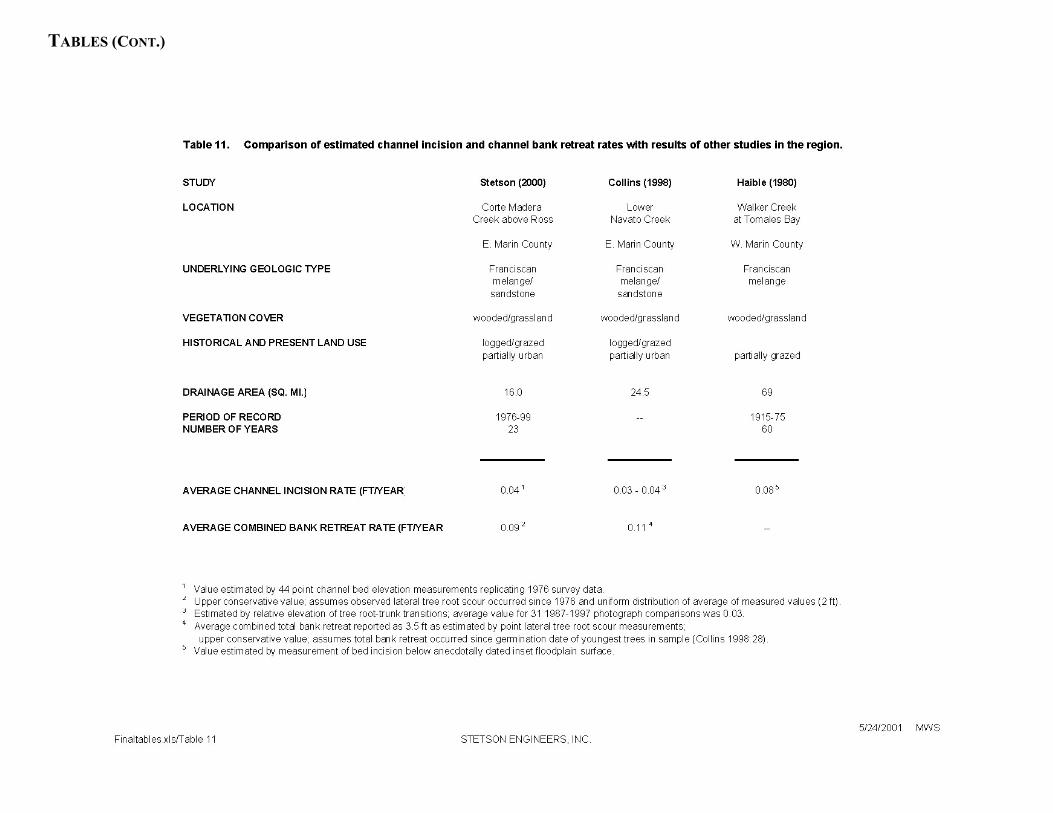
TABLES (CONT.)
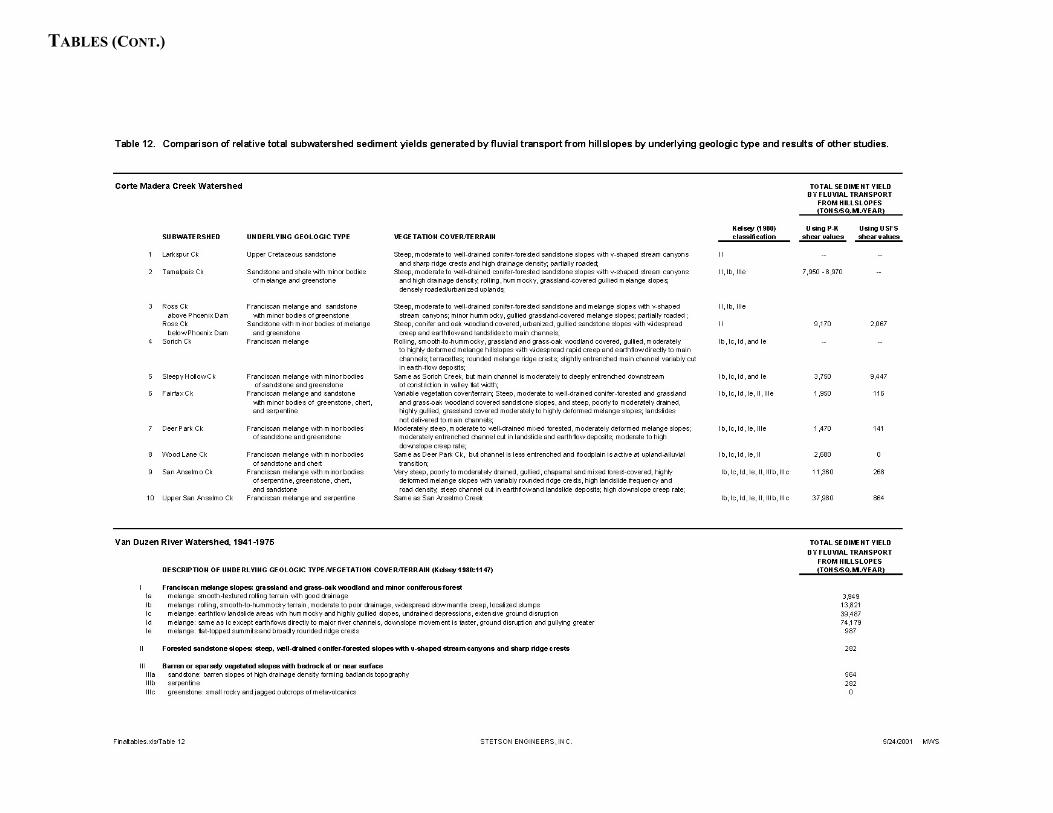
TABLES (CONT.)
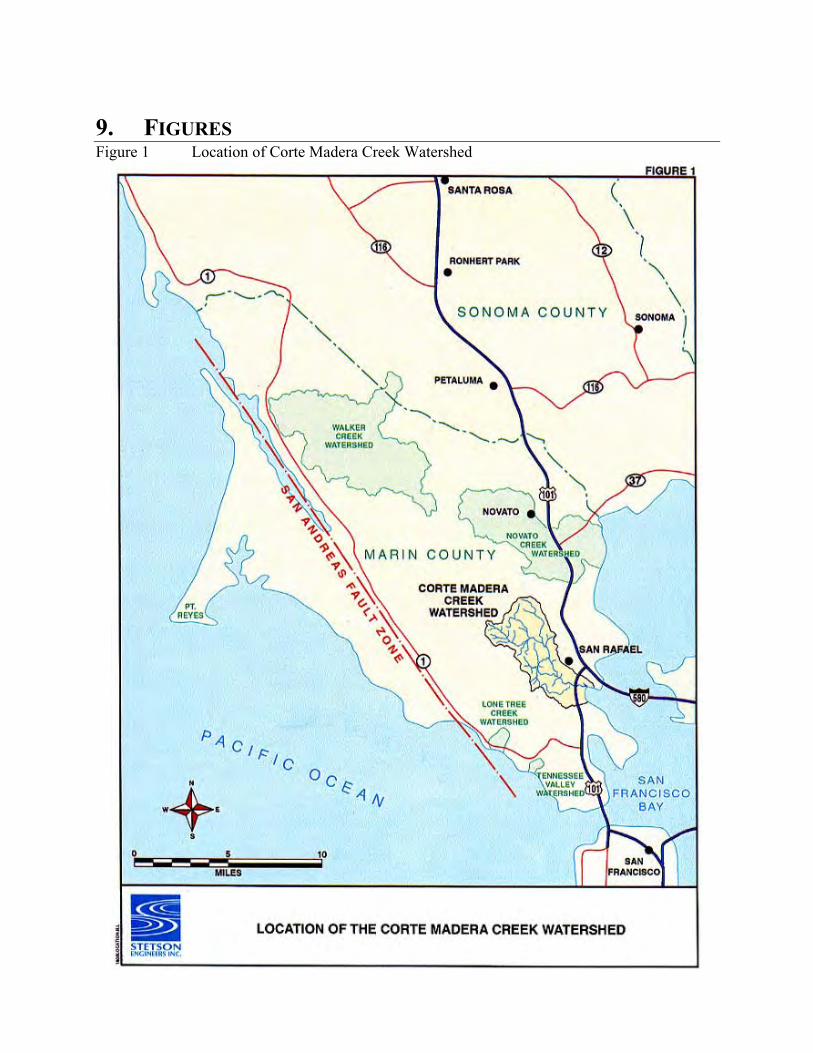
9. FIGURESFigure 1 Location of Corte Madera Creek Watershed
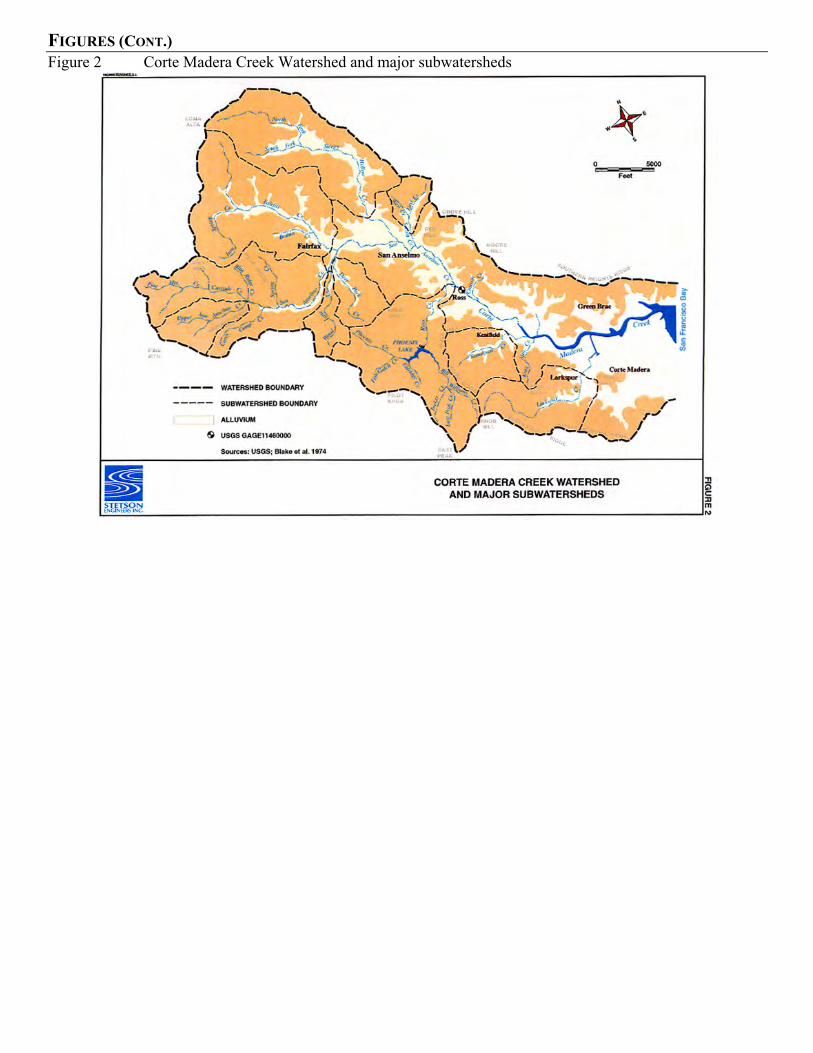
FIGURES (CONT.)Figure 2 Corte Madera Creek Watershed and major subwatersheds
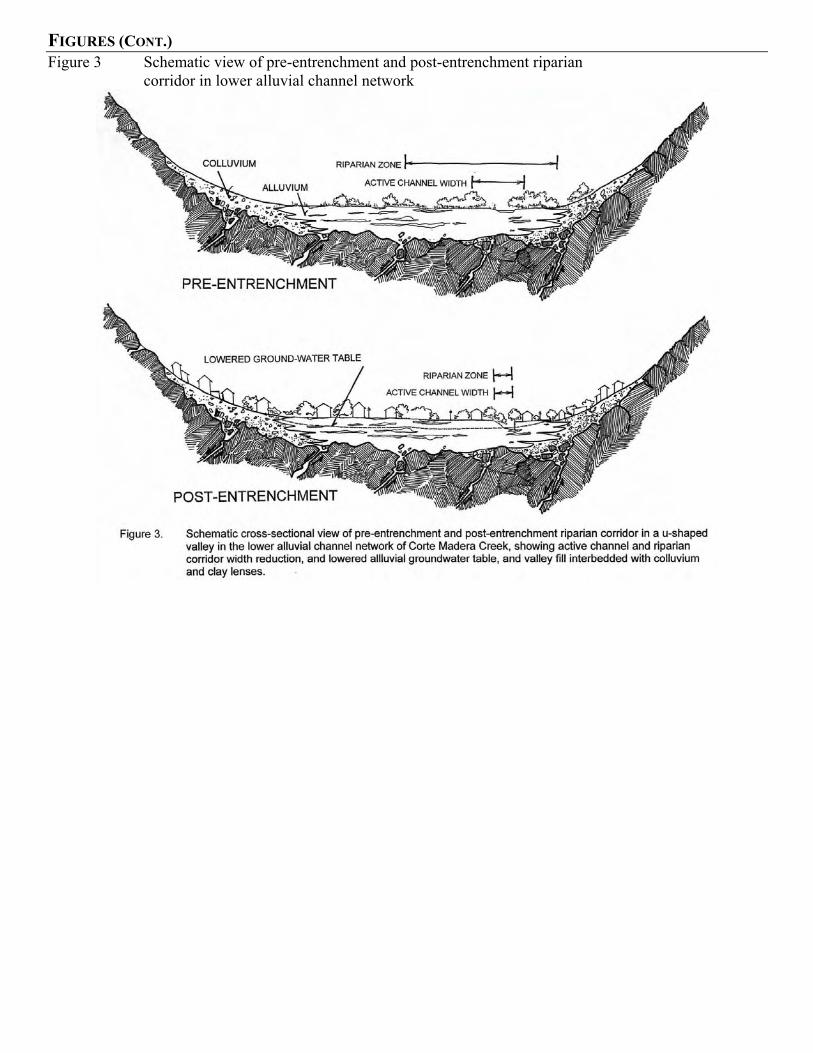
FIGURES (CONT.)Figure 3 Schematic view of pre-entrenchment and post-entrenchment riparian
corridor in lower alluvial channel network
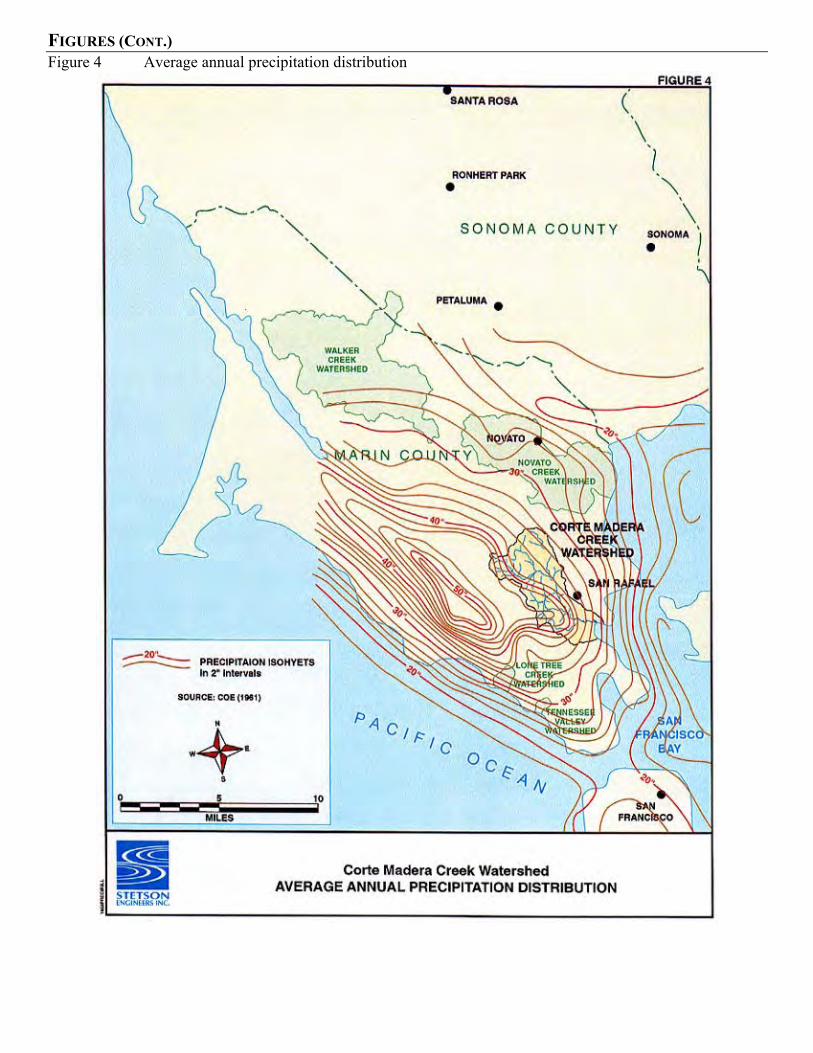
FIGURES (CONT.)Figure 4 Average annual precipitation distribution
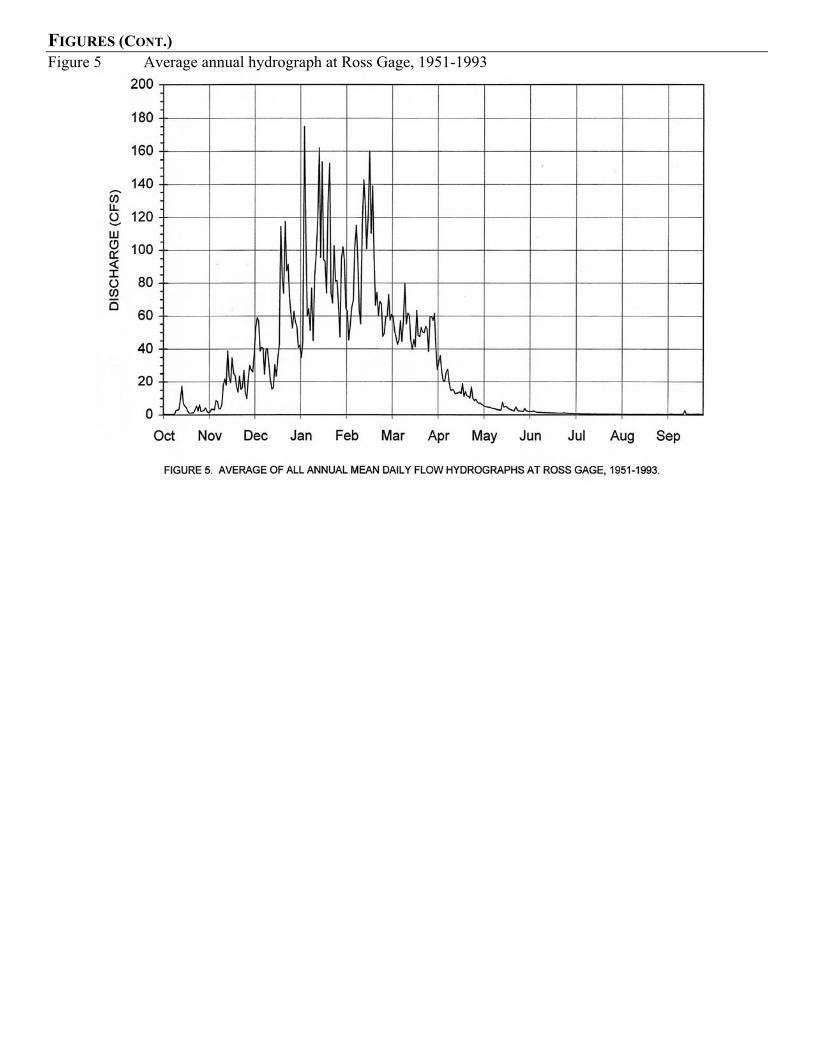
FIGURES (CONT.)Figure 5 Average annual hydrograph at Ross Gage, 1951-1993
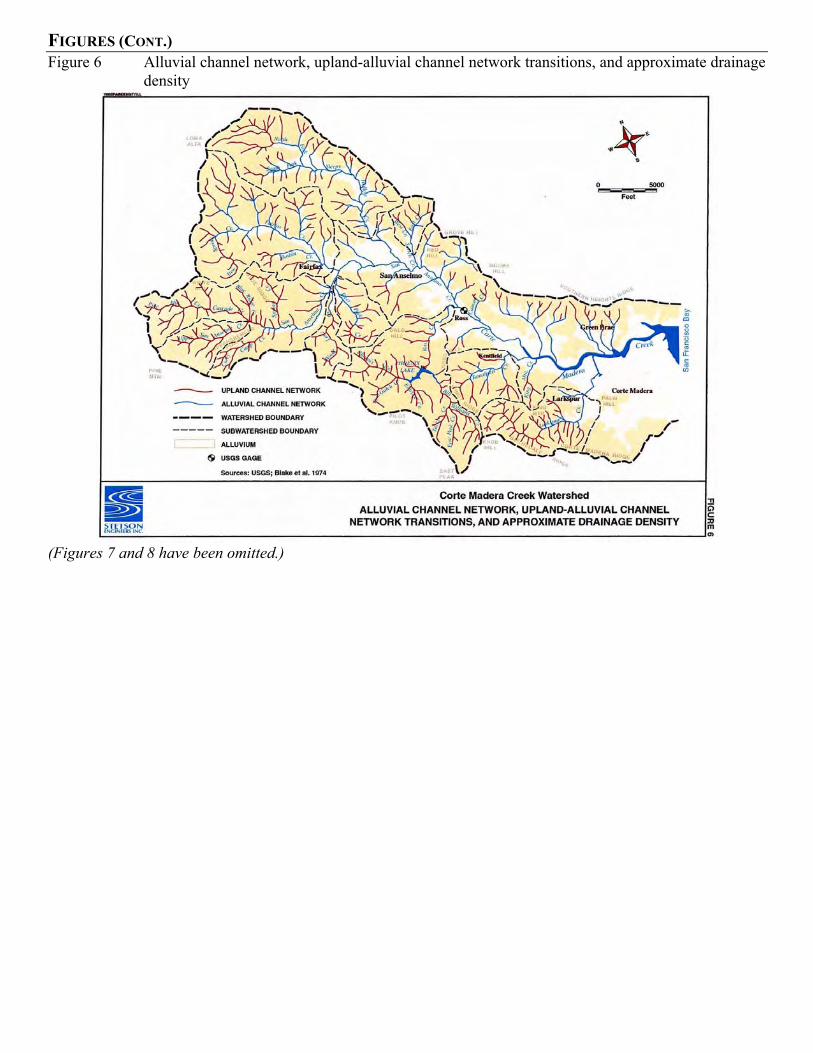
FIGURES (CONT.)Figure 6 Alluvial channel network, upland-alluvial channel network transitions, and approximate drainage
density
(Figures 7 and 8 have been omitted.)
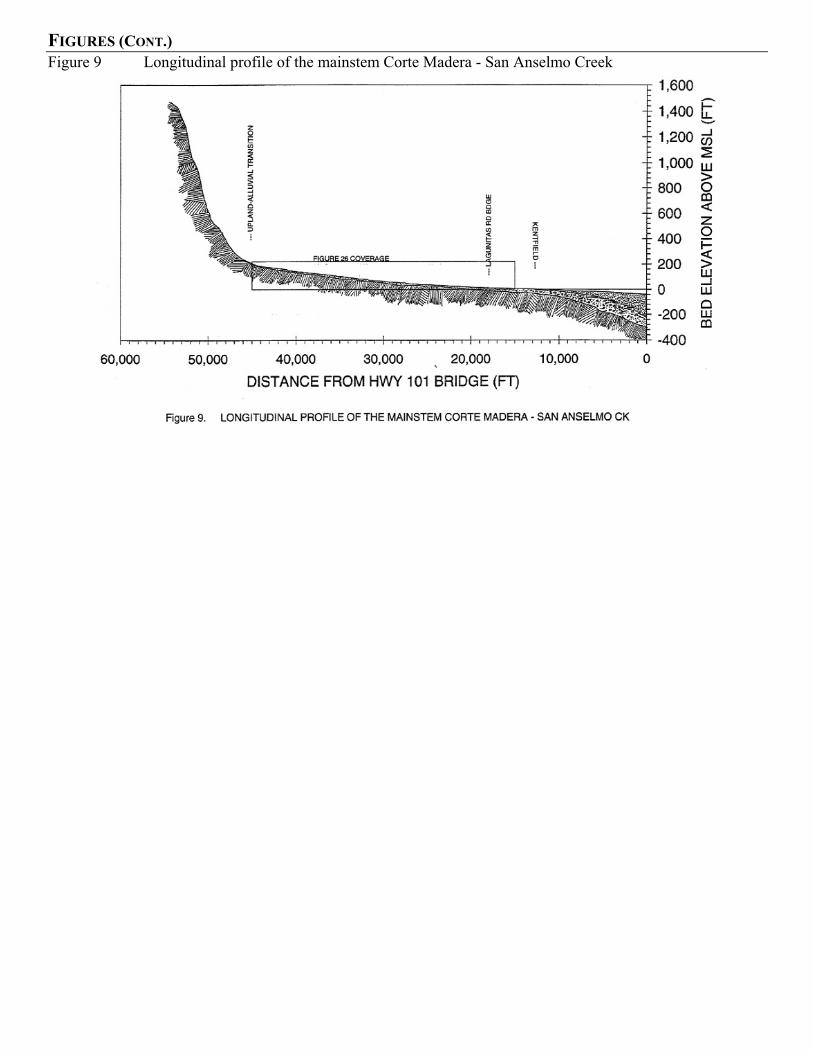
FIGURES (CONT.)Figure 9 Longitudinal profile of the mainstem Corte Madera - San Anselmo Creek
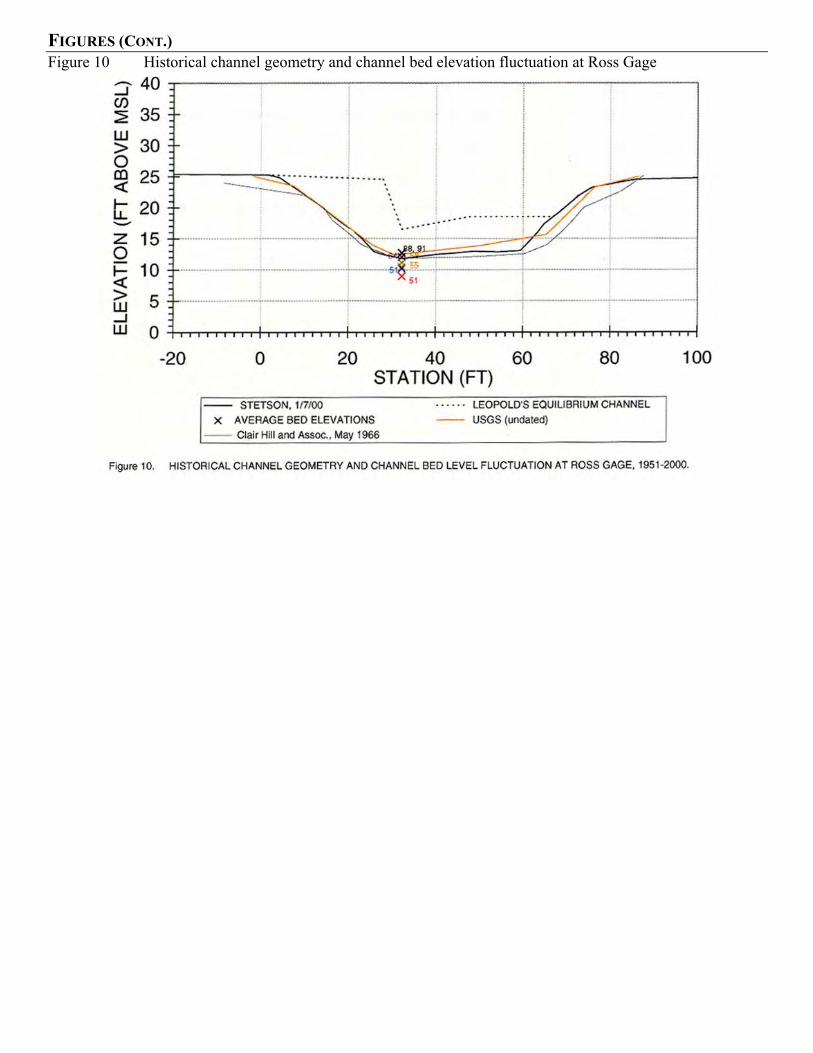
FIGURES (CONT.)Figure 10 Historical channel geometry and channel bed elevation fluctuation at Ross Gage
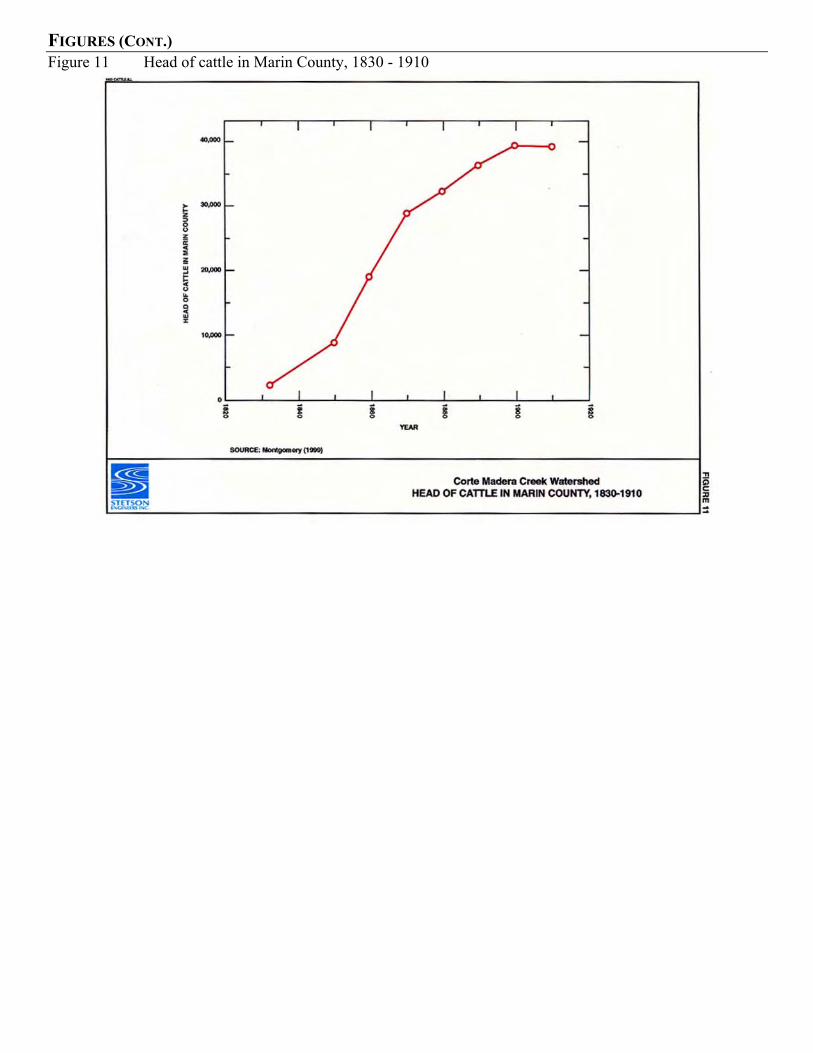
FIGURES (CONT.)Figure 11 Head of cattle in Marin County, 1830 - 1910
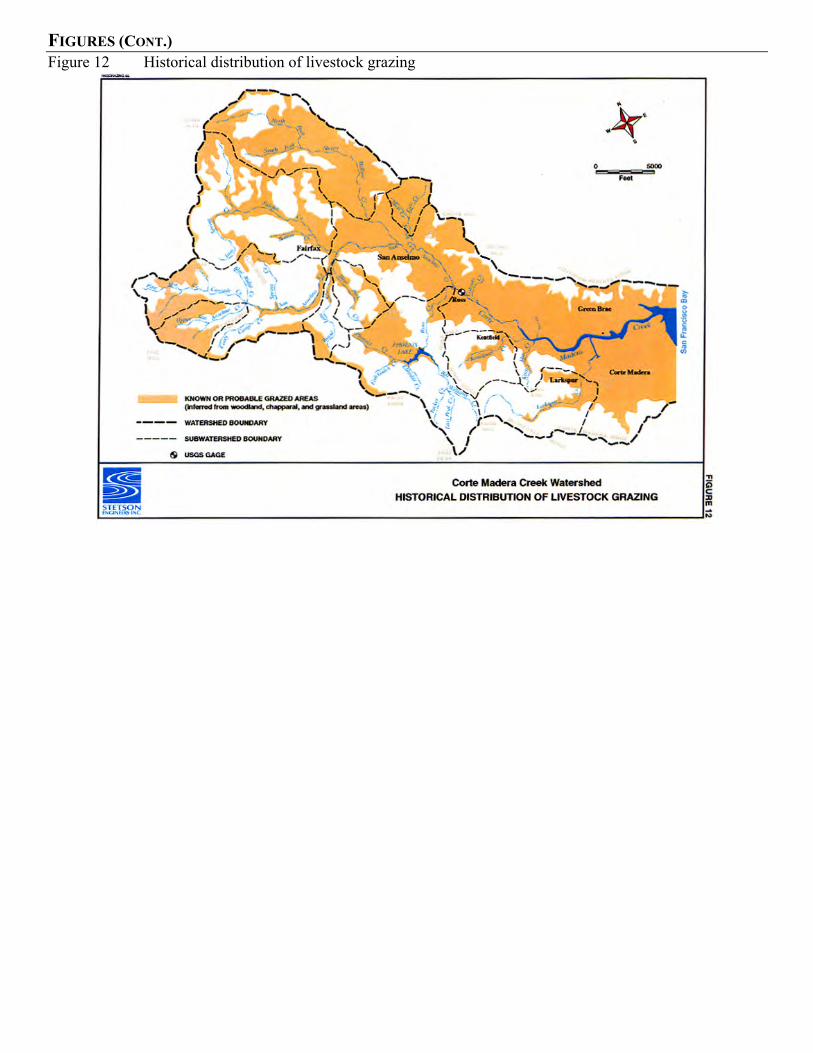
FIGURES (CONT.)Figure 12 Historical distribution of livestock grazing
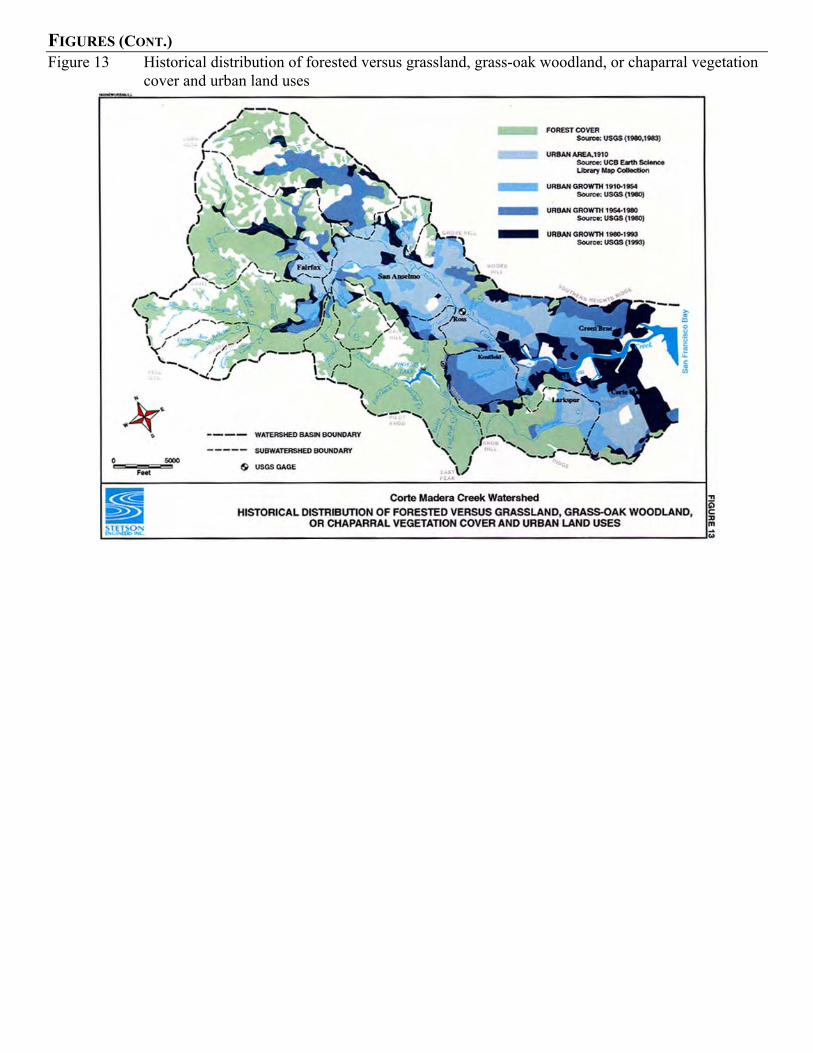
FIGURES (CONT.)Figure 13 Historical distribution of forested versus grassland, grass-oak woodland, or chaparral vegetation
cover and urban land uses
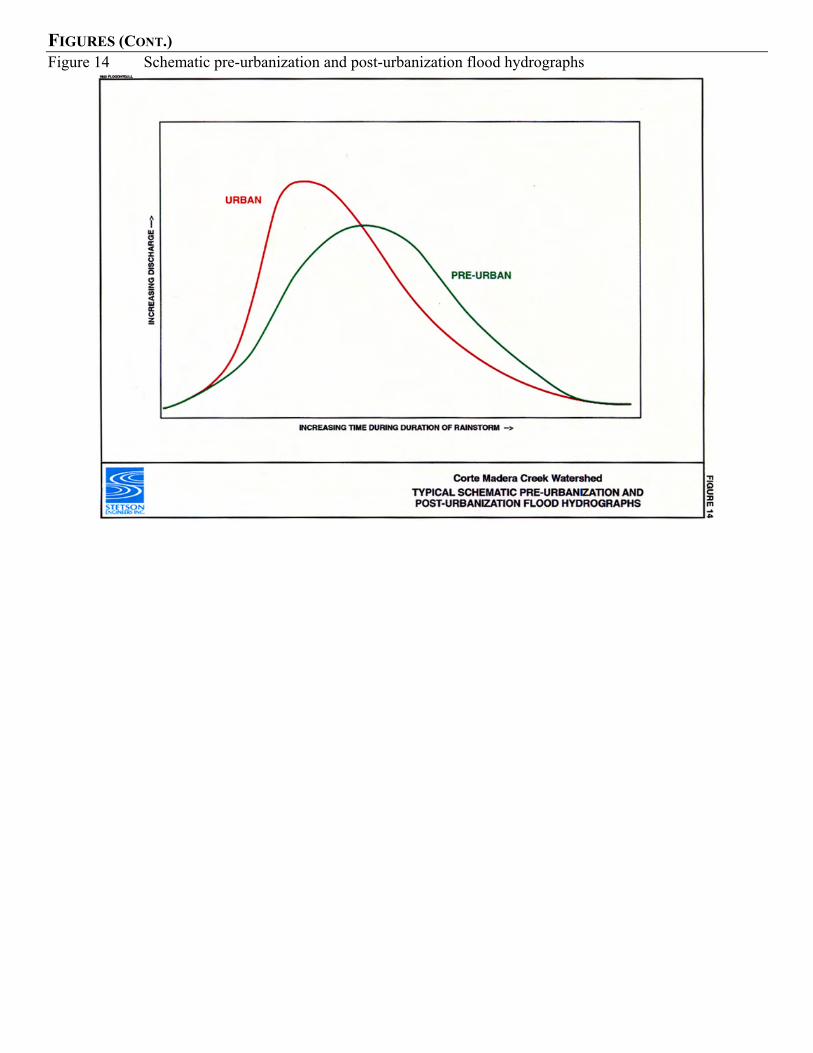
FIGURES (CONT.)Figure 14 Schematic pre-urbanization and post-urbanization flood hydrographs
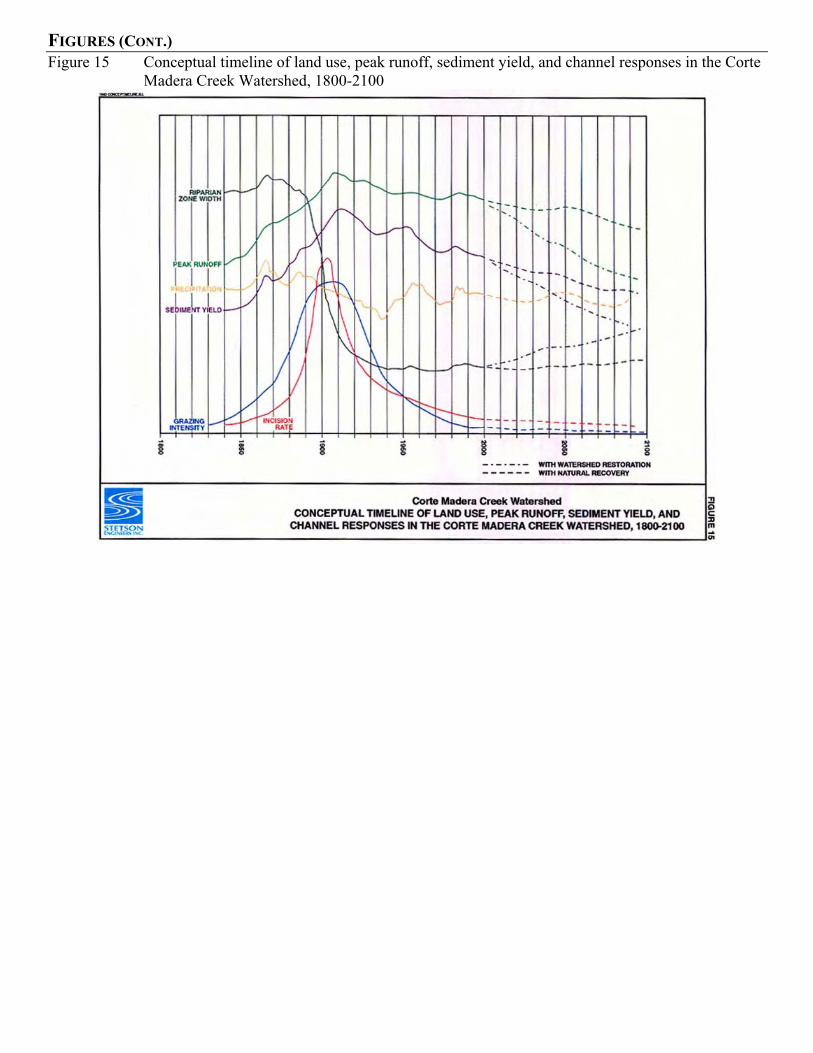
FIGURES (CONT.)Figure 15 Conceptual timeline of land use, peak runoff, sediment yield, and channel responses in the Corte
Madera Creek Watershed, 1800-2100
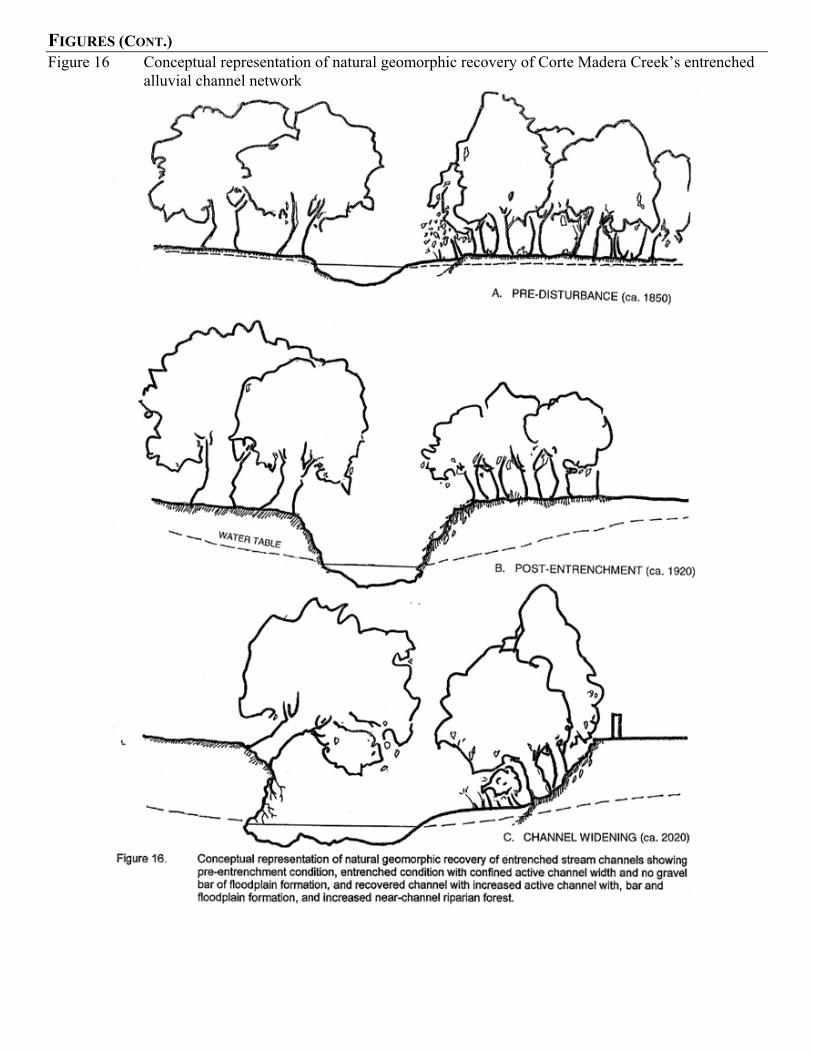
FIGURES (CONT.)Figure 16 Conceptual representation of natural geomorphic recovery of Corte Madera Creek’s entrenched
alluvial channel network
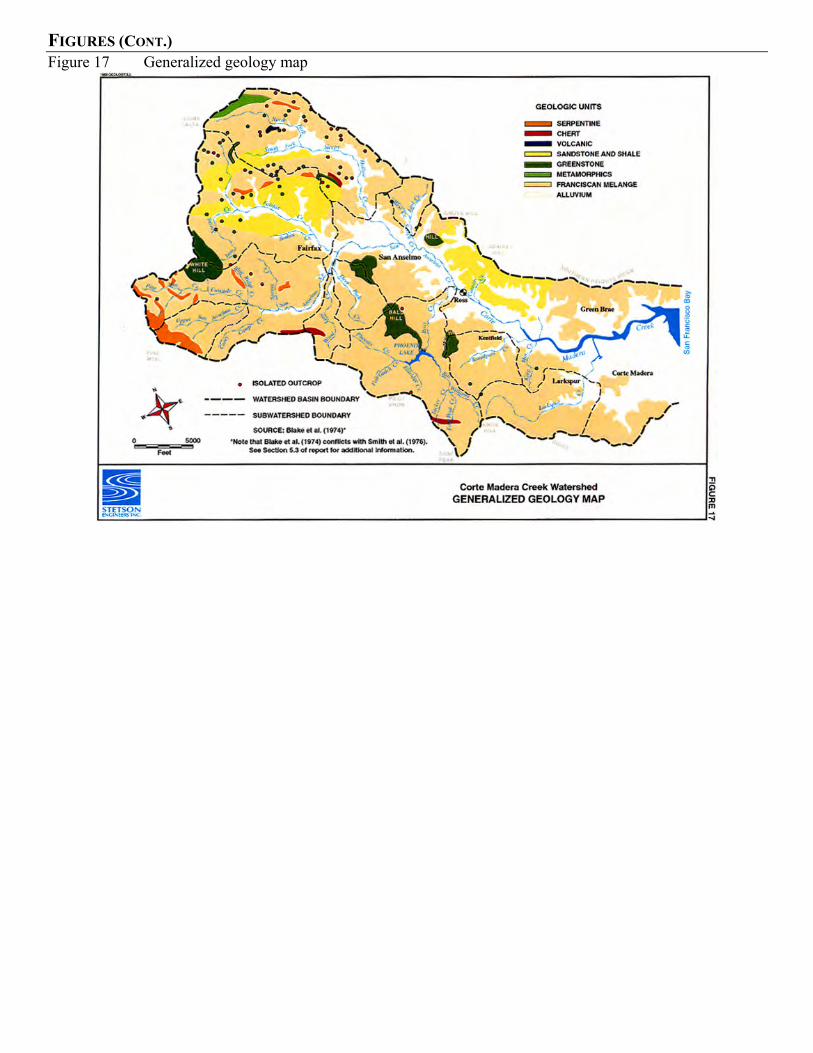
FIGURES (CONT.)Figure 17 Generalized geology map
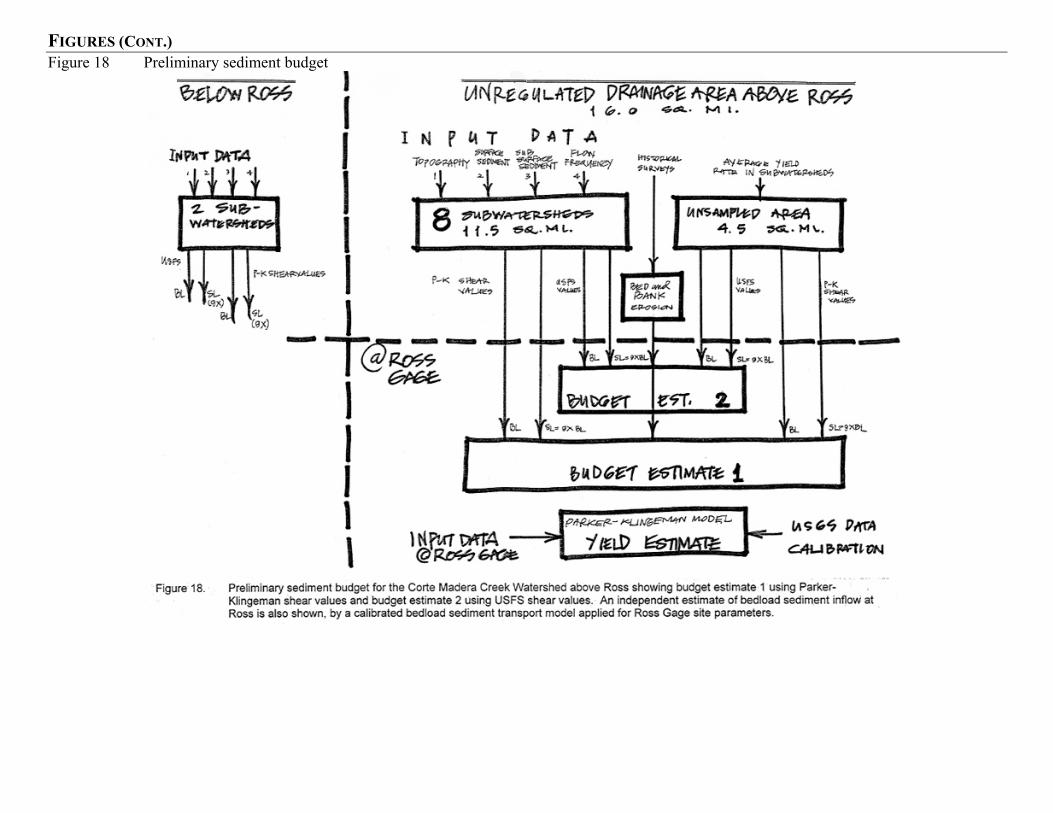
FIGURES (CONT.)Figure 18 Preliminary sediment budget
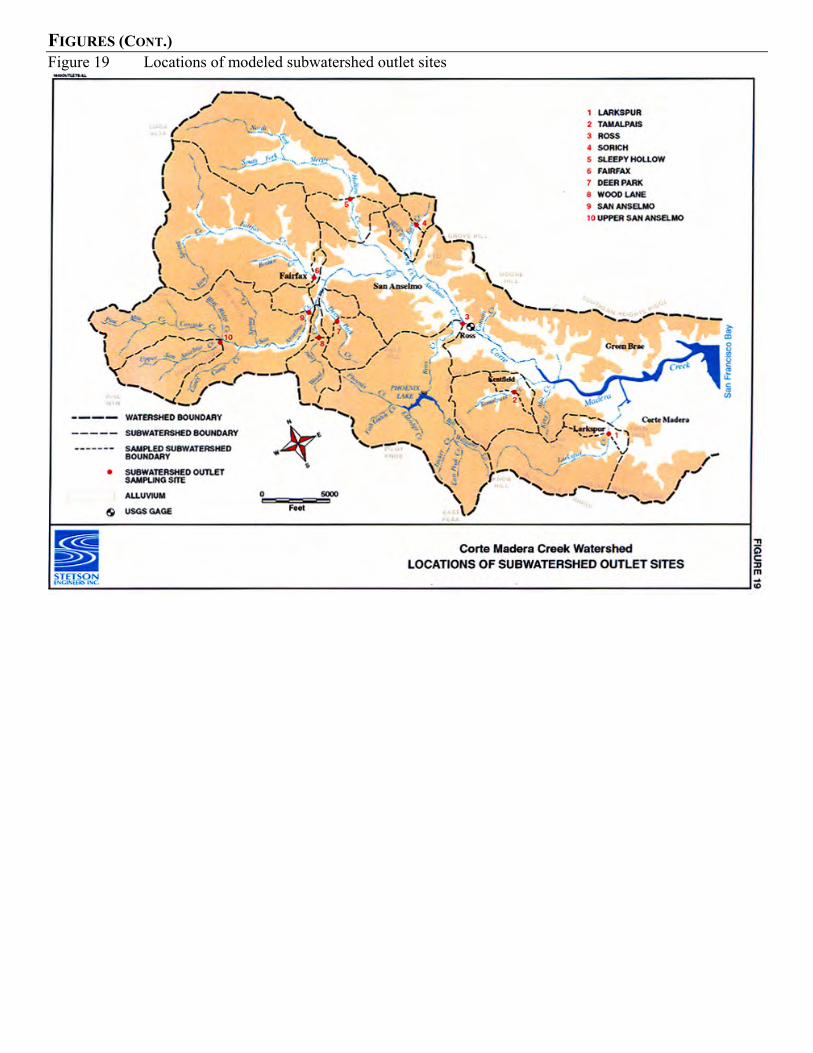
FIGURES (CONT.)Figure 19 Locations of modeled subwatershed outlet sites
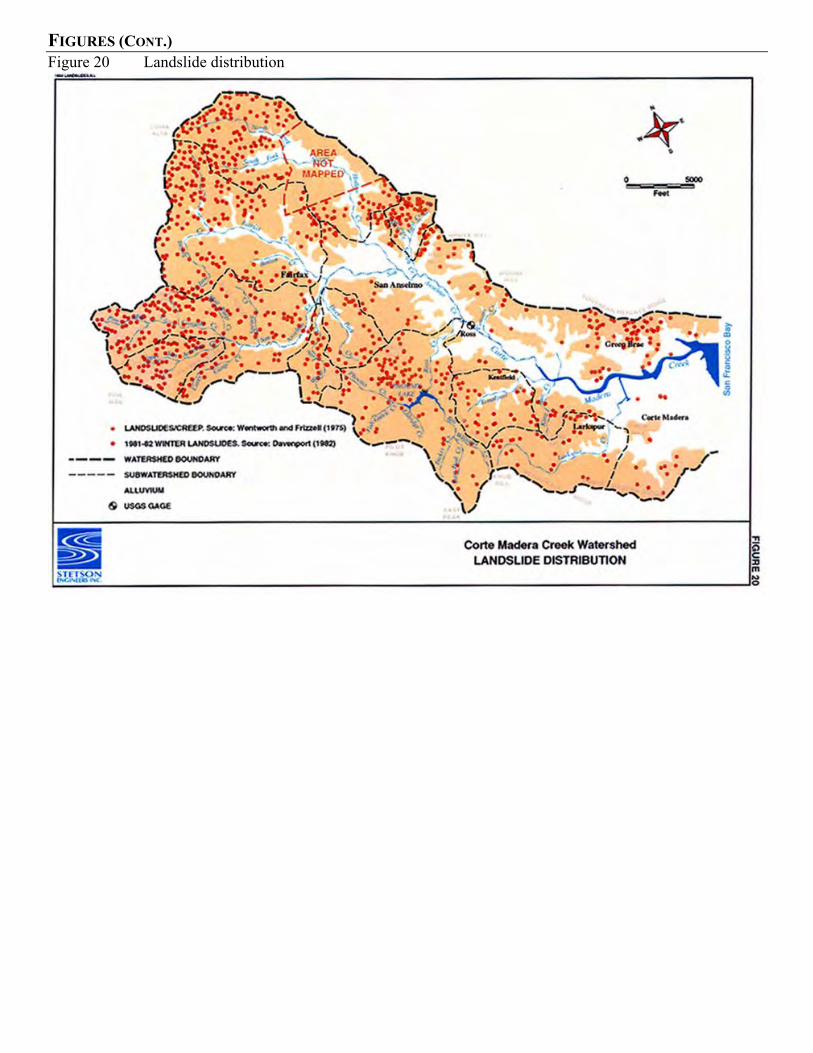
FIGURES (CONT.)Figure 20 Landslide distribution
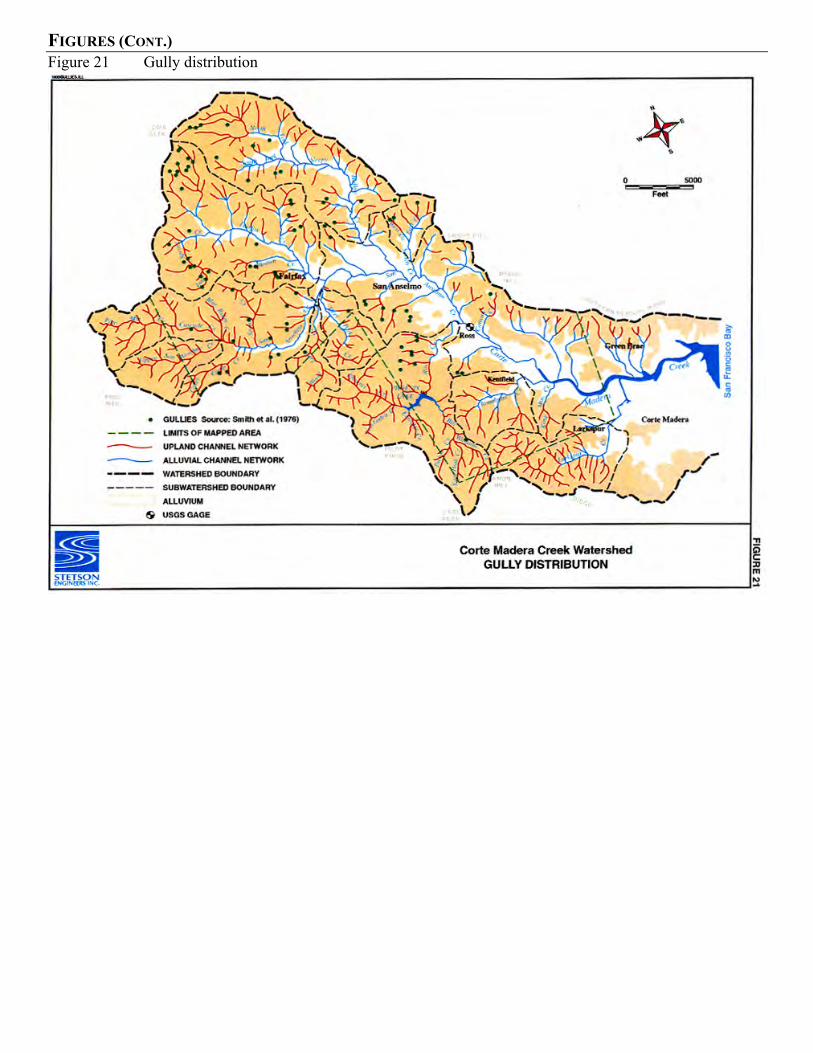
FIGURES (CONT.)Figure 21 Gully distribution
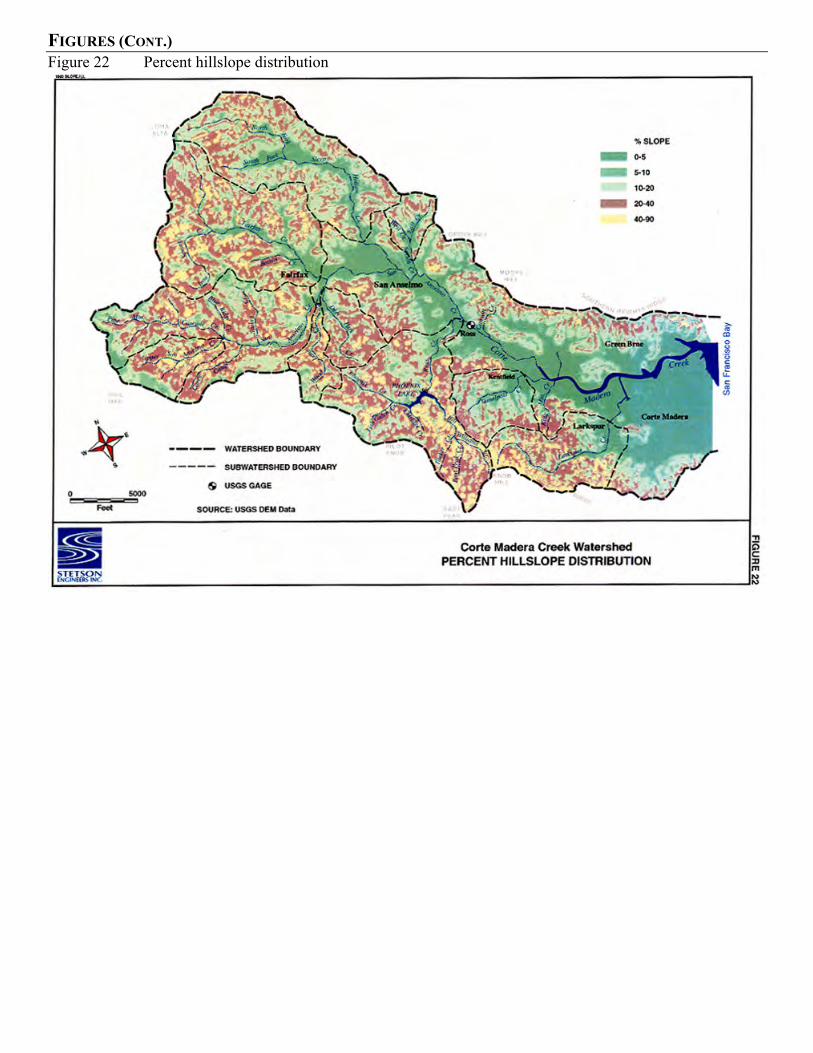
FIGURES (CONT.)Figure 22 Percent hillslope distribution
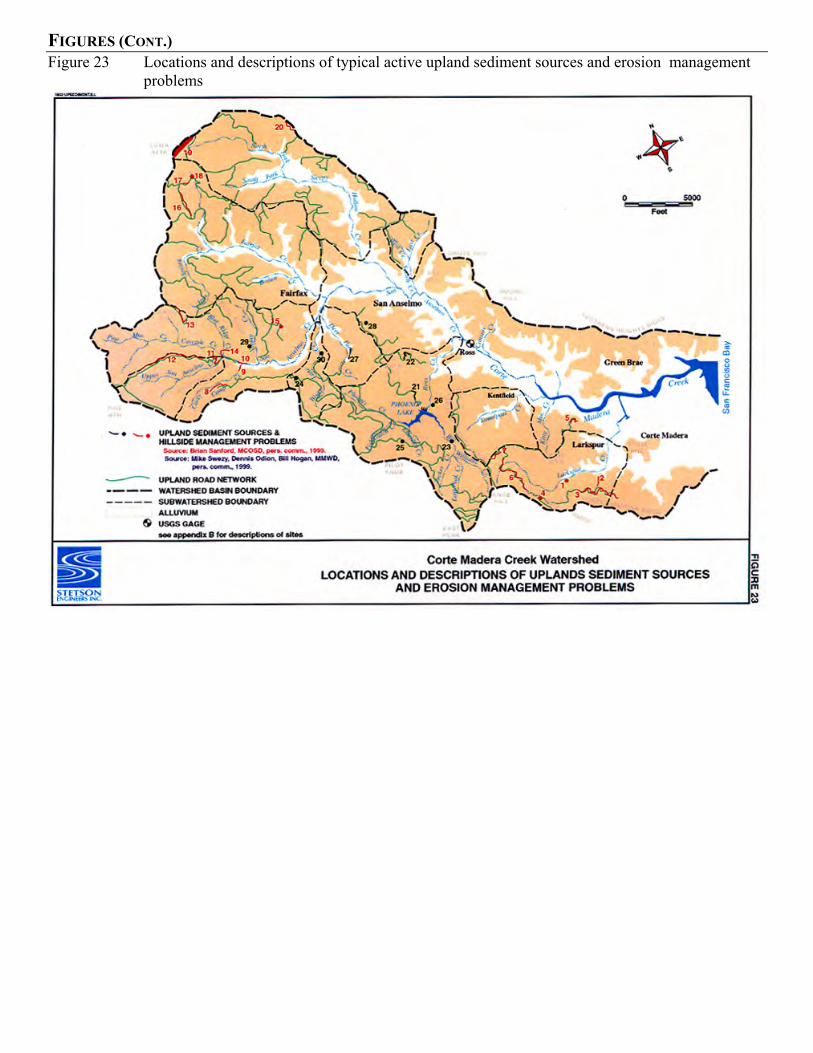
FIGURES (CONT.)Figure 23 Locations and descriptions of typical active upland sediment sources and erosion management
problems
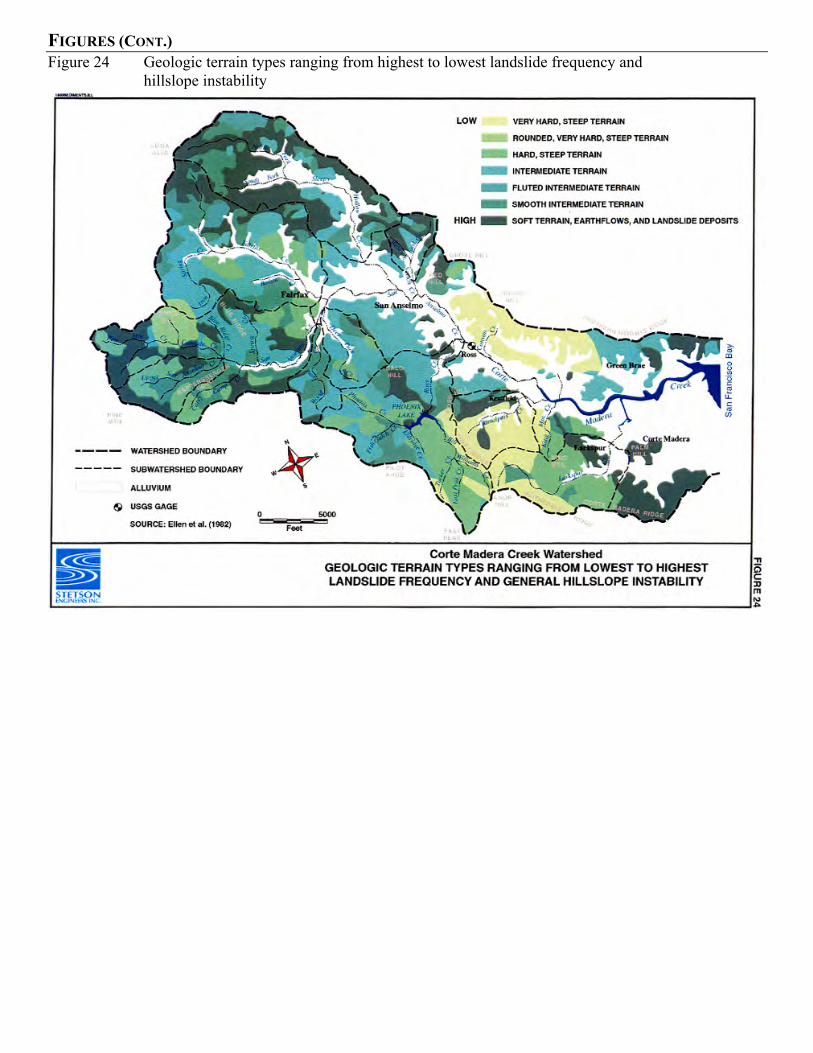
FIGURES (CONT.)Figure 24 Geologic terrain types ranging from highest to lowest landslide frequency and
hillslope instability
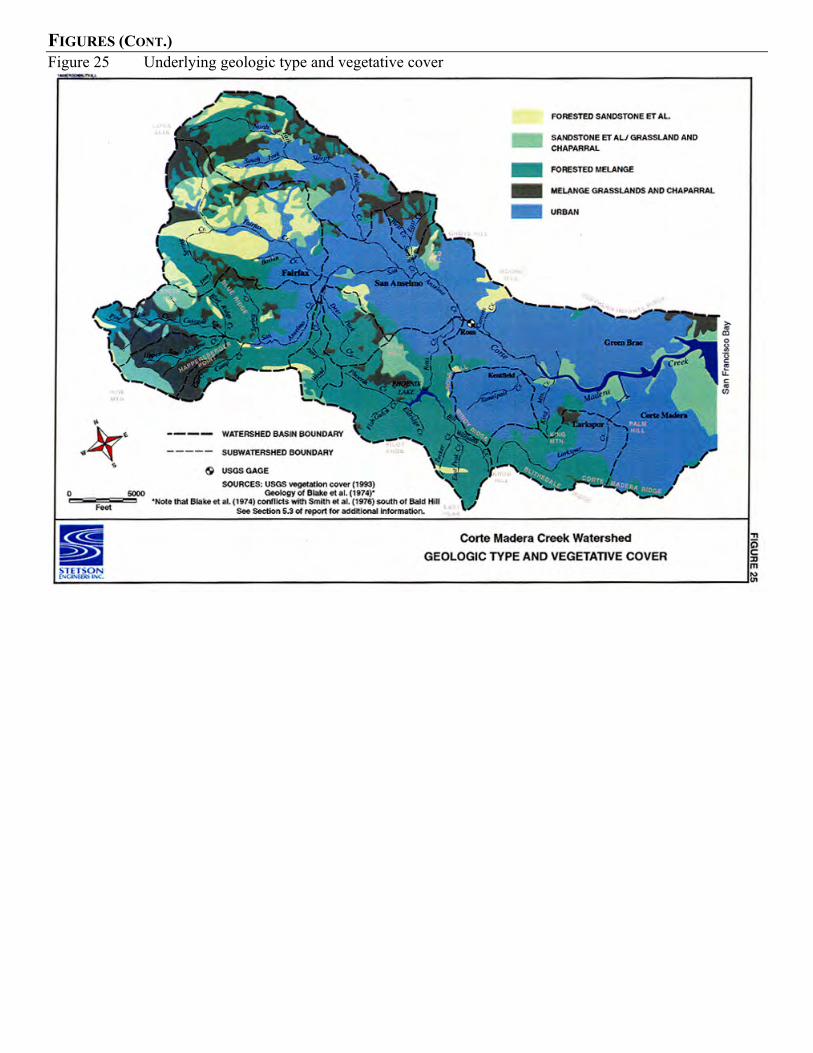
FIGURES (CONT.)Figure 25 Underlying geologic type and vegetative cover
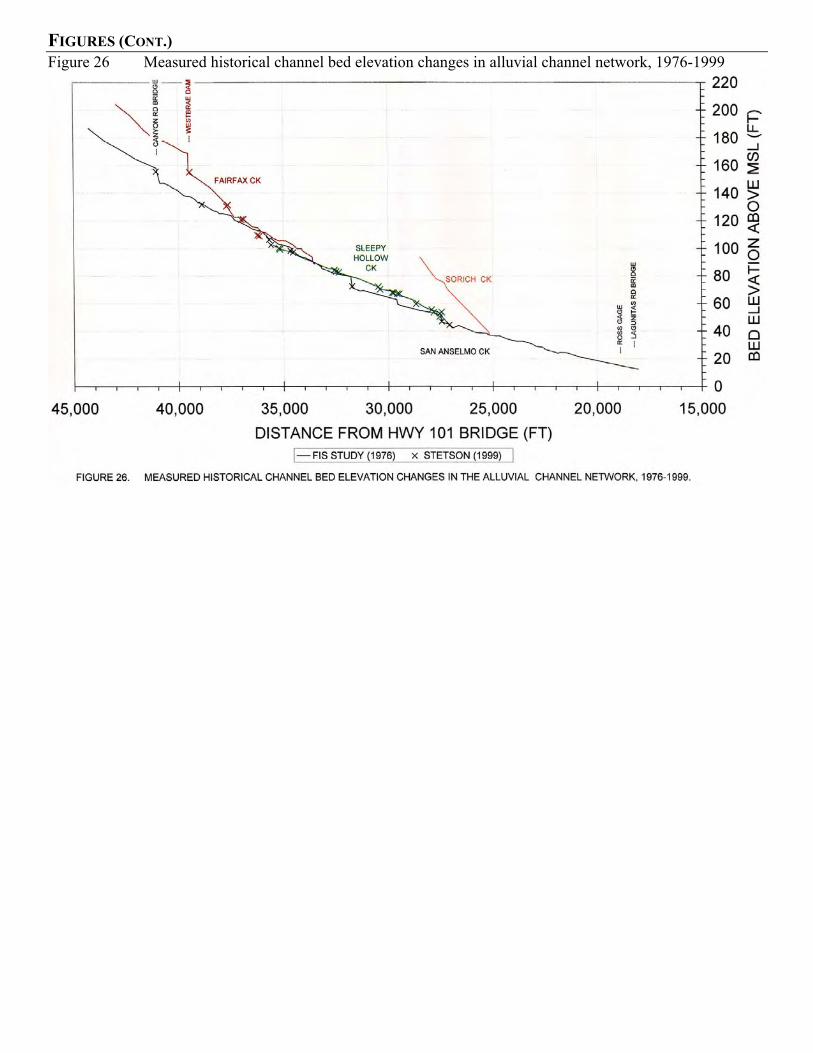
FIGURES (CONT.)Figure 26 Measured historical channel bed elevation changes in alluvial channel network, 1976-1999