Embed Size (px)
Citation preview
Getting started with ggplot2STAT 133
Gaston Sanchez
Department of Statistics, UC–Berkeley
gastonsanchez.com
github.com/gastonstat/stat133
Course web: gastonsanchez.com/stat133
ggplot2
2
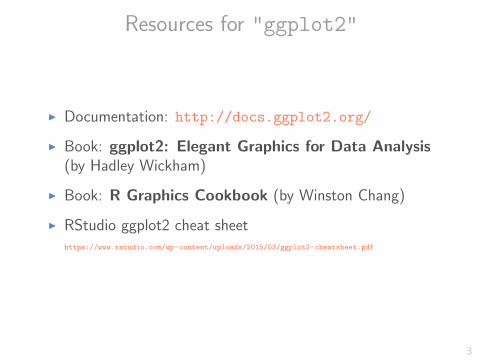
Resources for "ggplot2"
I Documentation: http://docs.ggplot2.org/
I Book: ggplot2: Elegant Graphics for Data Analysis(by Hadley Wickham)
I Book: R Graphics Cookbook (by Winston Chang)
I RStudio ggplot2 cheat sheethttps://www.rstudio.com/wp-content/uploads/2015/03/ggplot2-cheatsheet.pdf
3
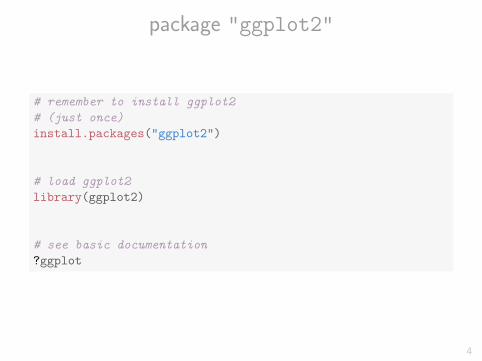
package "ggplot2"
# remember to install ggplot2
# (just once)
install.packages("ggplot2")
# load ggplot2
library(ggplot2)
# see basic documentation
?ggplot
4
ggplot2 book
5
R Graphics Cookbook
6
●●
●
●
●
●
●
●
●
●●
● ●●
●●
●
●
●
●
●
●●
●
●
●
●
●
●
●
●
●
100
200
300
10 15 20 25 30 35mpg
hp
cyl
●
●
●
4
6
8
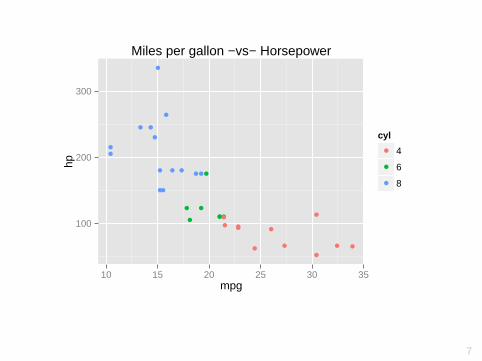
Miles per gallon −vs− Horsepower
7
●●●
●
●
●
●
●
●
●●
● ●●
●●
●
●●
●
●
●●
●
●
●
●
●
●
●
●
●
10 15 20 25 30
5015
025
0
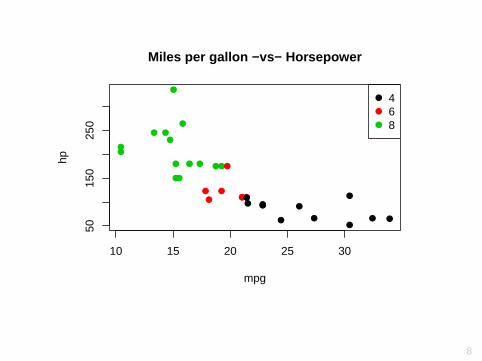
Miles per gallon −vs− Horsepower
mpg
hp
●
●
●
468
8
About "ggplot2"
I "ggplot2" (by Hadley Wickham) is an R package forproducing statistical graphics
I It provides a framework based on Leland Wilkinson’sGrammar of Graphics
I "ggplot2" provides beautiful plots while taking care offiddly details like legends, axes, colors, etc.
I "ggplot2" is built on the R graphics package "grid"
I Underlying philosophy is to describe a wide range ofgraphics with a compact syntax and independentcomponents
9
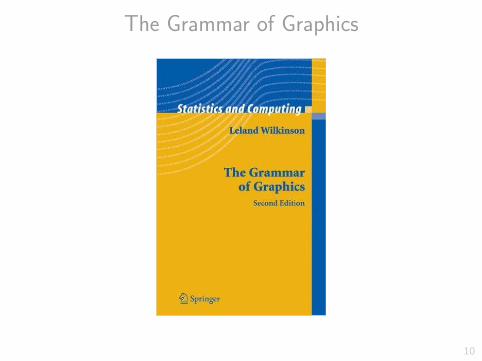
The Grammar of Graphics
10
About the Grammar of Graphics
I The Grammar of Graphics is Wilkinson’s attempt to definea theoretical framework for graphics
I Grammar: Formal system of rules for generating graphics– Some rules are mathematic– Some rules are aesthetic
11
About the Grammar of Graphics
3 Stages of Graphic Creation
I Specification: link data to graphic objects
I Assembly: put everything together
I Display: render of a graphic
12
About the Grammar of Graphics
SpecificationLink data to graphic objects
I Data
I Transformation of variables (e.g. aggregation)
I Scale transformations (e.g. log)
I Coordinate system (e.g. cartesian)
I Graphic Elements (e.g. points, lines)
I Guides (e.g. labels, legends)
13
R package "ggplot2"
About "ggplot2"
I Default appearance of plots carefully chosen
I Designed with visual perception in mind
I Inclusion of some components, like legends, are automated
I Great flexibility for annotating, editing, and embeddingoutput
14
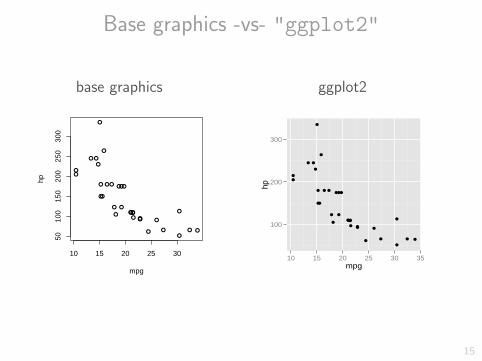
Base graphics -vs- "ggplot2"
base graphics
●●
●
●
●
●
●
●
●
●●
● ●●
●●
●
●
●●
●
●●
●
●
●
●
●
●
●
●
●
10 15 20 25 30
5010
015
020
025
030
0
mpg
hp
ggplot2
●●
●
●
●
●
●
●
●
●●
● ●●
●●
●
●
●
●
●
●●
●
●
●
●
●
●
●
●
●
100
200
300
10 15 20 25 30 35mpg
hp
15
About "ggplot2"
I "ggplot2" is the name of the package
I The gg in "ggplot2" stands for Grammar of Graphics
I Inspired in the Grammar of Graphics by Lee Wilkinson
I "ggplot" is the class of objects (plots)
I ggplot() is the main function in "ggplot2"
16
What is a Statistical Graphic?
17
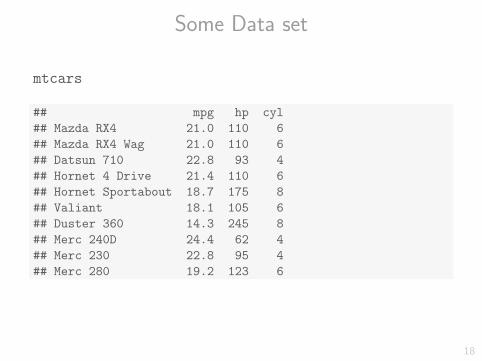
Some Data set
mtcars
## mpg hp cyl
## Mazda RX4 21.0 110 6
## Mazda RX4 Wag 21.0 110 6
## Datsun 710 22.8 93 4
## Hornet 4 Drive 21.4 110 6
## Hornet Sportabout 18.7 175 8
## Valiant 18.1 105 6
## Duster 360 14.3 245 8
## Merc 240D 24.4 62 4
## Merc 230 22.8 95 4
## Merc 280 19.2 123 6
18
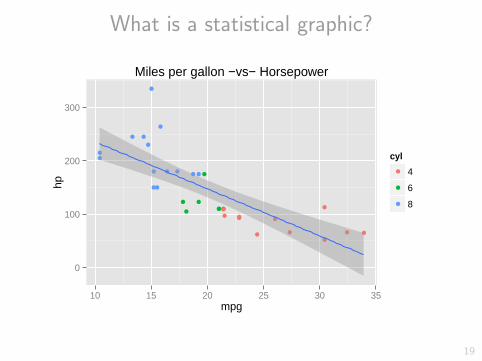
What is a statistical graphic?
●●
●
●
●
●
●
●
●
●●
● ●●
●●
●
●
●
●
●
●●
●
●
●
●
●
●
●
●
●
0
100
200
300
10 15 20 25 30 35mpg
hp
cyl
●
●
●
4
6
8
Miles per gallon −vs− Horsepower
19
What is a statistical graphic?
Elements to draw the chart “manually”
I coordinate system
I x and y axis (intervals)
I axis tick marks
I axis labels, and title
I points (with colors)
I regression line (and ribbon)
I legend
20
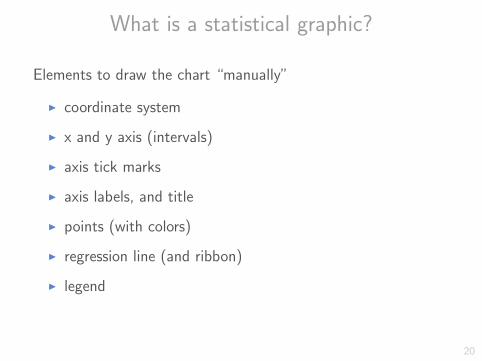
What is a statistical graphic?
Elements to draw the chart “manually”
I coordinate system
I x and y axis (intervals)
I axis tick marks
I axis labels, and title
I points (with colors)
I regression line (and ribbon)
I legend
20
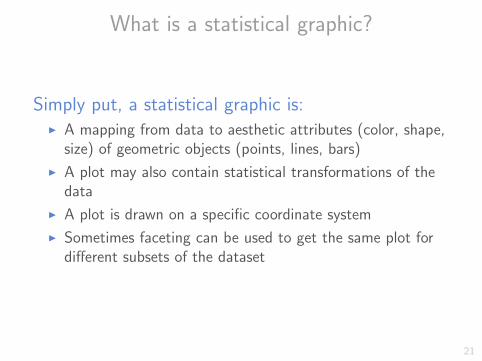
What is a statistical graphic?
Simply put, a statistical graphic is:I A mapping from data to aesthetic attributes (color, shape,
size) of geometric objects (points, lines, bars)
I A plot may also contain statistical transformations of thedata
I A plot is drawn on a specific coordinate system
I Sometimes faceting can be used to get the same plot fordifferent subsets of the dataset
21
Starting with "ggplot2"
22
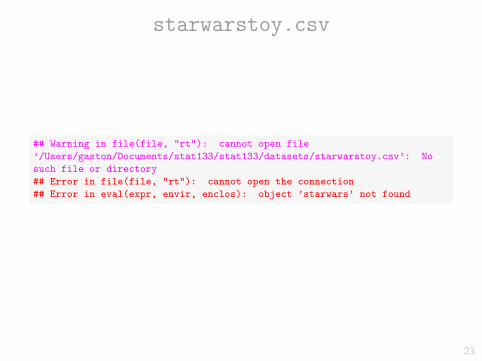
starwarstoy.csv
## Warning in file(file, "rt"): cannot open file
’/Users/gaston/Documents/stat133/stat133/datasets/starwarstoy.csv’: No
such file or directory
## Error in file(file, "rt"): cannot open the connection
## Error in eval(expr, envir, enclos): object ’starwars’ not found
23
Scatterplot
## Error in ggplot(data = starwars): object ’starwars’ not found
24
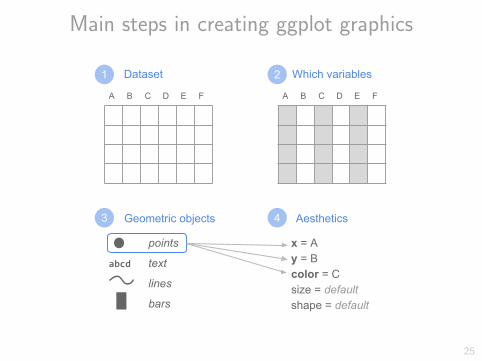
Main steps in creating ggplot graphics
A B C D E F
Dataset Which variables
A B C D E F
Geometric objects
abcd
points
text
lines
bars
Aesthetics
x = Ay = Bcolor = Csize = defaultshape = default
1 2
3 4
25
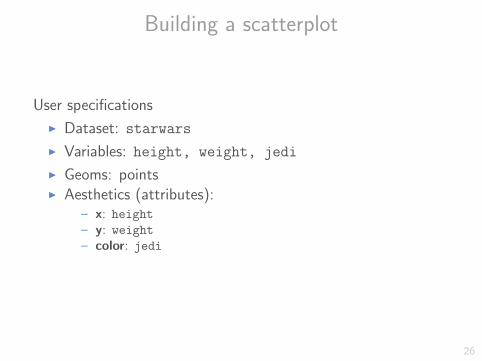
Building a scatterplot
User specifications
I Dataset: starwars
I Variables: height, weight, jedi
I Geoms: pointsI Aesthetics (attributes):
– x: height
– y: weight
– color: jedi
26
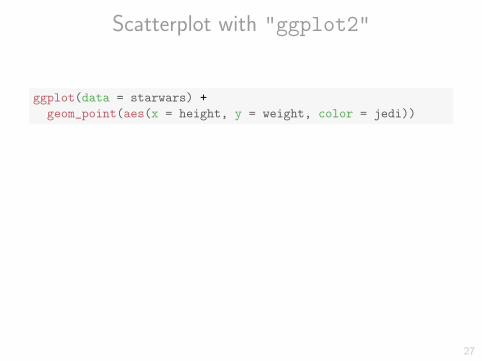
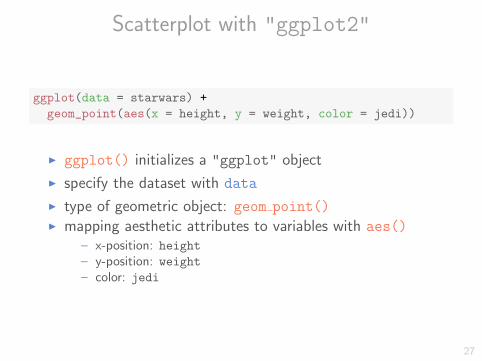
Scatterplot with "ggplot2"
ggplot(data = starwars) +
geom_point(aes(x = height, y = weight, color = jedi))
I ggplot() initializes a "ggplot" object
I specify the dataset with data
I type of geometric object: geom point()I mapping aesthetic attributes to variables with aes()
– x-position: height
– y-position: weight
– color: jedi
27

Scatterplot with "ggplot2"
ggplot(data = starwars) +
geom_point(aes(x = height, y = weight, color = jedi))
## Error in ggplot(data = starwars): object ’starwars’ not found
28
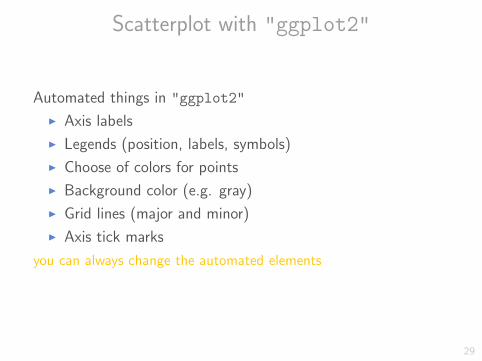
Scatterplot with "ggplot2"
Automated things in "ggplot2"
I Axis labels
I Legends (position, labels, symbols)
I Choose of colors for points
I Background color (e.g. gray)
I Grid lines (major and minor)
I Axis tick marks
you can always change the automated elements
29
"ggplot2" graphics
Philosophy of "ggplot2"A graphic is a mapping from data to aesthetic attributes(color, shape, size) of geometric objects (points, lines, bars)
30
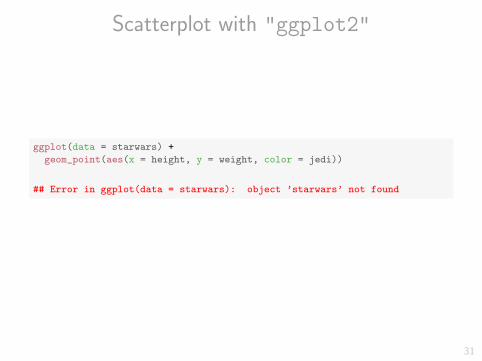
Scatterplot with "ggplot2"
ggplot(data = starwars) +
geom_point(aes(x = height, y = weight, color = jedi))
## Error in ggplot(data = starwars): object ’starwars’ not found
31
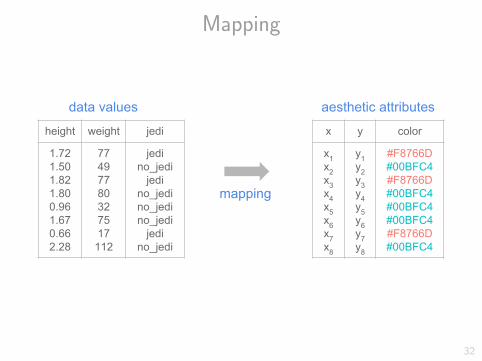
Mapping
height weight jedi
1.721.501.821.800.961.670.662.28
77497780327517
112
jedino_jedi
jedino_jedino_jedino_jedi
jedino_jedi
x y color
x1x2x3x4x5x6x7x8
y1y2y3y4y5y6y7y8
#F8766D#00BFC4#F8766D#00BFC4#00BFC4#00BFC4#F8766D#00BFC4
data values aesthetic attributes
mapping
32
"ggplot2" graphics
Philosophy of "ggplot2"A graphic is a mapping from data to aesthetic attributes(color, shape, size) of geometric objects (points, lines, bars)
I ggplot(data, ...)
I aes()
I geom objects()
33
Scatterplot with "ggplot2"
How does "ggplot2" work?
I plots are created piece-by-piece
I plot components added with + operator
I aesthetic attributes mapped to data values
I computation of scales for aesthetic attributes
34
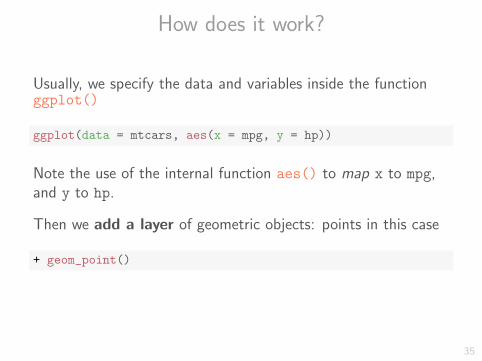
How does it work?
Usually, we specify the data and variables inside the functionggplot()
ggplot(data = mtcars, aes(x = mpg, y = hp))
Note the use of the internal function aes() to map x to mpg,and y to hp.
Then we add a layer of geometric objects: points in this case
+ geom_point()
35
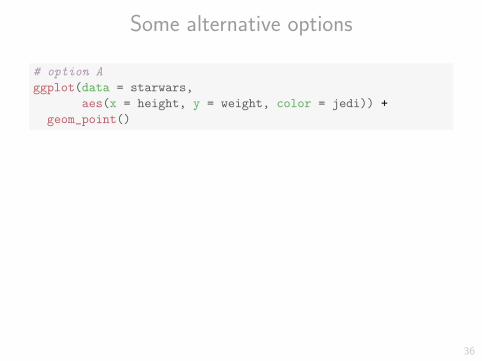
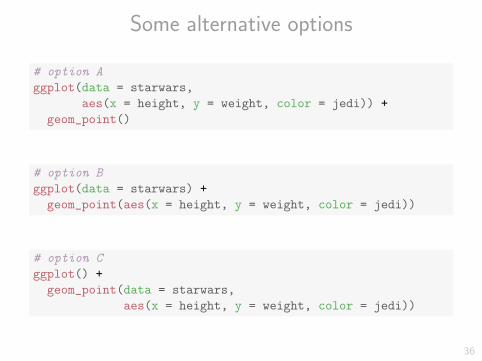
Some alternative options
# option A
ggplot(data = starwars,
aes(x = height, y = weight, color = jedi)) +
geom_point()
# option B
ggplot(data = starwars) +
geom_point(aes(x = height, y = weight, color = jedi))
# option C
ggplot() +
geom_point(data = starwars,
aes(x = height, y = weight, color = jedi))
36
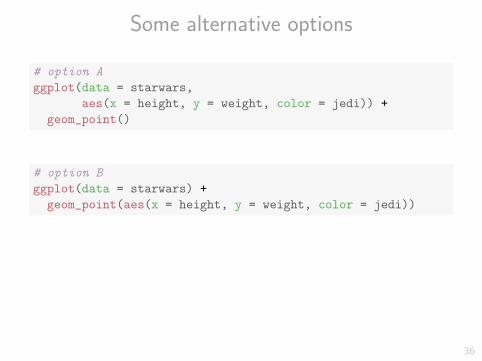
Main inquiries
Always ask yourself ...
I What is the data set of interest?
I What variables will be used to make the plot?
I What graphics shapes will be used to display?
I What features of the shapes will be used to represent thedata values?
37
"ggplot2" basics
I The data must be in a data.frame
I Variables are mapped to aesthetic attributes
I Aesthetic attributes belong to geometric objects geoms(points, lines, polygons)
38
Basic Terminology
I ggplot() - The main function where you specify thedataset and variables to plot
I geoms - geometric objetcs– geom point(), geom bar(), geom line(), geom density()
I aes - aesthetics (i.e. attributes)– shape, color, fill, linetype
39
Warning
"ggplot2" comes with the function qplot() (i.e. quick plot).Avoid using it!
As Karthik Ram says: “you’ll end up unlearning and relearning agood bit”
40