Embed Size (px)
DESCRIPTION
GIS & Emergency Management. City of Charleston, South Carolina. Introduction and why us?. Mark Wilbert Emergency Manager Brian Pokrant City GIS Analyst Why Us and Why Now? The rest of the story Focus is on prevention and future Partnership of expertise. Timing is Everything. - PowerPoint PPT Presentation
Citation preview
City of Charleston, South Carolina
GIS & EMERGENCY MANAGEMENT
Introduction and why us?
Mark Wilbert Emergency Manager
Brian Pokrant City GIS Analyst
Why Us and Why Now? The rest of the story Focus is on prevention and future
Partnership of expertise
Timing is Everything
Recent full time emergency manager-2013
New GIS centric City Management System integrating key processes -2015
GIS Strategic Plan-2014 New Municipal Emergency Operations
Center - 2015 2010 Hazus Census data – November
2014 Hazus Certified GIS Staff
EM Challenges in Charleston Earthquakes Floods Hurricanes Changes in Weather Behavior Population Growth Tourism Vulnerable Populations Surrounded by Water
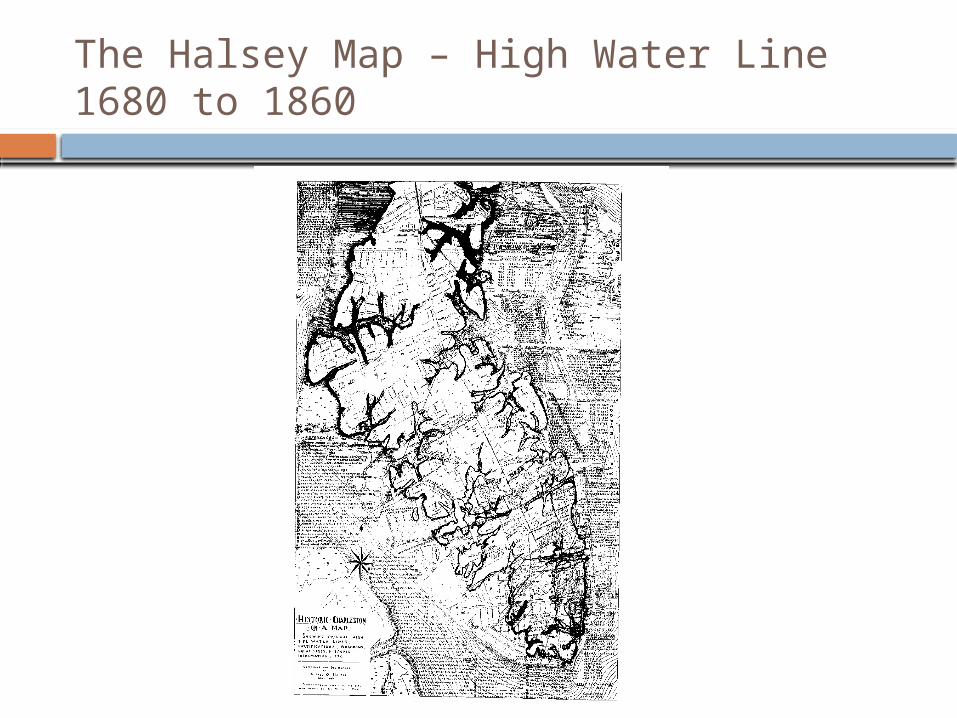
The Halsey Map – High Water Line 1680 to 1860
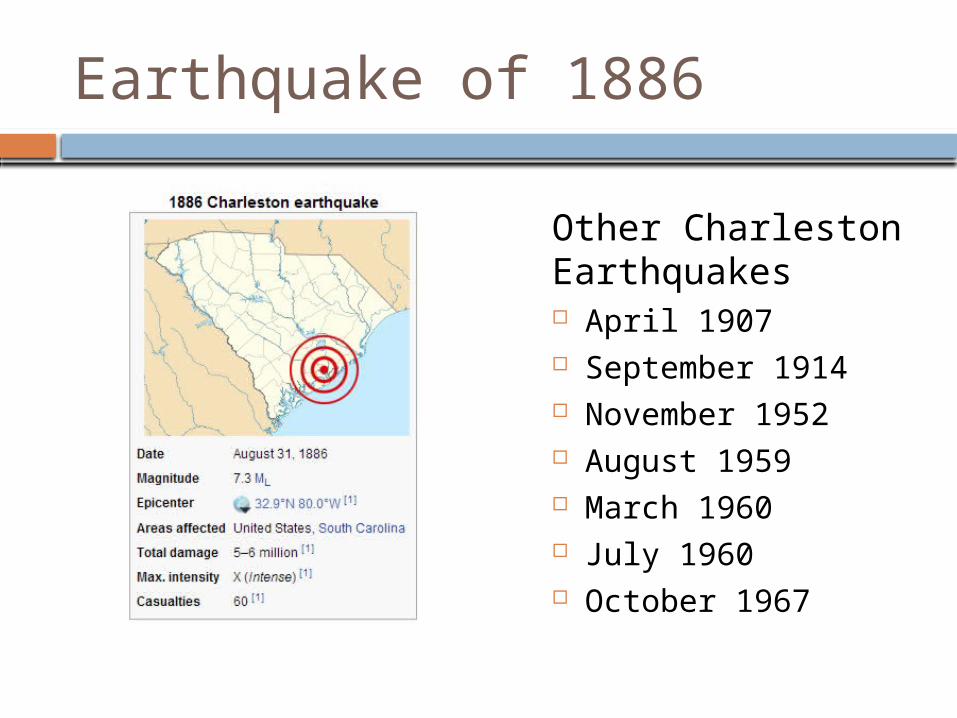
Earthquake of 1886
Other Charleston Earthquakes April 1907 September 1914 November 1952 August 1959 March 1960 July 1960 October 1967
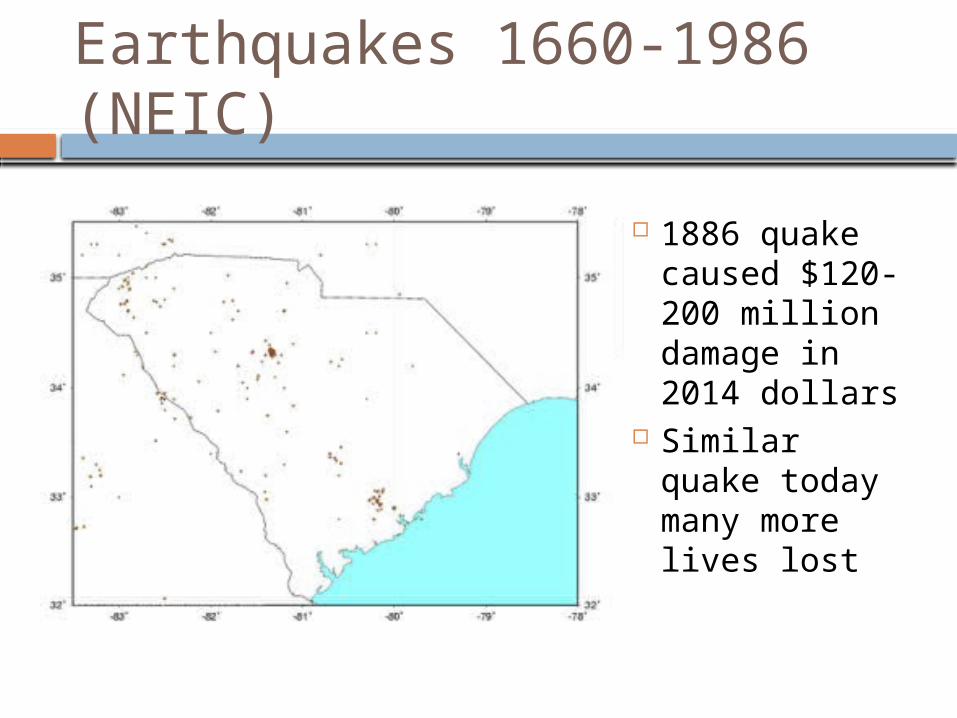
Earthquakes 1660-1986 (NEIC)
1886 quake caused $120-200 million damage in 2014 dollars
Similar quake today many more lives lost
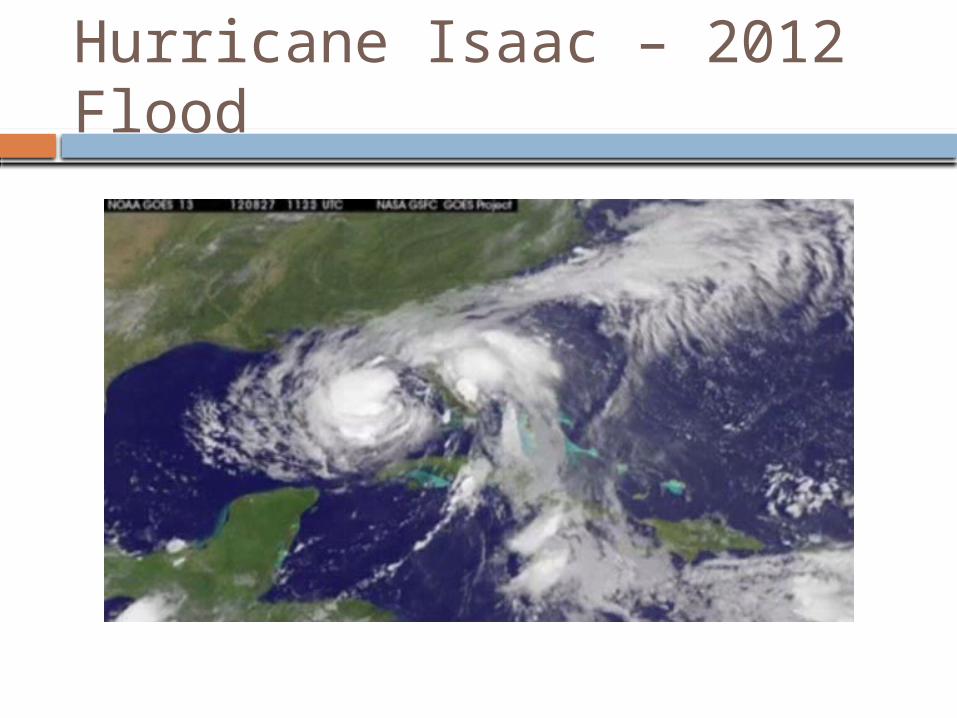
Hurricane Isaac – 2012 Flood
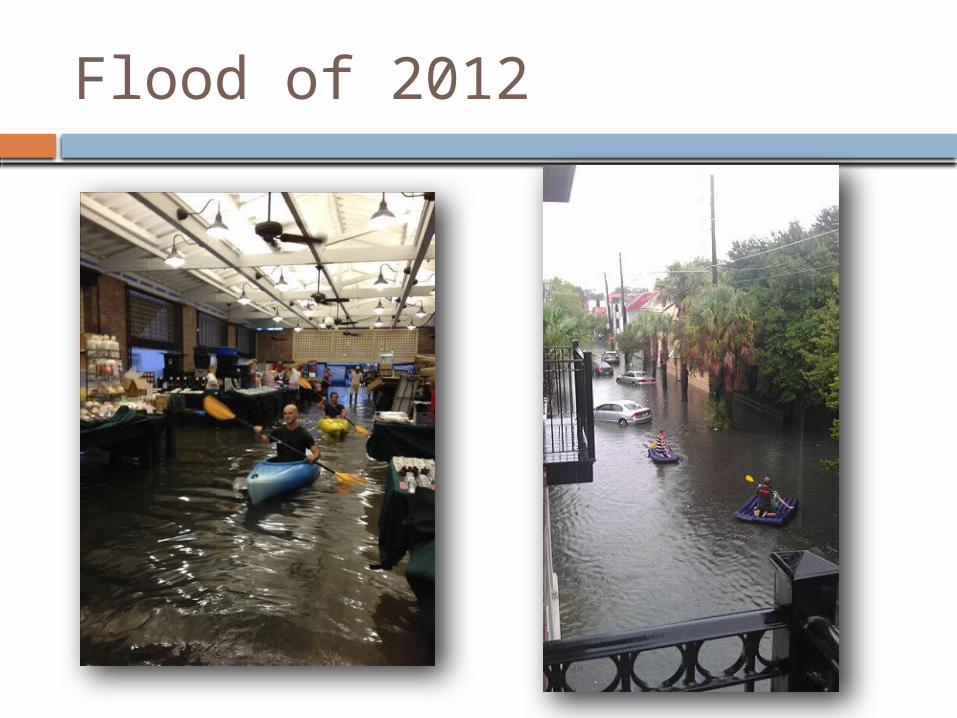
Flood of 2012
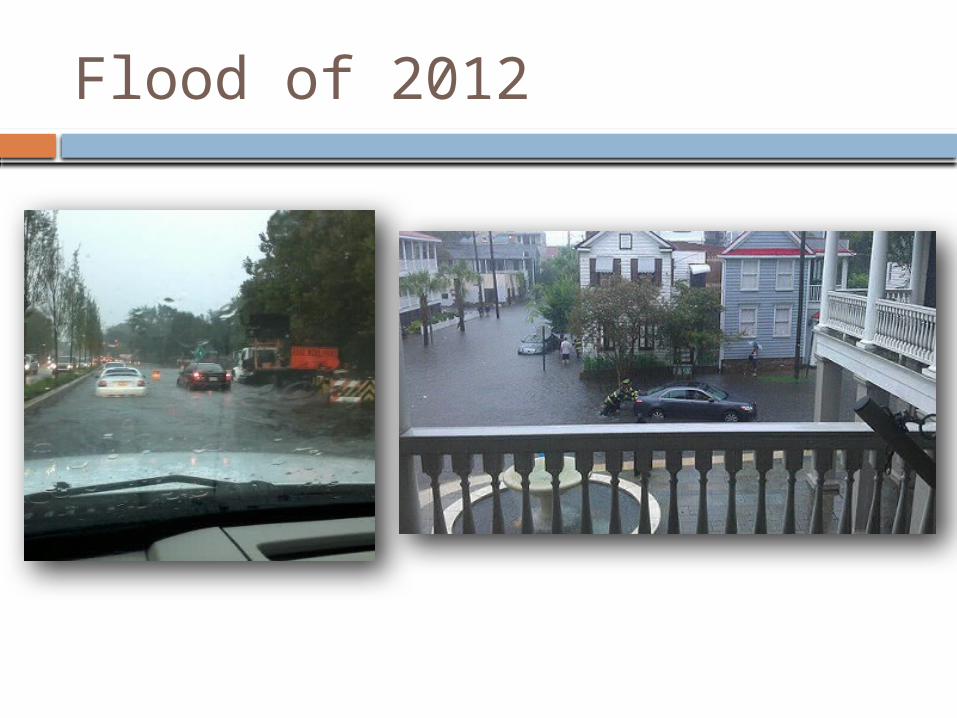
Flood of 2012
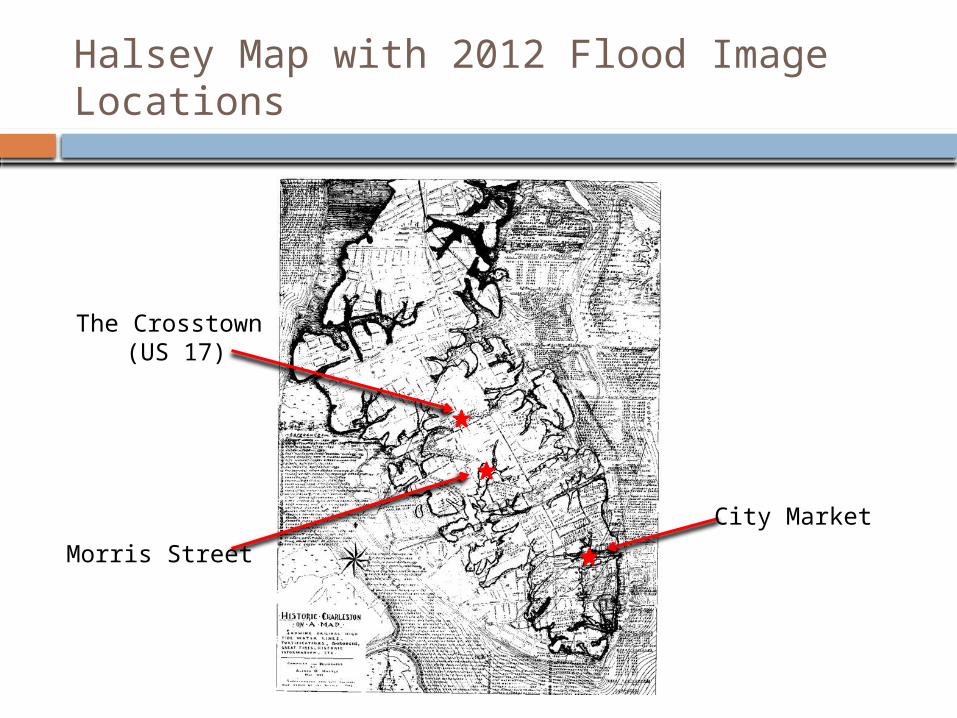
Halsey Map with 2012 Flood Image Locations
City Market
The Crosstown (US 17)
Morris Street
Hurricanes that have caused major flooding
1686, 1713, 1728, 1752, 1783, 1787, 1804, 1813, 1822, 1854, 1885, 1893, 1911, 1940, 1959, Agnes (1972), Hugo (1989)
1893 and 1940 produced 8.9-9’ surge levels Hugo produced a storm surge of 16-17’ in
McClellanville Hugo ranks 8th in terms of estimated
damage by Hurricanes in the US at $7 billion dollars
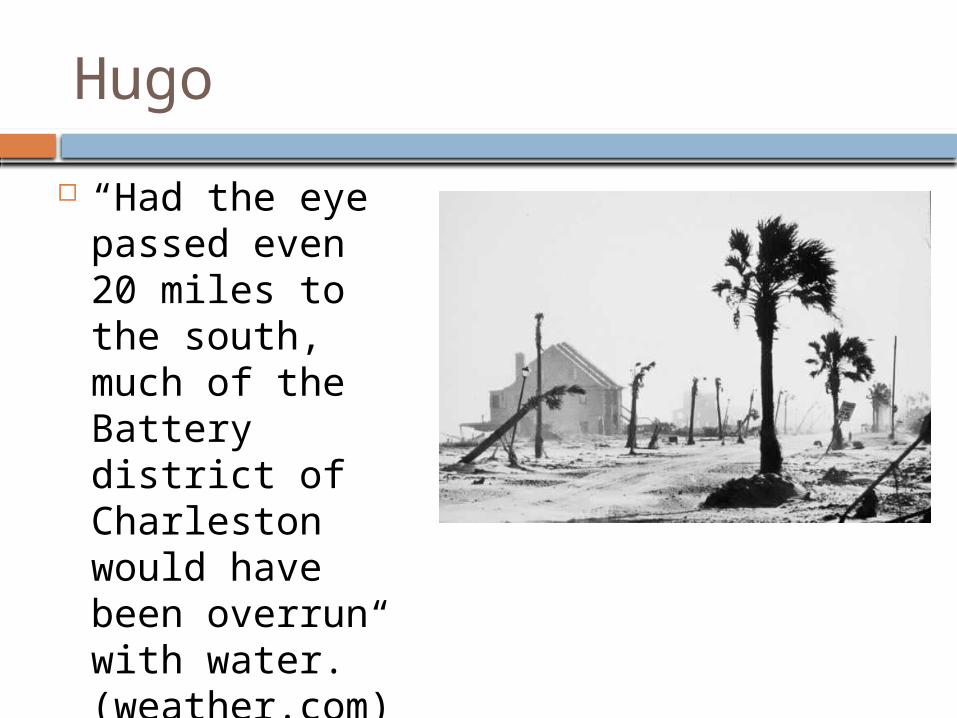
Hugo
“Had the eye passed even 20 miles to the south, much of the Battery district of Charleston would have been overrun with water.” (weather.com)
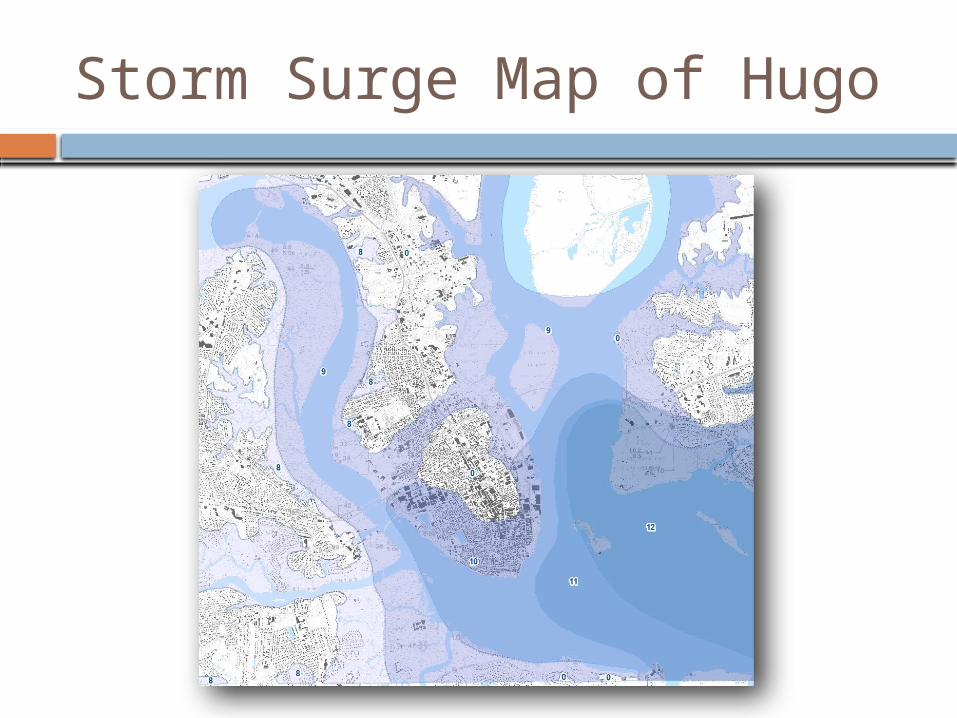
Storm Surge Map of Hugo
Weather Behavior, Population and Tourism
1-2 hr rainfall as important as 24 hr! Cannot build ourselves out of this Sea level rise in Charleston will exasperate
More frequent shallow flooding Storm inundation will be worse given same
storm scenarios Today’s rain events are tomorrow’s
emergency eventsResearch and modeling of some locations throughout the US are indicating that in 50 years, a 100 year flood event could be today’s 500 year event
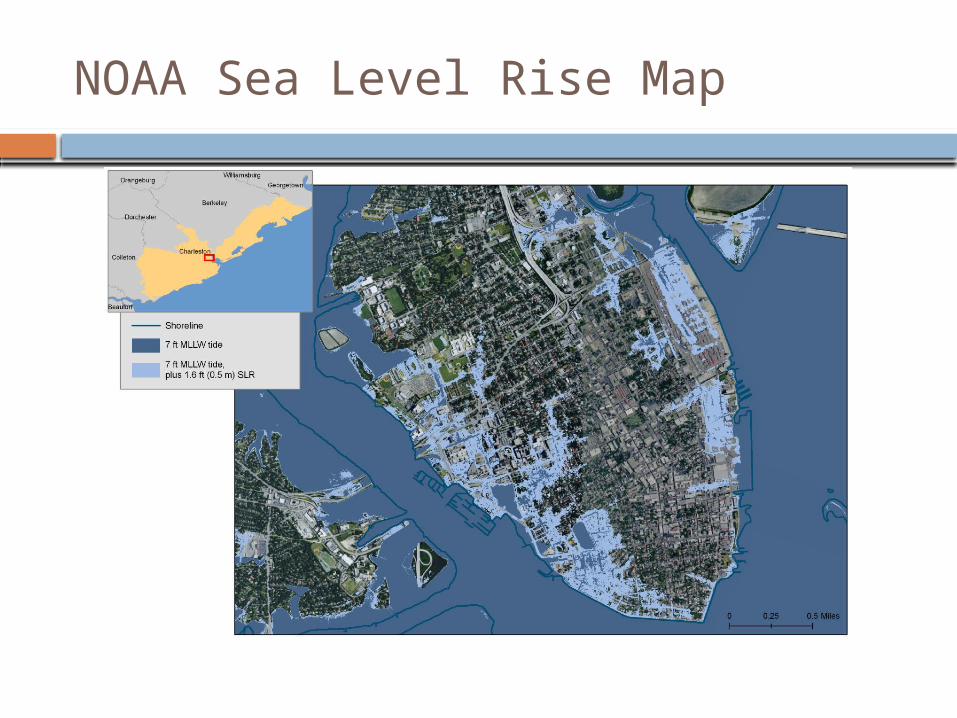
NOAA Sea Level Rise Map
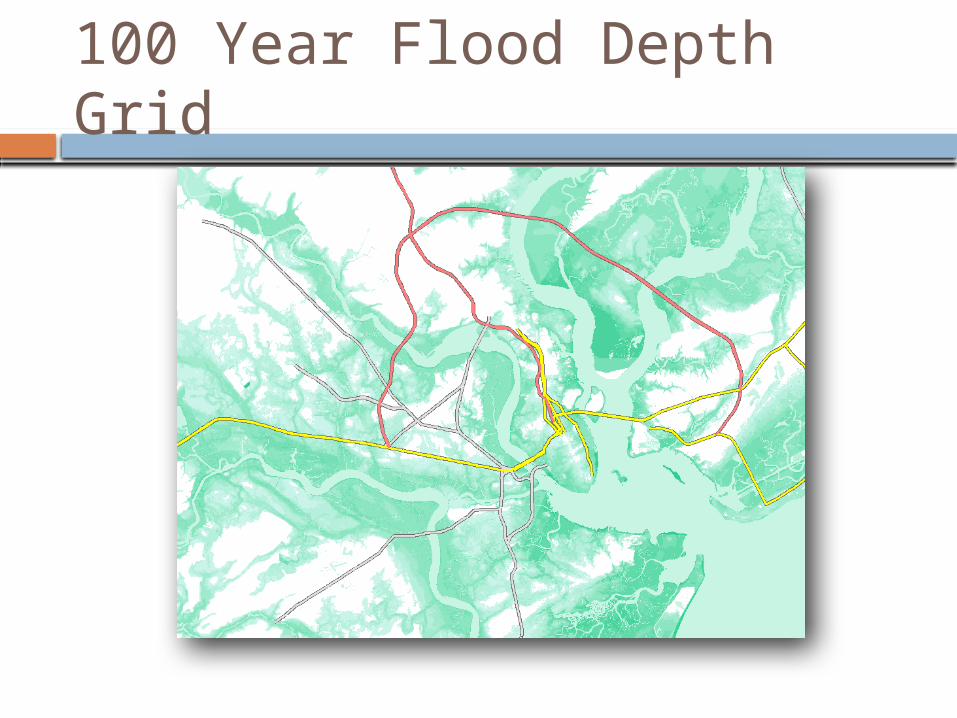
100 Year Flood Depth Grid
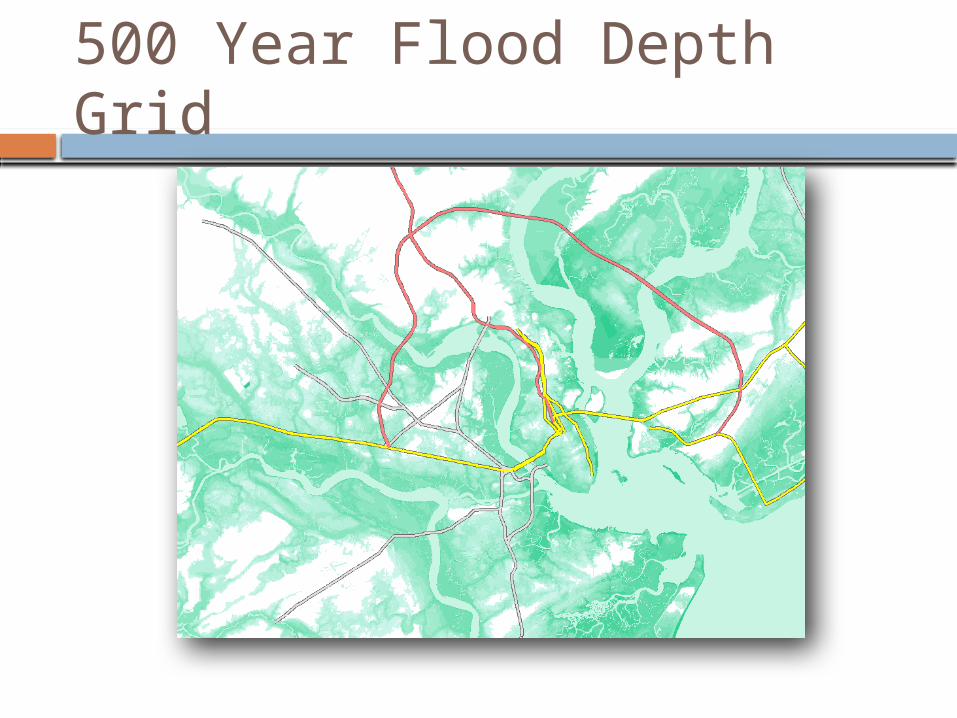
500 Year Flood Depth Grid
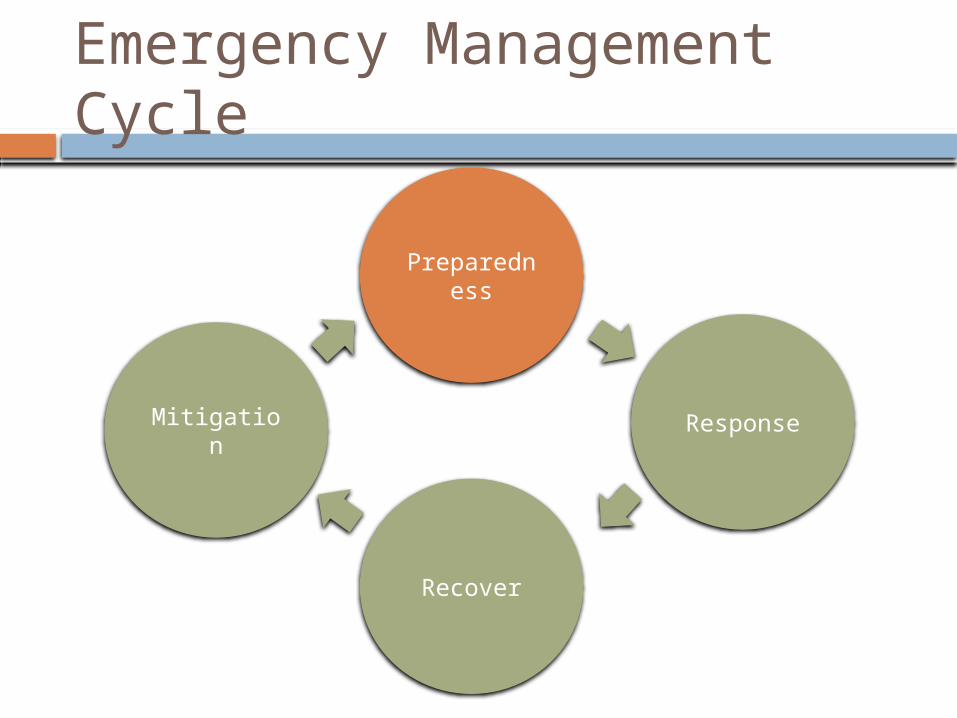
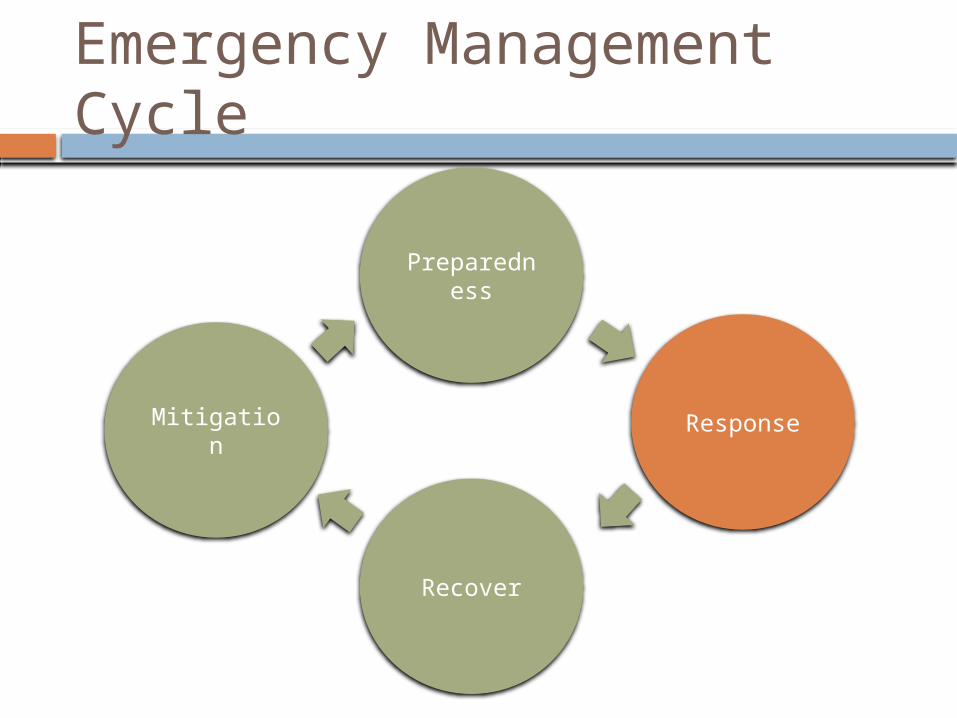
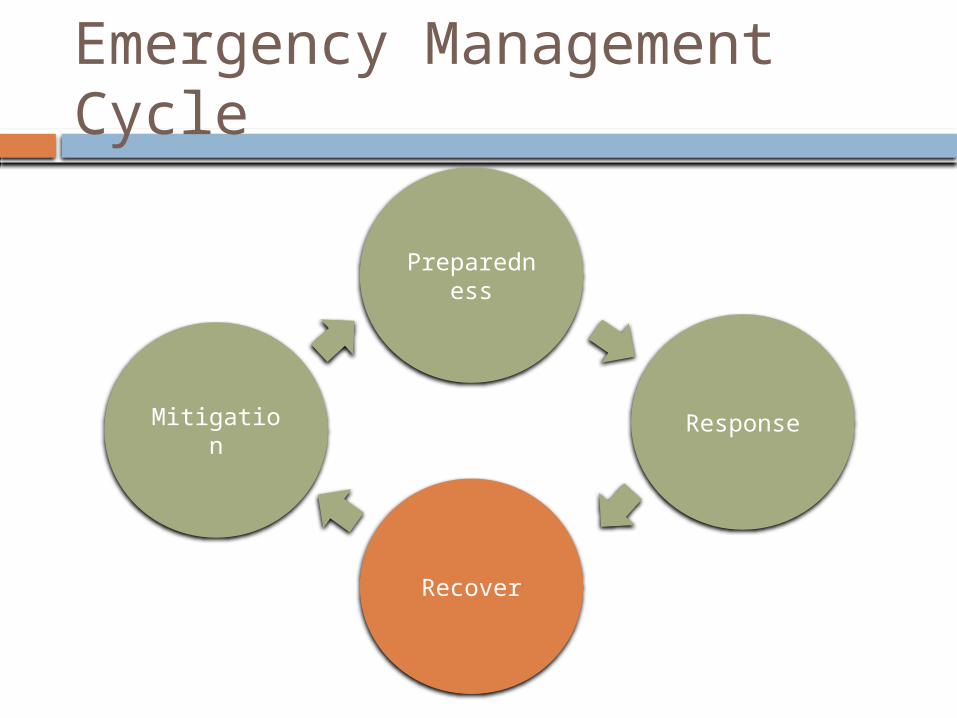
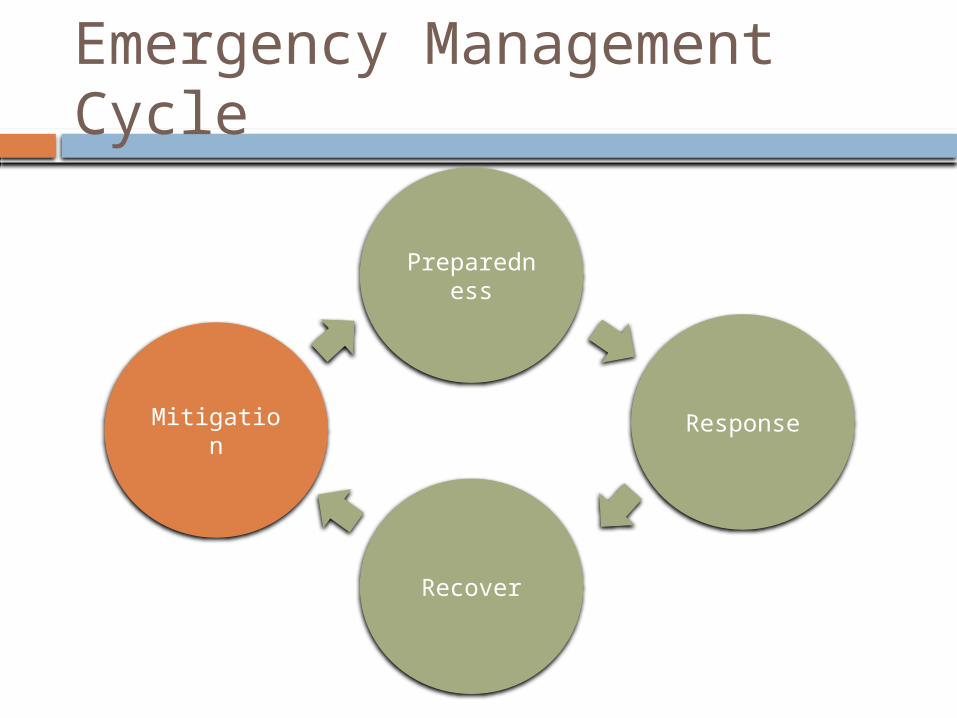
Emergency Management Cycle
Preparedness
Recover
Mitigation Response
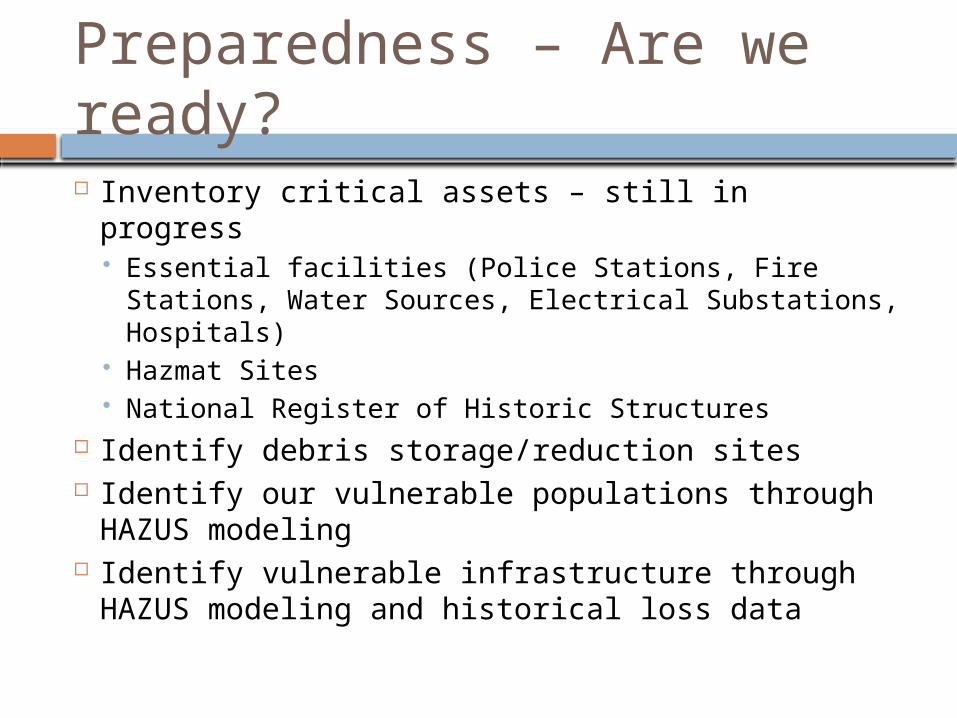
Preparedness – Are we ready? Inventory critical assets – still in progress
Essential facilities (Police Stations, Fire Stations, Water Sources, Electrical Substations, Hospitals)
Hazmat Sites National Register of Historic Structures
Identify debris storage/reduction sites Identify our vulnerable populations through
HAZUS modeling Identify vulnerable infrastructure through
HAZUS modeling and historical loss data
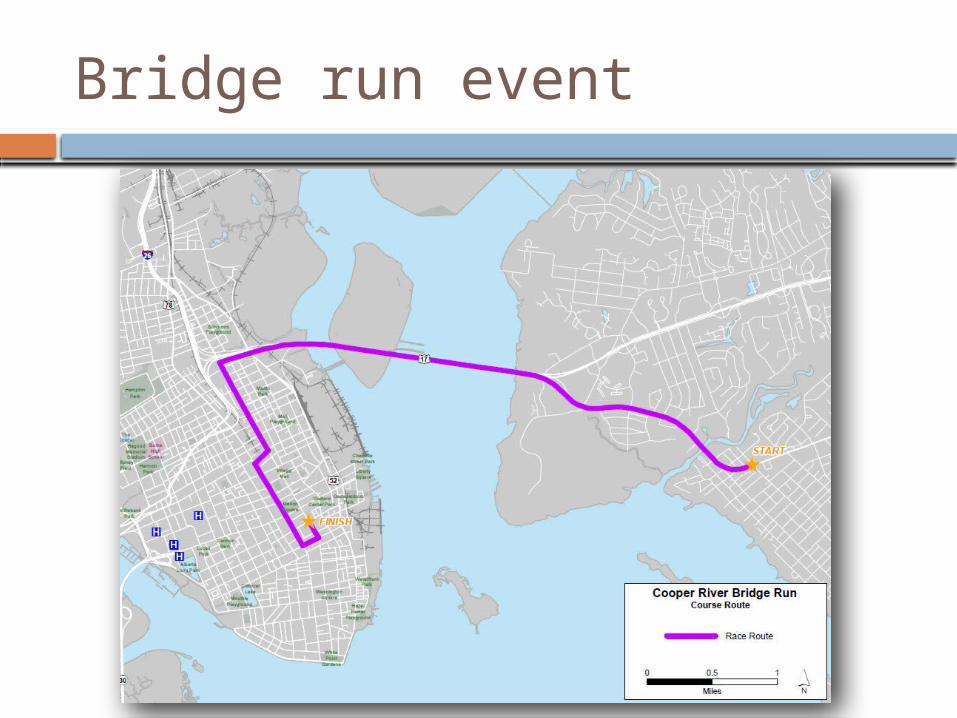
Bridge run event
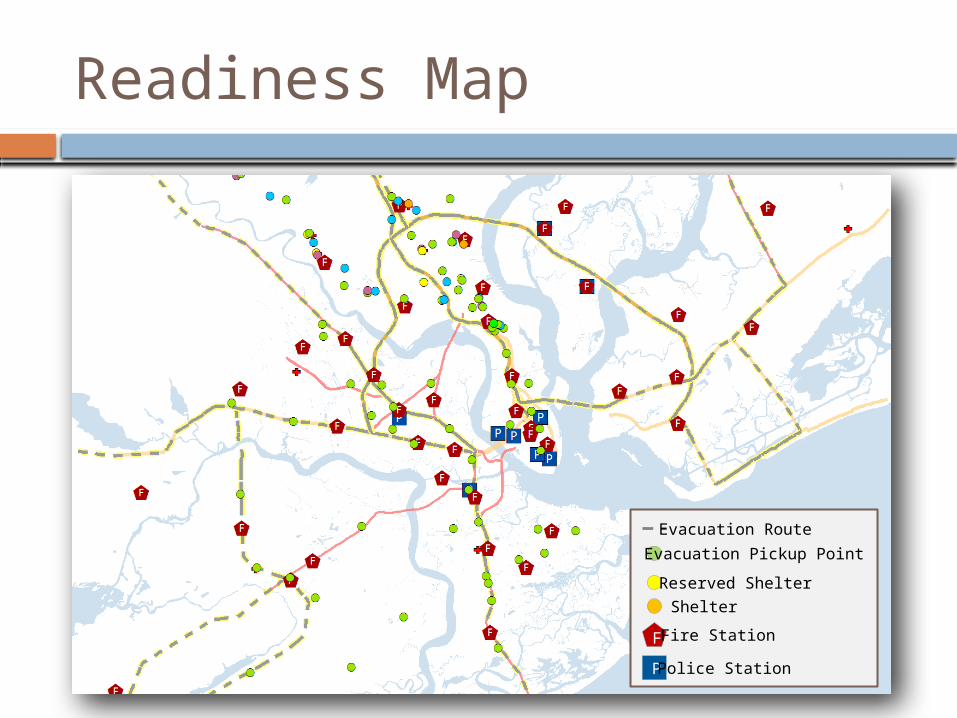
Readiness Map
Evacuation Pickup Point
F
P
Reserved Shelter
Shelter
Fire Station
Police Station
Evacuation Route
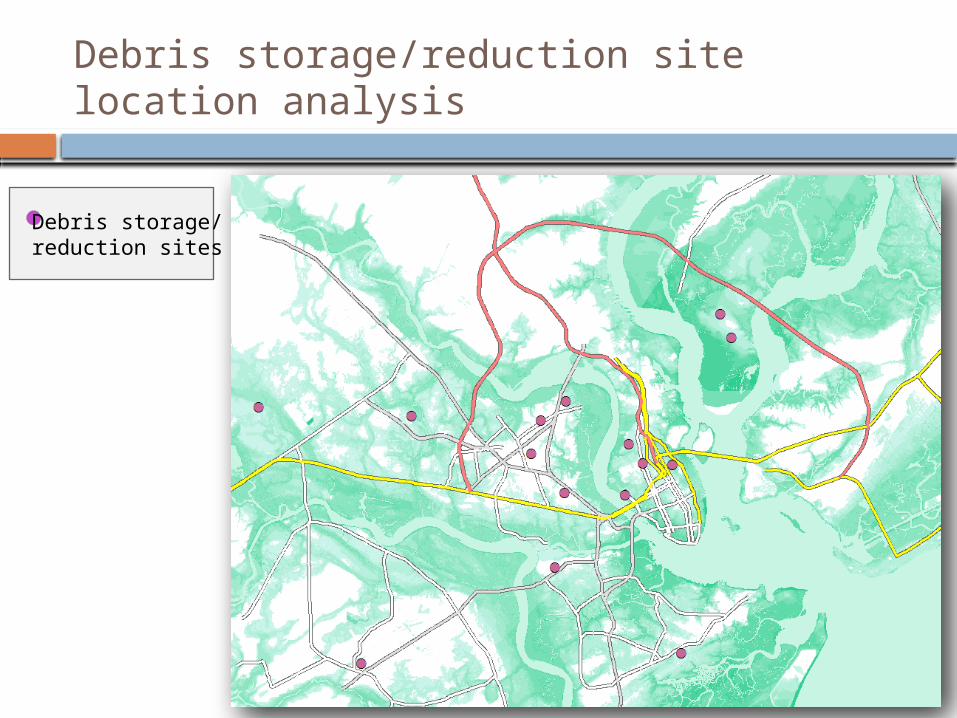
Debris storage/reduction site location analysis
Debris storage/reduction sites
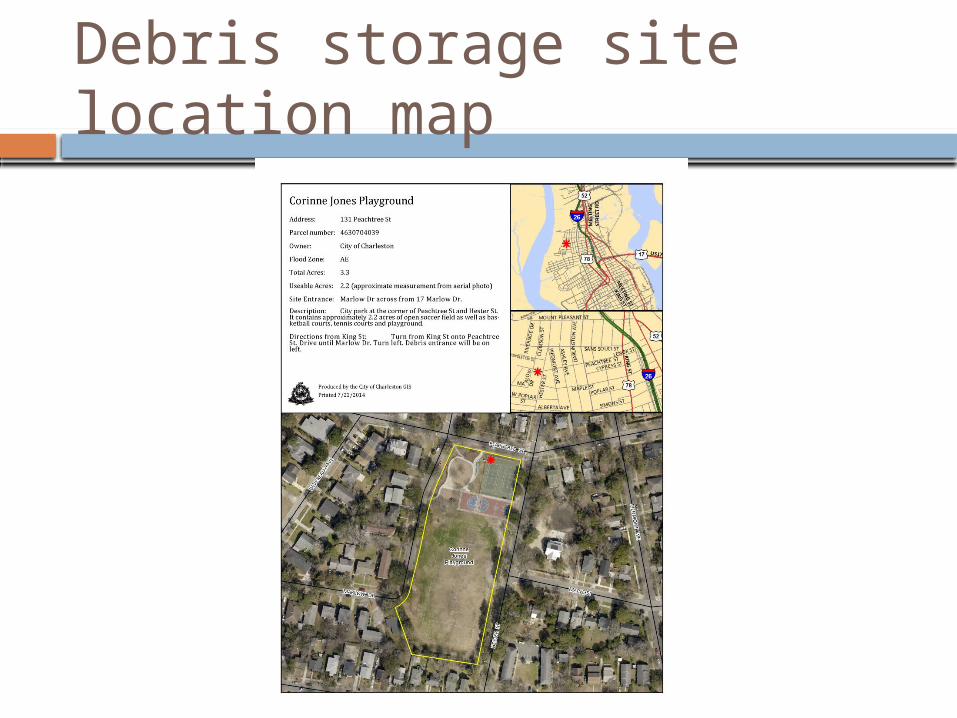
Debris storage site location map
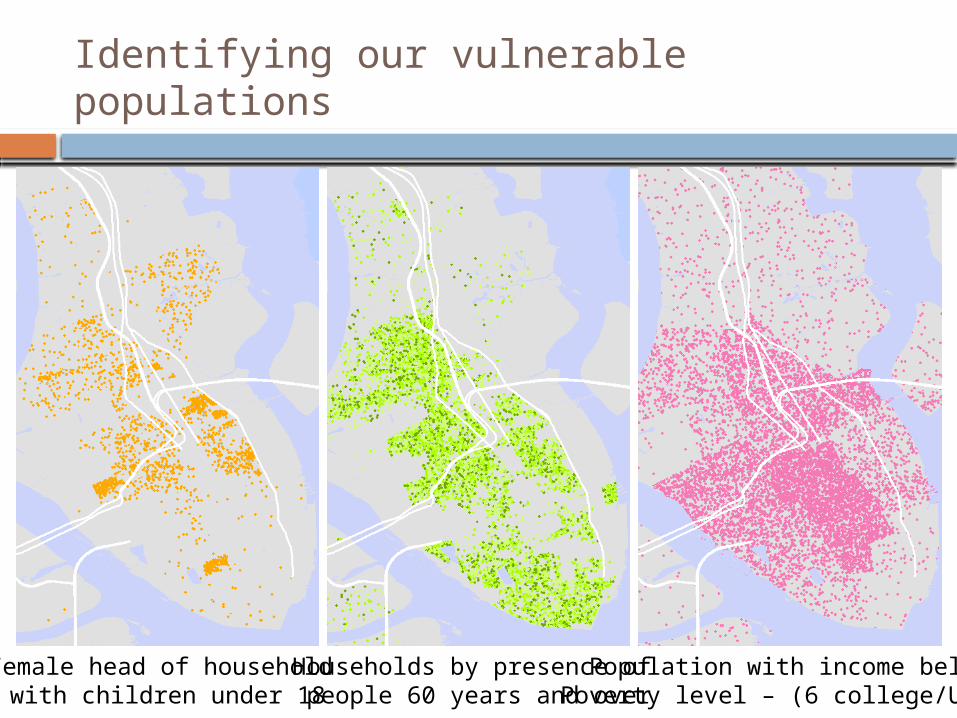
Identifying our vulnerable populations
Female head of household with children under 18
Households by presence of people 60 years and over
Population with income belowPoverty level – (6 college/Univ)
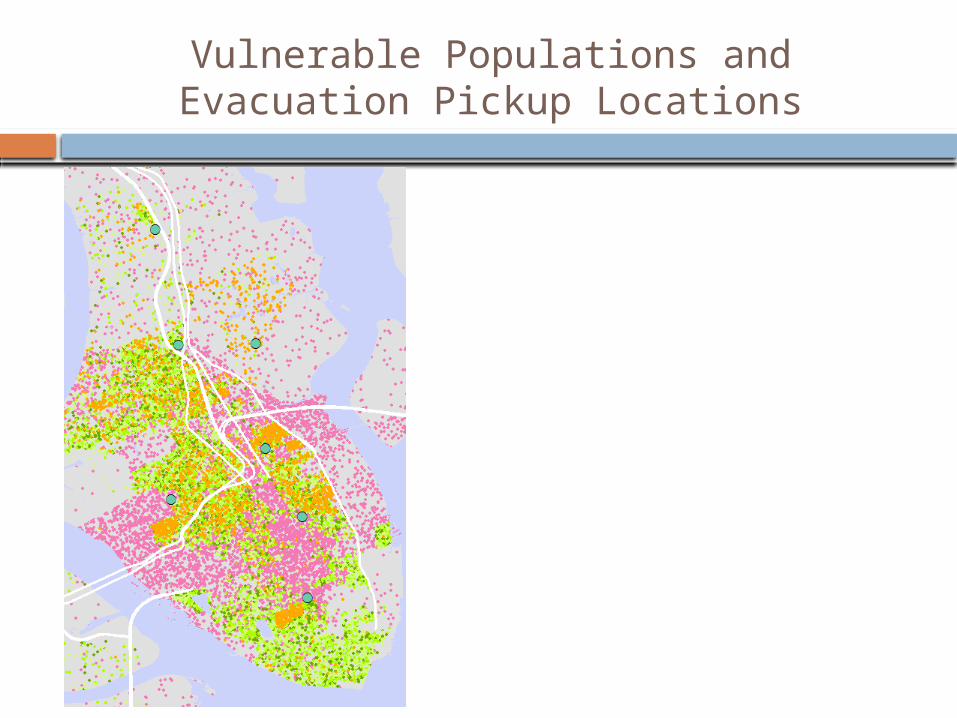
Vulnerable Populations and Evacuation Pickup Locations
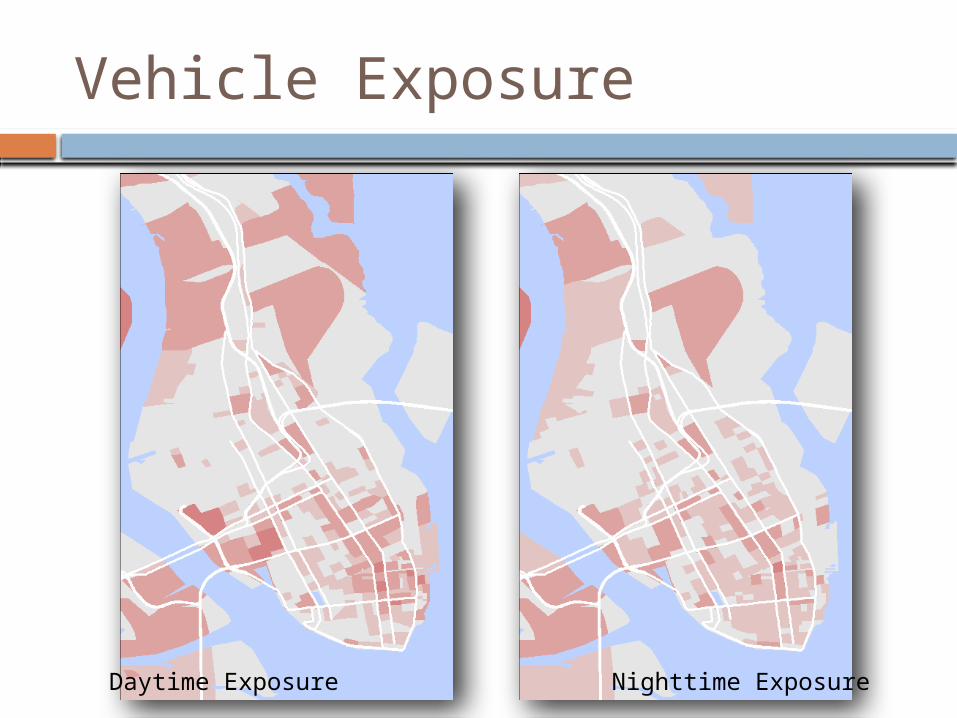
Vehicle Exposure
Daytime Exposure Nighttime Exposure
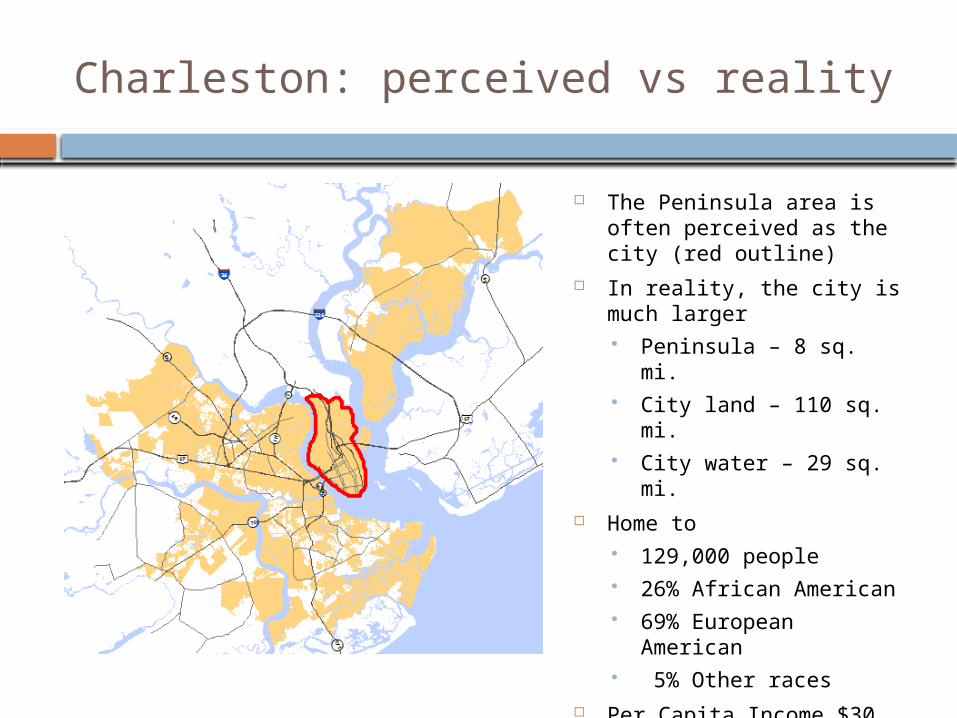
Charleston: perceived vs reality
The Peninsula area is often perceived as the city (red outline)
In reality, the city is much larger Peninsula – 8 sq. mi. City land – 110 sq. mi. City water – 29 sq. mi.
Home to 129,000 people 26% African American 69% European American 5% Other races
Per Capita Income $30, 700 Persons per household 2.8
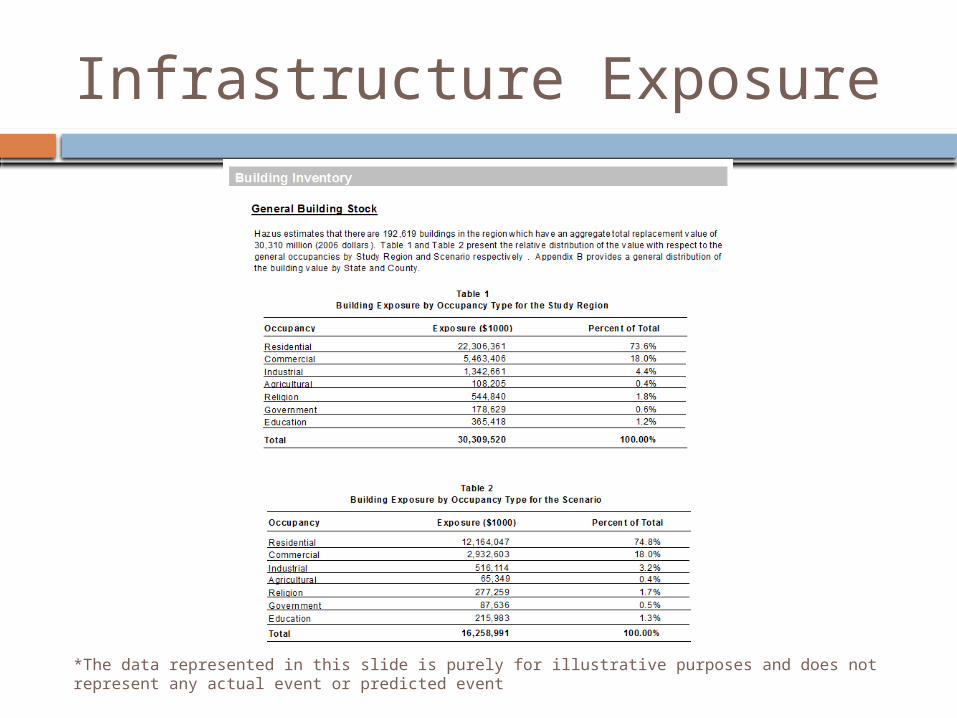
*The data represented in this slide is purely for illustrative purposes and does not represent any actual event or predicted event
Infrastructure Exposure
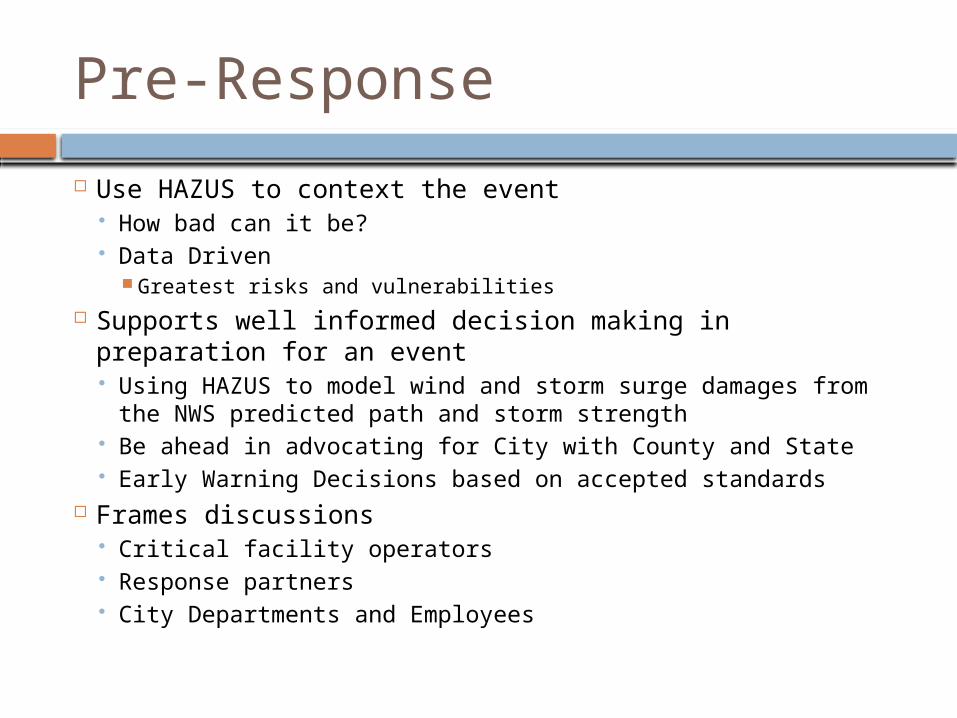
Pre-Response
Use HAZUS to context the event How bad can it be? Data Driven
Greatest risks and vulnerabilities Supports well informed decision making in preparation for
an event Using HAZUS to model wind and storm surge damages from the
NWS predicted path and storm strength Be ahead in advocating for City with County and State Early Warning Decisions based on accepted standards
Frames discussions Critical facility operators Response partners City Departments and Employees
*The data represented in this slide is purely for illustrative purposes and does not represent any actual event or predicted event
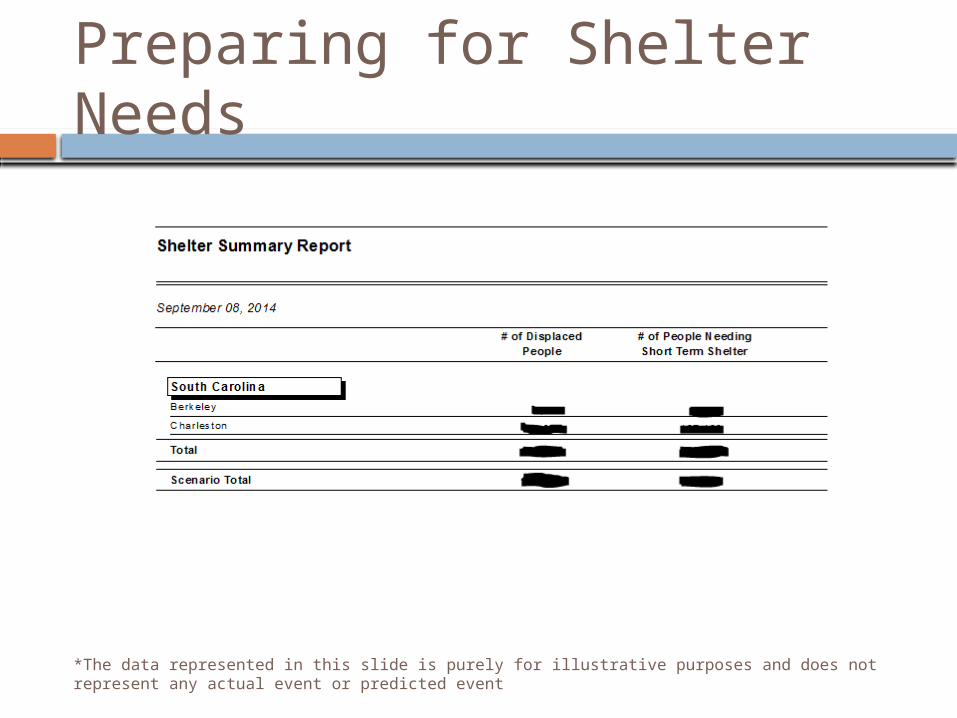
Preparing for Shelter Needs
*The data represented in this slide is purely for illustrative purposes and does not represent any actual event or predicted event
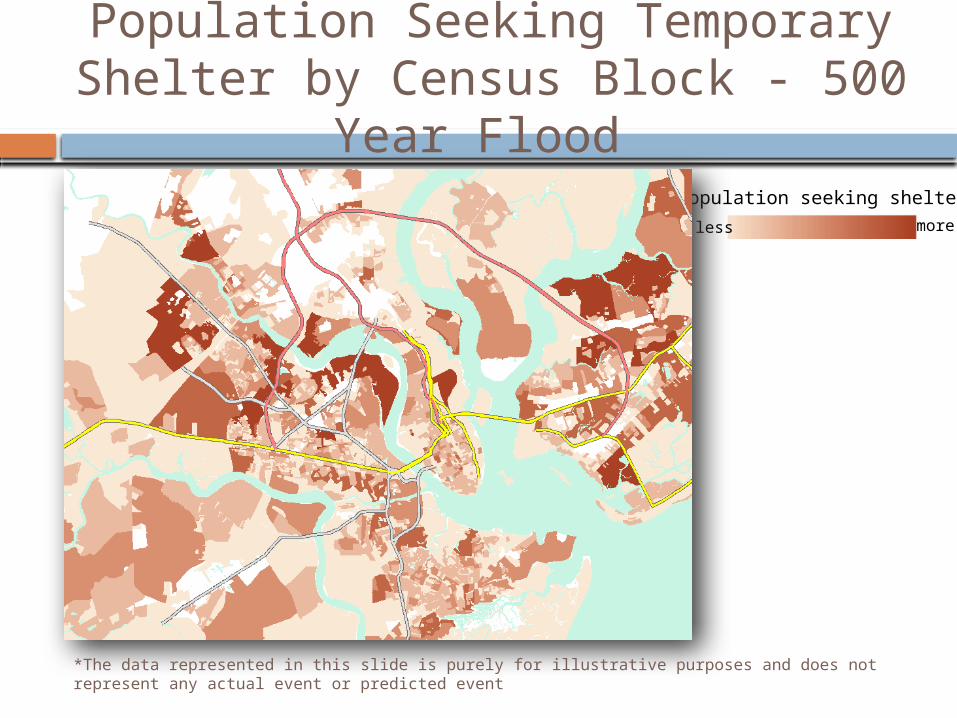
Population Seeking Temporary Shelter by Census Block - 500 Year
Flood Population seeking shelter
less more
*The data represented in this slide is purely for illustrative purposes and does not represent any actual event or predicted event
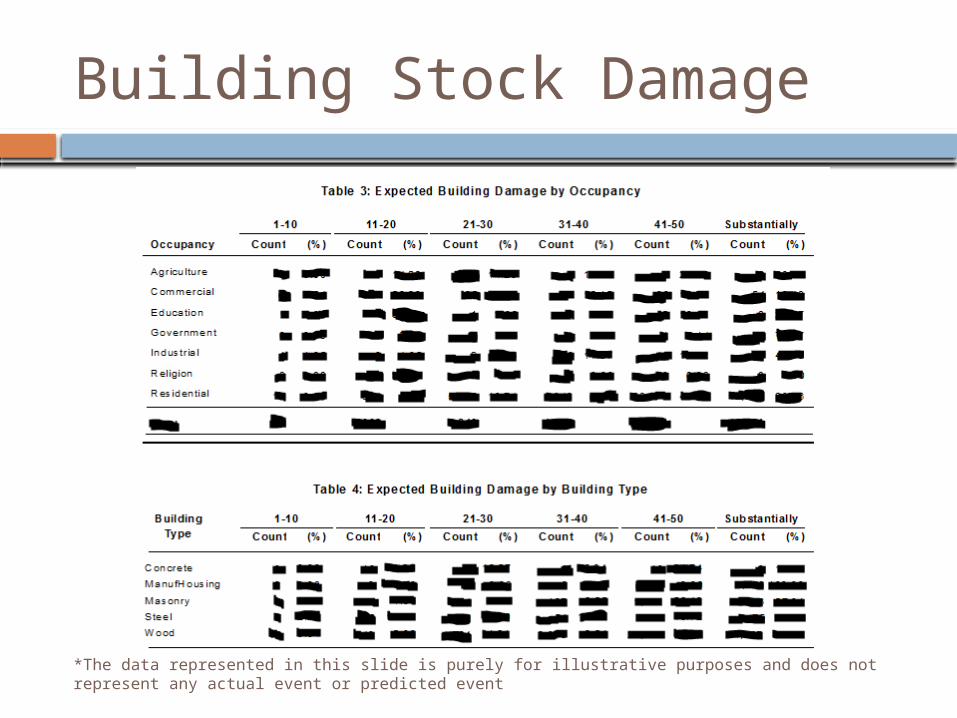
Building Stock Damage
*The data represented in this slide is purely for illustrative purposes and does not represent any actual event or predicted event
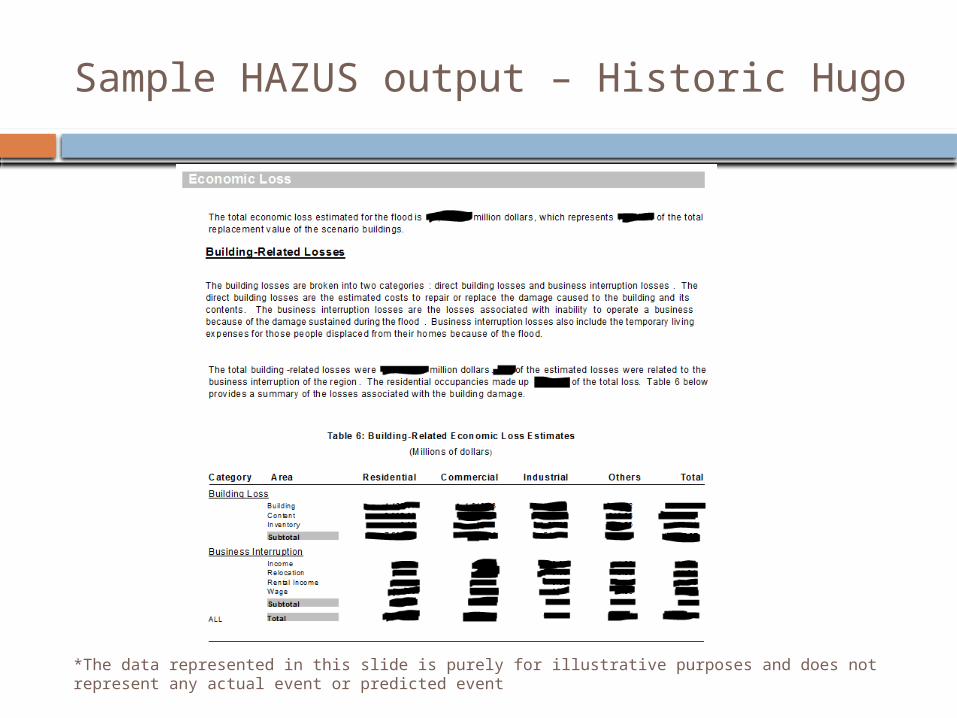
Sample HAZUS output – Historic Hugo
*The data represented in this slide is purely for illustrative purposes and does not represent any actual event or predicted event
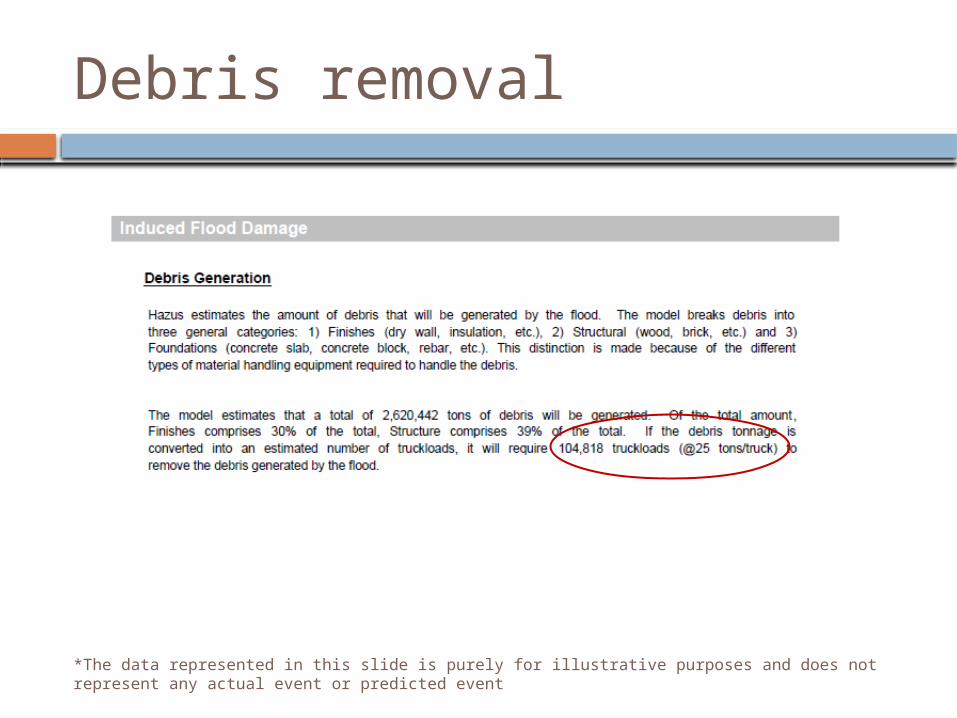
Debris removal
Emergency Management Cycle
Preparedness
Recover
Mitigation Response
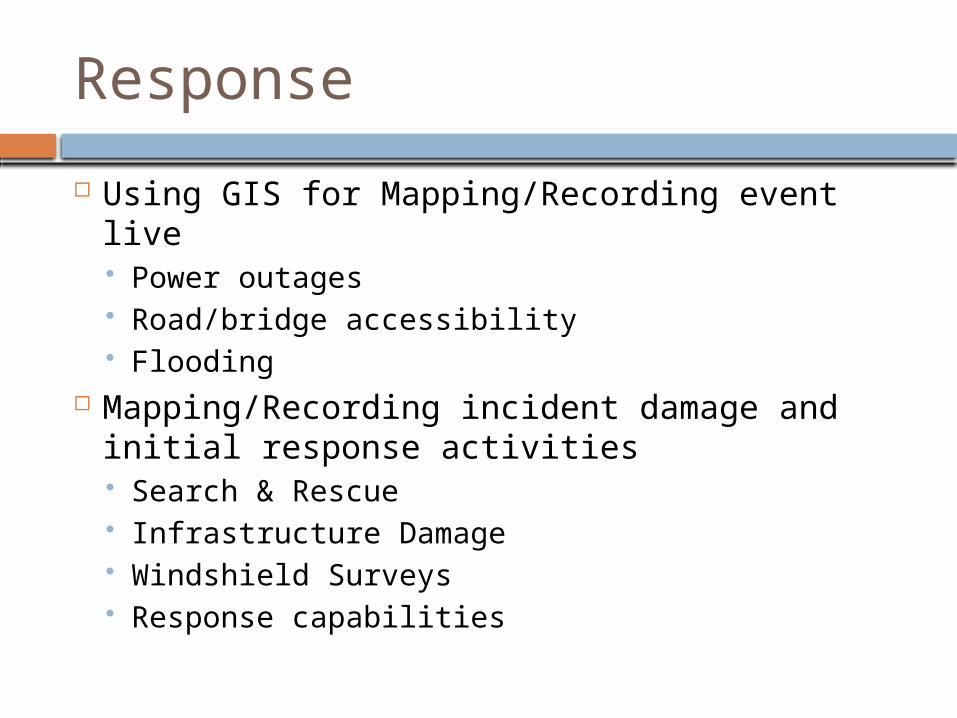
Response
Using GIS for Mapping/Recording event live Power outages Road/bridge accessibility Flooding
Mapping/Recording incident damage and initial response activities Search & Rescue Infrastructure Damage Windshield Surveys Response capabilities
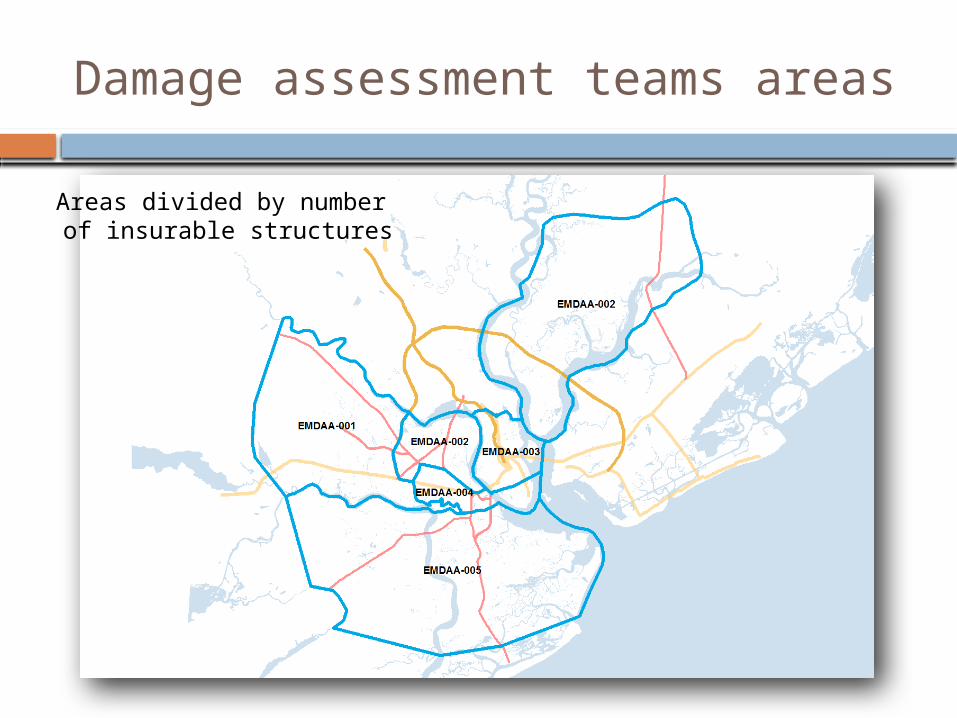
Damage assessment teams areas
Areas divided by number of insurable structures
Emergency Management Cycle
Preparedness
Recover
Mitigation Response
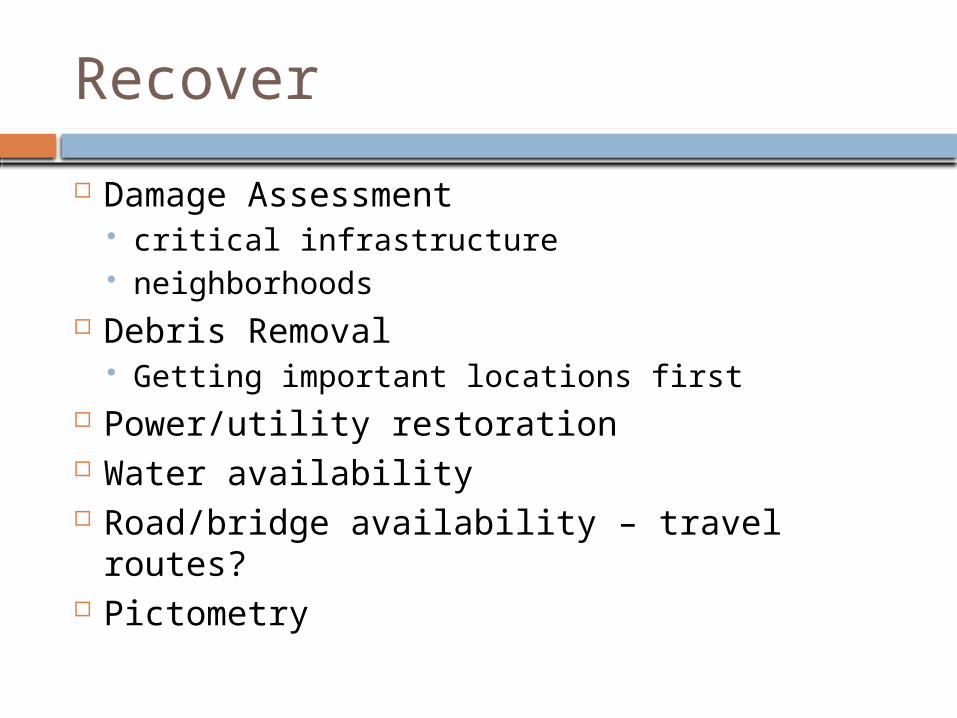
Recover
Damage Assessment critical infrastructure neighborhoods
Debris Removal Getting important locations first
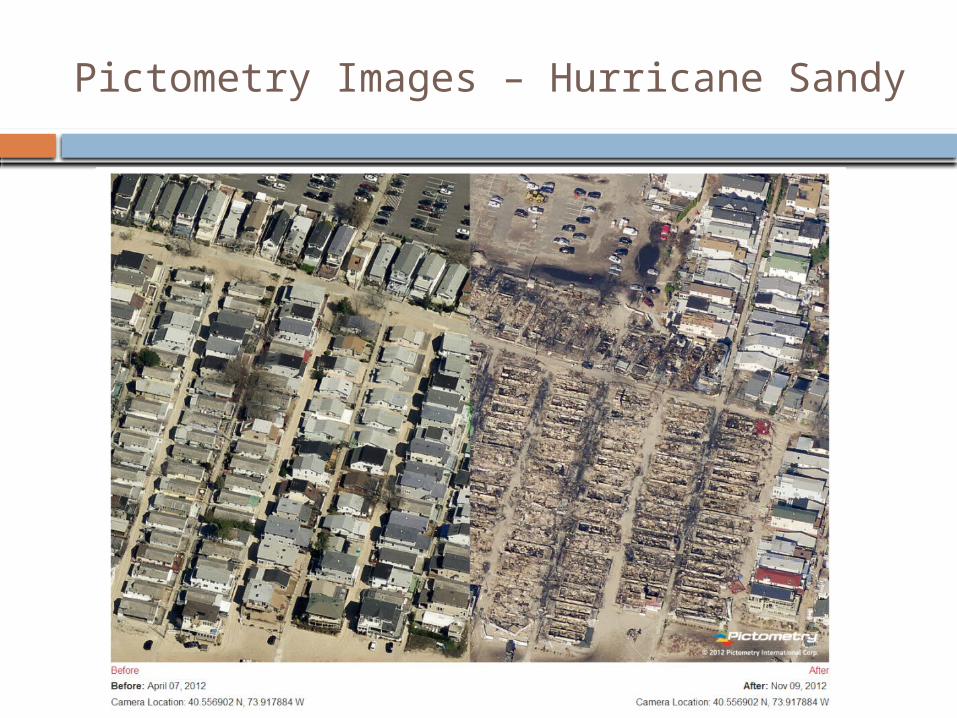
Power/utility restoration Water availability Road/bridge availability – travel routes? Pictometry
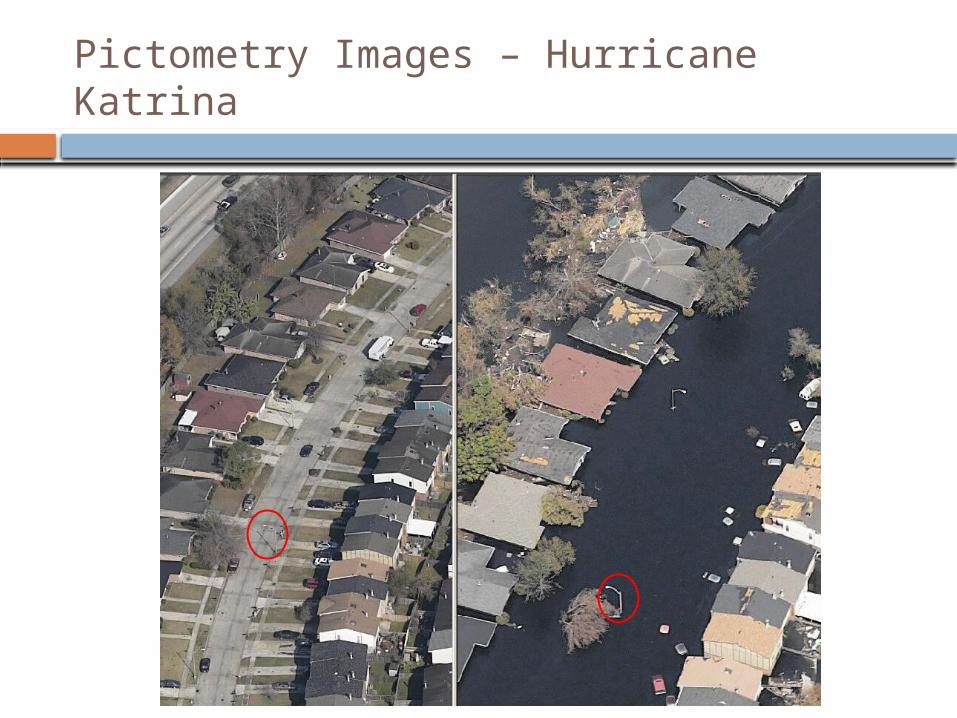
Pictometry Images – Hurricane Katrina
Emergency Management Cycle
Preparedness
Recover
Mitigation Response
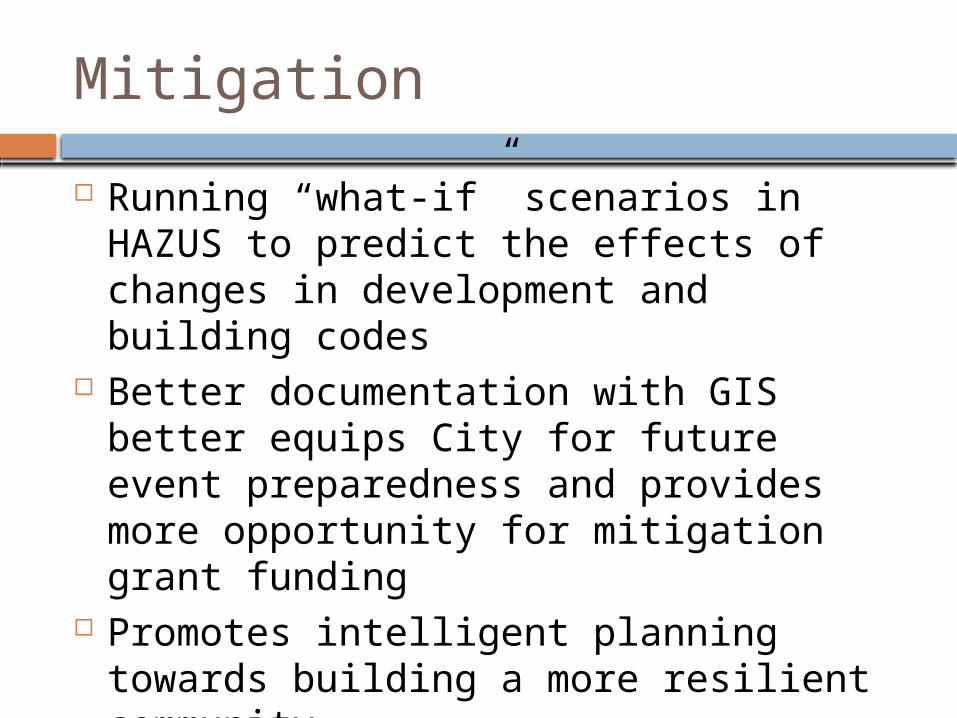
Mitigation
Running “what-if” scenarios in HAZUS to predict the effects of changes in development and building codes
Better documentation with GIS better equips City for future event preparedness and provides more opportunity for mitigation grant funding
Promotes intelligent planning towards building a more resilient community
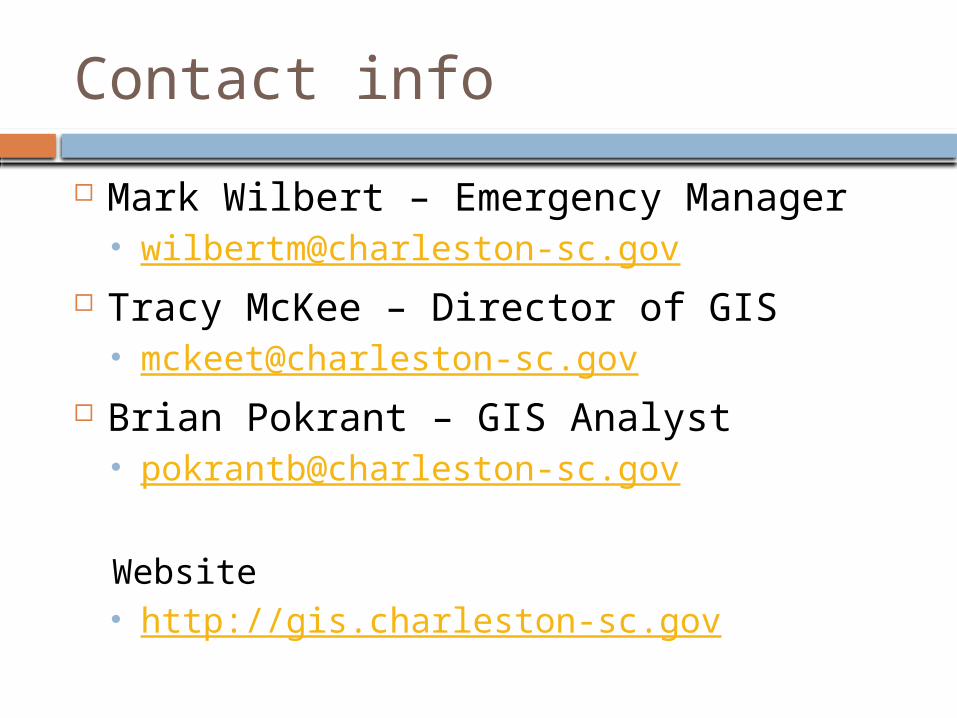
Contact info
Mark Wilbert – Emergency Manager [email protected]
Tracy McKee – Director of GIS [email protected]
Brian Pokrant – GIS Analyst [email protected]
Website http://gis.charleston-sc.gov