Embed Size (px)
Citation preview
GIS IN ECOLOGY:
EDITING AND CREATING
LAYERS
Editing and Creating Layers December 2013
Contents Introduction ...................................................... 2
ArcMap’s Editor Toolbar .............................. 3 Data Sources ............................................... 4
Tasks ............................................................... 4 Copying the Course Dataset ........................ 4 Map document setup ................................... 5 Adding XY data and updating tree (point) features ....................................................... 5 Creating trail (line) features .......................... 7 ‘Spaghetti’ digitizing of landcover features ... 9 Building polygons from polylines ................ 12
APPENDIX A: Directly editing polygons ......... 13 APPENDIX B: Editing with topology............... 15 APPENDIX C: Excerpts from help files .......... 16 This is an applied course on how to use ESRI’s ArcGIS software to edit existing features and create new vector layers. This short course is less instructive than the others, and is essentially a hands-on workshop in which you practice interpreting imagery and using various tools for creating new data and editing existing data. Do keep in mind that what is presented here is not the end-all-be-all methodology; there is much more functionality available. Excellent learning options are available through ESRI’s Online Training courses, workshops and training seminars: Learning ArcGIS – Module 5: Creating and Editing Data www.biology.ualberta.ca/facilities/gis/index.php?Page=484#virtualcampus
References: Pfaff, Rhonda, Bob Booth, Jeff Shaner, Scott Crosier, Phil
Sanchez, and Andy MacDonald. 2004. “Editing in ArcMap.” Environmental Systems Research
Institute, Inc. Redlands, CA. Anderson, J.R., Hardy, E.E., Roach, J.T., and Witmer,
R.E. 1976. A Land Use and Landcover Classification for use with Remote Sensor Data. United States Department of the Interior, u.S. geological Survey. Professional paper 964. 41 pages. Available online: http://landcover.usgs.gov/pdf/anderson.pdf
Image interpretation: http://www.ccrs.nrcan.gc.ca/resource/tutor/fundam/chapter4/02_e.php
Lillesand, T.M. and Kiefer, R.W. 2000. Remote Sensing and Image Interpretation, 4th edition. John Wiley and Sons, Inc. Toronto, Canada. 724 pages.
GIS in Ecology is sponsored by the Alberta Cooperative Conservation Research Unit
http://www.biology.ualberta.ca/accru
Editing and Creating Layers December 2013
GIS IN ECOLOGY:
EDITING AND CREATING
LAYERS
Introduction
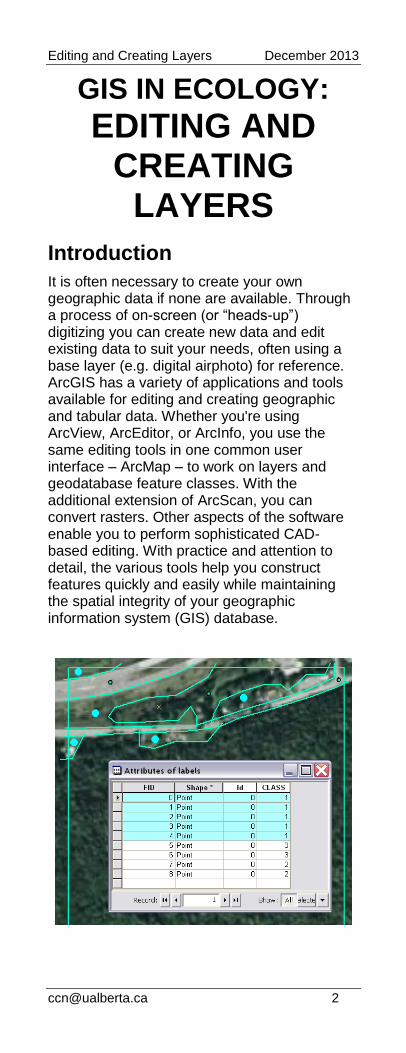
It is often necessary to create your own geographic data if none are available. Through a process of on-screen (or “heads-up”) digitizing you can create new data and edit existing data to suit your needs, often using a base layer (e.g. digital airphoto) for reference. ArcGIS has a variety of applications and tools available for editing and creating geographic and tabular data. Whether you're using ArcView, ArcEditor, or ArcInfo, you use the same editing tools in one common user interface – ArcMap – to work on layers and geodatabase feature classes. With the additional extension of ArcScan, you can convert rasters. Other aspects of the software enable you to perform sophisticated CAD-based editing. With practice and attention to detail, the various tools help you construct features quickly and easily while maintaining the spatial integrity of your geographic information system (GIS) database.
Editing and Creating Layers December 2013
There are several parts to the digitizing exercises, and the basic steps involve:
Determine the classification scheme needed for the type of ecology analyses – this may be modeled after the USGS (Anderson et al., 1976) system, another system, or simplified to 1 = built-up (road, urban, etc), 2 = water, 3 = forest, 4 = other vegetation (TIP: Use integer numbers for class codes to help reduce data-entry errors!)
Acquire appropriate imagery and learn the elements of image interpretation: shape, size, pattern, tone/hue, texture, shadows, site, association, and resolution
Decide on a minimum mapping unit and trace boundaries between the different land cover classes until the entire study area is completely classified
Edit/modify as required
ArcMap’s Editor Toolbar To edit or create data in ArcMap, you perform the following general steps: 1. Create a new ArcMap document or open an
existing one 2. Add any existing layer you want to edit to
your map Or, set up a new feature class layer that will contain your new data
3. Display the EDITOR TOOLBAR 4. Start an edit session 5. Set the environment (snapping, topology,
etc.) 6. Create or modify features and/or their
attributes through interpretation of the underlying base imagery
7. Stop your edit session and save your edits Sounds easy enough! The trick is mastering the tools and settings in the Editor toolbar. To create a new vector feature in ArcMap, you start an edit session to work on an edit sketch. An edit sketch is composed of vertices (the points at which the sketch changes direction such as corners) and segments (the lines that connect the vertices). You create a sketch using the sketch construction tools located on the tool palette. To edit existing features you access the same tools.
Editing and Creating Layers December 2013
It takes practice to become proficient at:
creating new digital vector features where none existed before (or perhaps cost too much for your grant to acquire), and
modifying existing data to make them more accurate or reflect changes over time.
Start reading up on all the functionality available to you in the ArcGIS Desktop help topic entitled “An overview of editing and data compilation.”
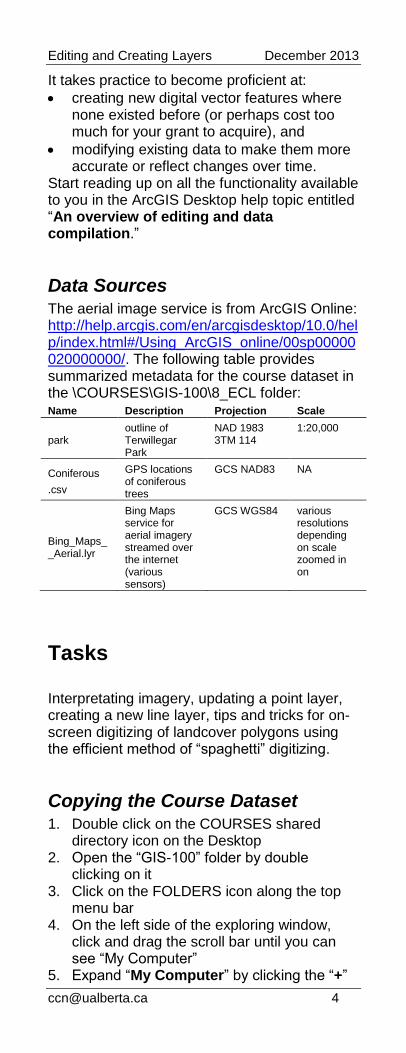
Data Sources The aerial image service is from ArcGIS Online: http://help.arcgis.com/en/arcgisdesktop/10.0/help/index.html#/Using_ArcGIS_online/00sp00000020000000/. The following table provides summarized metadata for the course dataset in the \COURSES\GIS-100\8_ECL folder: Name Description Projection Scale
park outline of Terwillegar Park
NAD 1983 3TM 114
1:20,000
Coniferous
.csv
GPS locations of coniferous trees
GCS NAD83 NA
Bing_Maps__Aerial.lyr
Bing Maps service for aerial imagery streamed over the internet (various sensors)
GCS WGS84 various resolutions depending on scale zoomed in on
Tasks
Interpretating imagery, updating a point layer, creating a new line layer, tips and tricks for on-screen digitizing of landcover polygons using the efficient method of “spaghetti” digitizing.
Copying the Course Dataset 1. Double click on the COURSES shared
directory icon on the Desktop 2. Open the “GIS-100” folder by double
clicking on it 3. Click on the FOLDERS icon along the top
menu bar 4. On the left side of the exploring window,
click and drag the scroll bar until you can see “My Computer”
5. Expand “My Computer” by clicking the “+”
Editing and Creating Layers December 2013
6. Expand “Local Disk (C:)” by clicking the “+” 7. Click and drag the “8_ECL” folder to the
C:\WorkSpace directory 8. Once all the files have copied over, close
the exploring window
Map document setup To get familiar with the general editing steps and basic tools in the Editor toolbar, you will work with points, lines, and polygons in the following exercises for a portion of the City of Edmonton’s river valley. 1. Start a new blank map document in
ARCMAP 2. Add the Park.lyr file FIRST – so the data
frame coordinate system is set same as this 3. Add the Bing_Maps__Aerial.lyr file
Adding XY data and updating tree (point) features In this example, you are asked to update a tree inventory for a site along the North Saskatchewan River. Previous work was done to collect spatial data for coniferous trees using a GPS receiver and now you will add these data and digitize additional point locations for the deciduous trees in the same area. The existing tree inventory is in tabular form with X and Y locations – add these and convert to spatial format for editing. 1. Choose FILE >>> ADD DATA >>> ADD XY
DATA 2. Navigate to your working directory and
select Coniferous.csv 3. Set the appropriate fields and EDIT the
spatial reference: GCS_North_American_1983
4. Once the event layer displays in the view, right click on Coniferous Event and choose DATA >>> EXPORT DATA
5. Select “Use same Coordinate System as the data frame”
6. Save as type: “File and personal geodatabase classes”
7. Specify an output name in your working directory; e.g. \Terwillegar.gdb\tree_inventory
8. Click YES to add the new layer to the map document
9. Right click on Coniferous Event and choose REMOVE
Editing and Creating Layers December 2013
10. Right click on tree_inventory and choose ZOOM TO LAYER
Because you are digitizing new features, it is wise to calculate values for each type or category. Add a field to use in indicating whether a feature is ‘coniferous’ or ‘deciduous.’ See ArcGIS Desktop Help for more details. 11. Right click on tree_inventory and choose
OPEN ATTRIBUTE TABLE 12. Choose OPTIONS >>> ADD FIELD 13. Specify NAME: TYPE, TYPE: Text,
LENGTH: 12 14. Click OK 15. Right click on the TREE attribute heading,
click FILED CALCULATOR, and type “Conifer”
Now it is time to start adding new point features where there are deciduous trees. Take a moment to visually inspect the site and note the appearance of the two types of trees. Note shape, shadow, tone, etc. and apply the techniques of manual image interpretation. 16. Click the EDITOR TOOLBAR button to
display the toolbar 17. Choose EDITOR >>> START EDITING 18. Select the folder that contains the
tree_inventory layer and click OK 19. In the Create Features dialog window, click
on the tree_inventory layer name to select this layer for editing
20. Hold the mouse cursor over the base of a deciduous tree and click to insert a point
21. Repeat clicking the mouse over each of the trees until all deciduous sites are digitized
You can be sure that there is uncertainty over the location of each individual tree site. Also, make note of the MAP SCALE that you are zoomed in at when creating the points. 22. Choose EDITOR >>> SAVE EDITS 23. If you wish to adjust a location, click on the
EDIT tool, click to select the feature, and then click and drag the point to a new position
24. SELECT all new features; i.e. select by attributes where "TYPE" IS NULL
25. Right click on the TYPE attribute heading and CALCULATE the string “Deciduous”
26. Choose EDITOR >>> STOP EDITING 27. Click YES to save your edits 28. SYMBOLIZE tree_inventory by showing
the TYPE field as unique values 29. CHALLENGE: Update the attribute table
with projected X- and Y-field coordinates!
Editing and Creating Layers December 2013
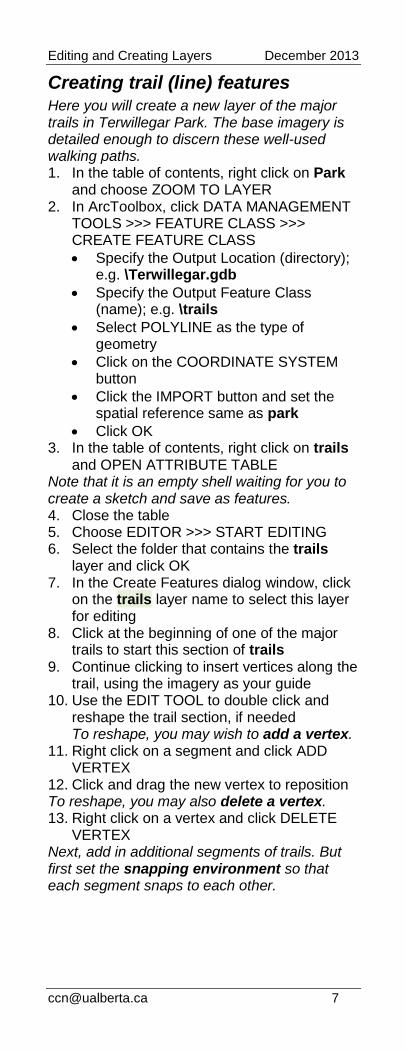
Creating trail (line) features Here you will create a new layer of the major trails in Terwillegar Park. The base imagery is detailed enough to discern these well-used walking paths. 1. In the table of contents, right click on Park
and choose ZOOM TO LAYER 2. In ArcToolbox, click DATA MANAGEMENT
TOOLS >>> FEATURE CLASS >>> CREATE FEATURE CLASS
Specify the Output Location (directory); e.g. \Terwillegar.gdb
Specify the Output Feature Class (name); e.g. \trails
Select POLYLINE as the type of geometry
Click on the COORDINATE SYSTEM button
Click the IMPORT button and set the spatial reference same as park
Click OK 3. In the table of contents, right click on trails
and OPEN ATTRIBUTE TABLE Note that it is an empty shell waiting for you to create a sketch and save as features. 4. Close the table 5. Choose EDITOR >>> START EDITING 6. Select the folder that contains the trails
layer and click OK 7. In the Create Features dialog window, click
on the trails layer name to select this layer for editing
8. Click at the beginning of one of the major trails to start this section of trails
9. Continue clicking to insert vertices along the trail, using the imagery as your guide
10. Use the EDIT TOOL to double click and reshape the trail section, if needed To reshape, you may wish to add a vertex.
11. Right click on a segment and click ADD VERTEX
12. Click and drag the new vertex to reposition To reshape, you may also delete a vertex. 13. Right click on a vertex and click DELETE
VERTEX Next, add in additional segments of trails. But first set the snapping environment so that each segment snaps to each other.
Editing and Creating Layers December 2013
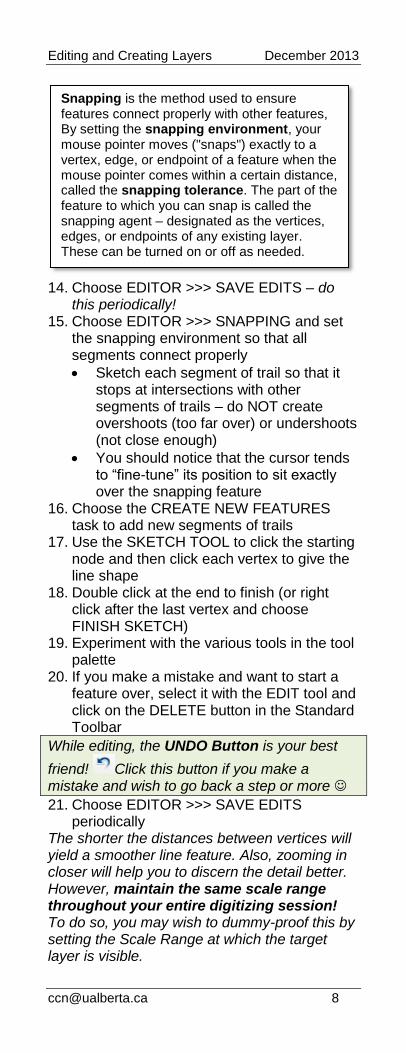
14. Choose EDITOR >>> SAVE EDITS – do this periodically!
15. Choose EDITOR >>> SNAPPING and set the snapping environment so that all segments connect properly
Sketch each segment of trail so that it stops at intersections with other segments of trails – do NOT create overshoots (too far over) or undershoots (not close enough)
You should notice that the cursor tends to “fine-tune” its position to sit exactly over the snapping feature
16. Choose the CREATE NEW FEATURES task to add new segments of trails
17. Use the SKETCH TOOL to click the starting node and then click each vertex to give the line shape
18. Double click at the end to finish (or right click after the last vertex and choose FINISH SKETCH)
19. Experiment with the various tools in the tool palette
20. If you make a mistake and want to start a feature over, select it with the EDIT tool and click on the DELETE button in the Standard Toolbar
While editing, the UNDO Button is your best
friend! Click this button if you make a mistake and wish to go back a step or more
21. Choose EDITOR >>> SAVE EDITS periodically
The shorter the distances between vertices will yield a smoother line feature. Also, zooming in closer will help you to discern the detail better. However, maintain the same scale range throughout your entire digitizing session! To do so, you may wish to dummy-proof this by setting the Scale Range at which the target layer is visible.
Snapping is the method used to ensure features connect properly with other features, By setting the snapping environment, your mouse pointer moves ("snaps") exactly to a vertex, edge, or endpoint of a feature when the mouse pointer comes within a certain distance, called the snapping tolerance. The part of the feature to which you can snap is called the snapping agent – designated as the vertices, edges, or endpoints of any existing layer. These can be turned on or off as needed.
Editing and Creating Layers December 2013
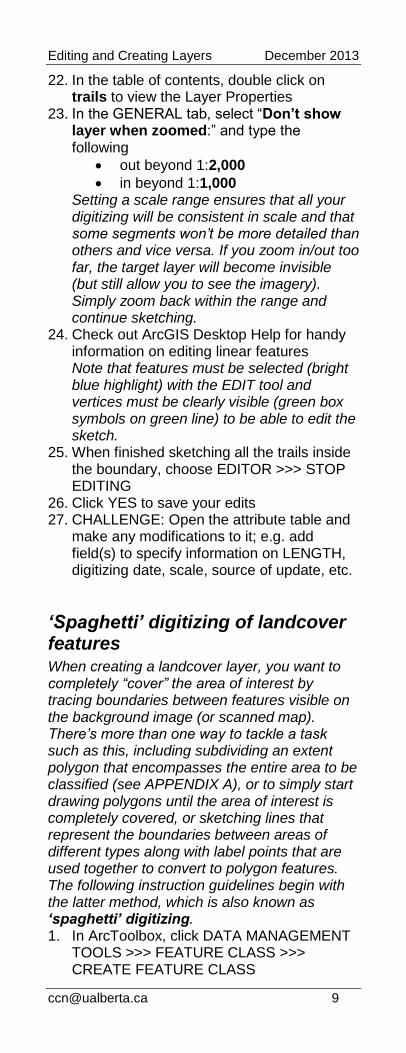
22. In the table of contents, double click on trails to view the Layer Properties
23. In the GENERAL tab, select “Don’t show layer when zoomed:” and type the following
out beyond 1:2,000
in beyond 1:1,000 Setting a scale range ensures that all your digitizing will be consistent in scale and that some segments won’t be more detailed than others and vice versa. If you zoom in/out too far, the target layer will become invisible (but still allow you to see the imagery). Simply zoom back within the range and continue sketching.
24. Check out ArcGIS Desktop Help for handy information on editing linear features Note that features must be selected (bright blue highlight) with the EDIT tool and vertices must be clearly visible (green box symbols on green line) to be able to edit the sketch.
25. When finished sketching all the trails inside the boundary, choose EDITOR >>> STOP EDITING
26. Click YES to save your edits 27. CHALLENGE: Open the attribute table and
make any modifications to it; e.g. add field(s) to specify information on LENGTH, digitizing date, scale, source of update, etc.
‘Spaghetti’ digitizing of landcover features When creating a landcover layer, you want to completely “cover” the area of interest by tracing boundaries between features visible on the background image (or scanned map). There’s more than one way to tackle a task such as this, including subdividing an extent polygon that encompasses the entire area to be classified (see APPENDIX A), or to simply start drawing polygons until the area of interest is completely covered, or sketching lines that represent the boundaries between areas of different types along with label points that are used together to convert to polygon features. The following instruction guidelines begin with the latter method, which is also known as ‘spaghetti’ digitizing. 1. In ArcToolbox, click DATA MANAGEMENT
TOOLS >>> FEATURE CLASS >>> CREATE FEATURE CLASS
Editing and Creating Layers December 2013
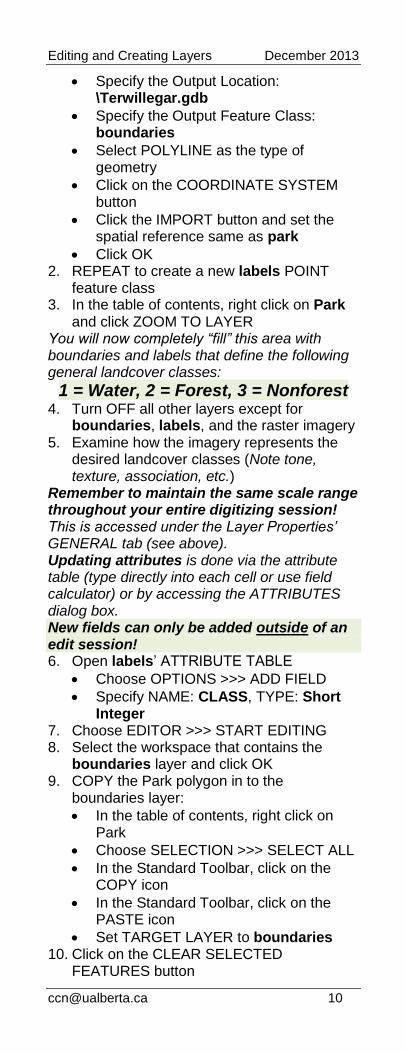
Specify the Output Location: \Terwillegar.gdb
Specify the Output Feature Class: boundaries
Select POLYLINE as the type of geometry
Click on the COORDINATE SYSTEM button
Click the IMPORT button and set the spatial reference same as park
Click OK 2. REPEAT to create a new labels POINT
feature class 3. In the table of contents, right click on Park
and click ZOOM TO LAYER You will now completely “fill” this area with boundaries and labels that define the following general landcover classes:
1 = Water, 2 = Forest, 3 = Nonforest 4. Turn OFF all other layers except for
boundaries, labels, and the raster imagery 5. Examine how the imagery represents the
desired landcover classes (Note tone, texture, association, etc.)
Remember to maintain the same scale range throughout your entire digitizing session! This is accessed under the Layer Properties’ GENERAL tab (see above). Updating attributes is done via the attribute table (type directly into each cell or use field calculator) or by accessing the ATTRIBUTES dialog box. New fields can only be added outside of an edit session! 6. Open labels’ ATTRIBUTE TABLE
Choose OPTIONS >>> ADD FIELD
Specify NAME: CLASS, TYPE: Short Integer
7. Choose EDITOR >>> START EDITING 8. Select the workspace that contains the
boundaries layer and click OK 9. COPY the Park polygon in to the
boundaries layer:
In the table of contents, right click on Park
Choose SELECTION >>> SELECT ALL
In the Standard Toolbar, click on the COPY icon
In the Standard Toolbar, click on the PASTE icon
Set TARGET LAYER to boundaries 10. Click on the CLEAR SELECTED
FEATURES button
Editing and Creating Layers December 2013
11. In the Create Features dialog, click on the boundaries layer name
12. Start modifying the sketch including data entry in the labels’ CLASS field for each record:
Use similar methods to trace boundaries as you did when creating trails line segments except ensure that the line segments grossly overlap (dangle)
When an area is completely enclosed by polylines (NO undershoots – there must be visible overlap), click on the labels layer name (in the Create Features dialog)
Click to create a point in the middle of the enclosed area
Click the ATTRIBUTES button to show the dialog window and type the CLASS value for the new point while it is still selected
Switch to the CREATE FEATURES tab (optionally, dock the ATTRIBUTES dialog window in a different location)
REPEAT tracing boundaries and creating labels (alternately click on each in the CREATE FEATURES dialog window)
13. SAVE EDITS periodically 14. Choose EDITOR >>> STOP EDITING when
finished 15. Click YES to save any edits Sketch on your own to create as many boundaries and labels in the short course time. SAVE, SAVE… ...Save yourself from insanity by saving your edits OFTEN. If something can go wrong, it will. So rather than having to redo several hours of editing, choose EDITOR >>> SAVE EDITS as often as you can remember! Probably bordering on paranoia, but an additional suggestion is to save a COPY of the shapefile after each edit session. Stop editing and in the table of contents, right click on the name and choose DATA >>> EXPORT DATA to save as filename_todaysdate.shp. Then if the main file is somehow corrupted, you only need to restart from the latest COPY.
Editing and Creating Layers December 2013
Building polygons from polylines This next step (A or B) depends on access to an ArcInfo license.
A. ArcInfo method
1. In ArcToolbox, click DATA MANAGEMENT TOOLS >>> FEATURES >>> FEATURE TO POLYGON
2. Specify the following:
Input Features: boundaries
Output Feature Class: \Terwillegar.gdb\landcover
CHECK to preserve attributes
Label Features: labels
Click OK
B. ArcView method
Requires Jenness Enterprises’ Graphics and Shapes extension was installed prior to opening ArcMap. 1. Choose GRAPHICS AND SHAPES >>>
BUILD POLYGONS FROM POLYLINES 2. Specify the following:
Select Polyline Layer to Convert: boundaries
Specify an output layer
Check ‘Transfer Label Point Attributes’ for labels
Click OK This handy Graphics and Shapes extension can be downloaded for free at: www.jennessent.com/arcgis/shapes_graphics.htm
Inspect the output polygons
3. Examine the resulting polygon layer by symbolizing on the CLASS field
4. OPEN ATTRIBUTE TABLE for landcover to ensure all values are appropriate
5. Edit further as necessary – this may involve editing the original boundaries and labels, then converting to polygon again OR see the APPENDICES for other methods
Editing and Creating Layers December 2013
APPENDIX A: Directly editing polygons
The tasks you will likely use the most for this method are: sketching and then clipping “island” polygons of one class out of the entire park boundary, selecting and then cutting polygon features. Additional information is provided for auto-completing polygons that you want to append to existing features, along with the importance of topology when editing contiguous edges. 1. In the table of contents, double click on
Landcover.shp and change the SYMBOLOGY to facilitate sketching; suggestions include:
Show all features as a HOLLOW symbol with a contrasting colored outline OR
Show all features as a colored hatch symbol OR
Show unique values for each CLASS, and DISPLAY Transparency ~50%
Clipping out “island” polygons
Digitizing non-contiguous polygons is as simple as creating line features except that the sketch closes on itself to complete an area. However, there is a slight trick to cutting out “islands” inside the larger polygons. 2. Select the polygon layer symbol patch in the
Create Features dialog 3. Click anywhere on the edge of an interior
water polygon to start the polygon 4. Move the mouse pointer to where you want
to place a vertex 5. Click the mouse button to set the vertex 6. Move the mouse pointer to where you want
to place the next vertex 7. Click the mouse button to set the vertex 8. Continue moving and clicking along the
water boundary until you have “traced” it 9. FINISH the polygon by
Double clicking on the last vertex (does not need to be the starting node)
Right clicking and selecting FINISH SKETCH
10. While the “island” polygon is still selected (highlighted), choose EDITOR >>> CLIP
11. Select the second option “Discard the area that intersects”
12. Click OK 13. In the Attributes dialog, or the attribute
table, enter the CLASS value: 1
Editing and Creating Layers December 2013
14. Sketch and clip out any other “island” polygons
15. SAVE EDITS periodically 16. Update the ATTRIBUTES as needed 17. Choose EDITOR >>> STOP EDITING when
finished 18. Click YES to save any edits 19. Open the attribute table and make any
modifications to it; e.g. add field(s) to specify information on digitizing date, scale, source of update, etc.
Cutting polygon features:
20. Use the SELECT FEATURES tool on the Tools toolbar and click anywhere on the polygon you wish to divide to select it
21. Choose the CUT POLYGONS TOOL on the Editor toolbar
22. Click anywhere outside of the selected polygon to start the dividing edge sketch (there must be overlap)
23. Continue clicking and moving the mouse cursor to outline the edge
24. Double click outside the selected polygon to finish the sketch to cut the polygon (there must be overlap)
25. Update the ATTRIBUTES as needed - in the Attributes dialog, or the attribute table, enter the CLASS value
Auto-complete polygon:
Perhaps you wish to append the sandy shore of the river valley onto your park boundary. There are a couple ways to this. One is to create a new feature that outlines the extra area and then use the union, merge, or clip functionality of the EDITOR menu. The auto complete polygon task is explained below: 26. Select the polygon layer symbol patch in the
Create Features dialog 27. Click the AUTO COMPLETE POLYGON
task under Construction Tools (below the Create Features templates)
28. Click anywhere inside the boundary of the existing polygon area to be appended to and start sketching it – click a couple vertices until you reach the other edge of an existing polygon (there must be overlap)
29. Double click inside the existing polygon’s edge to FINISH the sketch (overlap!)
30. Update the ATTRIBUTES as needed - in the Attributes dialog, or the attribute table, enter the CLASS value
Editing and Creating Layers December 2013
APPENDIX B: Editing with topology
Sometimes, you need to edit the shape of a feature that is spatially related to another feature – this will affect the other feature's shape. To maintain the integrity of your database, it's important to maintain feature spatial relationships when editing. With map topology you can edit spatially related features simultaneously (as long as they are in the same working directory). 31. Choose EDITOR >>> MORE EDITING
TOOLS >>> TOPOLOGY 32. While in an edit session, the MAP
TOPOLOGY button is active – click on it See ArcGIS Desktop Help for more details.
33. Specify the layers you want to participate in the topology; i.e. check beside the polygons
In this example, only the Landcover layer is required. However, you may want any changes you make to its outline to be reflected in the original boundary layer. 34. Click the TOPOLOGY EDIT tool 35. Double click on the shared boundary you
wish to edit – nodes will become visible 36. Make whichever of the following edits that
apply: 37. Right click and DELETE VERTEX or
INSERT VERTEX 38. Click and drag any node you wish to
reposition 39. Be careful not to reposition the entire
feature – unless that is what you wish to do 40. Choose EDITOR >>> SAVE EDITS Always use the TOPOLOGY EDIT tool for any contiguous polygon editing! These are just a few suggestions on how to apply some of the construction tools and editing functionality. Experiment with others and definitely read the ArcGIS Desktop Help.
Remember to create metadata and related documentation for your finished shapefiles! Include info on the base data used, date, limitations to use, attribute data dictionary, etc.
Editing and Creating Layers December 2013
APPENDIX C: Excerpts from help files
Read through help files starting with: help.arcgis.com/en/arcgisdesktop/10.0/help/index.html#/What_is_editing/001t00000001000000/ help.arcgis.com/en/arcgisdesktop/10.0/help/index.html#/Essential_editing_vocabulary/001t00000003000000/ help.arcgis.com/en/arcgisdesktop/10.0/help/index.html#/Introduction_to_the_Editing_tutorial/001t00000018000000/ help.arcgis.com/en/arcgisdesktop/10.0/help/index.html#/Reshaping_a_line/001t0000002t000000/ help.arcgis.com/en/arcgisdesktop/10.0/help/index.html#/Reshaping_a_polygon_to_match_another_feature/001t00000039000000/
While in sketch mode, right-click to display the sketch context menu. Close the context menu by pressing the Esc key.
Use the EDIT tool to double click on a feature to expose its vertices. Be careful to to accidentally move/shift features.
Delete a single vertex (or point) from a sketch: center the EDIT tool pointer over the vertex until the pointer changes. Right-click, then click DELETE VERTEX (or DELETE).
Delete the entire sketch of the feature you're creating: position the pointer over any part of the sketch, right-click, and click DELETE SKETCH or press Ctrl + Num Del.
Finish a sketch: you can double-click on the last vertex of the feature, or right-click and click FINISH SKETCH, or press F2.
Undo the last vertex: click the UNDO button on the ArcMap Standard toolbar. Click the button again to undo the second-to-last vertex you created, and so on. Click the REDO button to re-add the vertex.
You can add to the shape of a line or polygon feature to the sketch by right-clicking over the feature in sketch mode and clicking REPLACE SKETCH. The sketch will contain the shape of the feature you clicked over.
To square up a polyline or polygon, digitize at least two segments and then right-click anywhere on the map and click SQUARE AND FINISH.
You can also create lines and polygons with the mouse using stream mode digitizing.
Use the snapping environment to help you create points or vertices at more exact locations relative to other features.