Embed Size (px)
Citation preview
DEPARTMENT OF GEOGRAPHY UNIVERSITY OF COLOMBO
i
GIS MANUAL – VOLUME I
2016
DEPARTMENT OF GEOGRAPHY
UNIVERSITY OF COLOMBO L. Manawadu
V.P.I.S. Wijeratne
S.M.A.T. Nandaseela
P. Ranasinghe
M.A.D. Samanmali
DEPARTMENT OF GEOGRAPHY UNIVERSITY OF COLOMBO
ii
TABLE OF CONTENT
01 INTRODUCTION TO GIS 01
1.1.Introduction 01
1.2.Definition and Overview 01
1.3.History and Concept of GIS 02
1.4.Basic Components of GIS 04
1.5.GIS Functions 09
1.6 Applications of GIS 12
1.6.Trends in GIS 15
02 INTRODUCTION TO ARCGIS 18
2.1.Introduction to ArcGIS 18
2.2..Extension for ArcGIS Desktop 19
2.3.Components of ArcGIS Desktop 20
2.4.Common ArcGIS File Types 20
2.5.Important Term Words in ArcGIS 21
2.6.Working with ArcMap 10.1 23
2.7.ArcMap 10.1 Geographical User Interface (GUI) 24
2.8.Save Map Document 27
2.9.What is ArcCatalog Window? 27
03 WORKING WITH ARCMAP DATA 31
3.1. Adding Data though ArcMap 31
3.2. Identifying Attributes of Features 32
3.3. Selecting Features 32
3.4. Labeling 34
3.5. Setting Map Units and Display Units 34
3.6. Changing Map Symbol 35
04 WORKING WITH MAP PROJECTION 45
4.1. Georeferencing Image 45
4.2. Working with Projection 47
05 SCREEN DIGITIZING AND TABLE EDITING 51
5.1. Create a shapefile 51
5.2. On-Screen Digitizing 52
5.3. Attribute Table Editing 55
06 DESIGNING MAP LAYOUTS 64
6.1. Layout View 64
6.2. Saving Map Layout 70
07 GEOPROCESSING 71
7.1. Merge 72
7.2. Overlaying Analysis 73
7.3. Proximity Analysis 75
7.4. Selecting and Extracting Analysis 78
DEPARTMENT OF GEOGRAPHY UNIVERSITY OF COLOMBO
1
INTRODUCTION TO GIS
1.1 Introduction
Geographical Information Systems or GIS is highly demanded tool
in many fields of studies under decision making when comes to
planning. The concepts used in GIS are not alienated but modified
with digital approach to match the modern world to work with more
efficient and productive manner. Therefore, it is said that concepts of
GIS is like old wine in new bottle. Today, GIS is one of the most
powerful analytical tools in many research areas. The acronym GIS,
which stands for “Geographical Information System” came into
fashion around 1970. It offers number of different technologies,
processes and methods. It attached to many operations and also has
many applications related to Geography, Engineering, Hydrology,
Planning, Telecommunication, Transport, Forestry, and Business etc.
GIS can use any information with location or data represented in
spatially. The location can be expressed as latitude and longitude.
The system include data about people (population, income or
education), land (land-use types, streams, vegetation types and soil
types), sites
of factories, farms and schools or storm drains, road and electric
power lines etc. Therefore, GIS is very popular and important in the
field of research as well.
1.2 Definition and Overview
Many scholars define GIS in different ways. In general, GIS defines
as a computer based system for capturing, storing, analyzing,
interpreting and visualizing data of earth system.
CHAPTER ONE
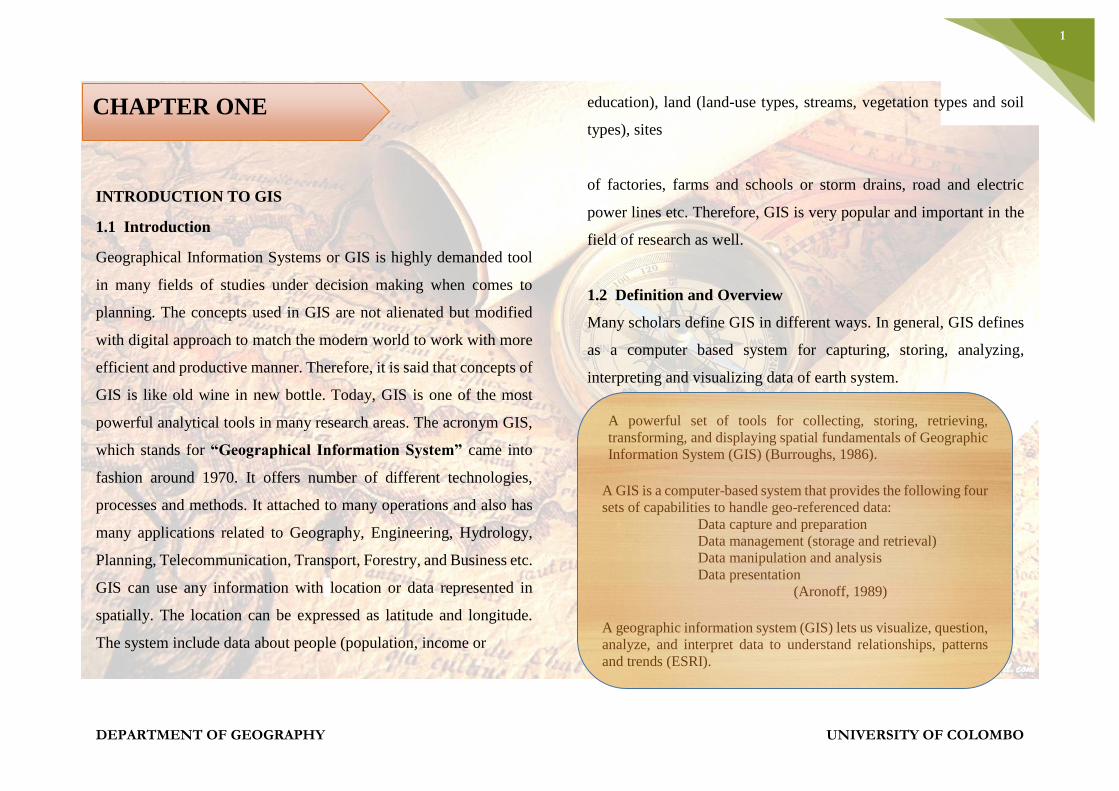
A powerful set of tools for collecting, storing, retrieving,
transforming, and displaying spatial fundamentals of Geographic
Information System (GIS) (Burroughs, 1986).
A GIS is a computer-based system that provides the following four
sets of capabilities to handle geo-referenced data:
Data capture and preparation
Data management (storage and retrieval)
Data manipulation and analysis
Data presentation
(Aronoff, 1989)
A geographic information system (GIS) lets us visualize, question,
analyze, and interpret data to understand relationships, patterns
and trends (ESRI).
DEPARTMENT OF GEOGRAPHY UNIVERSITY OF COLOMBO
2
1.3 History and Concept of GIS
GIS is not a new technology and it is a modern extension of
traditional cartography. There are some differences and some
similarities between cartography and GIS. Both GIS and cartography
attempt to represent phenomenon on the surface of the Earth in
“map” format. However, there are no limitations for data adding in
GIS and also spatial and statistical methods of analysis can be used
for representation with the combination of both spatial and aspatial
data.
The concepts in GIS are mostly derived from the spatial approach
along with analytical methods. The very first terminology in GIS is
used by Roger Tomlinson in 1869 in his publication "A Geographic
Information System for Regional Planning" (http://www.esri.com)
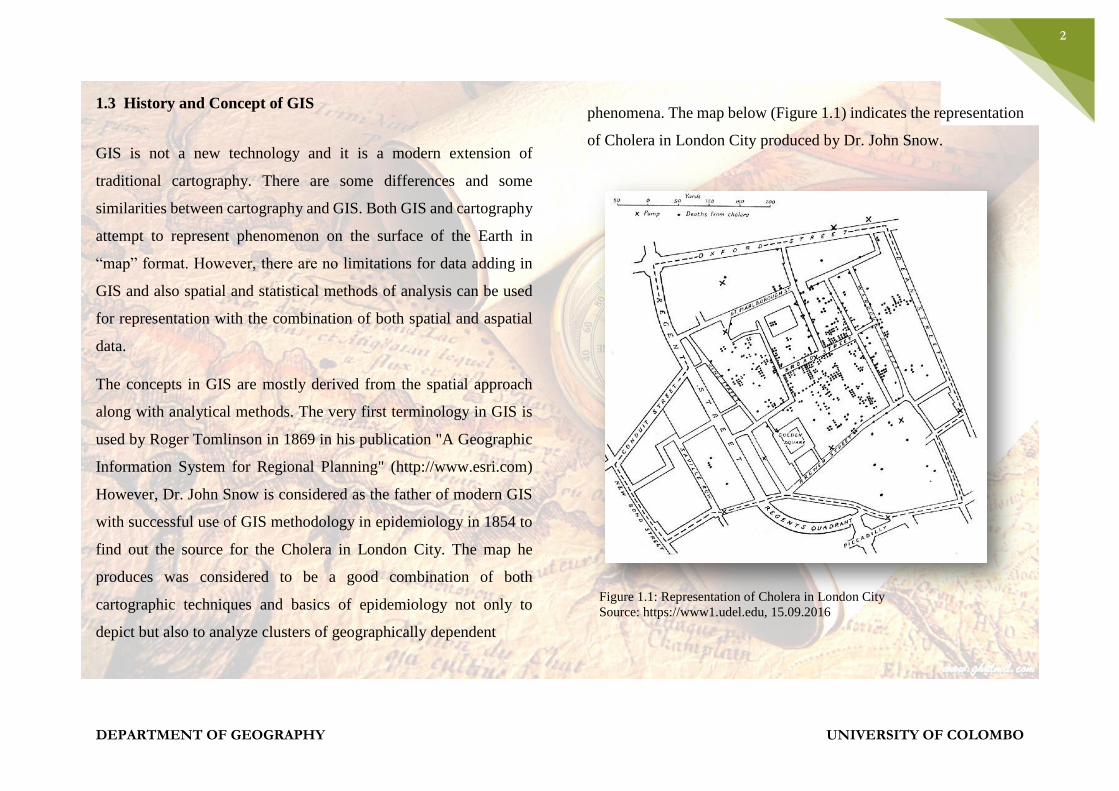
However, Dr. John Snow is considered as the father of modern GIS
with successful use of GIS methodology in epidemiology in 1854 to
find out the source for the Cholera in London City. The map he
produces was considered to be a good combination of both
cartographic techniques and basics of epidemiology not only to
depict but also to analyze clusters of geographically dependent
phenomena. The map below (Figure 1.1) indicates the representation
of Cholera in London City produced by Dr. John Snow.
Figure 1.1: Representation of Cholera in London City
Source: https://www1.udel.edu, 15.09.2016
DEPARTMENT OF GEOGRAPHY UNIVERSITY OF COLOMBO
3
With the development of photo zincography introduced by Sir Henry
James in the mid nineteenth century, allowed maps to be split into
layers. It helped the draughtsman to work with themes without any
confusion when making maps. This work was originally drawn on
glass plates but with the invention of plastic it become more easier
using less storage space and being less brittle, among others. Then
with the invention of the colour printer there were separate plates for
each colour. This method enabled the accurate reproduction of
images and originally used to create maps during the Ordnance
Survey of Great Britain during the 1850s. This is the first step of the
separate storage of layers in the GIS was originated.
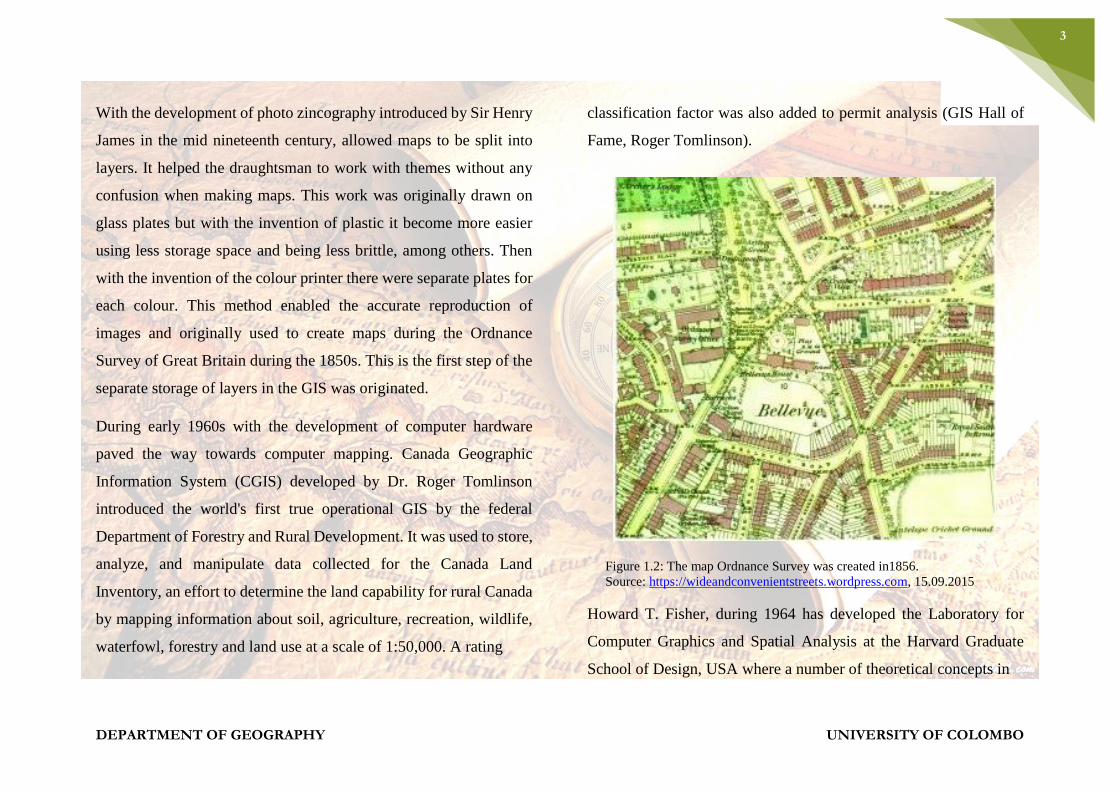
During early 1960s with the development of computer hardware
paved the way towards computer mapping. Canada Geographic
Information System (CGIS) developed by Dr. Roger Tomlinson
introduced the world's first true operational GIS by the federal
Department of Forestry and Rural Development. It was used to store,
analyze, and manipulate data collected for the Canada Land
Inventory, an effort to determine the land capability for rural Canada
by mapping information about soil, agriculture, recreation, wildlife,
waterfowl, forestry and land use at a scale of 1:50,000. A rating
classification factor was also added to permit analysis (GIS Hall of
Fame, Roger Tomlinson).
Figure 1.2: The map Ordnance Survey was created in1856.
Source: https://wideandconvenientstreets.wordpress.com, 15.09.2015
Howard T. Fisher, during 1964 has developed the Laboratory for
Computer Graphics and Spatial Analysis at the Harvard Graduate
School of Design, USA where a number of theoretical concepts in
DEPARTMENT OF GEOGRAPHY UNIVERSITY OF COLOMBO
4
spatial data handling was introduced and practiced. In 1970 it had
distributed seminal software code and systems, such as SYMAP,
GRID, and ODYSSEY that served as sources for subsequent
commercial development to universities, research centers and
corporations worldwide (Lovison Golob & Lucia, Harvard
University).
By the late 1970s two programmes known as MOSS and GRASS GIS
were introduced as public domain GIS systems. By the early 1980s,
M&S Computing (later Intergraph) along with Bentley Systems
Incorporated for the CAD platform, Environmental Systems
Research Institute (ESRI), CARIS (Computer Aided Resource
Information
System), MapInfo Corporation and ERDAS (Earth Resource Data
Analysis System) emerged as commercial vendors of GIS software,
successfully incorporating many of the GIS features, combining the
first generation approach to separation of spatial and attribute
information with a second generation approach to organizing
attribute data into database structures. (http://wiki.osgeo.org,
15.09.2016). Mapping Display and Analysis System (MIDAS) was
introduced in 1986 as the first desktop GIS product for the DOS
operating systems. It was renamed as MapInfo for Windows
operating system in 1990. By the end of 20th century with the
development of technology more developed platforms in both open
source and commercial were introduced. With the advancement of
the technology the applications of GIS has also been increased
rapidly and interdisciplinary approaches have introduced to the field
of GIS.
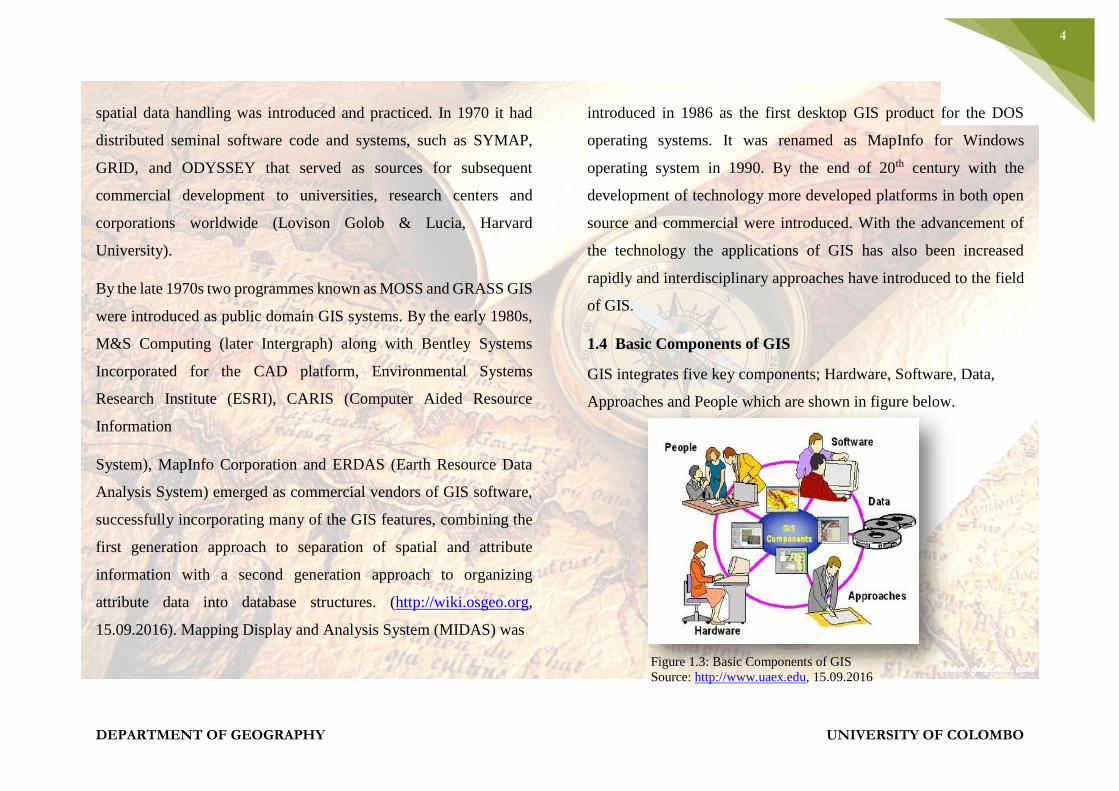
1.4 Basic Components of GIS
GIS integrates five key components; Hardware, Software, Data,
Approaches and People which are shown in figure below.
Figure 1.3: Basic Components of GIS
Source: http://www.uaex.edu, 15.09.2016
DEPARTMENT OF GEOGRAPHY UNIVERSITY OF COLOMBO
5

DEPARTMENT OF GEOGRAPHY UNIVERSITY OF COLOMBO
6

DEPARTMENT OF GEOGRAPHY UNIVERSITY OF COLOMBO
7

DEPARTMENT OF GEOGRAPHY UNIVERSITY OF COLOMBO
8

DEPARTMENT OF GEOGRAPHY UNIVERSITY OF COLOMBO
9

DEPARTMENT OF GEOGRAPHY UNIVERSITY OF COLOMBO
10

DEPARTMENT OF GEOGRAPHY UNIVERSITY OF COLOMBO
11

DEPARTMENT OF GEOGRAPHY UNIVERSITY OF COLOMBO
12

DEPARTMENT OF GEOGRAPHY UNIVERSITY OF COLOMBO
13

DEPARTMENT OF GEOGRAPHY UNIVERSITY OF COLOMBO
14

DEPARTMENT OF GEOGRAPHY UNIVERSITY OF COLOMBO
15

DEPARTMENT OF GEOGRAPHY UNIVERSITY OF COLOMBO
16

DEPARTMENT OF GEOGRAPHY UNIVERSITY OF COLOMBO
17
DEPARTMENT OF GEOGRAPHY UNIVERSITY OF COLOMBO
18
INTRODUCTION TO ARCGIS
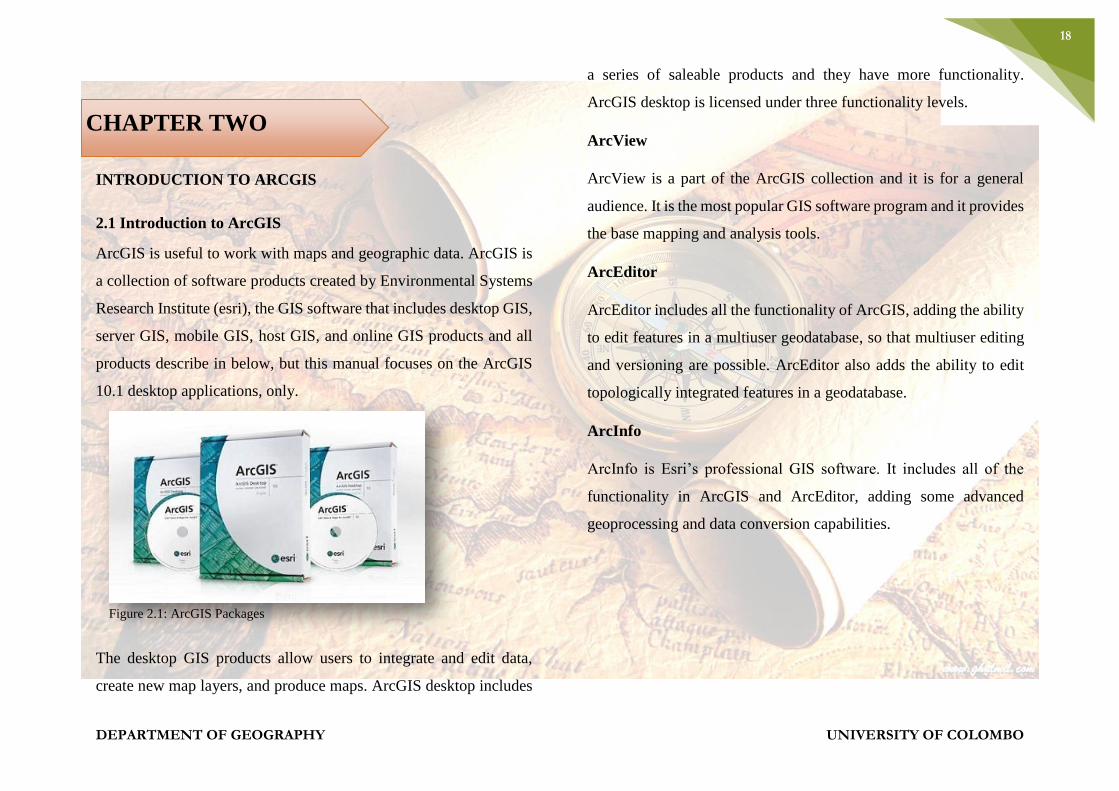
2.1 Introduction to ArcGIS
ArcGIS is useful to work with maps and geographic data. ArcGIS is
a collection of software products created by Environmental Systems
Research Institute (esri), the GIS software that includes desktop GIS,
server GIS, mobile GIS, host GIS, and online GIS products and all
products describe in below, but this manual focuses on the ArcGIS
10.1 desktop applications, only.
The desktop GIS products allow users to integrate and edit data,
create new map layers, and produce maps. ArcGIS desktop includes
a series of saleable products and they have more functionality.
ArcGIS desktop is licensed under three functionality levels.
ArcView
ArcView is a part of the ArcGIS collection and it is for a general
audience. It is the most popular GIS software program and it provides
the base mapping and analysis tools.
ArcEditor
ArcEditor includes all the functionality of ArcGIS, adding the ability
to edit features in a multiuser geodatabase, so that multiuser editing
and versioning are possible. ArcEditor also adds the ability to edit
topologically integrated features in a geodatabase.
ArcInfo
ArcInfo is Esri’s professional GIS software. It includes all of the
functionality in ArcGIS and ArcEditor, adding some advanced
geoprocessing and data conversion capabilities.
Figure 2.1: ArcGIS Packages
CHAPTER TWO
DEPARTMENT OF GEOGRAPHY UNIVERSITY OF COLOMBO
19
While these levels are crucial to consider when purchasing software,
it is also important to be aware of the limitation of the level you are
using.
ArcReader
It is a free product for viewing maps. It can explore and query data
layers. However, it cannot change symbology or create new data like
in ArcGIS Desktop. ArcReader is a good way to share the maps
which have created in ArcGIS with people who don’t have access to
the licensed software.
2.2 Extension for ArcGIS Desktop
This manual discusses about ArcGIS Desktop version and this
desktop product include large amount of functionality and
extensions. Some of extensions are very important for particular data
generate and analysis. Some analyst are;
Spatial Analyst
Use for modeling and raster (cell-based) analysis. Example:
Create density surfaces and conducting map algebra.
3D Analyst
Allows users to view, visualize and analyze spatial data in 3D
level. Example: Extruding polygons (such as parcels and building
footprints) and draping surfaces (such as orthophotos) on
elevation models.
Geostatistical Analyst
This sophisticated tool allows users to analyze raster (cell-based)
and point data using advanced statistical methods. Such as,
Kriging and inverse distance-weighting.
Network Analyst
Network-based analysis includes routing, determining closest
facility, or service areas. Networks can store information about
traffic flow, one-way streets, and travel time.
Tracking Analyst
Makes it possible to animate point data representing events at
discrete times and places. We can view events happening across
time and space using the “playback” feature.

DEPARTMENT OF GEOGRAPHY UNIVERSITY OF COLOMBO
20

DEPARTMENT OF GEOGRAPHY UNIVERSITY OF COLOMBO
21

DEPARTMENT OF GEOGRAPHY UNIVERSITY OF COLOMBO
22

DEPARTMENT OF GEOGRAPHY UNIVERSITY OF COLOMBO
23

DEPARTMENT OF GEOGRAPHY UNIVERSITY OF COLOMBO
24

DEPARTMENT OF GEOGRAPHY UNIVERSITY OF COLOMBO
25

DEPARTMENT OF GEOGRAPHY UNIVERSITY OF COLOMBO
26

DEPARTMENT OF GEOGRAPHY UNIVERSITY OF COLOMBO
27

DEPARTMENT OF GEOGRAPHY UNIVERSITY OF COLOMBO
28

DEPARTMENT OF GEOGRAPHY UNIVERSITY OF COLOMBO
29

DEPARTMENT OF GEOGRAPHY UNIVERSITY OF COLOMBO
30
DEPARTMENT OF GEOGRAPHY UNIVERSITY OF COLOMBO
31
WORKING WITH ARCMAP DATA
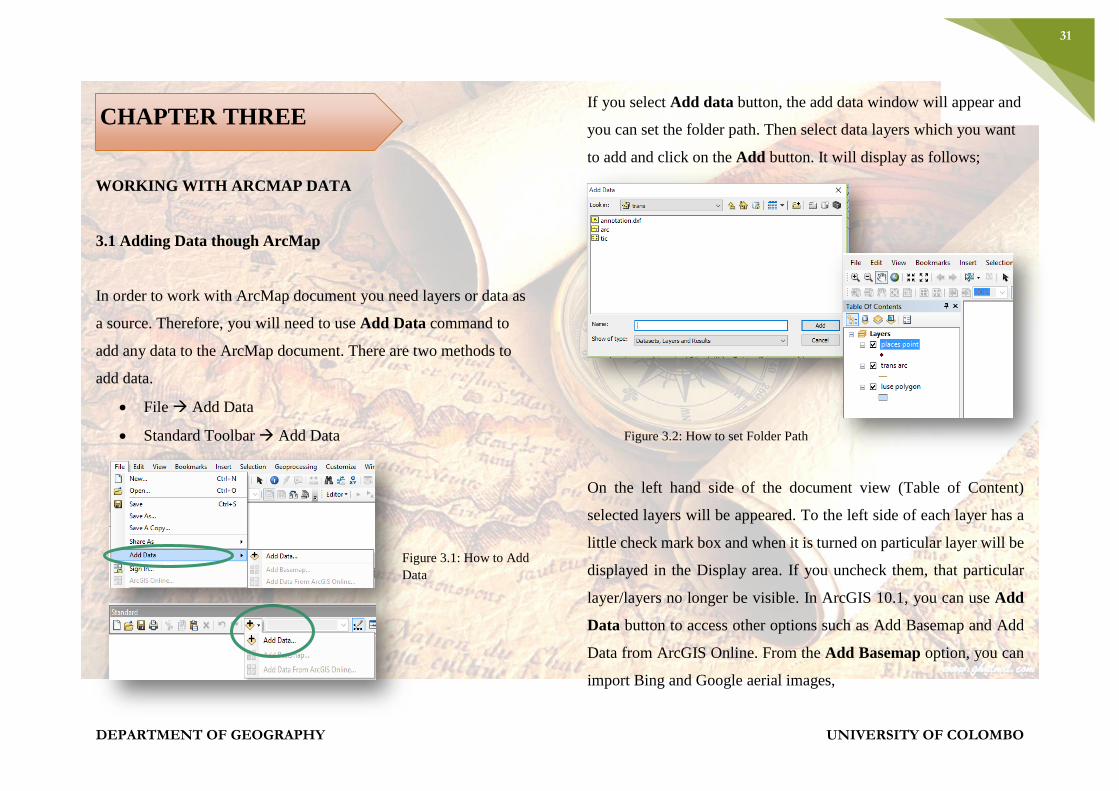
3.1 Adding Data though ArcMap
In order to work with ArcMap document you need layers or data as
a source. Therefore, you will need to use Add Data command to
add any data to the ArcMap document. There are two methods to
add data.
File Add Data
Standard Toolbar Add Data
If you select Add data button, the add data window will appear and
you can set the folder path. Then select data layers which you want
to add and click on the Add button. It will display as follows;
On the left hand side of the document view (Table of Content)
selected layers will be appeared. To the left side of each layer has a
little check mark box and when it is turned on particular layer will be
displayed in the Display area. If you uncheck them, that particular
layer/layers no longer be visible. In ArcGIS 10.1, you can use Add
Data button to access other options such as Add Basemap and Add
Data from ArcGIS Online. From the Add Basemap option, you can
import Bing and Google aerial images,
Figure 3.1: How to Add
Data
Figure 3.2: How to set Folder Path
CHAPTER THREE
DEPARTMENT OF GEOGRAPHY UNIVERSITY OF COLOMBO
32
street and topo maps, and others. Through ArcGIS Online, you can
import data and can create many additional layers.
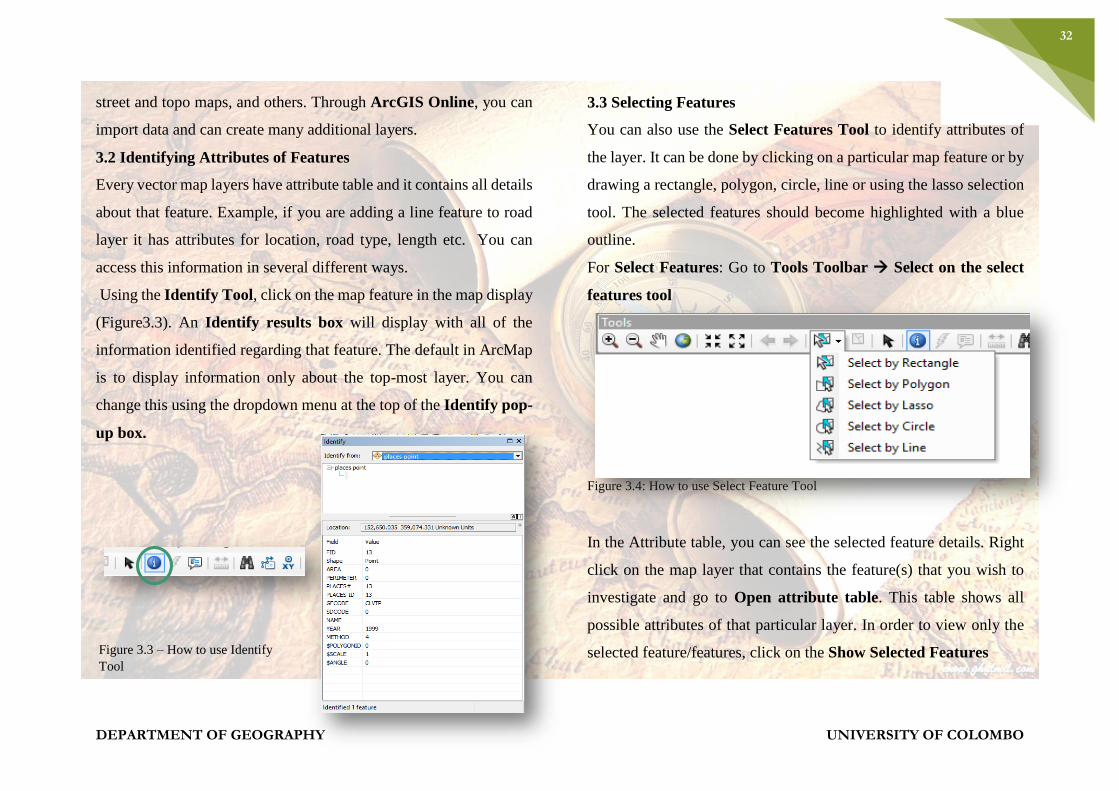
3.2 Identifying Attributes of Features
Every vector map layers have attribute table and it contains all details
about that feature. Example, if you are adding a line feature to road
layer it has attributes for location, road type, length etc. You can
access this information in several different ways.
Using the Identify Tool, click on the map feature in the map display
(Figure3.3). An Identify results box will display with all of the
information identified regarding that feature. The default in ArcMap
is to display information only about the top-most layer. You can
change this using the dropdown menu at the top of the Identify pop-
up box.
3.3 Selecting Features
You can also use the Select Features Tool to identify attributes of
the layer. It can be done by clicking on a particular map feature or by
drawing a rectangle, polygon, circle, line or using the lasso selection
tool. The selected features should become highlighted with a blue
outline.
For Select Features: Go to Tools Toolbar Select on the select
features tool
Figure 3.4: How to use Select Feature Tool
In the Attribute table, you can see the selected feature details. Right
click on the map layer that contains the feature(s) that you wish to
investigate and go to Open attribute table. This table shows all
possible attributes of that particular layer. In order to view only the
selected feature/features, click on the Show Selected Features
Figure 3.3 – How to use Identify
Tool

DEPARTMENT OF GEOGRAPHY UNIVERSITY OF COLOMBO
33

DEPARTMENT OF GEOGRAPHY UNIVERSITY OF COLOMBO
34

DEPARTMENT OF GEOGRAPHY UNIVERSITY OF COLOMBO
35

DEPARTMENT OF GEOGRAPHY UNIVERSITY OF COLOMBO
36

DEPARTMENT OF GEOGRAPHY UNIVERSITY OF COLOMBO
37

DEPARTMENT OF GEOGRAPHY UNIVERSITY OF COLOMBO
38

DEPARTMENT OF GEOGRAPHY UNIVERSITY OF COLOMBO
39

DEPARTMENT OF GEOGRAPHY UNIVERSITY OF COLOMBO
40

DEPARTMENT OF GEOGRAPHY UNIVERSITY OF COLOMBO
41

DEPARTMENT OF GEOGRAPHY UNIVERSITY OF COLOMBO
42

DEPARTMENT OF GEOGRAPHY UNIVERSITY OF COLOMBO
43

DEPARTMENT OF GEOGRAPHY UNIVERSITY OF COLOMBO
44
DEPARTMENT OF GEOGRAPHY UNIVERSITY OF COLOMBO
45
WORKING WITH MAP PROJECTION
4.1 Georeferencing Image
Georeferencing allows you to convert paper map into a digital map
layer. Georeferencing is the process of aligning a Raster data set to
a known Map Coordinates and assigning a Coordinate System. The
process includes assigning X and Y coordinates to points on your
digital map image, Shifting, Rotating, and Scaling your map.
Afterward, you can view it as a digital Map Layer along with your
Shapefiles. This is important for interpret historical map or an aerial
photographs.
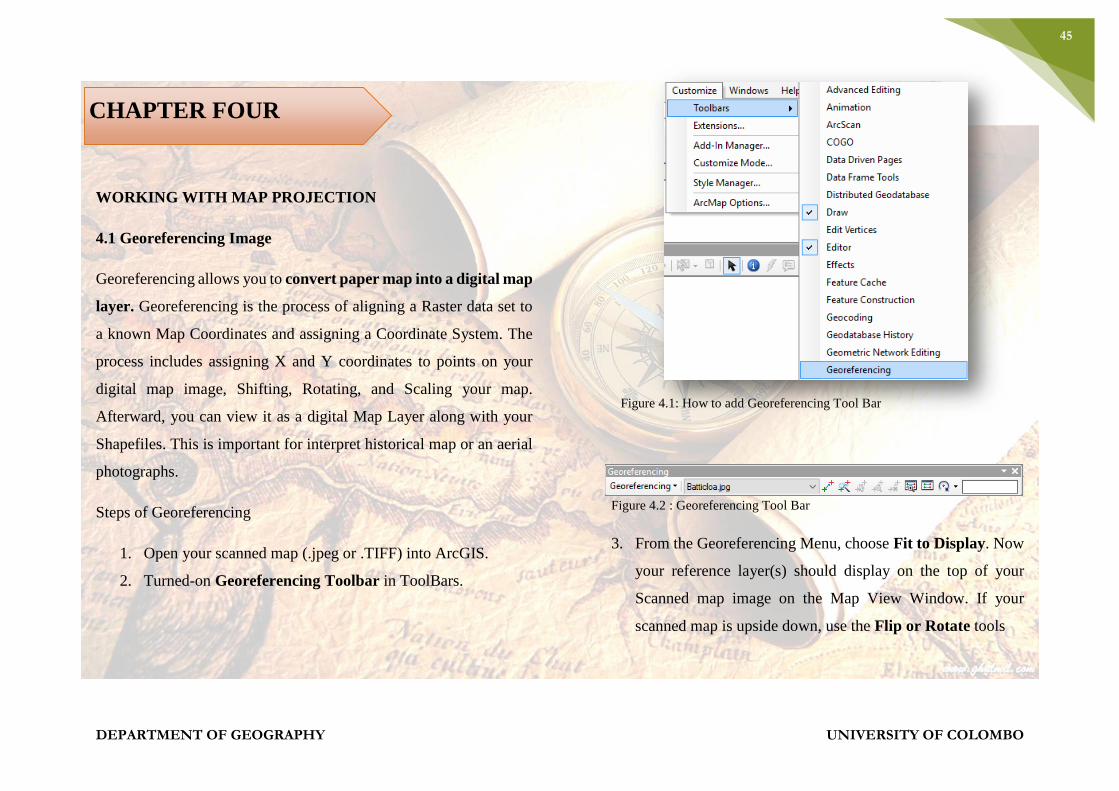
Steps of Georeferencing
1. Open your scanned map (.jpeg or .TIFF) into ArcGIS.
2. Turned-on Georeferencing Toolbar in ToolBars.
Figure 4.1: How to add Georeferencing Tool Bar
Figure 4.2 : Georeferencing Tool Bar
3. From the Georeferencing Menu, choose Fit to Display. Now
your reference layer(s) should display on the top of your
Scanned map image on the Map View Window. If your
scanned map is upside down, use the Flip or Rotate tools
CHAPTER FOUR
DEPARTMENT OF GEOGRAPHY UNIVERSITY OF COLOMBO
46
Figure 4.3: Fit To Display Feature/Filp to Rotate
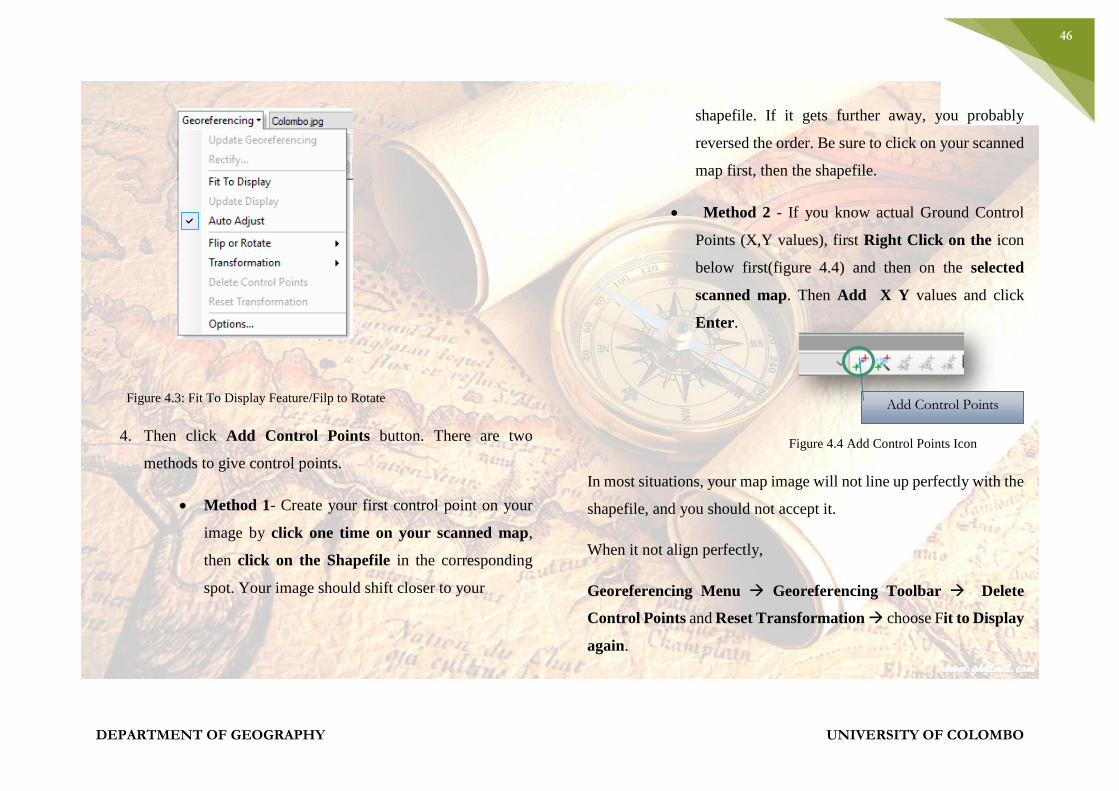
4. Then click Add Control Points button. There are two
methods to give control points.
Method 1- Create your first control point on your
image by click one time on your scanned map,
then click on the Shapefile in the corresponding
spot. Your image should shift closer to your
shapefile. If it gets further away, you probably
reversed the order. Be sure to click on your scanned
map first, then the shapefile.
Method 2 - If you know actual Ground Control
Points (X,Y values), first Right Click on the icon
below first(figure 4.4) and then on the selected
scanned map. Then Add X Y values and click
Enter.
Figure 4.4 Add Control Points Icon
In most situations, your map image will not line up perfectly with the
shapefile, and you should not accept it.
When it not align perfectly,
Georeferencing Menu Georeferencing Toolbar Delete
Control Points and Reset Transformation choose Fit to Display
again.
Add Control Points

DEPARTMENT OF GEOGRAPHY UNIVERSITY OF COLOMBO
47

DEPARTMENT OF GEOGRAPHY UNIVERSITY OF COLOMBO
48

DEPARTMENT OF GEOGRAPHY UNIVERSITY OF COLOMBO
49

DEPARTMENT OF GEOGRAPHY UNIVERSITY OF COLOMBO
50
DEPARTMENT OF GEOGRAPHY UNIVERSITY OF COLOMBO
51
SCREEN DIGITIZING AND TABLE EDITING
Sometimes, you may have to use paper maps, satellite or aerial
photograph and create maps from them or you may have to work with
shapefiles that someone else created. Therefore, if you need a layer
that doesn’t exist, you will have to create it by yourself. In that
situation Digitizing is very important. Digitizing is the process of
drawing or tracing map features to create a new digital layer.
This process involved tracing a paper map on a digitizing and then
assigning real world coordinates to certain parts. But, ArcGIS has on-
screen digitizing tools which allow you to create new shapefiles
without any additional hardware or software.
5.1 Create a shapefile
If you need to create new Shapefile (Point, Polygon or Line) you can
use ArcCataloge window.
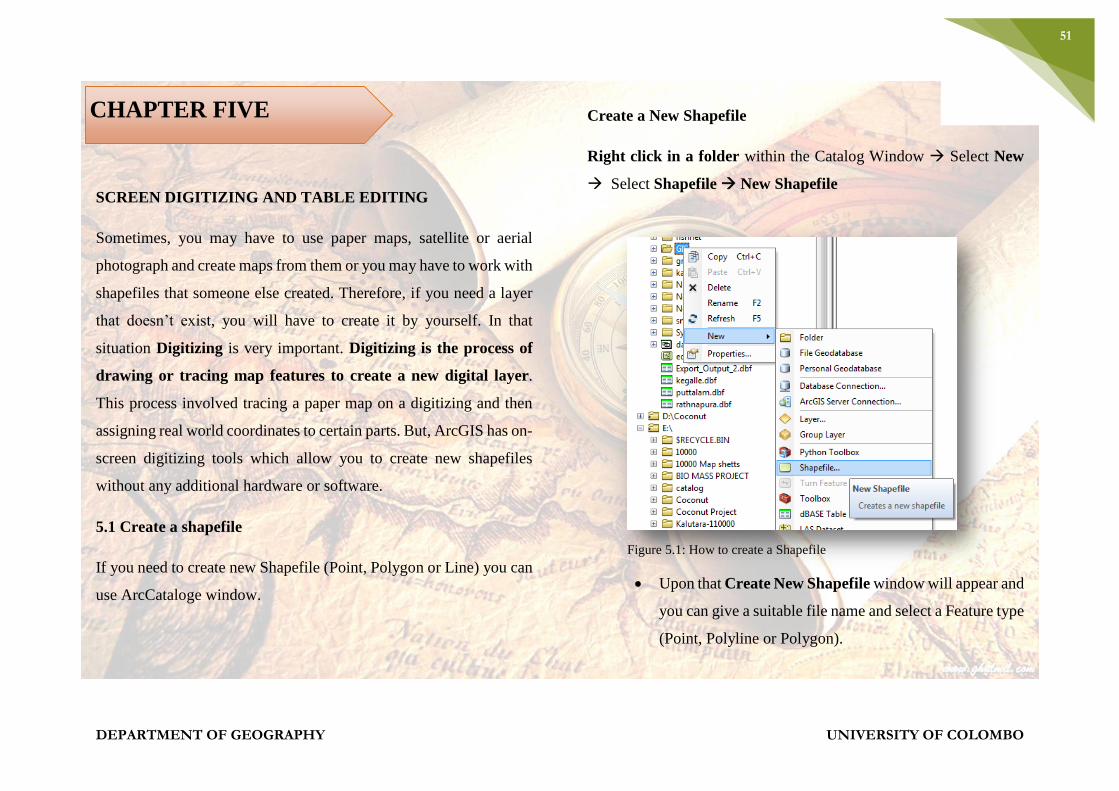
Create a New Shapefile
Right click in a folder within the Catalog Window Select New
Select Shapefile New Shapefile
Figure 5.1: How to create a Shapefile
Upon that Create New Shapefile window will appear and
you can give a suitable file name and select a Feature type
(Point, Polyline or Polygon).
CHAPTER FIVE
DEPARTMENT OF GEOGRAPHY UNIVERSITY OF COLOMBO
52
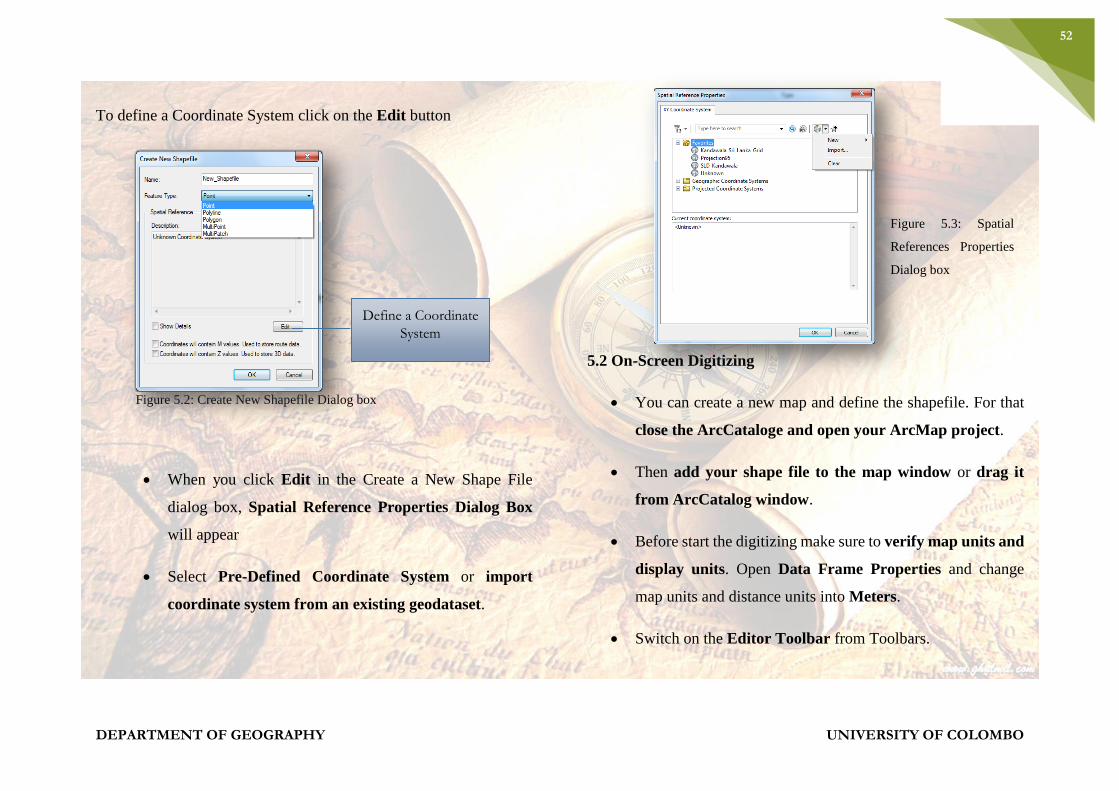
To define a Coordinate System click on the Edit button
Figure 5.2: Create New Shapefile Dialog box
When you click Edit in the Create a New Shape File
dialog box, Spatial Reference Properties Dialog Box
will appear
Select Pre-Defined Coordinate System or import
coordinate system from an existing geodataset.
5.2 On-Screen Digitizing
You can create a new map and define the shapefile. For that
close the ArcCataloge and open your ArcMap project.
Then add your shape file to the map window or drag it
from ArcCatalog window.
Before start the digitizing make sure to verify map units and
display units. Open Data Frame Properties and change
map units and distance units into Meters.
Switch on the Editor Toolbar from Toolbars.
Define a Coordinate
System
Figure 5.3: Spatial
References Properties
Dialog box

DEPARTMENT OF GEOGRAPHY UNIVERSITY OF COLOMBO
53

DEPARTMENT OF GEOGRAPHY UNIVERSITY OF COLOMBO
54

DEPARTMENT OF GEOGRAPHY UNIVERSITY OF COLOMBO
55

DEPARTMENT OF GEOGRAPHY UNIVERSITY OF COLOMBO
56

DEPARTMENT OF GEOGRAPHY UNIVERSITY OF COLOMBO
57

DEPARTMENT OF GEOGRAPHY UNIVERSITY OF COLOMBO
58

DEPARTMENT OF GEOGRAPHY UNIVERSITY OF COLOMBO
59

DEPARTMENT OF GEOGRAPHY UNIVERSITY OF COLOMBO
60

DEPARTMENT OF GEOGRAPHY UNIVERSITY OF COLOMBO
61

DEPARTMENT OF GEOGRAPHY UNIVERSITY OF COLOMBO
62

DEPARTMENT OF GEOGRAPHY UNIVERSITY OF COLOMBO
63
DEPARTMENT OF GEOGRAPHY UNIVERSITY OF COLOMBO
64
DESIGNING MAP LAYOUTS
1.1 Layout View
Layouts are way of allowing you to make a professional quality
presentation. When you switch to the Layout View, you have access
to a different range of tools. You can use the Layout Toolbar to
navigate.
To switch to Layout View
Click on the Layout View Icon at the bottom of your Map Display
or from the View menu Layout View
Figure 6.1: How to Switch to Layout View
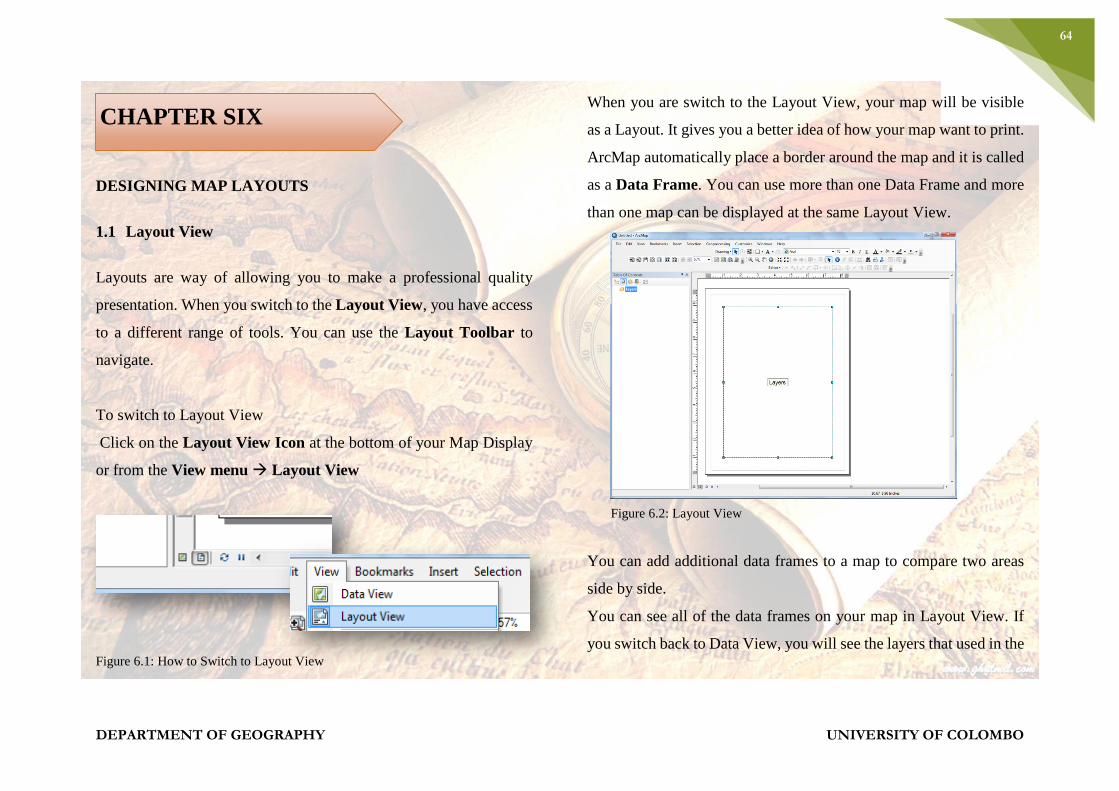
When you are switch to the Layout View, your map will be visible
as a Layout. It gives you a better idea of how your map want to print.
ArcMap automatically place a border around the map and it is called
as a Data Frame. You can use more than one Data Frame and more
than one map can be displayed at the same Layout View.
Figure 6.2: Layout View
You can add additional data frames to a map to compare two areas
side by side.
You can see all of the data frames on your map in Layout View. If
you switch back to Data View, you will see the layers that used in the
CHAPTER SIX
DEPARTMENT OF GEOGRAPHY UNIVERSITY OF COLOMBO
65
active data frame. The Active Data Frame is highlighted in the
Table
of Contents. In Layout View you can change the shape and position
of the data frame, add other map elements such as Scale Bars,
Legends to the Map and can change the Page Size and Orientation.
The Layout Toolbar is added to the ArcMap interface when you
choose Layout View. By using Layout Toolbar it is possible to
Zoom In, Zoom Out, Pan, Fixed Zoom In, Fixed Zoom Out, Zoom to
Whole page, Zoom to 100%, go back and forward between extents
and change the percentage of zooming. Those tools can be find in
Layout Toolbar in the Data View.
Figure 6.3 : Layout Tool Bar
When you are in the Layout View, Insert Menu which has number
of options become active. These options allow you to add elements
including Title, Legend, North Arrow, Scale Bar, and Image to Your
Layout.
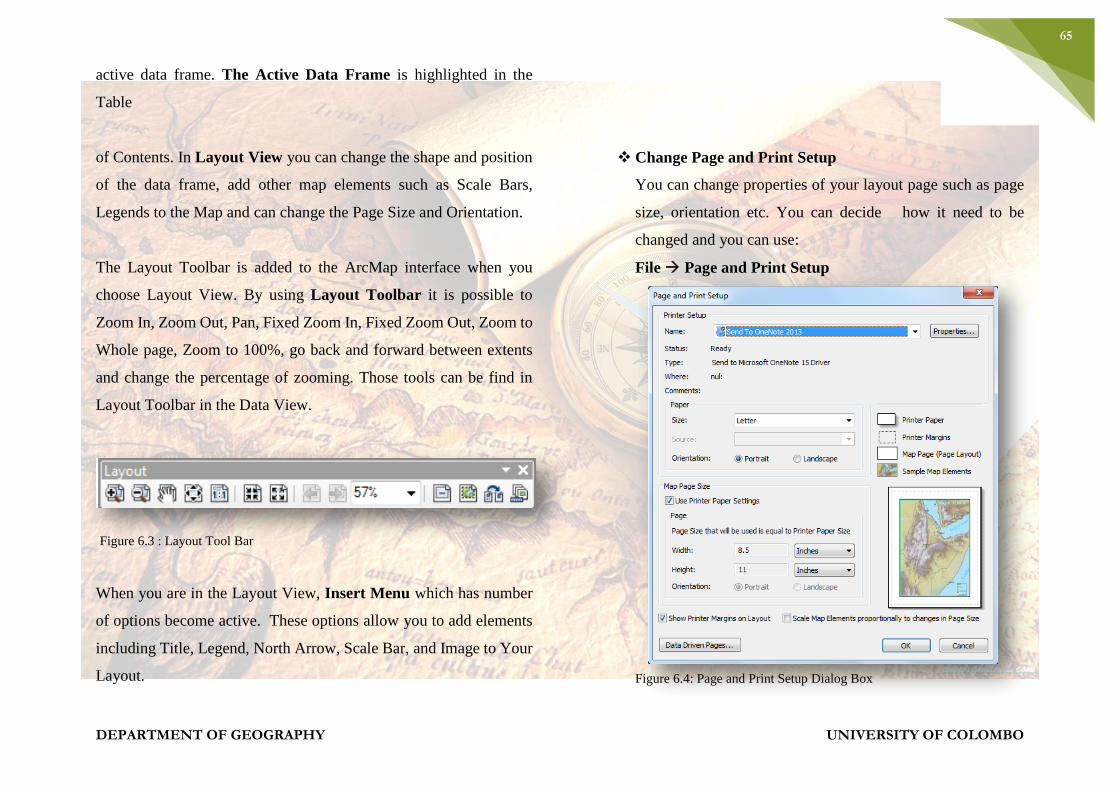
Change Page and Print Setup
You can change properties of your layout page such as page
size, orientation etc. You can decide how it need to be
changed and you can use:
File Page and Print Setup
Figure 6.4: Page and Print Setup Dialog Box

DEPARTMENT OF GEOGRAPHY UNIVERSITY OF COLOMBO
66

DEPARTMENT OF GEOGRAPHY UNIVERSITY OF COLOMBO
67

DEPARTMENT OF GEOGRAPHY UNIVERSITY OF COLOMBO
68

DEPARTMENT OF GEOGRAPHY UNIVERSITY OF COLOMBO
69

DEPARTMENT OF GEOGRAPHY UNIVERSITY OF COLOMBO
70
DEPARTMENT OF GEOGRAPHY UNIVERSITY OF COLOMBO
71
GEOPROCESSING
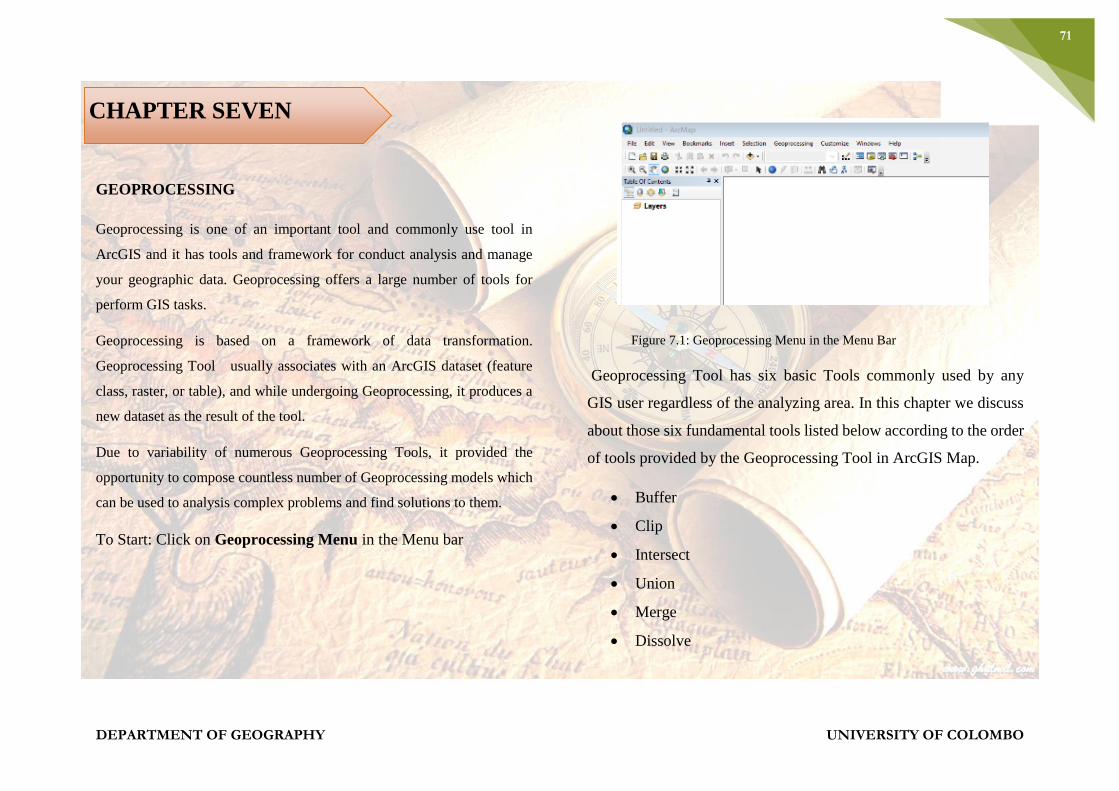
Geoprocessing is one of an important tool and commonly use tool in
ArcGIS and it has tools and framework for conduct analysis and manage
your geographic data. Geoprocessing offers a large number of tools for
perform GIS tasks.
Geoprocessing is based on a framework of data transformation.
Geoprocessing Tool usually associates with an ArcGIS dataset (feature
class, raster, or table), and while undergoing Geoprocessing, it produces a
new dataset as the result of the tool.
Due to variability of numerous Geoprocessing Tools, it provided the
opportunity to compose countless number of Geoprocessing models which
can be used to analysis complex problems and find solutions to them.
To Start: Click on Geoprocessing Menu in the Menu bar
Figure 7.1: Geoprocessing Menu in the Menu Bar
Geoprocessing Tool has six basic Tools commonly used by any
GIS user regardless of the analyzing area. In this chapter we discuss
about those six fundamental tools listed below according to the order
of tools provided by the Geoprocessing Tool in ArcGIS Map.
Buffer
Clip
Intersect
Union
Merge
Dissolve
CHAPTER SEVEN
DEPARTMENT OF GEOGRAPHY UNIVERSITY OF COLOMBO
72
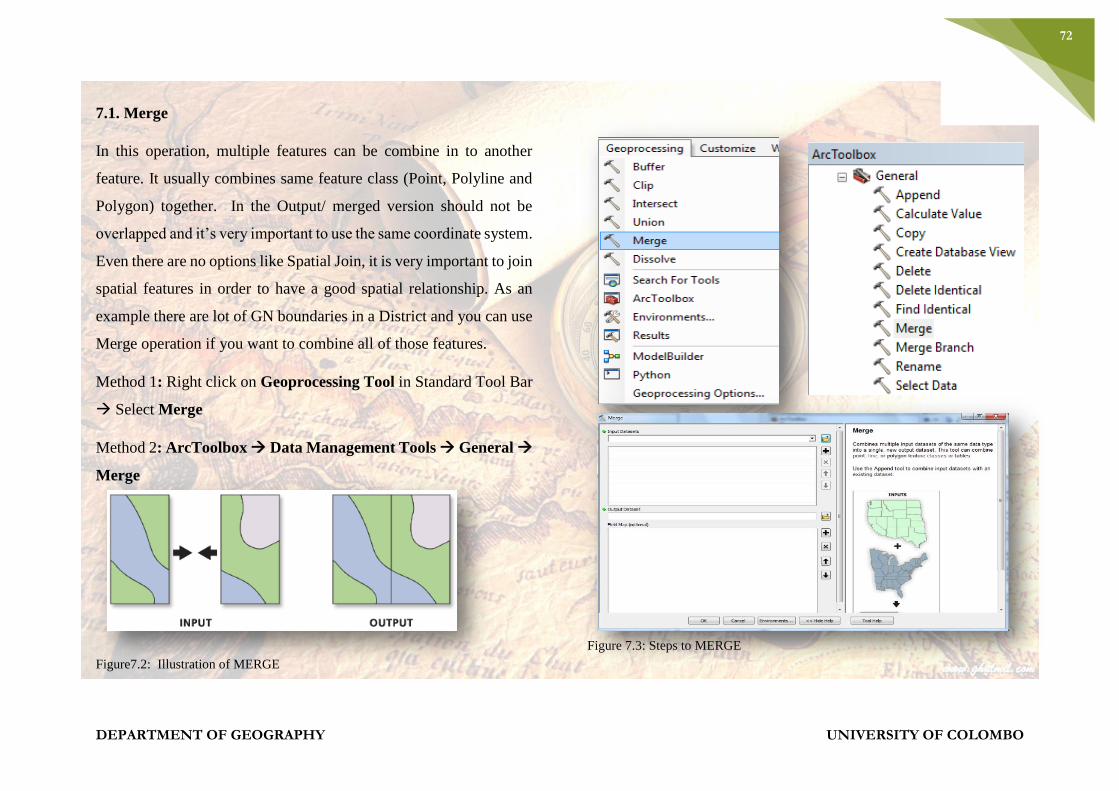
7.1. Merge
In this operation, multiple features can be combine in to another
feature. It usually combines same feature class (Point, Polyline and
Polygon) together. In the Output/ merged version should not be
overlapped and it’s very important to use the same coordinate system.
Even there are no options like Spatial Join, it is very important to join
spatial features in order to have a good spatial relationship. As an
example there are lot of GN boundaries in a District and you can use
Merge operation if you want to combine all of those features.
Method 1: Right click on Geoprocessing Tool in Standard Tool Bar
Select Merge
Method 2: ArcToolbox Data Management Tools General
Merge
Figure7.2: Illustration of MERGE
Figure 7.3: Steps to MERGE

DEPARTMENT OF GEOGRAPHY UNIVERSITY OF COLOMBO
73

DEPARTMENT OF GEOGRAPHY UNIVERSITY OF COLOMBO
74

DEPARTMENT OF GEOGRAPHY UNIVERSITY OF COLOMBO
75

DEPARTMENT OF GEOGRAPHY UNIVERSITY OF COLOMBO
76

DEPARTMENT OF GEOGRAPHY UNIVERSITY OF COLOMBO
77

DEPARTMENT OF GEOGRAPHY UNIVERSITY OF COLOMBO
78

DEPARTMENT OF GEOGRAPHY UNIVERSITY OF COLOMBO
79

DEPARTMENT OF GEOGRAPHY UNIVERSITY OF COLOMBO
80

DEPARTMENT OF GEOGRAPHY UNIVERSITY OF COLOMBO
81