Embed Size (px)
Citation preview
Web Based GISNothing But Net!
Historical Election results
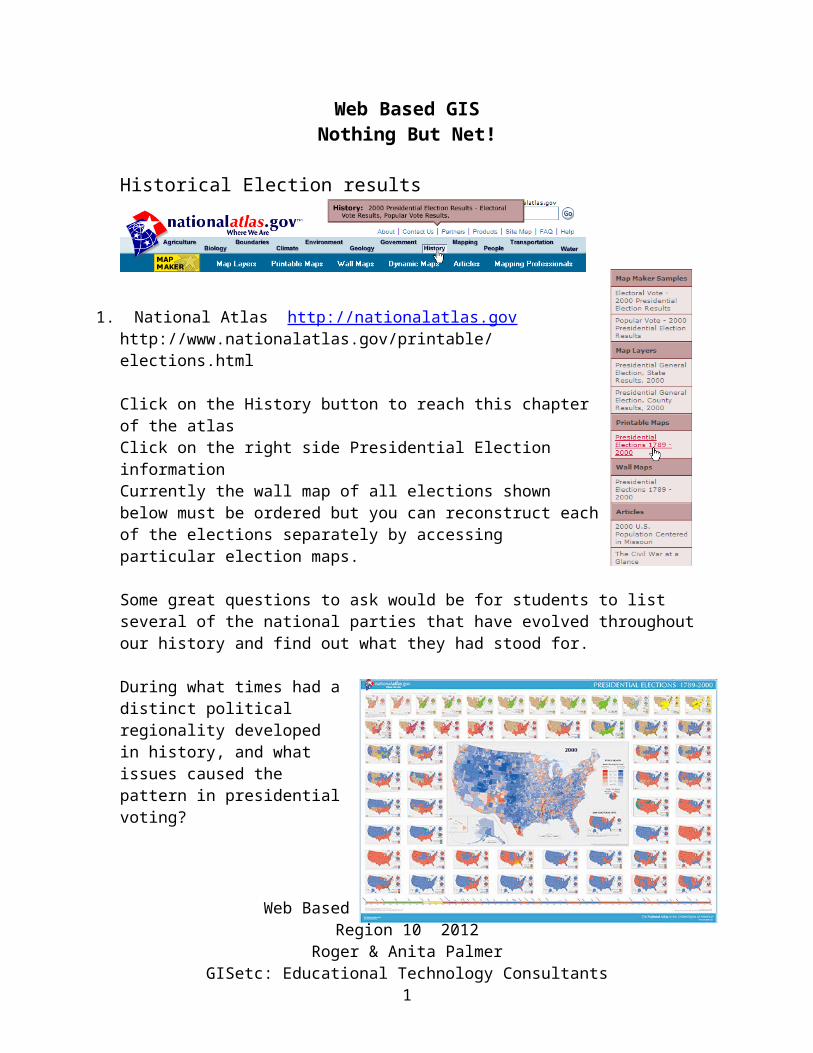
1. National Atlas http://nationalatlas.govhttp://www.nationalatlas.gov/printable/elections.html
Click on the History button to reach this chapter of the atlasClick on the right side Presidential Election information Currently the wall map of all elections shown below must be ordered but you can reconstruct each of the elections separately by accessing particular election maps.
Some great questions to ask would be for students to list several of the national parties that have evolved throughout our history and find out what they had stood for.
During what times had a distinct political regionality developed in history, and what issues caused the pattern in presidential voting?
What times had there been a loss in political regionality?
Web Based GIS: Nothing But NetRegion 10 2012
Roger & Anita PalmerGISetc: Educational Technology Consultants
1
Sociology: CSI over your lifetime
2. Following Crime Within Your State During Your LifetimeNational Atlas: http://nationalatlas.gov
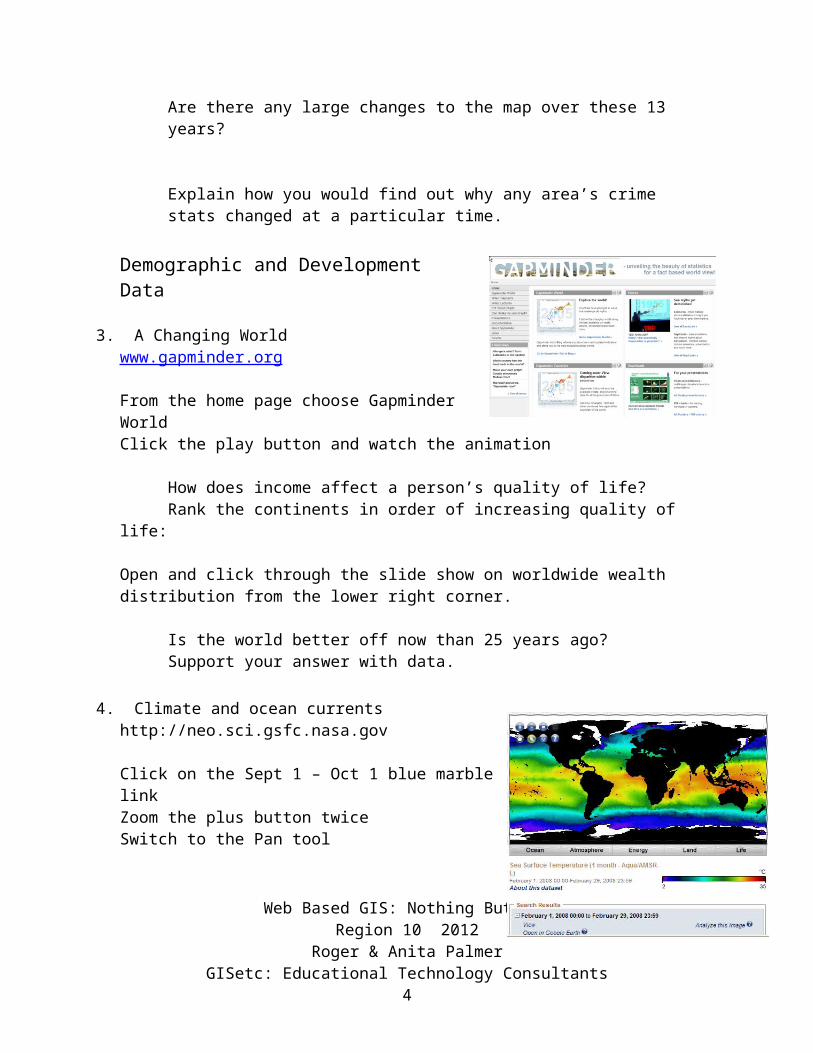
Click on Map MakerClick on People to Expand the Crime StatisticsIn the zoom to State window, Choose your own state (Texas)Choose to map 1994’s burglariesClick on Redraw Map buttonWhat do the darkest colored
counties represent in terms of burglaries?
Hint: Choose the map key tab:
Is there a pattern to where crimes occur in your state?
Turn off the 1994 stats before choosing 1995 then redraw. Check many yrs.
Does this pattern stay consistent over the data’s time period?You can press your print screen button on your keyboard to save and paste these maps onto a word document for direct comparisons.
Are there any large changes to the map over these 13 years?
Explain how you would find out why any area’s crime stats changed at a particular time.
Demographic and Development Data
Web Based GIS: Nothing But NetRegion 10 2012
Roger & Anita PalmerGISetc: Educational Technology Consultants
2
3. A Changing Worldwww.gapminder.org
From the home page choose Gapminder WorldClick the play button and watch the animation
How does income affect a person’s quality of life? Rank the continents in order of increasing quality of life:
Open and click through the slide show on worldwide wealth distribution from the lower right corner.
Is the world better off now than 25 years ago? Support your answer with data.
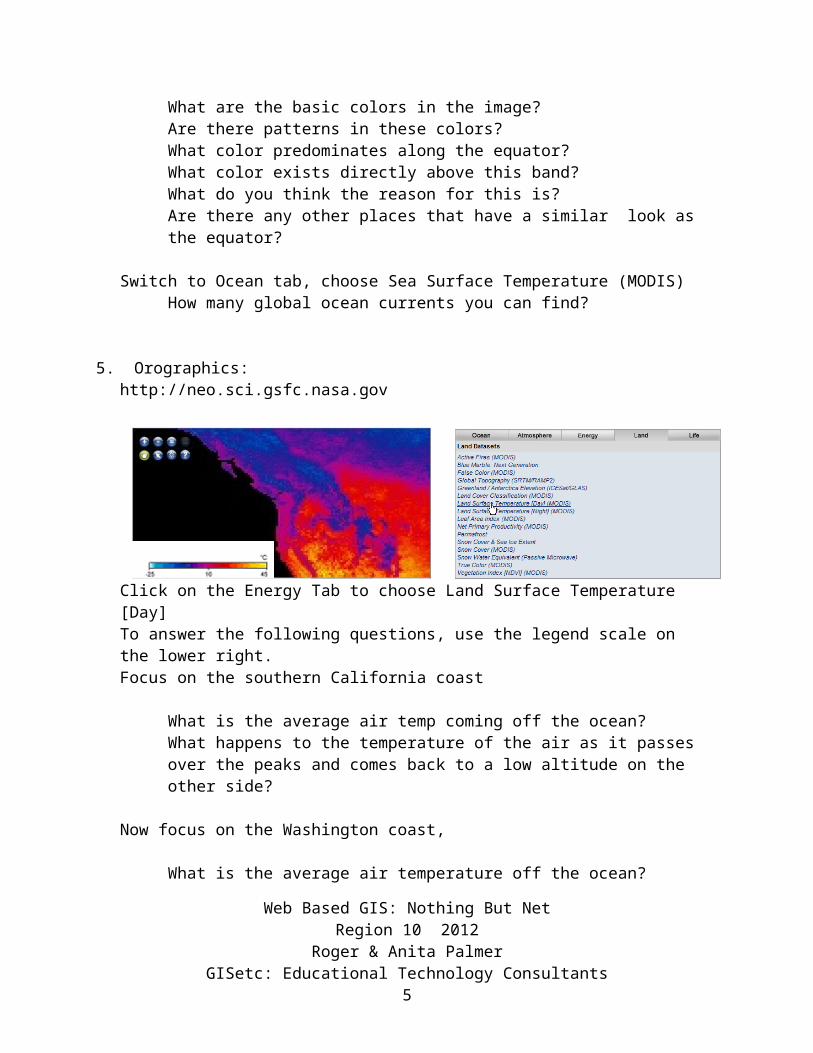
4. Climate and ocean currentshttp://neo.sci.gsfc.nasa.gov
Click on the Sept 1 – Oct 1 blue marble linkZoom the plus button twiceSwitch to the Pan tool
What are the basic colors in the image?Are there patterns in these colors?What color predominates along the equator?What color exists directly above this band?What do you think the reason for this is?Are there any other places that have a similar look as the equator?
Switch to Ocean tab, choose Sea Surface Temperature (MODIS)How many global ocean currents you can find?
5. Orographics: http://neo.sci.gsfc.nasa.gov
Web Based GIS: Nothing But NetRegion 10 2012
Roger & Anita PalmerGISetc: Educational Technology Consultants
3
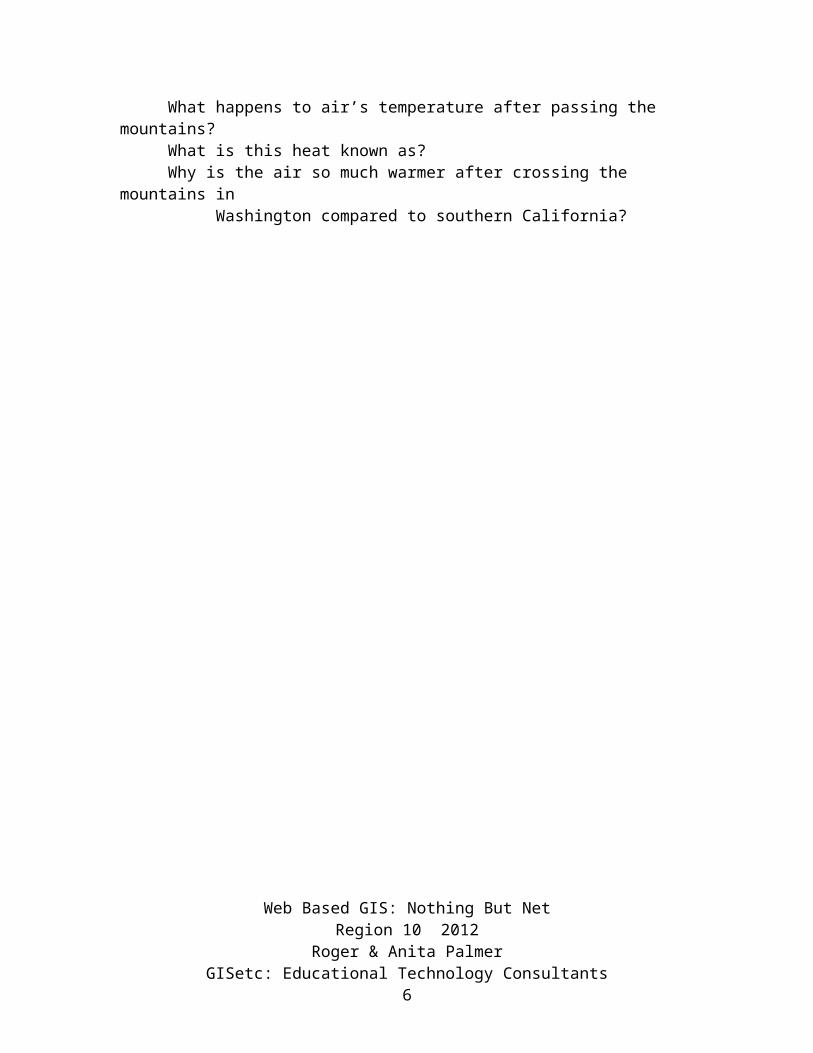
Click on the Energy Tab to choose Land Surface Temperature [Day] To answer the following questions, use the legend scale on the lower right.Focus on the southern California coast
What is the average air temp coming off the ocean?What happens to the temperature of the air as it passes over the peaks and comes back to a low altitude on the other side?
Now focus on the Washington coast,
What is the average air temperature off the ocean? What happens to air’s temperature after passing the mountains?What is this heat known as?Why is the air so much warmer after crossing the mountains in
Washington compared to southern California?
Web Based GIS: Nothing But NetRegion 10 2012
Roger & Anita PalmerGISetc: Educational Technology Consultants
4
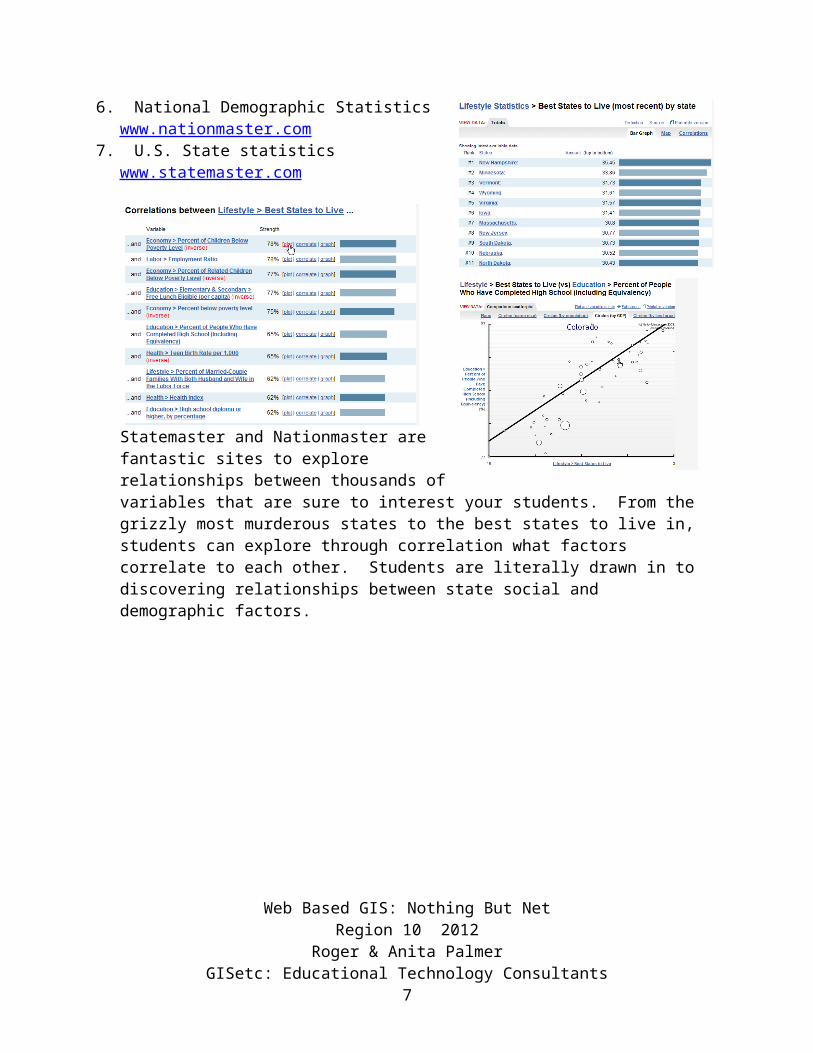
6. National Demographic Statistics www.nationmaster.com
7. U.S. State statisticswww.statemaster.com
Statemaster and Nationmaster are fantastic sites to explore relationships between thousands of variables that are sure to interest your students. From the grizzly most murderous states to the best states to live in, students can explore through correlation what factors correlate to each other. Students are literally drawn in to discovering relationships between state social and demographic factors.
Web Based GIS: Nothing But NetRegion 10 2012
Roger & Anita PalmerGISetc: Educational Technology Consultants
5
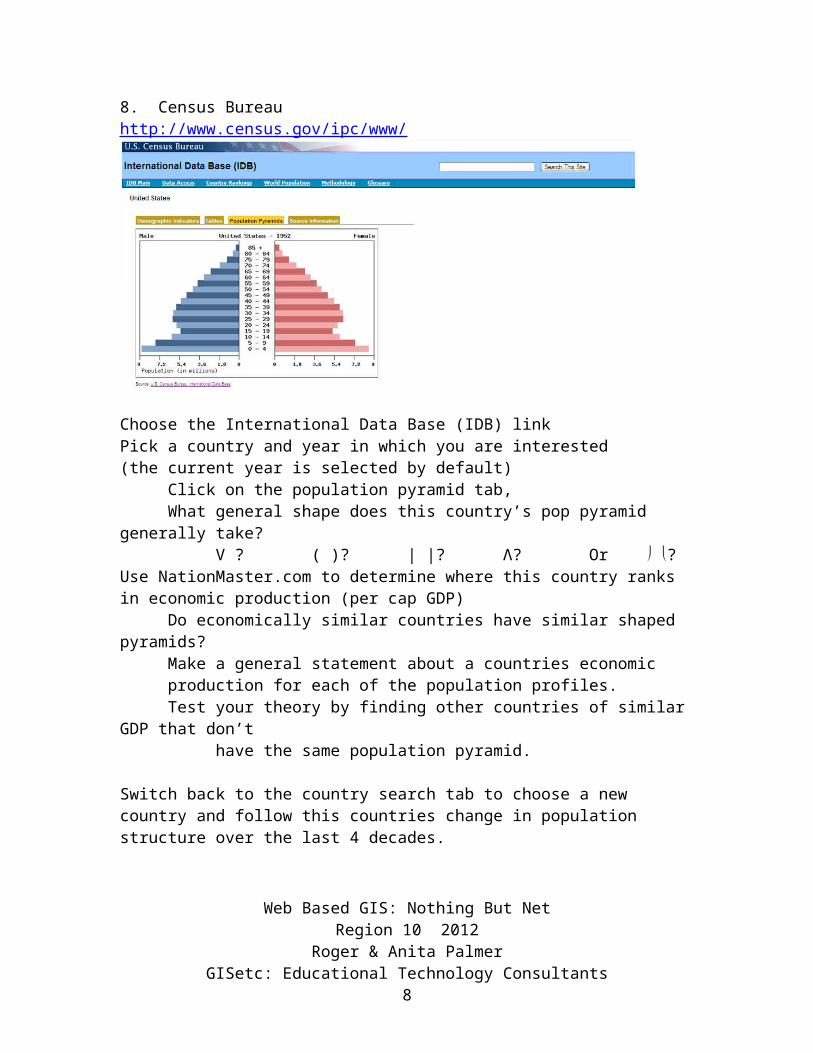
8. Census Bureauhttp://www.census.gov/ipc/www/
Choose the International Data Base (IDB) linkPick a country and year in which you are interested(the current year is selected by default)
Click on the population pyramid tab,What general shape does this country’s pop pyramid generally
take?V ? ( )? | |? Λ? Or ?
Use NationMaster.com to determine where this country ranks in economic production (per cap GDP)
Do economically similar countries have similar shaped pyramids?Make a general statement about a countries economic production for each of the population profiles. Test your theory by finding other countries of similar GDP that
don’t have the same population pyramid.
Switch back to the country search tab to choose a new country and follow this countries change in population structure over the last 4 decades. Create multiple pyramids by holding the CTRL key down and choosing several years (ie 2009, 1999, 1989, 1979, and 1969)
Based on the change in population structure, hypothesize how this
country has fared over the past 40 years economically?Google your country to see if you can support your theory.
Web Based GIS: Nothing But NetRegion 10 2012
Roger & Anita PalmerGISetc: Educational Technology Consultants
6
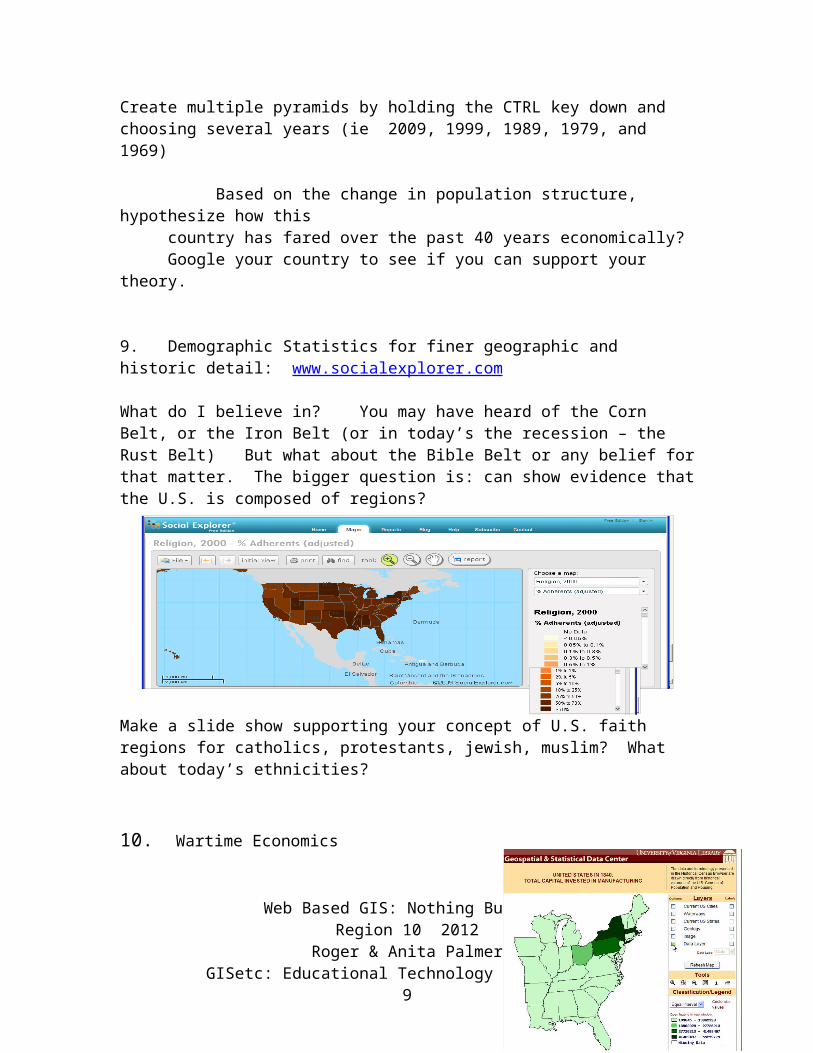
9. Demographic Statistics for finer geographic and historic detail: www.socialexplorer.com
What do I believe in? You may have heard of the Corn Belt, or the Iron Belt (or in today’s the recession – the Rust Belt) But what about the Bible Belt or any belief for that matter. The bigger question is: can show evidence that the U.S. is composed of regions?
Make a slide show supporting your concept of U.S. faith regions for catholics, protestants, jewish, muslim? What about today’s ethnicities?
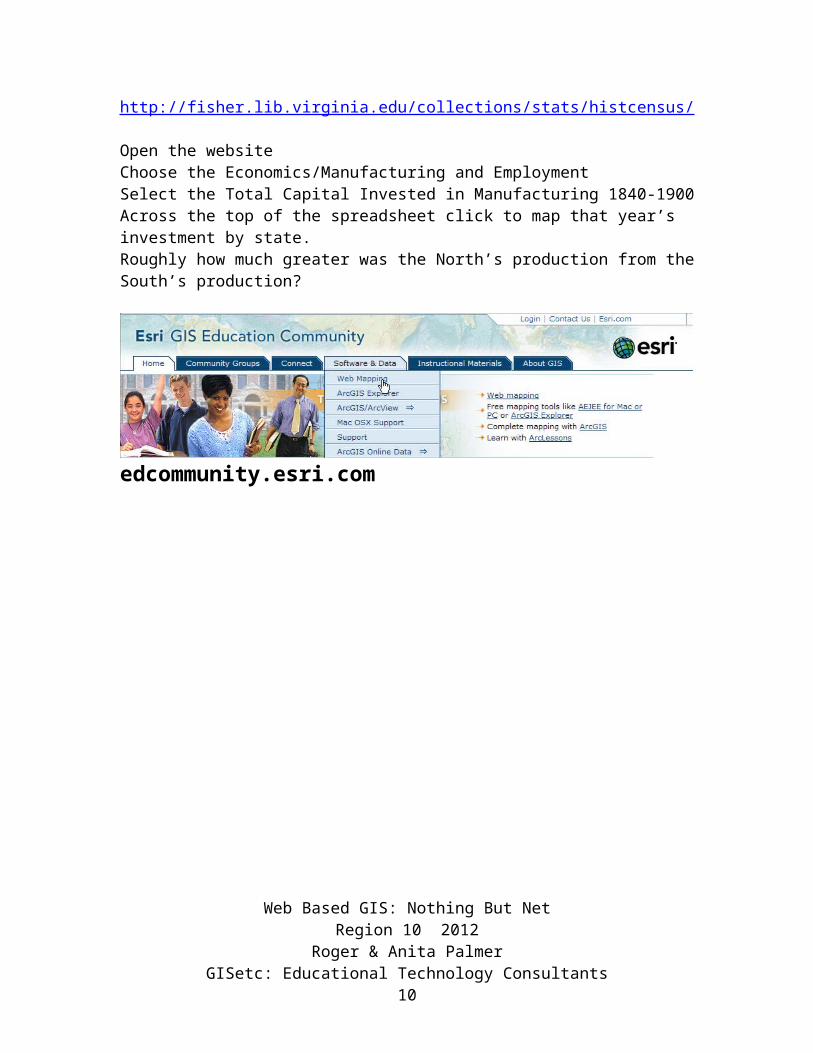
10. Wartime Economics
http://fisher.lib.virginia.edu/collections/stats/histcensus/
Open the websiteChoose the Economics/Manufacturing and EmploymentSelect the Total Capital Invested in Manufacturing 1840-1900Across the top of the spreadsheet click to map that year’s investment by state.Roughly how much greater was the North’s production from the South’s production?
edcommunity.esri.com
Web Based GIS: Nothing But NetRegion 10 2012
Roger & Anita PalmerGISetc: Educational Technology Consultants
7
Web Based GIS: Nothing But NetRegion 10 2012
Roger & Anita PalmerGISetc: Educational Technology Consultants
8
Web Based GIS: Nothing But NetRegion 10 2012
Roger & Anita PalmerGISetc: Educational Technology Consultants
9
Web Based GIS: Nothing But NetRegion 10 2012
Roger & Anita PalmerGISetc: Educational Technology Consultants
10


![Vol 02 [nothin´ but blues]](https://img.pdfslide.net/doc/110x75/58ee60e51a28ab4e598b4601/vol-02-nothin-but-blues-58ee63d7e2b13.jpg)


![Vol 002 - [Nothin' But Blues]](https://img.pdfslide.net/doc/110x75/568bd4fa1a28ab203496c5e2/vol-002-nothin-but-blues.jpg)


![Vol 02 - [Nothin´ But Blues] - ok.pdf](https://img.pdfslide.net/doc/110x75/577c7eab1a28abe054a21145/vol-02-nothin-but-blues-okpdf.jpg)
![Vol 02 - [Nothin´ But Blues]](https://img.pdfslide.net/doc/110x75/563db941550346aa9a9b911d/vol-02-nothin-but-blues.jpg)