Embed Size (px)
DESCRIPTION
Give credit where credit is due: Tracing value added in global production chains. William Powers United States International Trade Commission with Robert Koopman, Zhi Wang, and Shang-Jin Wei November 18, 2011. - PowerPoint PPT Presentation
Citation preview
Give credit where credit is due: Tracing value added in global
production chains
William PowersUnited States International Trade Commission
with Robert Koopman, Zhi Wang, and Shang-Jin Wei
November 18, 2011
The views expressed here are solely those of the presenter. This presentation is not meant to represent the views of the USITC or any of its Commissioners.
2
Presentation outline
• Global value chain analysis: Two IO-based approaches• Conceptual framework for ICIO-based analysis from
Koopman et al. (2010)• Applications
– Country and regional integration into global value chains– Direct and indirect exports of services– Bilateral trade deficits
• Conclusions and “wish list” for APEC
3
Value chain analysis based on IO-tables: 2 alternatives
• Single country models– Often based on Hummels, Ishii, Yi, 2001– Advantages: up-to-date; easy to measure foreign input in domestic
production and exports– Disadvantage: cannot determine sources of imported value
• Inter-Country Input-Output (ICIO) models– Major databases: IDE-JETRO, WTO, OECD, World Input-Output
Database, GTAP-based (e.g., Koopman et al. 2010; USITC 2011)– Advantages: Can track ultimate source and destination of value in
global production networks– Disadvantages: Complex, latest databases only through 2007
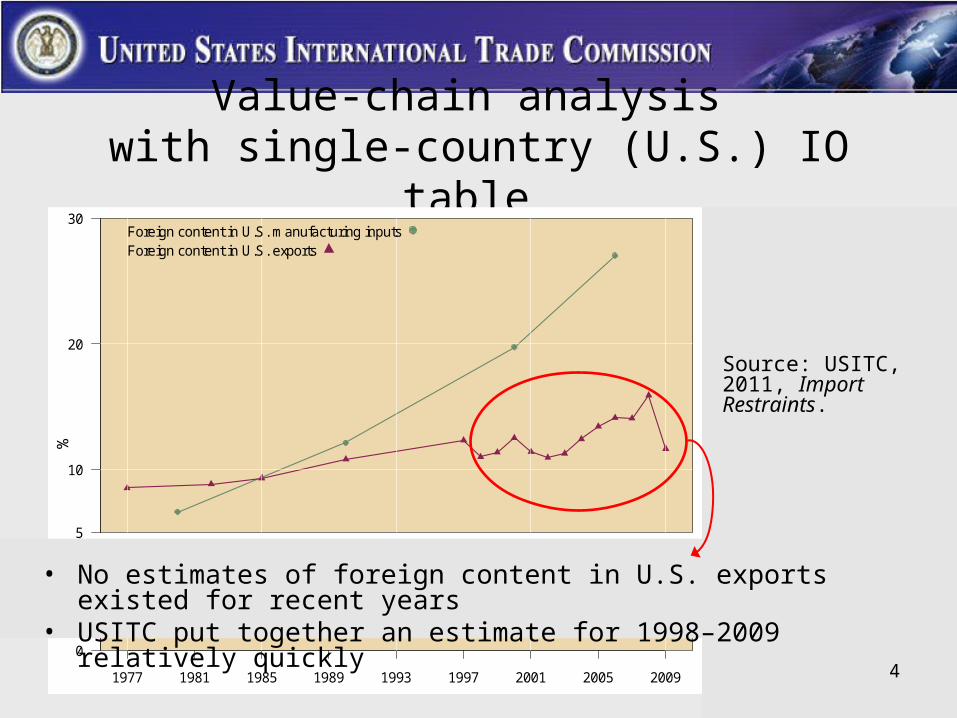
Value-chain analysis with single-country (U.S.) IO table
1977 1981 1985 1989 1993 1997 2001 2005 2009
0
0.5
1Foreign services (top 5) in U.S. inputsForeign services (all) in U.S. inputs
5
10
20
30
%
Foreign content in U.S. manufacturing inputsForeign content in U.S. exports
4
• No estimates of foreign content in U.S. exports existed for recent years• USITC put together an estimate for 1998–2009 relatively quickly
Source: USITC, 2011, Import Restraints.
5
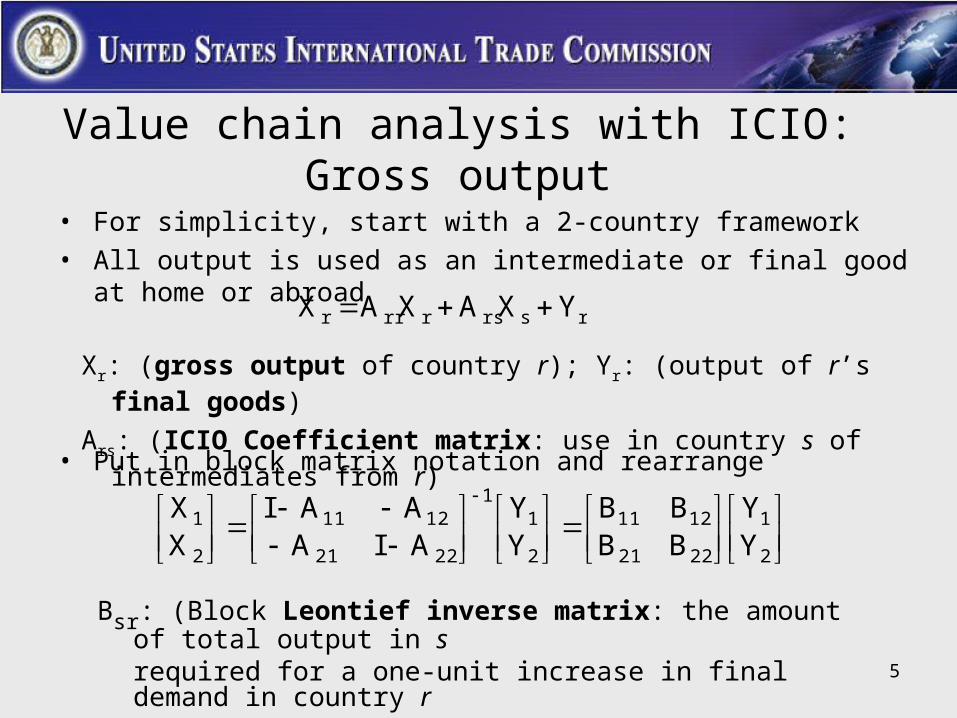
• For simplicity, start with a 2-country framework• All output is used as an intermediate or final good at home or abroad
Value chain analysis with ICIO: Gross output
Xr: (gross output of country r); Yr: (output of r’s final goods)
Ars: (ICIO Coefficient matrix: use in country s of intermediates from r)
rsrsrrrr YXAXAX
• Put in block matrix notation and rearrange
2
1
2221
1211
2
11
2221
1211
2
1
YY
BBBB
YY
AIAAAI
XX
Bsr: (Block Leontief inverse matrix: the amount of total output in srequired for a one-unit increase in final demand in country r
6
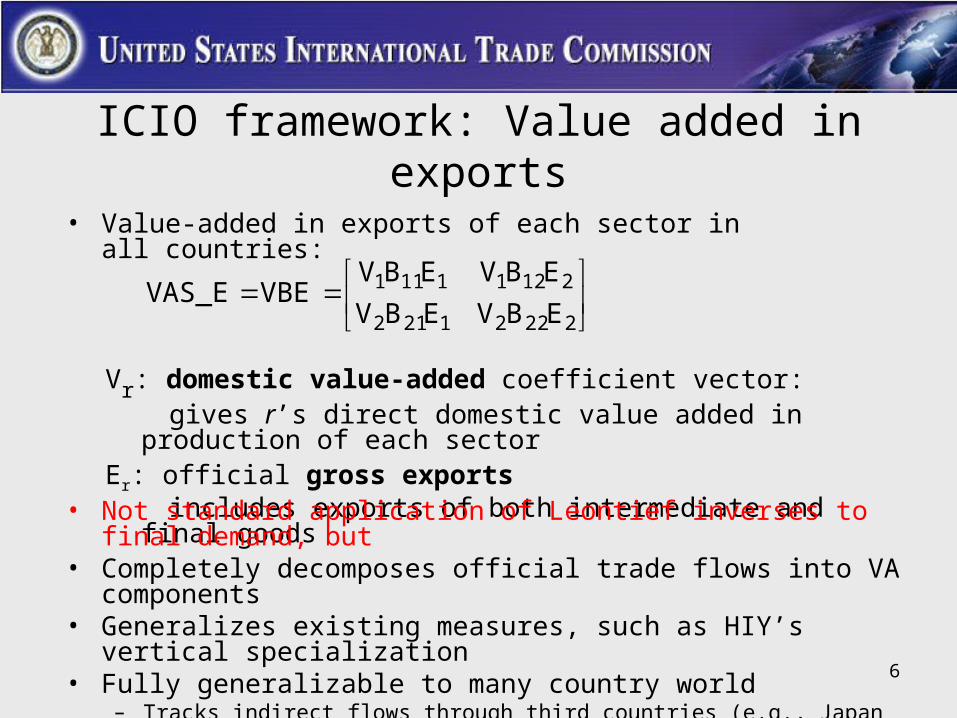
ICIO framework: Value added in exports
Vr: domestic value-added coefficient vector: gives r’s direct domestic value added in production of each sectorEr: official gross exports includes exports of both intermediate and final goods
22221212
21211111
EBVEBV
EBVEBVVBEVAS_E
• Value-added in exports of each sector in all countries:
• Not standard application of Leontief inverses to final demand, but• Completely decomposes official trade flows into VA components • Generalizes existing measures, such as HIY’s vertical specialization• Fully generalizable to many country world
– Tracks indirect flows through third countries (e.g., Japan China US) – Tracks indirect flows through other sectors
7
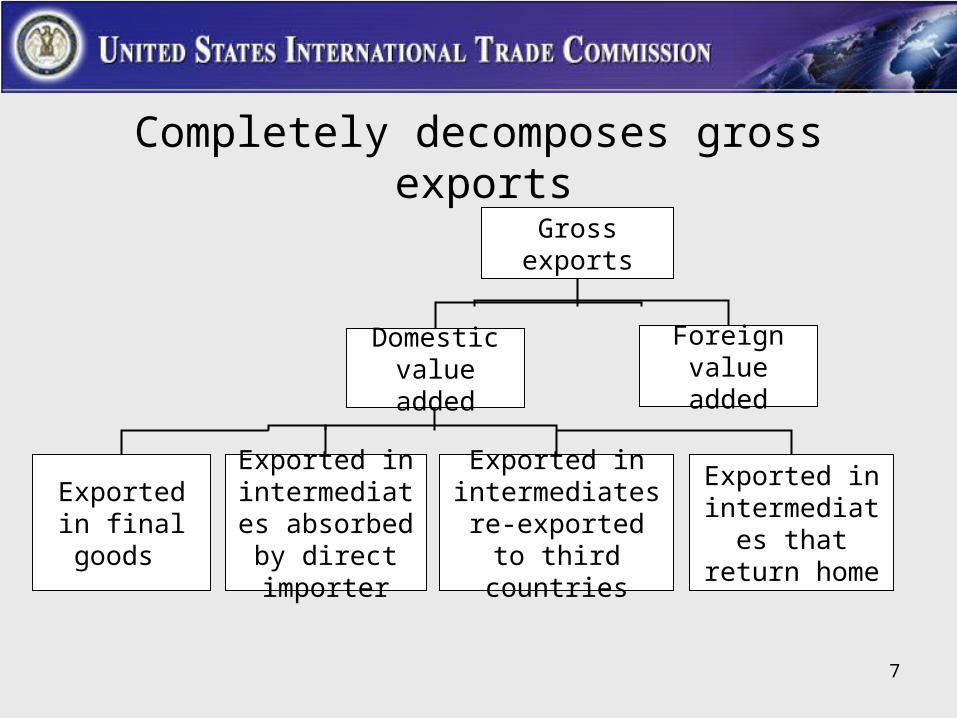
Completely decomposes gross exports
Exported in intermediates re-exported to third
countries
Exported in intermediates
that return home
Exported in final goods
Domestic value added
Foreign value added
Gross exports
Exported in intermediates absorbed by
direct importer
8
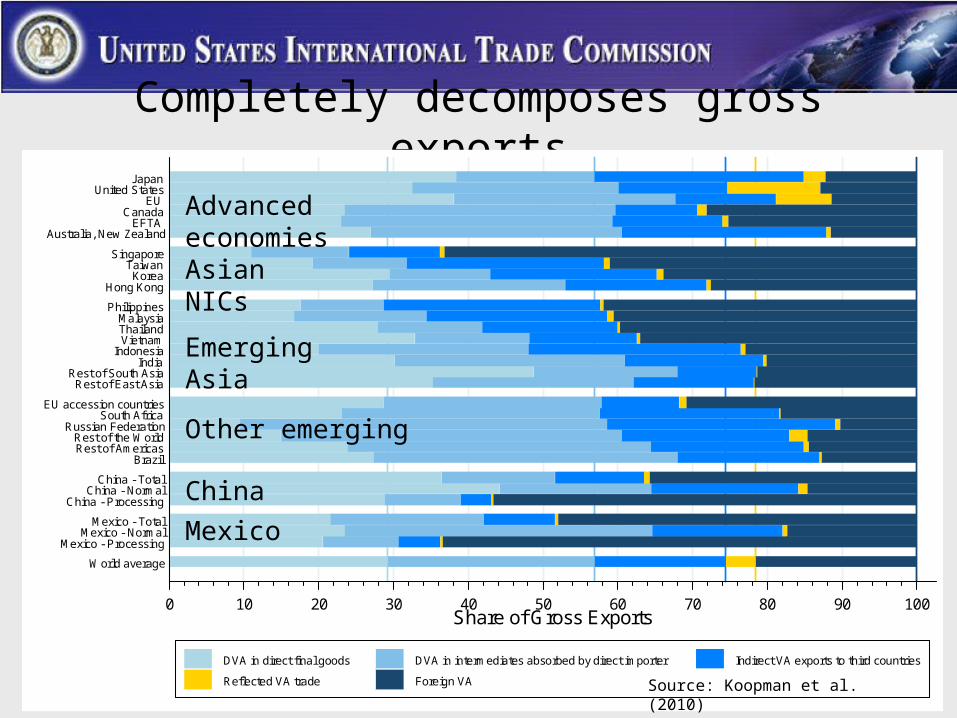
Completely decomposes gross exports
Advanced economies
Other emerging
Asia NICs
Emerging Asia
0 10 20 30 40 50 60 70 80 90 100Share of Gross Exports
World average
Mexico - ProcessingMexico - Normal
Mexico - Total
China - ProcessingChina - Normal
China - Total
BrazilRest of AmericasRest of the World
Russian FederationSouth Africa
EU accession countries
Rest of East AsiaRest of South Asia
IndiaIndonesia
VietnamThailandMalaysia
Philippines
Hong KongKorea
TaiwanSingapore
Australia, New ZealandEFTA
CanadaEU
United StatesJapan
DVA in direct final goods DVA in intermediates absorbed by direct importer Indirect VA exports to third countries
Reflected VA trade Foreign VA
Advanced economies
Asian NICs
Emerging Asia
Other emerging
China
Mexico
Source: Koopman et al. (2010)
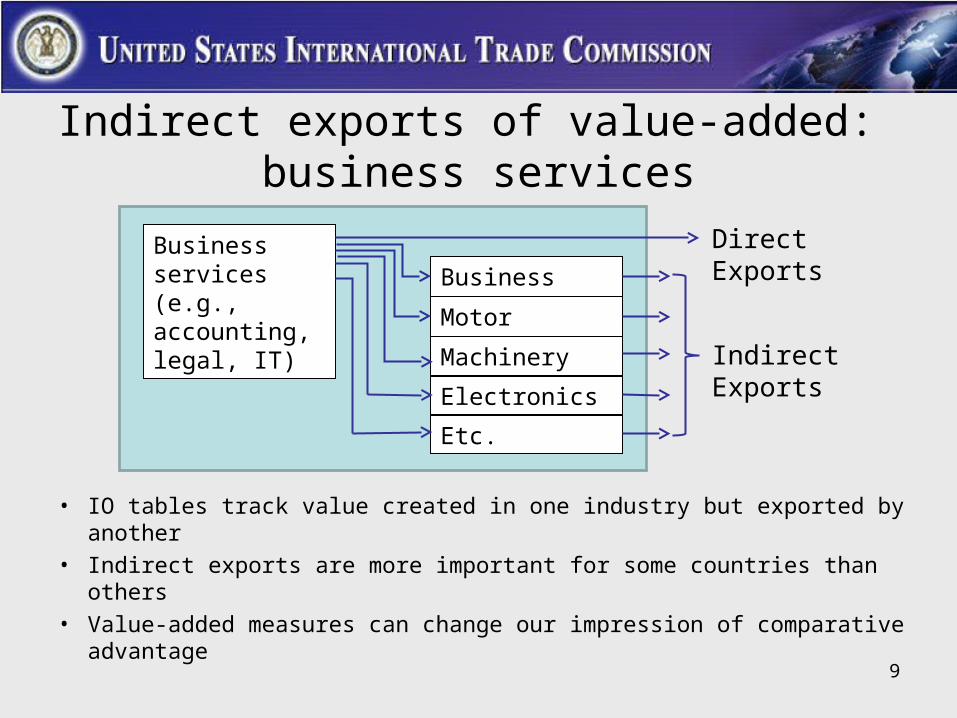
Indirect exports of value-added: business services
• IO tables track value created in one industry but exported by another • Indirect exports are more important for some countries than others• Value-added measures can change our impression of comparative
advantage
9
Direct ExportsBusiness services(e.g., accounting, legal, IT)
Business services
Motor vehicles
Machinery
Electronics
Etc.
Indirect Exports
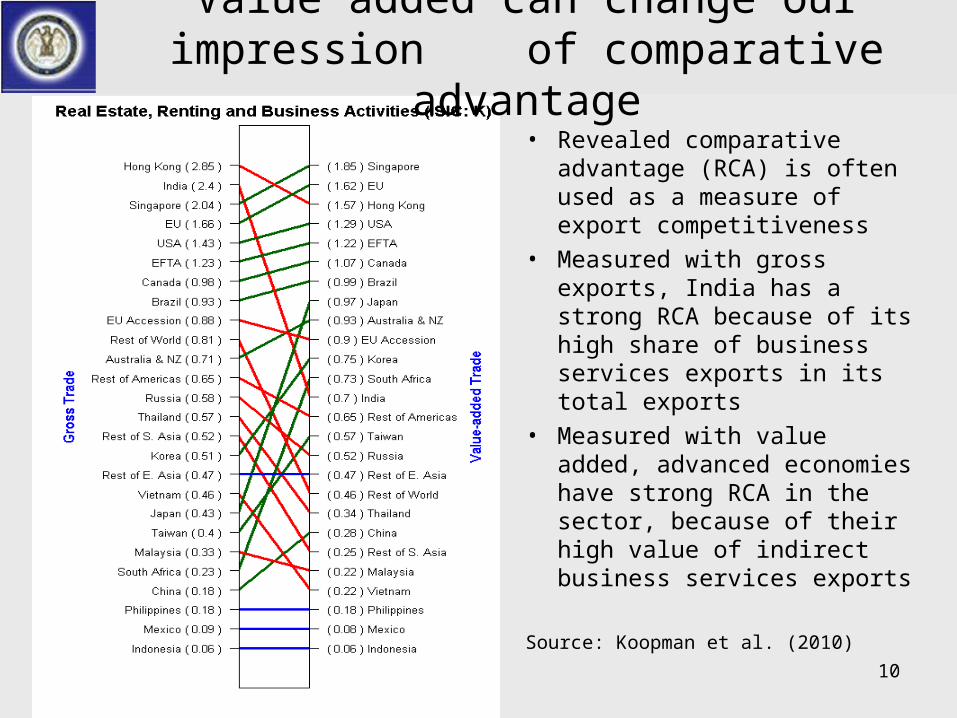
• Revealed comparative advantage (RCA) is often used as a measure of export competitiveness
• Measured with gross exports, India has a strong RCA because of its high share of business services exports in its total exports
• Measured with value added, advanced economies have strong RCA in the sector, because of their high value of indirect business services exports
Source: Koopman et al. (2010) 10
Value added can change our impression of comparative advantage
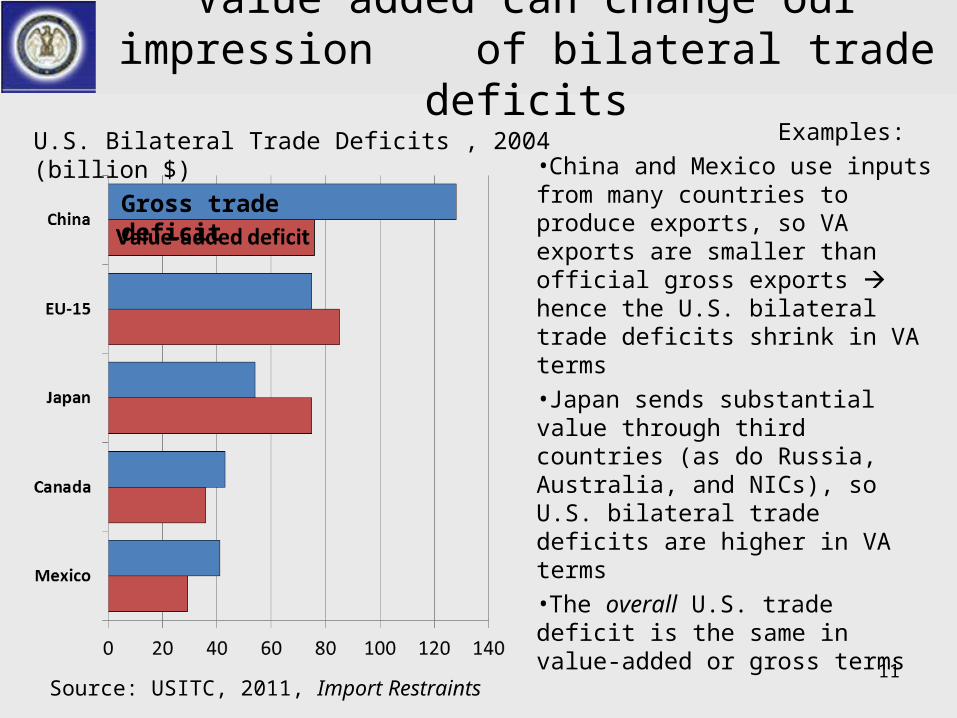
Examples:•China and Mexico use inputs from many countries to produce exports, so VA exports are smaller than official gross exports hence the U.S. bilateral trade deficits shrink in VA terms•Japan sends substantial value through third countries (as do Russia, Australia, and NICs), so U.S. bilateral trade deficits are higher in VA terms•The overall U.S. trade deficit is the same in value-added or gross terms
11
Value added can change our impression of bilateral trade deficits
U.S. Bilateral Trade Deficits , 2004 (billion $)
Gross trade deficit
Source: USITC, 2011, Import Restraints
Conclusions• Single-country IO frameworks can play a role• But ICIO can provide substantial insight, especially when
measures are consistent with official trade flows– Bilateral trade balances– Export strength and revealed comparative advantage– Reliance of exports on imports– Reliance on foreign demand and foreign supply
• “Wish list” for APEC– Disaggregation of all APEC countries and their major trading
partners in ICIO databases– Extension of survey-based ICIO coefficients to additional countries– Better understanding of changes in sources and destinations of
inputs over time 12
Questions/Comments?
• Contact information– Bill Powers– Research Division, Office of Economics– U.S. International Trade Commission– [email protected]
• Sources– Koopman et al., 2010, “Give Credit Where Credit is Due,”
http://www.nber.org/papers/w16426 – USITC, 2011, “The Economic effects of significant U.S. import
restraints,” http://www.usitc.gov/publications/332/pub4253.pdf 13