Embed Size (px)
Citation preview
Give credit where credit is due: Tracing value added in global
production chains
William PowersUnited States International Trade Commission
with Robert Koopman, Zhi Wang, and Shang-Jin Wei
February 4, 2011
The views expressed here are solely those of the presenter. This presentation is not meant to represent the views of the USITC or any of its Commissioners.
2
Presentation outline
• Global value chain: nature and measures• Conceptual framework and its contribution
– Three important matrices based on block-matrix formulation– Integration of other measures in the literature– Decomposition of gross exports completely into value-added
components
• Empirical results– Highlight regional differences in supply chain participation– Show differences in trade costs from multistage production
• Database improvements and limitations– Extensions of the GTAP database– Connection to official statistics
3
Value chains,from a product view to a global view
• What is a global value chain? – A system of value-added sources and destinations within a
globally integrated production network
• Literature– Single product: Dedrick, Kraemer, and Linden (2008)– Single country: Hummels, Ishii, Yi (2001), Koopman et al (2008)– Asian regional chains: Pula and Peltonen (2009); Wang,
Powers, and Wei (2009)– Global snapshot: Daudin, Rifflart, and Schweisguth (2010);
Johnson and Noguera (2010)– Global time series: Erumban et al. (2010); Wang et al. (2010)
4
Global value chains: Multiple measures
• Hummels, Ishii, and Yi (2001) measures of vertical trade– VS: share of imported inputs in exports– VS1: share of exports sent indirectly through third countries
• Newer measures– VAX: domestic value-added in exports (Johnson and Noguera) – VS1*: domestic value-added that returns home (Daudin et al.)
• aka “reflected” exports
• Not previously unified in a fully specified framework – turn to this next
5
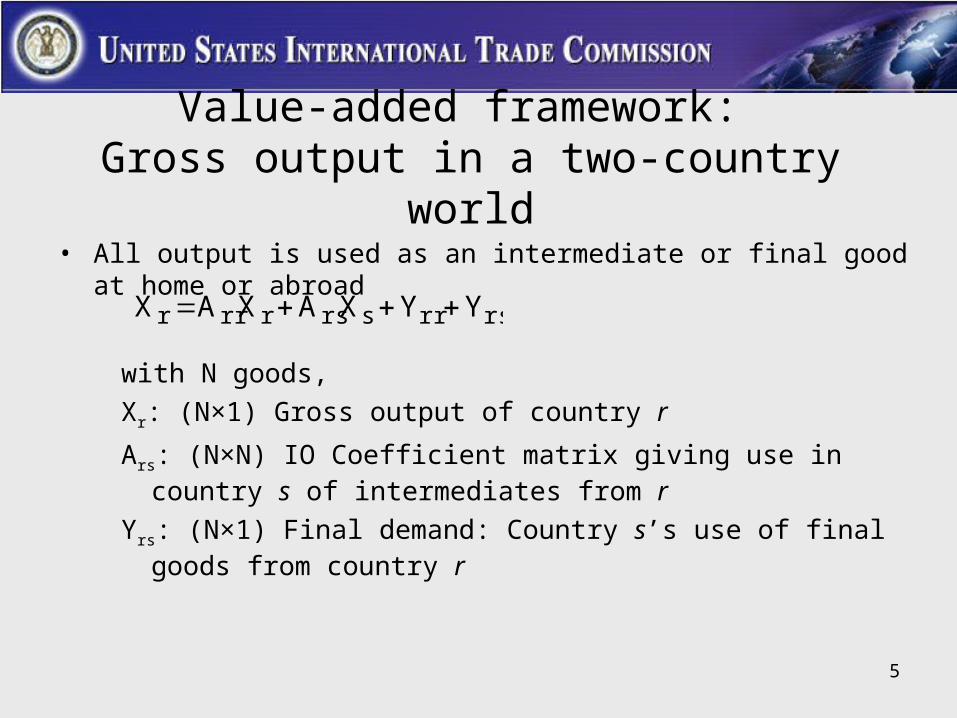
• All output is used as an intermediate or final good at home or abroad
Value-added framework: Gross output in a two-country world
with N goods,
Xr: (N×1) Gross output of country r
Ars: (N×N) IO Coefficient matrix giving use in country s of intermediates from r
Yrs: (N×1) Final demand: Country s’s use of final goods from country r
rsrrsrsrrrr YYXAXAX
6
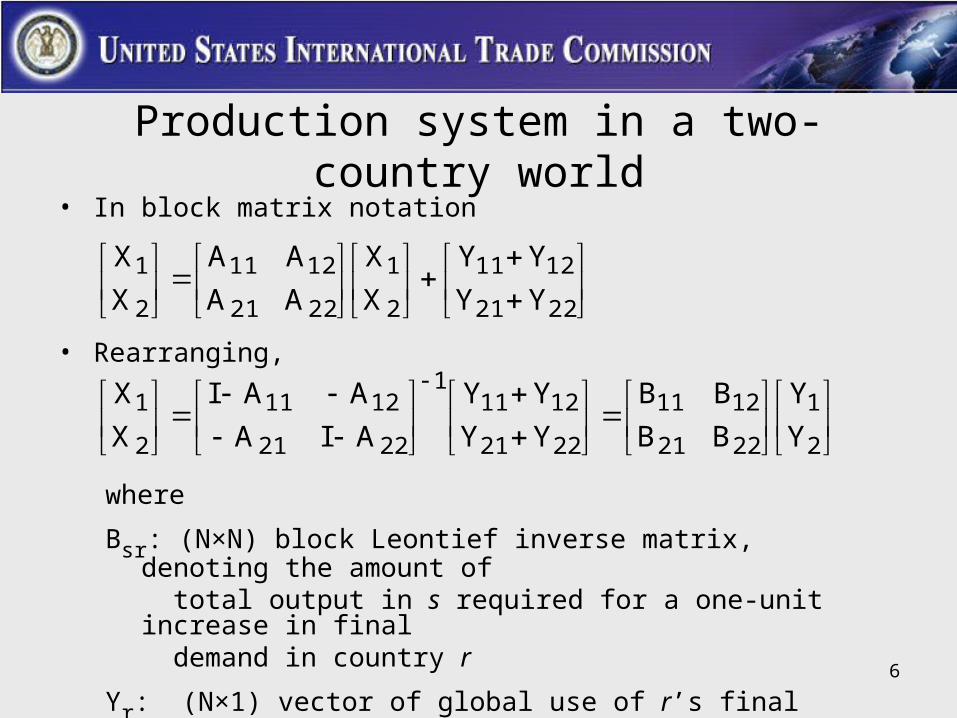
Production system in a two-country world
• Rearranging,
2
1
2221
1211
2221
12111
2221
1211
2
1
Y
Y
BB
BB
YY
YY
AIA
AAI
X
X
where
Bsr: (N×N) block Leontief inverse matrix, denoting the amount of total output in s required for a one-unit increase in final
demand in country r
Yr: (N×1) vector of global use of r’s final goods
• In block matrix notation
2221
1211
2
1
2221
1211
2
1
YY
YY
X
X
AA
AA
X
X
7
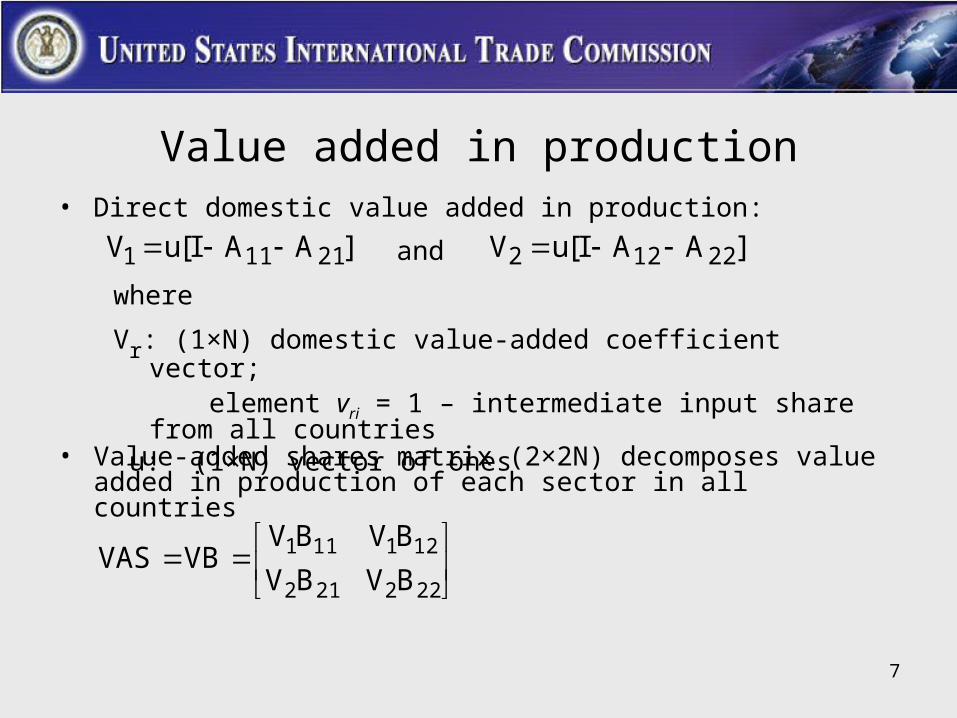
Value added in production
• Value-added shares matrix (2×2N) decomposes value added in production of each sector in all countries
• Direct domestic value added in production:
]AAI[uV 21111 ]AAI[uV 22122 and
where
Vr: (1×N) domestic value-added coefficient vector;
element vri = 1 – intermediate input share from all countries u: (1×N) vector of ones
222212
121111
BVBV
BVBVVBVAS
8
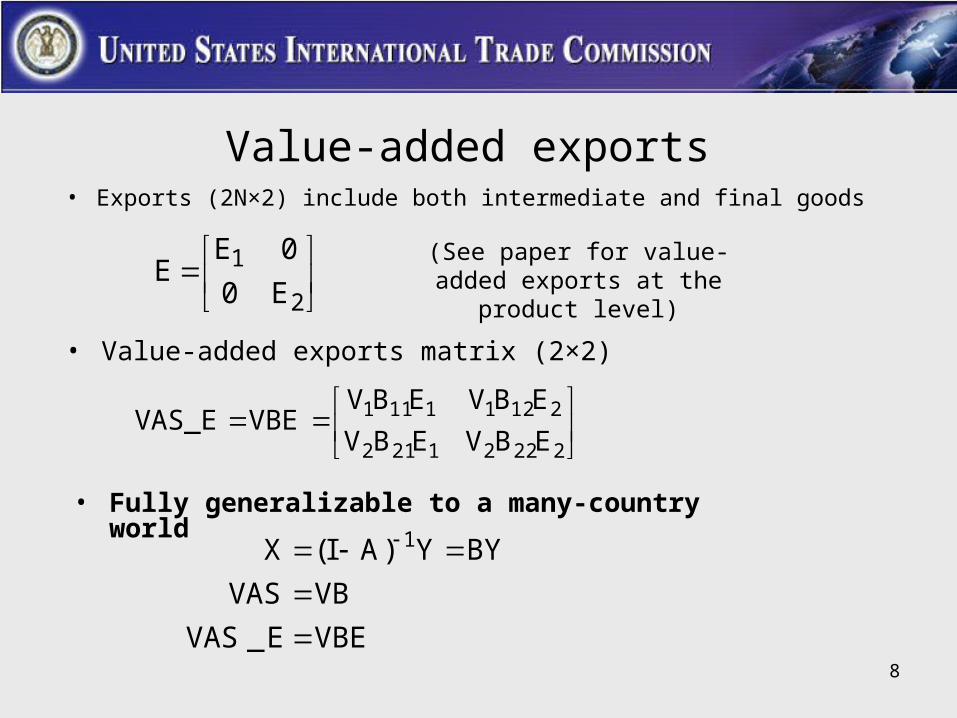
Value-added exports • Exports (2N×2) include both intermediate and final goods
2
1
E0
0EE
(See paper for value-added exports at the product level)
22221212
21211111
EBVEBV
EBVEBVVBEVAS_E
• Value-added exports matrix (2×2)
• Fully generalizable to a many-country world
VBEE_VAS
VBVAS
BYY)AI(X 1
9
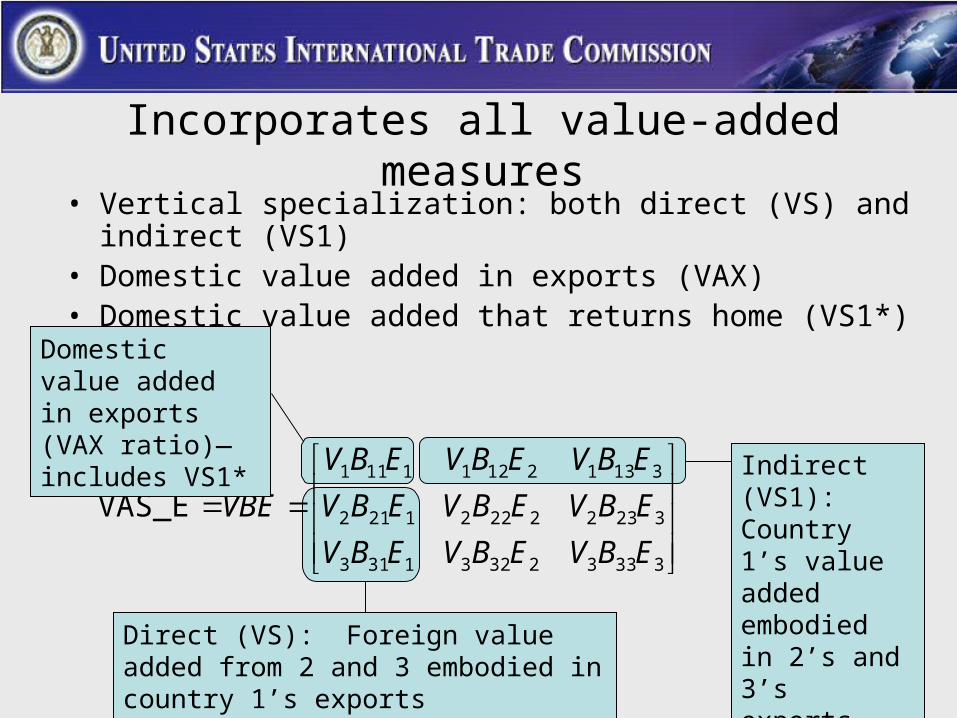
Incorporates all value-added measures• Vertical specialization: both direct (VS) and indirect (VS1) • Domestic value added in exports (VAX)• Domestic value added that returns home (VS1*)
Indirect (VS1): Country 1’s value added embodied in 2’s and 3’s exportsDirect (VS): Foreign value added from 2
and 3 embodied in country 1’s exports
333323231313
323222221212
313121211111
VAS_E
EBVEBVEBV
EBVEBVEBV
EBVEBVEBV
VBE
Domestic value added in exports (VAX ratio)— includes VS1*
10
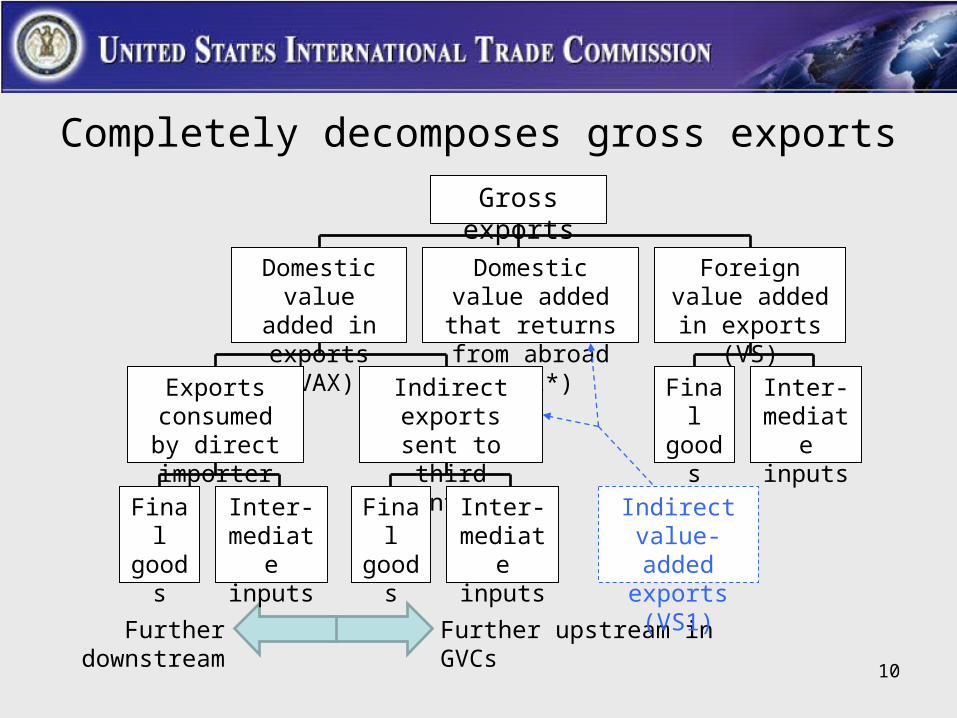
Completely decomposes gross exports
Further upstream in GVCsFurther downstream
Gross exports
Domestic value added in
exports (VAX)
Domestic value added that returns
from abroad (VS1*)
Foreign value added in exports
(VS)
Final goods
Inter-mediate inputs
Indirect exports sent to third
countries
Exports consumed by
direct importer
Final goods
Inter-mediate inputs
Final goods
Inter-mediate inputs
Indirect value-added
exports (VS1)
11
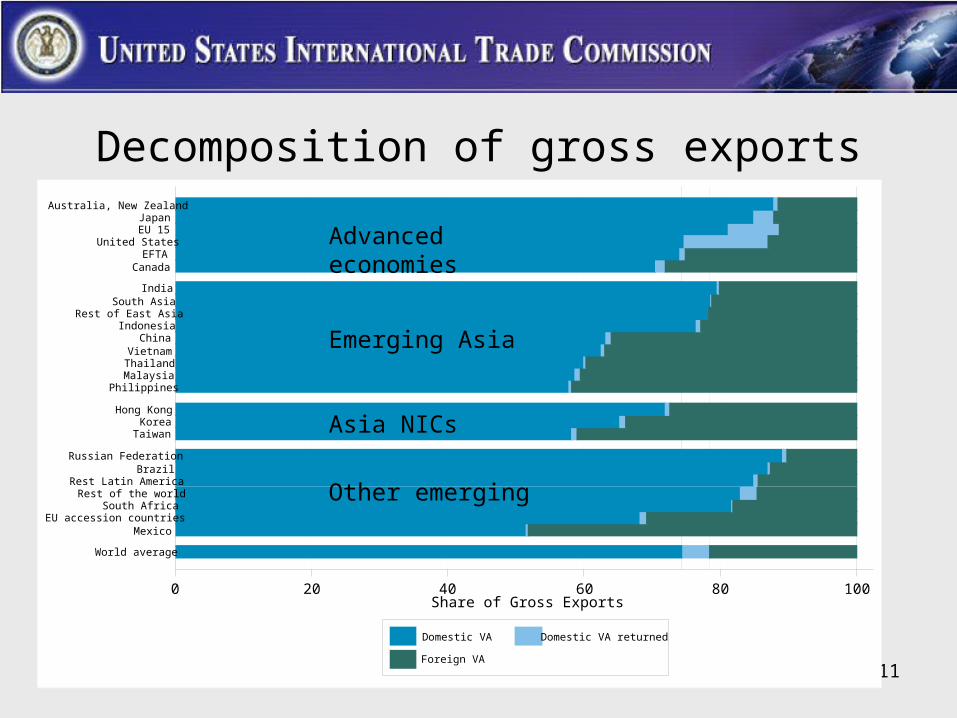
Decomposition of gross exports
0 20 40 60 80 100Share of Gross Exports
World average
MexicoEU accession countries
South AfricaRest of the world
Rest Latin AmericaBrazil
Russian Federation
TaiwanKorea
Hong Kong
PhilippinesMalaysiaThailandVietnam
ChinaIndonesia
Rest of East AsiaSouth Asia
India
CanadaEFTA
United StatesEU 15Japan
Australia, New Zealand
Domestic VA Domestic VA returned
Foreign VA
Advanced economies
Other emerging
Asia NICs
Emerging Asia
12
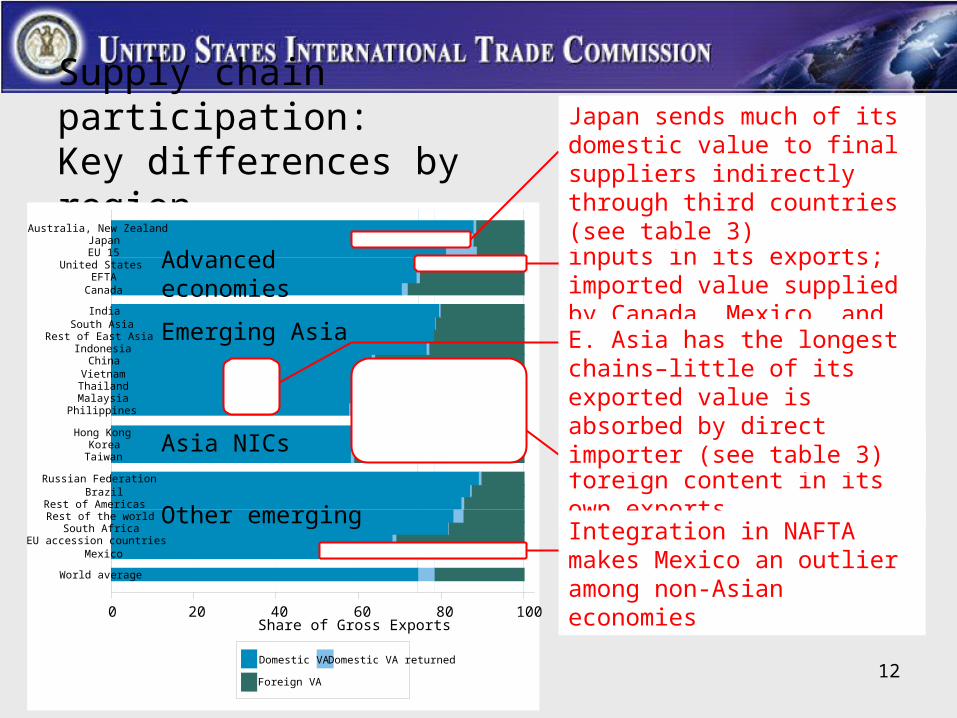
Supply chain participation:Key differences by region
0 20 40 60 80 100Share of Gross Exports
World average
MexicoEU accession countries
South AfricaRest of the world
Rest of AmericasBrazil
Russian Federation
TaiwanKorea
Hong Kong
PhilippinesMalaysiaThailandVietnam
ChinaIndonesia
Rest of East AsiaSouth Asia
India
CanadaEFTA
United StatesEU 15Japan
Australia, New Zealand
Domestic VA Domestic VA returned
Foreign VA
Advanced economies
Other emerging
Asia NICs
Emerging Asia
East Asia has the most foreign content in its own exports
US uses lots of imported inputs in its exports; imported value supplied by Canada, Mexico, and US itself
E. Asia has the longest chains–little of its exported value is absorbed by direct importer (see table 3)
Integration in NAFTA makes Mexico an outlier among non-Asian economies
Japan sends much of its domestic value to final suppliers indirectly through third countries (see table 3)
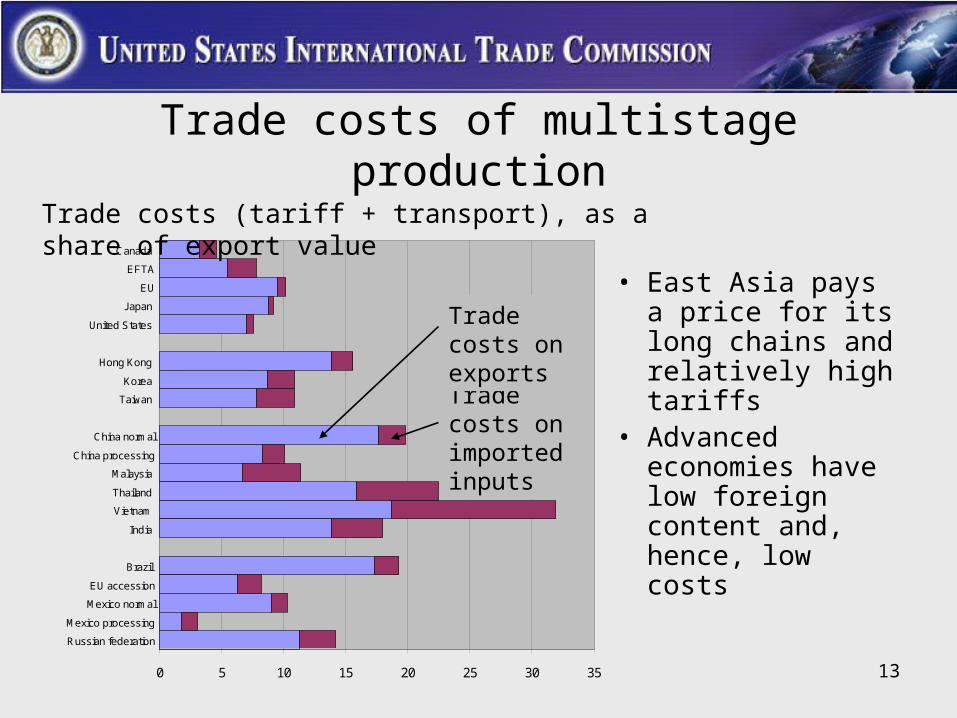
Trade costs of multistage production
• East Asia pays a price for its long chains and relatively high tariffs
• Advanced economies have low foreign content and, hence, low costs
0 5 10 15 20 25 30 35
Canada
EFTA
EU
Japan
United States
Hong Kong
Korea
Taiwan
China normal
China processing
Malaysia
Thailand
Vietnam
India
Brazil
EU accession
Mexico normal
Mexico processing
Russian federation
Trade costs on imported inputs
Trade costs (tariff + transport), as a share of export value
Trade costs on exports
13
14
Database development:Estimating a global Inter-Region IO table
• Start with 2004 GTAP global trade and prod’n database • Add additional detail on source and use of intermediate
inputs and final goods (elements of Ars)• Use end-use categories of detailed trade data (HS6) to
improve imported intermediate use coefficients – UN Broad Economic Classification (BEC) distinguishes
intermediate inputs from final goods in imports from each source in each sector
– BEC is better than the alternative: Proportional method assumes the intermediate share in imports from each source is the same as in the home country’s domestic supply
15
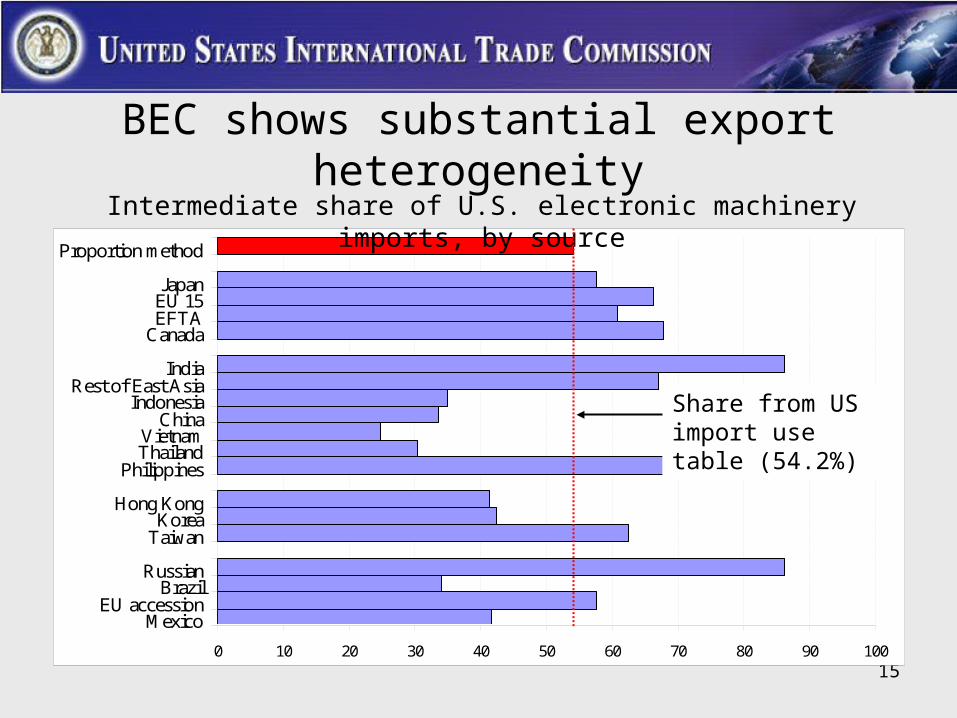
BEC shows substantial export heterogeneity
0 10 20 30 40 50 60 70 80 90 100
Proportion method
JapanEU 15EFTA
Canada
IndiaRest of East Asia
IndonesiaChina
VietnamThailand
Philippines
Hong KongKorea
Taiwan
RussianBrazil
EU accessionMexico
Intermediate share of U.S. electronic machinery imports, by source
Share from US import use table (54.2%)
16
Benefits and limitations of end-use classifications
• End-use classifications improve estimates of intermediate inputs entering the importing country
• Still have to assume proportionality to allocate intermediate inputs to each industry within the importing country– Required data not reported by most national statistical agencies– Problem noted by Committee on Economic Statistics of the
American Economic Association (Feenstra et al., 2010)
• Industry-level estimates of value-added trade may be unreliable with unknown biases, despite their theoretical tractability
Conclusions
• New value-added framework– Generalizes and harmonizes all measures in the
literature– Accounts for the entirety of gross trade– Provides new detail on regional differences in supply
chain activity and costs
• It is now possible to measure trade in value-added terms consistent with official statistics– Ideal database would be consistent with both official
trade statistics and national income accounts
17
Questions/Comments?
• Contact information– Bill Powers– Research Division, Office of Economics– U.S. International Trade Commission– [email protected]– (202) 708-5405
18


![arXiv:2006.05914v1 [cs.CR] 10 Jun 2020 · Abstract Contact tracing apps running on mobile devices promise to reduce the manual effort re-quired for identifying infection chains and](https://img.pdfslide.net/doc/110x75/5f4bd03f0580064c1d1e91cc/arxiv200605914v1-cscr-10-jun-2020-abstract-contact-tracing-apps-running-on.jpg)