1
Glacial Lake Outburst Floods in the Karakoram Mountains, P.R. China Early warning and climate change monitoring Christoph Haemmig 1 , Hansrudolf Keusen 1 and Josef Hess 2 INTRODUCTION In the last decade, 5 glacial lake outburst floods (GLOF) damaged infrastructure and claimed human lives along Yarkant River, Xinjiang, P.R. China. The spontaneous floods are a threat for over 1 Mio inha- bitants in the floodplains of Yarkant River and are causing an annual monetary loss of approx. 10 Mio Euro. Yarkant River drains the Karakoram Mountains with a catchment area of 50’248 km 2 and ranks as number one in terms of flood frequency and damages in Xinjiang. The glacial outburst floods with peak discharges of up to 6’000 m 3 /s originate from a remote ice-dammed glacier lake at 4’750 m a.s.l. in the Shaksgam Valley, approx. 560 km upstream of the floodplains. There, the Kyagar Glacier snout blocks the riverbed. Hence, a lake with a volume over 200 Mio m 3 has built-up periodically in the past. GOALS AND ACTIVITIES The activities aim to improve the management of the high flood risks of Yarkant River, predominantly caused by glacial lake outburst floods and the long-term monitoring of the respective glaciers and out- burst hazards. The actions are structured into three phases: 1) Establishment of an Early Warning System (EWS) for GLOFs (realized in 2011) 2) Risk management for the potential flood areas (to be realized in 2012 and ongoing) 3) Climate Change monitoring and analysis (started 2011 and ongoing) TERRESTRIAL OBSERVATION STATION A terrestrial solar powered gauge and warning station was installed along Keleqin River, approx. 200-km downstream of Kyagar Glacier Lake. Radar sensors are continuously logging the water level and images of Keleqin River are taken. All data is automatically transmitted by satellite communication to the decision-makers. In case of a detected GLOF, an automatically generated alarm-signal will immediately be sent to mobile phones of the Chinese authorities. Thus, emergency actions can be initiated. After the alarm-signal has been transmitted from the gauge and warning station, approx. 22 hours remain before the flood will reach the settlement area in the floodplains. CONCEPT OF EARLY WARNING AND MONITORING Because the hazardous glacier lake is situated in a very remote area, the methods focus on satellite remote sensing and automatic terrestrial observation and warning stations. VOLUMES OF HISTORIC AND PRESENT GLACIAL LAKES The volumes of impounded lake water are crucial for the floods in the lower reaches. Using optical sa- tellite images, extents and volumes of former glacial lakes could be calculated from 1976 – 2009. At present, the maximum potential lake volume is estimated to be approx. 22 Mio. m 3 . Comparing this value with historic records makes clear, that the volume of GLOFs from Kyagar Lake has decreased over time. SATELLITE REMOTE SENSING The hazard level for a spontaneous GLOF is preliminarily assessed through the lake volume. Based on periodically tasked very high resolution Synthetic Aperture Radar (SAR) data, the existence and extent of a glacial lake can be clearly identified. Combining the shoreline with the digital elevation model (DEM), the volume can be calculated. In 2011, the evolution of the glacier lake was observed within a time interval of up to 11 days. The current hazard level was then analyzed and transmitted to the Chine- se decision-makers. CONCLUSIONS AND OUTLOOK The automatic gauge and warning station is fully operational. Both water level fluctuations and EWS func- tionality are continuously monitored. Because the potential volume of Kyagar Glacier Lake strongly depends on the thickness of its blocking ice-dam, mass-balance calculations in terms of accelerated melting of Kyagar Glacier are crucial. A mean ice thickness change of -47.5 m was observed at the glacier tongue based on the comparison of digital el- evation models between 2002 and 2011. Such calculations are needed to define future hazard scenarios. ACKNOWLEDGMENTS Based on a Memorandum of Understanding between the Ministry of Water Resources of P.R. China (MWRC) and the Swiss Federal Depart- ment of the Environment, Transport, Energy and Communications (DETEC), it was decided to initiate a Sino-Swiss project to improve risk as- sessment and mitigation with respect to climate change, combining various technologies and know-how. The project is supported by a coopera- tion between the Swiss Agency for Development and Cooperation (SDC) and the Federal Office for the Environment (FOEN). On the Chinese side, the project is supported by local authorities, such as the Xinjiang Kashgar Hydrographic & Water Resources Survey Bureau. The Sino-Swiss project is based on a strong collaboration and experience exchange between experts from both countries which aim to imple- ment practicable, cost-efficient and sustainable measures. 1 Christoph Haemmig. Geotest AG, Switzerland (email: [email protected]) 1 Dr. Hansrudolf Keusen. Geotest AG, Birkenstrasse 15, 3052 Zollikofen, Switzerland (email: [email protected]) 2 Dr. Josef Hess. Federal Office for the Environment, Executive Director LAINAT, Switzerland (email: [email protected]) 0°N 5°N 85°E 90°E 80°E 90°E 85°E 80°E 75°E 35°N 40°N N T a r i m R i v e r Y a r k a n t R i v e r Taklamakan Desert Kashi Shache Urumqi K u n l u n S h a n K a r a k o r a m T i e n S h a n Zepu Yecheng Markit Shaksgam Valley 1 2 C H I N A Aghil Pass K2 S h a k s g a m V a l l e y K a r a k o r a m Y a r k a n t R i v e r Y a r k a n t R i v e r K e l e q i n R i v e r 1 2 3 4 5 6 2 3 Cha Hekou 1 2 3 4 5 Gasherbrum Glacier Urdok Glacier Stagar Glacier Tramkanri Glacier Kyagar Glacier South Victory Pass Glacier Kyagar Glacier Lake Gauge and Warning Station 6 N N 0 10 20 km K y a g a r G l a c i e r U p p e r S h a k s g a m V a l l e y 0 1 2 km N N 3 0 30 25 20 15 10 5 0 Radar Distance to Water Level (m) 29 Sep. 30 Sep. 1 Okt. 2 Okt. 3 Okt. 4 Okt. 5 Okt. 6 Okt. 0 5 10 15 20 25 30 35 29 Sep. 30 Sep. 1 Okt. 2 Okt. 3 Okt. 4 Okt. 5 Okt. 6 Okt. 8 9 10 11 12 13 14 15 16 Battery (V) Temperature (°C) Data processing Calculation of lake volume, estimation of meltwater flux Identification of hazard level Communicaton of hazard level to the decision- makers (Early Warning) Communicaton of non existing hazard level to the decision-makers Glacier Lake? YES NO high (immediate hazard of a spon- taneous GLOF with considerable volumes) medium (possible hazard of a spontaneous GLOF with moderate volumes) low (unlikely hazard of a spontaneous GLOF with small volumes) increase frequency of data acquisition continue data acqisition at low frequency continue data acqisition at low frequency increased state of alert of local authorities Massbalance 2002 till 2011 +20 till + 40 m +10 till +2 0m - 10 till -20 m - 20 till -40 m - 40 till -60 m - 60 till -80 m - 80 till -100 m - 100 till -120 m - 120 till -140 m Margin of visible glacier-ice 2011 0 500 1'000 1'500 Meters Satellite image: WV-2, 26.06.2011 ¯ 2009.07.27 2006.07.03 2005.04.27 2004.09.15 2002.08.09 1998.10.09 1979.06.07 1977.07.14 1976.06.13 Maximum (historic) 0 1 2 km potential lake 2011 (22.5 Mio m 3 ) 0 1'000 Meters Volume loss 2002 - 2011:171.3 Mio m 3 / 3.6 Mio m 2 Average height loss: 47.5 m in 9 years Date Occur- rence of glacier lake Volume of glacier lake [m 3 ] Hazard level In – and outflow of the glacier basin Remarks 27.08.2011 yes min. 45’000 max. 95’000 very low Inflow: large Outflow: large Lake surface is similar to August 5 th 2011 Data: SAR backscatter (Terrasar-X) 07.09.2011 yes min. 45’000 max. 95’000 very low Inflow: moderate Outflow: moderate Lake surface is similar to August 27 th 2011 Data: SAR backscatter (Terrasar-X) 18.09.2011 yes approx. 50’000 very low Inflow: minor Outflow: moderate Lake surface is approx. 50% smaller than 07.09.2011 Data: SAR backscatter (Terrasar-X) 21.10.2011 no - - Inflow: dry Outflow: minor Lake disappeared Data: SAR backscatter (Terrasar-X) Date of observation Volume [Mio m 3 ] Elevation of shore line [m a.s.l.] Area [km 2 ] historic Max. 234 4'852 5 13.06.1976 3.4 4'745 0.3 14.07.1977 42.4 4'789 1.7 07.06.1979 18.1 4'770 1.0 15.11.1998 121.4 4'819 3.4 09.08.2002 94.8 4'810 2.8 15.09.2004 63.4 4'792 2.1 27.04.2005 4.1 4'741 0.3 03.07.2006 9.5 4'749 0.5 27.07.2009 44.8 4'781 1.6 K e l eq i n R i v e r Zepu Shache Markit 60 0 40 20 km N N G L O F G L O F Server 22 h End-user Satellite (SAR) remote sensing Gauge and Warning Station a l a r m m o n i t o r i n g h a z a r d p ot e n t i a l Y a r k a n t R i v e r N N N N N N 3 Identification of the glaci- al lake and its hazard po- tential based on satellite data (TerraSAR-X, July 25th, 2011). The glacial lake is marked with blue colour. Concept of the Early Warning System, combining satellite remote sensing and automatic terrestrial observation stations. Situation of Yarkant River in the Tarim Basin , Shaksgam Valley and Kyagar Glacier Mass-balance calculations based on detailed DEMs indicate an average ice thickness loss at the glacier tongue of 47.5 m between 2002 and 2011. Observed glacial lakes based on satellite data from 1976 – 2009. Because the satellite images are not consistent with the timing of outburst events, the actual maximum volume cannot be calcula- ted. The present potential lake volume is approx. 22 Mio m 3 (hatched surface). System check Gauge and Warning Station Water level Automatic observation and warning station at Keleqin River, Cha Hekou. Left: Flow-chart indicates the pro- cedure for early warning. 2 1

Glacial Lake Outburst Floods in the Karakoram Mountains, P.R. China

Embed Size (px)

Citation preview

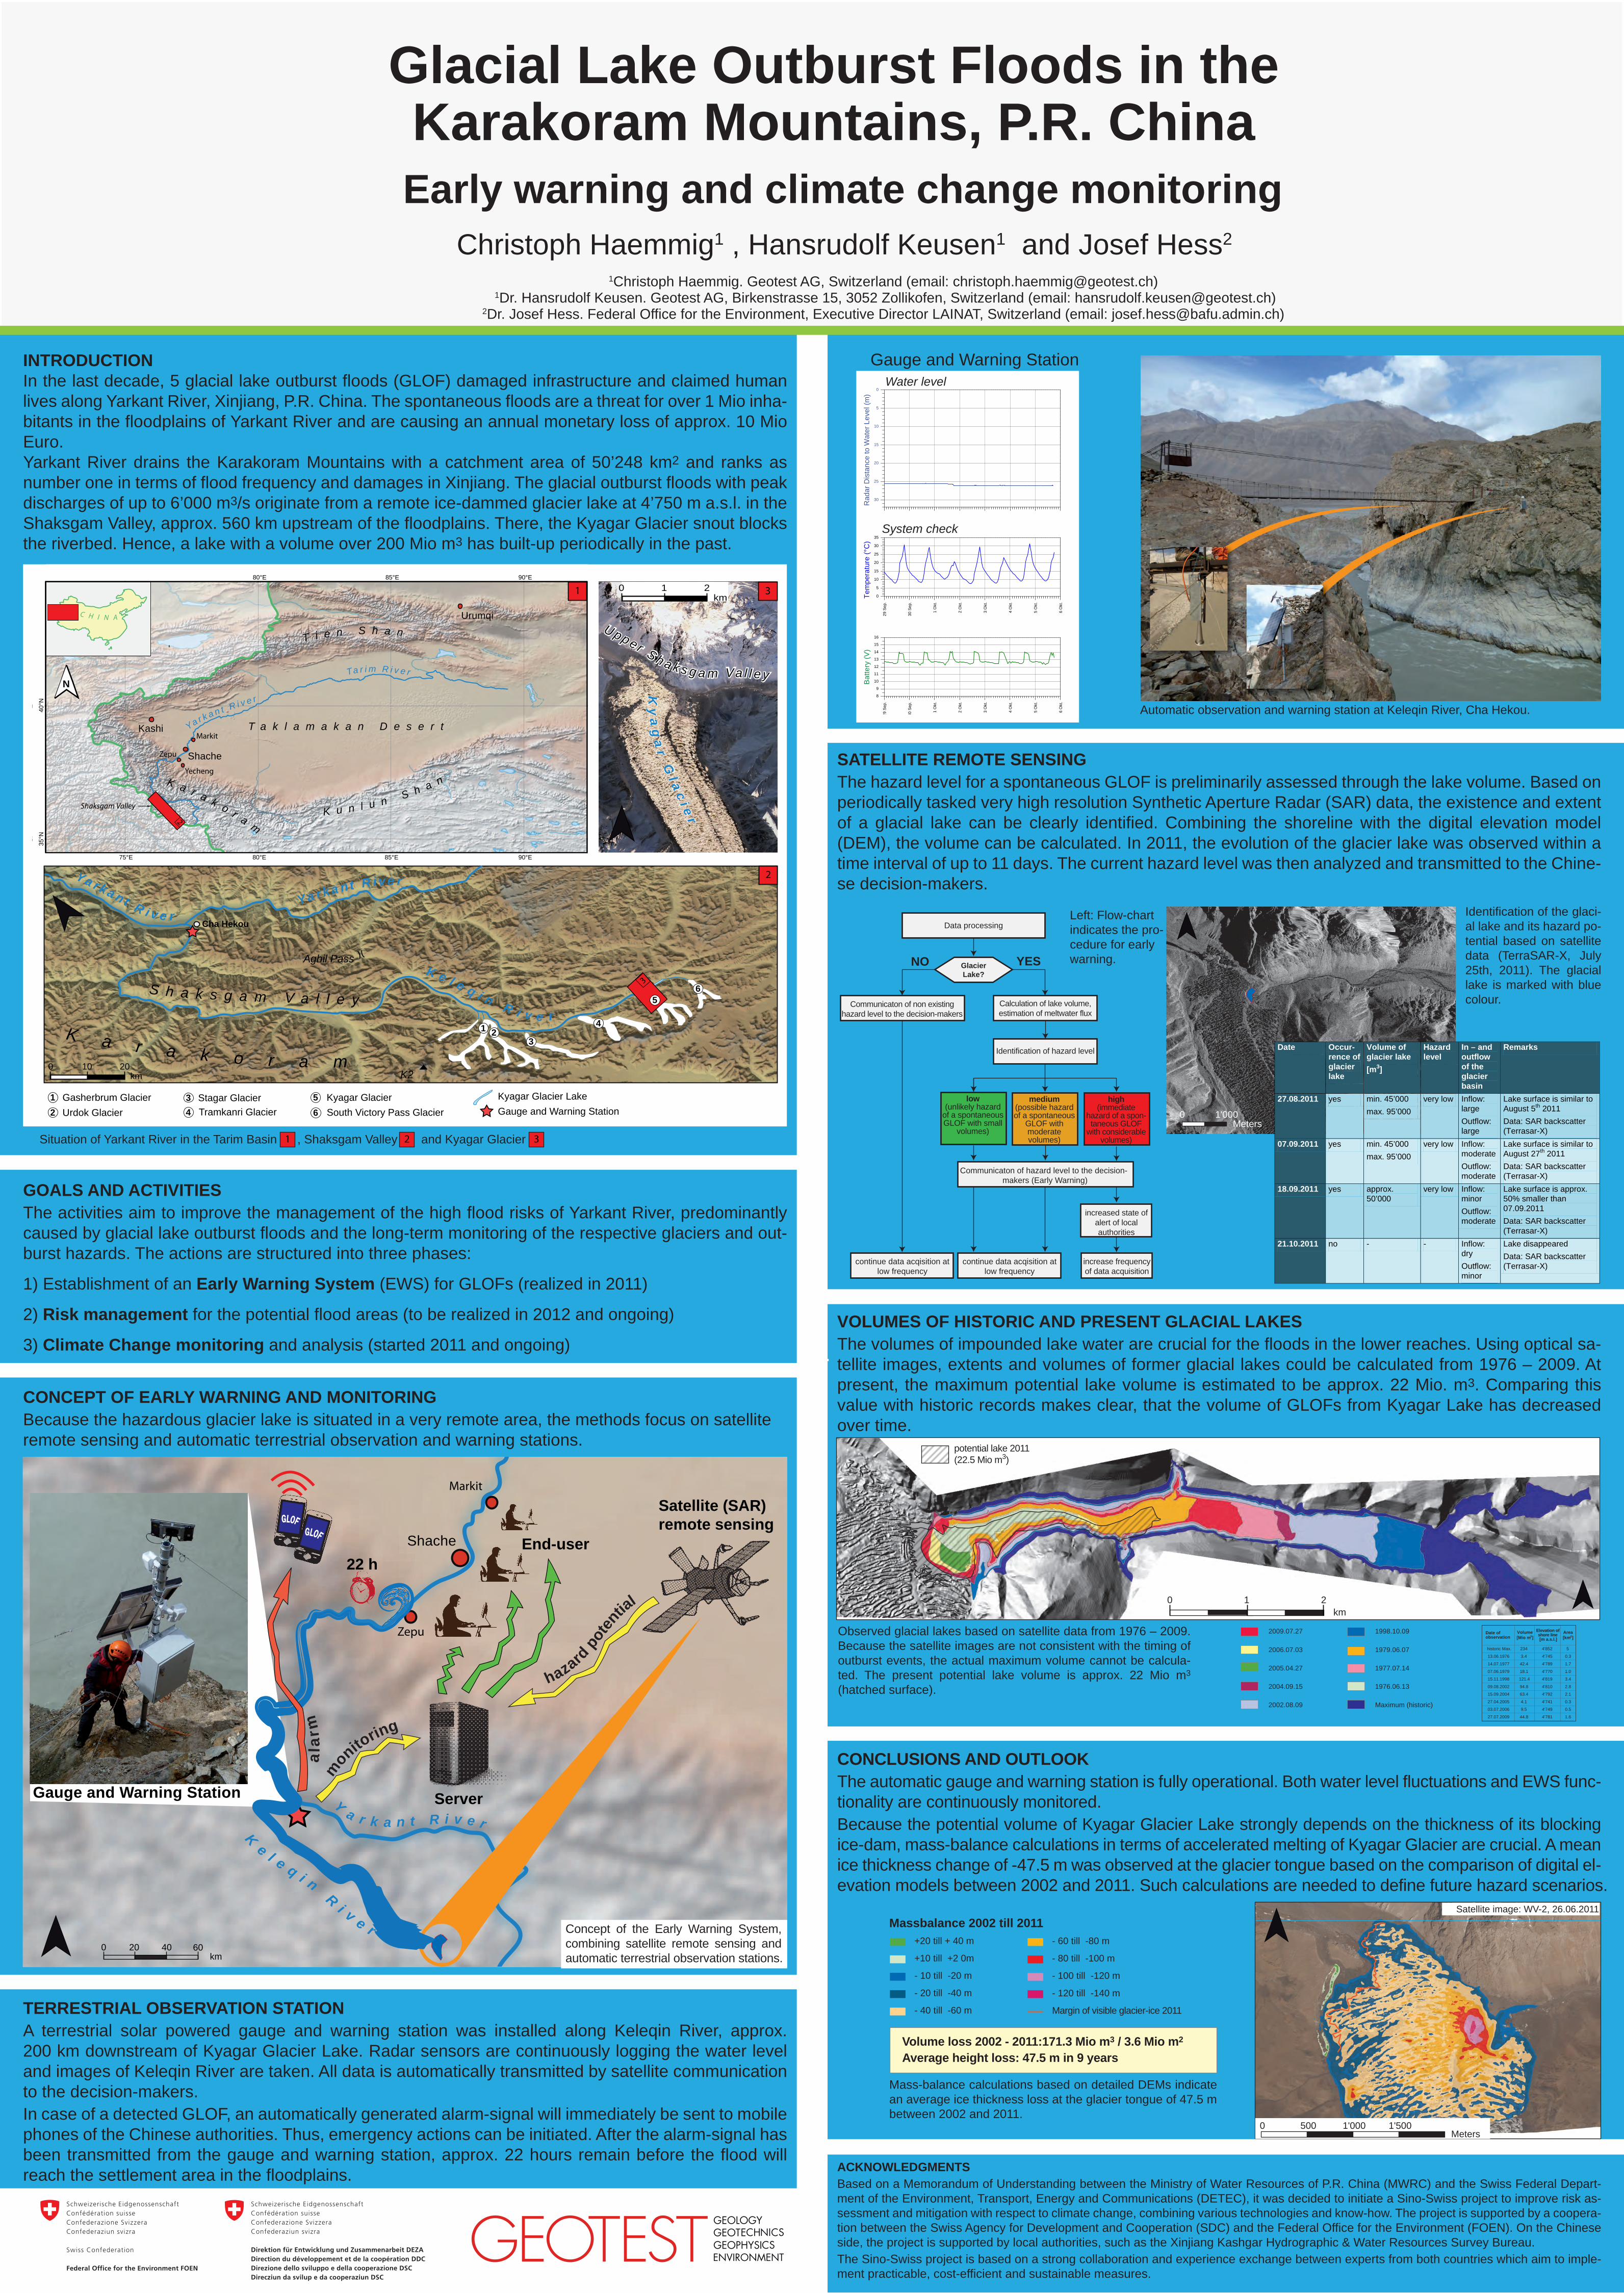
Glacial Lake Outburst Floods in theKarakoram Mountains, P.R. ChinaEarly warning and climate change monitoring

Christoph Haemmig1 , Hansrudolf Keusen1 and Josef Hess2

INTRODUCTIONIn the last decade, 5 glacial lake outburst floods (GLOF) damaged infrastructure and claimed human lives along Yarkant River, Xinjiang, P.R. China. The spontaneous floods are a threat for over 1 Mio inha-bitants in the floodplains of Yarkant River and are causing an annual monetary loss of approx. 10 Mio Euro.Yarkant River drains the Karakoram Mountains with a catchment area of 50’248 km2 and ranks as number one in terms of flood frequency and damages in Xinjiang. The glacial outburst floods with peak discharges of up to 6’000 m3/s originate from a remote ice-dammed glacier lake at 4’750 m a.s.l. in the Shaksgam Valley, approx. 560 km upstream of the floodplains. There, the Kyagar Glacier snout blocks the riverbed. Hence, a lake with a volume over 200 Mio m3 has built-up periodically in the past.

GOALS AND ACTIVITIESThe activities aim to improve the management of the high flood risks of Yarkant River, predominantly caused by glacial lake outburst floods and the long-term monitoring of the respective glaciers and out-burst hazards. The actions are structured into three phases:

1) Establishment of an Early Warning System (EWS) for GLOFs (realized in 2011)

2) Risk management for the potential flood areas (to be realized in 2012 and ongoing)

3) Climate Change monitoring and analysis (started 2011 and ongoing)

TERRESTRIAL OBSERVATION STATIONA terrestrial solar powered gauge and warning station was installed along Keleqin River, approx. 200-km downstream of Kyagar Glacier Lake. Radar sensors are continuously logging the water level and images of Keleqin River are taken. All data is automatically transmitted by satellite communication to the decision-makers.In case of a detected GLOF, an automatically generated alarm-signal will immediately be sent to mobile phones of the Chinese authorities. Thus, emergency actions can be initiated. After the alarm-signal has been transmitted from the gauge and warning station, approx. 22 hours remain before the flood will reach the settlement area in the floodplains.

CONCEPT OF EARLY WARNING AND MONITORINGBecause the hazardous glacier lake is situated in a very remote area, the methods focus on satellite remote sensing and automatic terrestrial observation and warning stations.

VOLUMES OF HISTORIC AND PRESENT GLACIAL LAKESThe volumes of impounded lake water are crucial for the floods in the lower reaches. Using optical sa-tellite images, extents and volumes of former glacial lakes could be calculated from 1976 – 2009. At present, the maximum potential lake volume is estimated to be approx. 22 Mio. m3. Comparing this value with historic records makes clear, that the volume of GLOFs from Kyagar Lake has decreased over time.

SATELLITE REMOTE SENSINGThe hazard level for a spontaneous GLOF is preliminarily assessed through the lake volume. Based on periodically tasked very high resolution Synthetic Aperture Radar (SAR) data, the existence and extent of a glacial lake can be clearly identified. Combining the shoreline with the digital elevation model (DEM), the volume can be calculated. In 2011, the evolution of the glacier lake was observed within a time interval of up to 11 days. The current hazard level was then analyzed and transmitted to the Chine-se decision-makers.

CONCLUSIONS AND OUTLOOKThe automatic gauge and warning station is fully operational. Both water level fluctuations and EWS func-tionality are continuously monitored.Because the potential volume of Kyagar Glacier Lake strongly depends on the thickness of its blocking ice-dam, mass-balance calculations in terms of accelerated melting of Kyagar Glacier are crucial. A mean ice thickness change of -47.5 m was observed at the glacier tongue based on the comparison of digital el-evation models between 2002 and 2011. Such calculations are needed to define future hazard scenarios.

ACKNOWLEDGMENTSBased on a Memorandum of Understanding between the Ministry of Water Resources of P.R. China (MWRC) and the Swiss Federal Depart-ment of the Environment, Transport, Energy and Communications (DETEC), it was decided to initiate a Sino-Swiss project to improve risk as-sessment and mitigation with respect to climate change, combining various technologies and know-how. The project is supported by a coopera-tion between the Swiss Agency for Development and Cooperation (SDC) and the Federal Office for the Environment (FOEN). On the Chinese side, the project is supported by local authorities, such as the Xinjiang Kashgar Hydrographic & Water Resources Survey Bureau.The Sino-Swiss project is based on a strong collaboration and experience exchange between experts from both countries which aim to imple-ment practicable, cost-efficient and sustainable measures.

1Christoph Haemmig. Geotest AG, Switzerland (email: [email protected]) 1Dr. Hansrudolf Keusen. Geotest AG, Birkenstrasse 15, 3052 Zollikofen, Switzerland (email: [email protected])

2Dr. Josef Hess. Federal Office for the Environment, Executive Director LAINAT, Switzerland (email: [email protected])

90°E

90°E

85°E

85°E

80°E

80°E

75°E

75°E

40°N 40°N

35°N 35°N

85°E 90°E80°E

90°E85°E80°E75°E

35°N40°N

35°N

40°N

NTa r i m R i v e r

Ya r k a n t R i v e r

T a k l a m a k a n D e s e r tKashi

Shache

Urumqi

K u n l u n S h a nK a r a k o r a m

T i e n S h a n

Zepu

Yecheng

Markit

Shaksgam Valley

1

2

C H I N A

Aghil Pass

K2

S h a k s g a m V a l l e y

K a r a k o r a m

Ya rka n t R i ve rYa rka n t R i v e r

K e l e q i n R i v e r1 2

3

4

56

2

3

Cha Hekou

12

34

5Gasherbrum GlacierUrdok Glacier

Stagar GlacierTramkanri Glacier

Kyagar GlacierSouth Victory Pass Glacier

Kyagar Glacier LakeGauge and Warning Station6

NN

0 10 20km

Ky

ag

ar G

l ac

i er

Uppe r S h a k s g a m Va l l e y

0 1 2km

NN

3

21 M

rz.

22 M

rz.

23 M

rz.

24 M

rz.

25 M

rz.

26 M

rz.

27 M

rz.

28 M

rz.

30

25

20

15

10

5

0

30

25

20

15

10

5

0

Rad

ar 2

Dis

tanc

e to

Wat

er L

evel

(m)

Rad

ar D

ista

nce

to W

ater

Lev

el (m

)

29 S

ep.

30 S

ep.

1 O

kt.

2 O

kt.

3 O

kt.

4 O

kt.

5 O

kt.

6 O

kt.

0

5

10

15

20

25

30

35

29 S

ep.

30 S

ep.

1 O

kt.

2 O

kt.

3 O

kt.

4 O

kt.

5 O

kt.

6 O

kt.

8

9

10

11

12

13

14

15

16

14100149 ChinaLogger Kelquin RiverLast Update: 05.10.2011 18:08 h

GEOTEST

GEOTEST

Bat

tery

(V)

Tem

pera

ture

(°C

)

Data processing

Calculation of lake volume, estimation of meltwater flux

Identification of hazard level

Communicaton of hazard level to the decision-makers (Early Warning)

Communicaton of non existing hazard level to the decision-makers

Glacier Lake?

YESNO

high(immediate

hazard of a spon- taneous GLOF

with considerable volumes)

medium(possible hazard of a spontaneous

GLOF with moderate volumes)

low(unlikely hazard

of a spontaneous GLOF with small

volumes)

increase frequency of data acquisition

continue data acqisition at low frequency

continue data acqisition at low frequency

increased state of alert of local authorities

Massbalance 2002 till 2011+20 till + 40 m

+10 till +2 0m

- 10 till -20 m

- 20 till -40 m

- 40 till -60 m

- 60 till -80 m

- 80 till -100 m

- 100 till -120 m

- 120 till -140 m

Margin of visible glacier-ice 2011

0 500 1'000 1'500Meters

Satellite image: WV-2, 26.06.2011

¯

2009.07.27

2006.07.03

2005.04.27

2004.09.15

2002.08.09

1998.10.09

1979.06.07

1977.07.14

1976.06.13

Maximum (historic)

0 1 2km

potential lake 2011 (22.5 Mio m3)

¯

0 1'000Meters

Volume loss 2002 - 2011:171.3 Mio m3 / 3.6 Mio m2

Average height loss: 47.5 m in 9 years

Date Occur-rence of glacier lake

Volume of glacier lake [m3]

Hazard level

In – and outflow of the glacier basin

Remarks

27.08.2011 yes min. 45’000 max. 95’000

very low Inflow: large Outflow: large

Lake surface is similar to August 5th 2011 Data: SAR backscatter (Terrasar-X)

07.09.2011 yes min. 45’000 max. 95’000

very low Inflow: moderate Outflow: moderate

Lake surface is similar to August 27th 2011 Data: SAR backscatter (Terrasar-X)

18.09.2011 yes approx. 50’000

very low Inflow: minor Outflow: moderate

Lake surface is approx. 50% smaller than 07.09.2011 Data: SAR backscatter (Terrasar-X)

21.10.2011 no - - Inflow: dry Outflow: minor

Lake disappeared Data: SAR backscatter (Terrasar-X)

Date of observation

Volume [Mio m3]

Elevation of shore line [m a.s.l.]

Area [km2]

historic Max. 234 4'852 5

13.06.1976 3.4 4'745 0.3

14.07.1977 42.4 4'789 1.7

07.06.1979 18.1 4'770 1.0

15.11.1998 121.4 4'819 3.4

09.08.2002 94.8 4'810 2.8

15.09.2004 63.4 4'792 2.1

27.04.2005 4.1 4'741 0.3

03.07.2006 9.5 4'749 0.5

27.07.2009 44.8 4'781 1.6

K

e l e q i n Ri v e r

Zepu

Shache

Markit

600 4020km

NN

GLOFGLOF

Server

22 hEnd-user

Satellite (SAR) remote sensing

Gauge and Warning Station

alar

mm

onitoring

hazard po

ten

tial

Ya r k a n t R i v e r

NN

NN

NN

3

Identification of the glaci-al lake and its hazard po-tential based on satellite data (TerraSAR-X, July 25th, 2011). The glacial lake is marked with blue colour.

Concept of the Early Warning System, combining satellite remote sensing and automatic terrestrial observation stations.

Situation of Yarkant River in the Tarim Basin , Shaksgam Valley and Kyagar Glacier

Mass-balance calculations based on detailed DEMs indicate an average ice thickness loss at the glacier tongue of 47.5 m between 2002 and 2011.

Observed glacial lakes based on satellite data from 1976 – 2009. Because the satellite images are not consistent with the timing of outburst events, the actual maximum volume cannot be calcula-ted. The present potential lake volume is approx. 22 Mio m3 (hatched surface).

System check

Gauge and Warning StationWater level

Automatic observation and warning station at Keleqin River, Cha Hekou.

Left: Flow-chart indicates the pro-cedure for early warning.

21