Embed Size (px)
Citation preview
A Comparison of Optic Nerve Head Morphology Viewedby Spectral Domain Optical Coherence Tomographyand by Serial Histology
Nicholas G. Strouthidis,1 Jonathan Grimm,1 Galen A. Williams,1 Grant A. Cull,1
David J. Wilson,2 and Claude F. Burgoyne1
PURPOSE. To compare serial optic nerve head (ONH) histologywith interpolated B-scans generated from a three-dimensional(3-D) spectral domain (SD)-OCT ONH volume acquired in vivofrom the same normal monkey eye.
METHODS. A 15° ONH SD-OCT volume was acquired in a normalmonkey eye, with IOP manometrically controlled at 10 mm Hg.After perfusion fixation at 10 mm Hg, the ONH was trephined,the specimen embedded in a paraffin block, and serial sagittalsections cut at 4-�m intervals. The location of each histologicsection was identified within the optic disc photograph bymatching the position of the retinal vessels and of Bruch’smembrane opening. By altering the angles of rotation andincidence, interpolated B-scans matching the location of thehistologic sections were generated with custom software.Structures identified in the histologic sections were comparedwith signals identified in the matched B-scans.
RESULTS. Close matches between histologic sections and inter-polated B-scans were identified throughout the extent of theONH. SD-OCT identified the neural canal opening as the ter-mination of the Bruch’s membrane–retinal pigment complexand border tissue as the innermost termination of the choroidalsignal. The anterior lamina cribrosa and its continuity with theprelaminar glial columns were also detected by SD-OCT.
CONCLUSIONS. Volumetric SD-OCT imaging of the ONH gener-ates interpolated B-scans that accurately match serial histologicsections. SD-OCT captures the anterior laminar surface, whichis likely to be a key structure in the detection of early ONHdamage in ocular hypertension and glaucoma. (Invest Ophthal-mol Vis Sci. 2010;51:1464–1474) DOI:10.1167/iovs.09-3984
The application of optical coherence tomography (OCT) tech-nology in clinical glaucoma practice has largely centered on
imaging the peripapillary retinal nerve fiber layer. This approach
has shown promise in assisting the clinician in both diagnosingglaucoma and detecting disease progression.1–6 There is mount-ing evidence to suggest that the primary site of injury to the retinalganglion cell axon is at the level of the lamina cribrosa.7–12 Anability to image the lamina cribrosa and other structures deepwithin the optic nerve head (ONH) would therefore constitute amajor advance. Indeed, recent work using postmortem three-dimensional (3-D) histomorphometric ONH reconstructions hasidentified several cardinal morphologic changes at the earlieststage of experimental glaucoma.13–16 These changes include athickening of the prelaminar tissue (as distinct from the thinningone would expect to observe at the later stages of the neuropa-thy), posterior deformation and thickening of the lamina cribrosa,and expansion of the scleral canal. We propose that the identifi-cation of these changes in vivo would help to identify those eyeswith the earliest signs of distress in response to an IOP-mediatedinsult and, as such, at high risk of future functional damage.
The ability of OCT to image retinal morphology has beenvalidated by several seminal studies in which investigators havesought to compare OCT tomograms to conventional serialhistology in humans,17,18 nonhuman primates,19–21 treeshrews,22 rodents,23 and pigs.24 Although not the principalgoal, several of these studies also included brief commentspertaining to ONH and peripapillary retinal morpholo-gy.21,22,24 Besides these commentaries, there have not been, todate, any formal, rigorous comparisons of ONH morphology asimaged by OCT and by light microscopy. An obvious reason forthis is the insufficiency of the axial (depth) resolution of con-ventional time domain OCT (�10 �m) for resolving structuresdeep under the surface of the optic disc cup. With the com-mercial introduction of spectral domain (SD)-OCT, which hasboth an improved axial resolution (approaching 5 �m) andvastly increased acquisition speed, the 3-D detection of deepONH targets has become tangible.
Several recent reports suggest that SD-OCT imaging of thehuman ONH can capture the lamina cribrosa.25,26 Althoughthese reports are encouraging, it is essential that the SD-OCT’sability to capture deep ONH targets be validated by compari-son with conventional serial histology. The purpose of thisstudy was to compare interpolated SD-OCT B-scans generatedfrom a volumetric SD-OCT reconstruction acquired in vivofrom a normal monkey ONH with serial histologic sectionsobtained postmortem from the same ONH. This study requiredthe development of a novel method of generating tailor-madeinterpolated B-scans at any orientation from the 3-D SD-OCTvolume. This method is fully described.
METHODS
ONH ImagingThe study was performed on the left eye of a 6.8-year-old, 4.5-kg femalerhesus macaque (Macaca mulatta). The local Institutional Animal Care
From the 1Optic Nerve Head Research Laboratory, Devers EyeInstitute, Legacy Health System, Portland, Oregon; and the 2Casey EyeInstitute, Oregon Health and Science University, Portland, Oregon.
Supported by an unrestricted educational grant from HeidelbergEngineering and by a Royal College of Ophthalmologists/Pfizer Fellow-ship (NGS); by instrument and unrestricted research funds from Hei-delberg Engineering (CFB); by National Eye Institute Grant R01-EY11610; by Legacy Good Samaritan Foundation; and by Sears MedicalTrust.
Submitted for publication May 13, 2009; revised August 23, 2009;accepted October 5, 2009.
Disclosure: N.G. Strouthidis, Heidelberg Engineering (F); J.Grimm, None; G.A. Williams, None; G.A. Cull, none; D.J. Wilson,None; C.F. Burgoyne, Heidelberg Engineering (F)
Corresponding author: Claude F. Burgoyne, Optic Nerve HeadResearch Laboratory, Devers Eye Institute, 1225 NE 2nd Avenue, POBox 3950, Portland, OR 97208-3950; [email protected].
Glaucoma
Investigative Ophthalmology & Visual Science, March 2010, Vol. 51, No. 31464 Copyright © Association for Research in Vision and Ophthalmology
and Use Committee (Legacy Health System, Portland, OR) approvedthe study, and the subject animal was treated in accordance with theARVO Statement for the Use of Animals in Ophthalmic and VisionResearch.
In vivo imaging with a rigid plano contact lens placed onto thecorneal surface was performed immediately before the animal waskilled. The monkey was anesthetized with ketamine and isoflurane,and the pupil was dilated with 1 drop each of 1% tropicamide, 2.5%phenylephrine hydrochloride, and 2% cyclopentolate hydrochloride.The intraocular pressure (IOP) was adjusted to 10 mm Hg with amanometer connected to a 27-gauge cannula, which was inserted intothe temporal anterior chamber. After IOP of 10 mm Hg was maintainedfor 30 minutes, an experienced technician (GAW) acquired a pair ofleft optic disc stereophotographs with a simultaneous stereo funduscamera (TRC-WT Retinal Camera; Topcon, Paramus, NJ).
SD-OCT imaging of the left ONH was performed with a commer-cially available device (Spectralis; Heidelberg Engineering, Heidelberg,Germany). For the purposes of this study, a horizontal raster scanpattern was acquired with 290 individual horizontal B-scans, 768 A-scans per B-scan, and each B-scan acquired nine times and averaged forspeckle noise reduction. The scan was centered on the ONH, with a15° retinal window. The device’s built-in eye-tracking facility wasturned on during acquisition. The native viewing software automati-cally registered all consecutive B-scans relative to one another in thez-axis.
Perfusion Fixation
At the conclusion of imaging, the animal was killed by perfusionfixation through the descending aorta with 1 L of 4% buffered hyper-tonic paraformaldehyde solution followed by 6 L of 5% buffered hy-pertonic glutaraldehyde solution. IOP was maintained at 10 mm Hg for1 hour, after which the left orbital contents were exenterated via alateral orbitotomy. All orbital tissue was immediately removed from theglobe. The anterior chamber was removed 2 to 3 mm posterior to thelimbus, and the posterior scleral shell with intact optic nerve, ONH,choroid, and retina was placed in 5% glutaraldehyde for storage.
Tissue Preparation
The optic nerve was removed leaving a 3-mm stump attached to theglobe. The ONH and peripapillary sclera were trephined (6 mm indiameter, passed from the vitreous surface through the sclera), and atriangular notch was cut into the superior peripapillary sclera. Thetrephined specimen was photographed at �2 magnification with asingle-lens reflex (SLR) camera (FM2; Nikon, Tokyo, Japan) attached toa dissecting microscope (Stereomaster; Thermo Fisher Scientific, Inc.,Waltham, MA).
Co-localization of the SD-OCT Infra-Red Imagewith the Trephined ONH Image
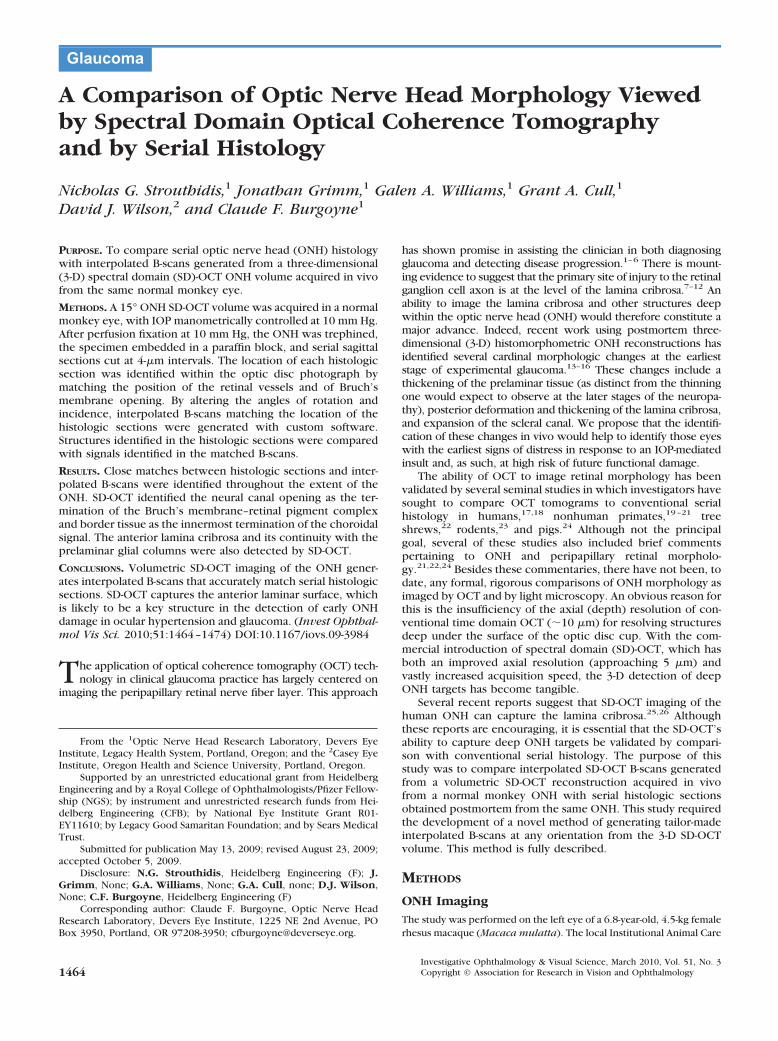
The location of the 15° SD-OCT acquisition window was overlaid ontothe digital image of the trephined ONH specimen to generate histo-logic sections at approximately the same orientation as the acquiredSD-OCT B-scans (Fig. 1). First, the 35-mm color slide image of thespecimen was digitized at a resolution of 4800 dpi with a color-calibrated scanner (ArtixScan M1 Slide Scanner; Microtek Laboratory,Inc., Fontana, CA). Commercially available image-processing software(Adobe Photoshop CS3, Adobe Systems, Inc., San Jose, CA) was used tooverlay the SD-OCT infra-red (IR) image onto the digitized ONH image,by matching the central retinal vessels and their bifurcations. Figure 1Ashows the co-localized IR image, including the SD-OCT acquisitionbox, at 50% opacity, superimposed onto the ONH photograph. Theco-ordinates of the SD-OCT acquisition box were burned onto theimage of the ONH specimen (Fig. 1B).
Tissue Embedding
Three attempts were made to cut the inferior edge of the specimenunder the dissecting microscope parallel to the inferior boundary ofthe co-localized acquisition box. The cuts were made with a single-edged, number 12 industrial razor blade (VWR, West Chester, PA),with the image shown in Figure 1B used as a reference. After each cut,the ONH specimen was rephotographed, and the resultant digitalimage was co-localized to Figure 1B so as to assess the accuracy of thecut relative to the inferior border of the superimposed acquisition box.After each inferior cut was found to be inaccurate, two additional cutswere made on the superior edge of the specimen, the second of whichbest approximated the desired orientation (Fig. 1C). The specimen wasthen embedded in paraffin by using a standard histologic technique,with the superior cut surface facing downward in the block.
Histologic Sectioning and Staining
The ONH specimen block was sectioned at 4-�m intervals with amicrotome (RM 2155; Leica Biosystems, St. Louis, MO). The sectionswere floated in a water bath (56°C) and picked up onto slides thatwere incubated overnight at 60°C. Before staining, the slides weredeparaffinized through two changes of xylene for 5 minutes. The slideswere then hydrated through two changes each of absolute alcohol and95% alcohol followed by one change of 70% alcohol and then a rinsein running tap water.
Every fourth section (16-�m intervals) was stained with hematox-ylin and eosin (HE) by immersion for 4 minutes in Shandon’s instanthematoxylin (Thermo-Fisher Scientific, Inc.), rinsed in running tapwater for 5 minutes, counterstained for 45 seconds in eosin, dehy-drated, and mounted in a synthetic medium (Eukitt; Sigma-Aldrich, St.Louis, MO).
FIGURE 1. Trephining the ONH in the orientation of the acquired B-scan. (A) The SD-OCT IR imageincluding the 15° acquisition box, viewed at 50% opacity, was aligned to an image of the ONH specimen.(B) The coordinates of the acquisition box were burned onto the image. (C) Cuts were made in thespecimen, in an attempt to get the closest approximation to the orientation of the acquired B-scans. Thecut made in the superior part of the specimen (red arrows) most closely matched the acquired B-scanorientation. The specimen was embedded with the superior cut surface facing downward.
IOVS, March 2010, Vol. 51, No. 3 Comparison of Optic Nerve Histology and SD-OCT 1465
In addition to the HE-stained slides, individual unstained slides fromregions of interest within the ONH were selected for alternative stain-ing (all stains acquired from Thermo-Fisher Scientific, Inc.). For Massontrichrome (MT) staining, the deparaffinized, hydrated slides were im-mersed in Weigert’s hematoxylin for 10 minutes and rinsed in runningwater for 10 minutes. They were then immersed in Biebrich scarlet-acid fuchsin for 5 minutes and rinsed in distilled water. Finally, theywere immersed in phosphomolybdic-phosphotungstic acid solutionfor 10 minutes and aniline blue solution for 3 minutes. They wererinsed in distilled water, immersed in 1% glacial acetic acid, dehy-drated, cleared, and mounted. Burke’s modification for the combinedstaining of cells and fibers in the nervous system was used to achieveluxol fast blue/cresyl violet acetate (LFB) staining.27 Finally, stainingwith a 1:1 (vol/vol) mixture of Ponceau-saffron and acid fuchsin wasperformed on a few selected slides, as this is the connective tissue stainused in our 3-D histomorphometric reconstruction technique.12,15,16
Slides selected for comparison with SD-OCT B-scans were imagedat 10� magnification with an inverted microscope (DM IRBE; Leica)and image capture software (Life Science, ver. 8.10.20, Bioquant ImageAnalysis Corp., Nashville, TN).
Orientation of Histologic Sections Relative to theOptic Disc Photograph
The 35-mm color stereo slide pair was digitized as outlined for thephotograph of the trephined specimen (Fig. 2). The HE-stained sec-
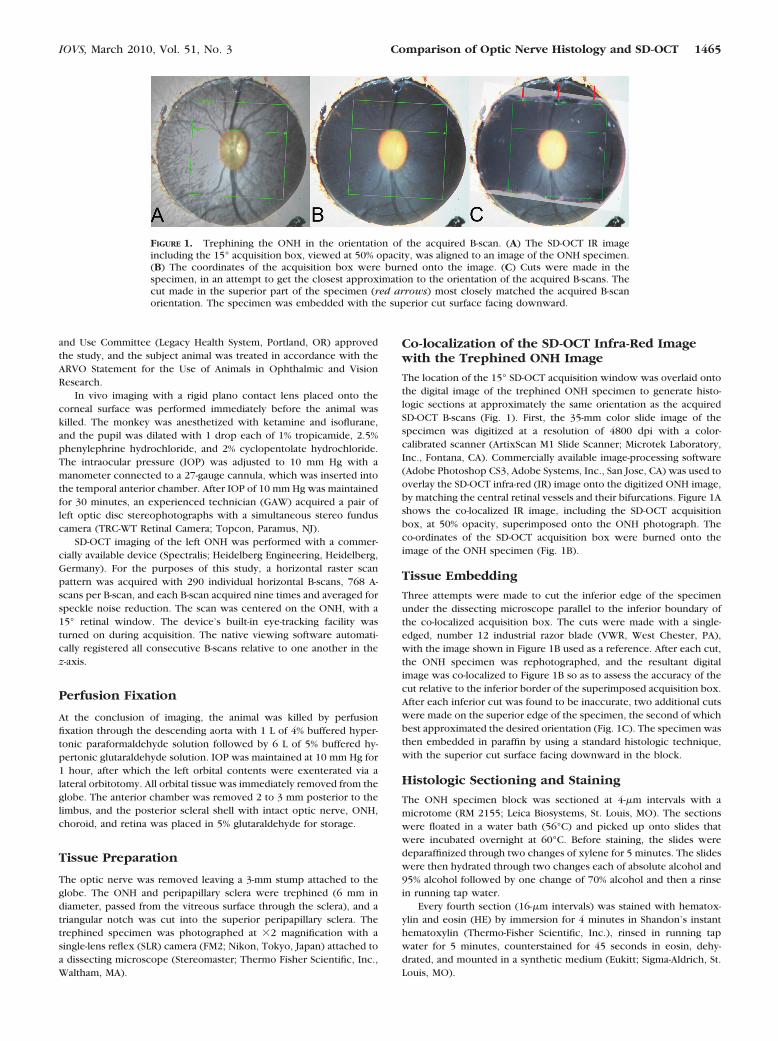
tions (every fourth section) were then reviewed to identify in whichslides the superior and inferior openings in the retinal pigment epithe-lium (RPE) and Bruch’s membrane were present. These slides there-fore served as cardinal orientation slides, corresponding to the superiorand inferior disc margins on the clinical disc photograph.28 The angleof rotation at which each section was acquired was ascertained bytracking the location of each major retinal vessel and its spacingrelative to other vessels and relative to the boundaries of the opticnerve and then referencing to a location on the clinical photographconsistent with these anatomic relationships. The clinical location ofeach histologic section was marked on the disc photograph, whichwas then co-localized and aligned to the en face SD-OCT image byusing the same method.
Generation of Interpolated B-Scans forComparison with Serial Histology
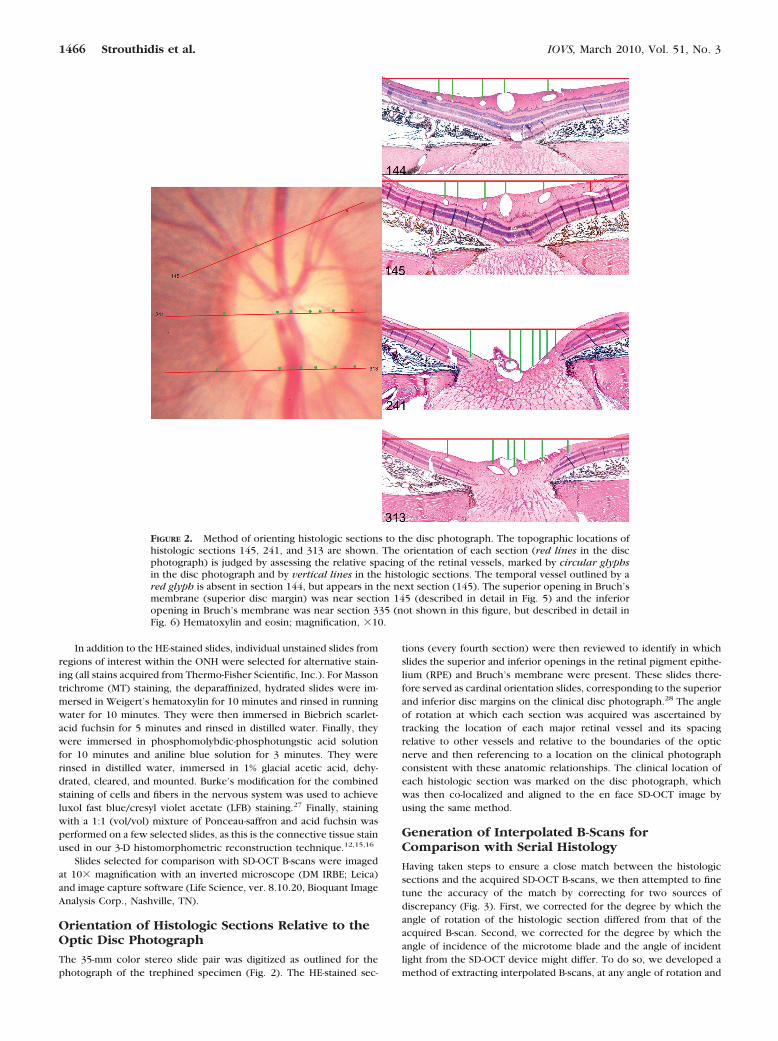
Having taken steps to ensure a close match between the histologicsections and the acquired SD-OCT B-scans, we then attempted to finetune the accuracy of the match by correcting for two sources ofdiscrepancy (Fig. 3). First, we corrected for the degree by which theangle of rotation of the histologic section differed from that of theacquired B-scan. Second, we corrected for the degree by which theangle of incidence of the microtome blade and the angle of incidentlight from the SD-OCT device might differ. To do so, we developed amethod of extracting interpolated B-scans, at any angle of rotation and
FIGURE 2. Method of orienting histologic sections to the disc photograph. The topographic locations ofhistologic sections 145, 241, and 313 are shown. The orientation of each section (red lines in the discphotograph) is judged by assessing the relative spacing of the retinal vessels, marked by circular glyphsin the disc photograph and by vertical lines in the histologic sections. The temporal vessel outlined by ared glyph is absent in section 144, but appears in the next section (145). The superior opening in Bruch’smembrane (superior disc margin) was near section 145 (described in detail in Fig. 5) and the inferioropening in Bruch’s membrane was near section 335 (not shown in this figure, but described in detail inFig. 6) Hematoxylin and eosin; magnification, �10.
1466 Strouthidis et al. IOVS, March 2010, Vol. 51, No. 3
incidence, from the data contained within the 3-D ONH SD-OCTvolume (Fig. 3).
Custom software (based on the Visualization Toolkit; VTK, CliftonPark, NY), was used to generate a B-scan plane (x–z plane) and torotate it about the z-axis to reproduce the en face angle of rotation. TheB-scan plane was then rotated about the x-axis to reproduce the angleof incidence. These manipulations were translated to a specified pointwithin the 3-D SD-OCT volume onto which a fine grid of 1 � 1-�msquares was overlaid. The application of this fine grid onto the B-scanplane was designed to overcome the distortion from the misalignmentof the plane with the volume occurring at the subpixel level. Thefine-grid squares were used to sample the volume by a nearest neigh-bor technique, wherein the distance of the centroid of the square inthe plane to the centroids of the pixels in the volume was computed,and the value from the pixel in the volume with the shortest centroid-to-centroid distance was selected. These data were saved as a floatingpoint TIFF image, and the plane was shifted along its normal until acomplete family of interpolated B-scans was generated. This softwarecould alter the angle of rotation and incidence by 0.5° increments.
The method by which the interpolated B-scan angle of rotation wasdecided for each histologic section is illustrated in Figure 4. The discphotograph, containing the topographical location of the HE-stainedsections (Fig. 4A) was co-localized to the en face SD-OCT image, asdescribed earlier. With a fixed center of rotation, the angle of rotationof each histologic section was calculated with reference to the hori-zontal raster acquisition box, in which the vertical axis is 0° and thehorizontal axis is 90°. With the angle of rotation identified, we used thepurpose-built software to generate a complete series of interpolatedB-scans for that angle, as though the acquisition window had shifted tothe selected angle of orientation.
Once the optimum angles of rotation had been identified, the angleof incidence was estimated. The interpolated B-scans generated with
an angle of incidence of 0° (perpendicular to the imaged surface) werecompared to the histologic sections from the same topographic loca-tions. The angle of incidence was then varied by 0.5° increments untilthe interpolated B-scans best matched the histologic section at eachlocation. An example demonstrating the effect of varying the angle ofincidence is shown in Figure 5.
Comparison of Histologic Sections to MatchedInterpolated B-Scans
Matched interpolated B-scans (defined to be best corrected for angle ofrotation and incidence) and their histologic sections were then quali-tatively compared, to identify which structures within the ONH couldbe identified by SD-OCT. To facilitate this, we attempted to align theONH structures within each B-scan with their respective locationswithin the matched histologic section. Alignment was performed withimage-processing software (Photoshop CS3; Adobe Systems, Inc.). Ro-tation and scaling in a 1:1 ratio were performed. We did not warp ormorph images to correct for tissue-processing artifacts in the histologicsections, such as differential horizontal or vertical shrinkage, choroidalexpansion, and retinal elevation.
RESULTS
Topographic Location of Histologic Sections
Histologic sections (n � 525), with a minimum separation of 4�m between each section, were generated from the trephinedONH sections. Figure 4A illustrates the location of the initialHE-stained sections (every fourth section) throughout the fullextent of the disc photograph. HE-stained sections in which
FIGURE 3. Method of identifying interpolated B-scans from the SD-OCT volumetric reconstruction. (A) Arepresentative acquired B-scan is shown within the 3-D volume (enclosed within a red cube) generatedfrom a 290 � 768 horizontal raster scan. The angle of rotation of the B-scan was 90° and the angle ofincidence was 0°. (B) The interpolated B-scan shown was generated in a 20° clockwise rotation (angle ofrotation, 70°); the angle of incidence was unchanged. (C) The interpolated B-scan shown was generatedafter a �20° change in the angle of incidence. (D) The interpolated B-scan shown was generated with anangle of rotation of 70° and an angle of incidence of �20°.
IOVS, March 2010, Vol. 51, No. 3 Comparison of Optic Nerve Histology and SD-OCT 1467
the retina was insufficiently preserved to allow the accurateidentification of retinal vessels were not used for comparison.
Generation of Matched Interpolated B-Scans
Histologic sections in the superior part of the nerve (Fig. 4C;region 1) required interpolated SD-OCT B-scans to be gener-ated at an angle of rotation of 73.5°. Inferior to this, there wasa small portion of the nerve (Fig. 4C; region 2) in which thematched angle of rotation was 87°. The remaining sections(Fig. 4C; region 3) required an angle of 89°, which was almostidentical with the acquired B-scan angle of 90°.
The effect of altering the angle of incidence of the interpo-lated B-scan for a given histologic section is illustrated in Figure5 for section 145, which was located close to the superior discmargin. In this section, the retinal pigment epithelium (RPE)and Bruch’s membrane were still intact, although there was anopening in both the choroid and the sclera. An interpolatedB-scan generated at an angle of incidence of 0°, perpendicularto the retinal surface, (Fig. 5B) was not as accurate as the onegenerated at an angle of incidence of �18°, which was angledtoward the nerve (Fig. 5C).
Figure 6A shows histologic section 335, which is locatedclose to the inferior disc margin. In this section, an opening inthe choroidal space is present below the intact RPE. A verysmall portion of the optic nerve is visible above a small, intactportion of peripapillary sclera, suggesting that the section wasacquired at a less oblique angle than was section 145. Figure 6Bshows the matched interpolated B-scan, generated at an angleof incidence of 0°. All the major vessels in the histologicsection are detectable in this interpolated B-scan. Likewise, theopening in the choroid is present, along with a faintly contin-uous RPE/Bruch’s membrane complex signal. It should benoted that the shadow cast by the presence of two large retinalvessels above this region would have contributed to the faint-ness of the latter signal. The sclera is not detected in thissection, although there is a faint signal below the choroidalopening, suggesting that some reflected light from the under-lying optic nerve has been captured.
An angle of incidence of �18° was found to achieve thebest matches in the part of the nerve where sections wereacquired at an angle of rotation of 73.5° (Fig. 4C, region 1).Where the angle of rotation was 87° (Fig. 4C, region 2), anangle of incidence of �10° achieved the best matches. In theremainder of the ONH, where the angle of rotation was 89°(Fig. 4C, region 3), the best matches were achieved with anangle of incidence of 0°.
Detection of Deep ONH Structures
Two examiners (NGS, CFB) qualitatively compared thematches between interpolated B-scans and the respective his-tologic sections. The vitreal surface of the ONH was detectableby SD-OCT throughout its full extent. However, SD-OCT visu-alization of structures deep to the surface was poor in regionswhere shadows were cast by the central retinal vessels.
Interpolated B-scans matched to histologic sections ac-quired from the central part of the disc (sections 256–260)were selected for the detailed assessment of deep ONH imag-ing, as they had the largest continuous shadow-free areas oneither side of the central retinal vessels (Figs. 7, 8, 9). For thesecomparisons, the same interpolated B-scan was matched toeach section, because the separation between adjacent B-scanswas approximately 12 to 16 �m, which was comparable to theseparation between the selected histologic sections. Withinthese sections, a prominent Bergmeister’s papilla was clearlyvisualized within both the histologic sections and the interpo-lated SD-OCT B-scan.
Neural Canal Opening. We have previously described theneural canal to be the passage through which retinal ganglioncell axons traverse the wall of the eye, beginning at the planeof the RPE/Bruch’s membrane complex (the neural canal open-ing, NCO) and continuing through the choroidal and scleralportions of the canal.28,29 Figure 7 demonstrates the SD-OCTdetected features of the NCO, as compared to their underlyinghistologic basis. The RPE/Bruch’s membrane complex wasdefined to be the posterior signal from the hyperreflectivetriple stripe below the dark, hyporeflective outer nuclear lay-er.29,30 We defined the innermost termination of this signal ateither side of the neural canal as the NCO.29 In Figure 7A,section 257 (HE-stained) is shown, with the temporal canalopening magnified in the inset. The retinal layers can be seento taper downward toward a point between the outer nuclearand photoreceptor layers (marked by black arrows). In thissection, the termination of the RPE was external to the termi-nation of Bruch’s membrane, and these same relationshipswere easily discerned within the matched interpolated B-scan(Fig. 7B). Within section 260 (Fig. 7C), Ponceau S stain betterrevealed the extension of unpigmented Bruch’s membranebeyond the RPE.
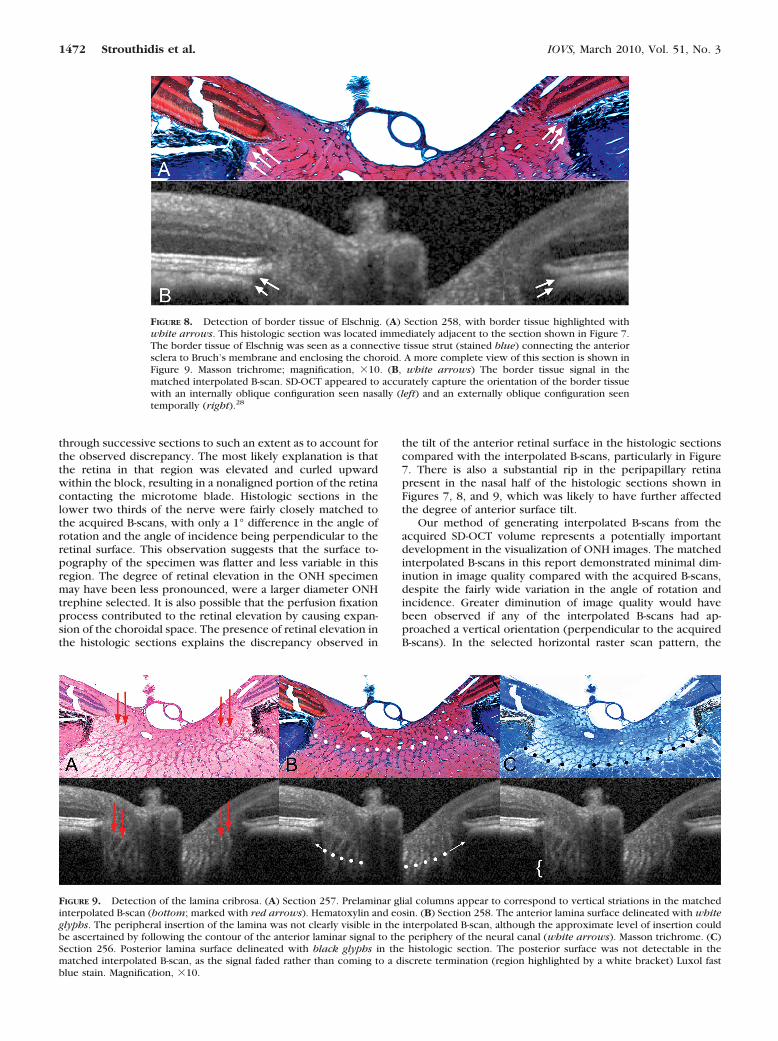
Border Tissue of Elschnig. The border tissue is a flange orstrut of connective tissue arising from the sclera to meet Bruch’smembrane and, in doing so, acting as the junction between theinnermost termination of the choroid and the adjacent retinalganglion cell axon bundles. In Figure 8A (histologic section 258,
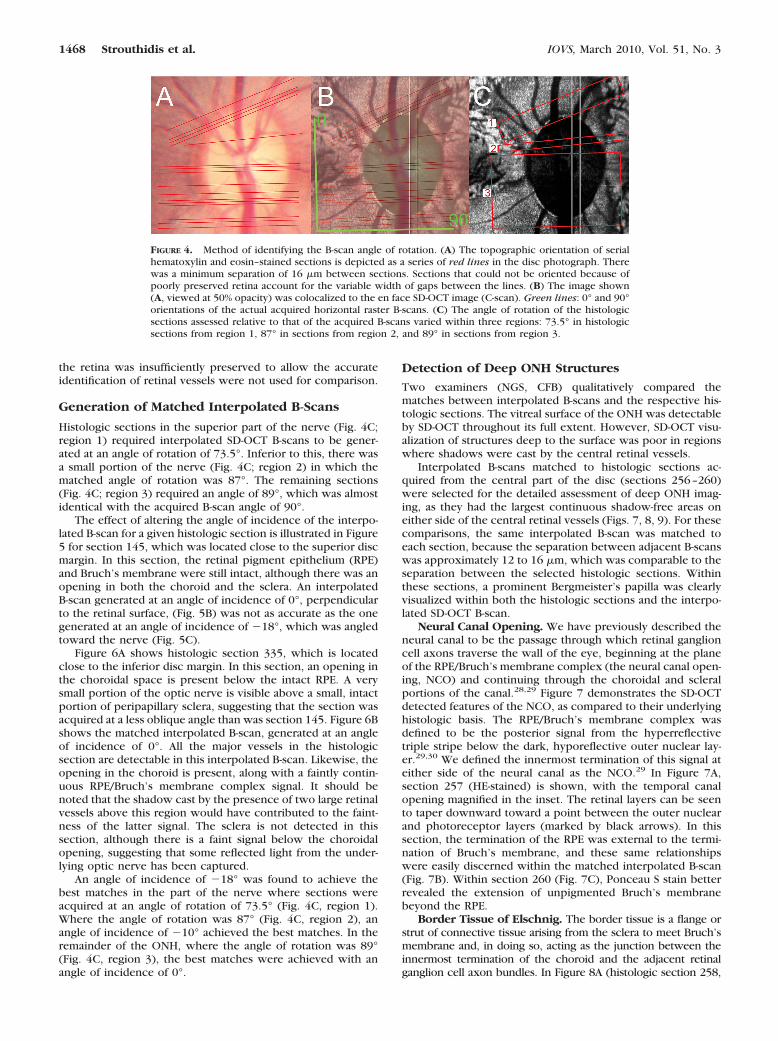
FIGURE 4. Method of identifying the B-scan angle of rotation. (A) The topographic orientation of serialhematoxylin and eosin–stained sections is depicted as a series of red lines in the disc photograph. Therewas a minimum separation of 16 �m between sections. Sections that could not be oriented because ofpoorly preserved retina account for the variable width of gaps between the lines. (B) The image shown(A, viewed at 50% opacity) was colocalized to the en face SD-OCT image (C-scan). Green lines: 0° and 90°orientations of the actual acquired horizontal raster B-scans. (C) The angle of rotation of the histologicsections assessed relative to that of the acquired B-scans varied within three regions: 73.5° in histologicsections from region 1, 87° in sections from region 2, and 89° in sections from region 3.
1468 Strouthidis et al. IOVS, March 2010, Vol. 51, No. 3
stained with MT), the border tissue of Elschnig is seen at eitherside of the neural canal, between the sclera and Bruch’s mem-brane. Within the matched interpolated B-scan (Fig. 8B), theborder tissue corresponds to the junction of the choroidal signalwith the nerve and the heavy pigment located just below it, at theedge of the sclera. Within this matched interpolated B-scan, theanterior scleral surface is not visible.
Prelaminar Glial Columns and the Anterior LaminaSurface. The prelaminar glial columns are most easily visual-ized in the HE-stained section (Fig. 9A, red arrows; section 257)where the glial nuclei are prominently stained; to a lesserextent, the connective tissue component of these columns isdetectable with MT staining (Fig. 9B; section 258). Thesecolumns can be seen to commence within the neural canal atapproximately the level of the NCO and the border tissue. Thecolumns extend posteriorly as vertical struts until the pointwhere they merge with the more horizontally oriented laminarbeams. Vertically oriented striations within the matched inter-polated B-scan (Fig. 9A) appear to correspond to the prelami-nar glial columns.
In Figure 9B, we define the anterior laminar surface in thehistologic section to be the innermost point at which horizon-tally/transversely oriented connective tissue can be identified.Within the matched interpolated B-scan there appears to be adistinction between the prelaminar glial columns (vertical stri-ations) and the anterior laminar surface (transversely orientedsignal), particularly in the nasal side of the scan. Although theprecise peripheral scleral insertion of the lamina cannot bevisualized in this B-scan, the anterior laminar surface signal canbe seen to bend upward toward a point below the bordertissue on both sides of the neural canal. The posterior laminarsurface (Fig. 9C) is not detectable in the matched interpolatedB-scan.
DISCUSSION
This study represents an important step in verifying the deepONH imaging capabilities of SD-OCT. The following ONH tar-gets could be identified by SD-OCT: the vitreal surface of the
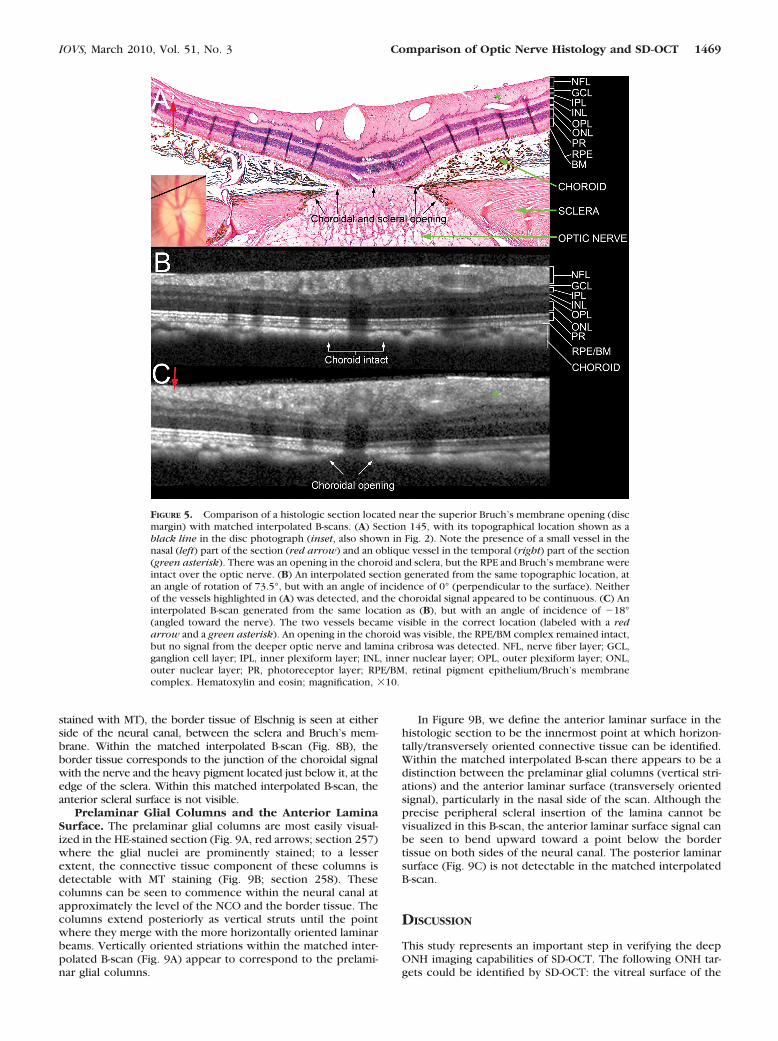
FIGURE 5. Comparison of a histologic section located near the superior Bruch’s membrane opening (discmargin) with matched interpolated B-scans. (A) Section 145, with its topographical location shown as ablack line in the disc photograph (inset, also shown in Fig. 2). Note the presence of a small vessel in thenasal (left) part of the section (red arrow) and an oblique vessel in the temporal (right) part of the section(green asterisk). There was an opening in the choroid and sclera, but the RPE and Bruch’s membrane wereintact over the optic nerve. (B) An interpolated section generated from the same topographic location, atan angle of rotation of 73.5°, but with an angle of incidence of 0° (perpendicular to the surface). Neitherof the vessels highlighted in (A) was detected, and the choroidal signal appeared to be continuous. (C) Aninterpolated B-scan generated from the same location as (B), but with an angle of incidence of �18°(angled toward the nerve). The two vessels became visible in the correct location (labeled with a redarrow and a green asterisk). An opening in the choroid was visible, the RPE/BM complex remained intact,but no signal from the deeper optic nerve and lamina cribrosa was detected. NFL, nerve fiber layer; GCL,ganglion cell layer; IPL, inner plexiform layer; INL, inner nuclear layer; OPL, outer plexiform layer; ONL,outer nuclear layer; PR, photoreceptor layer; RPE/BM, retinal pigment epithelium/Bruch’s membranecomplex. Hematoxylin and eosin; magnification, �10.
IOVS, March 2010, Vol. 51, No. 3 Comparison of Optic Nerve Histology and SD-OCT 1469
ONH, prelaminar tissue, NCO, border tissue, choroid, prelami-nar glial columns, and the anterior laminar surface. The ante-rior and posterior scleral surfaces, the peripheral insertion ofthe lamina, and the posterior laminar surface were not detect-able within this SD-OCT volume.
In a series of recent articles, we identified the NCO as arelatively planar, continuous structure that underpins the discmargin in most monkey eyes.28,29 For these reasons, and thelikelihood that an automated segmentation algorithm will reli-ably detect the NCO, we have proposed the NCO as a suitablebasis for an SD-OCT reference plane.29 In the present study, wewere unable to identify a distinct signal from Bruch’s mem-brane separate from the RPE. Of interest, it appears that theSD-OCT-defined NCO (Fig. 7B, magnified inset) took into ac-count a portion of unpigmented Bruch’s membrane, extendingbeyond the termination of the retinal pigment epithelium (Fig.7C, magnified inset). However, in this particular SD-OCT vol-ume, a transition point, such as an abrupt decrease in the widthof the RPE/Bruch’s membrane complex, was not detected.
The detection of an SD-OCT signal attributable to the bordertissue has clinical relevance in terms of defining the optic discmargin. We have recently determined, using postmortem 3-Dhistomorphometric reconstructions, that the underlying discmargin anatomy in the monkey eye is governed by the orien-tation of border tissue relative to Bruch’s membrane.28 Weidentified two principal border tissue orientations. Internally,oblique border tissue occurs where it extends from the scleratoward the neural canal to meet Bruch’s membrane (the mostcommon orientation). Externally oblique border tissue occurswhere it extends from the sclera, away from the neural canal,to meet Bruch’s membrane. This orientation, when present, islocated in the temporal half of the disc. In their classic descrip-tion of the ultrastructure of the human and monkey ONH,Anderson and Hoyt31 were unable to detect border tissue ofElschnig in the monkey eye. A connective tissue strut emanat-ing from the scleral surface is clearly visible in the MT-stainedsection (Fig. 8A, white arrows). This structure almost certainlyrepresents border tissue of Elschnig, although it is perhaps aless robust structure than in the human eye. Our study con-
firms that, at least in this eye, SD-OCT volumetric reconstruc-tion appears to accurately capture the orientation of the bordertissue relative to the sclera and Bruch’s membrane.
A key finding of this study is the confirmation that SD-OCTis capable of detecting the prelaminar glial columns and theanterior surface of the lamina cribrosa. This suggests thatSD-OCT may be useful for detecting morphologic changes inthe prelaminar glial columns as well as displacement of theanterior lamina. Inoue et al.26 recently identified the laminacribrosa as highly reflective signal beneath the optic disc cup inhorizontal SD-OCT B-scans acquired from glaucomatous orocular hypertensive human eyes. Furthermore, the distancebetween the anterior and posterior borders of this signal wasdefined as the thickness of the lamina cribrosa. Laminar thick-ness measurements were found to have a high interobserverreproducibility and to be significantly correlated with visualfield mean deviation.
Our comparisons between serial histology and SD-OCT inthis monkey eye suggest that the detection of the lamina is notso straightforward. Within this SD-OCT volume, there was adistinction between the vertical striations, which most likelyrepresent the prelaminar glial columns, and the interconnect-ing horizontal signal, which probably represents the horizontallaminar beams between the vertical septae. The anterior lami-nar signal is certainly more reflective in the SD-OCT horizontalB-scans presented by Inoue et al.,26 than in the B-scans exam-ined in the present study. Likewise, in our experience, thereflectivity of the anterior laminar surface is higher in humaneyes than in monkey eyes. Laminar reflectivity appears to befurther enhanced in highly myopic and glaucomatous eyes,which we assume is due to thinning of the prelaminar neuraltissue. It is also important to note that, in humans, the centralretinal trunk is located nasally whereas in the monkey, thetrunk tends to be central (as in this study). If one assumes thatlaminar reflectivity is affected by the thickness of the prelami-nar tissue, it follows that the most intense signal would beobserved beneath the central, deepest part of the cup. Unfor-tunately, in the eye examined in this study, the signal from the
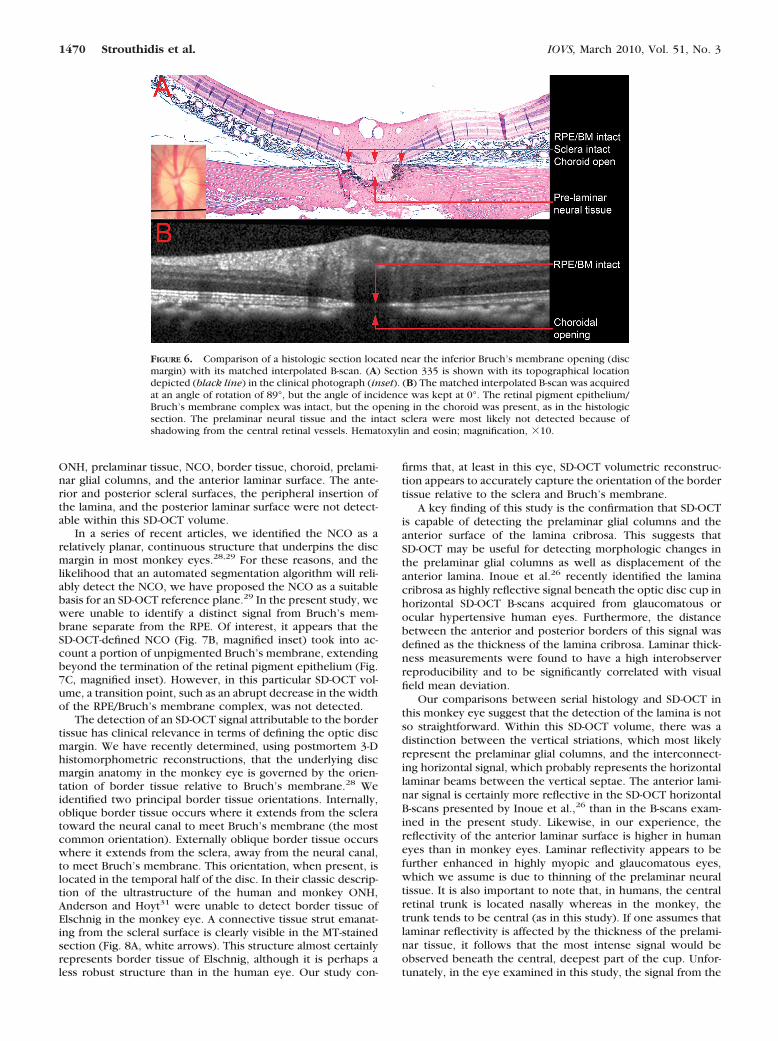
FIGURE 6. Comparison of a histologic section located near the inferior Bruch’s membrane opening (discmargin) with its matched interpolated B-scan. (A) Section 335 is shown with its topographical locationdepicted (black line) in the clinical photograph (inset). (B) The matched interpolated B-scan was acquiredat an angle of rotation of 89°, but the angle of incidence was kept at 0°. The retinal pigment epithelium/Bruch’s membrane complex was intact, but the opening in the choroid was present, as in the histologicsection. The prelaminar neural tissue and the intact sclera were most likely not detected because ofshadowing from the central retinal vessels. Hematoxylin and eosin; magnification, �10.
1470 Strouthidis et al. IOVS, March 2010, Vol. 51, No. 3
center of the lamina was obfuscated by fringe washout fromthe main vessel trunk.
It is also important to recognize that the ocular tissues ofmonkeys are more heavily pigmented than those of humaneyes.32 The heavy pigment on the surface of the anterior sclera(and indeed the peripheral lamina) of the eye examined in thisstudy may have absorbed, rather than reflected, the incomingSD-OCT illumination, which may, in part, explain why therewas no signal from the anterior scleral surface or from theperipheral lamina insertion.
In this eye, examined with a conventional 870-nm lightsource, the location of the posterior laminar surface was notapparent. In the B-scans examined in this study, the laminarsignal appeared to fade with increasing depth through theONH volume. We cannot be certain whether this decrease inreflectivity was due to the absence of horizontal laminar beamsat the posterior laminar surface or because the posterior limitof tissue penetration was reached. For this reason, we adviseexercising caution in trying to calculate in vivo laminar thick-ness by using SD-OCT. As Inoue et al.26 have reported that theirmeasurements of lamina thickness correlate with mean devia-tion in a cross-sectional cohort, the inference is that SD-OCT
can detect progressive laminar thinning in glaucoma. Althoughthis suggestion is supported by a body of literature reportingthat compression of the lamina occurs in the early, moderate,and severe stages of glaucomatous damage,33–35 we have iden-tified profound laminar thickening at the earliest stages of theneuropathy in a nonhuman primate model of glaucoma.15 Wehope that longitudinal in vivo SD-OCT ONH imaging will even-tually assist in establishing the relationship between laminamorphology and stage of disease. Our confidence in identifyingthe posterior laminar surface may be increased with the adop-tion of a 1060-nm light source, which has increased axialpenetration compared with the standard 870-nm light sourceas used in the imager (Spectralis; Heidelberg Engineer-ing).36–38 The deep ONH imaging capabilities of this alterna-tive light source will be verified by repeating the currentexperiment with a prototype equipped with the alternativewavelength light source.
By elucidating the topographic location of the HE-stainedsections with well-preserved retina, as depicted in Figure 4A,we identified a clear angular discrepancy between the histo-logic sections and the acquired B-scans in the superior third ofthe ONH. It is very unlikely that the microtome rotated
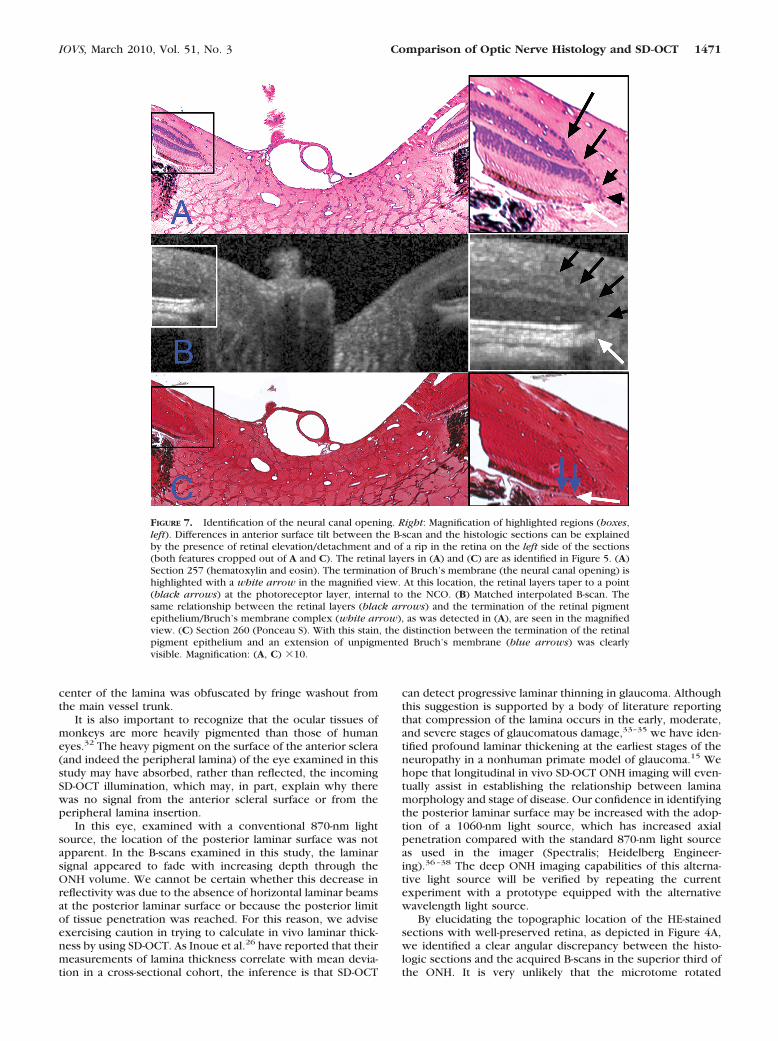
FIGURE 7. Identification of the neural canal opening. Right: Magnification of highlighted regions (boxes,left). Differences in anterior surface tilt between the B-scan and the histologic sections can be explainedby the presence of retinal elevation/detachment and of a rip in the retina on the left side of the sections(both features cropped out of A and C). The retinal layers in (A) and (C) are as identified in Figure 5. (A)Section 257 (hematoxylin and eosin). The termination of Bruch’s membrane (the neural canal opening) ishighlighted with a white arrow in the magnified view. At this location, the retinal layers taper to a point(black arrows) at the photoreceptor layer, internal to the NCO. (B) Matched interpolated B-scan. Thesame relationship between the retinal layers (black arrows) and the termination of the retinal pigmentepithelium/Bruch’s membrane complex (white arrow), as was detected in (A), are seen in the magnifiedview. (C) Section 260 (Ponceau S). With this stain, the distinction between the termination of the retinalpigment epithelium and an extension of unpigmented Bruch’s membrane (blue arrows) was clearlyvisible. Magnification: (A, C) �10.
IOVS, March 2010, Vol. 51, No. 3 Comparison of Optic Nerve Histology and SD-OCT 1471
through successive sections to such an extent as to account forthe observed discrepancy. The most likely explanation is thatthe retina in that region was elevated and curled upwardwithin the block, resulting in a nonaligned portion of the retinacontacting the microtome blade. Histologic sections in thelower two thirds of the nerve were fairly closely matched tothe acquired B-scans, with only a 1° difference in the angle ofrotation and the angle of incidence being perpendicular to theretinal surface. This observation suggests that the surface to-pography of the specimen was flatter and less variable in thisregion. The degree of retinal elevation in the ONH specimenmay have been less pronounced, were a larger diameter ONHtrephine selected. It is also possible that the perfusion fixationprocess contributed to the retinal elevation by causing expan-sion of the choroidal space. The presence of retinal elevation inthe histologic sections explains the discrepancy observed in
the tilt of the anterior retinal surface in the histologic sectionscompared with the interpolated B-scans, particularly in Figure7. There is also a substantial rip in the peripapillary retinapresent in the nasal half of the histologic sections shown inFigures 7, 8, and 9, which was likely to have further affectedthe degree of anterior surface tilt.
Our method of generating interpolated B-scans from theacquired SD-OCT volume represents a potentially importantdevelopment in the visualization of ONH images. The matchedinterpolated B-scans in this report demonstrated minimal dim-inution in image quality compared with the acquired B-scans,despite the fairly wide variation in the angle of rotation andincidence. Greater diminution of image quality would havebeen observed if any of the interpolated B-scans had ap-proached a vertical orientation (perpendicular to the acquiredB-scans). In the selected horizontal raster scan pattern, the
FIGURE 8. Detection of border tissue of Elschnig. (A) Section 258, with border tissue highlighted withwhite arrows. This histologic section was located immediately adjacent to the section shown in Figure 7.The border tissue of Elschnig was seen as a connective tissue strut (stained blue) connecting the anteriorsclera to Bruch’s membrane and enclosing the choroid. A more complete view of this section is shown inFigure 9. Masson trichrome; magnification, �10. (B, white arrows) The border tissue signal in thematched interpolated B-scan. SD-OCT appeared to accurately capture the orientation of the border tissuewith an internally oblique configuration seen nasally (left) and an externally oblique configuration seentemporally (right).28
FIGURE 9. Detection of the lamina cribrosa. (A) Section 257. Prelaminar glial columns appear to correspond to vertical striations in the matchedinterpolated B-scan (bottom; marked with red arrows). Hematoxylin and eosin. (B) Section 258. The anterior lamina surface delineated with whiteglyphs. The peripheral insertion of the lamina was not clearly visible in the interpolated B-scan, although the approximate level of insertion couldbe ascertained by following the contour of the anterior laminar signal to the periphery of the neural canal (white arrows). Masson trichrome. (C)Section 256. Posterior lamina surface delineated with black glyphs in the histologic section. The posterior surface was not detectable in thematched interpolated B-scan, as the signal faded rather than coming to a discrete termination (region highlighted by a white bracket) Luxol fastblue stain. Magnification, �10.
1472 Strouthidis et al. IOVS, March 2010, Vol. 51, No. 3
x-axis contained 768 samples per 15°, whereas the y-axis con-tained 290 samples per 15°. The pixels generated were there-fore not cubic but were “stretched” on the y-axis, with lessdensity of data than that on the x-axis. A B-scan pattern with anequal sampling density in both axes would be necessary tominimize the diminution in image quality, regardless of theangle of rotation. Although it is theoretically possible to gen-erate a 768 � 768, or indeed a 1536 � 1536, horizontal rasterpattern scan with the Spectralis, achieving such a dense pat-tern would be limited in practical terms by the test’s durationand by the memory constraints of the acquisition and viewinghardware and software.
The magnitude of the B-scans was adjusted by using a 1:1scale to achieve the best approximate alignment between theinterpolated B-scans and the serial histologic B-scans. Althoughan approximate horizontal alignment appears defensible, theB-scans appeared stretched in the vertical direction, with thecup and the anterior laminar surface seemingly deeper in theB-scan than in the matched histologic section. The SD-OCTvolumes are transferred to our custom visualization software ina 1:1-�m scale, rather than in a 1:1-pixel scale. Although thez-axis scaling is fixed, the lateral magnification (x- and y-axisorientation) of the Spectralis is based on the optics of thehuman and not the macaque eye. The purpose of this studywas to establish the histologic basis of SD-OCT signals deepwithin the ONH, rather than to achieve precise structuralquantification. Although we are currently developing an algo-rithm for macaque-specific lateral magnitude scaling, that ca-pability was beyond the scope of the present study. Thesescaling issues partly explain why the thicknesses of retinallayers (particularly the photoreceptor and the Bruch’s mem-brane/retinal pigment epithelium) appeared much thicker inthe interpolated B-scans than in the histologic sections. Un-doubtedly, there is also an effect of differential tissue shrink-age, which was not corrected in the rescaling of the interpo-lated B-scans. Finally, the thicknesses in the deep retinal layersby SD-OCT are also likely to be influenced by the strength ofreflected signal over distance, rather than just the thickness ofthe tissue of interest.
A major limitation of this work is that it was performed ona single monkey eye, which may mean that the results are notfully applicable to all human eyes. It is also important torecognize that the optic disc examined in this study had a veryregular morphology, with a distinct clinical disc margin and noevidence of tilt or of peripapillary atrophy. Indeed these lattertwo features are far less prevalent in monkeys than in humans,and when present usually have a less exaggerated presentationthan in the human eye. However, we believe that the merits ofthis study are such that the results are of relevance and interest.First, the morphology and histology of the monkey and humanONH are extremely similar and, as such, the characterizationby SD-OCT is likely to be closely matched. By using a monkeyeye, we were also able to perform SD-OCT imaging immedi-ately before obtaining the tissue specimen by perfusion fixa-tion. By using an anterior chamber manometer, we were ableto establish the same level of IOP at the time of imaging and atthe time of death. This kind of study cannot be replicated in ahuman eye.
This study provides histologic evidence that volumetricSD-OCT imaging of the ONH is capable of capturing ONHtarget structures, in particular the anterior laminar surface,which may prove useful in the detection of early changes inocular hypertension and glaucoma.15,39 Our novel method ofgenerating interpolated SD-OCT B-scans at any angle of rotationor incidence will expand the clinical application of this tech-nology in normal and glaucomatous human eyes.
Acknowledgments
The authors thank Dorothea Burke (Leonard Christensen Eye Pathol-ogy Laboratory, Casey Eye Institute, Portland, OR) for preparation ofthe histologic sections.
References
1. Schuman JS, Hee MR, Arya AV, et al. Optical coherencetomography: a new tool for glaucoma diagnosis. Curr Opin Oph-thalmol. 1995;6:89–95.
2. Nouri-Mahdavi K, Hoffman D, Tannenbaum DP, Law SK, Caprioli J.Identifying early glaucoma with optical coherence tomography.Am J Ophthalmol. 2004;137:228–235.
3. Sihota R, Sony P, Gupta V, Dada T, Singh R. Diagnostic capabilityof optical coherence tomography in evaluating the degree ofglaucomatous retinal nerve fiber damage. Invest Ophthalmol VisSci. 2006;47:2006–2010.
4. Budenz DL, Michael A, Chang RT, McSoley J, Katz J. Sensitivity andspecificity of the StratusOCT for perimetric glaucoma. Ophthal-mology. 2005;112:3–9.
5. Anton A, Moreno-Montanes J, Blazquez F, Alvarez A, Martin B,Molina B. Usefulness of optical coherence tomography parametersof the optic disc and the retinal nerve fiber layer to differentiateglaucomatous, ocular hypertensive, and normal eyes. J Glaucoma.2007;16:1–8.
6. Wollstein G, Schuman JS, Price LL, et al. Optical coherence tomog-raphy longitudinal evaluation of retinal nerve fiber layer thicknessin glaucoma. Arch Ophthalmol. 2005;123:464–470.
7. Gaasterland D, Tanishima T, Kuwabara T. Axoplasmic flow duringchronic experimental glaucoma: 1, light and electron microscopicstudies of the monkey optic nervehead during development ofglaucomatous cupping. Invest Ophthalmol Vis Sci. 1978;17:838–846.
8. Minckler DS, Bunt AH, Johanson GW. Orthograde and retrogradeaxoplasmic transport during acute ocular hypertension in themonkey. Invest Ophthalmol Vis Sci. 1977;16:426–441.
9. Quigley HA, Green WR. The histology of human glaucoma cuppingand optic nerve damage: clinicopathologic correlation in 21 eyes.Ophthalmology. 1979;86:1803–1830.
10. Quigley HA, Addicks EM, Green WR, Maumenee AE. Optic nervedamage in human glaucoma, II: The site of injury and susceptibilityto damage. Arch Ophthalmol. 1981;99:635–649.
11. Bellezza AJ, Rintalan CJ, Thompson HW, Downs JC, Hart RT,Burgoyne CF. Deformation of the lamina cribrosa and anteriorscleral canal wall in early experimental glaucoma. Invest Ophthal-mol Vis Sci. 2003;44:623–637.
12. Burgoyne CF, Downs JC, Bellezza AJ, Hart RT. Three-dimensionalreconstruction of normal and early glaucoma monkey optic nervehead connective tissues. Invest Ophthalmol Vis Sci. 2004;45:4388–4399.
13. Roberts MD, Grau V, Grimm J, et al. Remodeling of the connectivetissue microarchitecture of the lamina cribrosa in early experimen-tal glaucoma. Invest Ophthalmol Vis Sci. 2009;50:681–690.
14. Yang H, Downs JC, Bellezza AJ, Thompson H, Burgoyne CF. 3-Dhistomorphometry of the normal and early glaucomatous monkeyoptic nerve head: Prelaminar Neural Tissues and Cupping. InvestOphthalmol Vis Sci. 2007;48:5068–5084.
15. Yang H, Downs JC, Girkin C, et al. 3-D Histomorphometry of thenormal and early glaucomatous monkey optic nerve head: laminacribrosa and peripapillary scleral position and thickness. InvestOphthalmol Vis Sci. 2007;48:4597–4607.
16. Downs JC, Yang H, Girkin C, et al. Three dimensional histomor-phometry of the normal and early glaucomatous monkey opticnerve head: neural canal and subarachnoid space architecture.Invest Ophthalmol Vis Sci. 2007;48:3195–3208.
17. Chen TC, Cense B, Miller JW, et al. Histologic correlation of in vivooptical coherence tomography images of the human retina. Am JOphthalmol. 2006;141:1165–1168.
18. Blumenthal EZ, Parikh RS, Pe’er J, et al. Retinal nerve fibre layerimaging compared with histological measurements in a humaneye. Eye. 2009;23(1):171–175.
IOVS, March 2010, Vol. 51, No. 3 Comparison of Optic Nerve Histology and SD-OCT 1473
19. Toth CA, Birngruber R, Boppart SA, et al. Argon laser retinal lesionsevaluated in vivo by optical coherence tomography. Am J Oph-thalmol. 1997;123:188–198.
20. Toth CA, Narayan DG, Boppart SA, et al. A comparison of retinalmorphology viewed by optical coherence tomography and bylight microscopy. Arch Ophthalmol. 1997;115:1425–1428.
21. Anger EM, Unterhuber A, Hermann B, et al. Ultrahigh resolutionoptical coherence tomography of the monkey fovea. Identificationof retinal sublayers by correlation with semithin histology sec-tions. Exp Eye Res. 2004;78:1117–1125.
22. Abbott CJ, McBrien NA, Grunert U, Pianta MJ. Relationship of theoptical coherence tomography signal to underlying retinal histol-ogy in the tree shrew (Tupaia belangeri). Invest Ophthalmol VisSci. 2009;50:414–423.
23. Ruggeri M, Wehbe H, Jiao S, et al. In vivo three-dimensionalhigh-resolution imaging of rodent retina with spectral-domain op-tical coherence tomography. Invest Ophthalmol Vis Sci. 2007;48:1808–1814.
24. Gloesmann M, Hermann B, Schubert C, Sattmann H, Ahnelt PK,Drexler W. Histologic correlation of pig retina radial stratificationwith ultrahigh-resolution optical coherence tomography. InvestOphthalmol Vis Sci. 2003;44:1696–1703.
25. Kagemann L, Ishikawa H, Wollstein G, et al. Ultrahigh-resolutionspectral domain optical coherence tomography imaging of thelamina cribrosa. Ophthalmic Surg Lasers Imaging. 2008;39:S126–S131.
26. Inoue R, Hangai M, Kotera Y, et al. Three-dimensional high-speedoptical coherence tomography imaging of lamina cribrosa in glau-coma. Ophthalmology. 2009;116:214–222.
27. Burke D. A modification for the combined staining of cells andfibers in the nervous system. Am J Med Technol. 1968;34:667–670.
28. Strouthidis NG, Yang H, Downs JC, Burgoyne CF. Comparison ofclinical and three-dimensional histomorphometric optic disc mar-gin anatomy. Invest Ophthalmol Vis Sci. 2009;50:2165–2174.
29. Strouthidis NG, Yang H, Fortune B, Downs JC, Burgoyne CF.Detection of optic nerve head neural canal opening within histo-morphometric and spectral domain optical coherence tomogra-phy data sets. Invest Ophthalmol Vis Sci. 2009;50:214–223.
30. Drexler W, Fujimoto JG. State-of-the-art retinal optical coherencetomography. Prog Retin Eye Res. 2008;27:45–88.
31. Anderson DR, Hoyt WF. Ultrastructure of intraorbital portion ofhuman and monkey optic nerve. Arch Ophthalmol. 1969;82:506–530.
32. Marshall J, Hamilton AM, Bird AC. Histopathology of ruby andargon laser lesions in monkey and human retina: a comparativestudy. Br J Ophthalmol. 1975;59:610–630.
33. Emery JM, Landis D, Paton D, Boniuk M, Craig JM. The laminacribrosa in normal and glaucomatous human eyes. Trans Am AcadOphthalmol Otolaryngol. 1974;78:OP290–OP297.
34. Quigley HA, Hohman RM, Addicks EM, Massof RW, Green WR.Morphologic changes in the lamina cribrosa correlated with neuralloss in open-angle glaucoma. Am J Ophthalmol. 1983;95:673–691.
35. Yan DB, Coloma FM, Metheetrairut A, Trope GE, Heathcote JG,Ethier CR. Deformation of the lamina cribrosa by elevated intraoc-ular pressure. Br J Ophthalmol. 1994;78:643–648.
36. Povazay B, Bizheva K, Hermann B, et al. Enhanced visualization ofchoroidal vessels using ultrahigh resolution ophthalmic OCT at1050 nm. Opt Express. 2003;11:1980–1986.
37. Povazay B, Hermann B, Unterhuber A, et al. Three-dimensionaloptical coherence tomography at 1050 nm versus 800 nm inretinal pathologies: enhanced performance and choroidal penetra-tion in cataract patients. J Biomed Opt. 2007;12:041211.
38. Wang Y, Nelson J, Chen Z, Reiser B, Chuck R, Windeler R. Optimalwavelength for ultrahigh-resolution optical coherence tomogra-phy. Opt Express. 2003;11:1411–1417.
39. Yang H, Downs JC, Burgoyne CF. Physiologic intereye differencesin monkey optic nerve head architecture and their relation tochanges in early experimental glaucoma. Invest Ophthalmol VisSci. 2009;50:224–234.
1474 Strouthidis et al. IOVS, March 2010, Vol. 51, No. 3


![New La Lamina Cribrosa: imaging e biomeccanica Lamina Cribrosa.pdf · 2014. 10. 7. · a sieve, and therefore it is called lamina cribrosa."[1, 2]. Il rinnovato interesse che le nuove](https://img.pdfslide.net/doc/110x75/604941b7b23c0a669f2572f5/new-la-lamina-cribrosa-imaging-e-biomeccanica-lamina-cribrosapdf-2014-10-7.jpg)


![Poster Q1-2020 (x) - De Groote Heide · 2020. 1. 13. · (onh zrhqvgdjdyrqg .lhqhq %rqwh 2v %xgho (onh zhnhq rs grqghugdj2shqvwhoolqj +hhpndphu 6fkhshqkxlv %xgho (onh oddwvwh ]rqgdj](https://img.pdfslide.net/doc/110x75/6104ad775e333654341d7fa2/poster-q1-2020-x-de-groote-heide-2020-1-13-onh-zrhqvgdjdyrqg-lhqhq-rqwh.jpg)


![Gymnospermae 2. haftaGH´1$'G5%G7.G/(5µGHQLU (*=27G. 7h5 +HUKDQJL ELU ONH LoLQ \DEDQFÕ RODQ YH GR÷DO \D\ÕOÕú DODQÕ GÕúÕQGD RODQ ELU FDQOÕ R ONH LoLQ HJ]RWLN ELU W UG U '2;$](https://img.pdfslide.net/doc/110x75/60aac5e271fcc0328c26cb0e/gymnospermae-2-hafta-gh1g5g7g5ghqlu-27g-7h5-hukdqjl-elu-onh-lolq.jpg)