Embed Size (px)
Citation preview
i
Global Entrepreneurship Monitor 2013: India Report
Global Entrepreneurship Monitor 2014
India Report
Sunil Shukla Krishna Tanuku Pankaj Bharti Amit Kumar Dwivedi
Entrepreneurship Development Institute of India
Institute of Management TechnologyGhaziabad
Emerald Group Publishing (India) Private Limited502–503, Ring Road Mall, Mangalam Place, Sector-3, Rohini, New Delhi – 110085
Title: Global Entrepreneurship Monitor 2014: India Report
Copyright © 2016 Entrepreneurship Development Institute of India
Reprints and Permission serviceContact: [email protected]
No part of the publication may be reproduced, stored in a retrieval system, transmitted in any form or by any means electronic, mechanical, photocopying, recording or otherwise without the prior written permission of the publisher. Any opinions expressed in the articles/chapters are those of the authors. Whilst Emerald India makes every effort to ensure the quality and accuracy of the content, Emerald India makes no representation implied or otherwise, as to the articles/chapters suitability and application and disclaims any warranties, express or implied, to their use.
This edition can be exported from India by the publisher, Emerald Group Publishing (India) Private Limited.
ISBN: 978-0-9926800-9-1
India Report
Global Entrepreneurship Monitor 2014
Sunil Shukla I Krishna TanukuPankaj Bharti I Amit Kumar Dwivedi
PARTNERING INSTITUTIONS
Entrepreneurship Development Institute of India (EDI), Gandhinagar
Indian School of Business (ISB), Hyderabad
Institute of Management Technology (IMT), Ghaziabad
Although GEM data were used in the preparation of this report, their
interpretation and use are the sole responsibility of the authors.
GEM INDIA TEAM Sunil Shukla
Krishna Tanuku Bibek Banerjee
Pankaj Bharti Vijay Vyas
Amit Kumar Dwivedi Santosh Srinivas
Kumar Ashish Muzzafar Hussain
Vikash GuptaNoel Saraf Safal Batra

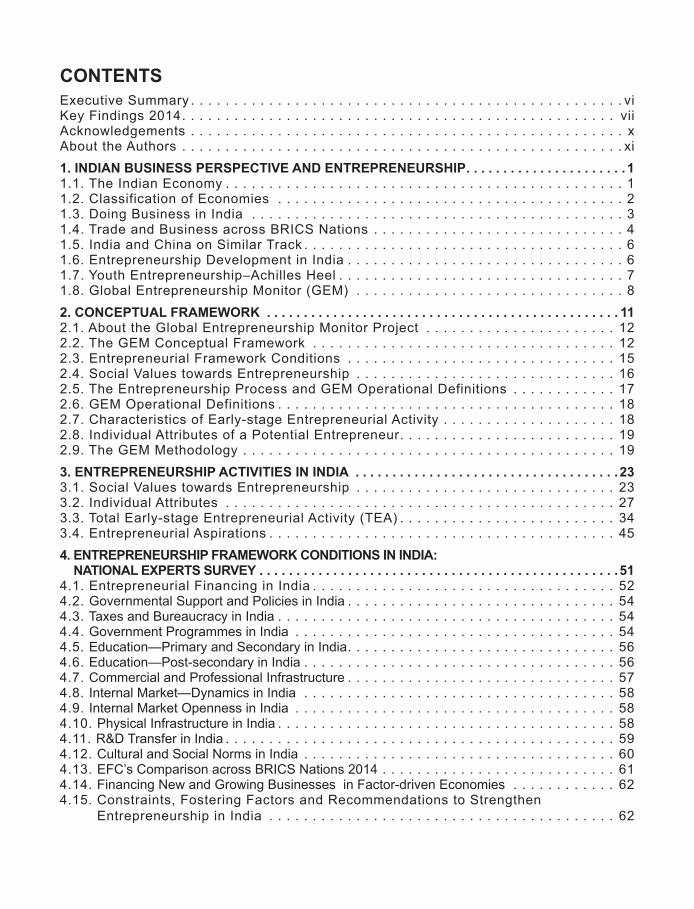
Executive Summary . . . . . . . . . . . . . . . . . . . . . . . . . . . . . . . . . . . . . . . . . . . . . . . . . . viKey Findings 2014 . . . . . . . . . . . . . . . . . . . . . . . . . . . . . . . . . . . . . . . . . . . . . . . . . . viiAcknowledgements . . . . . . . . . . . . . . . . . . . . . . . . . . . . . . . . . . . . . . . . . . . . . . . . . . xAbout the Authors . . . . . . . . . . . . . . . . . . . . . . . . . . . . . . . . . . . . . . . . . . . . . . . . . . . xi1. INDIAN BUSINESS PERSPECTIVE AND ENTREPRENEURSHIP . . . . . . . . . . . . . . . . . . . . . . 11 .1 . The Indian Economy . . . . . . . . . . . . . . . . . . . . . . . . . . . . . . . . . . . . . . . . . . . . . . 11 .2 . Classification of Economies . . . . . . . . . . . . . . . . . . . . . . . . . . . . . . . . . . . . . . . . 21 .3 . Doing Business in India . . . . . . . . . . . . . . . . . . . . . . . . . . . . . . . . . . . . . . . . . . . 31 .4 . Trade and Business across BRICS Nations . . . . . . . . . . . . . . . . . . . . . . . . . . . . . 41 .5 . India and China on Similar Track . . . . . . . . . . . . . . . . . . . . . . . . . . . . . . . . . . . . . 61 .6 . Entrepreneurship Development in India . . . . . . . . . . . . . . . . . . . . . . . . . . . . . . . . 61 .7 . Youth Entrepreneurship–Achilles Heel . . . . . . . . . . . . . . . . . . . . . . . . . . . . . . . . . 71 .8 . Global Entrepreneurship Monitor (GEM) . . . . . . . . . . . . . . . . . . . . . . . . . . . . . . . 82. CONCEPTUAL FRAMEWORK . . . . . . . . . . . . . . . . . . . . . . . . . . . . . . . . . . . . . . . . . . . . . . . . 112 .1 . About the Global Entrepreneurship Monitor Project . . . . . . . . . . . . . . . . . . . . . . 122 .2 . The GEM Conceptual Framework . . . . . . . . . . . . . . . . . . . . . . . . . . . . . . . . . . . 122 .3 . Entrepreneurial Framework Conditions . . . . . . . . . . . . . . . . . . . . . . . . . . . . . . . 152 .4 . Social Values towards Entrepreneurship . . . . . . . . . . . . . . . . . . . . . . . . . . . . . . 162 .5 . The Entrepreneurship Process and GEM Operational Definitions . . . . . . . . . . . . 172 .6 . GEM Operational Definitions . . . . . . . . . . . . . . . . . . . . . . . . . . . . . . . . . . . . . . . 182 .7 . Characteristics of Early-stage Entrepreneurial Activity . . . . . . . . . . . . . . . . . . . . 182 .8 . Individual Attributes of a Potential Entrepreneur . . . . . . . . . . . . . . . . . . . . . . . . . 192 .9 . The GEM Methodology . . . . . . . . . . . . . . . . . . . . . . . . . . . . . . . . . . . . . . . . . . . 193. ENTREPRENEURSHIP ACTIVITIES IN INDIA . . . . . . . . . . . . . . . . . . . . . . . . . . . . . . . . . . . .233 .1 . Social Values towards Entrepreneurship . . . . . . . . . . . . . . . . . . . . . . . . . . . . . . 233 .2 . Individual Attributes . . . . . . . . . . . . . . . . . . . . . . . . . . . . . . . . . . . . . . . . . . . . . 273 .3 . Total Early-stage Entrepreneurial Activity (TEA) . . . . . . . . . . . . . . . . . . . . . . . . . 343 .4 . Entrepreneurial Aspirations . . . . . . . . . . . . . . . . . . . . . . . . . . . . . . . . . . . . . . . . 454. ENTREPRENEURSHIP FRAMEWORK CONDITIONS IN INDIA:
NATIONAL EXPERTS SURVEY . . . . . . . . . . . . . . . . . . . . . . . . . . . . . . . . . . . . . . . . . . . . . . . . .514 .1 . Entrepreneurial Financing in India . . . . . . . . . . . . . . . . . . . . . . . . . . . . . . . . . . . 524 .2 . Governmental Support and Policies in India . . . . . . . . . . . . . . . . . . . . . . . . . . . . . . . 544 .3 . Taxes and Bureaucracy in India . . . . . . . . . . . . . . . . . . . . . . . . . . . . . . . . . . . . . . . 544 .4 . Government Programmes in India . . . . . . . . . . . . . . . . . . . . . . . . . . . . . . . . . . . . . 544 .5 . Education—Primary and Secondary in India . . . . . . . . . . . . . . . . . . . . . . . . . . . . . . . 564 .6 . Education—Post-secondary in India . . . . . . . . . . . . . . . . . . . . . . . . . . . . . . . . . . . . 564 .7 . Commercial and Professional Infrastructure . . . . . . . . . . . . . . . . . . . . . . . . . . . . . . . 574 .8 . Internal Market—Dynamics in India . . . . . . . . . . . . . . . . . . . . . . . . . . . . . . . . . . . . 584 .9 . Internal Market Openness in India . . . . . . . . . . . . . . . . . . . . . . . . . . . . . . . . . . . . . 584 .10 . Physical Infrastructure in India . . . . . . . . . . . . . . . . . . . . . . . . . . . . . . . . . . . . . . . 584 .11 . R&D Transfer in India . . . . . . . . . . . . . . . . . . . . . . . . . . . . . . . . . . . . . . . . . . . . . 594 .12 . Cultural and Social Norms in India . . . . . . . . . . . . . . . . . . . . . . . . . . . . . . . . . . . . 604 .13 . EFC’s Comparison across BRICS Nations 2014 . . . . . . . . . . . . . . . . . . . . . . . . . . . 614 .14 . Financing New and Growing Businesses in Factor-driven Economies . . . . . . . . . . . . 624 .15 . Constraints, Fostering Factors and Recommendations to Strengthen
Entrepreneurship in India . . . . . . . . . . . . . . . . . . . . . . . . . . . . . . . . . . . . . . . . 62
CONTENTS
vi
Global Entrepreneurship Monitor 2014: India Report
5. CONCLUSION AND KEY POLICY IMPLICATIONS . . . . . . . . . . . . . . . . . . . . . . . . . . . . . . . .655 .1 . Key Points from APS . . . . . . . . . . . . . . . . . . . . . . . . . . . . . . . . . . . . . . . . . . . . . 655 .2 . Key Points from NES . . . . . . . . . . . . . . . . . . . . . . . . . . . . . . . . . . . . . . . . . . . . 665 .3 . Challenges for the Future . . . . . . . . . . . . . . . . . . . . . . . . . . . . . . . . . . . . . . . . . 675 .4 . Key Policy Implications . . . . . . . . . . . . . . . . . . . . . . . . . . . . . . . . . . . . . . . . . . . 687. REFERENCES . . . . . . . . . . . . . . . . . . . . . . . . . . . . . . . . . . . . . . . . . . . . . . . . . . . . . . . . . . . . .708. APPENDIX . . . . . . . . . . . . . . . . . . . . . . . . . . . . . . . . . . . . . . . . . . . . . . . . . . . . . . . . . . . . . . . .72
Global Entrepreneurship Monitor 2014: India Report
vii
EXECUTIVE SUMMARYThe Global Entrepreneurship Monitor (GEM) is a global study conducted by GEM consortium with the aim to obtain internationally comparative data on entrepreneurial activity. It measures entrepreneurship both through surveys and interviews to field experts, conducted by the teams of each respective country. This report has achieved a significant role in the scientific research about entrepreneurship, for it is a wide and diachronic source of data. The GEM survey generates a variety of relevant primary information on different aspects of entrepreneurship and provides harmonized measures about individuals’ attributes and their activities in different phases of venturing (from nascent to start-up, established business, and discontinuation). GEM also measures highly ambitious entrepreneurship by identifying aspirations to grow among owner-managed businesses and the presence of entrepreneurial employee activity. All harmonized measures can be enriched with information on inclusiveness, using age, gender, and income. In 2014, more than 206,000 individuals were surveyed across 73 economies, and 3,936 national experts on entrepreneurship from 73 economies participated in the survey. In this study, GEM uses World Economic Forum anchored Global Competitiveness Index for classification of economies. GEM participant economies represent 72.4 per cent of the world’s population and 90 per cent of the world’s GDP, and it enables GEM to feature different profiles of entrepreneurship according to regions and economic development stages. The present report provides insights into entrepreneurial activities in India.
The GEM India study was conducted using a well-established GEM research methodology consistent across all participating countries enabling cross-country comparison. For this reason, the data was collected from two main sources, namely (1) Adult Population Survey (APS) and (2) National Experts Survey (NES). The APS provides information regarding the level of entrepreneurial activity in the country, whereas the NES focuses on entrepreneurial start-up environment in each economy/country with regard to the nine entrepreneurial framework conditions.
viii
Global Entrepreneurship Monitor 2014: India Report
KEY FINDINGS 2014
Adult Population Survey• In India, 58 per cent of Indian adults
consider entrepreneurship as a desirable career choice and around 66 per cent think that entrepreneurs receive a high level of status and respect . However, entrepreneurship in India is a less desirable career choice when compared to its peers in the factor-driven (least developed) economies as well as the BRICS nations .
•The desirable career choice for entrepreneurship in India is the lowest among BRICS nations, whereas on high status to successful entrepreneurs and media attention to entrepreneurship parameter, India is only a little higher than Russia . Moreover, in factor-driven economies, India comes at the lowest rank as far as high status to successful entrepreneurs is concerned . In fact, in the remaining two parameters, i .e . “Entrepreneurship as a good career choice” and “Media attention to entrepreneurship” India ranked a little higher than Iran among the factor-driven economies .
•As compared to females, the male adults have a considerably higher positive attitude towards entrepreneurship in society . The western, southern and eastern regions of India have a more positive attitude towards entrepreneurship in general when compared with northern regions .
• TheWorldEconomicForumclassifiescountries into three categories, i .e . factor driven, efficiency driven andinnovation driven every year, and Indiahasbeenclassifiedunderfactor-driven economy in 2014 . This tends to report more positive attitudes on entrepreneurial measures, such as perceived opportunities to start a business and perceived skills to start a business, in comparison to those in efficiency-driven and innovation-driven economies .
• In India, 39 per cent of adults perceive good opportunities to start a business and 37 per cent of adults believe they have capabilities to start a business, while 38 per cent feel that the fear of failure is preventing them from taking the plunge .
•Comparing the perceptions among male and female respondents, fear of failure, which prevents individuals from starting a business, is similar (51% for males and 48% for females) . However, female respondents have lower scores on perceived capabilities (43%) and perceived opportunities (41%) than their male counterpart .
•GEM 2014 survey found that in India, 4 .1 per cent of adults are “nascent en-trepreneurs” (actively involved in set-ting up a business), while 2 .5 per cent are “new business owners” (in opera-tion for more than 3 months but less than 42 months) . Combining both these
Global Entrepreneurship Monitor 2014: India Report
ix
rates gives us the Total Early-stage En-trepreneurial Activity (TEA) rate, mean-ing that 6 .6 per cent of the Indian adult population—or 1 in every 14 adults—is engaged in some form of early-stage entrepreneurial activity .
•Almost 6 .6 per cent of the adult population in India is engaged in entrepreneurship, while 3 .7 per cent already own/manage an established business . However, 7 .66 per cent adults are expected to start business in the next 3 years .
•The rate of business discontinuance is anticipated to be the highest in the factor-driven economies . However, India’s entrepreneurial exit rate is the second lowest among all GEM countries, which is indeed a positive factor .
•The distribution of age groups within the TEA is in line with global trends, where the highest prevalence rate is found in the 18–44 age groups than any other age range . In India, about one-third (34%) of early-stage entrepreneurs are women . The survey suggests that early-stage entrepreneurial activity is dominated by men and women start a business venture more often out of necessity than men .
• In India, entrepreneurs motivated by necessity (no other option for work) account for 31 per cent of early-stage activity, while 36 .5 per cent is motivated by improvement-driven motive . Where as in China the rate of necessity-driven entrepreneurship is 33 .2 per cent, improvement-driven entrepreneurship is 45 .4 per cent .
•Personal reasons (34%), lack of profitability (28%) and limitations in
accessingfinance(19%)arethemainreasons for entrepreneurial exits . The data indicates the need for stronger focus on entrepreneurial skills enhancement, financial managementtraining, and ease of funding options for creating and sustaining new ventures .
•More than 50 per cent of total early-stage entrepreneurs do not intend to increase employment prospects . Of those expecting to generate employment opportunities, majority are slow growth companies, looking at hiring 1–5 employees . The data confirmsthatabout4percentIndianentrepreneurs expect to expand rapidly in terms of employment creation (more than 20 employees) .
National Experts Survey•The opinion of national experts
revealed insights on factors impacting the environment for entrepreneurship . These factors are known as Entrepreneurial Framework Conditions (EFCs) of the country .
•According to the GEM National Experts Survey, Government regulation and policies, entrepreneurial education at primary and secondary school level and transfer and commercialization of R&D are regarded as the main constraining factors for entrepreneurship in India .
•Factors like commercial infrastructure, internal market dynamics, ease of access to available physical infrastructure, and cultural and social norms emerged as major enablers for entrepreneurship development in India .
x
Global Entrepreneurship Monitor 2014: India Report
•While the Indian economy is dynamic and the overall business climate good, there is a need to develop entrepreneurship on the margins of society to achieve inclusive growth . Furthermore, to improve levels of business sustainability, systems of entrepreneurial education, training, and development must be put into place .
•Recommendations are suggested to facilitate government policies, capacity building through education and training, restructuring of incentive and tax structures to promote more opportunity-driven entrepreneurship, and increased investment in R&D transfer to propel growth through innovation .
Global Entrepreneurship Monitor 2014: India Report
xi
ACKNOWLEDGEMENTSThe GEM India Report 2014 is an outcome of collective efforts of GEM India consortium, which was created by three institutions, Entrepreneurship Development Institute India (EDI), Gandhinagar; Indian School of Business (ISB), Hyderabad; and Institute of Management Technology (IMT) Ghaziabad. This report is the second national level report by the GEM India Team. The report provides information on entrepreneurship ecosystem and entrepreneurial activity in the country. The authors wish to express their gratitude to every member of the GEM India Team for their support and contribution to this project.
The leadership of the Entrepreneurship Development Institute of India, Wadhwani Centre for Entrepreneurship Development, ISB – Hyderabad, and IMT– Ghaziabad was ever ready to extend support and cooperation . Our deepest thanks and appreciation for their efforts as without their support and funding, it would not have been completed .
We acknowledge the Heads of all three institutions of GEM India consortium for envisioning GEM India Team in 2011 and to keep India on the global map of Global Entrepreneurship Research Association (GERA), USA .We owe our gratitude to the GEM Global Team at London Business School, Babson College as well as the GEM Data team for their unceasing aid and assistance at all times .
– We specially thank Dr Dinesh N . Awasthi (Former Director, EDI), forextending support needed for this project .
– The authors thank Dr Bibek Banerjee from IMT, Ghaziabad and his colleagues,Mr Vikas Gupta, Ms Noel Saraf and Mr Safal Batra for coordinating AdultPopulation Survey .
– It’s our privilege to express our gratitude to Dr Vijay Vyas (Faculty, PortsmouthBusiness School, U .K .), for his constant efforts to facilitate this study .
– Our earnest gratitude also to Mr Santosh Srinivas, Mr Kumar Ashish, and Mr Muzaffar Hussain from ISB, Hyderabad for their valuable inputs in this project .
– Our deepest regards to the national experts and respondents of the adultsurvey for their valuable time and efforts for sharing their insights on theentrepreneurial environment of India .
– We express our cordial thanks to Mr John George and his team membersat IMRB for timely conducting and submitting data of APS survey .
– The authors thank Mr Nikhilesh Desai for facilitating the publication of thisreport and acknowledge the support from Ms Julie Shah and Ms JigishaAagja in editing of this work .
Authors

xii
Global Entrepreneurship Monitor 2014: India Report
ABOUT THE AUTHORS
Dr Sunil ShuklaDr Sunil Shukla is the Director of Entrepreneurship Development Institute of India (EDI) . His research and consulting interests include entry barriers to entrepreneurship, curriculum development, intrapreneurship, family business management and organizational culture . Dr Shukla has been helping various organizations and corporates in strategic planning and capacity building of employees besides grooming their managers as intrapreneurs, leading to conducive climate for corporate entrepreneurship . Dr Shukla has been leading, the Global Entrepreneurship Monitor (GEM) India Consortium as a national team leader since 2012 .
Dr Krishna TanukuDr Krishna Tanuku is currently the Executive Director of the Wadhwani Centre for Entrepreneurship Development (WCED), Indian School of Business (ISB), Hyderabad . Dr Tanuku has an illustrious career that spans over 25 years of global experience covering the US, Europe, Asia, and the Middle East . His expertise covers from R&D to product management to marketing and also includes new markets expansion and management including JVs in Europe, South Korea, Japan and India . In 1994, Dr Tanuku was recognized with an international award as “MAN of the YEAR 1994 – Management and Business Vision” for “business acumen, innovative ideas, services and leadership in the field ofTelecommunication and Informatics”.DrTanuku is a nationalteam member of the Global Entrepreneurship Monitor (GEM), India consortium .

Global Entrepreneurship Monitor 2014: India Report
xiii
Dr Pankaj BhartiDr Pankaj Bharti has been working as a Faculty at Entrepreneurship Development Institute of India (EDI), Gandhinagar . He specializes in Organizational Behaviour, Human Resource Management and Corporate Entrepreneurship . He holds more than 10 years experience in the academics and industry . He is trained in conceptualizing and developing measurement tools for Social Science Research . He is also a National Team Member of Global Entrepreneurship Monitor (GEM), India . He has published papers and book on ‘Dehumanization of Urban and Rural Poor’ . He is associated with more than twenty research projects and programmes .
Dr Amit K. DwivediDr Amit K . Dwivedi has more than 10 years of teaching and research experience . Dr Dwivedi is associated with reputed national and international journals as Editor and reviewer, and has published forty research papers and three books . He has also edited three books . Dr Dwivedi has presented several research papers in national and international conferences . Currently he is National Team Member of Global Entrepreneurship Monitor (GEM) .

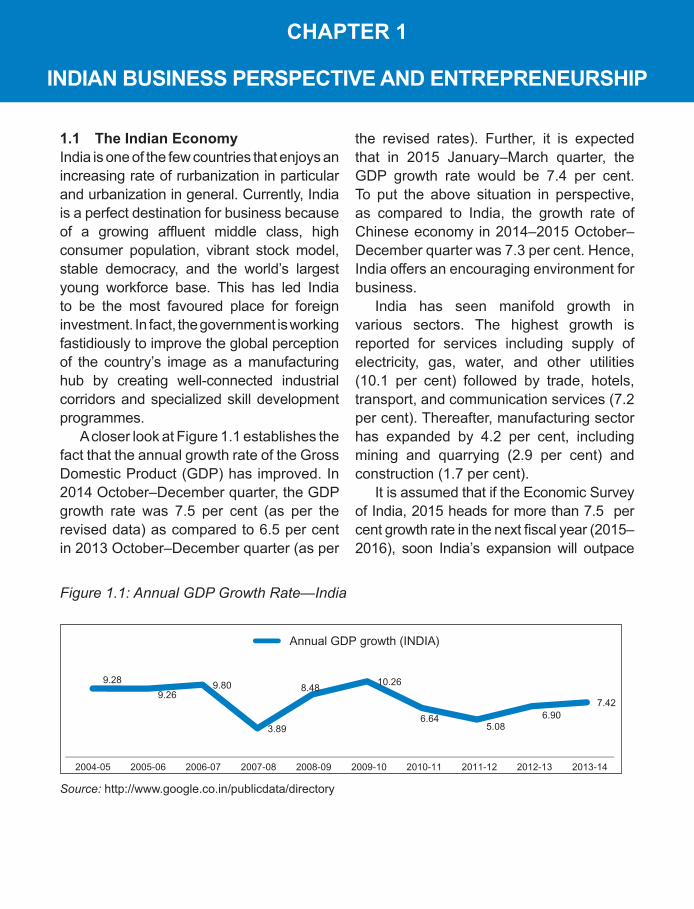
1.1 The Indian EconomyIndia is one of the few countries that enjoys an increasing rate of rurbanization in particular and urbanization in general. Currently, India is a perfect destination for business because of a growing affluent middle class, high consumer population, vibrant stock model, stable democracy, and the world’s largest young workforce base. This has led India to be the most favoured place for foreign investment. In fact, the government is working fastidiously to improve the global perception of the country’s image as a manufacturing hub by creating well-connected industrial corridors and specialized skill development programmes.
A closer look at Figure 1.1 establishes the fact that the annual growth rate of the Gross Domestic Product (GDP) has improved. In 2014 October–December quarter, the GDP growth rate was 7.5 per cent (as per the revised data) as compared to 6.5 per cent in 2013 October–December quarter (as per
the revised rates). Further, it is expected that in 2015 January–March quarter, the GDP growth rate would be 7.4 per cent. To put the above situation in perspective, as compared to India, the growth rate of Chinese economy in 2014–2015 October–December quarter was 7.3 per cent. Hence, India offers an encouraging environment for business.
India has seen manifold growth in various sectors. The highest growth is reported for services including supply of electricity, gas, water, and other utilities (10.1 per cent) followed by trade, hotels, transport, and communication services (7.2 per cent). Thereafter, manufacturing sector has expanded by 4.2 per cent, including mining and quarrying (2.9 per cent) and construction (1.7 per cent).
It is assumed that if the Economic Survey of India, 2015 heads for more than 7.5 per cent growth rate in the next fiscal year (2015–2016), soon India’s expansion will outpace
Figure 1.1: Annual GDP Growth Rate—India
9.28
9.269.80
3.89
8.4810.26
6.645.08
6.907.42
2004-05 2005-06 2006-07 2007-08 2008-09 2009-10 2010-11 2011-12 2012-13 2013-14
Annual GDP growth (INDIA)
Source: http://www.google.co.in/publicdata/directory
CHapTEr 1
IndIan BusInEss pErspECTIvE and EnTrEprEnEursHIp
2
Global Entrepreneurship Monitor 2014: India Report
that of China, Japan and Germany combined as recently projected by Christine Lagarde, the Chief of International Monetary Fund.1
Given the fact that India’s consistent growth rate in 2014 is 7.4 per cent, it is one of the fastest growing economies along with China, which is remarkably $10.4 trillion in size. The Indian economy, at $2.06 trillion, has almost doubled in size since the financial crisis hit the country in 2008 and has more than quadrupled from the start of this millennium.
On the contrary, despite an increase in its per capita Gross National Income (GNI), India has remained in the “lower middle income” category ($1,046–4,125). According to the World Bank’s data, an agency extrapolated from India’s average annual growth rate in per capita GNI 8.9 per cent over the last decade and found that it would become an “upper middle income” country ($4,126–12,735) in 2026, a little more than a decade from now. This will put it in the category that China occupies now.2
China, however, with a per capita GNI of $7,380 and an average annual growth in this parameter of 15.6 per cent, will leave the “upper middle income” category by 2018 to become a “high income” country like the US the UK Germany, and Japan. It is only by 2039 that India, at the assumed growth rate, will reach that level.
1 http://articles.economictimes.indiatimes.com/2015-04-14/news/61142139_1_world-economic-outlook-director-christine-lagarde-growth-projection2 India is now a $2 trillion economy, http://www.thehindu.com/business/Economy/india-is-now-a-2trillion-economy-says-world-bank-data/article7380442.ece (accessed October 1, 2015).
The World Bank’s data on per capita GNI—the total value added by all producers within the country, plus income received from citizens working abroad, divided by the population of the country—show that Bangladesh, Kenya, Myanmar, Tajikistan, Mongolia, Paraguay, Argentina, Hungary, the Seychelles, and Venezuela have shifted their income categories for the better. For example, Bangladesh, Kenya, Myanmar, and Tajikistan are now “middle income’ countries from being “low income” nations.
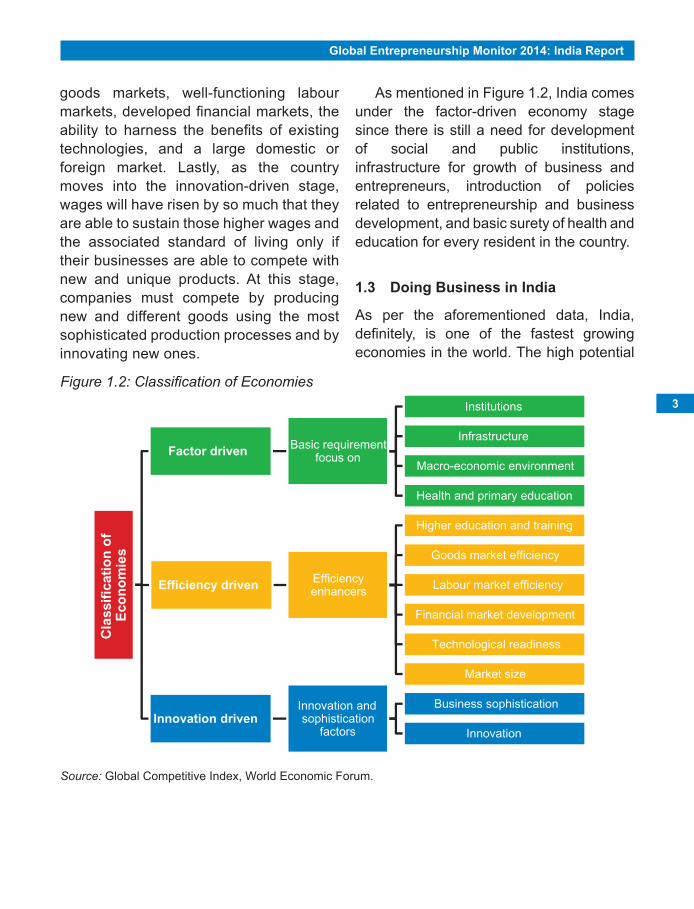
1.2 Classification of EconomiesIn line with the well-known economic theory of stages of development, the World Economic Forum (WEF) develops Global Competitive Index (GCI) every year and classifies economies in three broad categories which are factor driven, efficiency driven, and innovation driven. GCI assumes that, in the first stage, the economy is factor driven and countries compete based on their factor benefactions, primarily unskilled labour and natural resources. To maintain competitiveness at this stage, the economy primarily focuses on well-functioning public and private institutions, a well-developed infrastructure, a stable macroeconomic environment, and a healthy workforce that has at least received basic education. As the country becomes more competitive, productivity will increase and wages will rise with advancing development. Apparently, the country will move into the efficiency-driven stage of development. At this point, competitiveness is increasingly driven by higher education and training, efficient
Global Entrepreneurship Monitor 2014: India Report
3
goods markets, well-functioning labour markets, developed financial markets, the ability to harness the benefits of existing technologies, and a large domestic or foreign market. Lastly, as the country moves into the innovation-driven stage, wages will have risen by so much that they are able to sustain those higher wages and the associated standard of living only if their businesses are able to compete with new and unique products. At this stage, companies must compete by producing new and different goods using the most sophisticated production processes and by innovating new ones.
Figure 1.2: Classification of Economies
Cla
ssif
icat
ion
of
Eco
no
mie
s
Factor driven Basic requirement focus on
Institutions
Infrastructure
Macro-economic environment
Health and primary education
Efficiency driven Efficiency enhancers
Higher education and training
Goods market efficiency
Labour market efficiency
Financial market development
Technological readiness
Market size
Innovation drivenInnovation and sophistication
factors
Business sophistication
Innovation
As mentioned in Figure 1.2, India comes under the factor-driven economy stage since there is still a need for development of social and public institutions, infrastructure for growth of business and entrepreneurs, introduction of policies related to entrepreneurship and business development, and basic surety of health and education for every resident in the country.
1.3 doing Business in India
As per the aforementioned data, India, definitely, is one of the fastest growing economies in the world. The high potential
Source: Global Competitive Index, World Economic Forum.
4
Global Entrepreneurship Monitor 2014: India Report
of the Indian market driven by an emerging middle class, cost competitiveness, and a huge pool of talent makes it one of the most attractive investment destinations. Yet, according to the World Bank’s ‘Doing Business 2014’ report, India is ranked 134 out of 189 countries in the overall ease of doing business. This places India lower than the other BRICS (Brazil, Russia, India, China, and South Africa) members and highlights its relatively dismal performance among other South Asian countries.
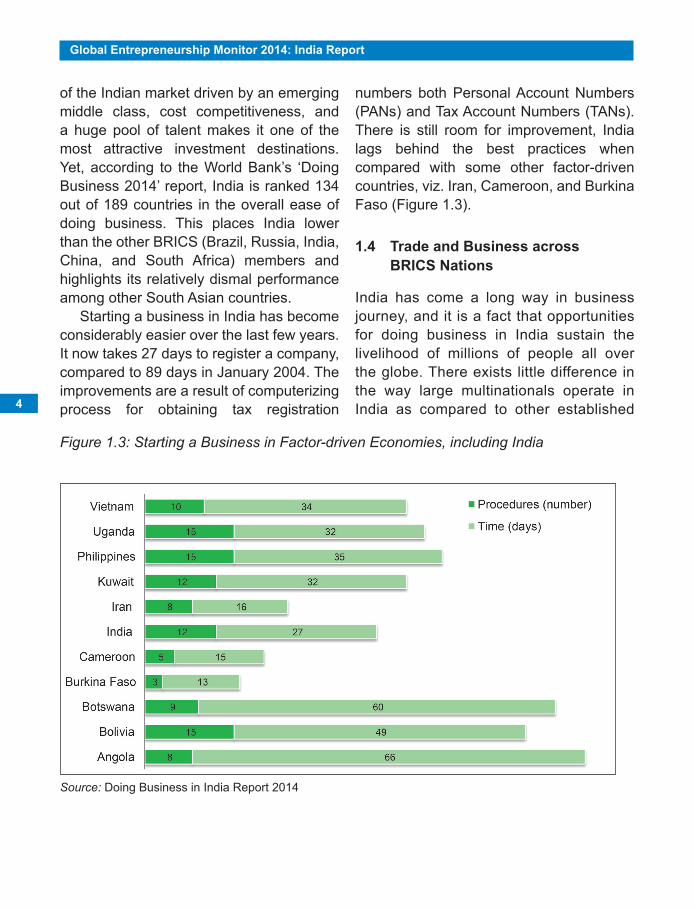
Starting a business in India has become considerably easier over the last few years. It now takes 27 days to register a company, compared to 89 days in January 2004. The improvements are a result of computerizing process for obtaining tax registration
Figure 1.3: Starting a Business in Factor-driven Economies, including India
numbers both Personal Account Numbers (PANs) and Tax Account Numbers (TANs). There is still room for improvement, India lags behind the best practices when compared with some other factor-driven countries, viz. Iran, Cameroon, and Burkina Faso (Figure 1.3).
1.4 Trade and Business across BRICS Nations
India has come a long way in business journey, and it is a fact that opportunities for doing business in India sustain the livelihood of millions of people all over the globe. There exists little difference in the way large multinationals operate in India as compared to other established
Source: Doing Business in India Report 2014
Global Entrepreneurship Monitor 2014: India Report
5
BRICS economies. Particularly, the emergence of corporate hubs in the country, especially special economic zones, has led to a paradigm change in business models and the overall trade architecture and attitudes.
The BRICS are natural candidates for more intense market exploitation, given their differentiated dynamism. This could contribute to reduce trade disequilibria in some sectors, such as manufacturing. But this strategy relies upon the actual access to these markets.
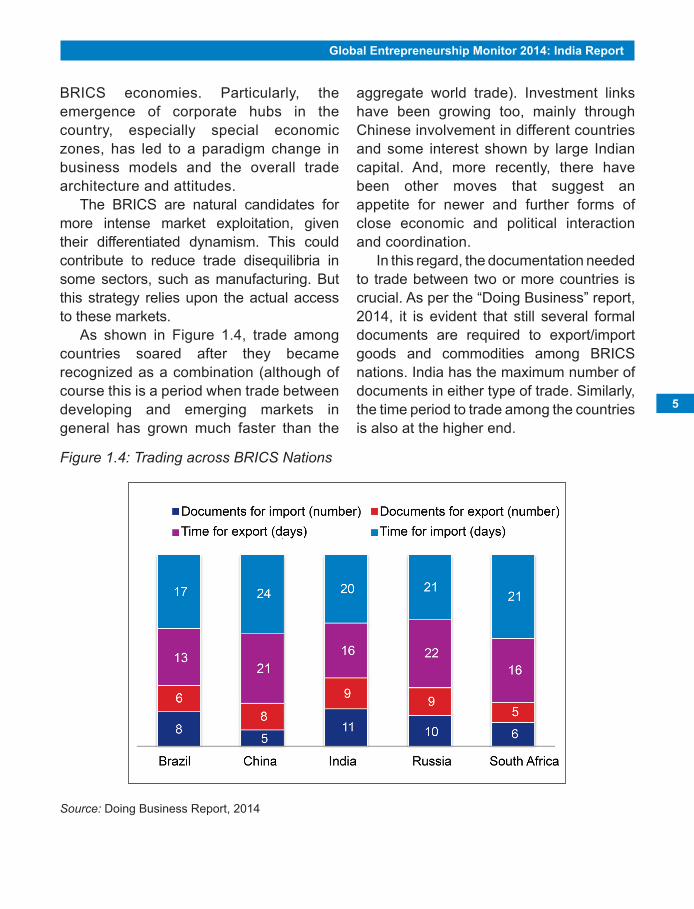
As shown in Figure 1.4, trade among countries soared after they became recognized as a combination (although of course this is a period when trade between developing and emerging markets in general has grown much faster than the
Source: Doing Business Report, 2014
Figure 1.4: Trading across BRICS Nations
aggregate world trade). Investment links have been growing too, mainly through Chinese involvement in different countries and some interest shown by large Indian capital. And, more recently, there have been other moves that suggest an appetite for newer and further forms of close economic and political interaction and coordination.
In this regard, the documentation needed to trade between two or more countries is crucial. As per the “Doing Business” report, 2014, it is evident that still several formal documents are required to export/import goods and commodities among BRICS nations. India has the maximum number of documents in either type of trade. Similarly, the time period to trade among the countries is also at the higher end.
6
Global Entrepreneurship Monitor 2014: India Report
1.5 India and China on similar Track
India and China are competing keenly to grasp a greater share of the world trade and investment. Many observers believe that India and China have taken different paths to economic growth. While China has enjoyed its status as the world’s premier manufacturing destination and has benefited from exports, India has been the favoured destination for investment in services.
China is the manufacturing powerhouse of the world because of its developed infrastructure, pro-FDI policies, and low-cost labour. It is also ahead of India on majority of the macroeconomic and social indicators. However, China’s population is set to age, whereas India, with a median age of 29, will be the youngest country in the world by 2020.3 India also scores above China in terms of its democratic government and its significant proportion of English-speaking people. Moreover, minimum wages in China have increased over the years, and its cost advantage has been reduced.4
Despite some recent challenges, India’s fundamental strengths are still intact. It has a large and growing consumer base and strong democratic institutions. Over a 10-year period, India’s middle class has grown by 350 million. No other country can match such pace of growth.
1.6 Entrepreneurship Development in India
Entrepreneurship development in the country shapes it economic destiny by creating wealth and employment, offering products and services, and generating taxes for governments. That is why entrepreneurship has closely been linked to economic growth in the literature on the subject. The entrepreneurial orientation to nation development accepts entrepreneurship as the central force of economic growth and development, without which other factors of development will be wasted or frittered away. However, the acceptance of entrepreneurship as a central development force by itself will not lead to development and advancement of enterprises.
Unlike most of the developed economies, India is a young country with about 63 per cent population currently being in the working age group of 15 to 59 years. This is an advantageous factor in its favour as studies have found that nascent entrepreneurship prevalence rates are highest in the 25–34 age group. But, this demographic dividend could prove to be its albatross if we are not able to engage our youth in creative pursuits by developing appropriate skills, including entrepreneurship skills. As of now, only about 5–6 per cent youth have access to some kind of skills. To convert youth as entrepreneurs, the government has developed policies and programmes including enhancing their innovation capacity. The government has declared 2010 to 2020 as the “Decade of Innovation” and
3 “India to be a youngest nation by 2020,” The Hindu website, www.thehindu.com (accessed July 27, 2013).
4 “China to Boost Minimum Wage 20% Annually for Five Years, Morning Post Says,” Bloomberg website, www.bloomberg.com (accessed August 7, 2013).
Global Entrepreneurship Monitor 2014: India Report
7
has set up the National Innovation Council to develop a culture of inclusive innovation.5 The Science, Technology, and Innovation Policy, 2013 aims to position India among the top five global scientific powers by 2020. Under this policy, the government aims to increase the gross expenditure on scientific research and development to 2 per cent of GDP. The policy also contains plans to establish Technology Business Incubators and science-led entrepreneurship institutions. However, given its innovation potential, India is underperforming. Its ranking on the Global Innovation Index fell from 64th in 2012 to 66th in 2013.6 The National Entrepreneurship Network (NEN) is working with the Department of Science and Technology and other stakeholders to promote innovation-driven entrepreneurship in campuses across India.7 Another initiative taken by the government to encourage collaborative research is the Australia–India Strategic Research Fund.8
India’s dynamic standing in the global marketplace is set to strengthen further in the coming years. With the rising number
of incubators, angel networks, and early stage venture capital funds, the country’s start-up ecosystem is developing gradually. According to the Planning Commission’s report on Angel Investment and Early Stage Venture Capital in India, the country was home to 120 incubators in 2012, most of which were government sponsored and affiliated to educational institutions. Institutes such as the Centre for Innovation, Incubation and Entrepreneurship (CIIE), the Entrepreneurship Development Institute of India (EDI), start-up villages, and a strong network of business incubators also promote a distinct culture of entrepreneurship.
1.7 Youth Entrepreneurship– achilles Heel
In spite of the above-mentioned efforts, a large section of masses are oblivious of entrepreneurship and its benefits. For instance, the young generation after passing their initial phases of education are still running to get admissions in such courses or programmes which would eventually ensure jobs in government sector, large private sector, or multinational corporations. Even after completing their education, only a handful of youngsters prefer to opt for entrepreneurship as their career. To make matters worse, it is a general perception that only those who could not perform well in other career options, opt for business as career. Business is thus a last resort for them. The psyche of the people has not undergone any change; they continue to inspire their children to take up traditional
5 Decade of Innovations: 2010–2020 Roadmap, National Innovation Council website, www.innovationcouncil.gov.in (accessed December 10, 2012).6 “India slips to 64th on global innovation index,” Business Standard, July 3, 2013, via Dow Jones Factiva, ©2013 Business Standard Ltd.7 Creating a culture of innovation,” Mint, December 10, 2012, via Dow Jones Factiva, ©2012 HT Media Limited.8 Australia–India Strategic Research Fund (AISRF), Ministry of Science and Technology, Department of Scientific and Industrial Research, January 2013, p. 2.
8
Global Entrepreneurship Monitor 2014: India Report
career options of medicine, engineering, or top government jobs. This shows that these institutions have failed to sensitize the masses towards entrepreneurship and its advantages. Correlating this observation the study on ‘Entry Barriers to Entrepreneurship in India: As Perceived by the Youth’ by Sunil Shukla and Dinesh Awasthi (2012), pointed out that the students in the sample were alien to the idea of entrepreneurship and its process and, hence, did not consider entrepreneurship as a career choice. A majority of them, however, also opined that if they were exposed to opportunities, procedures, and formalities, they would be willing to consider their career in entrepreneurship.
Seeing the dynamism of the economy and overall business scenario, there is a need ‘to regularly update’ the training pedagogy, interventions, curriculum motivational tools and the techniques and should be updated from time to time. But this aspect also does not show a very remarkable picture. Very few innovative methodologies have been developed till now. Overall, the techniques of teaching/training adopted by the institutions appear to be similar. They continued to follow the tools/techniques and methodologies devised in early years and, thus, require an overhaul.
1.8 Global Entrepreneurship Monitor (GEM)
The Global Entrepreneurship Monitor (GEM) is the world’s foremost study of entrepreneurship. Through a vast, centrally coordinated, internationally executed data
collection effort, GEM is able to provide high quality information, comprehensive reports, and interesting stories, which significantly enhance the understanding of the entrepreneurial phenomenon—but it is simply beyond this much. It is also an ever-growing community of believers in the transformative benefits of entrepreneurship.
GEM began in 1999 as a joint project between Babson College (USA) and London Business School (UK). The aim was to consider why some countries are more ‘entrepreneurial’ than others. Fifteen years on, GEM is the richest resource of information on the subject, publishing a range of global, national, and ‘special topic’ reports on an annual basis.
In each participating economy, GEM looks at two elements (1) the entrepreneurial behaviour and attitudes of individuals and (2) the national context and how it impacts entrepreneurship. The information collected through surveys and published data carefully analyzed by the local GEM researchers allow a deep understanding of the environment for entrepreneurship and provide valuable insights.
GEM collects primary data on entrepreneurship and focuses on the individual entrepreneur. Its approach is the same throughout the world, facilitating detailed international comparisons. Though the measures come from the research process, it captures all different stages from seeing an opportunity to making the first steps towards starting a business, nurturing a baby business, and scaling it up.
Particularly, its historical global data set is extremely comprehensive with well
Global Entrepreneurship Monitor 2014: India Report
9
over 2 million observations across over a hundred economies. It is an invaluable resource for researchers and has made a significant academic contribution.
1.8.1 GEM India: GenesisIn due course of time, GEM has emerged as the world’s leading entrepreneurship study and the richest platform of entrepreneurship research. The GEM research was initiated in India by the N.S. Raghavan Centre for Entrepreneurial Learning (NSRCEL) at IIM, Bengaluru in 2001. Following the successful accomplishment of GEM India Research Project 2001, it was again undertaken in 2002. Back then, the GEM research model was in its nascent stage and the ‘Assessment of Entrepreneurial Activity’ in India was a novel concept.
Prof. Mathew J Manimala (NSRCEL, IIM-B) conducted the GEM India survey during 2001 and 2002 under the GEM Research Project and delivered research work in form of two annual reports.
Subsequently, during 2006–2008, a team of Prof. I M Pandey, Prof. Ashutosh Bhupatkar, and Prof. Janki Raman from the Pearl School of Business, Gurgaon conducted the GEM India study. The surveys were conducted over 3 years and the data featured in GEM Global Report 2006, 2007, and 2008. However, the GEM India team could not publish the national report during the same period. Moreover, due to some reasons, in the succeeding years (2008–2011), the GEM India study was not undertaken.
GEM India, 2012–2015
In 2011, with an aim to continue with the GEM India study, the heads of three leading institutions, i.e. Dr Dinesh Awasthi (Director, Entrepreneurship Development Institute of India, Gandhinagar), Dr Krishna Tanuku (Executive Director, Wadhwani Centre for Entrepreneurship Development, Indian School of Business, Hyderabad), and Dr Bibek Banerjee (Director, Institute of Management Technology, Ghaziabad) along with Dr Vijay Vyas (Faculty, Portsmouth Business School, UK) and Prof. Mathew J Manimala (NSRCEL, IIM, Bengaluru) discussed the possibilities of forming the GEM India consortium, 2012–2015. Finally, the three institutions, i.e. EDI, ISB, and IMT Ghaziabad formed a national-level consortium.
To begin the project anew, the three institutions signed a Memorandum of Understanding (MoU) and the ‘GEM India Plus’ consortium was formed on February 2, 2012 for research over 3 years, i.e. 2012 to 2015. All three partners unanimously agreed to nominate Entrepreneurship Development Institute of India, EDI (Gandhinagar) as the Lead Institution and Prof. Sunil Shukla (Director, EDI) as the Team Leader.
As per the stipulated requirements, the ‘GEM India Plus’ consortium conducted research studies during the years 2012, 2013, and 2014. The research results of the study conducted in the year 2013 were featured in the GEM national report, 2013.
10
Global Entrepreneurship Monitor 2014: India Report
Presently, GEM national report, 2014 is under progress. After 3 years, ‘GEM India Plus, 2012–2015’ consortium was reconstituted.
GEM India, 2015–2018
The present ‘GEM India team’ comprises Entrepreneurship Development Institute of India, (EDI, Gandhinagar), Centre for Entrepreneurship Development Madhya Pradesh (CEDMAP, Bhopal), and Jammu & Kashmir Entrepreneurship Development Institute (JKEDI, Srinagar). The three institutions signed an MoU on April 11, 2015 at EDI, Gandhinagar for the next three annual GEM studies commencing from April 2015. The institutions agreed to fulfill GEM annual cycle and other obligations, in a time-bound manner, to suit GEM global schedule.
The present consortium also nominated EDI, Gandhinagar as the Lead Institution and the Secretariat of the GEM India team. In this initiative, Prof. Sunil Shukla was designated as the National Team Leader.
1.8.2 GEM India TeamThe GEM India team has its secretariat at the lead institution Entrepreneurship Development Institute of India (EDI). The GEM programme is a major initiative aimed
at studying, analyzing, and describing entrepreneurial processes within a wide range of countries. To contribute towards GEM India report, an initiative was taken by EDI, Gandhinagar along with the Institute of Management Technology (IMT, Ghaziabad) and Indian School of Business (ISB, Hyderabad). All three institutions formed a consortium, namely GEM India team in 2012 with EDI as the lead institute. The team had participated in three annual study cycles during 2012 to 2015 and delivered a national report (GEM national report, 2013) after a long gap of more than 10 years. Currently, The GEM national report, 2014 is under progress.
Being a pioneer in Entrepreneurship Education and Research in India, EDI took an initiative to continue GEM India studies by reforming the consortium with new partners. For this, EDI initiated a dialogue with two state-level institutions practicing entrepreneurship (Centre for Entrepreneurship Development Madhya Pradesh, Bhopal and Jammu Kashmir Entrepreneurship Development Institute, Srinagar). As a result, strengths, capabilities, and enthusiasm of working together as partner institutions led to the formation of the GEM India consortium in April 2015.
2.1 About the Global Entrepreneurship Monitor Project
The Global Entrepreneurship Monitor Project was initiated in 1999 by London Business School, UK and Babson College, USA. Since 1999, the GEM study has been carried out every year and expanded considerably. For instance, the 2014 report recorded the estimable participation from 73 countries. Unique of its kind, the GEM project is a distinctive research study about the entrepreneurial tendencies in different nations of the world. It basically assesses the entrepreneurial activity prevalent to a particular nation and links it to the entrepreneurial framework conditions of the country on one hand, and the projected economic growth on the other.
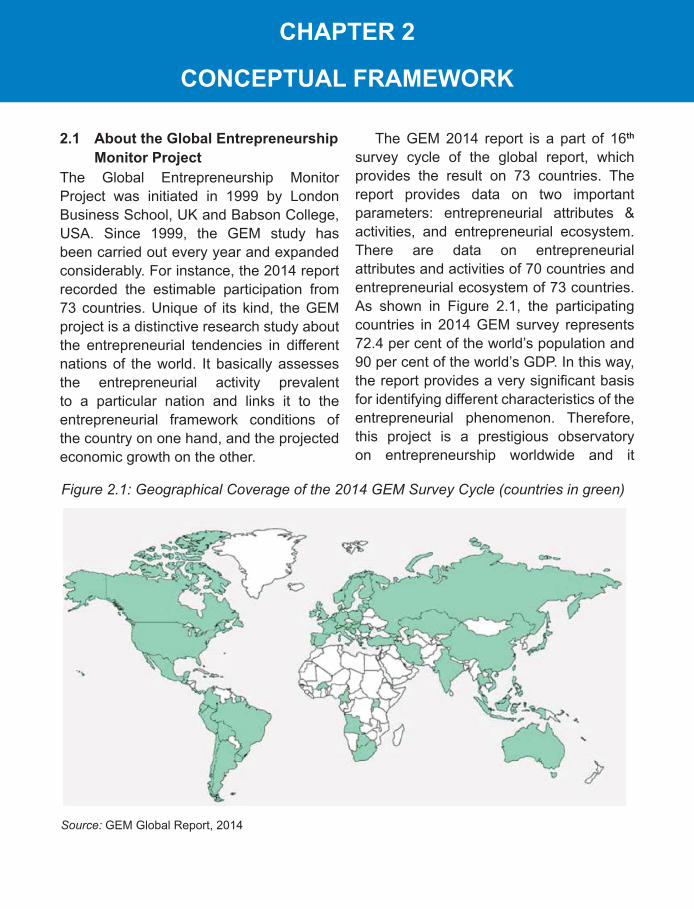
The GEM 2014 report is a part of 16th survey cycle of the global report, which provides the result on 73 countries. The report provides data on two important parameters: entrepreneurial attributes & activities, and entrepreneurial ecosystem. There are data on entrepreneurial attributes and activities of 70 countries and entrepreneurial ecosystem of 73 countries. As shown in Figure 2.1, the participating countries in 2014 GEM survey represents 72.4 per cent of the world’s population and 90 per cent of the world’s GDP. In this way, the report provides a very significant basis for identifying different characteristics of the entrepreneurial phenomenon. Therefore, this project is a prestigious observatory on entrepreneurship worldwide and it
Figure 2.1: Geographical Coverage of the 2014 GEM Survey Cycle (countries in green)
Source: GEM Global Report, 2014
CHAPtEr 2
ConCEPtuAl FrAMEwork
12
Global Entrepreneurship Monitor 2014: India Report
measures the scope of entrepreneurial activity in each nation and compares it internationally.
The main proposition of the GEM research project is that the level of entrepreneurial activity in a country has a backward linkage to the quality of the entrepreneurial framework conditions in the country, and a forward linkage to the country’s economic growth.
For instance, the supportiveness of the entrepreneurial framework conditions influence the level of entrepreneurial activity, and the level of entrepreneurial activity influences the economic growth. It is noted that such macro-level relationships
can be tested only by using the data of several countries. In fact, at the level of individual countries, the GEM research effort is mainly a fact-finding mission to ascertain the supportiveness of the entrepreneurial framework conditions and the level of entrepreneurial activity in the country. This has been elaborated further in the conceptual framework.
2.2 the GEM Conceptual Framework
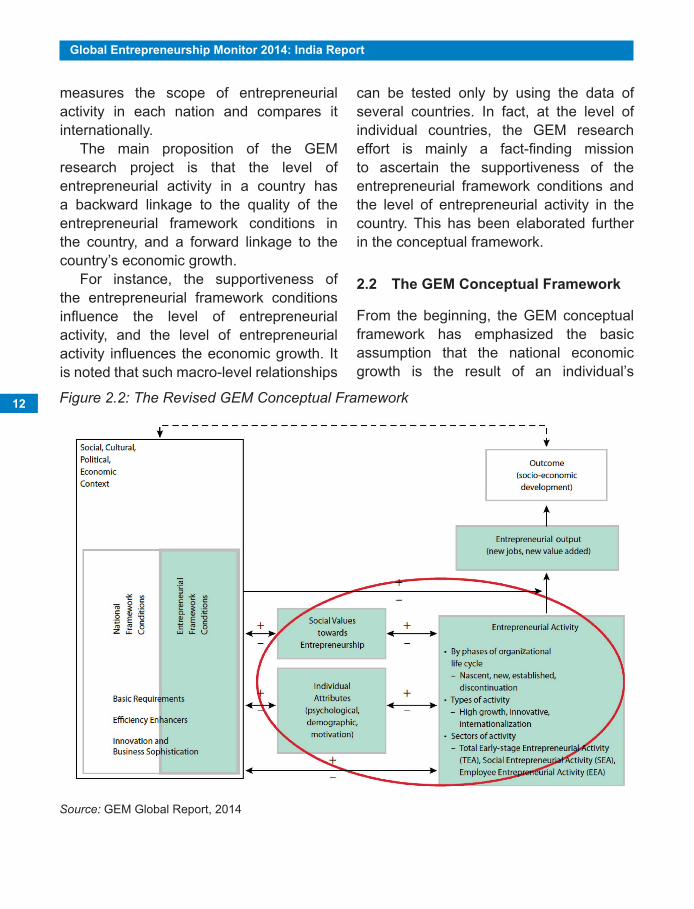
From the beginning, the GEM conceptual framework has emphasized the basic assumption that the national economic growth is the result of an individual’s
Figure 2.2: The Revised GEM Conceptual Framework
Source: GEM Global Report, 2014
Global Entrepreneurship Monitor 2014: India Report
13
personal ability to recognize and seize opportunities. This process occurs with the interaction of environment.
This year, particularly, to have a better understanding of the relationship between social values, personal attributes, and the various forms of social activities, GEM study has revised its model (see GEM Global Report for the previous model). The major modification of this year’s GEM framework is to expand the entrepreneurial profile (Figure 2.2).
Entrepreneurial activity is not a heroic act of an individual, regardless of the environment in which the activity is performed.
Entrepreneurial activity is an output of the interaction of an individual’s perception on an opportunity and capacity (motivation and skills) to act upon this and the distinct conditions of the respective environment in which the individual is located.
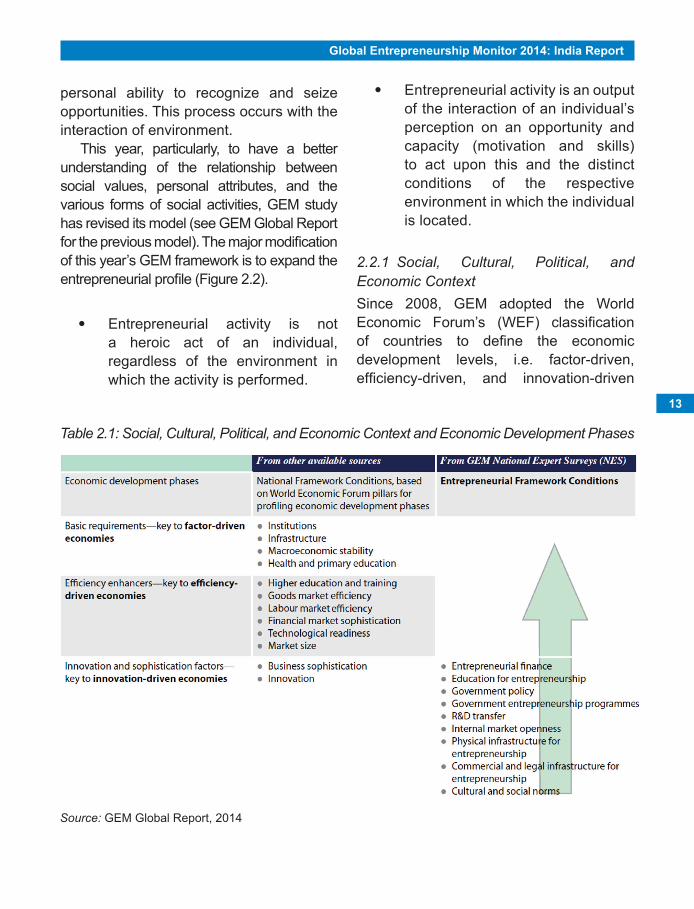
2.2.1 Social, Cultural, Political, and Economic ContextSince 2008, GEM adopted the World Economic Forum’s (WEF) classification of countries to define the economic development levels, i.e. factor-driven, efficiency-driven, and innovation-driven
Table 2.1: Social, Cultural, Political, and Economic Context and Economic Development Phases
Source: GEM Global Report, 2014
14
Global Entrepreneurship Monitor 2014: India Report
economies (Table 2.1). It is important to mention here that the levels of economic development are determined by the dominant presence of the identified group of pillars (WEF Report, 2014).
According to the WEF, the factor-driven phase is characterized by subsistence of agriculture and extraction businesses, with a heavy reliance on (unskilled) labour and natural resources. Companies compete on the basis of price and sell basic products or commodities with their low productivity reflected in low wages. The focus of development efforts tends towards building a sufficient foundation of basic requirements. In the efficiency-driven phase, an economy becomes more competitive with further development accompanied by industrialization and an
increased reliance on economies of scale, with capital-intensive large organizations becoming more dominant. Countries begin to develop more efficient production processes and increase product quality because wages have risen and prices have not kept pace. This phase is generally accompanied by improved (and improving) basic requirements, and attention is then directed towards developing the efficiency enhancers. As countries move into the innovation-driven stage, wages will have risen by so much that they are able to sustain the higher wages and the associated standard of living only if their businesses are able to compete with new and unique products. At this stage, companies must compete by producing new and different goods using the most
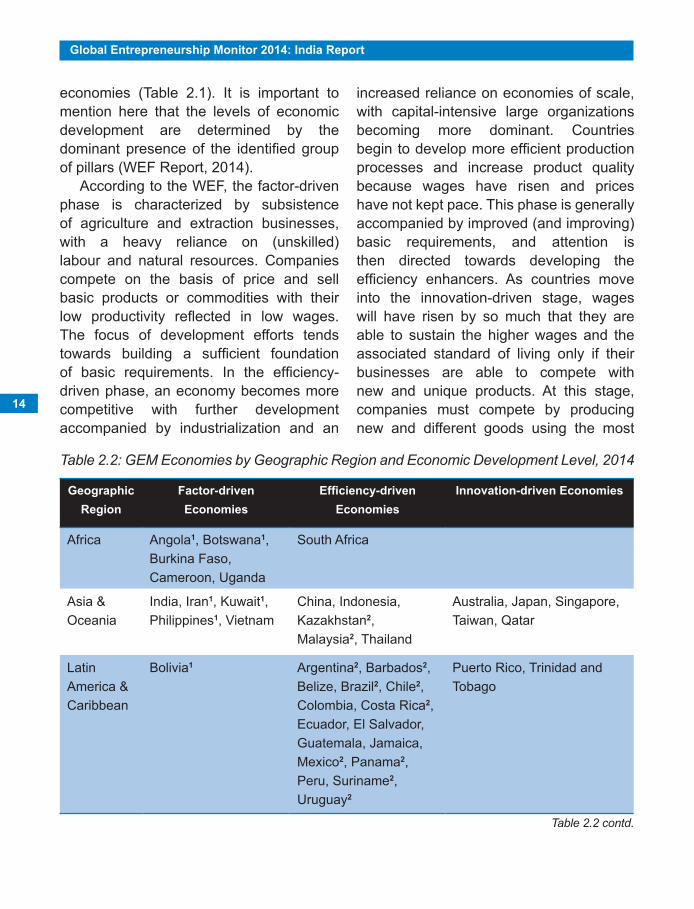
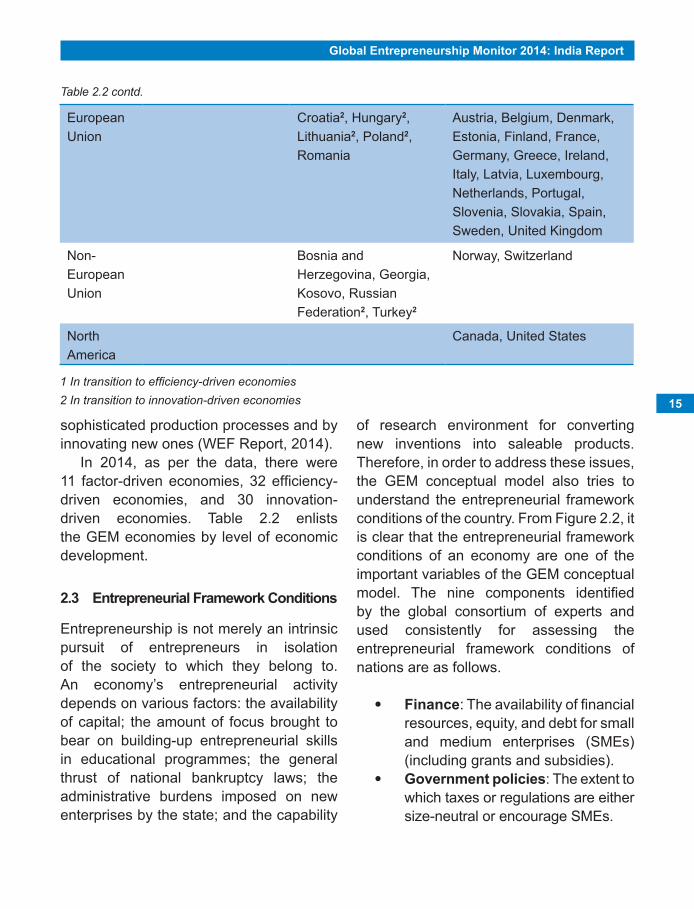
Table 2.2: GEM Economies by Geographic Region and Economic Development Level, 2014
Geographic region
Factor-driven Economies
Efficiency-driven Economies
Innovation-driven Economies
Africa Angola1, Botswana1, Burkina Faso, Cameroon, Uganda
South Africa
Asia & Oceania
India, Iran1, Kuwait1, Philippines1, Vietnam
China, Indonesia, Kazakhstan2, Malaysia2, Thailand
Australia, Japan, Singapore, Taiwan, Qatar
Latin America & Caribbean
Bolivia1 Argentina2, Barbados2, Belize, Brazil2, Chile2, Colombia, Costa Rica2, Ecuador, El Salvador, Guatemala, Jamaica, Mexico2, Panama2, Peru, Suriname2, Uruguay2
Puerto Rico, Trinidad and Tobago
Table 2.2 contd.
Global Entrepreneurship Monitor 2014: India Report
15
sophisticated production processes and by innovating new ones (WEF Report, 2014).
In 2014, as per the data, there were 11 factor-driven economies, 32 efficiency-driven economies, and 30 innovation-driven economies. Table 2.2 enlists the GEM economies by level of economic development.
2.3 Entrepreneurial Framework Conditions
Entrepreneurship is not merely an intrinsic pursuit of entrepreneurs in isolation of the society to which they belong to. An economy’s entrepreneurial activity depends on various factors: the availability of capital; the amount of focus brought to bear on building-up entrepreneurial skills in educational programmes; the general thrust of national bankruptcy laws; the administrative burdens imposed on new enterprises by the state; and the capability
European Union
Croatia2, Hungary2, Lithuania2, Poland2, Romania
Austria, Belgium, Denmark, Estonia, Finland, France, Germany, Greece, Ireland, Italy, Latvia, Luxembourg, Netherlands, Portugal, Slovenia, Slovakia, Spain, Sweden, United Kingdom
Non-European Union
Bosnia and Herzegovina, Georgia, Kosovo, Russian Federation2, Turkey2
Norway, Switzerland
North America
Canada, United States
1 In transition to efficiency-driven economies2 In transition to innovation-driven economies
of research environment for converting new inventions into saleable products. Therefore, in order to address these issues, the GEM conceptual model also tries to understand the entrepreneurial framework conditions of the country. From Figure 2.2, it is clear that the entrepreneurial framework conditions of an economy are one of the important variables of the GEM conceptual model. The nine components identified by the global consortium of experts and used consistently for assessing the entrepreneurial framework conditions of nations are as follows.
Finance: The availability of financial resources, equity, and debt for small and medium enterprises (SMEs) (including grants and subsidies).
Government policies: The extent to which taxes or regulations are either size-neutral or encourage SMEs.
Table 2.2 contd.
16
Global Entrepreneurship Monitor 2014: India Report
Government programmes: The presence and quality of direct programmes to assist new and growing firms at all levels of government (national, regional, and municipal).
Entrepreneurial education and training: The extent to which training in creating or managing SMEs is incorporated within the education and training system at all levels (primary, secondary, and post-school).
r&D transfer: The extent to which national research and development will lead to new commercial opportunities and is available to SMEs.
Commercial and professional infrastructure: The presence of property rights and commercial, accounting, and other legal services and institutions that support or promote SMEs.
Entry regulation: It contains two components: (1) Market Dynamics: the level of change in markets from year to year, and (2) Market Openness: the extent to which new firms are free to enter the existing markets.
Physical infrastructure and services: Ease of access to physical resources i.e. communication, utilities, transportation, land or space, at a price that does not discriminate against SMEs.
Cultural and social norms: The extent to which social and cultural norms encourage or allow actions leading to new business methods or
activities that can potentially increase the personal wealth and income.
2.4 Social Values towards Entrepreneurship
The values and culture of society towards entrepreneurship facilitate the tendencies of individuals to become entrepreneurs and also success of the entrepreneurs is largely dependent on the entrepreneurial ecosystem of the society. Hence, to have better understanding of the relationship between social values and entrepreneurship, the GEM model also includes ‘social value towards entrepreneurship’ as one of the key variables. In this context, GEM tries to understand how society values entrepreneurship as a good career choice; if entrepreneurs have a high-social status; and how media attention to entrepreneurship is contributing (or not) to the development of a national entrepreneurial culture.
2.4.1 Individual AttributesThe GEM conceptual framework includes several individual attributes, i.e. perception of opportunities, perception of own capabilities to act entrepreneurially, fear of failure, and entrepreneurial intentions. These individual attributes facilitate entrepreneurship activities. Apart from these attributes, the GEM model also includes several demographic factors (gender, age, geographic location), and motivational aspects (necessity-based vs. opportunity-based venturing, improvement-driven venturing, etc.).
2.4.2 Entrepreneurial ActivityEntrepreneurial activities are defined in terms of organizational life-cycle approach (nascent, new venture, established venture,
Global Entrepreneurship Monitor 2014: India Report
17
discontinuation), the types of activity (high growth, innovation, internationalization) and the sector of the activity (total early-stage entrepreneurial activity—TEA, social entrepreneurial activity—SEA, employee entrepreneurial activity—EEA). It also provides insights on ambitious entrepreneurial activity (both from the stand point of an owner-managed venture and of an entrepreneurial employee). Finally, gender and age descriptors are used to emphasize some distinctive patterns.
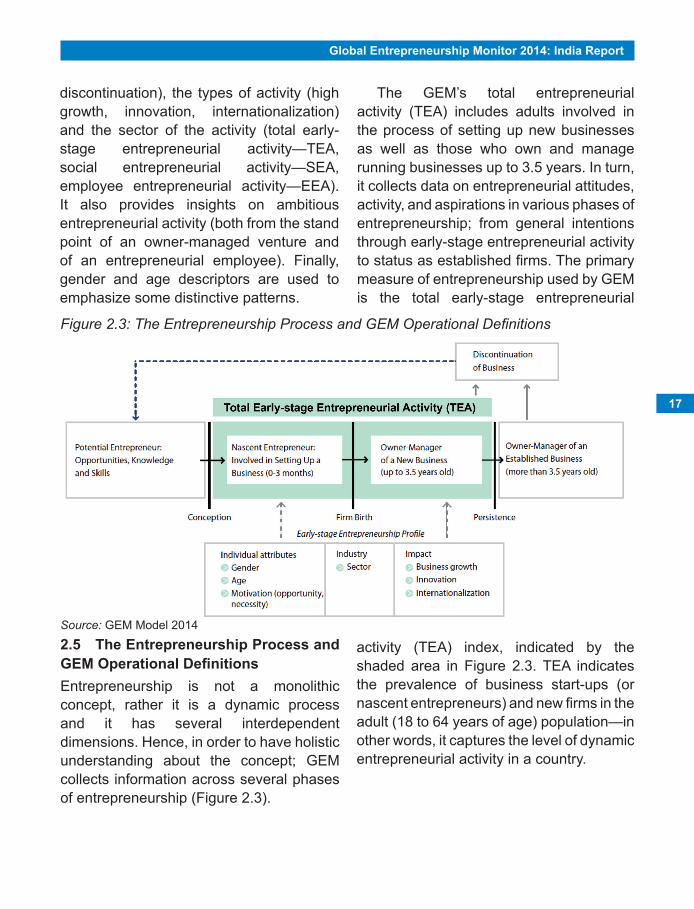
2.5 the Entrepreneurship Process and GEM Operational DefinitionsEntrepreneurship is not a monolithic concept, rather it is a dynamic process and it has several interdependent dimensions. Hence, in order to have holistic understanding about the concept; GEM collects information across several phases of entrepreneurship (Figure 2.3).
Figure 2.3: The Entrepreneurship Process and GEM Operational Definitions
The GEM’s total entrepreneurial activity (TEA) includes adults involved in the process of setting up new businesses as well as those who own and manage running businesses up to 3.5 years. In turn, it collects data on entrepreneurial attitudes, activity, and aspirations in various phases of entrepreneurship; from general intentions through early-stage entrepreneurial activity to status as established firms. The primary measure of entrepreneurship used by GEM is the total early-stage entrepreneurial
activity (TEA) index, indicated by the shaded area in Figure 2.3. TEA indicates the prevalence of business start-ups (or nascent entrepreneurs) and new firms in the adult (18 to 64 years of age) population—in other words, it captures the level of dynamic entrepreneurial activity in a country.
Source: GEM Model 2014
18
Global Entrepreneurship Monitor 2014: India Report
2.6 GEM Operational Definitions
• Total early-stage entrepreneur-ial activity (TEA): Percentage of individuals aged 18–64 who are either a nascent entrepre-neur or owner-manager of a new business.
• nascent entrepreneurship rate: Percentage of individuals aged 18–64 who are currently a nascent entrepreneur, i.e. actively involved in setting up a business they will own or co-own; this business has not paid salaries, wages, or any other payments to the owners for more than three months.
• new business ownership rate: Percentage of individuals aged 18–64 who are currently an owner-manager of a new business, i.e. owning and managing a running business that has paid salaries, wages, or any other payments to the owners for more than three months, but not more than 42 months.
2.7 Characteristics of Early-stage Entrepreneurial Activity
• Opportunity-based early-stage entrepreneurial activity: Per-centage of individuals involved in early-stage entrepreneurial activity (as defined above) who claim to be purely or partly driven by opportu-nity as opposed to finding no other option for work. This includes taking
advantage of a business opportuni-ty or having a job but seeking better opportunity.
• Necessity-based early-stage entrepreneurial activity: Per-centage of individuals involved in early-stage entrepreneurial activity (as defined above) who claim to be driven by necessity (having no bet-ter choice for work) as opposed to opportunity.
• Improvement-driven opportunity early-stage entrepreneurial ac-tivity: Percentage of individuals in-volved in early-stage entrepreneur-ial activity (as defined above) who (1) claim to be driven by opportunity as opposed to finding no other op-tion for work; and (2) who indicate that the main driver for being in-volved in this opportunity is being independent or increasing their in-come, rather than just maintaining their income.
• High-growth expectation early-stage entrepreneurial activity (relative prevalence): Percentage of early-stage entrepreneurs (as defined above) who expect to employ at least 20 people five years from now.
• new product-market-oriented ear-ly-stage entrepreneurial activity (relative prevalence): Percentage of early-stage entrepreneurs (as defined above) who report that their product or service is new to at least some customers and not many businesses offer the same product or service.
Global Entrepreneurship Monitor 2014: India Report
19
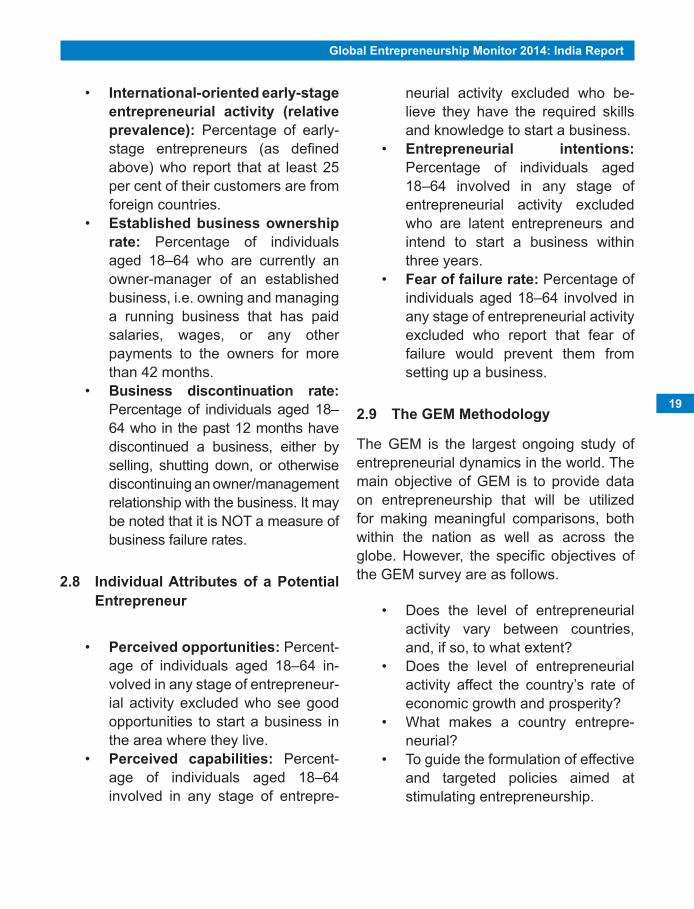
• International-oriented early-stage entrepreneurial activity (relative prevalence): Percentage of early-stage entrepreneurs (as defined above) who report that at least 25 per cent of their customers are from foreign countries.
• Established business ownership rate: Percentage of individuals aged 18–64 who are currently an owner-manager of an established business, i.e. owning and managing a running business that has paid salaries, wages, or any other payments to the owners for more than 42 months.
• Business discontinuation rate: Percentage of individuals aged 18–64 who in the past 12 months have discontinued a business, either by selling, shutting down, or otherwise discontinuing an owner/management relationship with the business. It may be noted that it is NOT a measure of business failure rates.
2.8 Individual Attributes of a Potential Entrepreneur
• Perceived opportunities: Percent-age of individuals aged 18–64 in-volved in any stage of entrepreneur-ial activity excluded who see good opportunities to start a business in the area where they live.
• Perceived capabilities: Percent-age of individuals aged 18–64 involved in any stage of entrepre-
neurial activity excluded who be-lieve they have the required skills and knowledge to start a business.
• Entrepreneurial intentions: Percentage of individuals aged 18–64 involved in any stage of entrepreneurial activity excluded who are latent entrepreneurs and intend to start a business within three years.
• Fear of failure rate: Percentage of individuals aged 18–64 involved in any stage of entrepreneurial activity excluded who report that fear of failure would prevent them from setting up a business.
2.9 The GEM Methodology
The GEM is the largest ongoing study of entrepreneurial dynamics in the world. The main objective of GEM is to provide data on entrepreneurship that will be utilized for making meaningful comparisons, both within the nation as well as across the globe. However, the specific objectives of the GEM survey are as follows.
• Does the level of entrepreneurial activity vary between countries, and, if so, to what extent?
• Does the level of entrepreneurial activity affect the country’s rate of economic growth and prosperity?
• What makes a country entrepre-neurial?
• To guide the formulation of effective and targeted policies aimed at stimulating entrepreneurship.
20
Global Entrepreneurship Monitor 2014: India Report
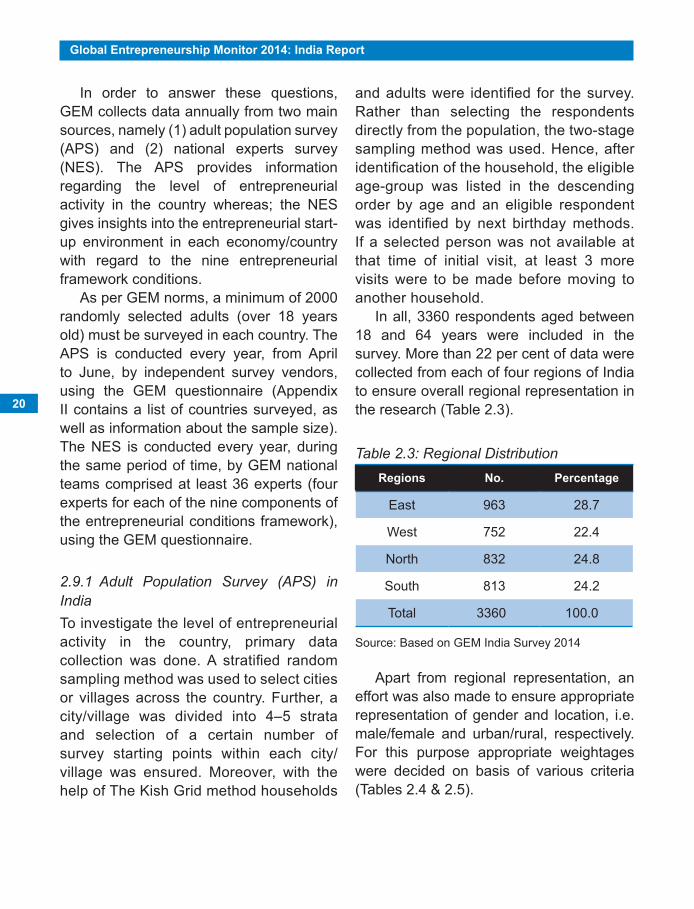
In order to answer these questions, GEM collects data annually from two main sources, namely (1) adult population survey (APS) and (2) national experts survey (NES). The APS provides information regarding the level of entrepreneurial activity in the country whereas; the NES gives insights into the entrepreneurial start-up environment in each economy/country with regard to the nine entrepreneurial framework conditions.
As per GEM norms, a minimum of 2000 randomly selected adults (over 18 years old) must be surveyed in each country. The APS is conducted every year, from April to June, by independent survey vendors, using the GEM questionnaire (Appendix II contains a list of countries surveyed, as well as information about the sample size). The NES is conducted every year, during the same period of time, by GEM national teams comprised at least 36 experts (four experts for each of the nine components of the entrepreneurial conditions framework), using the GEM questionnaire.
2.9.1 Adult Population Survey (APS) in IndiaTo investigate the level of entrepreneurial activity in the country, primary data collection was done. A stratified random sampling method was used to select cities or villages across the country. Further, a city/village was divided into 4–5 strata and selection of a certain number of survey starting points within each city/village was ensured. Moreover, with the help of The Kish Grid method households
and adults were identified for the survey. Rather than selecting the respondents directly from the population, the two-stage sampling method was used. Hence, after identification of the household, the eligible age-group was listed in the descending order by age and an eligible respondent was identified by next birthday methods. If a selected person was not available at that time of initial visit, at least 3 more visits were to be made before moving to another household.
In all, 3360 respondents aged between 18 and 64 years were included in the survey. More than 22 per cent of data were collected from each of four regions of India to ensure overall regional representation in the research (Table 2.3).
Table 2.3: Regional Distributionregions no. Percentage
East 963 28.7
West 752 22.4
North 832 24.8
South 813 24.2
Total 3360 100.0
Source: Based on GEM India Survey 2014
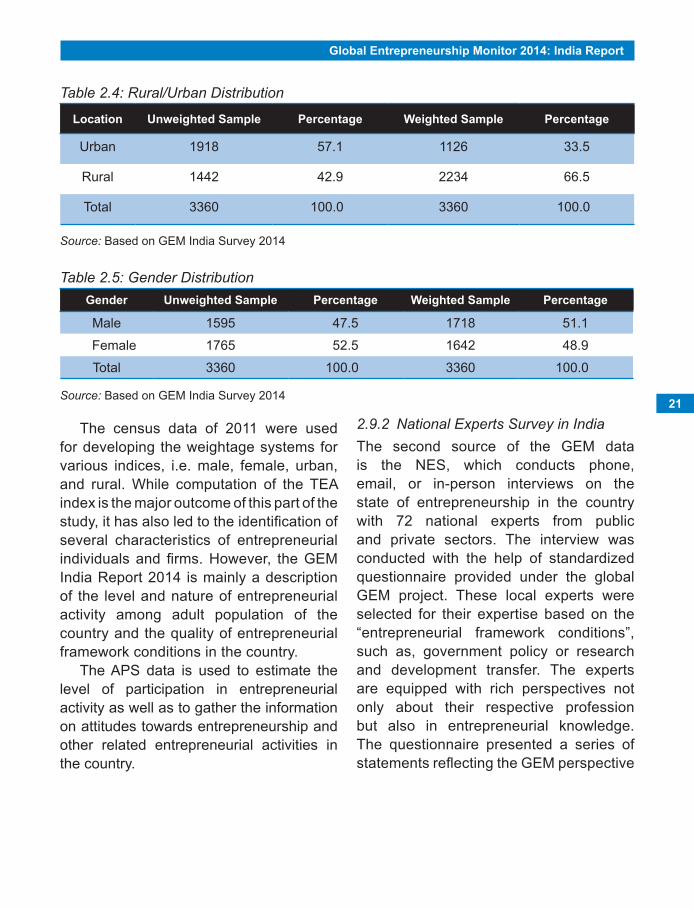
Apart from regional representation, an effort was also made to ensure appropriate representation of gender and location, i.e. male/female and urban/rural, respectively. For this purpose appropriate weightages were decided on basis of various criteria (Tables 2.4 & 2.5).
Global Entrepreneurship Monitor 2014: India Report
21
Table 2.4: Rural/Urban Distribution
location unweighted Sample Percentage weighted Sample Percentage
Urban 1918 57.1 1126 33.5
Rural 1442 42.9 2234 66.5
Total 3360 100.0 3360 100.0
Source: Based on GEM India Survey 2014
Table 2.5: Gender DistributionGender unweighted Sample Percentage weighted Sample Percentage
Male 1595 47.5 1718 51.1
Female 1765 52.5 1642 48.9
Total 3360 100.0 3360 100.0
Source: Based on GEM India Survey 2014
The census data of 2011 were used for developing the weightage systems for various indices, i.e. male, female, urban, and rural. While computation of the TEA index is the major outcome of this part of the study, it has also led to the identification of several characteristics of entrepreneurial individuals and firms. However, the GEM India Report 2014 is mainly a description of the level and nature of entrepreneurial activity among adult population of the country and the quality of entrepreneurial framework conditions in the country.
The APS data is used to estimate the level of participation in entrepreneurial activity as well as to gather the information on attitudes towards entrepreneurship and other related entrepreneurial activities in the country.
2.9.2 National Experts Survey in IndiaThe second source of the GEM data is the NES, which conducts phone, email, or in-person interviews on the state of entrepreneurship in the country with 72 national experts from public and private sectors. The interview was conducted with the help of standardized questionnaire provided under the global GEM project. These local experts were selected for their expertise based on the “entrepreneurial framework conditions”, such as, government policy or research and development transfer. The experts are equipped with rich perspectives not only about their respective profession but also in entrepreneurial knowledge. The questionnaire presented a series of statements reflecting the GEM perspective

22
Global Entrepreneurship Monitor 2014: India Report
on conditions supporting entrepreneurship. The experts were asked to estimate the degree to which each factor was applicable for India. The final section solicits open-ended responses, which are coded to nine categories.
In all, 175 national experts were identified, approached, and requested for data collection and their consent was sought. Data was collected using e-mails and speed post, followed by face-to-face as well as telephonic interviews. From 85
Table 2.7: Regional Distribution of Expertsregions no. of Experts Percentage
North (New Delhi, Haryana, Punjab, Rajasthan, UP, Uttarakhand) 30 41.67
South (Karnataka, Kerala, Tamil Nadu and AP) 07 9.72
East (Bihar, Chhattisgarh, Jharkhand, West Bengal) 07 9.72
West (Gujarat, MP, Maharashtra) 28 38.89
Total 72 100
completed responses in all respect that were obtained, 72 were chosen for submission to GEM, as against a requirement of 36. The average age of experts was 46.30 years and the average work experience was 13.19 years. The specialization of the experts is given in Table 2.6.
Though the experts were selected by purposive sampling method; however, so as to justify the regional representation, experts were selected from all the four regions (Table 2.7).
Table 2.6: Experts, Specialization (Table contains multiple responses)S.n. Specialization no. Percentage
1 Entrepreneurs 25 35
2 Investors, financers, bankers 11 15
3 Policy makers 21 29
4 Business and support services providers 26 36
5 Educators, teachers, researchers on entrepreneurship 32 44
6 Others 5 7
Source: Based on GEM India Survey 2014
Source: Based on GEM India Survey 2014
CHapter 3entrepreneursHip aCtivities in india
The GEM data of Adult Population Survey provides a thorough understanding of the entrepreneurial profile of all 70 economies of the GEM community. As mentioned in chapter 2, the GEM conceptual framework is based on three components, which gives better understanding of entrepreneurial energy in any economy. Hence, further analysis is based on the following variables.
• Individual attributes—which reflect perceptions about opportunities, capabilities to act entrepreneurially, entrepreneurial intentions and fear of failure;
• Social values—which reflect how the society values entrepreneurial behaviour, and
• Entrepreneurship indicators—different forms of entrepreneurial activity along the life cycle of a venture (nascent, new business, established business, share of high ambitious ventures, discontinuation), and motivation for venturing (opportunity vs. necessity based ventures). All these indicators can be enriched with insights concerning how age, gender, and personal income affect entrepreneurial activity.
In order to compare the data of the participating economies by the phase of development, GEM used WEF categorization of economies, namely factor
driven, efficiency driven, and innovation driven (see Chapter 2). The data also provides the opportunity to compare the results within and across geographic regions of the world and phases of economic development. In this way, this report presents status of entrepreneurial activities in India in comparison to factor-driven economies, BRICS nations, and other global regions.
3.1 social values towards entrepreneurship
The attitudes of society towards entrepreneurship facilitate the tendencies of individuals to become entrepreneurs. The evidence also suggests that positive attitudes towards entrepreneurship are found to correlate with high levels of entrepreneurship. The success of the entrepreneurs is largely dependent on entrepreneurial ecosystem of the society. Along with government policies, the value system and culture of society forms entrepreneurial ecosystem of the country. Thus, it can be said that a favourable attitude of society towards entrepreneurship motivate individuals to start their own business. This assumption is also supported by Kwon and Arenius (2010). In GEM survey, social values are measured through the following three dimensions.
• If most people consider starting a new business as a desirable career choice;
24
Global Entrepreneurship Monitor 2014: India Report
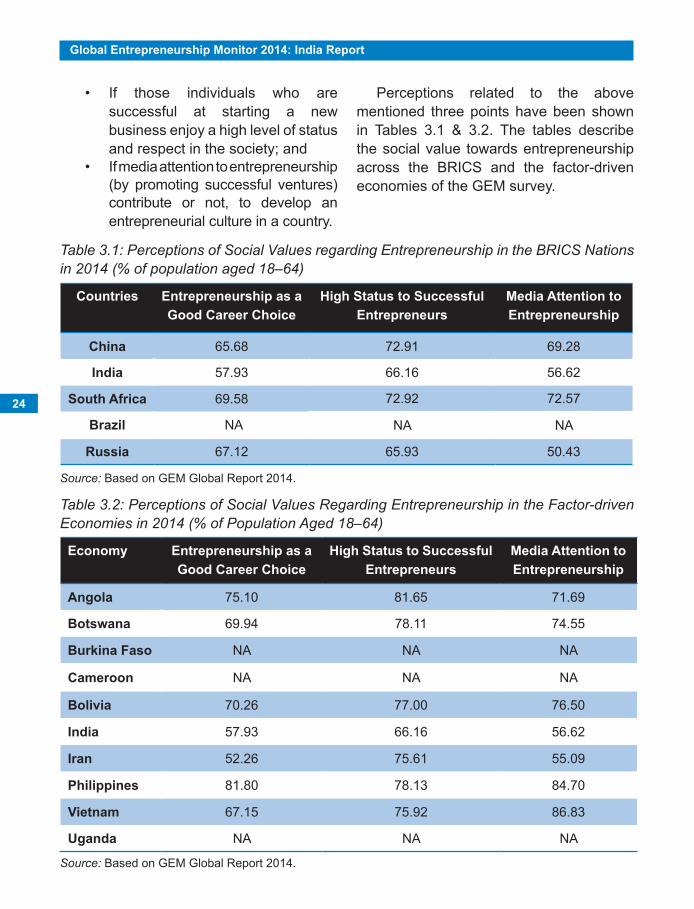
• If those individuals who are successful at starting a new business enjoy a high level of status and respect in the society; and
• If media attention to entrepreneurship (by promoting successful ventures) contribute or not, to develop an entrepreneurial culture in a country.
Table 3.1: Perceptions of Social Values regarding Entrepreneurship in the BRICS Nations in 2014 (% of population aged 18–64)
Countries entrepreneurship as a Good Career Choice
High status to successful entrepreneurs
Media attention to entrepreneurship
China 65.68 72.91 69.28
india 57.93 66.16 56.62
south africa 69.58 72.92 72.57
Brazil NA NA NA
russia 67.12 65.93 50.43
Table 3.2: Perceptions of Social Values Regarding Entrepreneurship in the Factor-driven Economies in 2014 (% of Population Aged 18–64)
economy entrepreneurship as a Good Career Choice
High status to successful entrepreneurs
Media attention to entrepreneurship
angola 75.10 81.65 71.69
Botswana 69.94 78.11 74.55
Burkina Faso NA NA NA
Cameroon NA NA NA
Bolivia 70.26 77.00 76.50
india 57.93 66.16 56.62
iran 52.26 75.61 55.09
philippines 81.80 78.13 84.70
vietnam 67.15 75.92 86.83
uganda NA NA NA
Perceptions related to the above mentioned three points have been shown in Tables 3.1 & 3.2. The tables describe the social value towards entrepreneurship across the BRICS and the factor-driven economies of the GEM survey.
Source: Based on GEM Global Report 2014.
Source: Based on GEM Global Report 2014.
Global Entrepreneurship Monitor 2014: India Report
25
As shown in Table 3.1, South African economies showed the highest social values towards entrepreneurship. In India, adults are generally positive when it comes to entrepreneurship as an attractive career option and whether entrepreneurs receive high status. The results reveal that 58 per cent of Indian adults consider entrepreneurship as a desirable career choice; around 66 per cent adults think that entrepreneurs receive a high level of status and respect, and about 57 per cent of adults have reported that there is media attention to entrepreneurship.
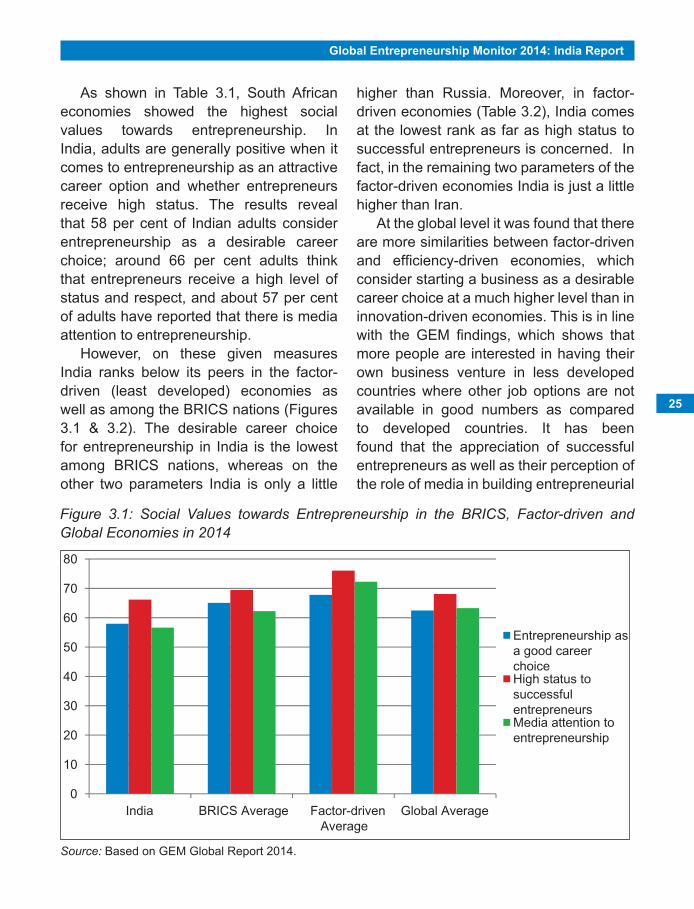
However, on these given measures India ranks below its peers in the factor-driven (least developed) economies as well as among the BRICS nations (Figures 3.1 & 3.2). The desirable career choice for entrepreneurship in India is the lowest among BRICS nations, whereas on the other two parameters India is only a little
higher than Russia. Moreover, in factor-driven economies (Table 3.2), India comes at the lowest rank as far as high status to successful entrepreneurs is concerned. In fact, in the remaining two parameters of the factor-driven economies India is just a little higher than Iran.
At the global level it was found that there are more similarities between factor-driven and efficiency-driven economies, which consider starting a business as a desirable career choice at a much higher level than in innovation-driven economies. This is in line with the GEM findings, which shows that more people are interested in having their own business venture in less developed countries where other job options are not available in good numbers as compared to developed countries. It has been found that the appreciation of successful entrepreneurs as well as their perception of the role of media in building entrepreneurial
Figure 3.1: Social Values towards Entrepreneurship in the BRICS, Factor-driven and Global Economies in 2014
0
10
20
30
40
50
60
70
80
India BRICS Average Factor-drivenAverage
Global Average
Entrepreneurship asa good careerchoiceHigh status tosuccessfulentrepreneursMedia attention toentrepreneurship
Source: Based on GEM Global Report 2014.
26
Global Entrepreneurship Monitor 2014: India Report
culture within society is more similar in efficiency-driven and innovation-driven economies, but lower than the factor-driven economies (Figure 3.1).
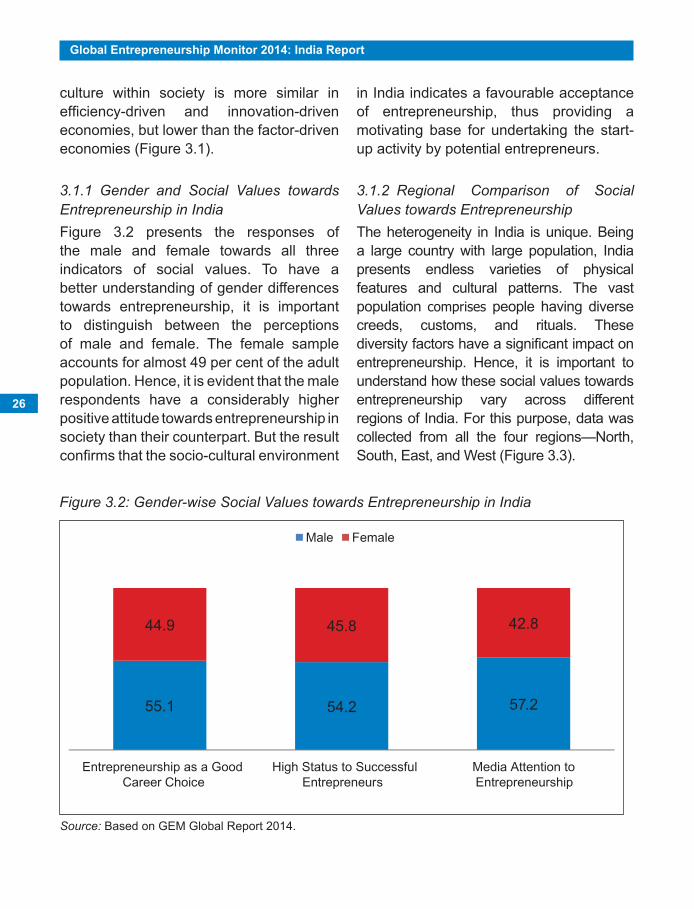
3.1.1 Gender and Social Values towards Entrepreneurship in IndiaFigure 3.2 presents the responses of the male and female towards all three indicators of social values. To have a better understanding of gender differences towards entrepreneurship, it is important to distinguish between the perceptions of male and female. The female sample accounts for almost 49 per cent of the adult population. Hence, it is evident that the male respondents have a considerably higher positive attitude towards entrepreneurship in society than their counterpart. But the result confirms that the socio-cultural environment
Figure 3.2: Gender-wise Social Values towards Entrepreneurship in India
55.1 54.2 57.2
44.9 45.8 42.8
Entrepreneurship as a GoodCareer Choice
High Status to SuccessfulEntrepreneurs
Media Attention toEntrepreneurship
Male Female
in India indicates a favourable acceptance of entrepreneurship, thus providing a motivating base for undertaking the start-up activity by potential entrepreneurs.
3.1.2 Regional Comparison of Social Values towards EntrepreneurshipThe heterogeneity in India is unique. Being a large country with large population, India presents endless varieties of physical features and cultural patterns. The vast population comprises people having diverse creeds, customs, and rituals. These diversity factors have a significant impact on entrepreneurship. Hence, it is important to understand how these social values towards entrepreneurship vary across different regions of India. For this purpose, data was collected from all the four regions—North, South, East, and West (Figure 3.3).
Source: Based on GEM Global Report 2014.
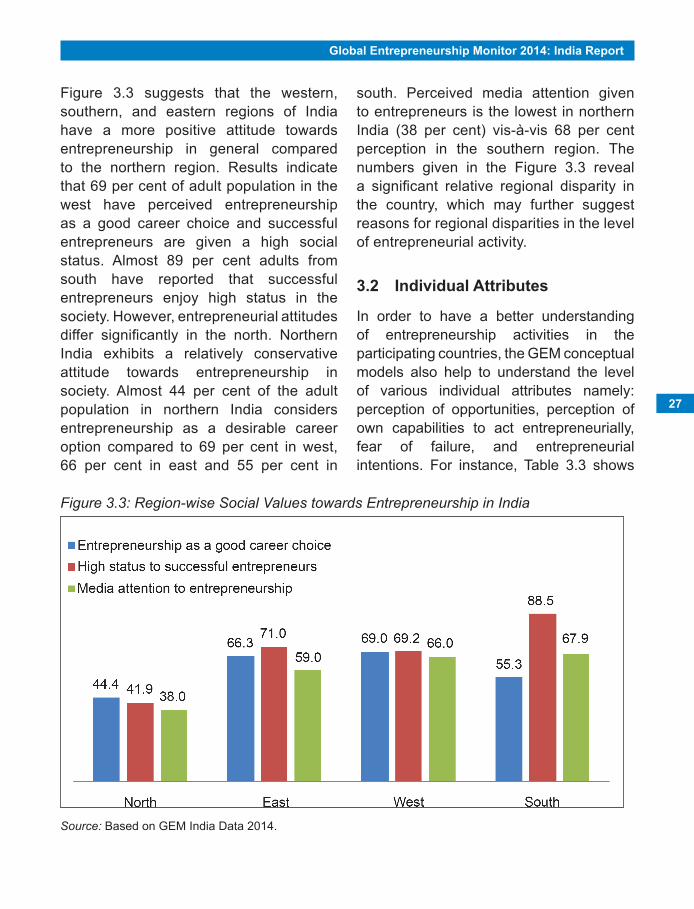
Global Entrepreneurship Monitor 2014: India Report
27
Figure 3.3 suggests that the western, southern, and eastern regions of India have a more positive attitude towards entrepreneurship in general compared to the northern region. Results indicate that 69 per cent of adult population in the west have perceived entrepreneurship as a good career choice and successful entrepreneurs are given a high social status. Almost 89 per cent adults from south have reported that successful entrepreneurs enjoy high status in the society. However, entrepreneurial attitudes differ significantly in the north. Northern India exhibits a relatively conservative attitude towards entrepreneurship in society. Almost 44 per cent of the adult population in northern India considers entrepreneurship as a desirable career option compared to 69 per cent in west, 66 per cent in east and 55 per cent in
south. Perceived media attention given to entrepreneurs is the lowest in northern India (38 per cent) vis-à-vis 68 per cent perception in the southern region. The numbers given in the Figure 3.3 reveal a significant relative regional disparity in the country, which may further suggest reasons for regional disparities in the level of entrepreneurial activity.
3.2 individual attributes
In order to have a better understanding of entrepreneurship activities in the participating countries, the GEM conceptual models also help to understand the level of various individual attributes namely: perception of opportunities, perception of own capabilities to act entrepreneurially, fear of failure, and entrepreneurial intentions. For instance, Table 3.3 shows
Figure 3.3: Region-wise Social Values towards Entrepreneurship in India
Source: Based on GEM India Data 2014.
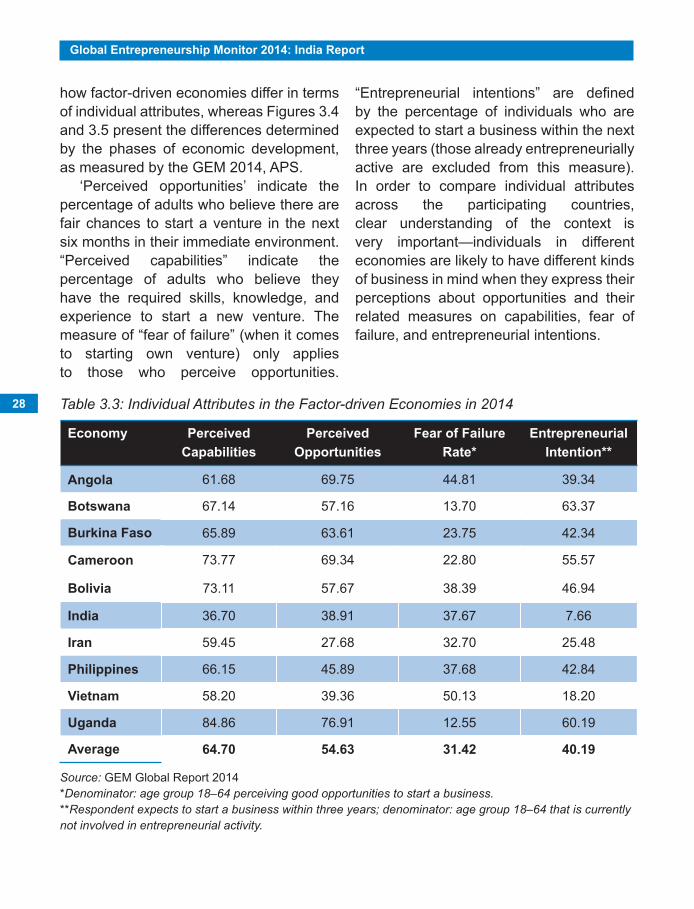
28
Global Entrepreneurship Monitor 2014: India Report
how factor-driven economies differ in terms of individual attributes, whereas Figures 3.4 and 3.5 present the differences determined by the phases of economic development, as measured by the GEM 2014, APS.
‘Perceived opportunities’ indicate the percentage of adults who believe there are fair chances to start a venture in the next six months in their immediate environment. “Perceived capabilities” indicate the percentage of adults who believe they have the required skills, knowledge, and experience to start a new venture. The measure of “fear of failure” (when it comes to starting own venture) only applies to those who perceive opportunities.
“Entrepreneurial intentions” are defined by the percentage of individuals who are expected to start a business within the next three years (those already entrepreneurially active are excluded from this measure). In order to compare individual attributes across the participating countries, clear understanding of the context is very important—individuals in different economies are likely to have different kinds of business in mind when they express their perceptions about opportunities and their related measures on capabilities, fear of failure, and entrepreneurial intentions.
Table 3.3: Individual Attributes in the Factor-driven Economies in 2014
economy perceived Capabilities
perceived Opportunities
Fear of Failure rate*
entrepreneurial intention**
angola 61.68 69.75 44.81 39.34
Botswana 67.14 57.16 13.70 63.37
Burkina Faso 65.89 63.61 23.75 42.34
Cameroon 73.77 69.34 22.80 55.57
Bolivia 73.11 57.67 38.39 46.94
india 36.70 38.91 37.67 7.66
iran 59.45 27.68 32.70 25.48
philippines 66.15 45.89 37.68 42.84
vietnam 58.20 39.36 50.13 18.20
uganda 84.86 76.91 12.55 60.19
average 64.70 54.63 31.42 40.19
Source: GEM Global Report 2014*Denominator: age group 18–64 perceiving good opportunities to start a business.**Respondent expects to start a business within three years; denominator: age group 18–64 that is currently not involved in entrepreneurial activity.
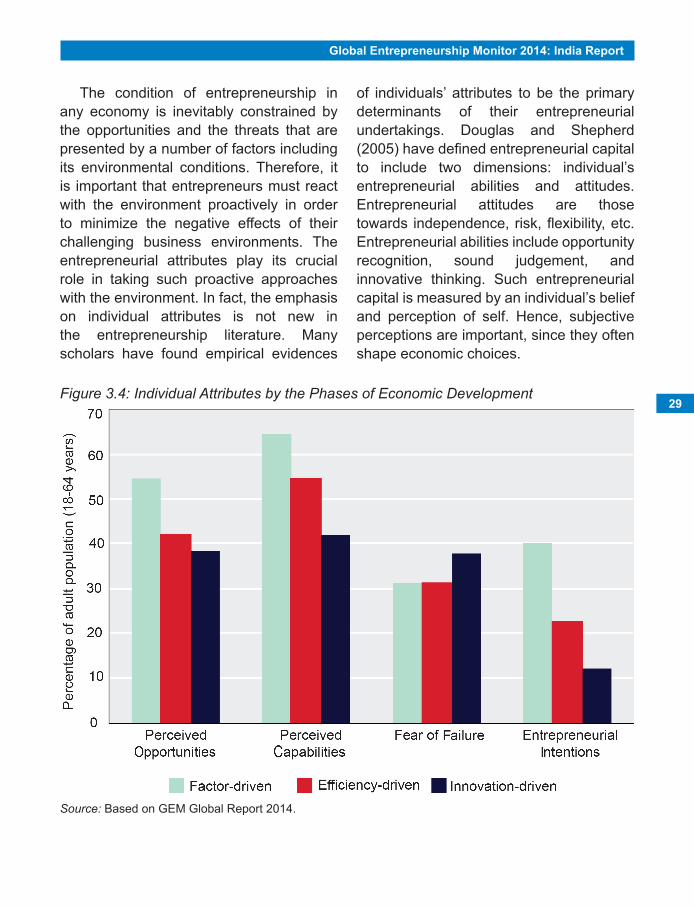
Global Entrepreneurship Monitor 2014: India Report
29
The condition of entrepreneurship in any economy is inevitably constrained by the opportunities and the threats that are presented by a number of factors including its environmental conditions. Therefore, it is important that entrepreneurs must react with the environment proactively in order to minimize the negative effects of their challenging business environments. The entrepreneurial attributes play its crucial role in taking such proactive approaches with the environment. In fact, the emphasis on individual attributes is not new in the entrepreneurship literature. Many scholars have found empirical evidences
of individuals’ attributes to be the primary determinants of their entrepreneurial undertakings. Douglas and Shepherd (2005) have defined entrepreneurial capital to include two dimensions: individual’s entrepreneurial abilities and attitudes. Entrepreneurial attitudes are those towards independence, risk, flexibility, etc. Entrepreneurial abilities include opportunity recognition, sound judgement, and innovative thinking. Such entrepreneurial capital is measured by an individual’s belief and perception of self. Hence, subjective perceptions are important, since they often shape economic choices.
Figure 3.4: Individual Attributes by the Phases of Economic Development
Source: Based on GEM Global Report 2014.
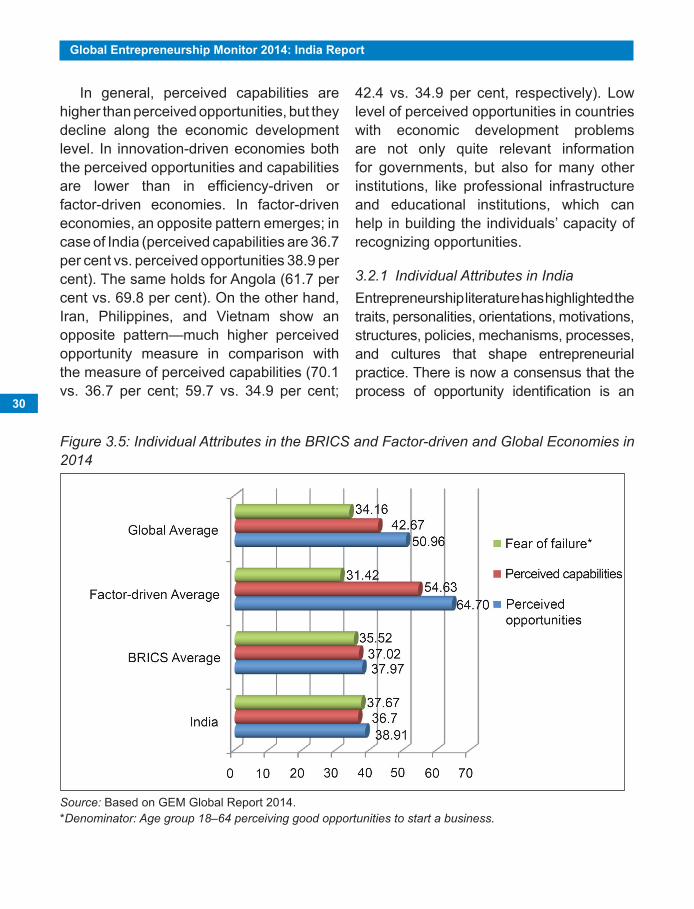
30
Global Entrepreneurship Monitor 2014: India Report
In general, perceived capabilities are higher than perceived opportunities, but they decline along the economic development level. In innovation-driven economies both the perceived opportunities and capabilities are lower than in efficiency-driven or factor-driven economies. In factor-driven economies, an opposite pattern emerges; in case of India (perceived capabilities are 36.7 per cent vs. perceived opportunities 38.9 per cent). The same holds for Angola (61.7 per cent vs. 69.8 per cent). On the other hand, Iran, Philippines, and Vietnam show an opposite pattern—much higher perceived opportunity measure in comparison with the measure of perceived capabilities (70.1 vs. 36.7 per cent; 59.7 vs. 34.9 per cent;
42.4 vs. 34.9 per cent, respectively). Low level of perceived opportunities in countries with economic development problems are not only quite relevant information for governments, but also for many other institutions, like professional infrastructure and educational institutions, which can help in building the individuals’ capacity of recognizing opportunities.
3.2.1 Individual Attributes in IndiaEntrepreneurship literature has highlighted the traits, personalities, orientations, motivations, structures, policies, mechanisms, processes, and cultures that shape entrepreneurial practice. There is now a consensus that the process of opportunity identification is an
Figure 3.5: Individual Attributes in the BRICS and Factor-driven and Global Economies in 2014
Source: Based on GEM Global Report 2014.*Denominator: Age group 18–64 perceiving good opportunities to start a business.

Global Entrepreneurship Monitor 2014: India Report
31
important determinant for entrepreneurship (Shane and Venkataraman, 2000; Arenius and Declercq, 2004). Several scholars like Baron, 2007; R. K. Mitchell et al., 2007; Tang, Kacmar & Busenitz, 2012 also explain the importance of business opportunity identification process for entrepreneurial alertness. Hence, in order to set up a business it is important for an individual to perceive some kind of opportunity. In the present research, it is measured by the percentage of persons who claim that there are good conditions for starting up a business in their neighbourhood within the next six months.
There is no consensus among researchers about the definition of entrepreneurial success. Scholars of entrepreneurship have defined it in various ways. Stefanovic et al. (2010) have pointed out many factors such as previous experience, hard work, access to capital, personal capabilities, and leadership skills as the factors affecting success.
Experience and knowledge have been identified by Hussain and Windsoperger (2010) as the success factors. Koellinger et al. (2005); Elam and Terjesen (2007); and Klyver et al. (2007) find evidence that belief in one’s start-up skills is the most important predictor of being a nascent entrepreneur. Koellinger (2008) proposed that individuals with a higher level of self-confidence are more likely to exploit innovative rather than imitative business opportunities.
An important indicator of entrepreneurial intent is the individual’s attitude towards risk. In spite of having an identified opportunity and despite positively perceived capabilities, fear of failure may deter the actual undertaking. In this way, entrepreneurial choices can be dominated by fear of failure. In the present research, the respondents were asked whether fear of failure would prevent them from starting a business.
Figure 3.6: Gender-wise Individual Attributes in India
Source: Based on GEM India Data 2014.
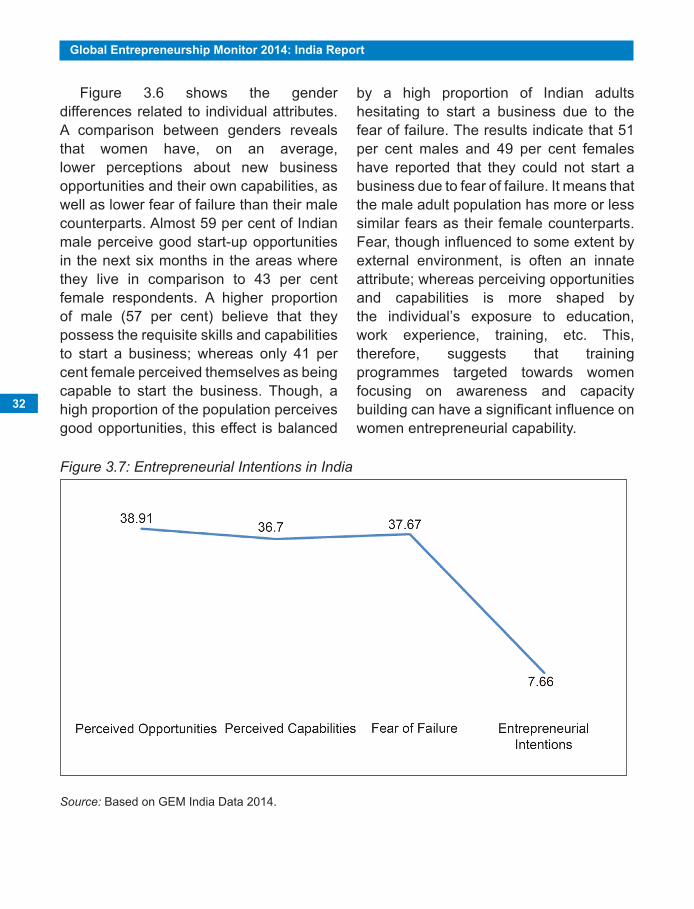
32
Global Entrepreneurship Monitor 2014: India Report
Figure 3.6 shows the gender differences related to individual attributes. A comparison between genders reveals that women have, on an average, lower perceptions about new business opportunities and their own capabilities, as well as lower fear of failure than their male counterparts. Almost 59 per cent of Indian male perceive good start-up opportunities in the next six months in the areas where they live in comparison to 43 per cent female respondents. A higher proportion of male (57 per cent) believe that they possess the requisite skills and capabilities to start a business; whereas only 41 per cent female perceived themselves as being capable to start the business. Though, a high proportion of the population perceives good opportunities, this effect is balanced
by a high proportion of Indian adults hesitating to start a business due to the fear of failure. The results indicate that 51 per cent males and 49 per cent females have reported that they could not start a business due to fear of failure. It means that the male adult population has more or less similar fears as their female counterparts. Fear, though influenced to some extent by external environment, is often an innate attribute; whereas perceiving opportunities and capabilities is more shaped by the individual’s exposure to education, work experience, training, etc. This, therefore, suggests that training programmes targeted towards women focusing on awareness and capacity building can have a significant influence on women entrepreneurial capability.
Figure 3.7: Entrepreneurial Intentions in India
Source: Based on GEM India Data 2014.
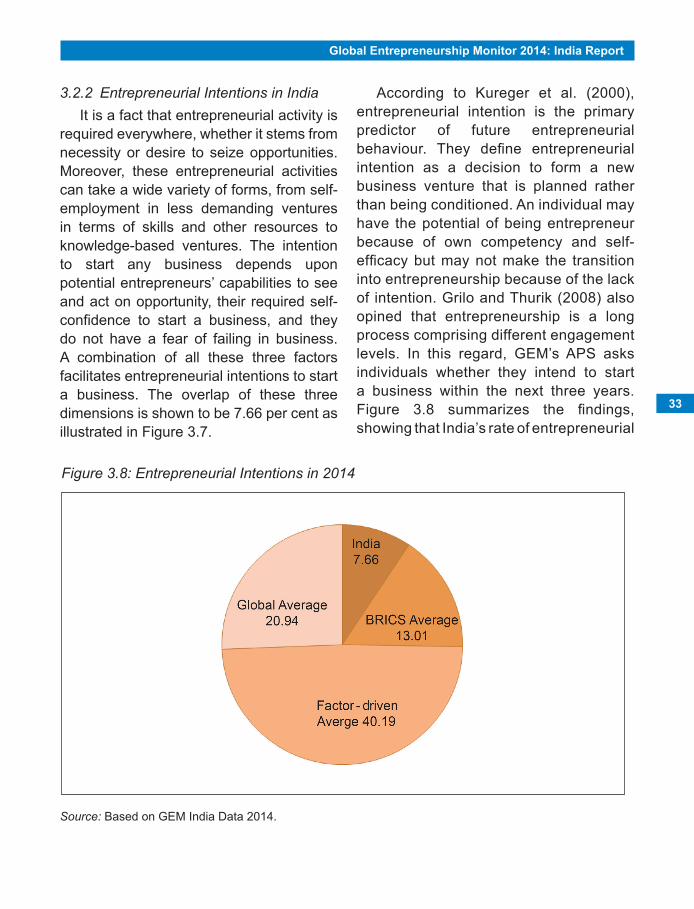
Global Entrepreneurship Monitor 2014: India Report
33
3.2.2 Entrepreneurial Intentions in IndiaIt is a fact that entrepreneurial activity is
required everywhere, whether it stems from necessity or desire to seize opportunities. Moreover, these entrepreneurial activities can take a wide variety of forms, from self-employment in less demanding ventures in terms of skills and other resources to knowledge-based ventures. The intention to start any business depends upon potential entrepreneurs’ capabilities to see and act on opportunity, their required self-confidence to start a business, and they do not have a fear of failing in business. A combination of all these three factors facilitates entrepreneurial intentions to start a business. The overlap of these three dimensions is shown to be 7.66 per cent as illustrated in Figure 3.7.
Figure 3.8: Entrepreneurial Intentions in 2014
According to Kureger et al. (2000), entrepreneurial intention is the primary predictor of future entrepreneurial behaviour. They define entrepreneurial intention as a decision to form a new business venture that is planned rather than being conditioned. An individual may have the potential of being entrepreneur because of own competency and self-efficacy but may not make the transition into entrepreneurship because of the lack of intention. Grilo and Thurik (2008) also opined that entrepreneurship is a long process comprising different engagement levels. In this regard, GEM’s APS asks individuals whether they intend to start a business within the next three years. Figure 3.8 summarizes the findings, showing that India’s rate of entrepreneurial
Source: Based on GEM India Data 2014.
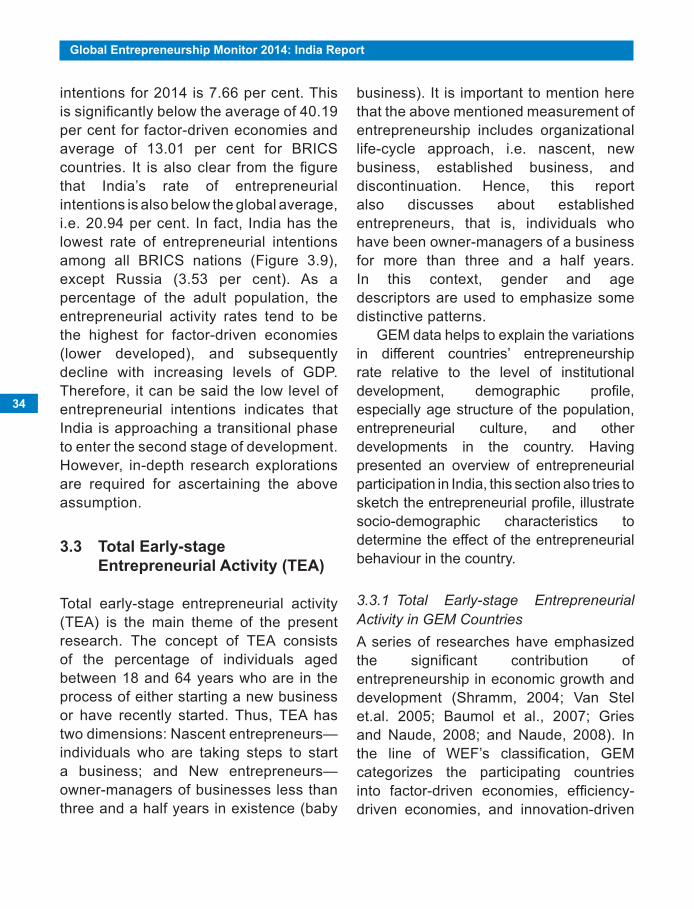
34
Global Entrepreneurship Monitor 2014: India Report
intentions for 2014 is 7.66 per cent. This is significantly below the average of 40.19 per cent for factor-driven economies and average of 13.01 per cent for BRICS countries. It is also clear from the figure that India’s rate of entrepreneurial intentions is also below the global average, i.e. 20.94 per cent. In fact, India has the lowest rate of entrepreneurial intentions among all BRICS nations (Figure 3.9), except Russia (3.53 per cent). As a percentage of the adult population, the entrepreneurial activity rates tend to be the highest for factor-driven economies (lower developed), and subsequently decline with increasing levels of GDP. Therefore, it can be said the low level of entrepreneurial intentions indicates that India is approaching a transitional phase to enter the second stage of development. However, in-depth research explorations are required for ascertaining the above assumption.
3.3 total early-stage entrepreneurial activity (tea)
Total early-stage entrepreneurial activity (TEA) is the main theme of the present research. The concept of TEA consists of the percentage of individuals aged between 18 and 64 years who are in the process of either starting a new business or have recently started. Thus, TEA has two dimensions: Nascent entrepreneurs—individuals who are taking steps to start a business; and New entrepreneurs—owner-managers of businesses less than three and a half years in existence (baby
business). It is important to mention here that the above mentioned measurement of entrepreneurship includes organizational life-cycle approach, i.e. nascent, new business, established business, and discontinuation. Hence, this report also discusses about established entrepreneurs, that is, individuals who have been owner-managers of a business for more than three and a half years. In this context, gender and age descriptors are used to emphasize some distinctive patterns.
GEM data helps to explain the variations in different countries’ entrepreneurship rate relative to the level of institutional development, demographic profile, especially age structure of the population, entrepreneurial culture, and other developments in the country. Having presented an overview of entrepreneurial participation in India, this section also tries to sketch the entrepreneurial profile, illustrate socio-demographic characteristics to determine the effect of the entrepreneurial behaviour in the country.
3.3.1 Total Early-stage Entrepreneurial Activity in GEM CountriesA series of researches have emphasized the significant contribution of entrepreneurship in economic growth and development (Shramm, 2004; Van Stel et.al. 2005; Baumol et al., 2007; Gries and Naude, 2008; and Naude, 2008). In the line of WEF’s classification, GEM categorizes the participating countries into factor-driven economies, efficiency-driven economies, and innovation-driven
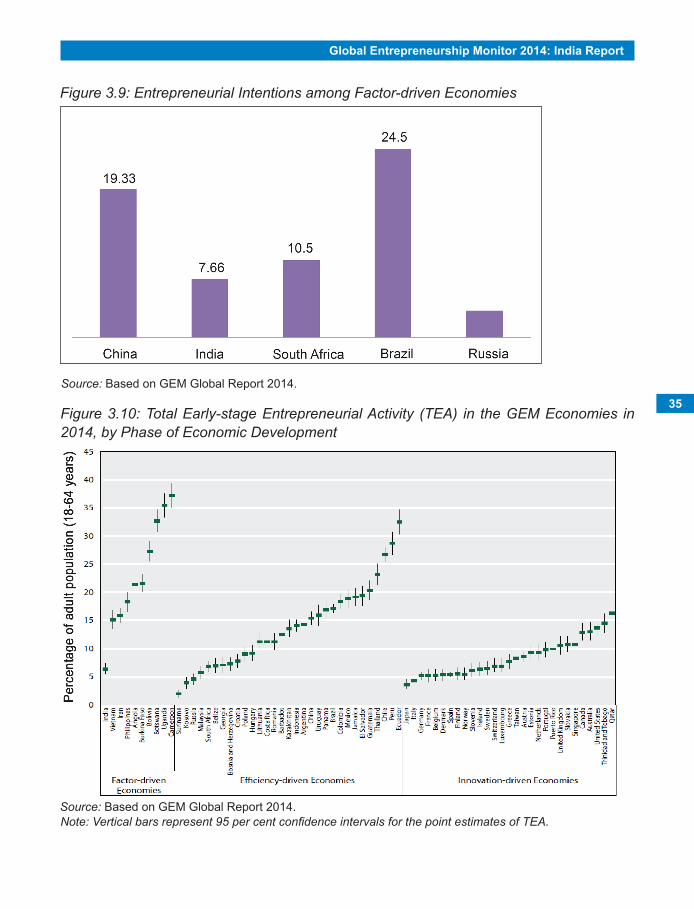
Global Entrepreneurship Monitor 2014: India Report
35
Figure 3.9: Entrepreneurial Intentions among Factor-driven Economies
Figure 3.10: Total Early-stage Entrepreneurial Activity (TEA) in the GEM Economies in 2014, by Phase of Economic Development
Note: Vertical bars represent 95 per cent confidence intervals for the point estimates of TEA.
Source: Based on GEM Global Report 2014.
Source: Based on GEM Global Report 2014.
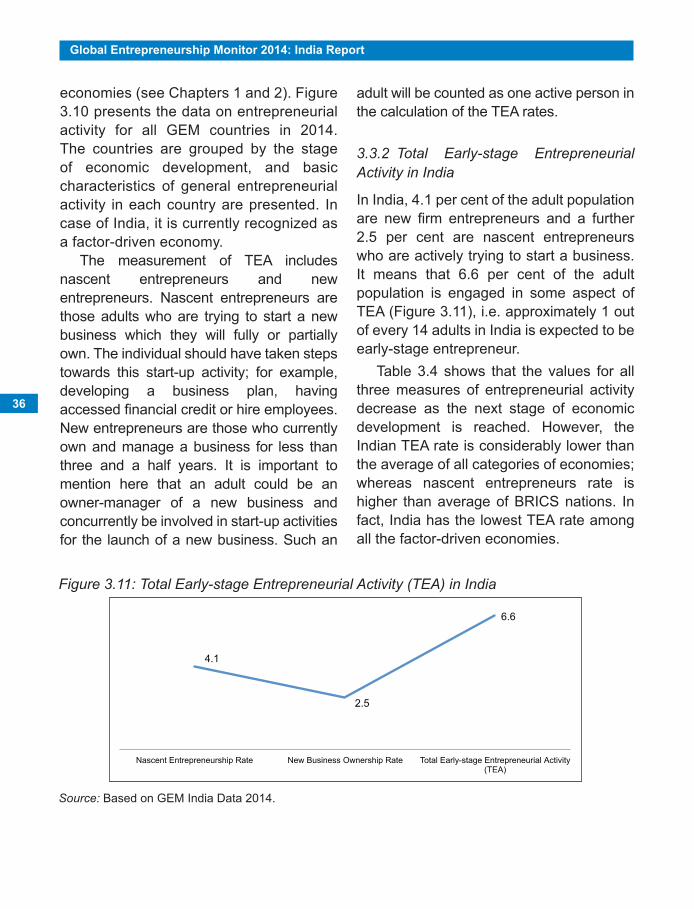
36
Global Entrepreneurship Monitor 2014: India Report
economies (see Chapters 1 and 2). Figure 3.10 presents the data on entrepreneurial activity for all GEM countries in 2014. The countries are grouped by the stage of economic development, and basic characteristics of general entrepreneurial activity in each country are presented. In case of India, it is currently recognized as a factor-driven economy.
The measurement of TEA includes nascent entrepreneurs and new entrepreneurs. Nascent entrepreneurs are those adults who are trying to start a new business which they will fully or partially own. The individual should have taken steps towards this start-up activity; for example, developing a business plan, having accessed financial credit or hire employees. New entrepreneurs are those who currently own and manage a business for less than three and a half years. It is important to mention here that an adult could be an owner-manager of a new business and concurrently be involved in start-up activities for the launch of a new business. Such an
adult will be counted as one active person in the calculation of the TEA rates.
3.3.2 Total Early-stage Entrepreneurial Activity in India
In India, 4.1 per cent of the adult population are new firm entrepreneurs and a further 2.5 per cent are nascent entrepreneurs who are actively trying to start a business. It means that 6.6 per cent of the adult population is engaged in some aspect of TEA (Figure 3.11), i.e. approximately 1 out of every 14 adults in India is expected to be early-stage entrepreneur.
Table 3.4 shows that the values for all three measures of entrepreneurial activity decrease as the next stage of economic development is reached. However, the Indian TEA rate is considerably lower than the average of all categories of economies; whereas nascent entrepreneurs rate is higher than average of BRICS nations. In fact, India has the lowest TEA rate among all the factor-driven economies.
Figure 3.11: Total Early-stage Entrepreneurial Activity (TEA) in India
4.1
2.5
6.6
Nascent Entrepreneurship Rate New Business Ownership Rate Total Early-stage Entrepreneurial Activity (TEA)
Source: Based on GEM India Data 2014.
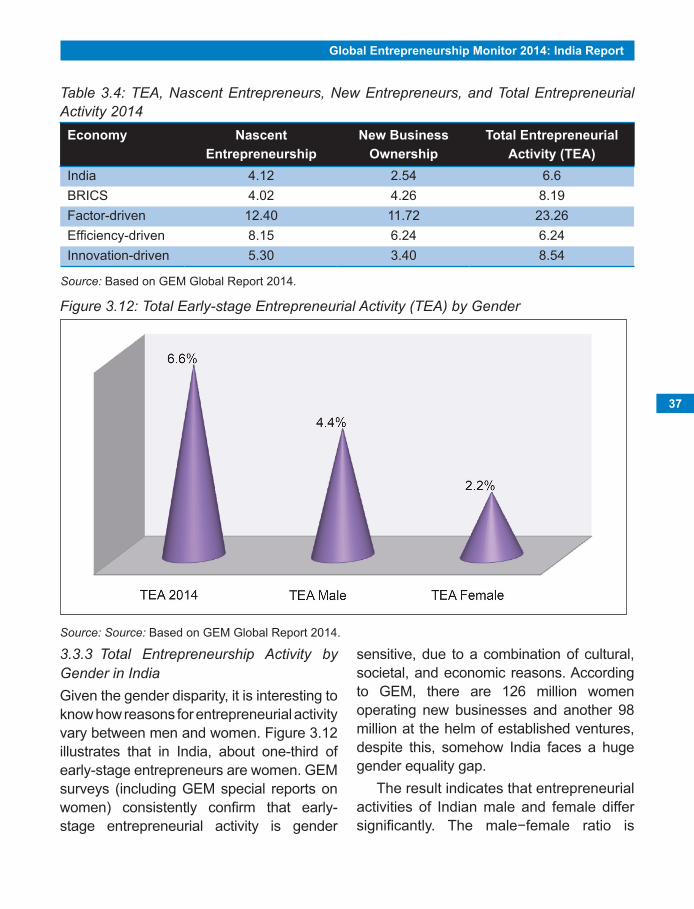
Global Entrepreneurship Monitor 2014: India Report
37
Table 3.4: TEA, Nascent Entrepreneurs, New Entrepreneurs, and Total Entrepreneurial Activity 2014
economy nascent entrepreneurship
new Business Ownership
total entrepreneurial activity (tea)
India 4.12 2.54 6.6BRICS 4.02 4.26 8.19Factor-driven 12.40 11.72 23.26Efficiency-driven 8.15 6.24 6.24Innovation-driven 5.30 3.40 8.54
3.3.3 Total Entrepreneurship Activity by Gender in IndiaGiven the gender disparity, it is interesting to know how reasons for entrepreneurial activity vary between men and women. Figure 3.12 illustrates that in India, about one-third of early-stage entrepreneurs are women. GEM surveys (including GEM special reports on women) consistently confirm that early-stage entrepreneurial activity is gender
sensitive, due to a combination of cultural, societal, and economic reasons. According to GEM, there are 126 million women operating new businesses and another 98 million at the helm of established ventures, despite this, somehow India faces a huge gender equality gap.
The result indicates that entrepreneurial activities of Indian male and female differ significantly. The male−female ratio is
Figure 3.12: Total Early-stage Entrepreneurial Activity (TEA) by Gender
Source: Based on GEM Global Report 2014.
Source: Source: Based on GEM Global Report 2014.

38
Global Entrepreneurship Monitor 2014: India Report
more or less balanced in the sample. Data showed that 4.4 per cent of men and 2.2 per cent of women are involved in early-stage entrepreneurship—the ratio of men to women is 2:1. Hence, the likelihood that an individual engages in early-stage entrepreneurial activity is influenced by gender. Indian men are twice more likely to be involved in early-stage entrepreneurship compared to their female counterparts. This finding is supported by a number of research studies which point out that men have a higher probability of engaging in entrepreneurship than women (Blanchflower et al. 2001; Reynolds et al. 2002; Arenius and DeClercq 2005; Minniti et al. 2005; Davidsson 2006; Klyver et al. 2007; Grilo and Thurik 2008; and Kalpper and Paker 2010). Higher male TEA is a universal characterization in almost all
GEM countries. However, the gap between male and female TEA is what varies across the nations depending as well as reflecting their diverse social culture and norms.
3.3.4 Total Entrepreneurship Activity by Age Groups in India
Figure 3.13 reveals that the probability of being an early-stage entrepreneur is the highest among the individuals between 25 and 34-year-olds. The distribution of age groups within the TEA is in line with global trends, where the highest prevalence rate is found in 18–44 age range. The high TEA rates among the young age groups of 18–44 indicates a positive sign for a country like India, which is undergoing a demographic transition, with an increase in the share of the working age youth population.
Figure 3.13: Total Early-stage Entrepreneurial Activity (TEA) by Age Group
Source: Based on GEM Global Report 2014.
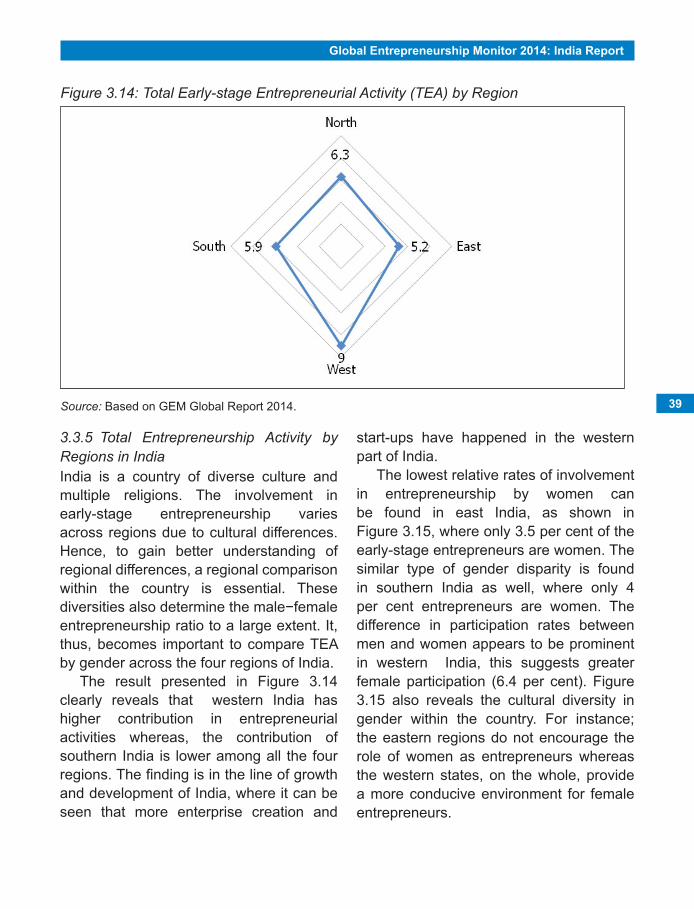
Global entrepreneurship Monitor 2014: india report
39
3.3.5 Total Entrepreneurship Activity by Regions in India India is a country of diverse culture and multiple religions. The involvement in early-stage entrepreneurship varies across regions due to cultural differences. Hence, to gain better understanding of regional differences, a regional comparison within the country is essential. These diversities also determine the male−female entrepreneurship ratio to a large extent. It, thus, becomes important to compare TEA by gender across the four regions of India.
The result presented in Figure 3.14 clearly reveals that western India has higher contribution in entrepreneurial activities whereas, the contribution of southern India is lower among all the four regions. The fi nding is in the line of growth and development of India, where it can be seen that more enterprise creation and
start-ups have happened in the western part of India.
The lowest relative rates of involvement in entrepreneurship by women can be found in east India, as shown in Figure 3.15, where only 3.5 per cent of the early-stage entrepreneurs are women. The similar type of gender disparity is found in southern India as well, where only 4 per cent entrepreneurs are women. The difference in participation rates between men and women appears to be prominent in western India, this suggests greater female participation (6.4 per cent). Figure 3.15 also reveals the cultural diversity in gender within the country. For instance; the eastern regions do not encourage the role of women as entrepreneurs whereas the western states, on the whole, provide a more conducive environment for female entrepreneurs.
Figure 3.14: Total Early-stage Entrepreneurial Activity (TEA) by Region
Source: Based on GEM Global Report 2014.
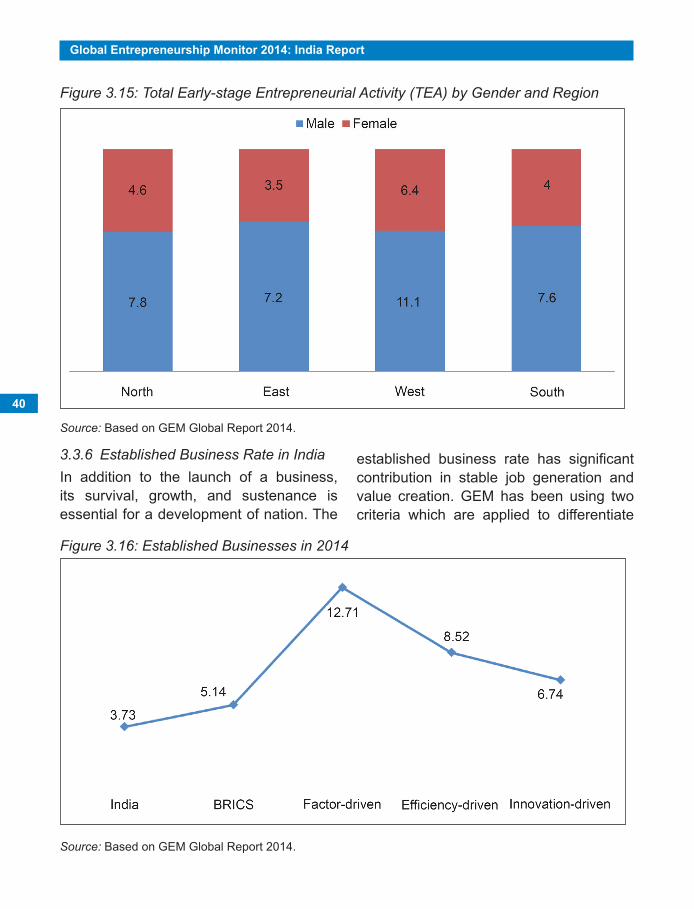
40
Global Entrepreneurship Monitor 2014: India Report
Figure 3.15: Total Early-stage Entrepreneurial Activity (TEA) by Gender and Region
3.3.6 Established Business Rate in IndiaIn addition to the launch of a business, its survival, growth, and sustenance is essential for a development of nation. The
Figure 3.16: Established Businesses in 2014
established business rate has significant contribution in stable job generation and value creation. GEM has been using two criteria which are applied to differentiate
Source: Based on GEM Global Report 2014.
Source: Based on GEM Global Report 2014.
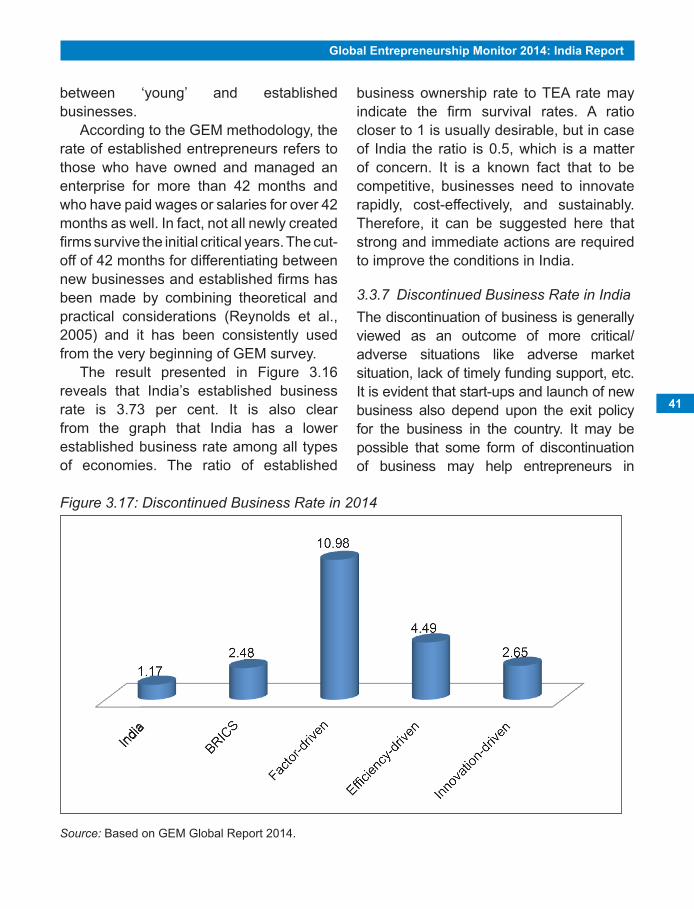
Global Entrepreneurship Monitor 2014: India Report
41
between ‘young’ and established businesses.
According to the GEM methodology, the rate of established entrepreneurs refers to those who have owned and managed an enterprise for more than 42 months and who have paid wages or salaries for over 42 months as well. In fact, not all newly created firms survive the initial critical years. The cut-off of 42 months for differentiating between new businesses and established firms has been made by combining theoretical and practical considerations (Reynolds et al., 2005) and it has been consistently used from the very beginning of GEM survey.
The result presented in Figure 3.16 reveals that India’s established business rate is 3.73 per cent. It is also clear from the graph that India has a lower established business rate among all types of economies. The ratio of established
business ownership rate to TEA rate may indicate the firm survival rates. A ratio closer to 1 is usually desirable, but in case of India the ratio is 0.5, which is a matter of concern. It is a known fact that to be competitive, businesses need to innovate rapidly, cost-effectively, and sustainably. Therefore, it can be suggested here that strong and immediate actions are required to improve the conditions in India.
3.3.7 Discontinued Business Rate in IndiaThe discontinuation of business is generally viewed as an outcome of more critical/adverse situations like adverse market situation, lack of timely funding support, etc. It is evident that start-ups and launch of new business also depend upon the exit policy for the business in the country. It may be possible that some form of discontinuation of business may help entrepreneurs in
Figure 3.17: Discontinued Business Rate in 2014
Source: Based on GEM Global Report 2014.
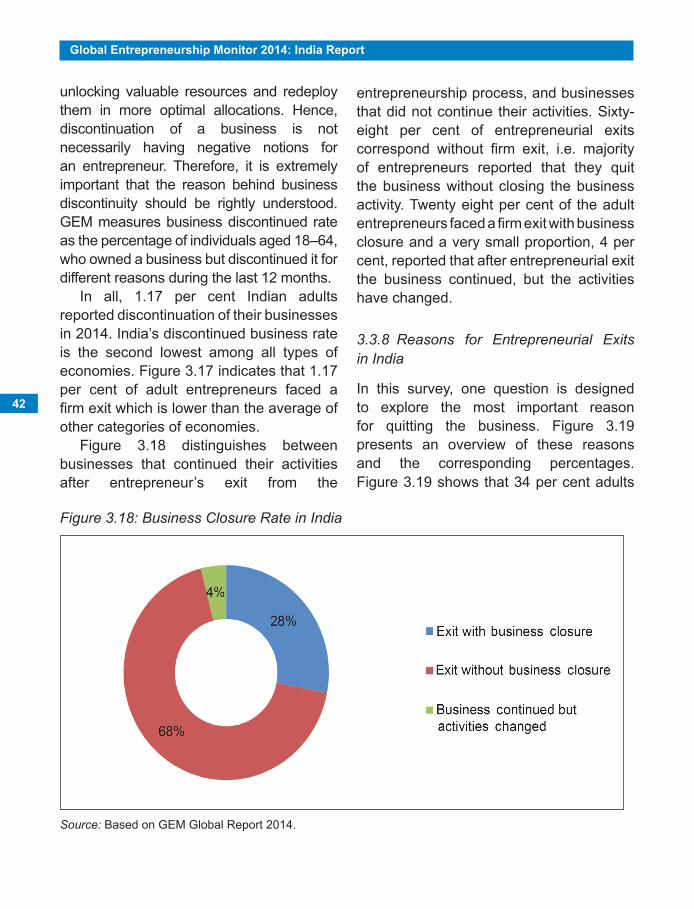
42
Global Entrepreneurship Monitor 2014: India Report
unlocking valuable resources and redeploy them in more optimal allocations. Hence, discontinuation of a business is not necessarily having negative notions for an entrepreneur. Therefore, it is extremely important that the reason behind business discontinuity should be rightly understood. GEM measures business discontinued rate as the percentage of individuals aged 18–64, who owned a business but discontinued it for different reasons during the last 12 months.
In all, 1.17 per cent Indian adults reported discontinuation of their businesses in 2014. India’s discontinued business rate is the second lowest among all types of economies. Figure 3.17 indicates that 1.17 per cent of adult entrepreneurs faced a firm exit which is lower than the average of other categories of economies.
Figure 3.18 distinguishes between businesses that continued their activities after entrepreneur’s exit from the
entrepreneurship process, and businesses that did not continue their activities. Sixty-eight per cent of entrepreneurial exits correspond without firm exit, i.e. majority of entrepreneurs reported that they quit the business without closing the business activity. Twenty eight per cent of the adult entrepreneurs faced a firm exit with business closure and a very small proportion, 4 per cent, reported that after entrepreneurial exit the business continued, but the activities have changed.
3.3.8 Reasons for Entrepreneurial Exits in India
In this survey, one question is designed to explore the most important reason for quitting the business. Figure 3.19 presents an overview of these reasons and the corresponding percentages. Figure 3.19 shows that 34 per cent adults
Figure 3.18: Business Closure Rate in India
Source: Based on GEM Global Report 2014.
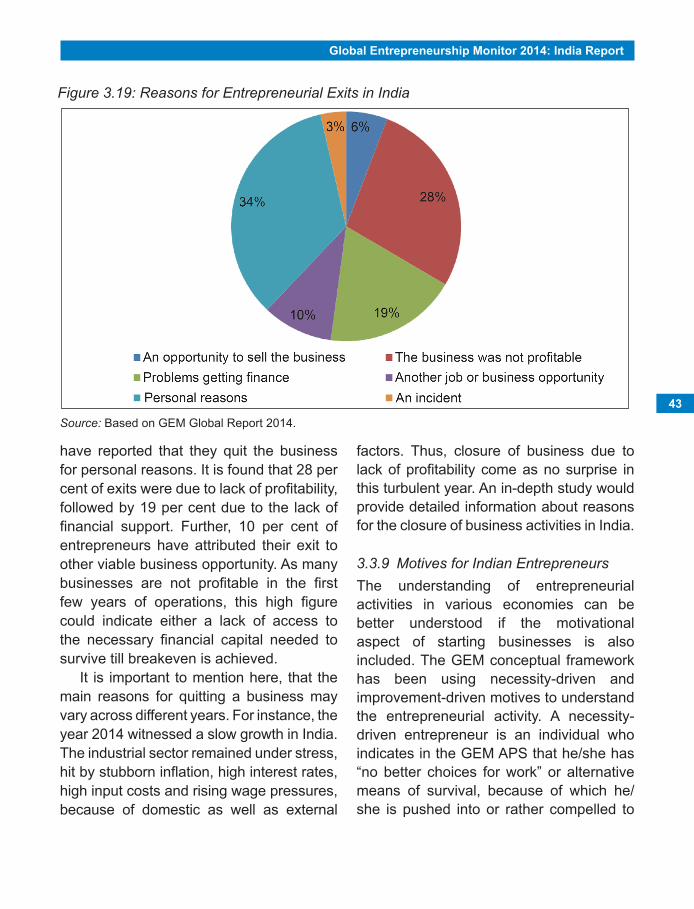
Global Entrepreneurship Monitor 2014: India Report
43
Figure 3.19: Reasons for Entrepreneurial Exits in India
have reported that they quit the business for personal reasons. It is found that 28 per cent of exits were due to lack of profitability, followed by 19 per cent due to the lack of financial support. Further, 10 per cent of entrepreneurs have attributed their exit to other viable business opportunity. As many businesses are not profitable in the first few years of operations, this high figure could indicate either a lack of access to the necessary financial capital needed to survive till breakeven is achieved.
It is important to mention here, that the main reasons for quitting a business may vary across different years. For instance, the year 2014 witnessed a slow growth in India. The industrial sector remained under stress, hit by stubborn inflation, high interest rates, high input costs and rising wage pressures, because of domestic as well as external
factors. Thus, closure of business due to lack of profitability come as no surprise in this turbulent year. An in-depth study would provide detailed information about reasons for the closure of business activities in India.
3.3.9 Motives for Indian EntrepreneursThe understanding of entrepreneurial activities in various economies can be better understood if the motivational aspect of starting businesses is also included. The GEM conceptual framework has been using necessity-driven and improvement-driven motives to understand the entrepreneurial activity. A necessity-driven entrepreneur is an individual who indicates in the GEM APS that he/she has “no better choices for work” or alternative means of survival, because of which he/she is pushed into or rather compelled to
Source: Based on GEM Global Report 2014.
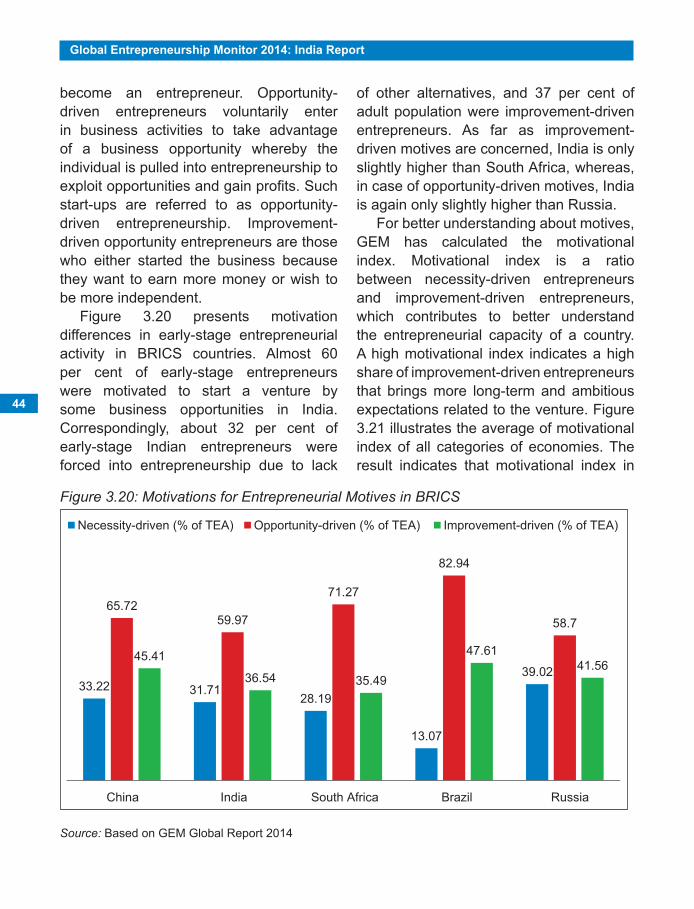
44
Global Entrepreneurship Monitor 2014: India Report
become an entrepreneur. Opportunity-driven entrepreneurs voluntarily enter in business activities to take advantage of a business opportunity whereby the individual is pulled into entrepreneurship to exploit opportunities and gain profits. Such start-ups are referred to as opportunity-driven entrepreneurship. Improvement-driven opportunity entrepreneurs are those who either started the business because they want to earn more money or wish to be more independent.
Figure 3.20 presents motivation differences in early-stage entrepreneurial activity in BRICS countries. Almost 60 per cent of early-stage entrepreneurs were motivated to start a venture by some business opportunities in India. Correspondingly, about 32 per cent of early-stage Indian entrepreneurs were forced into entrepreneurship due to lack
of other alternatives, and 37 per cent of adult population were improvement-driven entrepreneurs. As far as improvement-driven motives are concerned, India is only slightly higher than South Africa, whereas, in case of opportunity-driven motives, India is again only slightly higher than Russia.
For better understanding about motives, GEM has calculated the motivational index. Motivational index is a ratio between necessity-driven entrepreneurs and improvement-driven entrepreneurs, which contributes to better understand the entrepreneurial capacity of a country. A high motivational index indicates a high share of improvement-driven entrepreneurs that brings more long-term and ambitious expectations related to the venture. Figure 3.21 illustrates the average of motivational index of all categories of economies. The result indicates that motivational index in
Figure 3.20: Motivations for Entrepreneurial Motives in BRICS
33.22 31.7128.19
13.07
39.02
65.7259.97
71.27
82.94
58.7
45.41
36.54 35.49
47.6141.56
China India South Africa Brazil Russia
Source: Based on GEM Global Report 2014
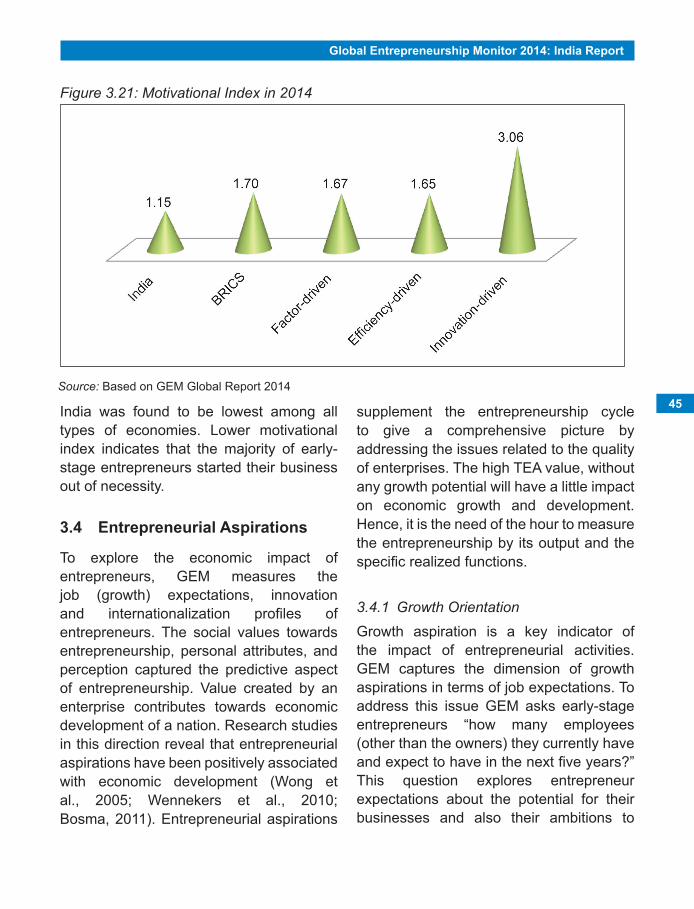
Global Entrepreneurship Monitor 2014: India Report
45India was found to be lowest among all types of economies. Lower motivational index indicates that the majority of early-stage entrepreneurs started their business out of necessity.
3.4 entrepreneurial aspirations
To explore the economic impact of entrepreneurs, GEM measures the job (growth) expectations, innovation and internationalization profiles of entrepreneurs. The social values towards entrepreneurship, personal attributes, and perception captured the predictive aspect of entrepreneurship. Value created by an enterprise contributes towards economic development of a nation. Research studies in this direction reveal that entrepreneurial aspirations have been positively associated with economic development (Wong et al., 2005; Wennekers et al., 2010; Bosma, 2011). Entrepreneurial aspirations
supplement the entrepreneurship cycle to give a comprehensive picture by addressing the issues related to the quality of enterprises. The high TEA value, without any growth potential will have a little impact on economic growth and development. Hence, it is the need of the hour to measure the entrepreneurship by its output and the specific realized functions.
3.4.1 Growth Orientation
Growth aspiration is a key indicator of the impact of entrepreneurial activities. GEM captures the dimension of growth aspirations in terms of job expectations. To address this issue GEM asks early-stage entrepreneurs “how many employees (other than the owners) they currently have and expect to have in the next five years?” This question explores entrepreneur expectations about the potential for their businesses and also their ambitions to
Figure 3.21: Motivational Index in 2014
Source: Based on GEM Global Report 2014
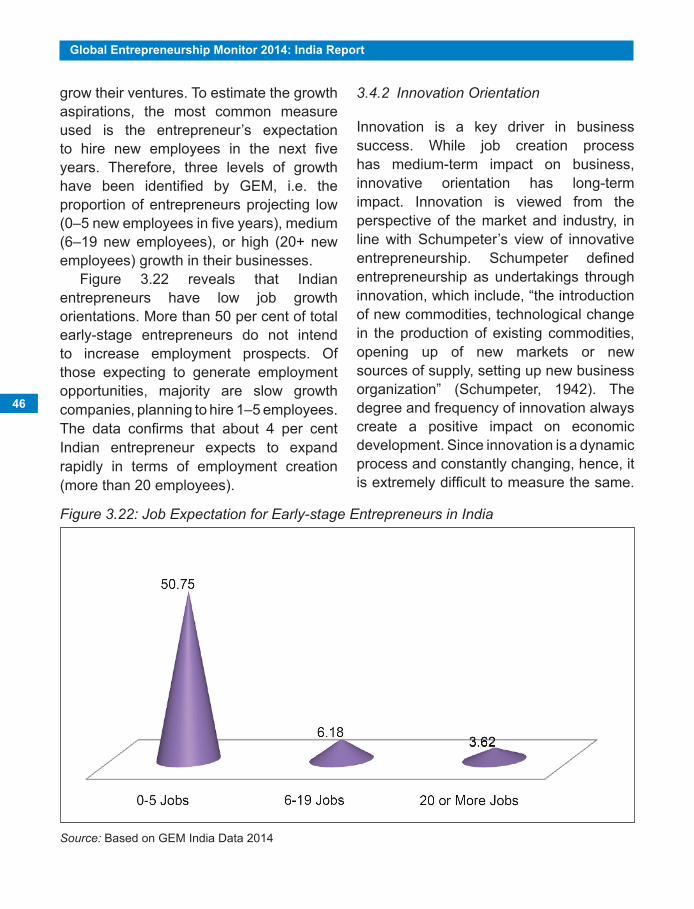
46
Global Entrepreneurship Monitor 2014: India Report
grow their ventures. To estimate the growth aspirations, the most common measure used is the entrepreneur’s expectation to hire new employees in the next five years. Therefore, three levels of growth have been identified by GEM, i.e. the proportion of entrepreneurs projecting low (0–5 new employees in five years), medium (6–19 new employees), or high (20+ new employees) growth in their businesses.
Figure 3.22 reveals that Indian entrepreneurs have low job growth orientations. More than 50 per cent of total early-stage entrepreneurs do not intend to increase employment prospects. Of those expecting to generate employment opportunities, majority are slow growth companies, planning to hire 1–5 employees. The data confirms that about 4 per cent Indian entrepreneur expects to expand rapidly in terms of employment creation (more than 20 employees).
3.4.2 Innovation Orientation
Innovation is a key driver in business success. While job creation process has medium-term impact on business, innovative orientation has long-term impact. Innovation is viewed from the perspective of the market and industry, in line with Schumpeter’s view of innovative entrepreneurship. Schumpeter defined entrepreneurship as undertakings through innovation, which include, “the introduction of new commodities, technological change in the production of existing commodities, opening up of new markets or new sources of supply, setting up new business organization” (Schumpeter, 1942). The degree and frequency of innovation always create a positive impact on economic development. Since innovation is a dynamic process and constantly changing, hence, it is extremely difficult to measure the same.
Figure 3.22: Job Expectation for Early-stage Entrepreneurs in India
Source: Based on GEM India Data 2014
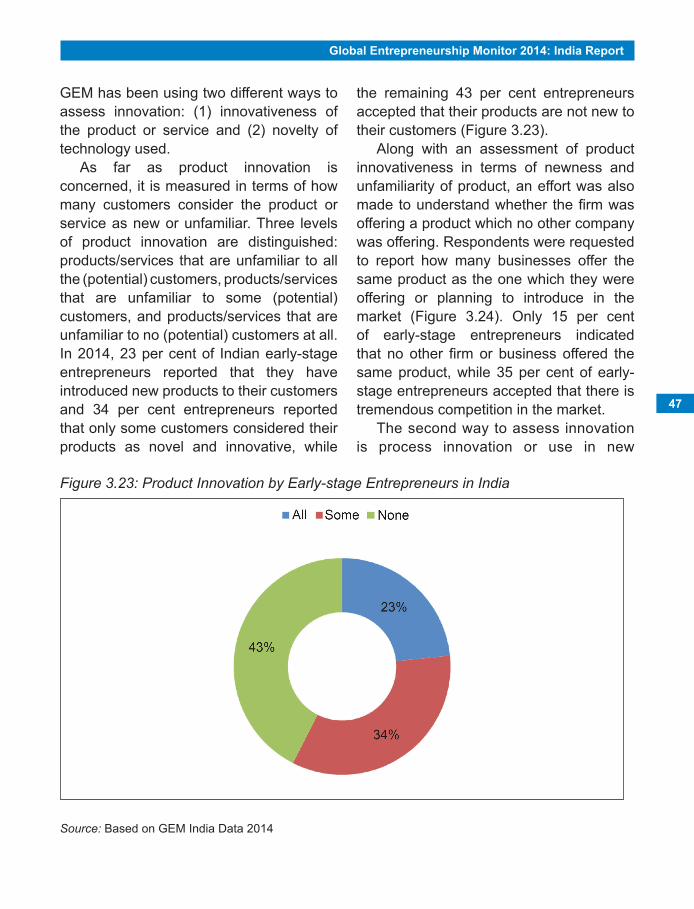
Global Entrepreneurship Monitor 2014: India Report
47
GEM has been using two different ways to assess innovation: (1) innovativeness of the product or service and (2) novelty of technology used.
As far as product innovation is concerned, it is measured in terms of how many customers consider the product or service as new or unfamiliar. Three levels of product innovation are distinguished: products/services that are unfamiliar to all the (potential) customers, products/services that are unfamiliar to some (potential) customers, and products/services that are unfamiliar to no (potential) customers at all. In 2014, 23 per cent of Indian early-stage entrepreneurs reported that they have introduced new products to their customers and 34 per cent entrepreneurs reported that only some customers considered their products as novel and innovative, while
the remaining 43 per cent entrepreneurs accepted that their products are not new to their customers (Figure 3.23).
Along with an assessment of product innovativeness in terms of newness and unfamiliarity of product, an effort was also made to understand whether the firm was offering a product which no other company was offering. Respondents were requested to report how many businesses offer the same product as the one which they were offering or planning to introduce in the market (Figure 3.24). Only 15 per cent of early-stage entrepreneurs indicated that no other firm or business offered the same product, while 35 per cent of early-stage entrepreneurs accepted that there is tremendous competition in the market.
The second way to assess innovation is process innovation or use in new
Figure 3.23: Product Innovation by Early-stage Entrepreneurs in India
Source: Based on GEM India Data 2014
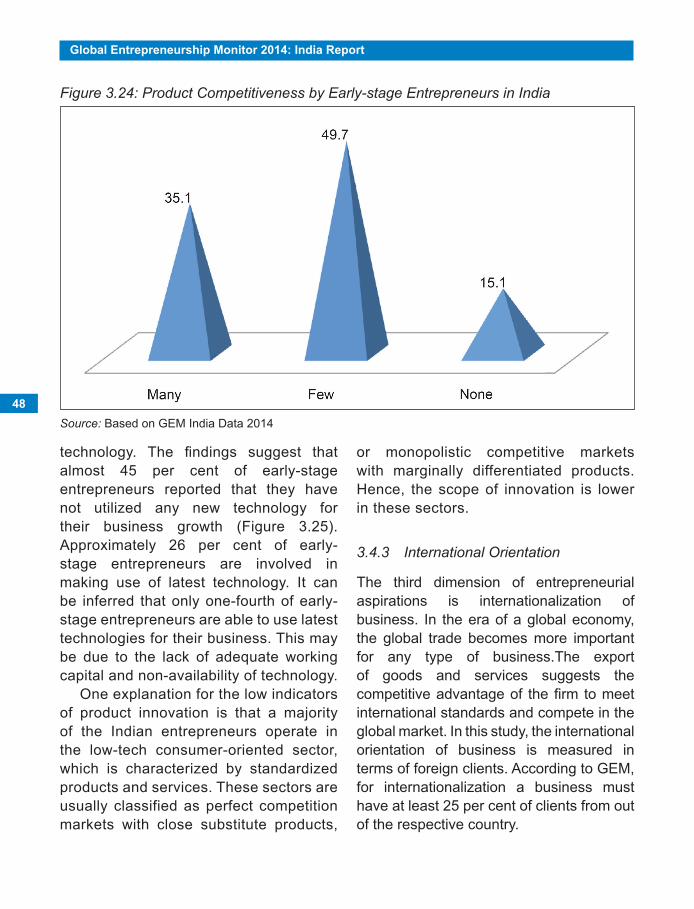
48
Global Entrepreneurship Monitor 2014: India Report
technology. The findings suggest that almost 45 per cent of early-stage entrepreneurs reported that they have not utilized any new technology for their business growth (Figure 3.25). Approximately 26 per cent of early-stage entrepreneurs are involved in making use of latest technology. It can be inferred that only one-fourth of early-stage entrepreneurs are able to use latest technologies for their business. This may be due to the lack of adequate working capital and non-availability of technology.
One explanation for the low indicators of product innovation is that a majority of the Indian entrepreneurs operate in the low-tech consumer-oriented sector, which is characterized by standardized products and services. These sectors are usually classified as perfect competition markets with close substitute products,
or monopolistic competitive markets with marginally differentiated products. Hence, the scope of innovation is lower in these sectors.
3.4.3 International Orientation
The third dimension of entrepreneurial aspirations is internationalization of business. In the era of a global economy, the global trade becomes more important for any type of business.The export of goods and services suggests the competitive advantage of the firm to meet international standards and compete in the global market. In this study, the international orientation of business is measured in terms of foreign clients. According to GEM, for internationalization a business must have at least 25 per cent of clients from out of the respective country.
Figure 3.24: Product Competitiveness by Early-stage Entrepreneurs in India
Source: Based on GEM India Data 2014
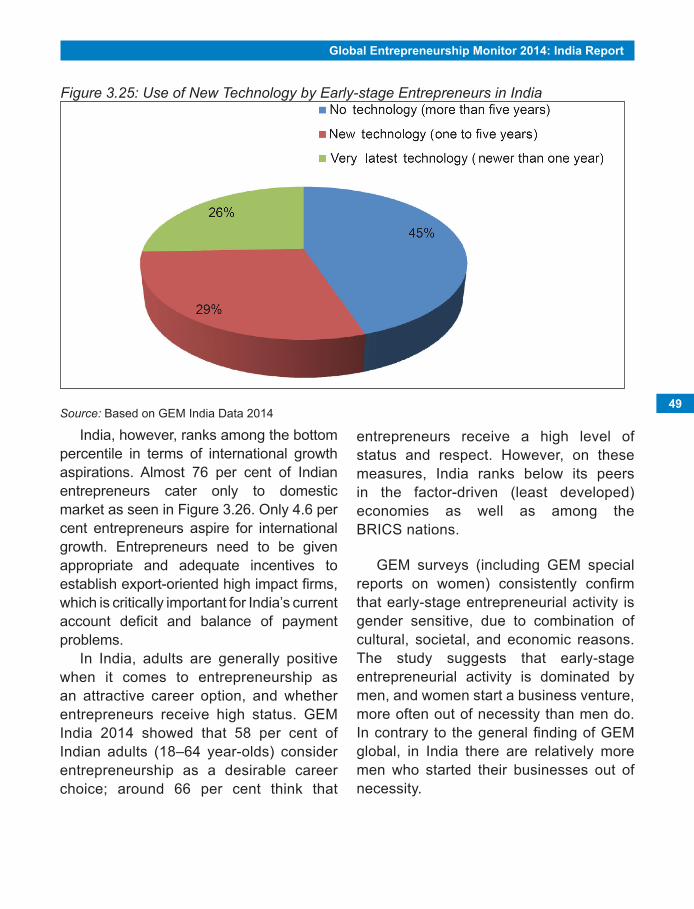
Global Entrepreneurship Monitor 2014: India Report
49
Figure 3.25: Use of New Technology by Early-stage Entrepreneurs in India
India, however, ranks among the bottom percentile in terms of international growth aspirations. Almost 76 per cent of Indian entrepreneurs cater only to domestic market as seen in Figure 3.26. Only 4.6 per cent entrepreneurs aspire for international growth. Entrepreneurs need to be given appropriate and adequate incentives to establish export-oriented high impact firms, which is critically important for India’s current account deficit and balance of payment problems.
In India, adults are generally positive when it comes to entrepreneurship as an attractive career option, and whether entrepreneurs receive high status. GEM India 2014 showed that 58 per cent of Indian adults (18–64 year-olds) consider entrepreneurship as a desirable career choice; around 66 per cent think that
entrepreneurs receive a high level of status and respect. However, on these measures, India ranks below its peers in the factor-driven (least developed) economies as well as among the BRICS nations.
GEM surveys (including GEM special reports on women) consistently confirm that early-stage entrepreneurial activity is gender sensitive, due to combination of cultural, societal, and economic reasons. The study suggests that early-stage entrepreneurial activity is dominated by men, and women start a business venture, more often out of necessity than men do. In contrary to the general finding of GEM global, in India there are relatively more men who started their businesses out of necessity.
Source: Based on GEM India Data 2014
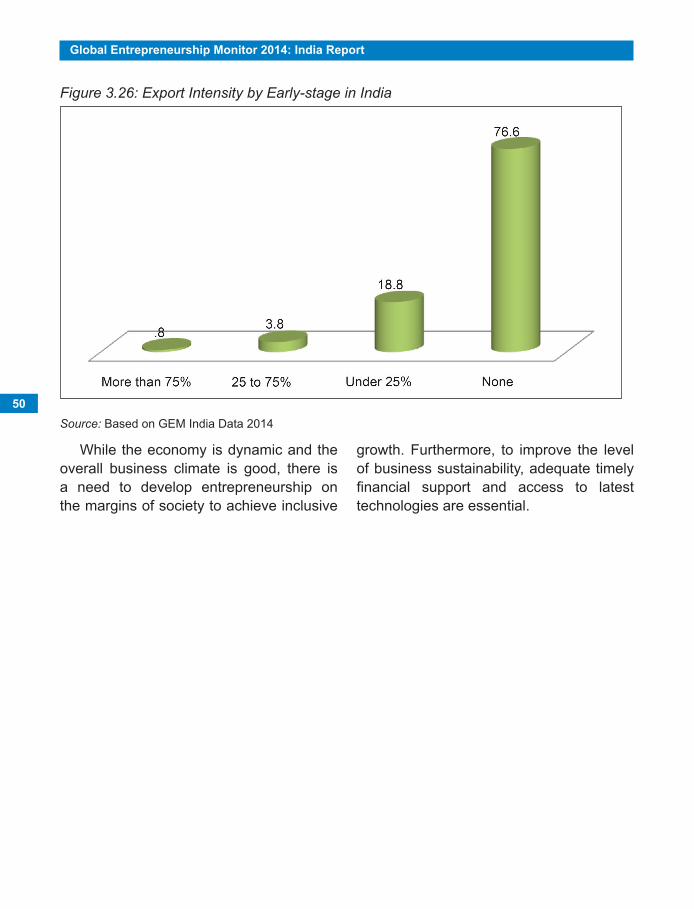
50
Global Entrepreneurship Monitor 2014: India Report
While the economy is dynamic and the overall business climate is good, there is a need to develop entrepreneurship on the margins of society to achieve inclusive
Figure 3.26: Export Intensity by Early-stage in India
growth. Furthermore, to improve the level of business sustainability, adequate timely financial support and access to latest technologies are essential.
Source: Based on GEM India Data 2014
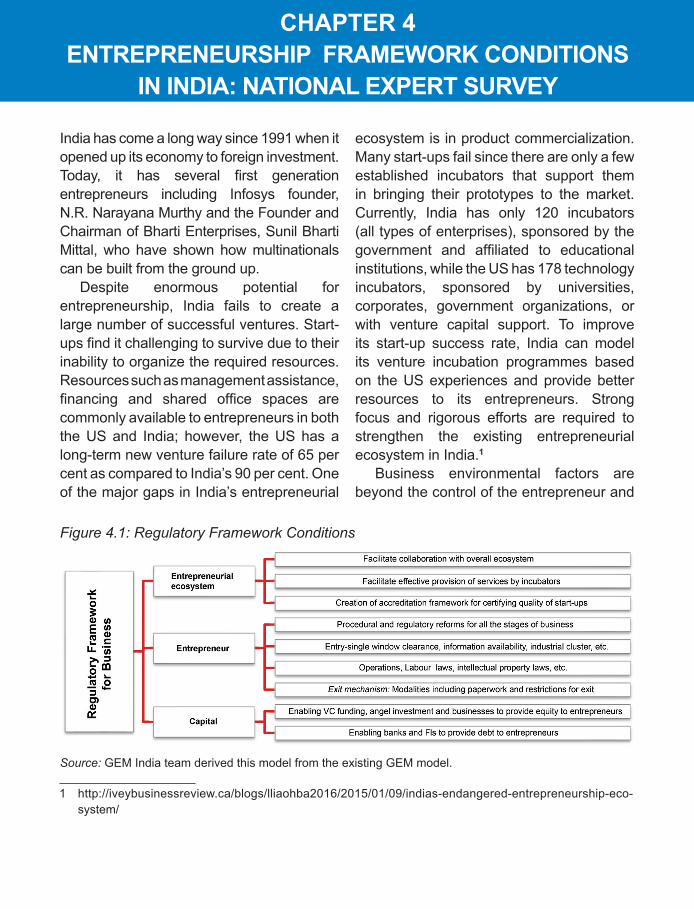
CHapter 4entrepreneursHip FraMeWOrK COnDitiOns
in inDia: natiOnaL eXpert surVeY
India has come a long way since 1991 when it opened up its economy to foreign investment. Today, it has several first generation entrepreneurs including Infosys founder, N.R. Narayana Murthy and the Founder and Chairman of Bharti Enterprises, Sunil Bharti Mittal, who have shown how multinationals can be built from the ground up.
Despite enormous potential for entrepreneurship, India fails to create a large number of successful ventures. Start-ups find it challenging to survive due to their inability to organize the required resources. Resources such as management assistance, financing and shared office spaces are commonly available to entrepreneurs in both the US and India; however, the US has a long-term new venture failure rate of 65 per cent as compared to India’s 90 per cent. One of the major gaps in India’s entrepreneurial
ecosystem is in product commercialization. Many start-ups fail since there are only a few established incubators that support them in bringing their prototypes to the market. Currently, India has only 120 incubators (all types of enterprises), sponsored by the government and affiliated to educational institutions, while the US has 178 technology incubators, sponsored by universities, corporates, government organizations, or with venture capital support. To improve its start-up success rate, India can model its venture incubation programmes based on the US experiences and provide better resources to its entrepreneurs. Strong focus and rigorous efforts are required to strengthen the existing entrepreneurial ecosystem in India.1
Business environmental factors are beyond the control of the entrepreneur and
Figure 4.1: Regulatory Framework Conditions
Source: GEM India team derived this model from the existing GEM model.
1 http://iveybusinessreview.ca/blogs/lliaohba2016/2015/01/09/indias-endangered-entrepreneurship-eco-system/
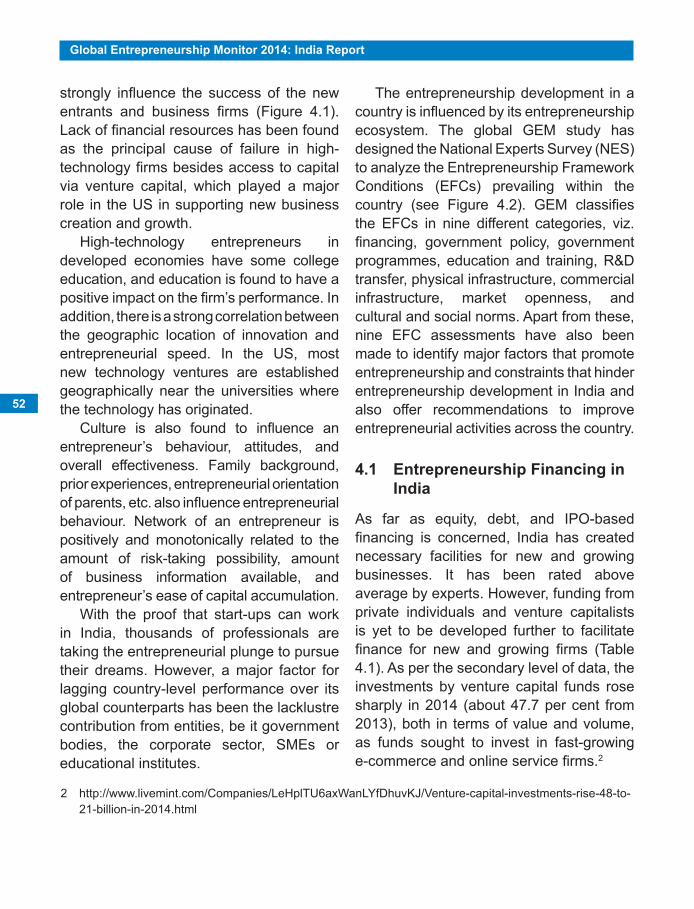
52
Global Entrepreneurship Monitor 2014: India Report
strongly influence the success of the new entrants and business firms (Figure 4.1). Lack of financial resources has been found as the principal cause of failure in high-technology firms besides access to capital via venture capital, which played a major role in the US in supporting new business creation and growth.
High-technology entrepreneurs in developed economies have some college education, and education is found to have a positive impact on the firm’s performance. In addition, there is a strong correlation between the geographic location of innovation and entrepreneurial speed. In the US, most new technology ventures are established geographically near the universities where the technology has originated.
Culture is also found to influence an entrepreneur’s behaviour, attitudes, and overall effectiveness. Family background, prior experiences, entrepreneurial orientation of parents, etc. also influence entrepreneurial behaviour. Network of an entrepreneur is positively and monotonically related to the amount of risk-taking possibility, amount of business information available, and entrepreneur’s ease of capital accumulation.
With the proof that start-ups can work in India, thousands of professionals are taking the entrepreneurial plunge to pursue their dreams. However, a major factor for lagging country-level performance over its global counterparts has been the lacklustre contribution from entities, be it government bodies, the corporate sector, SMEs or educational institutes.
The entrepreneurship development in a country is influenced by its entrepreneurship ecosystem. The global GEM study has designed the National Experts Survey (NES) to analyze the Entrepreneurship Framework Conditions (EFCs) prevailing within the country (see Figure 4.2). GEM classifies the EFCs in nine different categories, viz. financing, government policy, government programmes, education and training, R&D transfer, physical infrastructure, commercial infrastructure, market openness, and cultural and social norms. Apart from these, nine EFC assessments have also been made to identify major factors that promote entrepreneurship and constraints that hinder entrepreneurship development in India and also offer recommendations to improve entrepreneurial activities across the country.
4.1 entrepreneurship Financing in india
As far as equity, debt, and IPO-based financing is concerned, India has created necessary facilities for new and growing businesses. It has been rated above average by experts. However, funding from private individuals and venture capitalists is yet to be developed further to facilitate finance for new and growing firms (Table 4.1). As per the secondary level of data, the investments by venture capital funds rose sharply in 2014 (about 47.7 per cent from 2013), both in terms of value and volume, as funds sought to invest in fast-growing e-commerce and online service firms.2
2 http://www.livemint.com/Companies/LeHplTU6axWanLYfDhuvKJ/Venture-capital-investments-rise-48-to-21-billion-in-2014.html
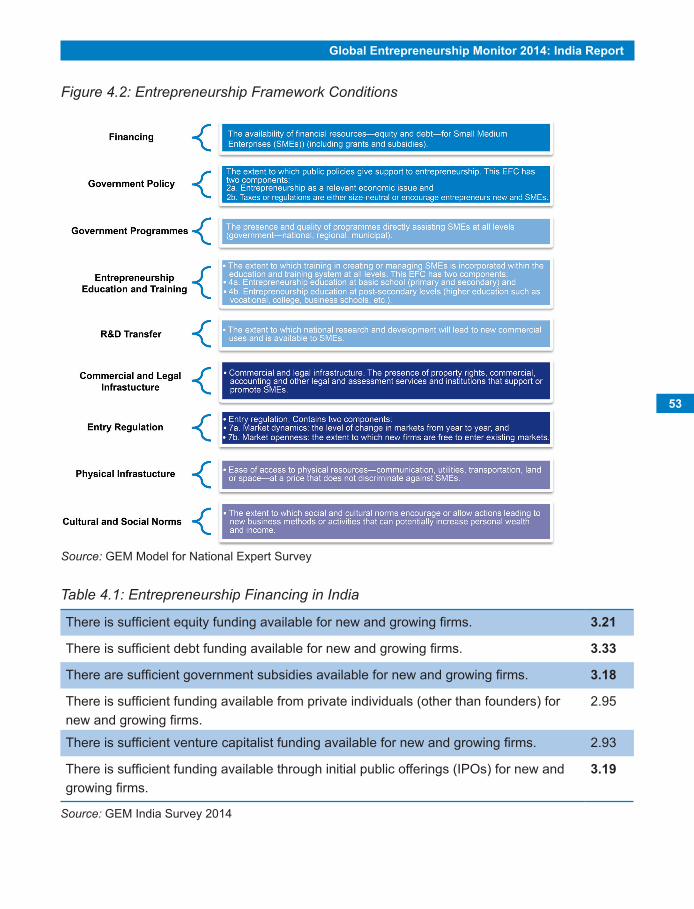
Global Entrepreneurship Monitor 2014: India Report
53
Figure 4.2: Entrepreneurship Framework Conditions
Source: GEM Model for National Expert Survey
Table 4.1: Entrepreneurship Financing in India
There is sufficient equity funding available for new and growing firms. 3.21
There is sufficient debt funding available for new and growing firms. 3.33
There are sufficient government subsidies available for new and growing firms. 3.18
There is sufficient funding available from private individuals (other than founders) for new and growing firms.
2.95
There is sufficient venture capitalist funding available for new and growing firms. 2.93
There is sufficient funding available through initial public offerings (IPOs) for new and growing firms.
3.19
Source: GEM India Survey 2014
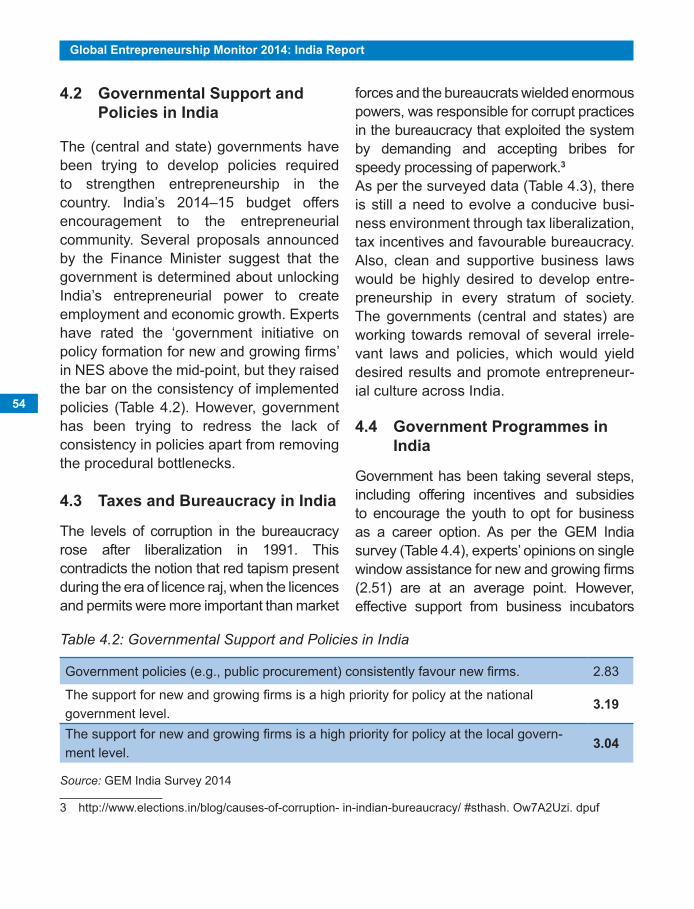
54
Global Entrepreneurship Monitor 2014: India Report
4.2 Governmental support and policies in india
The (central and state) governments have been trying to develop policies required to strengthen entrepreneurship in the country. India’s 2014–15 budget offers encouragement to the entrepreneurial community. Several proposals announced by the Finance Minister suggest that the government is determined about unlocking India’s entrepreneurial power to create employment and economic growth. Experts have rated the ‘government initiative on policy formation for new and growing firms’ in NES above the mid-point, but they raised the bar on the consistency of implemented policies (Table 4.2). However, government has been trying to redress the lack of consistency in policies apart from removing the procedural bottlenecks.
4.3 taxes and Bureaucracy in india
The levels of corruption in the bureaucracy rose after liberalization in 1991. This contradicts the notion that red tapism present during the era of licence raj, when the licences and permits were more important than market
forces and the bureaucrats wielded enormous powers, was responsible for corrupt practices in the bureaucracy that exploited the system by demanding and accepting bribes for speedy processing of paperwork.3As per the surveyed data (Table 4.3), there is still a need to evolve a conducive busi-ness environment through tax liberalization, tax incentives and favourable bureaucracy. Also, clean and supportive business laws would be highly desired to develop entre-preneurship in every stratum of society. The governments (central and states) are working towards removal of several irrele-vant laws and policies, which would yield desired results and promote entrepreneur-ial culture across India.
4.4 Government programmes in india
Government has been taking several steps, including offering incentives and subsidies to encourage the youth to opt for business as a career option. As per the GEM India survey (Table 4.4), experts’ opinions on single window assistance for new and growing firms (2.51) are at an average point. However, effective support from business incubators
Table 4.2: Governmental Support and Policies in India
Government policies (e.g., public procurement) consistently favour new firms. 2.83
The support for new and growing firms is a high priority for policy at the national government level.
3.19
The support for new and growing firms is a high priority for policy at the local govern-ment level.
3.04
Source: GEM India Survey 2014
3 http://www.elections.in/blog/causes-of-corruption- in-indian-bureaucracy/ #sthash. Ow7A2Uzi. dpuf
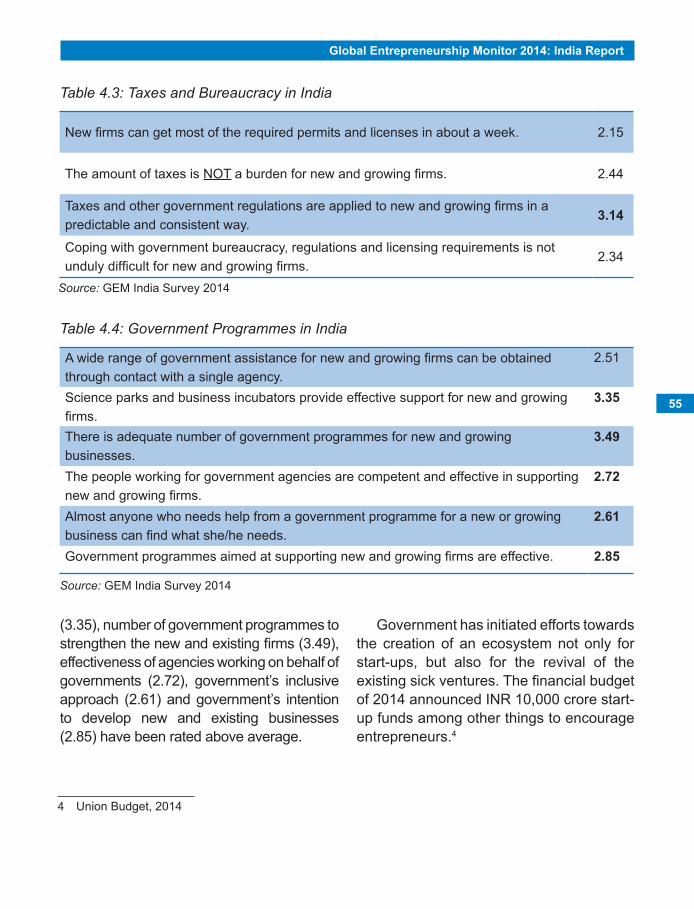
Global Entrepreneurship Monitor 2014: India Report
55
(3.35), number of government programmes to strengthen the new and existing firms (3.49), effectiveness of agencies working on behalf of governments (2.72), government’s inclusive approach (2.61) and government’s intention to develop new and existing businesses (2.85) have been rated above average.
Table 4.3: Taxes and Bureaucracy in India
New firms can get most of the required permits and licenses in about a week. 2.15
The amount of taxes is NOT a burden for new and growing firms. 2.44
Taxes and other government regulations are applied to new and growing firms in a predictable and consistent way.
3.14
Coping with government bureaucracy, regulations and licensing requirements is not unduly difficult for new and growing firms.
2.34
Source: GEM India Survey 2014
Table 4.4: Government Programmes in India
A wide range of government assistance for new and growing firms can be obtained through contact with a single agency.
2.51
Science parks and business incubators provide effective support for new and growing firms.
3.35
There is adequate number of government programmes for new and growing businesses.
3.49
The people working for government agencies are competent and effective in supporting new and growing firms.
2.72
Almost anyone who needs help from a government programme for a new or growing business can find what she/he needs.
2.61
Government programmes aimed at supporting new and growing firms are effective. 2.85
Source: GEM India Survey 2014
Government has initiated efforts towards the creation of an ecosystem not only for start-ups, but also for the revival of the existing sick ventures. The financial budget of 2014 announced INR 10,000 crore start-up funds among other things to encourage entrepreneurs.4
4 Union Budget, 2014
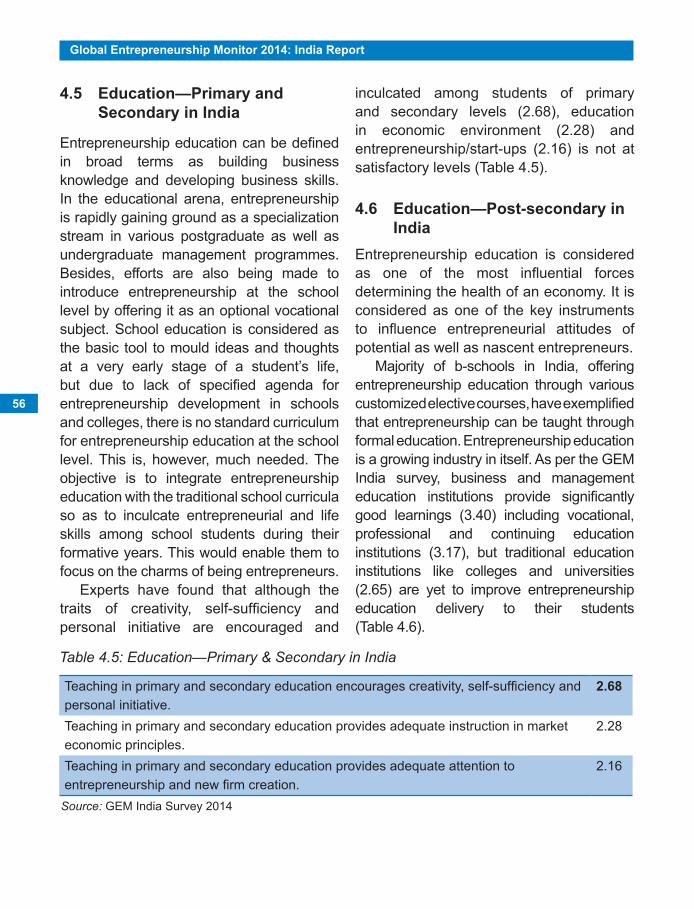
56
Global Entrepreneurship Monitor 2014: India Report
4.5 education—primary and secondary in india
Entrepreneurship education can be defined in broad terms as building business knowledge and developing business skills. In the educational arena, entrepreneurship is rapidly gaining ground as a specialization stream in various postgraduate as well as undergraduate management programmes. Besides, efforts are also being made to introduce entrepreneurship at the school level by offering it as an optional vocational subject. School education is considered as the basic tool to mould ideas and thoughts at a very early stage of a student’s life, but due to lack of specified agenda for entrepreneurship development in schools and colleges, there is no standard curriculum for entrepreneurship education at the school level. This is, however, much needed. The objective is to integrate entrepreneurship education with the traditional school curricula so as to inculcate entrepreneurial and life skills among school students during their formative years. This would enable them to focus on the charms of being entrepreneurs.
Experts have found that although the traits of creativity, self-sufficiency and personal initiative are encouraged and
inculcated among students of primary and secondary levels (2.68), education in economic environment (2.28) and entrepreneurship/start-ups (2.16) is not at satisfactory levels (Table 4.5).
4.6 education—post-secondary in india
Entrepreneurship education is considered as one of the most influential forces determining the health of an economy. It is considered as one of the key instruments to influence entrepreneurial attitudes of potential as well as nascent entrepreneurs.
Majority of b-schools in India, offering entrepreneurship education through various customized elective courses, have exemplified that entrepreneurship can be taught through formal education. Entrepreneurship education is a growing industry in itself. As per the GEM India survey, business and management education institutions provide significantly good learnings (3.40) including vocational, professional and continuing education institutions (3.17), but traditional education institutions like colleges and universities (2.65) are yet to improve entrepreneurship education delivery to their students (Table 4.6).
Table 4.5: Education—Primary & Secondary in India
Teaching in primary and secondary education encourages creativity, self-sufficiency and personal initiative.
2.68
Teaching in primary and secondary education provides adequate instruction in market economic principles.
2.28
Teaching in primary and secondary education provides adequate attention to entrepreneurship and new firm creation.
2.16
Source: GEM India Survey 2014
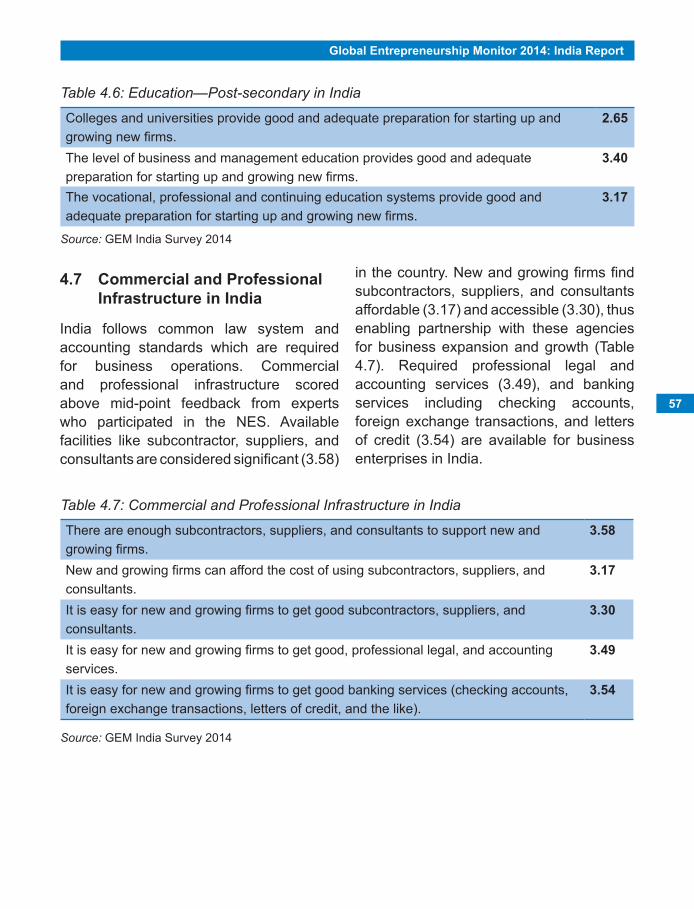
Global Entrepreneurship Monitor 2014: India Report
57
4.7 Commercial and professional infrastructure in india
India follows common law system and accounting standards which are required for business operations. Commercial and professional infrastructure scored above mid-point feedback from experts who participated in the NES. Available facilities like subcontractor, suppliers, and consultants are considered significant (3.58)
Table 4.6: Education—Post-secondary in India
Colleges and universities provide good and adequate preparation for starting up and growing new firms.
2.65
The level of business and management education provides good and adequate preparation for starting up and growing new firms.
3.40
The vocational, professional and continuing education systems provide good and adequate preparation for starting up and growing new firms.
3.17
Source: GEM India Survey 2014
in the country. New and growing firms find subcontractors, suppliers, and consultants affordable (3.17) and accessible (3.30), thus enabling partnership with these agencies for business expansion and growth (Table 4.7). Required professional legal and accounting services (3.49), and banking services including checking accounts, foreign exchange transactions, and letters of credit (3.54) are available for business enterprises in India.
Table 4.7: Commercial and Professional Infrastructure in India
There are enough subcontractors, suppliers, and consultants to support new and growing firms.
3.58
New and growing firms can afford the cost of using subcontractors, suppliers, and consultants.
3.17
It is easy for new and growing firms to get good subcontractors, suppliers, and consultants.
3.30
It is easy for new and growing firms to get good, professional legal, and accounting services.
3.49
It is easy for new and growing firms to get good banking services (checking accounts, foreign exchange transactions, letters of credit, and the like).
3.54
Source: GEM India Survey 2014
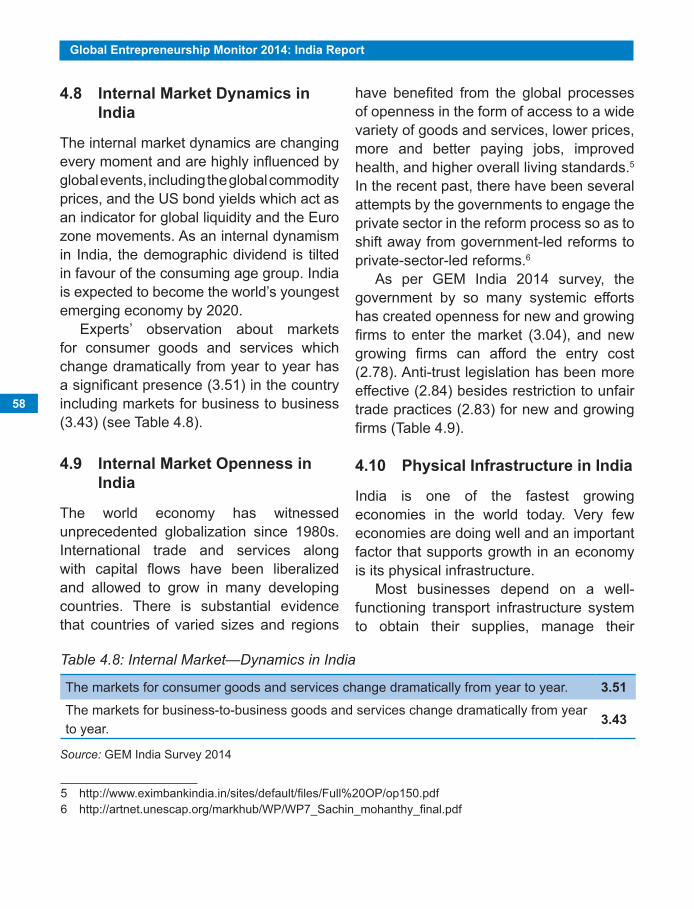
58
Global Entrepreneurship Monitor 2014: India Report
4.8 internal Market Dynamics in india
The internal market dynamics are changing every moment and are highly influenced by global events, including the global commodity prices, and the US bond yields which act as an indicator for global liquidity and the Euro zone movements. As an internal dynamism in India, the demographic dividend is tilted in favour of the consuming age group. India is expected to become the world’s youngest emerging economy by 2020.
Experts’ observation about markets for consumer goods and services which change dramatically from year to year has a significant presence (3.51) in the country including markets for business to business (3.43) (see Table 4.8).
4.9 internal Market Openness in india
The world economy has witnessed unprecedented globalization since 1980s. International trade and services along with capital flows have been liberalized and allowed to grow in many developing countries. There is substantial evidence that countries of varied sizes and regions
have benefited from the global processes of openness in the form of access to a wide variety of goods and services, lower prices, more and better paying jobs, improved health, and higher overall living standards.5
In the recent past, there have been several attempts by the governments to engage the private sector in the reform process so as to shift away from government-led reforms to private-sector-led reforms.6
As per GEM India 2014 survey, the government by so many systemic efforts has created openness for new and growing firms to enter the market (3.04), and new growing firms can afford the entry cost (2.78). Anti-trust legislation has been more effective (2.84) besides restriction to unfair trade practices (2.83) for new and growing firms (Table 4.9).
4.10 physical infrastructure in india
India is one of the fastest growing economies in the world today. Very few economies are doing well and an important factor that supports growth in an economy is its physical infrastructure.
Most businesses depend on a well-functioning transport infrastructure system to obtain their supplies, manage their
Table 4.8: Internal Market—Dynamics in India
The markets for consumer goods and services change dramatically from year to year. 3.51The markets for business-to-business goods and services change dramatically from year to year.
3.43
Source: GEM India Survey 2014
5 http://www.eximbankindia.in/sites/default/files/Full%20OP/op150.pdf6 http://artnet.unescap.org/markhub/WP/WP7_Sachin_mohanthy_final.pdf
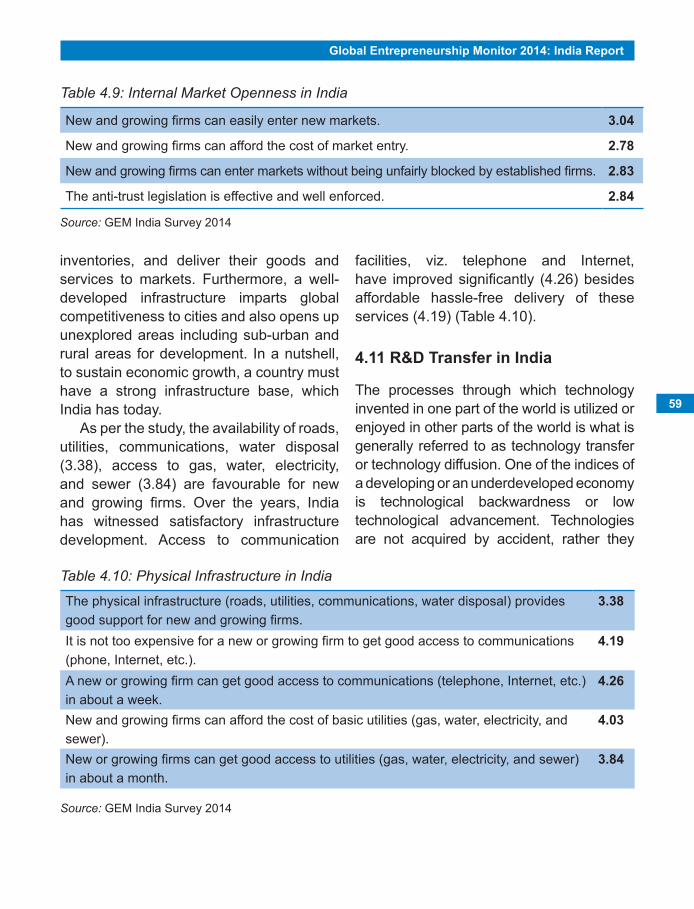
Global Entrepreneurship Monitor 2014: India Report
59
inventories, and deliver their goods and services to markets. Furthermore, a well-developed infrastructure imparts global competitiveness to cities and also opens up unexplored areas including sub-urban and rural areas for development. In a nutshell, to sustain economic growth, a country must have a strong infrastructure base, which India has today.
As per the study, the availability of roads, utilities, communications, water disposal (3.38), access to gas, water, electricity, and sewer (3.84) are favourable for new and growing firms. Over the years, India has witnessed satisfactory infrastructure development. Access to communication
Table 4.9: Internal Market Openness in India
New and growing firms can easily enter new markets. 3.04
New and growing firms can afford the cost of market entry. 2.78
New and growing firms can enter markets without being unfairly blocked by established firms. 2.83
The anti-trust legislation is effective and well enforced. 2.84
Source: GEM India Survey 2014
facilities, viz. telephone and Internet, have improved significantly (4.26) besides affordable hassle-free delivery of these services (4.19) (Table 4.10).
4.11 r&D transfer in india
The processes through which technology invented in one part of the world is utilized or enjoyed in other parts of the world is what is generally referred to as technology transfer or technology diffusion. One of the indices of a developing or an underdeveloped economy is technological backwardness or low technological advancement. Technologies are not acquired by accident, rather they
Table 4.10: Physical Infrastructure in India
The physical infrastructure (roads, utilities, communications, water disposal) provides good support for new and growing firms.
3.38
It is not too expensive for a new or growing firm to get good access to communications (phone, Internet, etc.).
4.19
A new or growing firm can get good access to communications (telephone, Internet, etc.) in about a week.
4.26
New and growing firms can afford the cost of basic utilities (gas, water, electricity, and sewer).
4.03
New or growing firms can get good access to utilities (gas, water, electricity, and sewer) in about a month.
3.84
Source: GEM India Survey 2014
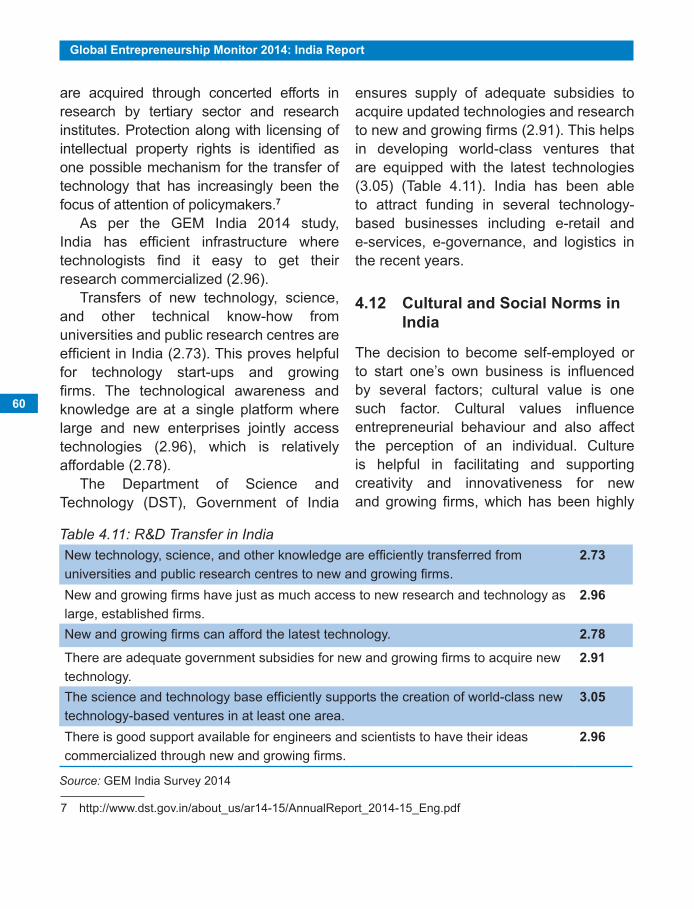
60
Global Entrepreneurship Monitor 2014: India Report
are acquired through concerted efforts in research by tertiary sector and research institutes. Protection along with licensing of intellectual property rights is identified as one possible mechanism for the transfer of technology that has increasingly been the focus of attention of policymakers.7
As per the GEM India 2014 study, India has efficient infrastructure where technologists find it easy to get their research commercialized (2.96).
Transfers of new technology, science, and other technical know-how from universities and public research centres are efficient in India (2.73). This proves helpful for technology start-ups and growing firms. The technological awareness and knowledge are at a single platform where large and new enterprises jointly access technologies (2.96), which is relatively affordable (2.78).
The Department of Science and Technology (DST), Government of India
ensures supply of adequate subsidies to acquire updated technologies and research to new and growing firms (2.91). This helps in developing world-class ventures that are equipped with the latest technologies (3.05) (Table 4.11). India has been able to attract funding in several technology-based businesses including e-retail and e-services, e-governance, and logistics in the recent years.
4.12 Cultural and social norms in india
The decision to become self-employed or to start one’s own business is influenced by several factors; cultural value is one such factor. Cultural values influence entrepreneurial behaviour and also affect the perception of an individual. Culture is helpful in facilitating and supporting creativity and innovativeness for new and growing firms, which has been highly
Table 4.11: R&D Transfer in IndiaNew technology, science, and other knowledge are efficiently transferred from universities and public research centres to new and growing firms.
2.73
New and growing firms have just as much access to new research and technology as large, established firms.
2.96
New and growing firms can afford the latest technology. 2.78
There are adequate government subsidies for new and growing firms to acquire new technology.
2.91
The science and technology base efficiently supports the creation of world-class new technology-based ventures in at least one area.
3.05
There is good support available for engineers and scientists to have their ideas commercialized through new and growing firms.
2.96
Source: GEM India Survey 2014
7 http://www.dst.gov.in/about_us/ar14-15/AnnualReport_2014-15_Eng.pdf
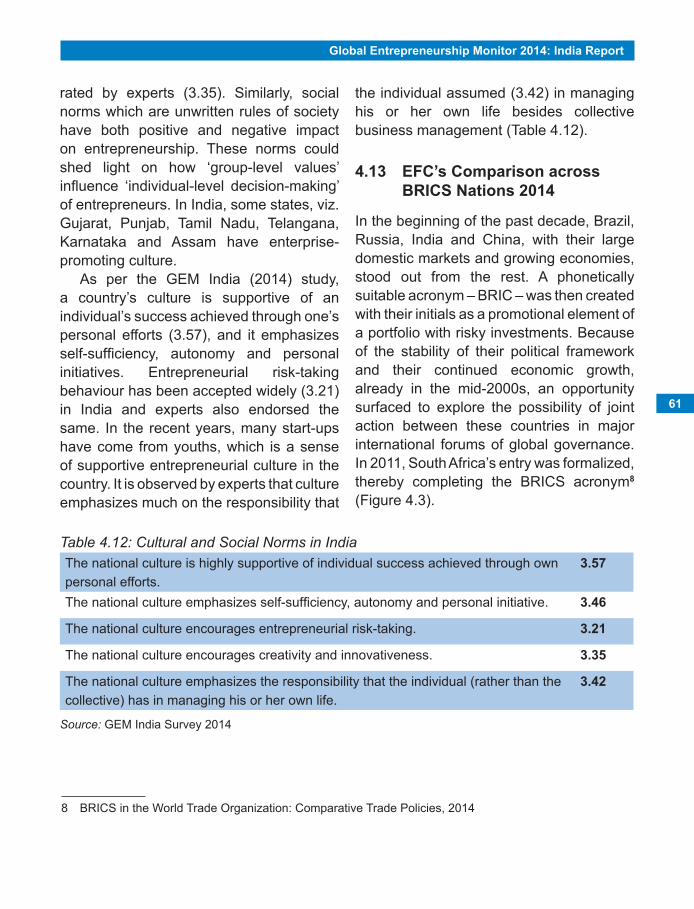
Global Entrepreneurship Monitor 2014: India Report
61
rated by experts (3.35). Similarly, social norms which are unwritten rules of society have both positive and negative impact on entrepreneurship. These norms could shed light on how ‘group-level values’ influence ‘individual-level decision-making’ of entrepreneurs. In India, some states, viz. Gujarat, Punjab, Tamil Nadu, Telangana, Karnataka and Assam have enterprise-promoting culture.
As per the GEM India (2014) study, a country’s culture is supportive of an individual’s success achieved through one’s personal efforts (3.57), and it emphasizes self-sufficiency, autonomy and personal initiatives. Entrepreneurial risk-taking behaviour has been accepted widely (3.21) in India and experts also endorsed the same. In the recent years, many start-ups have come from youths, which is a sense of supportive entrepreneurial culture in the country. It is observed by experts that culture emphasizes much on the responsibility that
the individual assumed (3.42) in managing his or her own life besides collective business management (Table 4.12).
4.13 eFC’s Comparison across BriCs nations 2014
In the beginning of the past decade, Brazil, Russia, India and China, with their large domestic markets and growing economies, stood out from the rest. A phonetically suitable acronym – BRIC – was then created with their initials as a promotional element of a portfolio with risky investments. Because of the stability of their political framework and their continued economic growth, already in the mid-2000s, an opportunity surfaced to explore the possibility of joint action between these countries in major international forums of global governance. In 2011, South Africa’s entry was formalized, thereby completing the BRICS acronym8 (Figure 4.3).
Table 4.12: Cultural and Social Norms in IndiaThe national culture is highly supportive of individual success achieved through own personal efforts.
3.57
The national culture emphasizes self-sufficiency, autonomy and personal initiative. 3.46
The national culture encourages entrepreneurial risk-taking. 3.21
The national culture encourages creativity and innovativeness. 3.35
The national culture emphasizes the responsibility that the individual (rather than the collective) has in managing his or her own life.
3.42
Source: GEM India Survey 2014
8 BRICS in the World Trade Organization: Comparative Trade Policies, 2014
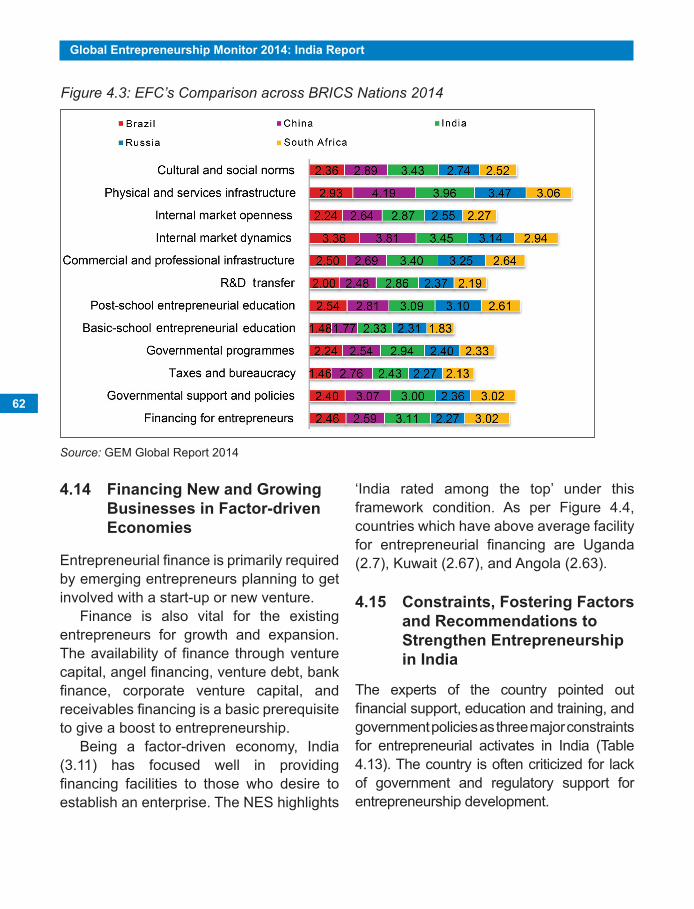
62
Global entrepreneurship Monitor 2014: india report
Figure 4.3: EFC’s Comparison across BRICS Nations 2014
Source: GEM Global Report 2014
4.14 Financing new and Growing Businesses in Factor-driven economies
Entrepreneurial fi nance is primarily required by emerging entrepreneurs planning to get involved with a start-up or new venture.
Finance is also vital for the existing entrepreneurs for growth and expansion. The availability of fi nance through venture capital, angel fi nancing, venture debt, bank fi nance, corporate venture capital, and receivables fi nancing is a basic prerequisite to give a boost to entrepreneurship.
Being a factor-driven economy, India (3.11) has focused well in providing fi nancing facilities to those who desire to establish an enterprise. The NES highlights
‘India rated among the top’ under this framework condition. As per Figure 4.4, countries which have above average facility for entrepreneurial fi nancing are Uganda (2.7), Kuwait (2.67), and Angola (2.63).
4.15 Constraints, Fostering Factors and recommendations to strengthen entrepreneurship in india
The experts of the country pointed out fi nancial support, education and training, and government policies as three major constraints for entrepreneurial activates in India (Table 4.13). The country is often criticized for lack of government and regulatory support for entrepreneurship development.
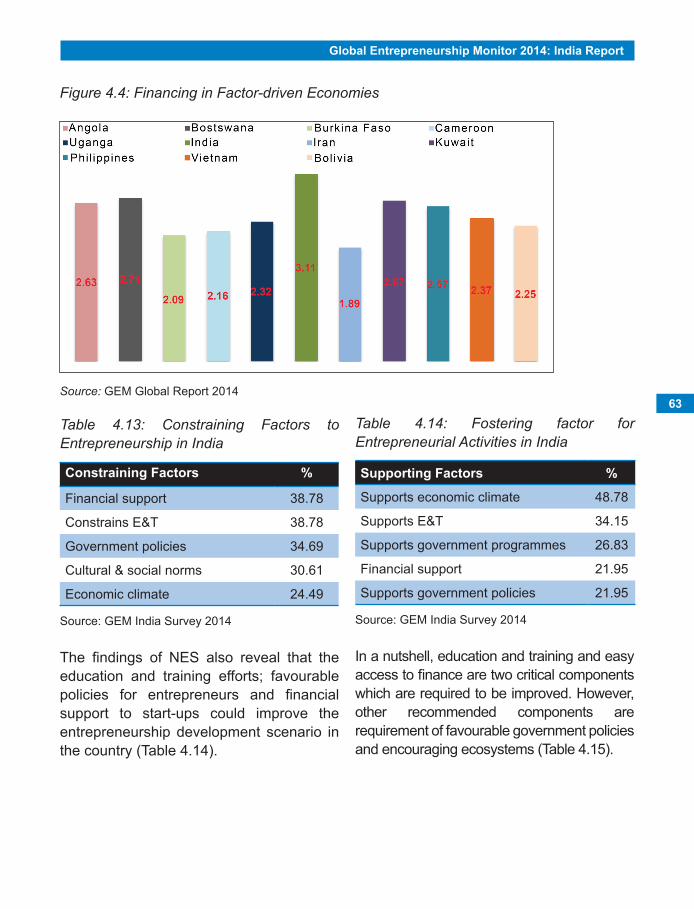
Global Entrepreneurship Monitor 2014: India Report
63
Table 4.13: Constraining Factors to Entrepreneurship in India
Constraining Factors %
Financial support 38.78
Constrains E&T 38.78
Government policies 34.69
Cultural & social norms 30.61
Economic climate 24.49
Source: GEM India Survey 2014
The findings of NES also reveal that the education and training efforts; favourable policies for entrepreneurs and financial support to start-ups could improve the entrepreneurship development scenario in the country (Table 4.14).
Source: GEM Global Report 2014
Figure 4.4: Financing in Factor-driven Economies
Table 4.14: Fostering factor for Entrepreneurial Activities in India
supporting Factors %
Supports economic climate 48.78
Supports E&T 34.15
Supports government programmes 26.83
Financial support 21.95
Supports government policies 21.95
Source: GEM India Survey 2014
In a nutshell, education and training and easy access to finance are two critical components which are required to be improved. However, other recommended components are requirement of favourable government policies and encouraging ecosystems (Table 4.15).
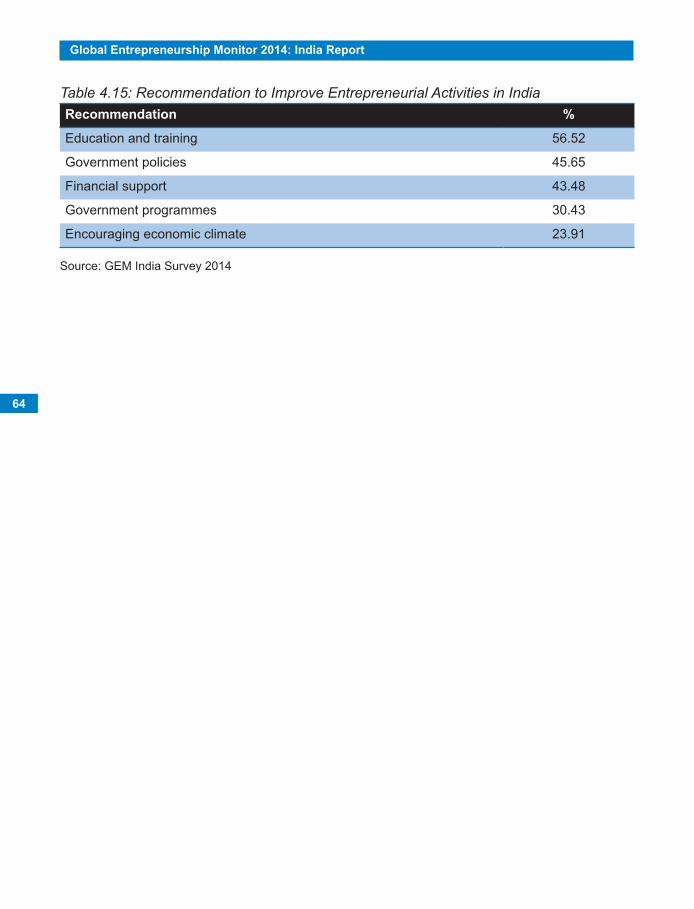
64
Global Entrepreneurship Monitor 2014: India Report
Table 4.15: Recommendation to Improve Entrepreneurial Activities in Indiarecommendation %
Education and training 56.52
Government policies 45.65
Financial support 43.48
Government programmes 30.43
Encouraging economic climate 23.91
Source: GEM India Survey 2014
Global Entrepreneurship Monitor 2013: India ReportCHapter 5
CONCLUSION aND KeY pOLICY IMpLICatIONS
Entrepreneurship has become a key driver of sustainable economic growth and has immense potential to generate employment opportunities. Developing a culture of entrepreneurial thinking within the country has become a focus for governments and societies worldwide. In the Indian context, given its socio-economic challenges as well as its size and scope, a holistic approach to entrepreneurship development can bring transformational changes to socio-economic landscape. Adopting simplified common approach or simply following an existing model of entrepreneurship development (even if it is highly successful elsewhere) will not help India to achieve its potential. What is needed is a holistic model of pervasive entrepreneurship development, driven by innovations and values that can address India’s unique challenges.
The GEM India 2014 report unveils the entrepreneurial dynamics in the country. This report provides data and analysis that can help academicians, researchers, policymakers, and professionals to take appropriate action for enhancing economic growth with focus on broad-based entrepreneurship development. Another significant contribution is that it enables us to assess how the entrepreneurial activity and profiles change with political and socio-economic development over a period time. The report examined key aspects of entrepreneurship among Indians, by measuring their attitudes, activities, and aspirations. The findings of the report can provide policy-makers with a foundation
for reviewing the current and prospective policies to enhance and highlight the vital role and need for entrepreneurship in India. The major findings and appropriate recommendation for policy-making are highlighted under conclusion. The findings are based on a survey of 3,360 adults sampled across the country. To ensure national representation of population and generalization power of findings appropriate weights were used for age groups, gender, and urban-rural classifications.
5.1 Key points from apS (adult population Survey)
• In India, adults are generally positive when it comes to entrepreneurship as an attractive career option, and whether entrepreneurs receive high status. GEM India 2014 showed that 58 per cent of Indian adults, in the 18–64 age group, consider entrepreneurship as a desirable career choice; around 66 per cent think that entrepreneurs receive a high level of status and respect. However, on these measures India ranks below its peers in the factor-driven (least developed) economies as well as among the BRICS nations.
• GEM India 2014 found that in India, 4.1 per cent of adults are ‘nascent entrepreneurs’ (actively involved in setting up a business) while 2.5 per cent are ‘new business owners’
66
Global Entrepreneurship Monitor 2014: India Report
(in operation for more than 3 but less than 42 months). Combining these rates gives us the total early-stage entrepreneurial activity (TEA) rate, meaning that 6.7 per cent of the Indian adult population, that is 1 in every 14 adults, – is engaged in some form of early-stage entrepreneurial activity.
• 6.6 per cent of the adult population in India is engaged in entrepreneurship, while 3.7 per cent already own/manage an established business. However, 7.66 per cent adults are expected to start business in the next three years.
• 39 per cent of adults in India see good opportunities to start a business; while 37 per cent of adults perceive they have capabilities to start a business; and 38 per cent of the adult population would be prevented from doing so by fear of failure.
• It was found that more early-stage entrepreneurs were in the 25–34 age group than in any other age range.
• In India, about one third (34 per cent) of early-stage entrepreneurs are women. GEM surveys (including GEM special reports on women) consistently confirm that early-stage entrepreneurial activity is gender sensitive, due to combination of cultural, societal, and economic reasons. GEM India study suggests that early-stage entrepreneurial activity is dominated by men,
and women who start a business venture more often out of necessity than men. Contrary to the general finding of GEM, in India there are relatively more men who started their businesses out of necessity.
• In India, entrepreneurship motivated by necessity (no other option for work) accounts for 31 per cent of early-stage activity, while 36.5 per cent is motivated by improvement-driven motive. In comparison in China, rate of necessity-driven entrepreneurship is 33.2 per cent, and that of improvement-driven entrepreneurship is 45.4 per cent.
5.2 Key points from NeS (National experts Survey) enablers and Constraints
According to the GEM National Experts Survey, the three major constraints for entrepreneurship development in India are:
• Government regulation and policies;
• Entrepreneurial education at primary and secondary school level, and;
• Transfer and commercialization of R&D—new know-how and technologies.
the major enablers are:• Commercial Infrastructure—the
presence of property rights, and commercial, accounting, and other legal services and institutions that support or promote SMEs;
Global Entrepreneurship Monitor 2014: India Report
67
• Internal market dynamics—the extent to which markets change dramatically from year to year;
• Ease of access to available physical infrastructure—communication, utilities, transportation, land or space, at a price that does not discriminate against new, small or growing firms;
• Culture and social norms—the extent to which social and cultural norms encourage or allow actions leading to new business methods or activities that can potentially increase personal wealth and income.
5.3 Challenges for the Future
• While the Indian economy is dynamic and the overall business climate is good, there is an urgent need to take a holistic approach to develop a broad-based ecosystem that would support the needs of current and future generations of entrepreneurs. More importantly, such an ecosystem should be pervasive and must support the aspirations of all sections of the society in order to achieve sustainable inclusive growth. In recent times, there has been an increased level of focus on financing start-ups, ease of starting a business, incubators, mentoring and entrepreneurship training but these are accessible only to a small percentage of aspiring entrepreneurs. Moreover, availability of this kind of support is
limited to a few centres within India and is rarely available to millions of aspiring and capable entrepreneurs from villages and small towns or from less privileged sections of the society. A holistic ecosystem for entrepreneurship development must focus on appropriate platforms of education/training/re-skilling to reorient the mindset of Indian youth across all segments of the society. In addition, it must also focus on innovation, creating socio-economic value towards collaboration and must create equal access to opportunities. It must not only focus on new entrepreneurs but also towards facilitating the growth of existing start-ups, micro enterprises, SMEs, and the like. In addition, the ecosystem must facilitate reorienting the mindset of people seeking employment towards innovation-driven entrepreneurial approach to value creation to their employers. In this context, there is a tremendous need for a collaborative approach between government, industry, educational institutions, and the society at large.
• Broadly, a holistic ecosystem cov-ers four broad areas: (1) access to various types of capital; (2) access to entrepreneurial orientation and education; (3) access to networks and opportunities; and (4) access to knowledge and innovations. These four broad areas must be support-ed by appropriate, transparent,
68
Global Entrepreneurship Monitor 2014: India Report
and consistent policy framework at various levels of government. Ac-cess to capital must focus beyond access to financial capital and must also include knowledge capital (R&D institutions, knowledge networks, global partnerships, diaspora, etc.), social capital (expertise-based local communities, collaborative partners across boundaries, knowledge net-works, etc.), and governance capital (co-creation and sharing of value cre-ated, technology management, etc.).
5.4 Key policy Implications
In order to help build such a holistic ecosystem that could propel Indian economy with an equitable socio-economic development focus, there is an urgent need to take a multi-pronged approach to develop appropriate policies in different areas in a cohesive and consistent manner. This also calls for a more refined segmented study of Indian entrepreneurs, based on segments of their focus, education, innovation content, economic and social strata, stage of their existing businesses, etc. In this process, it is also extremely critical that entrepreneurship development policy is well aligned with Make in India, Skill India, Innovate India and similar other major initiatives.
The new business creation process occurs across multiple levels of society, influenced by individual-level factors such as a person’s resources as well as country-level institutions. Thus, the allocation of individual resources to the exploitation of new business opportunities
cannot be considered in isolation from the broader institutional context in which such opportunity exploitation takes place.
• The study suggests that policy-makers should take a targeted approach to stimulate and sustain new business activity by implementing specific policy tools to promote new businesses, depending on the individual resource they want to exploit the most. In India, where culture is characterized by high levels of hierarchy and conservatism, government should focus not only on providing people with easier access to different capital types but also on ensuring that external resources can be combined effectively with the skills and experiences that aspiring entrepreneurs already possess. Otherwise, their knowledge, even if inherently useful for entrepreneurship, may be channelized towards alternative activities that demand less effort and confront less uncertainty.
• Government policy needs to introduce major reforms to make doing business in India easy and fast. Processing of regulatory applications needs to be improved and the business registration process should be made easier and quicker in practice. India needs to move towards a single-window system by adopting a one-stop shop approach. To promote youth and women entrepreneurship a separate and effective policy needs to be structured.
Global Entrepreneurship Monitor 2014: India Report
69
• There is also a need to incentivize private individuals and corporations that provide different types of capital (beyond financial capital) to new ventures.
• The entrepreneurial activities in the country are highly dependent upon the quality of education and the ecosystem that promotes innovation. To encourage the students to opt for entrepreneurship as their career, the government should introduce entrepreneurship in the education system at all levels and orient and prepare students for an entrepreneurship career by imparting their skills, knowledge, and aptitude necessary for successful entrepreneurship journey. This education is useful even for people seeking employment as it helps them to focus on value creation for their employers through their entrepreneurial mindset. Similar programmes must also be introduced to retrain/reskill people wanting to move into new areas.
• Entrepreneurship education needs to be complemented with strong linkages to industry, practitioners, and other supporting experts and role models.
• A comprehensive programme to develop incubation centres, online collaborative platforms for experi-menting, testing of new ideas and their test marketing, and scaling, for
developing interdisciplinary solutions with design thinking, etc. throughout the country, supported by appropri-ate infrastructure and forward and backward linkages.
Realizing that economic empowerment is a necessary condition for, and a major route to social and political empowerment, the government must promote inclusive growth of entrepreneurship, encompassing all sections and regions of society to exploit emerging opportunities and thus achieve equitable entrepreneurial growth in the country. To achieve the goal of inclusive entrepreneurship development, the reasons behind under-representation in entrepreneurial manifestations of these segments must be studied in depth. Measures to encourage inclusive growth of entrepreneurship would include providing access to information, credit, market linkages and managerial competencies, access to different types of capital and motivational programmes. Of course, the focus here will be on promotion of micro enterprises for self-employment and to integrate them into the main stream.
The GEM India team, in collaboration with GEM global, has embarked on a very important initiative that could play a key role in the Indian socio-economic development. The team can potentially undertake a more detailed study that could provide added insights. However, this requires expansion of GEM India partnerships and significant support from both the government as well as the industry.
Global Entrepreneurship Monitor 2013: India ReportRefeRences
Amorós, J.E. and Bosma, N. (2013). Global Entrepreneurship Monitor 2013 Global Report, Global Entrepreneurship Research Association (GERA).
Arenius, P. and Minniti, M. (2005). “Perceptual Variables and Nascent Entrepreneurship.” Small Business Economics 24 3: 233–47.
Arenius, P. and DeClercq, D. (2005). A Network-based Approach on Opportunity Recognition, Small Business Economics, 24, 3, 249–265.
Baron, R. A. (2007). Behavioral and cognitive factors in entrepreneurship: Entrepreneurs as the active element in new venture creation. Strategic Entrepreneurship Journal, 1(1–2), 167–82.
Blanchflower, D. G., Oswald, A., and Stutzer, A. (2001). Latent Entrepreneurship across Nations. European Economic Review 45, 680–91.
Bosma, N. (2011). Extended Report: Entrepreneurs and Entrepreneurial Employees Across the Globe.
Davidsson, P., 2006. Nascent Entrepreneurship. Foundations and Trends in Entrepreneurship 2(1), 1–76.
Douglas, E.J. and Shepherd, D.A. (2005). “Entrepreneurial Human Capital and the Self-employment Decision”, paper presented at the Entrepreneurial Research Exchange, Swinburne University, Melbourne, Australia. February.
Elam, Amanda and Terjesen, Siri A. (2007). Institutional Logics: Gender and Business Creation Across 28 Countries. In Babson College Entrepreneurship Research Conference (BCERC), June 2007, Madrid, Spain.
Grilo, I., and R. Thurik. (2008). “Determinants of Entrepreneurial Engagement Levels in Europe and the US.” Industrial and Corporate Change 17, 6, 1113−45.
Hussain, D., and Windsperger, J. (2010). Multi-unit ownership strategy in franchising: Development of an integrative model. Journal of Marketing Channels, 17(1), 3–31.
Klapper, L. F., & Parker, S. C., 2010. Gender and the Business Environment for New Ferm Creation. (O. U. Press, Ed.) The World Bank Research Observer, 1–21.
Klyver K, Hindle K and Schøtt T. (2007). Who will be an entrepreneur? How cultural mechanisms and social network patterns structure together influence entrepreneurial participation. Proceedings of the 27th Annual Babson College Entrepreneurship Research Conference, IE Business School, Madrid, 7–9 June.
Koellinger, Ph., Minniti, M. and Schade, C. (2007). “I think I can, I think I can”: Overconfidence and entrepreneurial behaviour, Journal of Economic Psychology, Volume 28, Issue 4.
Koellinger, Ph. (2008). The relationship between technology, innovation, and firm performance—Empirical evidence from e-business in Europe, Research Policy, 37(8).
Global Entrepreneurship Monitor 2014: India Report
71
Krueger, N.F., Reilly, M.D., and Carsrud, A.L. (2000). Competing models of entrepreneurial intentions. Journal of Business Venturing, 15 (2), 411-32. http:// dx. doi.org.
Kwon, S. and Arenius, P. (2010). Nations of entrepreneurs: A social capital perspective, Journal of Business Venturing, 25(3)
Minniti M., Arenius, P. and Langowitz, N., (2005). Global Entrepreneurship Monitor 2004 Report on Women and Entrepreneurship, The Centre for Women Leadership at Babson College.
Mitchell, R. K., Busenitz, L. W., Bird, B., Gaglio, C. M., McMullen, J. S., Morse, E. A., and Smith, J. B. (2007). The central question in entrepreneurial cognition research 2007. Entrepreneurship Theory and Practice, 31(1), 1–27.
Reynolds, P. D., Bygrave, W. D., Autio, E., Cox, L. W. and Hay, M. (2002). Global Entrepreneurship Monitor 2002 Executive Report. Babson College, Ewing Marion Kauffman Foundation and London Business School
Saraf, N. and Banerjee, B. (2013). Global Entrepreneurship Monitor 2014 India Report, Emerald Group Publishing Limited, New Delhi
Schumpeter, J. A. (1934). The Theory of Economic Developement. Cambridge, MA: Harvard University Press.
Schwab, K. and Sala-i-Martín, X. (2014). The Global Competitiveness Report, The World Economic Forum.
Shane, S., Venkataraman, S., (2000) “The promise of entrepreneurship as a field of research” Acad. Manage. Rev. 25(1), 217–26.
Slavica S., Amorós, J.E. and Arreola D.M. (2014). Global Entrepreneurship Monitor 2014 Global Report, Global Entrepreneurship Research Association (GERA).
Stefanovic, I., Prokic, S. and Rankovic, L. (2010). Motivational and Success Factors of Entrepreneurs: the Evidence from a Developing Country. Zb. Rad. Ekon. Fak. Rij. 2010. 28(2), 251–69.
Shukla, S. and Awasthi, D.N. (2012). “Gen Y and Entrepreneurship: The Enablers, The Killers and the Eco-system”, in Perfect Professional: Enabling Managers to Make a Difference.
Tang, J., Kacmar, K. M., and Busenitz, L. W. (2012). Alertness in the pursuit of new opportunities. Journal of Business Venturing, 27(1), 77–94.
Van Stel, A., Carree, M., and Thurik, R. (2005). The effect of entrepreneurial activity on national economic growth. Small Business Economics, 23, 311–321
Wennekers, S., A. Van Stel, M. Carree and A.R. Thurik (2010). The relationship between entrepreneurship and economic development: Is it U-shaped? ”Foundations and Trends in Entrepreneurship, 6(3), 167–237.
Wong, B., Ho Y., and Autio, E. (2005). Entrepreneurship, innovation and economic growth: Evidence from GEM data. Small Business Economics, 24(3), 335–50.
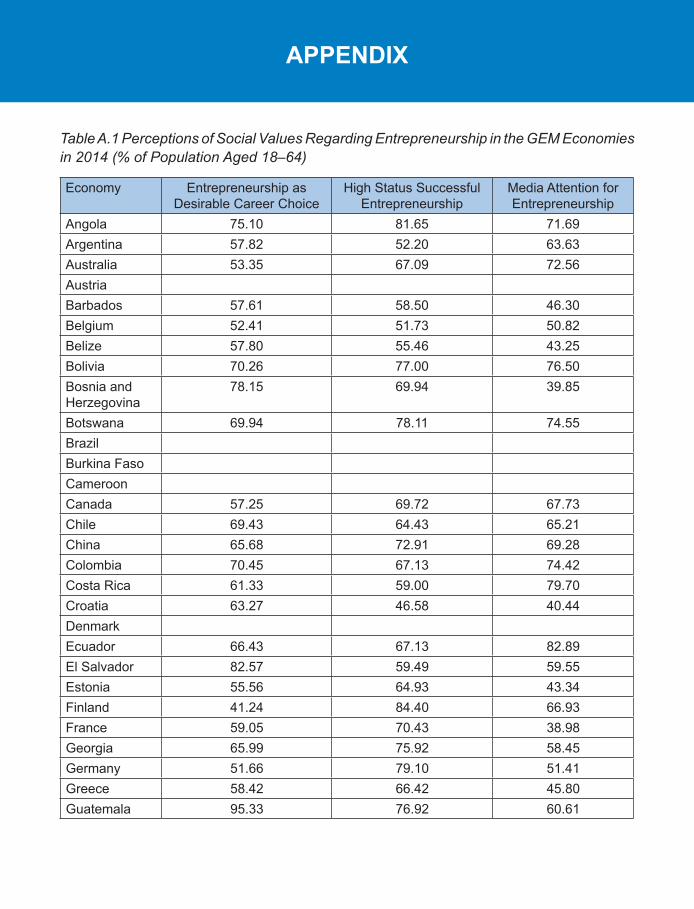
Global Entrepreneurship Monitor 2013: India ReportAPPEndix
Economy Entrepreneurship as Desirable Career Choice
High Status Successful Entrepreneurship
Media Attention for Entrepreneurship
Angola 75.10 81.65 71.69Argentina 57.82 52.20 63.63Australia 53.35 67.09 72.56AustriaBarbados 57.61 58.50 46.30Belgium 52.41 51.73 50.82Belize 57.80 55.46 43.25Bolivia 70.26 77.00 76.50Bosnia and Herzegovina
78.15 69.94 39.85
Botswana 69.94 78.11 74.55BrazilBurkina FasoCameroonCanada 57.25 69.72 67.73Chile 69.43 64.43 65.21China 65.68 72.91 69.28Colombia 70.45 67.13 74.42Costa Rica 61.33 59.00 79.70Croatia 63.27 46.58 40.44DenmarkEcuador 66.43 67.13 82.89El Salvador 82.57 59.49 59.55Estonia 55.56 64.93 43.34Finland 41.24 84.40 66.93France 59.05 70.43 38.98Georgia 65.99 75.92 58.45Germany 51.66 79.10 51.41Greece 58.42 66.42 45.80Guatemala 95.33 76.92 60.61
Table A.1 Perceptions of Social Values Regarding Entrepreneurship in the GEM Economies in 2014 (% of Population Aged 18–64)
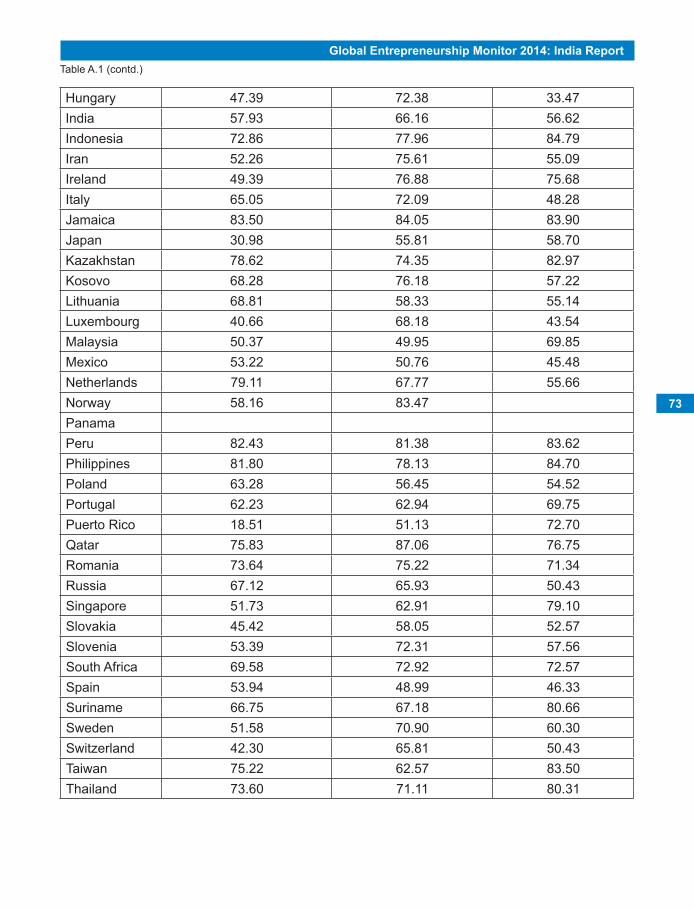
Global Entrepreneurship Monitor 2014: India Report
73
Hungary 47.39 72.38 33.47India 57.93 66.16 56.62Indonesia 72.86 77.96 84.79Iran 52.26 75.61 55.09Ireland 49.39 76.88 75.68Italy 65.05 72.09 48.28Jamaica 83.50 84.05 83.90Japan 30.98 55.81 58.70Kazakhstan 78.62 74.35 82.97Kosovo 68.28 76.18 57.22Lithuania 68.81 58.33 55.14Luxembourg 40.66 68.18 43.54Malaysia 50.37 49.95 69.85Mexico 53.22 50.76 45.48Netherlands 79.11 67.77 55.66Norway 58.16 83.47PanamaPeru 82.43 81.38 83.62Philippines 81.80 78.13 84.70Poland 63.28 56.45 54.52Portugal 62.23 62.94 69.75Puerto Rico 18.51 51.13 72.70Qatar 75.83 87.06 76.75Romania 73.64 75.22 71.34Russia 67.12 65.93 50.43Singapore 51.73 62.91 79.10Slovakia 45.42 58.05 52.57Slovenia 53.39 72.31 57.56South Africa 69.58 72.92 72.57Spain 53.94 48.99 46.33Suriname 66.75 67.18 80.66Sweden 51.58 70.90 60.30Switzerland 42.30 65.81 50.43Taiwan 75.22 62.57 83.50Thailand 73.60 71.11 80.31
Table A.1 (contd.)
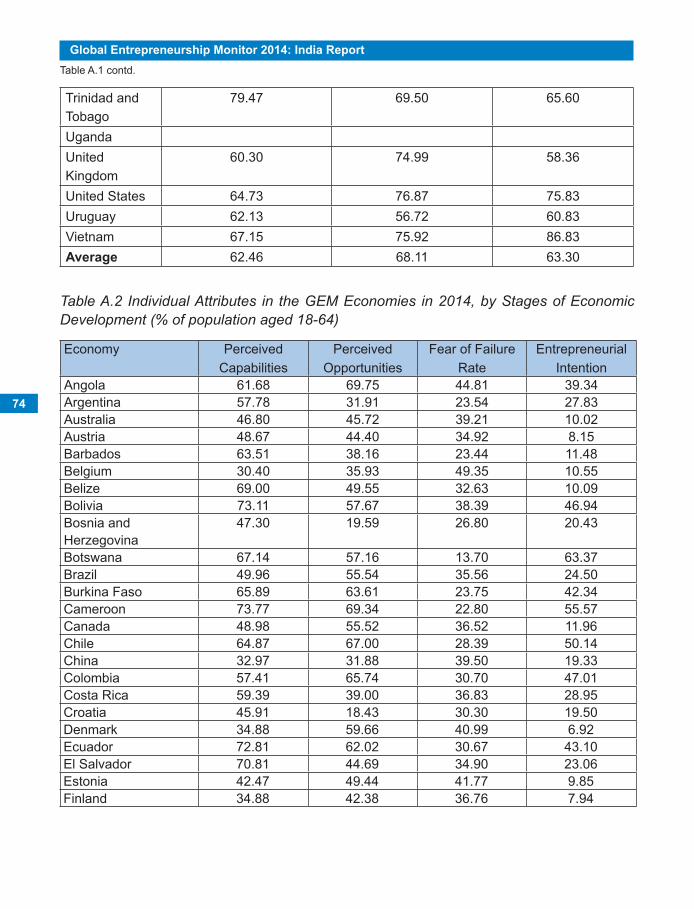
74
Global Entrepreneurship Monitor 2014: India Report
Trinidad and Tobago
79.47 69.50 65.60
UgandaUnited Kingdom
60.30 74.99 58.36
United States 64.73 76.87 75.83Uruguay 62.13 56.72 60.83Vietnam 67.15 75.92 86.83Average 62.46 68.11 63.30
Economy Perceived Capabilities
Perceived Opportunities
Fear of Failure Rate
Entrepreneurial Intention
Angola 61.68 69.75 44.81 39.34Argentina 57.78 31.91 23.54 27.83Australia 46.80 45.72 39.21 10.02Austria 48.67 44.40 34.92 8.15Barbados 63.51 38.16 23.44 11.48Belgium 30.40 35.93 49.35 10.55Belize 69.00 49.55 32.63 10.09Bolivia 73.11 57.67 38.39 46.94Bosnia and Herzegovina
47.30 19.59 26.80 20.43
Botswana 67.14 57.16 13.70 63.37Brazil 49.96 55.54 35.56 24.50Burkina Faso 65.89 63.61 23.75 42.34Cameroon 73.77 69.34 22.80 55.57Canada 48.98 55.52 36.52 11.96Chile 64.87 67.00 28.39 50.14China 32.97 31.88 39.50 19.33Colombia 57.41 65.74 30.70 47.01Costa Rica 59.39 39.00 36.83 28.95Croatia 45.91 18.43 30.30 19.50Denmark 34.88 59.66 40.99 6.92Ecuador 72.81 62.02 30.67 43.10El Salvador 70.81 44.69 34.90 23.06Estonia 42.47 49.44 41.77 9.85Finland 34.88 42.38 36.76 7.94
Table A.2 Individual Attributes in the GEM Economies in 2014, by Stages of Economic Development (% of population aged 18-64)
Table A.1 contd.
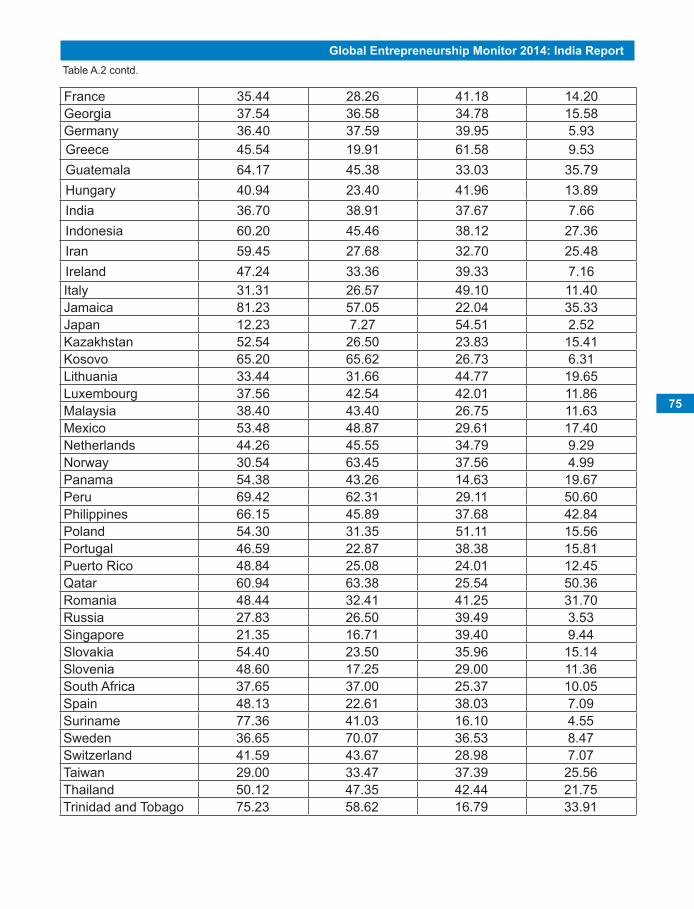
Global Entrepreneurship Monitor 2014: India Report
75
France 35.44 28.26 41.18 14.20Georgia 37.54 36.58 34.78 15.58Germany 36.40 37.59 39.95 5.93Greece 45.54 19.91 61.58 9.53Guatemala 64.17 45.38 33.03 35.79Hungary 40.94 23.40 41.96 13.89India 36.70 38.91 37.67 7.66Indonesia 60.20 45.46 38.12 27.36Iran 59.45 27.68 32.70 25.48Ireland 47.24 33.36 39.33 7.16Italy 31.31 26.57 49.10 11.40Jamaica 81.23 57.05 22.04 35.33Japan 12.23 7.27 54.51 2.52Kazakhstan 52.54 26.50 23.83 15.41Kosovo 65.20 65.62 26.73 6.31Lithuania 33.44 31.66 44.77 19.65Luxembourg 37.56 42.54 42.01 11.86Malaysia 38.40 43.40 26.75 11.63Mexico 53.48 48.87 29.61 17.40Netherlands 44.26 45.55 34.79 9.29Norway 30.54 63.45 37.56 4.99Panama 54.38 43.26 14.63 19.67Peru 69.42 62.31 29.11 50.60Philippines 66.15 45.89 37.68 42.84Poland 54.30 31.35 51.11 15.56Portugal 46.59 22.87 38.38 15.81Puerto Rico 48.84 25.08 24.01 12.45Qatar 60.94 63.38 25.54 50.36Romania 48.44 32.41 41.25 31.70Russia 27.83 26.50 39.49 3.53Singapore 21.35 16.71 39.40 9.44Slovakia 54.40 23.50 35.96 15.14Slovenia 48.60 17.25 29.00 11.36South Africa 37.65 37.00 25.37 10.05Spain 48.13 22.61 38.03 7.09Suriname 77.36 41.03 16.10 4.55Sweden 36.65 70.07 36.53 8.47Switzerland 41.59 43.67 28.98 7.07Taiwan 29.00 33.47 37.39 25.56Thailand 50.12 47.35 42.44 21.75Trinidad and Tobago 75.23 58.62 16.79 33.91
Table A.2 contd.
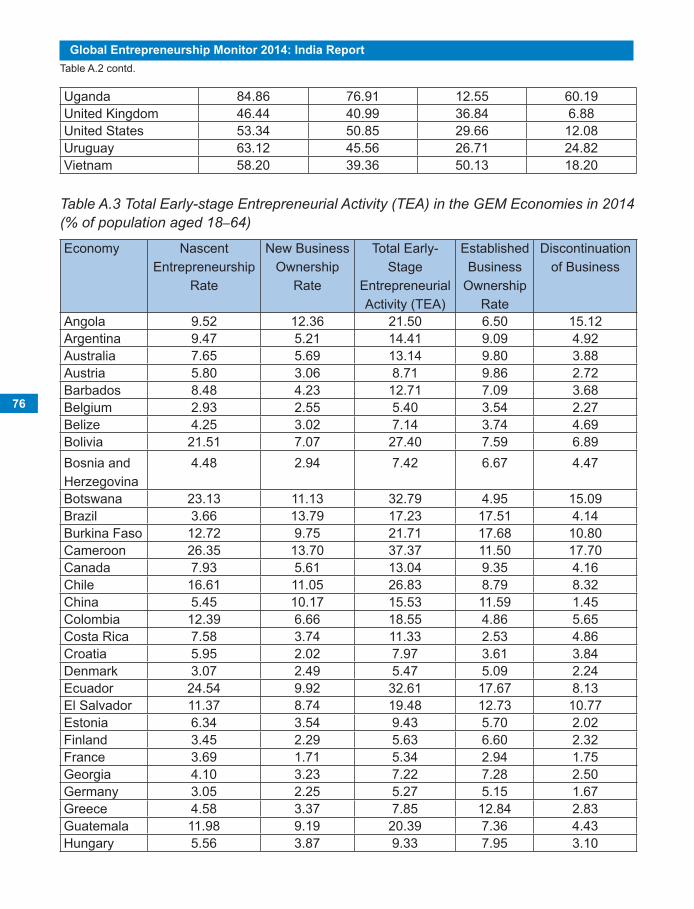
76
Global Entrepreneurship Monitor 2014: India Report
Uganda 84.86 76.91 12.55 60.19United Kingdom 46.44 40.99 36.84 6.88United States 53.34 50.85 29.66 12.08Uruguay 63.12 45.56 26.71 24.82Vietnam 58.20 39.36 50.13 18.20
Economy Nascent Entrepreneurship
Rate
New Business Ownership
Rate
Total Early-Stage
Entrepreneurial Activity (TEA)
Established Business
Ownership Rate
Discontinuation of Business
Angola 9.52 12.36 21.50 6.50 15.12Argentina 9.47 5.21 14.41 9.09 4.92Australia 7.65 5.69 13.14 9.80 3.88Austria 5.80 3.06 8.71 9.86 2.72Barbados 8.48 4.23 12.71 7.09 3.68Belgium 2.93 2.55 5.40 3.54 2.27Belize 4.25 3.02 7.14 3.74 4.69Bolivia 21.51 7.07 27.40 7.59 6.89Bosnia and Herzegovina
4.48 2.94 7.42 6.67 4.47
Botswana 23.13 11.13 32.79 4.95 15.09Brazil 3.66 13.79 17.23 17.51 4.14Burkina Faso 12.72 9.75 21.71 17.68 10.80Cameroon 26.35 13.70 37.37 11.50 17.70Canada 7.93 5.61 13.04 9.35 4.16Chile 16.61 11.05 26.83 8.79 8.32China 5.45 10.17 15.53 11.59 1.45Colombia 12.39 6.66 18.55 4.86 5.65Costa Rica 7.58 3.74 11.33 2.53 4.86Croatia 5.95 2.02 7.97 3.61 3.84Denmark 3.07 2.49 5.47 5.09 2.24Ecuador 24.54 9.92 32.61 17.67 8.13El Salvador 11.37 8.74 19.48 12.73 10.77Estonia 6.34 3.54 9.43 5.70 2.02Finland 3.45 2.29 5.63 6.60 2.32France 3.69 1.71 5.34 2.94 1.75Georgia 4.10 3.23 7.22 7.28 2.50Germany 3.05 2.25 5.27 5.15 1.67Greece 4.58 3.37 7.85 12.84 2.83Guatemala 11.98 9.19 20.39 7.36 4.43Hungary 5.56 3.87 9.33 7.95 3.10
Table A.3 Total Early-stage Entrepreneurial Activity (TEA) in the GEM Economies in 2014 (% of population aged 18–64)
Table A.2 contd.
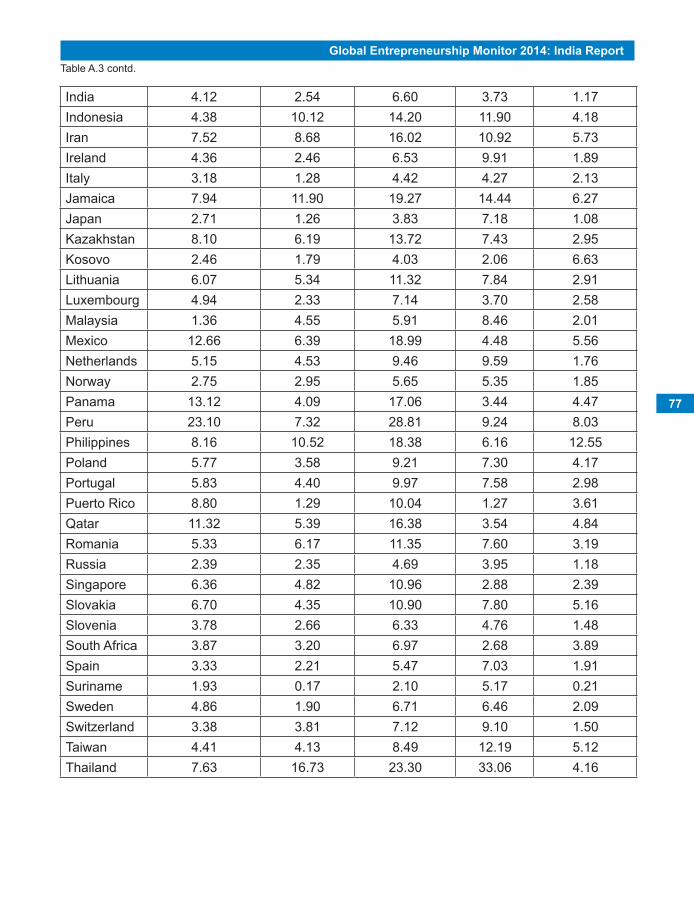
Global Entrepreneurship Monitor 2014: India Report
77
India 4.12 2.54 6.60 3.73 1.17Indonesia 4.38 10.12 14.20 11.90 4.18Iran 7.52 8.68 16.02 10.92 5.73Ireland 4.36 2.46 6.53 9.91 1.89Italy 3.18 1.28 4.42 4.27 2.13Jamaica 7.94 11.90 19.27 14.44 6.27Japan 2.71 1.26 3.83 7.18 1.08Kazakhstan 8.10 6.19 13.72 7.43 2.95Kosovo 2.46 1.79 4.03 2.06 6.63Lithuania 6.07 5.34 11.32 7.84 2.91Luxembourg 4.94 2.33 7.14 3.70 2.58Malaysia 1.36 4.55 5.91 8.46 2.01Mexico 12.66 6.39 18.99 4.48 5.56Netherlands 5.15 4.53 9.46 9.59 1.76Norway 2.75 2.95 5.65 5.35 1.85Panama 13.12 4.09 17.06 3.44 4.47Peru 23.10 7.32 28.81 9.24 8.03Philippines 8.16 10.52 18.38 6.16 12.55Poland 5.77 3.58 9.21 7.30 4.17Portugal 5.83 4.40 9.97 7.58 2.98Puerto Rico 8.80 1.29 10.04 1.27 3.61Qatar 11.32 5.39 16.38 3.54 4.84Romania 5.33 6.17 11.35 7.60 3.19Russia 2.39 2.35 4.69 3.95 1.18Singapore 6.36 4.82 10.96 2.88 2.39Slovakia 6.70 4.35 10.90 7.80 5.16Slovenia 3.78 2.66 6.33 4.76 1.48South Africa 3.87 3.20 6.97 2.68 3.89Spain 3.33 2.21 5.47 7.03 1.91Suriname 1.93 0.17 2.10 5.17 0.21Sweden 4.86 1.90 6.71 6.46 2.09Switzerland 3.38 3.81 7.12 9.10 1.50Taiwan 4.41 4.13 8.49 12.19 5.12Thailand 7.63 16.73 23.30 33.06 4.16
Table A.3 contd.
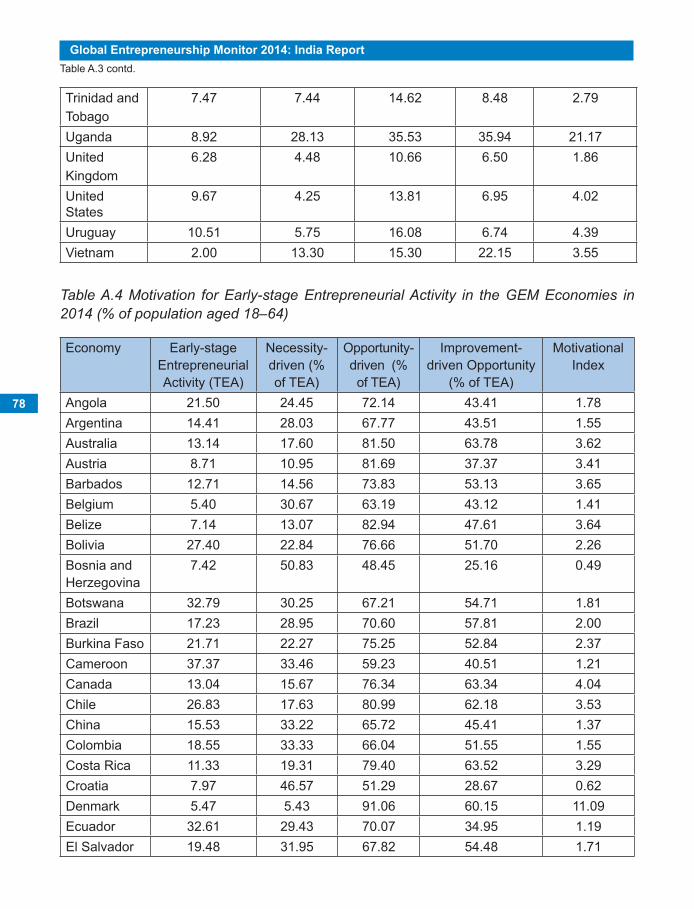
78
Global Entrepreneurship Monitor 2014: India Report
Trinidad and Tobago
7.47 7.44 14.62 8.48 2.79
Uganda 8.92 28.13 35.53 35.94 21.17United Kingdom
6.28 4.48 10.66 6.50 1.86
United States
9.67 4.25 13.81 6.95 4.02
Uruguay 10.51 5.75 16.08 6.74 4.39Vietnam 2.00 13.30 15.30 22.15 3.55
Economy Early-stage Entrepreneurial Activity (TEA)
Necessity-driven (% of TEA)
Opportunity-driven (% of TEA)
Improvement-driven Opportunity
(% of TEA)
Motivational Index
Angola 21.50 24.45 72.14 43.41 1.78Argentina 14.41 28.03 67.77 43.51 1.55Australia 13.14 17.60 81.50 63.78 3.62Austria 8.71 10.95 81.69 37.37 3.41Barbados 12.71 14.56 73.83 53.13 3.65Belgium 5.40 30.67 63.19 43.12 1.41Belize 7.14 13.07 82.94 47.61 3.64Bolivia 27.40 22.84 76.66 51.70 2.26Bosnia and Herzegovina
7.42 50.83 48.45 25.16 0.49
Botswana 32.79 30.25 67.21 54.71 1.81Brazil 17.23 28.95 70.60 57.81 2.00Burkina Faso 21.71 22.27 75.25 52.84 2.37Cameroon 37.37 33.46 59.23 40.51 1.21Canada 13.04 15.67 76.34 63.34 4.04Chile 26.83 17.63 80.99 62.18 3.53China 15.53 33.22 65.72 45.41 1.37Colombia 18.55 33.33 66.04 51.55 1.55Costa Rica 11.33 19.31 79.40 63.52 3.29Croatia 7.97 46.57 51.29 28.67 0.62Denmark 5.47 5.43 91.06 60.15 11.09Ecuador 32.61 29.43 70.07 34.95 1.19El Salvador 19.48 31.95 67.82 54.48 1.71
Table A.4 Motivation for Early-stage Entrepreneurial Activity in the GEM Economies in 2014 (% of population aged 18–64)
Table A.3 contd.
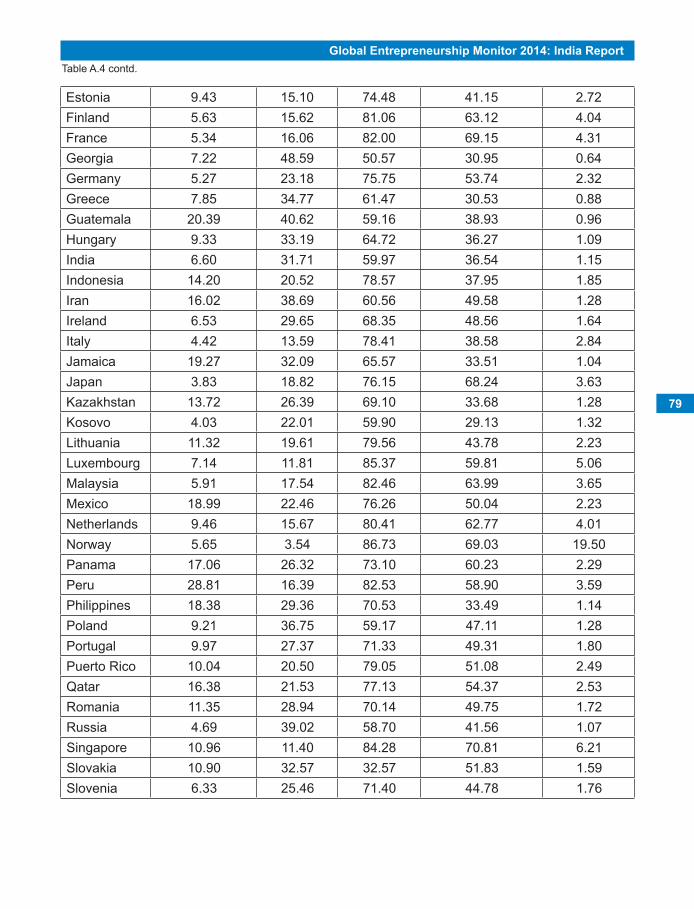
Global Entrepreneurship Monitor 2014: India Report
79
Estonia 9.43 15.10 74.48 41.15 2.72Finland 5.63 15.62 81.06 63.12 4.04France 5.34 16.06 82.00 69.15 4.31Georgia 7.22 48.59 50.57 30.95 0.64Germany 5.27 23.18 75.75 53.74 2.32Greece 7.85 34.77 61.47 30.53 0.88Guatemala 20.39 40.62 59.16 38.93 0.96Hungary 9.33 33.19 64.72 36.27 1.09India 6.60 31.71 59.97 36.54 1.15Indonesia 14.20 20.52 78.57 37.95 1.85Iran 16.02 38.69 60.56 49.58 1.28Ireland 6.53 29.65 68.35 48.56 1.64Italy 4.42 13.59 78.41 38.58 2.84Jamaica 19.27 32.09 65.57 33.51 1.04Japan 3.83 18.82 76.15 68.24 3.63Kazakhstan 13.72 26.39 69.10 33.68 1.28Kosovo 4.03 22.01 59.90 29.13 1.32Lithuania 11.32 19.61 79.56 43.78 2.23Luxembourg 7.14 11.81 85.37 59.81 5.06Malaysia 5.91 17.54 82.46 63.99 3.65Mexico 18.99 22.46 76.26 50.04 2.23Netherlands 9.46 15.67 80.41 62.77 4.01Norway 5.65 3.54 86.73 69.03 19.50Panama 17.06 26.32 73.10 60.23 2.29Peru 28.81 16.39 82.53 58.90 3.59Philippines 18.38 29.36 70.53 33.49 1.14Poland 9.21 36.75 59.17 47.11 1.28Portugal 9.97 27.37 71.33 49.31 1.80Puerto Rico 10.04 20.50 79.05 51.08 2.49Qatar 16.38 21.53 77.13 54.37 2.53Romania 11.35 28.94 70.14 49.75 1.72Russia 4.69 39.02 58.70 41.56 1.07Singapore 10.96 11.40 84.28 70.81 6.21Slovakia 10.90 32.57 32.57 51.83 1.59Slovenia 6.33 25.46 71.40 44.78 1.76
Table A.4 contd.
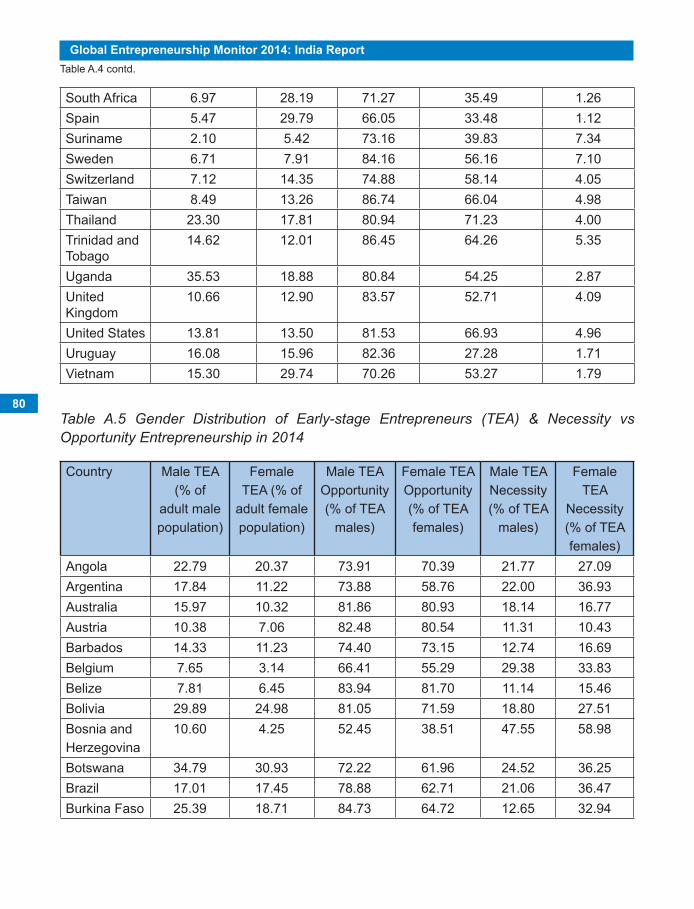
80
Global Entrepreneurship Monitor 2014: India Report
South Africa 6.97 28.19 71.27 35.49 1.26Spain 5.47 29.79 66.05 33.48 1.12Suriname 2.10 5.42 73.16 39.83 7.34Sweden 6.71 7.91 84.16 56.16 7.10Switzerland 7.12 14.35 74.88 58.14 4.05Taiwan 8.49 13.26 86.74 66.04 4.98Thailand 23.30 17.81 80.94 71.23 4.00Trinidad and Tobago
14.62 12.01 86.45 64.26 5.35
Uganda 35.53 18.88 80.84 54.25 2.87United Kingdom
10.66 12.90 83.57 52.71 4.09
United States 13.81 13.50 81.53 66.93 4.96Uruguay 16.08 15.96 82.36 27.28 1.71Vietnam 15.30 29.74 70.26 53.27 1.79
Country Male TEA (% of
adult male population)
Female TEA (% of
adult female population)
Male TEA Opportunity (% of TEA
males)
Female TEA Opportunity (% of TEA females)
Male TEA Necessity (% of TEA
males)
Female TEA
Necessity (% of TEA females)
Angola 22.79 20.37 73.91 70.39 21.77 27.09Argentina 17.84 11.22 73.88 58.76 22.00 36.93Australia 15.97 10.32 81.86 80.93 18.14 16.77Austria 10.38 7.06 82.48 80.54 11.31 10.43Barbados 14.33 11.23 74.40 73.15 12.74 16.69Belgium 7.65 3.14 66.41 55.29 29.38 33.83Belize 7.81 6.45 83.94 81.70 11.14 15.46Bolivia 29.89 24.98 81.05 71.59 18.80 27.51Bosnia and Herzegovina
10.60 4.25 52.45 38.51 47.55 58.98
Botswana 34.79 30.93 72.22 61.96 24.52 36.25Brazil 17.01 17.45 78.88 62.71 21.06 36.47Burkina Faso 25.39 18.71 84.73 64.72 12.65 32.94
Table A.5 Gender Distribution of Early-stage Entrepreneurs (TEA) & Necessity vs Opportunity Entrepreneurship in 2014
Table A.4 contd.
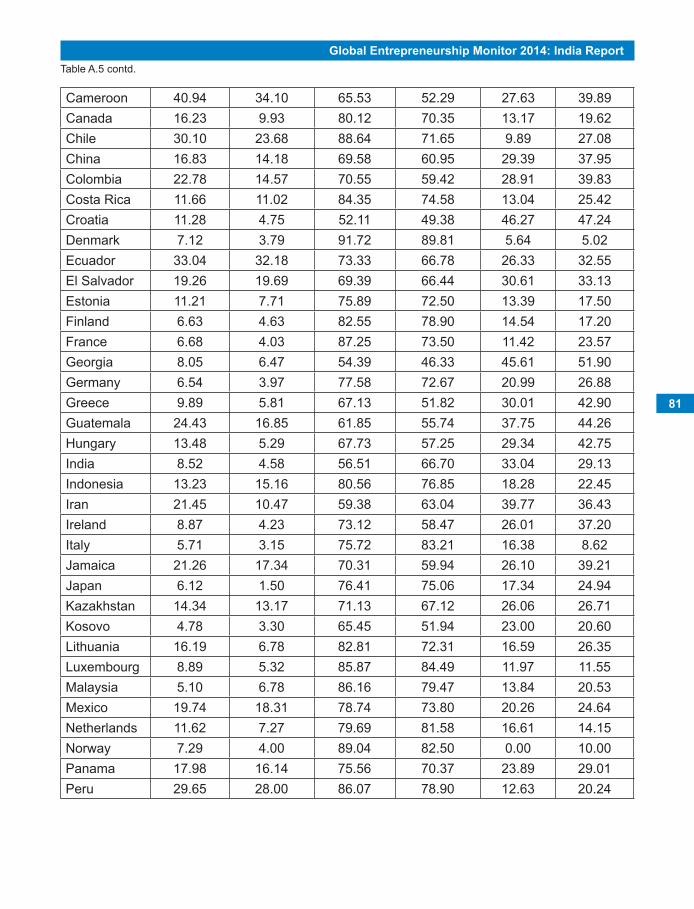
Global Entrepreneurship Monitor 2014: India Report
81
Cameroon 40.94 34.10 65.53 52.29 27.63 39.89Canada 16.23 9.93 80.12 70.35 13.17 19.62Chile 30.10 23.68 88.64 71.65 9.89 27.08China 16.83 14.18 69.58 60.95 29.39 37.95Colombia 22.78 14.57 70.55 59.42 28.91 39.83Costa Rica 11.66 11.02 84.35 74.58 13.04 25.42Croatia 11.28 4.75 52.11 49.38 46.27 47.24Denmark 7.12 3.79 91.72 89.81 5.64 5.02Ecuador 33.04 32.18 73.33 66.78 26.33 32.55El Salvador 19.26 19.69 69.39 66.44 30.61 33.13Estonia 11.21 7.71 75.89 72.50 13.39 17.50Finland 6.63 4.63 82.55 78.90 14.54 17.20France 6.68 4.03 87.25 73.50 11.42 23.57Georgia 8.05 6.47 54.39 46.33 45.61 51.90Germany 6.54 3.97 77.58 72.67 20.99 26.88Greece 9.89 5.81 67.13 51.82 30.01 42.90Guatemala 24.43 16.85 61.85 55.74 37.75 44.26Hungary 13.48 5.29 67.73 57.25 29.34 42.75India 8.52 4.58 56.51 66.70 33.04 29.13Indonesia 13.23 15.16 80.56 76.85 18.28 22.45Iran 21.45 10.47 59.38 63.04 39.77 36.43Ireland 8.87 4.23 73.12 58.47 26.01 37.20Italy 5.71 3.15 75.72 83.21 16.38 8.62Jamaica 21.26 17.34 70.31 59.94 26.10 39.21Japan 6.12 1.50 76.41 75.06 17.34 24.94Kazakhstan 14.34 13.17 71.13 67.12 26.06 26.71Kosovo 4.78 3.30 65.45 51.94 23.00 20.60Lithuania 16.19 6.78 82.81 72.31 16.59 26.35Luxembourg 8.89 5.32 85.87 84.49 11.97 11.55Malaysia 5.10 6.78 86.16 79.47 13.84 20.53Mexico 19.74 18.31 78.74 73.80 20.26 24.64Netherlands 11.62 7.27 79.69 81.58 16.61 14.15Norway 7.29 4.00 89.04 82.50 0.00 10.00Panama 17.98 16.14 75.56 70.37 23.89 29.01Peru 29.65 28.00 86.07 78.90 12.63 20.24
Table A.5 contd.
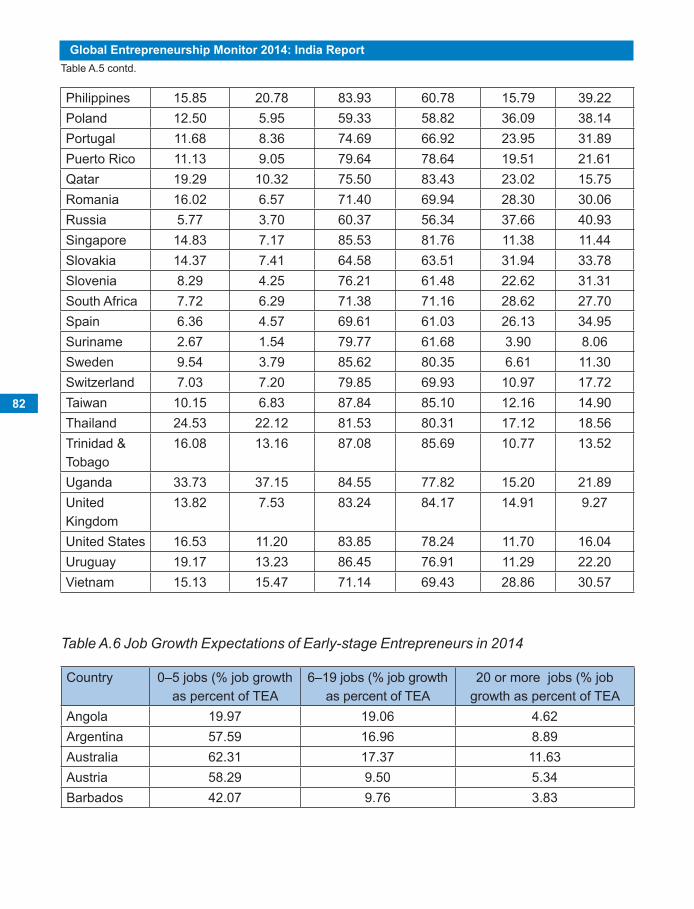
82
Global Entrepreneurship Monitor 2014: India Report
Philippines 15.85 20.78 83.93 60.78 15.79 39.22Poland 12.50 5.95 59.33 58.82 36.09 38.14Portugal 11.68 8.36 74.69 66.92 23.95 31.89Puerto Rico 11.13 9.05 79.64 78.64 19.51 21.61Qatar 19.29 10.32 75.50 83.43 23.02 15.75Romania 16.02 6.57 71.40 69.94 28.30 30.06Russia 5.77 3.70 60.37 56.34 37.66 40.93Singapore 14.83 7.17 85.53 81.76 11.38 11.44Slovakia 14.37 7.41 64.58 63.51 31.94 33.78Slovenia 8.29 4.25 76.21 61.48 22.62 31.31South Africa 7.72 6.29 71.38 71.16 28.62 27.70Spain 6.36 4.57 69.61 61.03 26.13 34.95Suriname 2.67 1.54 79.77 61.68 3.90 8.06Sweden 9.54 3.79 85.62 80.35 6.61 11.30Switzerland 7.03 7.20 79.85 69.93 10.97 17.72Taiwan 10.15 6.83 87.84 85.10 12.16 14.90Thailand 24.53 22.12 81.53 80.31 17.12 18.56Trinidad & Tobago
16.08 13.16 87.08 85.69 10.77 13.52
Uganda 33.73 37.15 84.55 77.82 15.20 21.89United Kingdom
13.82 7.53 83.24 84.17 14.91 9.27
United States 16.53 11.20 83.85 78.24 11.70 16.04Uruguay 19.17 13.23 86.45 76.91 11.29 22.20Vietnam 15.13 15.47 71.14 69.43 28.86 30.57
Country 0–5 jobs (% job growth as percent of TEA
6–19 jobs (% job growth as percent of TEA
20 or more jobs (% job growth as percent of TEA
Angola 19.97 19.06 4.62Argentina 57.59 16.96 8.89Australia 62.31 17.37 11.63Austria 58.29 9.50 5.34Barbados 42.07 9.76 3.83
Table A.6 Job Growth Expectations of Early-stage Entrepreneurs in 2014
Table A.5 contd.
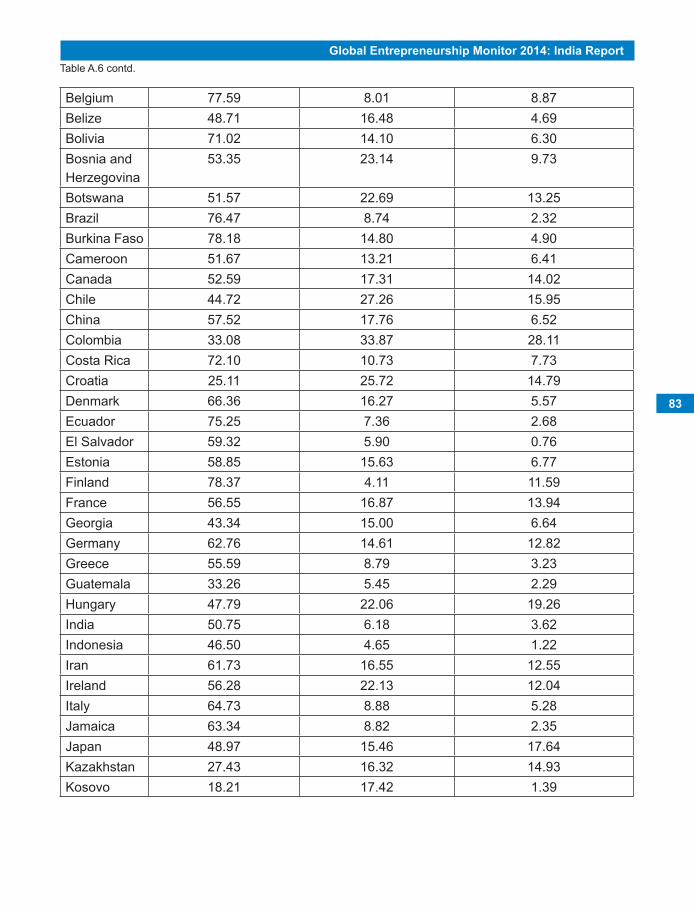
Global Entrepreneurship Monitor 2014: India Report
83
Belgium 77.59 8.01 8.87Belize 48.71 16.48 4.69Bolivia 71.02 14.10 6.30Bosnia and Herzegovina
53.35 23.14 9.73
Botswana 51.57 22.69 13.25Brazil 76.47 8.74 2.32Burkina Faso 78.18 14.80 4.90Cameroon 51.67 13.21 6.41Canada 52.59 17.31 14.02Chile 44.72 27.26 15.95China 57.52 17.76 6.52Colombia 33.08 33.87 28.11Costa Rica 72.10 10.73 7.73Croatia 25.11 25.72 14.79Denmark 66.36 16.27 5.57Ecuador 75.25 7.36 2.68El Salvador 59.32 5.90 0.76Estonia 58.85 15.63 6.77Finland 78.37 4.11 11.59France 56.55 16.87 13.94Georgia 43.34 15.00 6.64Germany 62.76 14.61 12.82Greece 55.59 8.79 3.23Guatemala 33.26 5.45 2.29Hungary 47.79 22.06 19.26India 50.75 6.18 3.62Indonesia 46.50 4.65 1.22Iran 61.73 16.55 12.55Ireland 56.28 22.13 12.04Italy 64.73 8.88 5.28Jamaica 63.34 8.82 2.35Japan 48.97 15.46 17.64Kazakhstan 27.43 16.32 14.93Kosovo 18.21 17.42 1.39
Table A.6 contd.
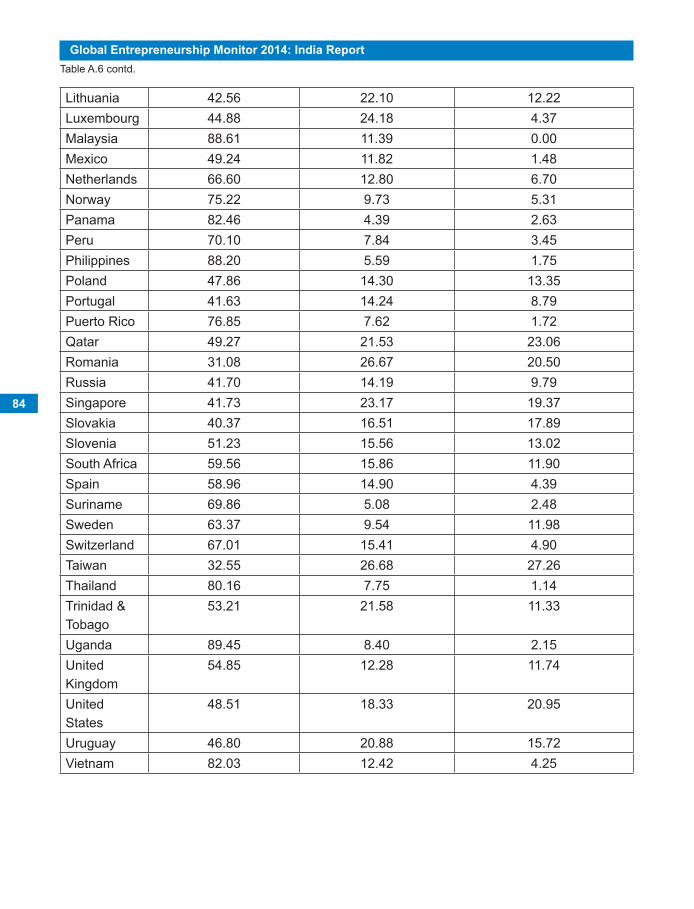
84
Global Entrepreneurship Monitor 2014: India Report
Lithuania 42.56 22.10 12.22Luxembourg 44.88 24.18 4.37Malaysia 88.61 11.39 0.00Mexico 49.24 11.82 1.48Netherlands 66.60 12.80 6.70Norway 75.22 9.73 5.31Panama 82.46 4.39 2.63Peru 70.10 7.84 3.45Philippines 88.20 5.59 1.75Poland 47.86 14.30 13.35Portugal 41.63 14.24 8.79Puerto Rico 76.85 7.62 1.72Qatar 49.27 21.53 23.06Romania 31.08 26.67 20.50Russia 41.70 14.19 9.79Singapore 41.73 23.17 19.37Slovakia 40.37 16.51 17.89Slovenia 51.23 15.56 13.02South Africa 59.56 15.86 11.90Spain 58.96 14.90 4.39Suriname 69.86 5.08 2.48Sweden 63.37 9.54 11.98Switzerland 67.01 15.41 4.90Taiwan 32.55 26.68 27.26Thailand 80.16 7.75 1.14Trinidad & Tobago
53.21 21.58 11.33
Uganda 89.45 8.40 2.15United Kingdom
54.85 12.28 11.74
United States
48.51 18.33 20.95
Uruguay 46.80 20.88 15.72Vietnam 82.03 12.42 4.25
Table A.6 contd.
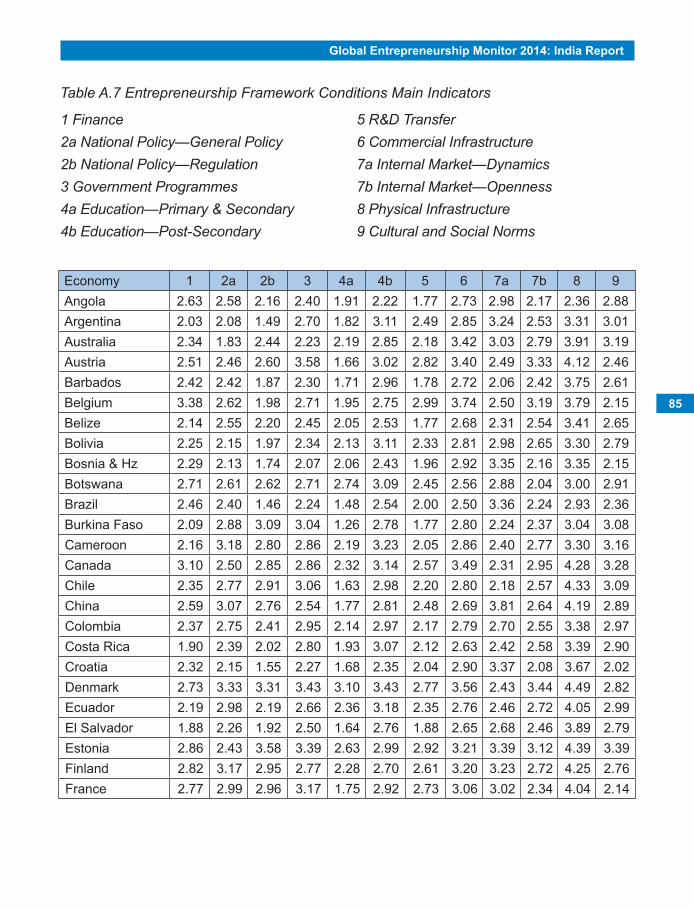
Global Entrepreneurship Monitor 2014: India Report
85
Economy 1 2a 2b 3 4a 4b 5 6 7a 7b 8 9Angola 2.63 2.58 2.16 2.40 1.91 2.22 1.77 2.73 2.98 2.17 2.36 2.88Argentina 2.03 2.08 1.49 2.70 1.82 3.11 2.49 2.85 3.24 2.53 3.31 3.01Australia 2.34 1.83 2.44 2.23 2.19 2.85 2.18 3.42 3.03 2.79 3.91 3.19Austria 2.51 2.46 2.60 3.58 1.66 3.02 2.82 3.40 2.49 3.33 4.12 2.46Barbados 2.42 2.42 1.87 2.30 1.71 2.96 1.78 2.72 2.06 2.42 3.75 2.61Belgium 3.38 2.62 1.98 2.71 1.95 2.75 2.99 3.74 2.50 3.19 3.79 2.15Belize 2.14 2.55 2.20 2.45 2.05 2.53 1.77 2.68 2.31 2.54 3.41 2.65Bolivia 2.25 2.15 1.97 2.34 2.13 3.11 2.33 2.81 2.98 2.65 3.30 2.79Bosnia & Hz 2.29 2.13 1.74 2.07 2.06 2.43 1.96 2.92 3.35 2.16 3.35 2.15Botswana 2.71 2.61 2.62 2.71 2.74 3.09 2.45 2.56 2.88 2.04 3.00 2.91Brazil 2.46 2.40 1.46 2.24 1.48 2.54 2.00 2.50 3.36 2.24 2.93 2.36Burkina Faso 2.09 2.88 3.09 3.04 1.26 2.78 1.77 2.80 2.24 2.37 3.04 3.08Cameroon 2.16 3.18 2.80 2.86 2.19 3.23 2.05 2.86 2.40 2.77 3.30 3.16Canada 3.10 2.50 2.85 2.86 2.32 3.14 2.57 3.49 2.31 2.95 4.28 3.28Chile 2.35 2.77 2.91 3.06 1.63 2.98 2.20 2.80 2.18 2.57 4.33 3.09China 2.59 3.07 2.76 2.54 1.77 2.81 2.48 2.69 3.81 2.64 4.19 2.89Colombia 2.37 2.75 2.41 2.95 2.14 2.97 2.17 2.79 2.70 2.55 3.38 2.97Costa Rica 1.90 2.39 2.02 2.80 1.93 3.07 2.12 2.63 2.42 2.58 3.39 2.90Croatia 2.32 2.15 1.55 2.27 1.68 2.35 2.04 2.90 3.37 2.08 3.67 2.02Denmark 2.73 3.33 3.31 3.43 3.10 3.43 2.77 3.56 2.43 3.44 4.49 2.82Ecuador 2.19 2.98 2.19 2.66 2.36 3.18 2.35 2.76 2.46 2.72 4.05 2.99El Salvador 1.88 2.26 1.92 2.50 1.64 2.76 1.88 2.65 2.68 2.46 3.89 2.79Estonia 2.86 2.43 3.58 3.39 2.63 2.99 2.92 3.21 3.39 3.12 4.39 3.39Finland 2.82 3.17 2.95 2.77 2.28 2.70 2.61 3.20 3.23 2.72 4.25 2.76France 2.77 2.99 2.96 3.17 1.75 2.92 2.73 3.06 3.02 2.34 4.04 2.14
Table A.7 Entrepreneurship Framework Conditions Main Indicators
1 Finance 2a National Policy—General Policy 2b National Policy—Regulation 3 Government Programmes 4a Education—Primary & Secondary4b Education—Post-Secondary
5 R&D Transfer 6 Commercial Infrastructure 7a Internal Market—Dynamics 7b Internal Market—Openness 8 Physical Infrastructure 9 Cultural and Social Norms
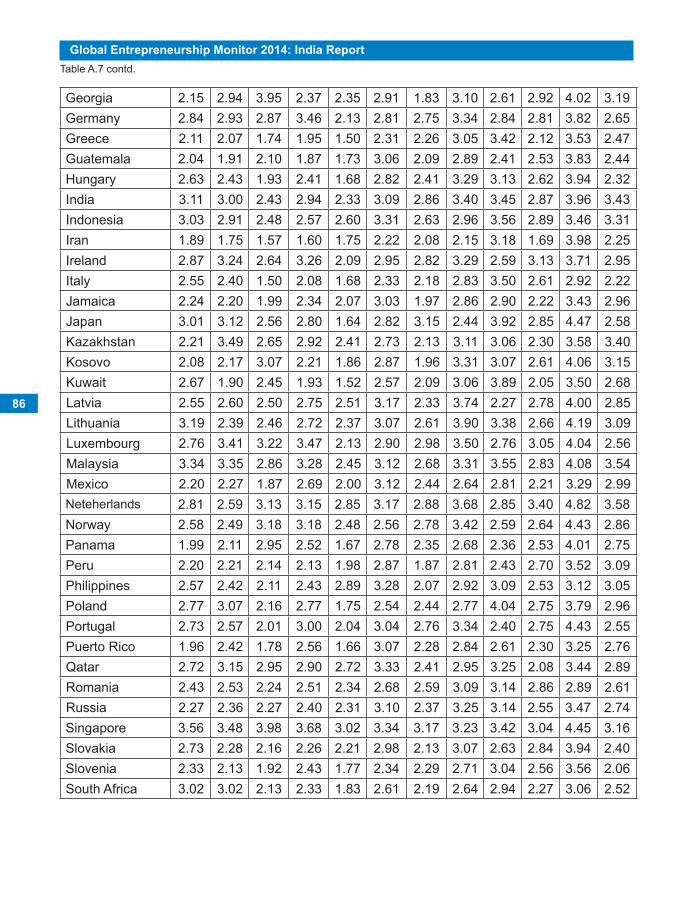
86
Global Entrepreneurship Monitor 2014: India Report
Georgia 2.15 2.94 3.95 2.37 2.35 2.91 1.83 3.10 2.61 2.92 4.02 3.19Germany 2.84 2.93 2.87 3.46 2.13 2.81 2.75 3.34 2.84 2.81 3.82 2.65Greece 2.11 2.07 1.74 1.95 1.50 2.31 2.26 3.05 3.42 2.12 3.53 2.47Guatemala 2.04 1.91 2.10 1.87 1.73 3.06 2.09 2.89 2.41 2.53 3.83 2.44Hungary 2.63 2.43 1.93 2.41 1.68 2.82 2.41 3.29 3.13 2.62 3.94 2.32India 3.11 3.00 2.43 2.94 2.33 3.09 2.86 3.40 3.45 2.87 3.96 3.43Indonesia 3.03 2.91 2.48 2.57 2.60 3.31 2.63 2.96 3.56 2.89 3.46 3.31Iran 1.89 1.75 1.57 1.60 1.75 2.22 2.08 2.15 3.18 1.69 3.98 2.25Ireland 2.87 3.24 2.64 3.26 2.09 2.95 2.82 3.29 2.59 3.13 3.71 2.95Italy 2.55 2.40 1.50 2.08 1.68 2.33 2.18 2.83 3.50 2.61 2.92 2.22Jamaica 2.24 2.20 1.99 2.34 2.07 3.03 1.97 2.86 2.90 2.22 3.43 2.96Japan 3.01 3.12 2.56 2.80 1.64 2.82 3.15 2.44 3.92 2.85 4.47 2.58Kazakhstan 2.21 3.49 2.65 2.92 2.41 2.73 2.13 3.11 3.06 2.30 3.58 3.40Kosovo 2.08 2.17 3.07 2.21 1.86 2.87 1.96 3.31 3.07 2.61 4.06 3.15Kuwait 2.67 1.90 2.45 1.93 1.52 2.57 2.09 3.06 3.89 2.05 3.50 2.68Latvia 2.55 2.60 2.50 2.75 2.51 3.17 2.33 3.74 2.27 2.78 4.00 2.85Lithuania 3.19 2.39 2.46 2.72 2.37 3.07 2.61 3.90 3.38 2.66 4.19 3.09Luxembourg 2.76 3.41 3.22 3.47 2.13 2.90 2.98 3.50 2.76 3.05 4.04 2.56Malaysia 3.34 3.35 2.86 3.28 2.45 3.12 2.68 3.31 3.55 2.83 4.08 3.54Mexico 2.20 2.27 1.87 2.69 2.00 3.12 2.44 2.64 2.81 2.21 3.29 2.99Neteherlands 2.81 2.59 3.13 3.15 2.85 3.17 2.88 3.68 2.85 3.40 4.82 3.58Norway 2.58 2.49 3.18 3.18 2.48 2.56 2.78 3.42 2.59 2.64 4.43 2.86Panama 1.99 2.11 2.95 2.52 1.67 2.78 2.35 2.68 2.36 2.53 4.01 2.75Peru 2.20 2.21 2.14 2.13 1.98 2.87 1.87 2.81 2.43 2.70 3.52 3.09Philippines 2.57 2.42 2.11 2.43 2.89 3.28 2.07 2.92 3.09 2.53 3.12 3.05Poland 2.77 3.07 2.16 2.77 1.75 2.54 2.44 2.77 4.04 2.75 3.79 2.96Portugal 2.73 2.57 2.01 3.00 2.04 3.04 2.76 3.34 2.40 2.75 4.43 2.55Puerto Rico 1.96 2.42 1.78 2.56 1.66 3.07 2.28 2.84 2.61 2.30 3.25 2.76Qatar 2.72 3.15 2.95 2.90 2.72 3.33 2.41 2.95 3.25 2.08 3.44 2.89Romania 2.43 2.53 2.24 2.51 2.34 2.68 2.59 3.09 3.14 2.86 2.89 2.61Russia 2.27 2.36 2.27 2.40 2.31 3.10 2.37 3.25 3.14 2.55 3.47 2.74Singapore 3.56 3.48 3.98 3.68 3.02 3.34 3.17 3.23 3.42 3.04 4.45 3.16Slovakia 2.73 2.28 2.16 2.26 2.21 2.98 2.13 3.07 2.63 2.84 3.94 2.40Slovenia 2.33 2.13 1.92 2.43 1.77 2.34 2.29 2.71 3.04 2.56 3.56 2.06South Africa 3.02 3.02 2.13 2.33 1.83 2.61 2.19 2.64 2.94 2.27 3.06 2.52
Table A.7 contd.
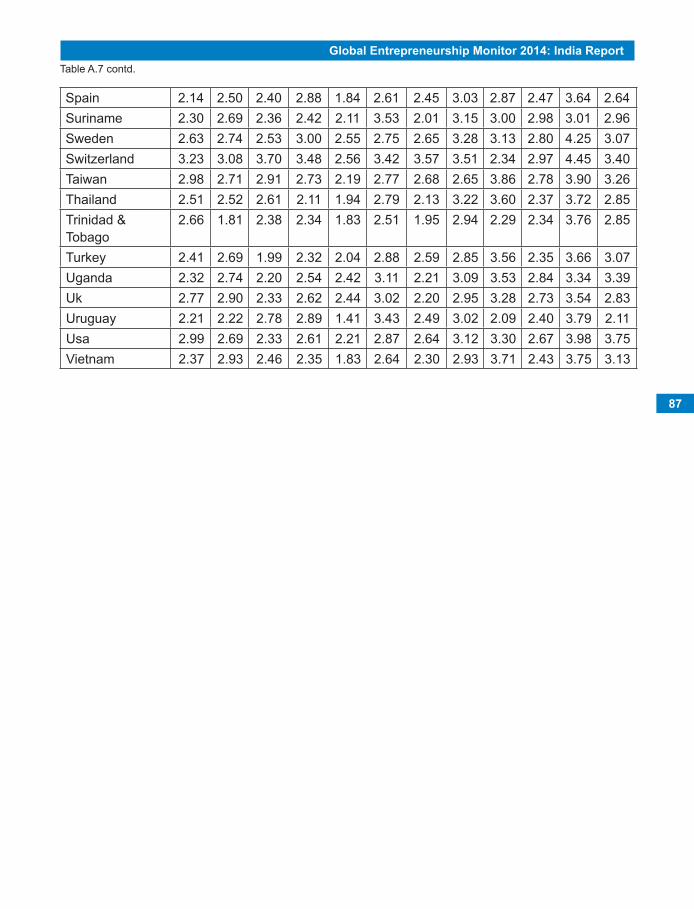
Global Entrepreneurship Monitor 2014: India Report
87
Spain 2.14 2.50 2.40 2.88 1.84 2.61 2.45 3.03 2.87 2.47 3.64 2.64Suriname 2.30 2.69 2.36 2.42 2.11 3.53 2.01 3.15 3.00 2.98 3.01 2.96Sweden 2.63 2.74 2.53 3.00 2.55 2.75 2.65 3.28 3.13 2.80 4.25 3.07Switzerland 3.23 3.08 3.70 3.48 2.56 3.42 3.57 3.51 2.34 2.97 4.45 3.40Taiwan 2.98 2.71 2.91 2.73 2.19 2.77 2.68 2.65 3.86 2.78 3.90 3.26Thailand 2.51 2.52 2.61 2.11 1.94 2.79 2.13 3.22 3.60 2.37 3.72 2.85Trinidad & Tobago
2.66 1.81 2.38 2.34 1.83 2.51 1.95 2.94 2.29 2.34 3.76 2.85
Turkey 2.41 2.69 1.99 2.32 2.04 2.88 2.59 2.85 3.56 2.35 3.66 3.07Uganda 2.32 2.74 2.20 2.54 2.42 3.11 2.21 3.09 3.53 2.84 3.34 3.39Uk 2.77 2.90 2.33 2.62 2.44 3.02 2.20 2.95 3.28 2.73 3.54 2.83Uruguay 2.21 2.22 2.78 2.89 1.41 3.43 2.49 3.02 2.09 2.40 3.79 2.11Usa 2.99 2.69 2.33 2.61 2.21 2.87 2.64 3.12 3.30 2.67 3.98 3.75Vietnam 2.37 2.93 2.46 2.35 1.83 2.64 2.30 2.93 3.71 2.43 3.75 3.13
Table A.7 contd.