Embed Size (px)
Citation preview
Global Entrepreneurship Monitor:
Luxembourg 2015/2016
R :
With the funding support of:

Authors
Leïla Ben Aoun-Peltier
Peter R. Höck
Chiara Peroni
Cesare A. F. Riillo
The views expressed in this report are those of the authors and do not necessarily reflect those of the Global GEM or STATEC. Authors would like to thank Charles Henri DiMaria and other colleagues at STATEC for their useful comments and advice. Authors are grateful to Laurent Solazzi and Gérard Eischen for their support. Riillo thanks Bosma Niels for valuable insights on Global Social Entrepreneurship figures.

Global Entrepreneurship Monitor
3
Global Entrepreneurship Monitor
4
Contents
1 Introduction 5 2 The GEM research Project 7 2.1 The GEM conceptual model: taking contexts seriously! 7 2.2 GEM as dynamic measures of entrepreneurship – when perceptions matters! 9 2.3 GEM surveys 11
3 Luxembourg 2015 Adult Population Survey 12 3.1 The characteristics of respondents 12 3.2 The evolution of entrepreneurship indicators 14 3.3 Attributes of entrepreneurs in Luxembourg 15 3.4 New ventures: ownership, activity, innovativeness and funding 17 3.5 Entrepreneurship: a cross-country perspective 21
4 Luxembourg 2015 National Expert Survey 25 5 Special topics: immigration, well-being and social entrepreneurship 27 5.1 Entrepreneurial activities and immigration in Luxembourg 27 5.1.1 Entrepreneurial indicators by immigration background 27 5.1.2 Individual attributes of entrepreneurs by immigration background 28 5.1.3 Industry by immigration background 29
5.2 Well-being in Luxembourg 31 5.3 Social Entrepreneurship 32
6 Conclusions 35 7 References 36
Global Entrepreneurship Monitor
5
1 Introduction In recent years, governments have become increasingly active in designing policies to encourage and support entrepreneurial efforts. This development originates from the recognition that successful entrepreneurship is a crucial source of job creation and economic growth. Theoretical and empirical studies have shown that entrepreneurship is an important contributor to innovation and technological progress, thus a driver of productivity and ultimately of economic growth (Schumpeter, 1934; Wennekers and Thurik, 1999).
In this context, the Global Entrepreneurship Monitor (GEM) initiative was launched in 1999 to study entrepreneurship, assess the evidence on links between entrepreneurship and growth, and to provide support to policy actions. In particular, GEM aims to collect internationally comparable data to deepen the understanding of entrepreneurial activities and their link with countries' economic performances. Data are collected on an annual basis and harmonised to enable international comparisons. Additionally, GEM complements register data on new ventures collecting information about the individual characteristics and perception of entrepreneurs. Luxembourg joined the Global Entrepreneurship Monitor (GEM) consortium in 2013. A first data collection exercise was launched in 2013. Further exercises have been run by STATEC in 2014 and 2015.
Since its inception, the GEM country report for Luxembourg presents figures and provides essential information on entrepreneurship in this country.
GEM data have also opened new research opportunities to inform on the link between entrepreneurship and Luxembourg’s residents’ immigration background (Peroni et al. 2016), residents’ well-being (Sarracino and Gosset, 2016), as well as methodological issues concerning statistical surveys (Sarracino et al. 2016).
The GEM dataset combine data from two surveys. The first one is the National Expert Survey –NES- which collects expert’s evaluation on the socio-economic context that shapes entrepreneurial abilities and aspirations.
The second survey is the Adult Population Survey
-APS- which collects information on the characteristics of individuals and their involvement in entrepreneurial activities over the different stages of venturing, from start-up firms to established businesses. Results of the Luxembourgish survey are integrated in the GEM global report (GEM global report 2015/2016).
This report presents the GEM framework and gives a detailed account of the information contained in the survey data collected in 2015. It also exploits data from the three previous waves of the survey to analyse the evolution of entrepreneurship over time. The report is organized as follows:
Section 2 outlines the methodology and framework adopted by GEM researchers; it describes the main features of the Adult population survey (APS) and of the National Expert Survey (NES).
Section 3 reports on entrepreneurial activities in Luxembourg from the Adult Population Survey in 2015. The analysis focuses on the individual characteristics of entrepreneurs, such as age, gender, skills and immigration background. It also describes the attributes of new businesses, such as proprietorship, economic activity, and innovation behaviour. In addition, the analysis compares Luxembourg to other European countries and the newly collected data to those from the 2013 and 2014 waves.
Section 4 presents results of the National Expert Survey. This helps to identify features of the Luxembourgish institutional context.
Section 1 overviews special topics of particular relevance to Luxembourg: immigration, subjective well-being and social entrepreneurship.
Finally, Section 6 summarises results and gives concluding remarks.
Main Results The most important indicator of entrepreneurship produced by GEM is Total Early-Stage Entrepreneurial Activity (TEA). TEA measures the share of the active population being nascent entrepreneurs or leading new businesses. Data show an overall increase in Total Early entrepreneurship
Global Entrepreneurship Monitor
6
Activity –TEA- between 2013 and 2015. TEA measured 8.7% in 2014, 7.1% in 2014, and 10.2% in 2015. Interestingly GDP growth followed a similar trend during this period (4.3%, 4.1%, and 4.8%), suggesting a positive correlation between economic growth and entrepreneurial activity.
After Estonia, Luxembourg has the 2th highest Total Entrepreneurship Activity among European countries. Luxembourg’s neighbours have a TEA rate of about 6%. In 2015, Belgium is reporting a TEA of 6.2 %, The Netherlands 7.2% and Germany 4.7%.
For this edition of the GEM report a special focus was put on the Social Entrepreneurships. Luxembourg ranks first in Europe in terms of proportion of Nascent Social Entrepreneurs on the adult population (7.4%). Nascent Social Entrepreneurs are individuals that are involved in entrepreneurial activity with particularly social, environmental or community objectives.
Traits of entrepreneurs Efficient policies aiming to promote entrepreneurship require knowledge of different typologies of entrepreneurs. The main traits of entrepreneurs and start-ups emerging from the GEM surveys are summarized and presented below:
“Gender”: In 2015, the share of early entrepreneurs among males (11.6%) is higher than the share of young entrepreneurs among females (8.7%). However, the proportion of female entrepreneurs increases from 2014.
"Immigrant": Immigration confirms to be an important source of entrepreneurship. First generation immigrants play a major role in entrepreneurial activity (15.1% of first generation immigrants are engaged in entrepreneurship, against 7.2% of non-immigrants and 8.4% of second generation).
“Social” Luxembourg ranks first in Europe in terms of proportion of Nascent Social Entrepreneurs on the adult population (7.4%).
"The cherry-picking": residents in Luxembourg are risk averse and opportunity driven (only 9.7% of Luxembourgish entrepreneurs are motivated primarily by a lack of other options for making a living compared to the 22.4% of European entrepreneurs).
"Dissatisfied": on average, entrepreneurs describe themselves more often as dissatisfied with their lives (18%) than others (9%).
Global Entrepreneurship Monitor
7
2 The GEM research Project
The Global Entrepreneurship Monitor (GEM) research aims to create a cross-national harmonised dataset to study the role of entrepreneurship in fostering national economic growth. In doing so, GEM emphasises the role played by new and small businesses in economic growth, which contrasts with the traditional analysis focusing on the contribution of large corporations (Reynolds et al., 2005). To improve the understanding of the relationship between entrepreneurial activities and economic growth, GEM sets the following objectives:
Determine the extent to which entrepreneurial activity influences economic growth within individual economies.
Identify factors which encourage or hinder entrepreneurial activity
Identify policy implications for enhancing entrepreneurial capacity in an economy.
The programme was initiated in 1999 as a joint venture between academics at London Business School and Babson College in the United States. In 1999, ten participating countries conducted the first
GEM study. Since then, GEM has grown into a consortium of more than 400 researchers. GEM is now regarded as a prominent longitudinal study of entrepreneurship. In 2015, the 61 countries participating countries provided insights on entrepreneurship across a large sample of economies, spanning several geographic regions and levels of economic development.
Luxembourg joined the consortium in 2013 and, since then, Adult Population Survey (APS) and National Experts Survey (NES) are administered to samples of the country’s residents every year. The data collection exercise for this report took place in the spring/summer of 2015. The sample included 2016 individuals for the APS; the NES consisted of 36 interviews.
The basic APS questionnaire is made up of a core questionnaire and additional questions. The latter includes special topics for all GEM countries, and
groups of specific questions for Luxembourg. The global GEM special topic in 2015 was social entrepreneurship. In addition, since 2013, Luxembourg APS includes questions on immigration and wellbeing, as these issues are particularly relevant for Luxembourg’s business community and policy makers.
2.1 The GEM conceptual model: taking contexts seriously!
The GEM'S conceptual framework allows to measure outcomes of entrepreneurial activities, either in terms of Total Early-stage Entrepreneurial Activity (TEA), Social Entrepreneurial Activity (SEA) or Employee Entrepreneurial Activity (EEA). It also takes into account the internationalization aspects of entrepreneurship, high growth and innovative potentials for the economy, as well as more traditional outcomes such as the creation of new jobs and gains in value added. It is important to note that GEM directly collects data closely related with entrepreneurship and rely on other data sources (for example official statistic for GDP) to complement the conceptual framework.
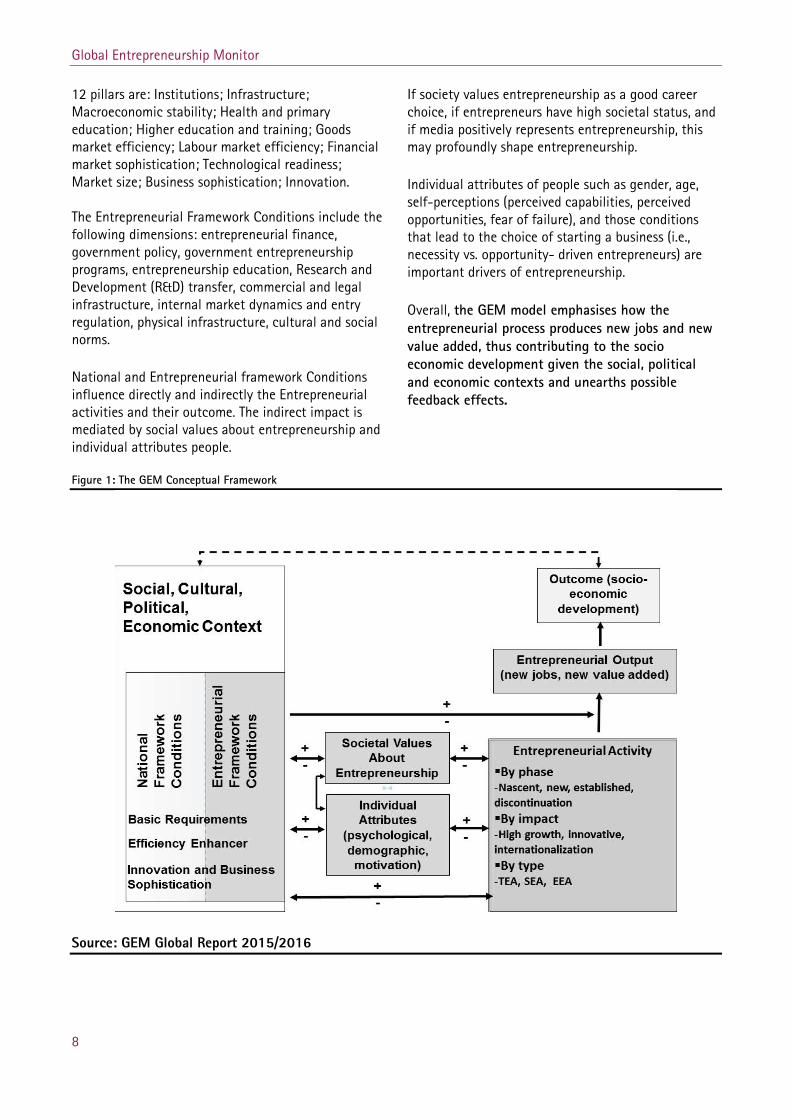
The specificity of the GEM Conceptual Framework is to take into account the environment and interactions with economic outcomes (see Figure 1). Indeed the social-cultural and political contexts of the National economy explain cross-national differences and national evolutions.
The GEM framework adopts two complementary views on the environmental context. On the one hand, the National Framework Conditions reflect the social, cultural, political and economic context that impacts the advancement of the society as a whole. On the other hand, the Entrepreneurial Framework Conditions captures the policy environment as well as the general cultural environment with respect to entrepreneurship.
GEM does not directly collect data on National Framework conditions but adopts the twelve pillars defined by the World Economic Forum’s for profiling economic development phases when surveying competitiveness (World Economic Forum, 2015). The
Global Entrepreneurship Monitor
8
12 pillars are: Institutions; Infrastructure; Macroeconomic stability; Health and primary education; Higher education and training; Goods market efficiency; Labour market efficiency; Financial market sophistication; Technological readiness; Market size; Business sophistication; Innovation. The Entrepreneurial Framework Conditions include the following dimensions: entrepreneurial finance, government policy, government entrepreneurship programs, entrepreneurship education, Research and Development (R&D) transfer, commercial and legal infrastructure, internal market dynamics and entry regulation, physical infrastructure, cultural and social norms.
National and Entrepreneurial framework Conditions influence directly and indirectly the Entrepreneurial activities and their outcome. The indirect impact is mediated by social values about entrepreneurship and individual attributes people.
If society values entrepreneurship as a good career choice, if entrepreneurs have high societal status, and if media positively represents entrepreneurship, this may profoundly shape entrepreneurship.
Individual attributes of people such as gender, age, self-perceptions (perceived capabilities, perceived opportunities, fear of failure), and those conditions that lead to the choice of starting a business (i.e., necessity vs. opportunity- driven entrepreneurs) are important drivers of entrepreneurship.
Overall, the GEM model emphasises how the entrepreneurial process produces new jobs and new value added, thus contributing to the socio economic development given the social, political and economic contexts and unearths possible feedback effects.
Figure 1: The GEM Conceptual Framework
Source: GEM Global Report 2015/2016
Global Entrepreneurship Monitor
9
2.2 GEM as dynamic measures of entrepreneurship – when perceptions matters!
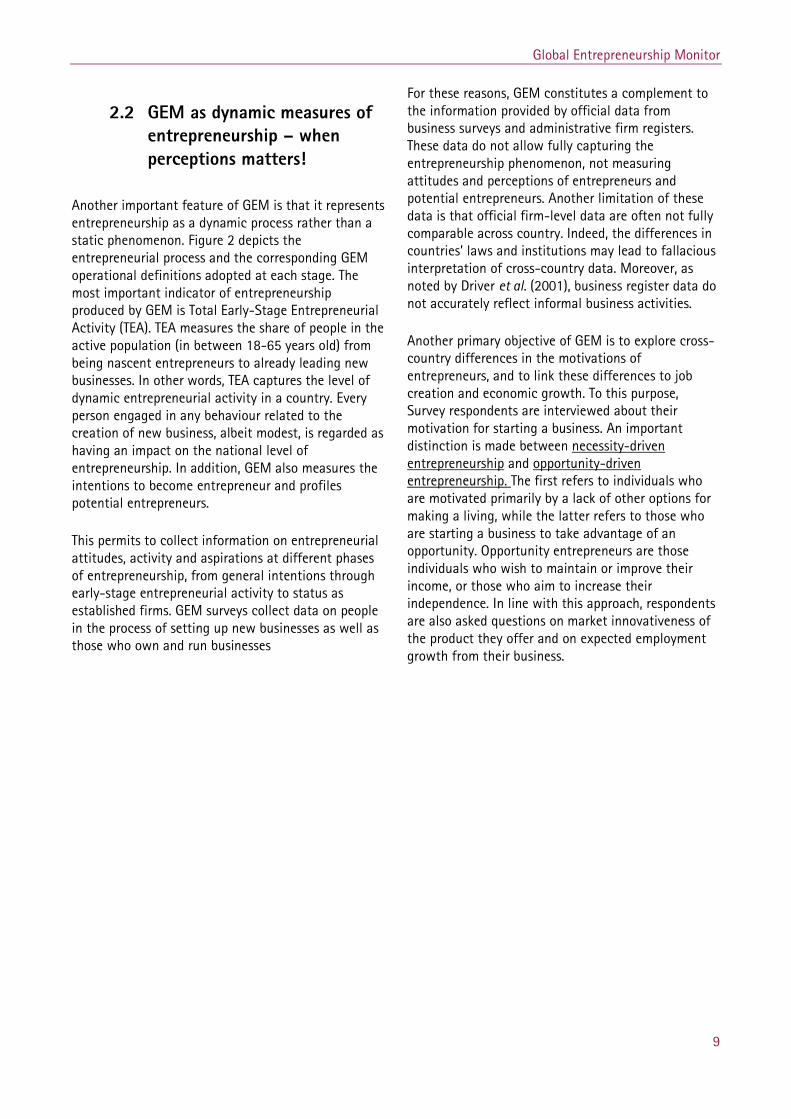
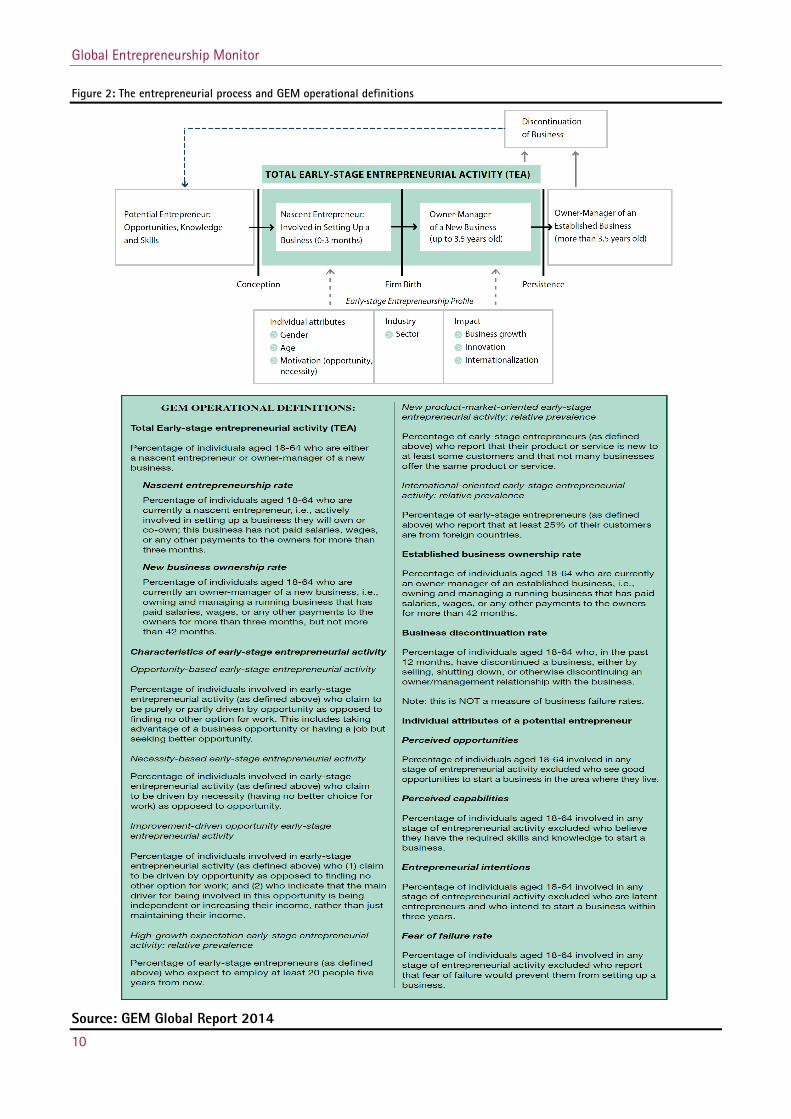
Another important feature of GEM is that it represents entrepreneurship as a dynamic process rather than a static phenomenon. Figure 2 depicts the entrepreneurial process and the corresponding GEM operational definitions adopted at each stage. The most important indicator of entrepreneurship produced by GEM is Total Early-Stage Entrepreneurial Activity (TEA). TEA measures the share of people in the active population (in between 18-65 years old) from being nascent entrepreneurs to already leading new businesses. In other words, TEA captures the level of dynamic entrepreneurial activity in a country. Every person engaged in any behaviour related to the creation of new business, albeit modest, is regarded as having an impact on the national level of entrepreneurship. In addition, GEM also measures the intentions to become entrepreneur and profiles potential entrepreneurs.
This permits to collect information on entrepreneurial attitudes, activity and aspirations at different phases of entrepreneurship, from general intentions through early-stage entrepreneurial activity to status as established firms. GEM surveys collect data on people in the process of setting up new businesses as well as those who own and run businesses
For these reasons, GEM constitutes a complement to the information provided by official data from business surveys and administrative firm registers. These data do not allow fully capturing the entrepreneurship phenomenon, not measuring attitudes and perceptions of entrepreneurs and potential entrepreneurs. Another limitation of these data is that official firm-level data are often not fully comparable across country. Indeed, the differences in countries’ laws and institutions may lead to fallacious interpretation of cross-country data. Moreover, as noted by Driver et al. (2001), business register data do not accurately reflect informal business activities.
Another primary objective of GEM is to explore cross-country differences in the motivations of entrepreneurs, and to link these differences to job creation and economic growth. To this purpose, Survey respondents are interviewed about their motivation for starting a business. An important distinction is made between necessity-driven entrepreneurship and opportunity-driven entrepreneurship. The first refers to individuals who are motivated primarily by a lack of other options for making a living, while the latter refers to those who are starting a business to take advantage of an opportunity. Opportunity entrepreneurs are those individuals who wish to maintain or improve their income, or those who aim to increase their independence. In line with this approach, respondents are also asked questions on market innovativeness of the product they offer and on expected employment growth from their business.
Global Entrepreneurship Monitor
10
Figure 2: The entrepreneurial process and GEM operational definitions
Source: GEM Global Report 2014
Global Entrepreneurship Monitor
11
2.3 GEM surveys
The research design of the GEM surveys is harmonised over all participating countries for the sake of comparability. The data is collected yearly from two main sources:
Adult population survey (APS)
The APS is a survey of the adult active population, namely people at least 18 but younger than 65 years. Each of the participating countries conducts the survey among a representative sample of at least 2000 adults (2016 in Luxembourg). The survey for Luxembourg is conducted during the spring/summer of each year using a standardised questionnaire provided by the GEM consortium. In 2015, the GEM Luxembourg team has decided to keep some questions administered in previous years as special topics of the global questionnaire. These questions focus on the immigration status of respondents and on their subjective well-being. This decision was made because of the relevance of such questions to Luxembourg. To ensure consistency, the international GEM data team supervises the data collection process. Waves of raw data are sent regularly during the survey to the GEM data team for quality checking before being made available to the participating countries. To increase reliability of the figures, the observations are weighted to ensure that the joint distribution of the gender and age of the respondents is equal to the distribution of the reference population as recorded in official registers.
The questionnaire is made of ten blocks of questions to collect information on the whole population and on different types of entrepreneurs. The description of the blocks of questions is the following: 1. Attitude and values towards Entrepreneurship 2. Nascent entrepreneurs 3. Owner-managers 4. Potential and discontinuing entrepreneurs 5. Informal investors 6. Employment + entrepreneurial employee activity 7. Well-being (Luxembourg specific questions) 8. Social Entrepreneurship (2015 special topic) 9. Immigration (Luxembourg specific questions) 10. Demographics on respondents National experts survey (NES)
The national experts’ survey is an important component of the GEM project as it provides insights into the entrepreneurial start-up environment in each country. National experts inform on the Entrepreneurial Framework Conditions that influence entrepreneurial activities.
Four experts from each of the nine entrepreneurial framework condition categories are interviewed, summing up to a total of 36 experts per country. (The categories are listed in Table 2, in Section 4)
Global Entrepreneurship Monitor
12
3 Luxembourg 2015 Adult Population Survey This section overviews the entrepreneurial activity in Luxembourg using information from the Adult Population Survey (APS). The report focuses on the last wave of data, collected in 2015, while previous surveys (2013 and 2014) are used for comparative purposes.
Section 3.1 focuses on individual traits of respondents and compares characteristics of respondents with those of the overall resident population.
Section 3.2 presents the measurement of entrepreneurship at the various stages of the entrepreneurial process, focusing on the crucial TEA indicator.
Section 3.3 overviews the individual characteristics of the entrepreneurs in Luxembourg.
Section 3.4 analyses the characteristics of new ventures in Luxembourg. The section investigates ownership structure, types of activities in which new firms are created, ownership structure, and sources of funding for Luxembourgish start-ups.
Finally, Section 3.5compares Luxembourg data to those of other E.U. countries
3.1 The characteristics of respondents
The GEM target population is composed by individuals between 18 and 64 years of age who are residents in Luxembourg. From this, a sample of 2016 individuals is interviewed using telephone interviews (40% of respondents) and on-line questionnaires (60%). The use of online surveys is motivated by the fact that internet connections are covering nearly 97% of the Luxembourgish population (STATEC, 2015a) and that older respondents are often over-represented in telephone samples (Roster et al., 2004).
The representativeness of the sample is a crucial factor that affects the interpretation of results from statistical surveys. In practice, representativeness informs whether results are generalizable to the full population or are valid only for a “subset’ of the population under investigation. Unweighted data shows an under-representation of respondents in the
age group of 18-34 years and a corresponding over-representation of those aged 45 and above. Therefore, in GEM, observations are weighted to ensure that the sample distributions of the gender and age variables are identical to those of the same characteristics in the overall population. In other words, this procedure tries to ensure that the characteristics of the sample are as close as possible to those of the overall population.
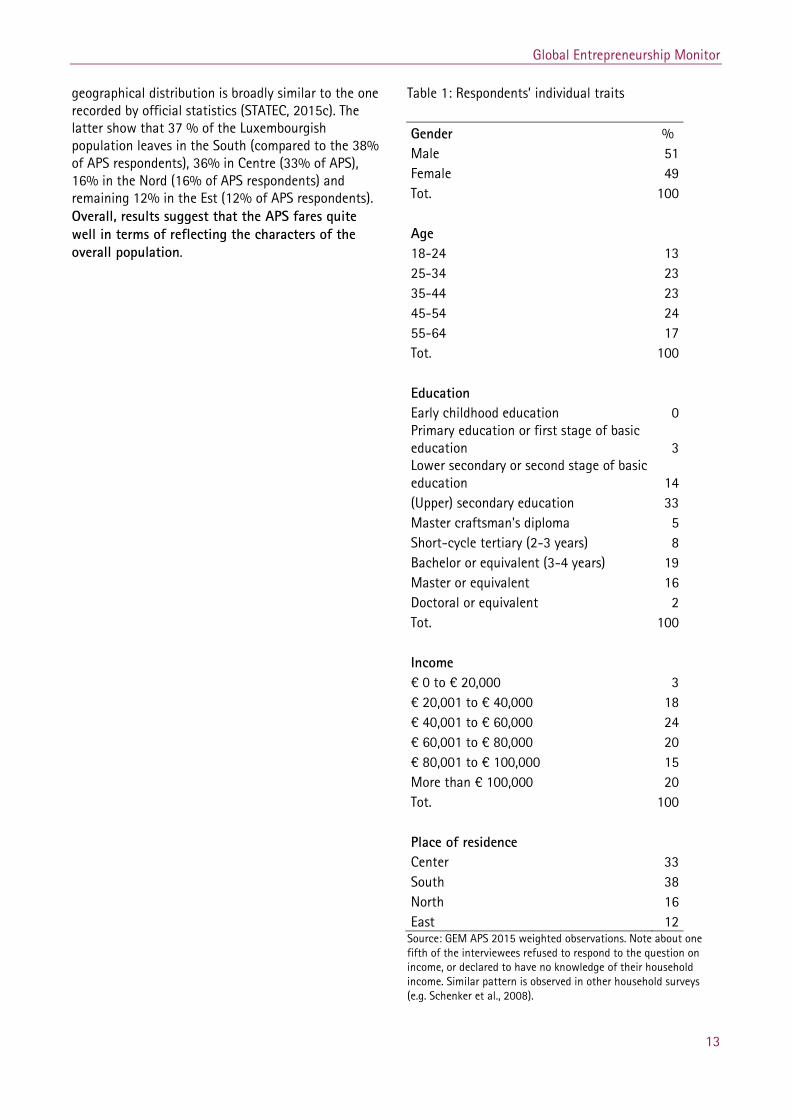
Table 1 describes age, gender, income, and place of residence of respondents. This reveals that slightly more women than men (51% versus 49%) were interviewed; about half of the interviewed were 35 to 54 years old (47%). One third of the respondents declared an upper secondary education level, and one in four an income between 40.000 and 60.000 Euro. Finally, Table 1 shows that the majority of respondents live in the South and in the Centre regions of Luxembourg (respectively 38% and 33%).
To evaluate the effectiveness of the weighting procedure based on age and gender, and thus the representativeness of the APS survey, some traits of the respondents reported in Table 1 (education, income and geographical distribution) is compared with those of the overall population as measured in the census registers. Education reported in Table 1 and in the whole population have generally similar distribution, despite that the APS slightly underestimates the proportion of people reporting lower education (STATEC, 2013). Income data are also in line with those reported by official statistics. Indeed, 55% of APS respondents have an income of at least 60 000 €, while official statistics reported that, in 2013, at least 50% of all household have yearly income of 53,784 €.1 Finally, the respondents’
1 APS income distribution is computed only for respondents that agree to answer to the question. The official annual median income is computed as the household disposable monthly median income multiplied by12 months. In 2013, the last available year of data, the monthly median income was 4,482€ (STATEC, 2015b) Note that STATEC reports median income of the entire population, while the APS includes only households of 18-64 excluding households of adults aged more than 65 years.
Global Entrepreneurship Monitor
13
geographical distribution is broadly similar to the one recorded by official statistics (STATEC, 2015c). The latter show that 37 % of the Luxembourgish population leaves in the South (compared to the 38% of APS respondents), 36% in Centre (33% of APS), 16% in the Nord (16% of APS respondents) and remaining 12% in the Est (12% of APS respondents). Overall, results suggest that the APS fares quite well in terms of reflecting the characters of the overall population.
Table 1: Respondents’ individual traits
Gender % Male 51 Female 49 Tot. 100 Age
18-24 13 25-34 23 35-44 23 45-54 24 55-64 17 Tot. 100 Education
Early childhood education 0 Primary education or first stage of basic education 3 Lower secondary or second stage of basic education 14 (Upper) secondary education 33 Master craftsman's diploma 5 Short-cycle tertiary (2-3 years) 8 Bachelor or equivalent (3-4 years) 19 Master or equivalent 16 Doctoral or equivalent 2 Tot. 100 Income
€ 0 to € 20,000 3 € 20,001 to € 40,000 18 € 40,001 to € 60,000 24 € 60,001 to € 80,000 20 € 80,001 to € 100,000 15 More than € 100,000 20 Tot. 100 Place of residence Center 33 South 38 North 16 East 12 Source: GEM APS 2015 weighted observations. Note about one fifth of the interviewees refused to respond to the question on income, or declared to have no knowledge of their household income. Similar pattern is observed in other household surveys (e.g. Schenker et al., 2008).
Global Entrepreneurship Monitor
14
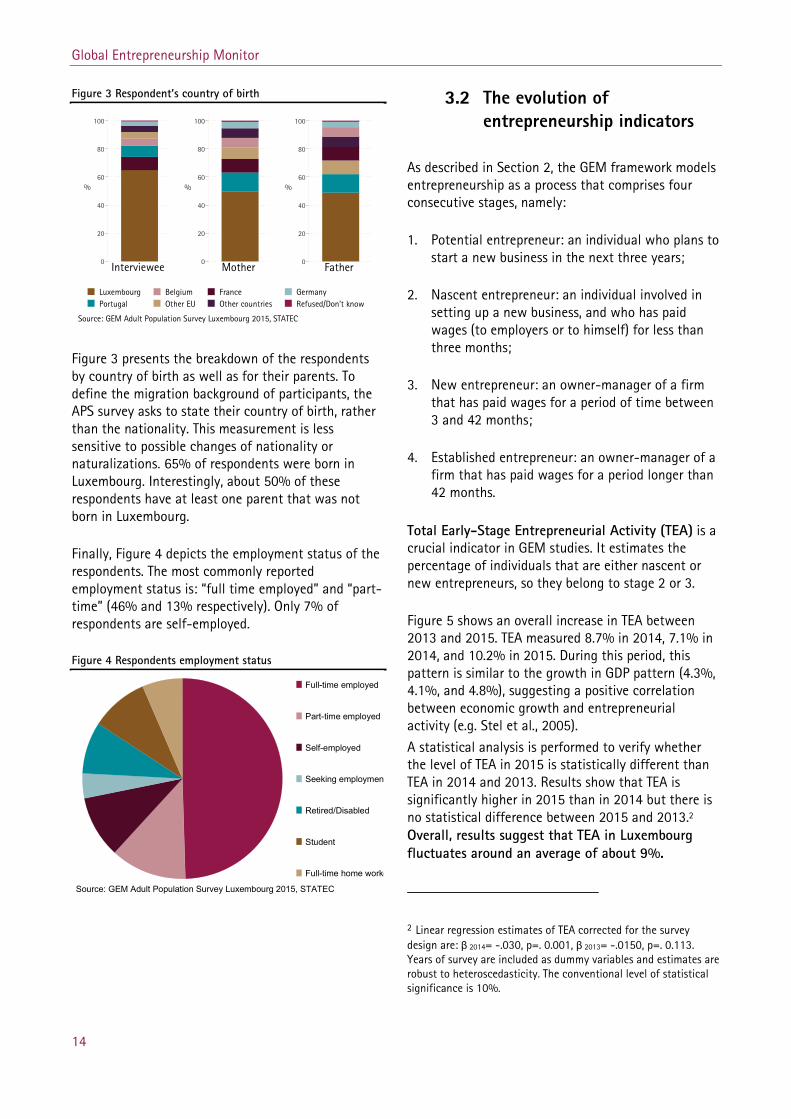
Figure 3 Respondent’s country of birth
Figure 3 presents the breakdown of the respondents by country of birth as well as for their parents. To define the migration background of participants, the APS survey asks to state their country of birth, rather than the nationality. This measurement is less sensitive to possible changes of nationality or naturalizations. 65% of respondents were born in Luxembourg. Interestingly, about 50% of these respondents have at least one parent that was not born in Luxembourg.
Finally, Figure 4 depicts the employment status of the respondents. The most commonly reported employment status is: “full time employed” and “part-time” (46% and 13% respectively). Only 7% of respondents are self-employed.
Figure 4 Respondents employment status
Full-time employed
Part-time employed
Self-employed
Seeking employmen
Retired/Disabled
Student
Full-time home worke
Source: GEM Adult Population Survey Luxembourg 2015, STATEC
3.2 The evolution of entrepreneurship indicators
As described in Section 2, the GEM framework models entrepreneurship as a process that comprises four consecutive stages, namely:
1. Potential entrepreneur: an individual who plans to start a new business in the next three years;
2. Nascent entrepreneur: an individual involved in setting up a new business, and who has paid wages (to employers or to himself) for less than three months;
3. New entrepreneur: an owner-manager of a firm that has paid wages for a period of time between 3 and 42 months;
4. Established entrepreneur: an owner-manager of a firm that has paid wages for a period longer than 42 months.
Total Early-Stage Entrepreneurial Activity (TEA) is a crucial indicator in GEM studies. It estimates the percentage of individuals that are either nascent or new entrepreneurs, so they belong to stage 2 or 3.
Figure 5 shows an overall increase in TEA between 2013 and 2015. TEA measured 8.7% in 2014, 7.1% in 2014, and 10.2% in 2015. During this period, this pattern is similar to the growth in GDP pattern (4.3%, 4.1%, and 4.8%), suggesting a positive correlation between economic growth and entrepreneurial activity (e.g. Stel et al., 2005). A statistical analysis is performed to verify whether the level of TEA in 2015 is statistically different than TEA in 2014 and 2013. Results show that TEA is significantly higher in 2015 than in 2014 but there is no statistical difference between 2015 and 2013.2 Overall, results suggest that TEA in Luxembourg fluctuates around an average of about 9%.
2 Linear regression estimates of TEA corrected for the survey design are: β 2014= -.030, p=. 0.001, β 2013= -.0150, p=. 0.113. Years of survey are included as dummy variables and estimates are robust to heteroscedasticity. The conventional level of statistical significance is 10%.
0
20
40
60
80
100
%
Interviewee 0
20
40
60
80
100
%
Mother 0
20
40
60
80
100
%
Father
Source: GEM Adult Population Survey Luxembourg 2015, STATEC
Luxembourg Belgium France GermanyPortugal Other EU Other countries Refused/Don't know
Global Entrepreneurship Monitor
15
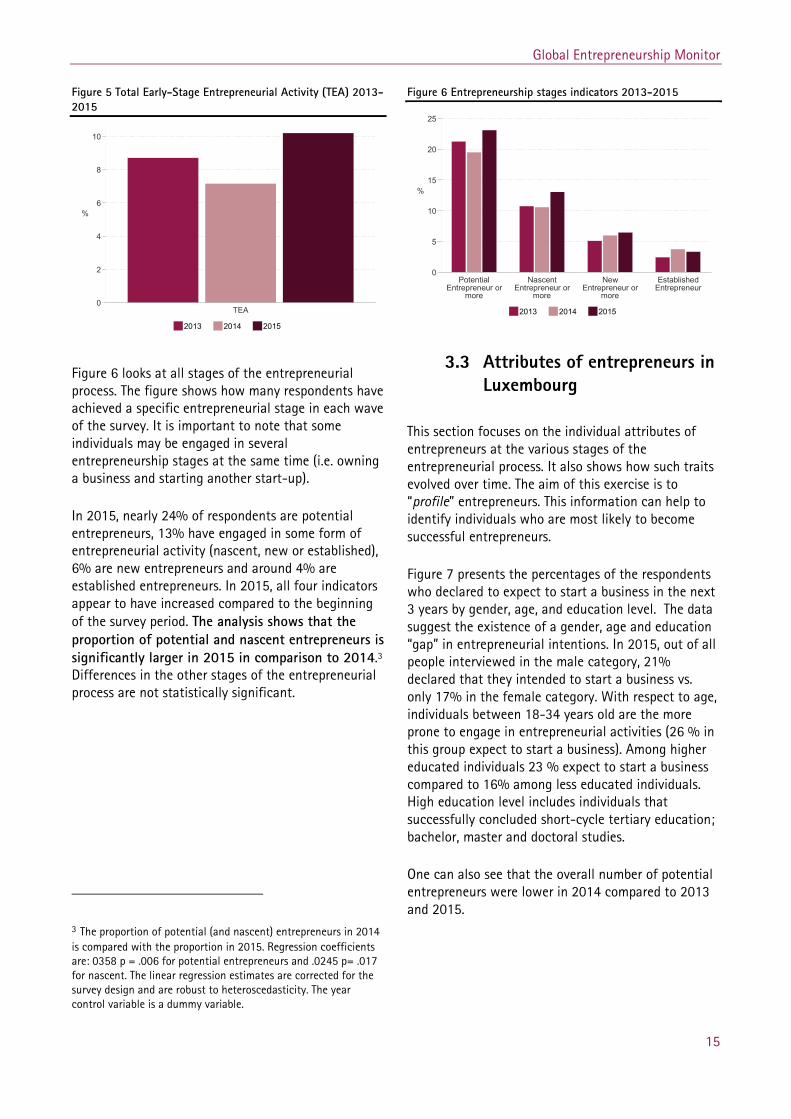
Figure 5 Total Early-Stage Entrepreneurial Activity (TEA) 2013-2015
0
2
4
6
8
10
%
TEA
2013 2014 2015
Figure 6 looks at all stages of the entrepreneurial process. The figure shows how many respondents have achieved a specific entrepreneurial stage in each wave of the survey. It is important to note that some individuals may be engaged in several entrepreneurship stages at the same time (i.e. owning a business and starting another start-up).
In 2015, nearly 24% of respondents are potential entrepreneurs, 13% have engaged in some form of entrepreneurial activity (nascent, new or established), 6% are new entrepreneurs and around 4% are established entrepreneurs. In 2015, all four indicators appear to have increased compared to the beginning of the survey period. The analysis shows that the proportion of potential and nascent entrepreneurs is significantly larger in 2015 in comparison to 2014.3 Differences in the other stages of the entrepreneurial process are not statistically significant.
3 The proportion of potential (and nascent) entrepreneurs in 2014 is compared with the proportion in 2015. Regression coefficients are: 0358 p = .006 for potential entrepreneurs and .0245 p= .017 for nascent. The linear regression estimates are corrected for the survey design and are robust to heteroscedasticity. The year control variable is a dummy variable.
Figure 6 Entrepreneurship stages indicators 2013-2015
0
5
10
15
20
25
%
PotentialEntrepreneur or
more
NascentEntrepreneur or
more
NewEntrepreneur or
more
EstablishedEntrepreneur
2013 2014 2015
3.3 Attributes of entrepreneurs in Luxembourg
This section focuses on the individual attributes of entrepreneurs at the various stages of the entrepreneurial process. It also shows how such traits evolved over time. The aim of this exercise is to “profile” entrepreneurs. This information can help to identify individuals who are most likely to become successful entrepreneurs.
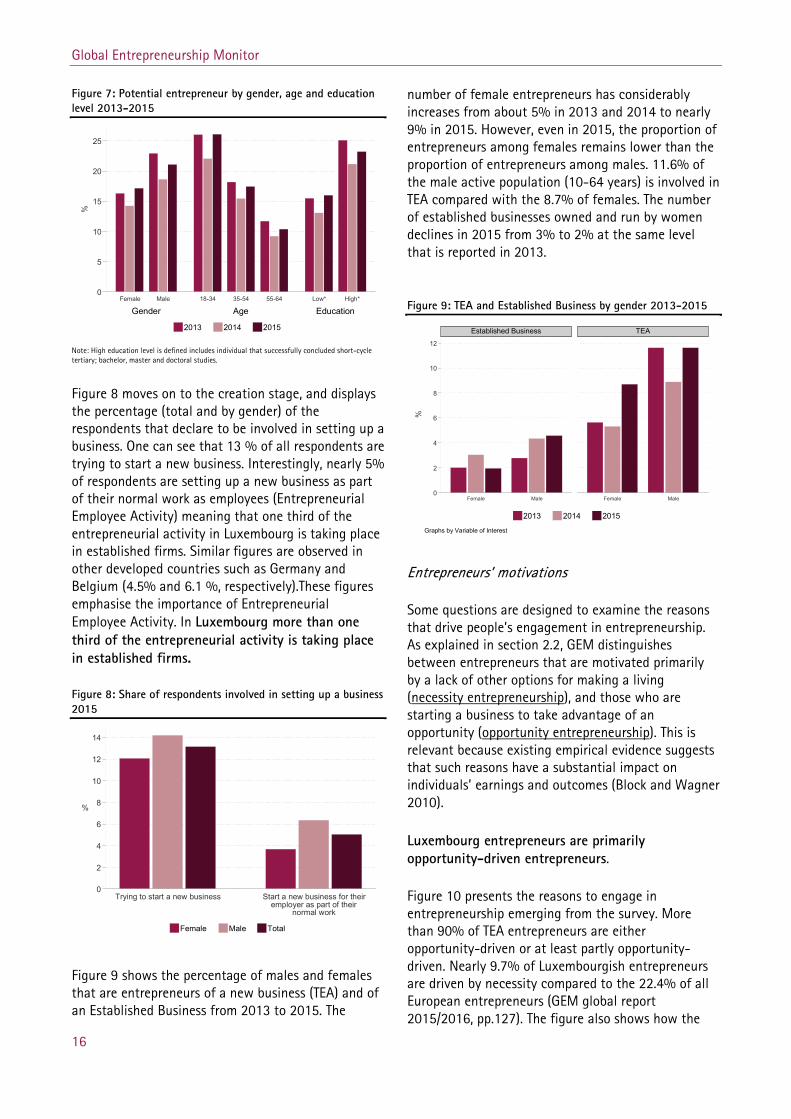
Figure 7 presents the percentages of the respondents who declared to expect to start a business in the next 3 years by gender, age, and education level. The data suggest the existence of a gender, age and education “gap” in entrepreneurial intentions. In 2015, out of all people interviewed in the male category, 21% declared that they intended to start a business vs. only 17% in the female category. With respect to age, individuals between 18-34 years old are the more prone to engage in entrepreneurial activities (26 % in this group expect to start a business). Among higher educated individuals 23 % expect to start a business compared to 16% among less educated individuals. High education level includes individuals that successfully concluded short-cycle tertiary education; bachelor, master and doctoral studies.
One can also see that the overall number of potential entrepreneurs were lower in 2014 compared to 2013 and 2015.
Global Entrepreneurship Monitor
16
Figure 7: Potential entrepreneur by gender, age and education level 2013-2015
0
5
10
15
20
25
%
Gender Age EducationFemale Male 18-34 35-54 55-64 Low* High*
2013 2014 2015
Note: High education level is defined includes individual that successfully concluded short-cycle tertiary; bachelor, master and doctoral studies.
Figure 8 moves on to the creation stage, and displays the percentage (total and by gender) of the respondents that declare to be involved in setting up a business. One can see that 13 % of all respondents are trying to start a new business. Interestingly, nearly 5% of respondents are setting up a new business as part of their normal work as employees (Entrepreneurial Employee Activity) meaning that one third of the entrepreneurial activity in Luxembourg is taking place in established firms. Similar figures are observed in other developed countries such as Germany and Belgium (4.5% and 6.1 %, respectively).These figures emphasise the importance of Entrepreneurial Employee Activity. In Luxembourg more than one third of the entrepreneurial activity is taking place in established firms.
Figure 8: Share of respondents involved in setting up a business 2015
0
2
4
6
8
10
12
14
%
Trying to start a new business Start a new business for theiremployer as part of their
normal work
Female Male Total
Figure 9 shows the percentage of males and females that are entrepreneurs of a new business (TEA) and of an Established Business from 2013 to 2015. The
number of female entrepreneurs has considerably increases from about 5% in 2013 and 2014 to nearly 9% in 2015. However, even in 2015, the proportion of entrepreneurs among females remains lower than the proportion of entrepreneurs among males. 11.6% of the male active population (10-64 years) is involved in TEA compared with the 8.7% of females. The number of established businesses owned and run by women declines in 2015 from 3% to 2% at the same level that is reported in 2013.
Figure 9: TEA and Established Business by gender 2013-2015
0
2
4
6
8
10
12
Female Male Female Male
Established Business TEA
2013 2014 2015
%
Graphs by Variable of Interest
Entrepreneurs’ motivations
Some questions are designed to examine the reasons that drive people’s engagement in entrepreneurship. As explained in section 2.2, GEM distinguishes between entrepreneurs that are motivated primarily by a lack of other options for making a living (necessity entrepreneurship), and those who are starting a business to take advantage of an opportunity (opportunity entrepreneurship). This is relevant because existing empirical evidence suggests that such reasons have a substantial impact on individuals’ earnings and outcomes (Block and Wagner 2010).
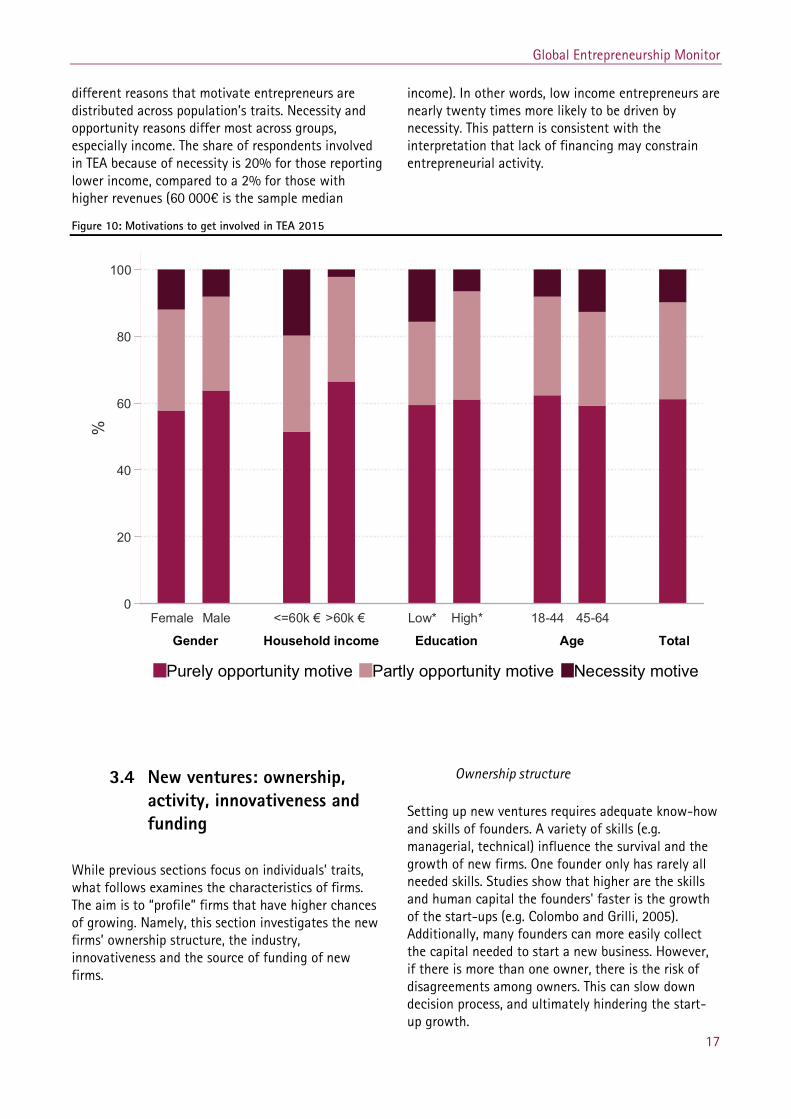
Luxembourg entrepreneurs are primarily opportunity-driven entrepreneurs.
Figure 10 presents the reasons to engage in entrepreneurship emerging from the survey. More than 90% of TEA entrepreneurs are either opportunity-driven or at least partly opportunity-driven. Nearly 9.7% of Luxembourgish entrepreneurs are driven by necessity compared to the 22.4% of all European entrepreneurs (GEM global report 2015/2016, pp.127). The figure also shows how the
Global Entrepreneurship Monitor
17
different reasons that motivate entrepreneurs are distributed across population’s traits. Necessity and opportunity reasons differ most across groups, especially income. The share of respondents involved in TEA because of necessity is 20% for those reporting lower income, compared to a 2% for those with higher revenues (60 000€ is the sample median
income). In other words, low income entrepreneurs are nearly twenty times more likely to be driven by necessity. This pattern is consistent with the interpretation that lack of financing may constrain entrepreneurial activity.
Figure 10: Motivations to get involved in TEA 2015
3.4 New ventures: ownership, activity, innovativeness and funding
While previous sections focus on individuals’ traits, what follows examines the characteristics of firms. The aim is to “profile” firms that have higher chances of growing. Namely, this section investigates the new firms’ ownership structure, the industry, innovativeness and the source of funding of new firms.
Ownership structure
Setting up new ventures requires adequate know-how and skills of founders. A variety of skills (e.g. managerial, technical) influence the survival and the growth of new firms. One founder only has rarely all needed skills. Studies show that higher are the skills and human capital the founders' faster is the growth of the start-ups (e.g. Colombo and Grilli, 2005). Additionally, many founders can more easily collect the capital needed to start a new business. However, if there is more than one owner, there is the risk of disagreements among owners. This can slow down decision process, and ultimately hindering the start-up growth.
0
20
40
60
80
100
%
Gender Household income Education Age Total
Female Male <=60k € >60k € Low* High* 18-44 45-64
Purely opportunity motive Partly opportunity motive Necessity motive
Global Entrepreneurship Monitor
18
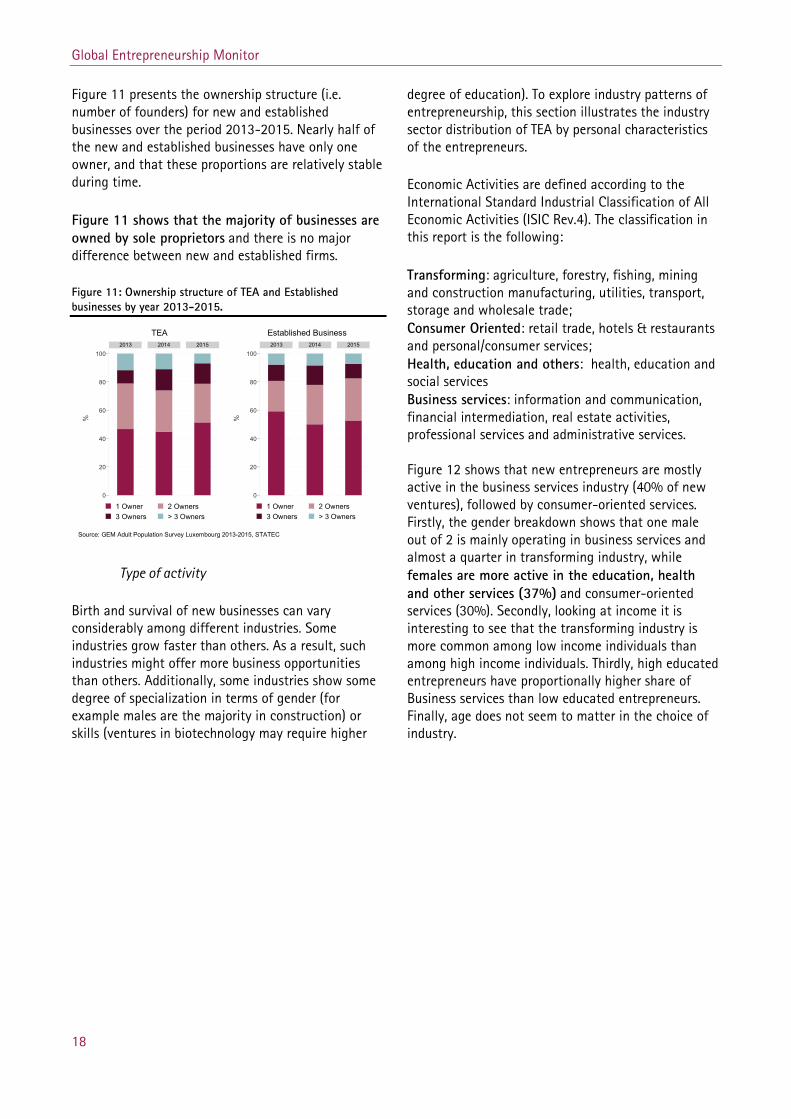
Figure 11 presents the ownership structure (i.e. number of founders) for new and established businesses over the period 2013-2015. Nearly half of the new and established businesses have only one owner, and that these proportions are relatively stable during time.
Figure 11 shows that the majority of businesses are owned by sole proprietors and there is no major difference between new and established firms.
Figure 11: Ownership structure of TEA and Established businesses by year 2013-2015.
0
20
40
60
80
1002013 2014 2015
1 Owner 2 Owners3 Owners > 3 Owners
%
TEA
0
20
40
60
80
1002013 2014 2015
1 Owner 2 Owners3 Owners > 3 Owners
%
Established Business
Source: GEM Adult Population Survey Luxembourg 2013-2015, STATEC
Type of activity
Birth and survival of new businesses can vary considerably among different industries. Some industries grow faster than others. As a result, such industries might offer more business opportunities than others. Additionally, some industries show some degree of specialization in terms of gender (for example males are the majority in construction) or skills (ventures in biotechnology may require higher
degree of education). To explore industry patterns of entrepreneurship, this section illustrates the industry sector distribution of TEA by personal characteristics of the entrepreneurs.
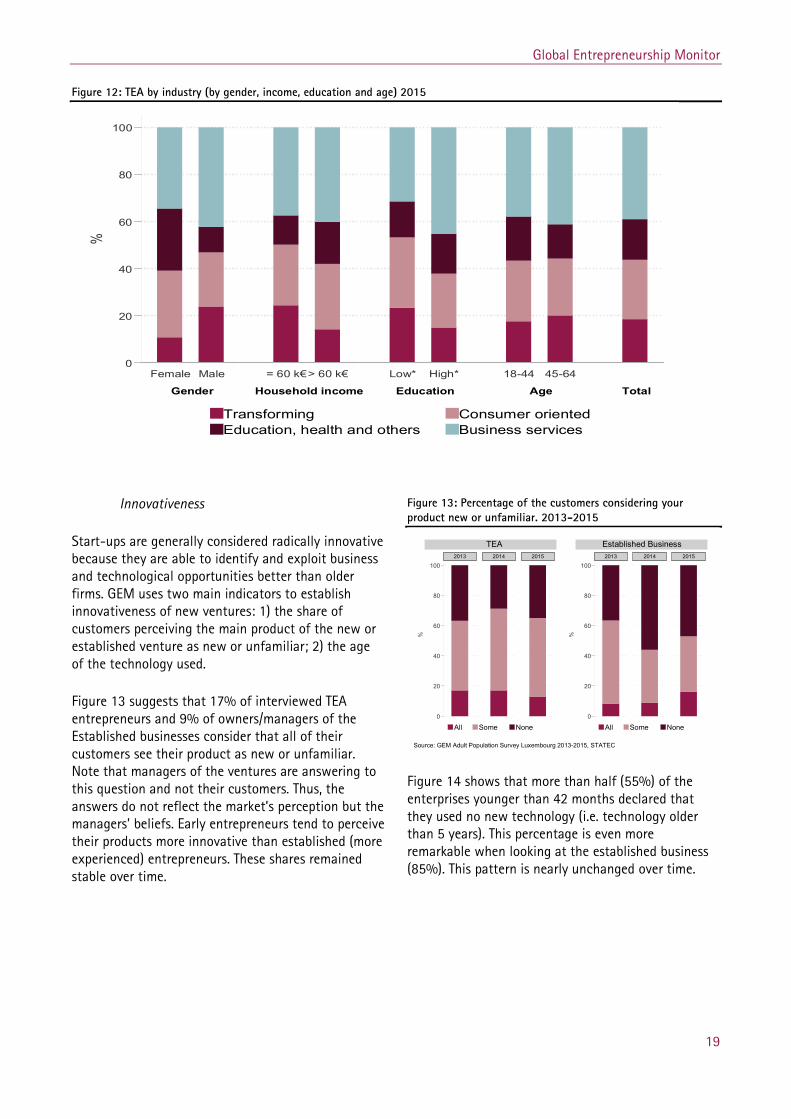
Economic Activities are defined according to the International Standard Industrial Classification of All Economic Activities (ISIC Rev.4). The classification in this report is the following:
Transforming: agriculture, forestry, fishing, mining and construction manufacturing, utilities, transport, storage and wholesale trade; Consumer Oriented: retail trade, hotels & restaurants and personal/consumer services; Health, education and others: health, education and social services Business services: information and communication, financial intermediation, real estate activities, professional services and administrative services. Figure 12 shows that new entrepreneurs are mostly active in the business services industry (40% of new ventures), followed by consumer-oriented services. Firstly, the gender breakdown shows that one male out of 2 is mainly operating in business services and almost a quarter in transforming industry, while females are more active in the education, health and other services (37%) and consumer-oriented services (30%). Secondly, looking at income it is interesting to see that the transforming industry is more common among low income individuals than among high income individuals. Thirdly, high educated entrepreneurs have proportionally higher share of Business services than low educated entrepreneurs. Finally, age does not seem to matter in the choice of industry.
Global Entrepreneurship Monitor
19
Figure 12: TEA by industry (by gender, income, education and age) 2015
Innovativeness
Start-ups are generally considered radically innovative because they are able to identify and exploit business and technological opportunities better than older firms. GEM uses two main indicators to establish innovativeness of new ventures: 1) the share of customers perceiving the main product of the new or established venture as new or unfamiliar; 2) the age of the technology used.
Figure 13 suggests that 17% of interviewed TEA entrepreneurs and 9% of owners/managers of the Established businesses consider that all of their customers see their product as new or unfamiliar. Note that managers of the ventures are answering to this question and not their customers. Thus, the answers do not reflect the market’s perception but the managers’ beliefs. Early entrepreneurs tend to perceive their products more innovative than established (more experienced) entrepreneurs. These shares remained stable over time.
Figure 13: Percentage of the customers considering your product new or unfamiliar. 2013-2015
0
20
40
60
80
1002013 2014 2015
All Some None
%
TEA
0
20
40
60
80
1002013 2014 2015
All Some None
%
Established Business
Source: GEM Adult Population Survey Luxembourg 2013-2015, STATEC Figure 14 shows that more than half (55%) of the enterprises younger than 42 months declared that they used no new technology (i.e. technology older than 5 years). This percentage is even more remarkable when looking at the established business (85%). This pattern is nearly unchanged over time.
0
20
40
60
80
100
%
Gender Household income Education Age Total
Female Male = 60 k€> 60 k€ Low* High* 18-44 45-64
Transforming Consumer orientedEducation, health and others Business services
Global Entrepreneurship Monitor
20
Figure 14: Age of the technology or procedure used to provide the services/products 2013-2015
0
20
40
60
80
1002013 2014 2015
Very latest technology (<1 year)New technology (1-5 years)No new technology (>5 years)
%
TEA
0
20
40
60
80
1002013 2014 2015
Very latest technology (<1 year)New technology (1-5 years)No new technology (>5 years)
%
Established Business
Source: GEM Adult Population Survey Luxembourg 2013-2015, STATEC
Funding
Starting and growing a new business requires adequate access to capital. The lack of funding is one of the biggest hurdles to entrepreneurship. Start-ups may have problems to collect necessary capital
because financial systems may be reluctant to fund businesses that have not proven to be profitable. It is difficult to assess the quality of new business ideas and many start-ups fail (e.g. Kerr and Nanda. 2011). Lack of funding (loans or equity) can postpone productive investment and slowdown growth. This section aims to provide information about the source of funding available to Luxembourgish business start-ups in 2015.
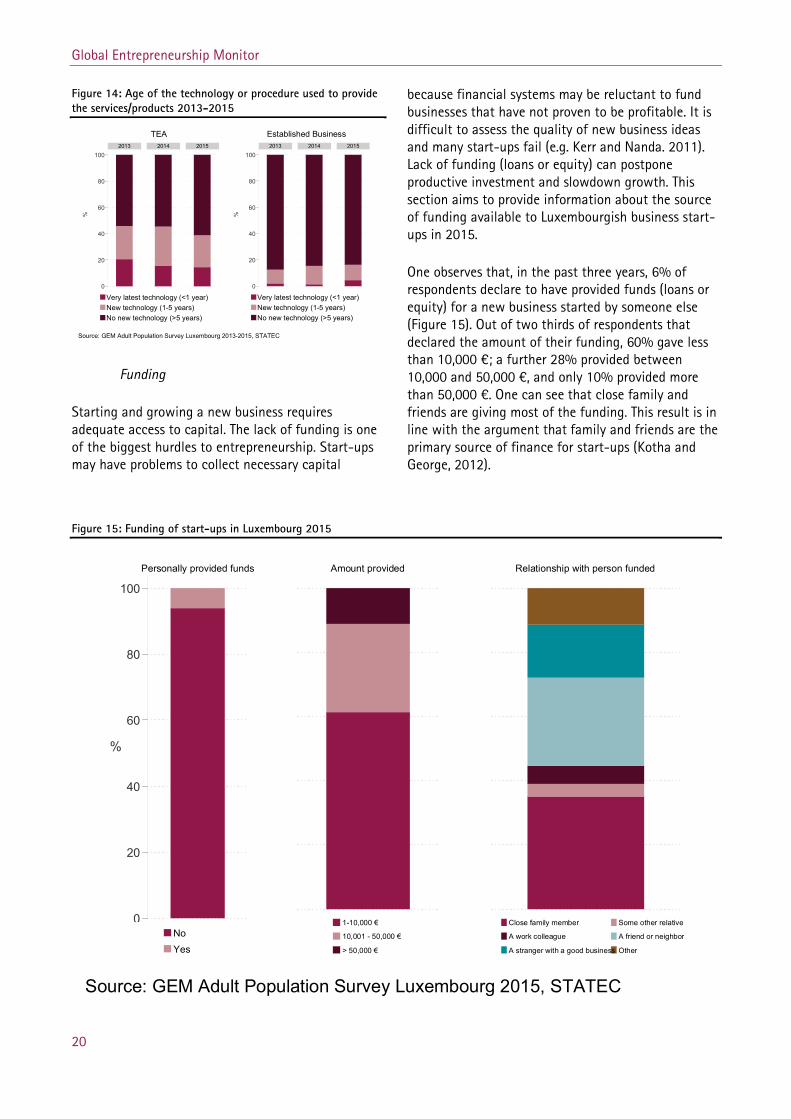
One observes that, in the past three years, 6% of respondents declare to have provided funds (loans or equity) for a new business started by someone else (Figure 15). Out of two thirds of respondents that declared the amount of their funding, 60% gave less than 10,000 €; a further 28% provided between 10,000 and 50,000 €, and only 10% provided more than 50,000 €. One can see that close family and friends are giving most of the funding. This result is in line with the argument that family and friends are the primary source of finance for start-ups (Kotha and George, 2012).
Figure 15: Funding of start-ups in Luxembourg 2015
0
20
40
60
80
100
%
Personally provided funds
NoYes
Amount provided
1-10,000 €
10,001 - 50,000 €
> 50,000 €
Relationship with person funded
Close family member Some other relative
A work colleague A friend or neighbor
A stranger with a good business Other
Source: GEM Adult Population Survey Luxembourg 2015, STATEC
Global Entrepreneurship Monitor
21
3.5 Entrepreneurship: a cross-country perspective
This section compares entrepreneurial attitudes and activities in Luxembourg to those of other countries. The analysis focuses on TEA and on the perception of entrepreneurship, then differences in the actual participation in entrepreneurship is examined.
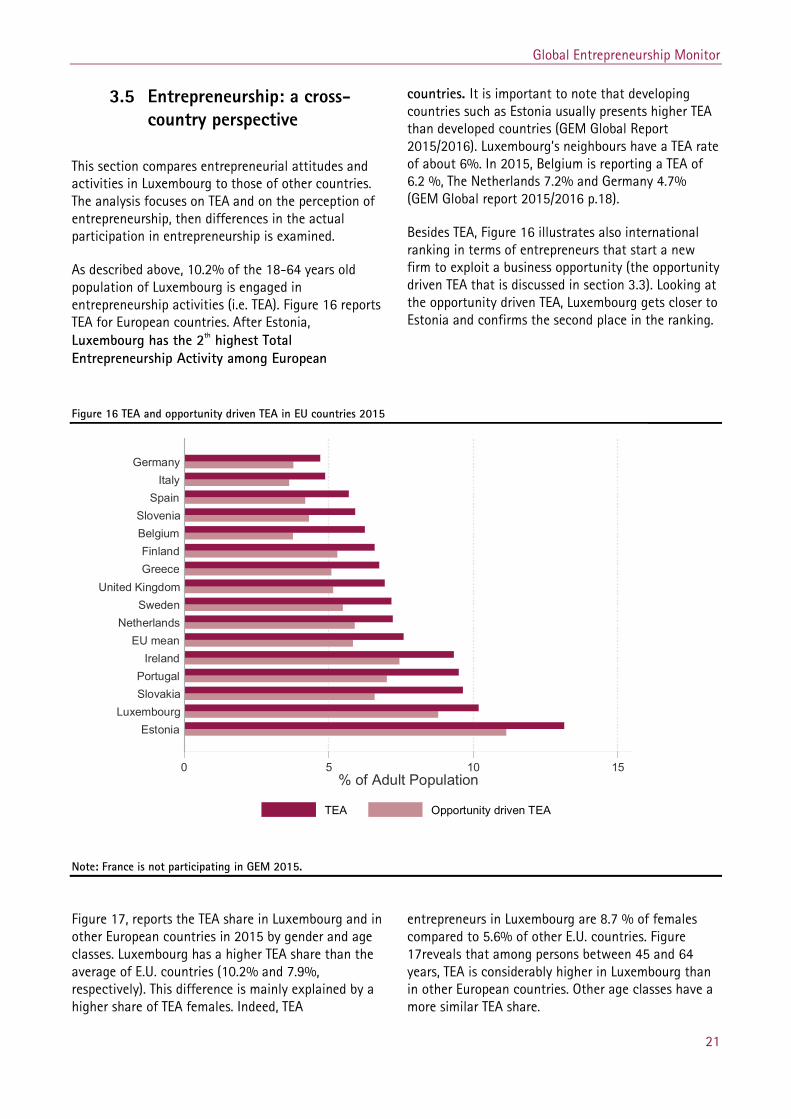
As described above, 10.2% of the 18-64 years old population of Luxembourg is engaged in entrepreneurship activities (i.e. TEA). Figure 16 reports TEA for European countries. After Estonia, Luxembourg has the 2th highest Total Entrepreneurship Activity among European
countries. It is important to note that developing countries such as Estonia usually presents higher TEA than developed countries (GEM Global Report 2015/2016). Luxembourg’s neighbours have a TEA rate of about 6%. In 2015, Belgium is reporting a TEA of 6.2 %, The Netherlands 7.2% and Germany 4.7% (GEM Global report 2015/2016 p.18).
Besides TEA, Figure 16 illustrates also international ranking in terms of entrepreneurs that start a new firm to exploit a business opportunity (the opportunity driven TEA that is discussed in section 3.3). Looking at the opportunity driven TEA, Luxembourg gets closer to Estonia and confirms the second place in the ranking.
Figure 16 TEA and opportunity driven TEA in EU countries 2015
Note: France is not participating in GEM 2015.
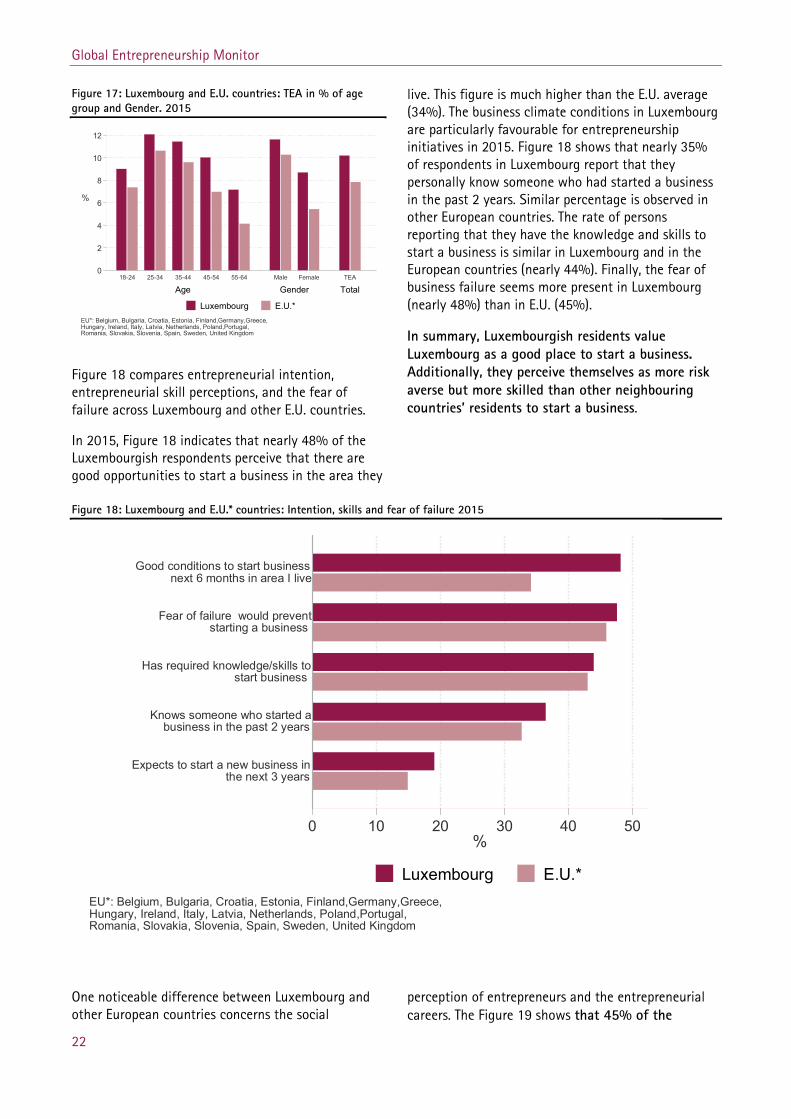
Figure 17, reports the TEA share in Luxembourg and in other European countries in 2015 by gender and age classes. Luxembourg has a higher TEA share than the average of E.U. countries (10.2% and 7.9%, respectively). This difference is mainly explained by a higher share of TEA females. Indeed, TEA
entrepreneurs in Luxembourg are 8.7 % of females compared to 5.6% of other E.U. countries. Figure 17reveals that among persons between 45 and 64 years, TEA is considerably higher in Luxembourg than in other European countries. Other age classes have a more similar TEA share.
0 5 10 15% of Adult Population
EstoniaLuxembourg
SlovakiaPortugal
IrelandEU mean
NetherlandsSweden
United KingdomGreeceFinland
BelgiumSlovenia
SpainItaly
Germany
TEA Opportunity driven TEA
Global Entrepreneurship Monitor
22
Figure 17: Luxembourg and E.U. countries: TEA in % of age group and Gender. 2015
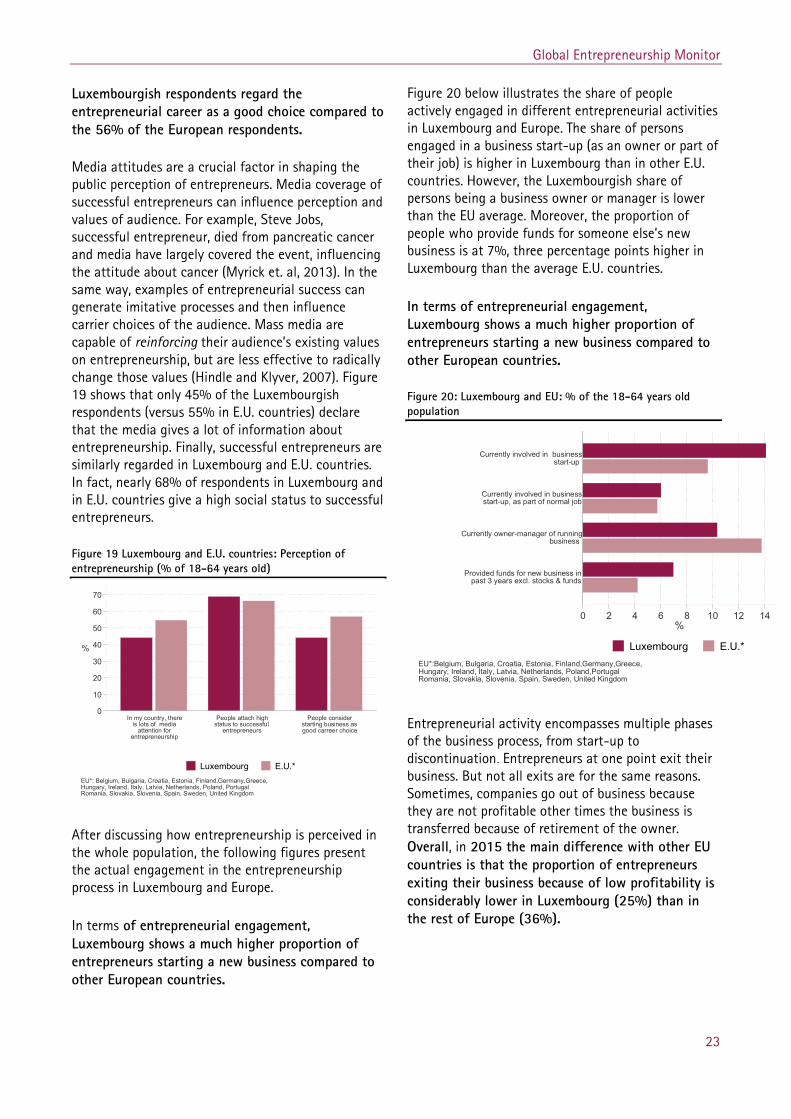
Figure 18 compares entrepreneurial intention, entrepreneurial skill perceptions, and the fear of failure across Luxembourg and other E.U. countries.
In 2015, Figure 18 indicates that nearly 48% of the Luxembourgish respondents perceive that there are good opportunities to start a business in the area they
live. This figure is much higher than the E.U. average (34%). The business climate conditions in Luxembourg are particularly favourable for entrepreneurship initiatives in 2015. Figure 18 shows that nearly 35% of respondents in Luxembourg report that they personally know someone who had started a business in the past 2 years. Similar percentage is observed in other European countries. The rate of persons reporting that they have the knowledge and skills to start a business is similar in Luxembourg and in the European countries (nearly 44%). Finally, the fear of business failure seems more present in Luxembourg (nearly 48%) than in E.U. (45%).
In summary, Luxembourgish residents value Luxembourg as a good place to start a business. Additionally, they perceive themselves as more risk averse but more skilled than other neighbouring countries’ residents to start a business.
Figure 18: Luxembourg and E.U.* countries: Intention, skills and fear of failure 2015
One noticeable difference between Luxembourg and other European countries concerns the social
perception of entrepreneurs and the entrepreneurial careers. The Figure 19 shows that 45% of the
0
2
4
6
8
10
12
%
Age Gender Total18-24 25-34 35-44 45-54 55-64 Male Female TEA
EU*: Belgium, Bulgaria, Croatia, Estonia, Finland,Germany,Greece,Hungary, Ireland, Italy, Latvia, Netherlands, Poland,Portugal, Romania, Slovakia, Slovenia, Spain, Sweden, United Kingdom
Luxembourg E.U.*
0 10 20 30 40 50%
Expects to start a new business inthe next 3 years
Knows someone who started abusiness in the past 2 years
Has required knowledge/skills tostart business
Fear of failure would preventstarting a business
Good conditions to start businessnext 6 months in area I live
EU*: Belgium, Bulgaria, Croatia, Estonia, Finland,Germany,Greece,Hungary, Ireland, Italy, Latvia, Netherlands, Poland,Portugal,Romania, Slovakia, Slovenia, Spain, Sweden, United Kingdom
Luxembourg E.U.*
Global Entrepreneurship Monitor
23
Luxembourgish respondents regard the entrepreneurial career as a good choice compared to the 56% of the European respondents.
Media attitudes are a crucial factor in shaping the public perception of entrepreneurs. Media coverage of successful entrepreneurs can influence perception and values of audience. For example, Steve Jobs, successful entrepreneur, died from pancreatic cancer and media have largely covered the event, influencing the attitude about cancer (Myrick et. al, 2013). In the same way, examples of entrepreneurial success can generate imitative processes and then influence carrier choices of the audience. Mass media are capable of reinforcing their audience’s existing values on entrepreneurship, but are less effective to radically change those values (Hindle and Klyver, 2007). Figure 19 shows that only 45% of the Luxembourgish respondents (versus 55% in E.U. countries) declare that the media gives a lot of information about entrepreneurship. Finally, successful entrepreneurs are similarly regarded in Luxembourg and E.U. countries. In fact, nearly 68% of respondents in Luxembourg and in E.U. countries give a high social status to successful entrepreneurs.
Figure 19 Luxembourg and E.U. countries: Perception of entrepreneurship (% of 18-64 years old)
After discussing how entrepreneurship is perceived in the whole population, the following figures present the actual engagement in the entrepreneurship process in Luxembourg and Europe.
In terms of entrepreneurial engagement, Luxembourg shows a much higher proportion of entrepreneurs starting a new business compared to other European countries.
Figure 20 below illustrates the share of people actively engaged in different entrepreneurial activities in Luxembourg and Europe. The share of persons engaged in a business start-up (as an owner or part of their job) is higher in Luxembourg than in other E.U. countries. However, the Luxembourgish share of persons being a business owner or manager is lower than the EU average. Moreover, the proportion of people who provide funds for someone else’s new business is at 7%, three percentage points higher in Luxembourg than the average E.U. countries.
In terms of entrepreneurial engagement, Luxembourg shows a much higher proportion of entrepreneurs starting a new business compared to other European countries.
Figure 20: Luxembourg and EU: % of the 18-64 years old population
Entrepreneurial activity encompasses multiple phases of the business process, from start-up to discontinuation. Entrepreneurs at one point exit their business. But not all exits are for the same reasons. Sometimes, companies go out of business because they are not profitable other times the business is transferred because of retirement of the owner. Overall, in 2015 the main difference with other EU countries is that the proportion of entrepreneurs exiting their business because of low profitability is considerably lower in Luxembourg (25%) than in the rest of Europe (36%).
0
10
20
30
40
50
60
70
%
In my country, thereis lots of media
attention forentrepreneurship
People attach highstatus to successful
entrepreneurs
People considerstarting business asgood carreer choice
EU*: Belgium, Bulgaria, Croatia, Estonia, Finland,Germany,Greece,Hungary, Ireland, Italy, Latvia, Netherlands, Poland, PortugalRomania, Slovakia, Slovenia, Spain, Sweden, United Kingdom
Luxembourg E.U.*
0 2 4 6 8 10 12 14%
Provided funds for new business inpast 3 years excl. stocks & funds
Currently owner-manager of runningbusiness
Currently involved in businessstart-up, as part of normal job
Currently involved in businessstart-up
EU*:Belgium, Bulgaria, Croatia, Estonia, Finland,Germany,Greece,Hungary, Ireland, Italy, Latvia, Netherlands, Poland,PortugalRomania, Slovakia, Slovenia, Spain, Sweden, United Kingdom
Luxembourg E.U.*
Global Entrepreneurship Monitor
24
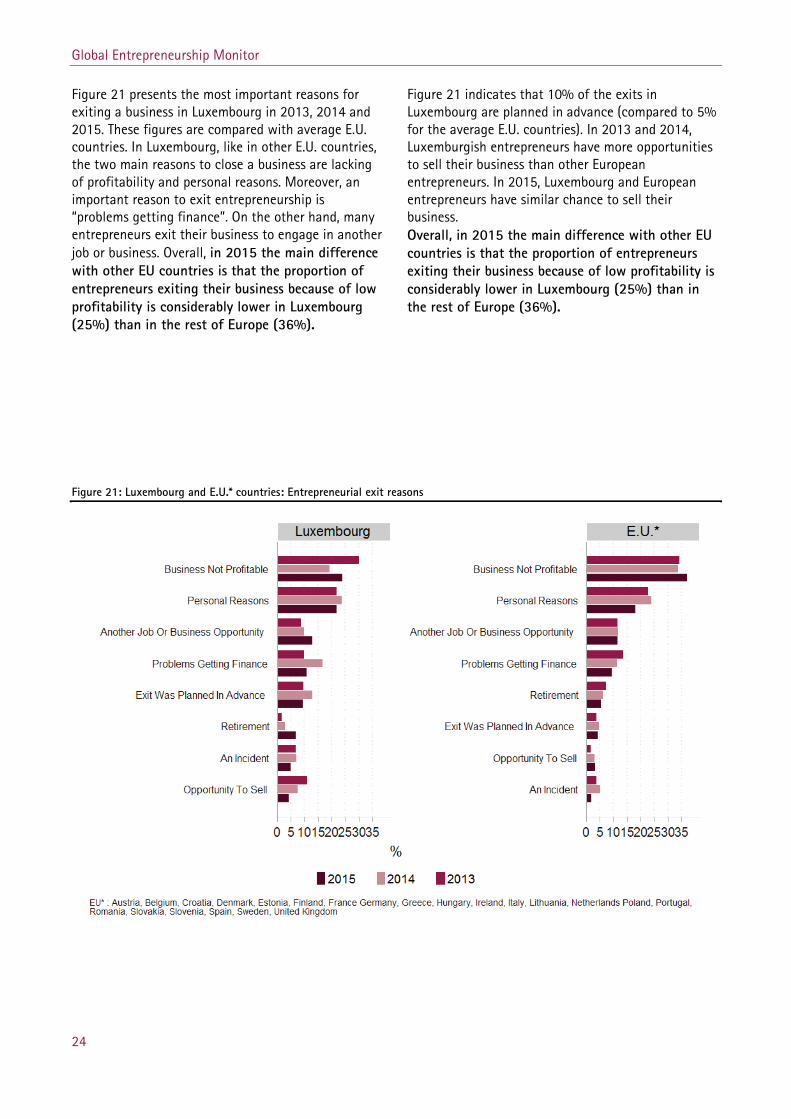
Figure 21 presents the most important reasons for exiting a business in Luxembourg in 2013, 2014 and 2015. These figures are compared with average E.U. countries. In Luxembourg, like in other E.U. countries, the two main reasons to close a business are lacking of profitability and personal reasons. Moreover, an important reason to exit entrepreneurship is “problems getting finance”. On the other hand, many entrepreneurs exit their business to engage in another job or business. Overall, in 2015 the main difference with other EU countries is that the proportion of entrepreneurs exiting their business because of low profitability is considerably lower in Luxembourg (25%) than in the rest of Europe (36%).
Figure 21 indicates that 10% of the exits in Luxembourg are planned in advance (compared to 5% for the average E.U. countries). In 2013 and 2014, Luxemburgish entrepreneurs have more opportunities to sell their business than other European entrepreneurs. In 2015, Luxembourg and European entrepreneurs have similar chance to sell their business. Overall, in 2015 the main difference with other EU countries is that the proportion of entrepreneurs exiting their business because of low profitability is considerably lower in Luxembourg (25%) than in the rest of Europe (36%).
Figure 21: Luxembourg and E.U.* countries: Entrepreneurial exit reasons
Global Entrepreneurship Monitor
25
4 Luxembourg 2015 National Expert Survey Entrepreneurial Framework Conditions (EFCs) refer to business opportunities, entrepreneurial capacities, , infrastructure and individuals’ preferences, which, in turn, impact the creation and development of businesses’ and entrepreneurial success. By collecting information from the national experts’ interviews on EFCs, GEM captures informed judgments regarding the entrepreneurial “ecosystem” (GEM 2015).
This section presents a comparative assessment of the entrepreneurial “ecosystem” of Luxembourg based on data from the National Expert Survey (NES).
The aim of the NES is to assess the entrepreneur ecosystem through the measurement of a set of 9 Entrepreneurial Framework Conditions (EFC) indicators. These EFCs are: Entrepreneurial Finance, Government Policy, Government Entrepreneurship Programs, Entrepreneurial Education, R&D transfer, the Commercial and Legal Infrastructure Barriers to entry, Physical Infrastructure and the Cultural and Social Norms. Table 2 describes in detail the various
framework conditions. Each EFC is measured on the basis of answers to a set of questions. Experts evaluate adequacy of each EFC using a Likert scales of 9 points (1 = highly insufficient, 9 = highly sufficient).
The following provides some information on respondents’ individual characteristics, and presents descriptive statistics on the entrepreneurial environment indicators.
Luxembourg’s NES sample
Luxembourg’s NES sample includes 36 experts from various Luxembourgish private and public institutions. Most of the experts are male (8 females and 28 males) hold a university degree (nearly 90%) and the average age is 47 years. Finally, answering to multiple choice question about their activity, 5 experts describe themselves as “entrepreneur”, 11 as a “Business and support service provider”, 5 as “Educator, teacher, and researcher on entrepreneurship”, 4 as “Policy-maker” and 4 as “Investor or Banker”.
Table 2: The 9 GEM’s Entrepreneurial Framework Conditions-EFC-that describe the entrepreneurial ecosystem
1) Entrepreneurial Finance. This conditions aims to capture the availability of financial resources — equity and debt — for small and medium enterprises (SMEs). It includes grants and subsidies).
2) Government Policy. The extent to which public policies support entrepreneurship. This condition has two components: a) General: Government perceives entrepreneurship as a relevant economic issue and b) Regulation: Taxes or regulations are either not discriminating on the grounds of size or encouraging new
ventures and SMEs. 3) Government Entrepreneurship Programs. The presence and quality of programs directly assisting SMEs at
all levels of government (national, regional, municipal). 4) Entrepreneurship Education. The extent to which training in creating or managing SMEs is incorporated
within the education and training system at all levels. This EFC has two components: a) Entrepreneurship Education at primary and secondary school, and b) Entrepreneurship Education at post-secondary levels (higher education such as vocational, college,
business schools, etc.). 5) R&D Transfer. The extent to which national research and development will lead to new commercial
opportunities and is available to SMEs. 6) Commercial and Legal Infrastructure. The presence of property rights, commercial, accounting and other
legal and assessment services and institutions that support or promote SMEs. 7) Barriers to entry. This EFC includes two components:
a) Market Dynamics: the level of change in markets from year to year, and b) Market Openness: the extent to which new firms are free to enter existing markets.
8) Physical Infrastructure. Ease of access to physical resources and infrastructure, such as communication networks, utilities, transportation, land or space—. This also captures cost of accessing such infrastructure faced by SMEs: prices should not discriminate against SMEs.
9) Cultural and Social Norms. The extent to which social and cultural norms encourage or allow actions leading to new business methods or activities that can potentially increase personal wealth and income.
Source: adapted from GEM Global Report 2015/2016
Global Entrepreneurship Monitor
26
Luxembourg’s NES results
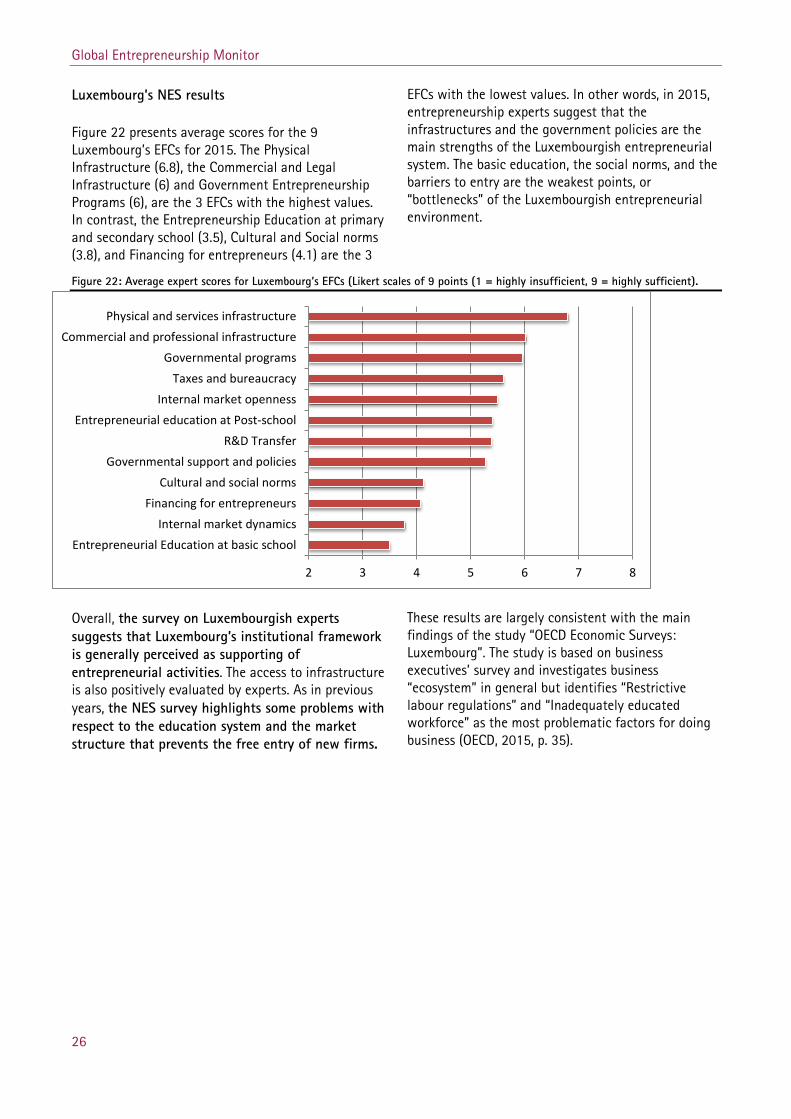
Figure 22 presents average scores for the 9 Luxembourg’s EFCs for 2015. The Physical Infrastructure (6.8), the Commercial and Legal Infrastructure (6) and Government Entrepreneurship Programs (6), are the 3 EFCs with the highest values. In contrast, the Entrepreneurship Education at primary and secondary school (3.5), Cultural and Social norms (3.8), and Financing for entrepreneurs (4.1) are the 3
EFCs with the lowest values. In other words, in 2015, entrepreneurship experts suggest that the infrastructures and the government policies are the main strengths of the Luxembourgish entrepreneurial system. The basic education, the social norms, and the barriers to entry are the weakest points, or “bottlenecks” of the Luxembourgish entrepreneurial environment.
Figure 22: Average expert scores for Luxembourg’s EFCs (Likert scales of 9 points (1 = highly insufficient, 9 = highly sufficient).
Overall, the survey on Luxembourgish experts suggests that Luxembourg’s institutional framework is generally perceived as supporting of entrepreneurial activities. The access to infrastructure is also positively evaluated by experts. As in previous years, the NES survey highlights some problems with respect to the education system and the market structure that prevents the free entry of new firms.
These results are largely consistent with the main findings of the study “OECD Economic Surveys: Luxembourg”. The study is based on business executives’ survey and investigates business “ecosystem” in general but identifies “Restrictive labour regulations” and “Inadequately educated workforce” as the most problematic factors for doing business (OECD, 2015, p. 35).
2 3 4 5 6 7 8
Entrepreneurial Education at basic schoolInternal market dynamics
Financing for entrepreneursCultural and social norms
Governmental support and policiesR&D Transfer
Entrepreneurial education at Post-schoolInternal market openness
Taxes and bureaucracyGovernmental programs
Commercial and professional infrastructurePhysical and services infrastructure
Global Entrepreneurship Monitor
27
5 Special topics: immigration, well-being and social entrepreneurship
This section investigates the relationship between entrepreneurship and the structure of the population in Luxembourg. In addition, this section reports on the well-being of residents, as GEM is the only source of information at annual frequency on this topic of increasing relevance. Finally, features of the social entrepreneurship, the special topic for 2015 are analysed in the last section.
5.1 Entrepreneurial activities and immigration in Luxembourg
The issue of immigrants’ involvement in entrepreneurial activities is of general interest, but is also of special relevance to Luxembourg in view of the country’s population structure. The proportion of Luxembourgish residents with some immigration background is considerable. In 2011, according to the last census data, 49% of residents are Luxembourgish at birth (Peltier et al. 2012). Foreigners account for nearly half of the resident population (43%) and 94.5% of all immigrants comes from other EU countries (Peltier et al., 2012).
The Luxembourgish labour market largely depends on foreign workers resident and non-residents. 44.4% of the total labour force is resident in neighbouring countries (STATEC, 2015e). Cross-border workers and cross-border entrepreneurs are currently not part of the GEM sample. Immigration and its economic consequences, is the subject of several studies in recent years. Such studies highlight how migrants and cross-border workers largely contribute to the entrepreneurial efforts (STATEC, 2012; Stawinska, 2012; Peroni et al. 2016).
In view of Luxembourg’s population structure, GEM Luxembourg regularly collects detailed information on migration background. What follows examines this data, which highlights how the Luxembourgish population structure is related to entrepreneurship indicators, and to characteristics of entrepreneurs and new ventures. Immigration background is defined as following:
First generation is made of people born outside of Luxembourg.
Second generation was born in Luxembourg and has at least one parent that was born outside Luxembourg.
Finally, non-immigrants are the persons born in Luxembourg with both parents were born Luxembourgish.
5.1.1 Entrepreneurial indicators by immigration background
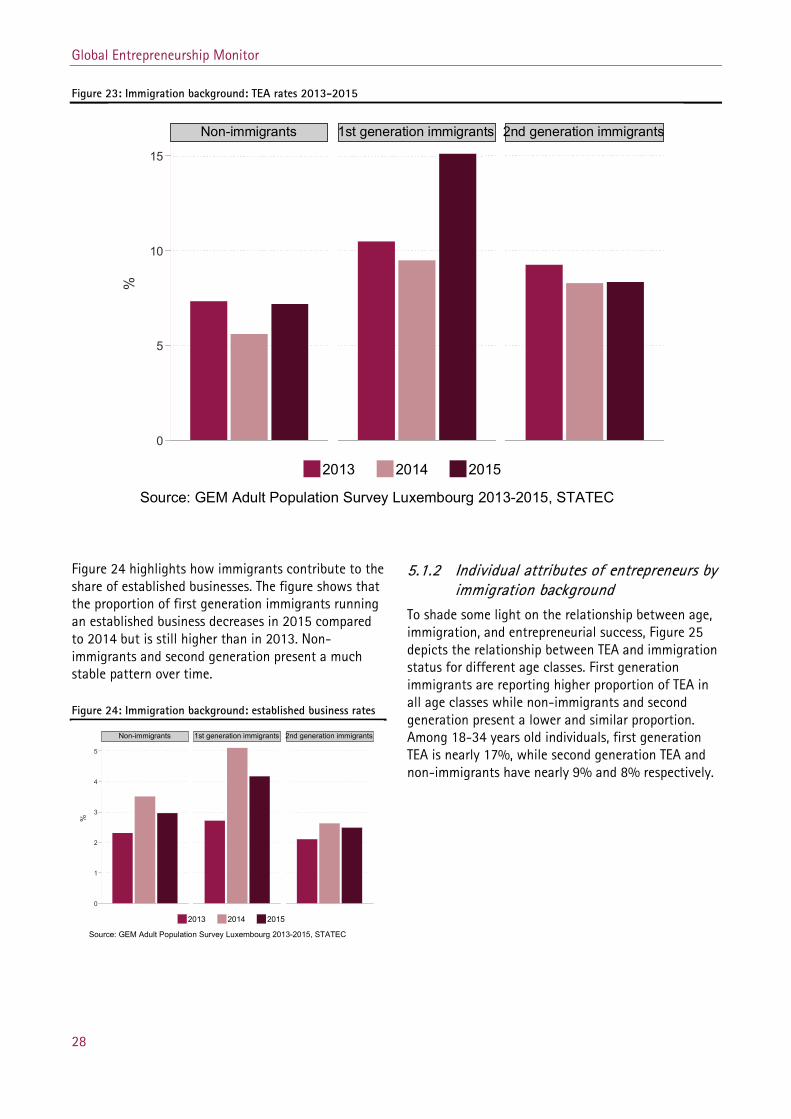
Figure 23 shows that immigrants are more likely to engage in early stage entrepreneurial activities, as measured by TEA. In 2015, among respondents that have no immigration background, 7.2 % are in TEA. The proportion among first and second generation is 15.1% and 8.4% respectively.
The proportion of entrepreneurs among first generation immigration is nearly the double than in the native and second generation population.
Global Entrepreneurship Monitor
28
Figure 23: Immigration background: TEA rates 2013-2015
0
5
10
15
Non-immigrants 1st generation immigrants 2nd generation immigrants
2013 2014 2015
%
Source: GEM Adult Population Survey Luxembourg 2013-2015, STATEC
Figure 24 highlights how immigrants contribute to the share of established businesses. The figure shows that the proportion of first generation immigrants running an established business decreases in 2015 compared to 2014 but is still higher than in 2013. Non-immigrants and second generation present a much stable pattern over time.
Figure 24: Immigration background: established business rates
0
1
2
3
4
5
Non-immigrants 1st generation immigrants 2nd generation immigrants
2013 2014 2015
%
Source: GEM Adult Population Survey Luxembourg 2013-2015, STATEC
5.1.2 Individual attributes of entrepreneurs by immigration background
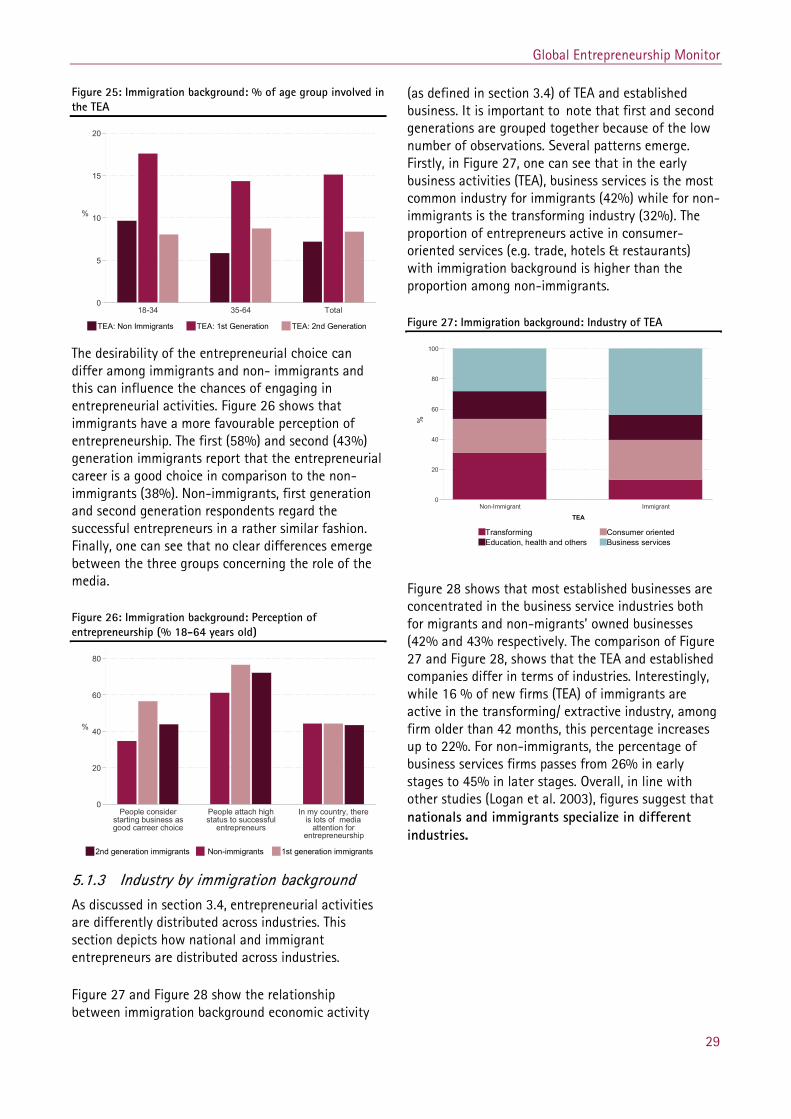
To shade some light on the relationship between age, immigration, and entrepreneurial success, Figure 25 depicts the relationship between TEA and immigration status for different age classes. First generation immigrants are reporting higher proportion of TEA in all age classes while non-immigrants and second generation present a lower and similar proportion. Among 18-34 years old individuals, first generation TEA is nearly 17%, while second generation TEA and non-immigrants have nearly 9% and 8% respectively.
Global Entrepreneurship Monitor
29
Figure 25: Immigration background: % of age group involved in the TEA
0
5
10
15
20
%
18-34 35-64 Total
TEA: Non Immigrants TEA: 1st Generation TEA: 2nd Generation
The desirability of the entrepreneurial choice can differ among immigrants and non- immigrants and this can influence the chances of engaging in entrepreneurial activities. Figure 26 shows that immigrants have a more favourable perception of entrepreneurship. The first (58%) and second (43%) generation immigrants report that the entrepreneurial career is a good choice in comparison to the non-immigrants (38%). Non-immigrants, first generation and second generation respondents regard the successful entrepreneurs in a rather similar fashion. Finally, one can see that no clear differences emerge between the three groups concerning the role of the media.
Figure 26: Immigration background: Perception of entrepreneurship (% 18-64 years old)
0
20
40
60
80
%
People considerstarting business asgood carreer choice
People attach highstatus to successful
entrepreneurs
In my country, thereis lots of media
attention forentrepreneurship
2nd generation immigrants Non-immigrants 1st generation immigrants
5.1.3 Industry by immigration background As discussed in section 3.4, entrepreneurial activities are differently distributed across industries. This section depicts how national and immigrant entrepreneurs are distributed across industries.
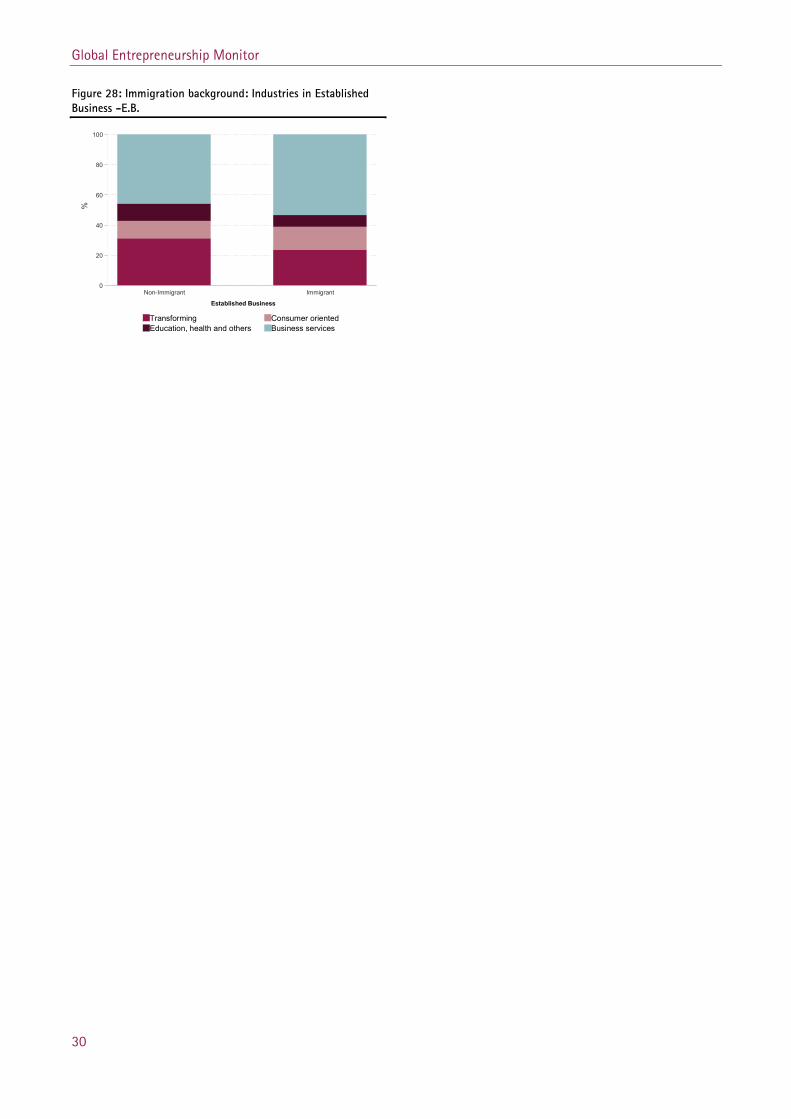
Figure 27 and Figure 28 show the relationship between immigration background economic activity
(as defined in section 3.4) of TEA and established business. It is important to note that first and second generations are grouped together because of the low number of observations. Several patterns emerge. Firstly, in Figure 27, one can see that in the early business activities (TEA), business services is the most common industry for immigrants (42%) while for non-immigrants is the transforming industry (32%). The proportion of entrepreneurs active in consumer-oriented services (e.g. trade, hotels & restaurants) with immigration background is higher than the proportion among non-immigrants.
Figure 27: Immigration background: Industry of TEA
Figure 28 shows that most established businesses are concentrated in the business service industries both for migrants and non-migrants’ owned businesses (42% and 43% respectively. The comparison of Figure 27 and Figure 28, shows that the TEA and established companies differ in terms of industries. Interestingly, while 16 % of new firms (TEA) of immigrants are active in the transforming/ extractive industry, among firm older than 42 months, this percentage increases up to 22%. For non-immigrants, the percentage of business services firms passes from 26% in early stages to 45% in later stages. Overall, in line with other studies (Logan et al. 2003), figures suggest that nationals and immigrants specialize in different industries.
0
20
40
60
80
100
%
TEA
Non-Immigrant Immigrant
Transforming Consumer orientedEducation, health and others Business services
Global Entrepreneurship Monitor
30
Figure 28: Immigration background: Industries in Established Business -E.B.
0
20
40
60
80
100
%
Established Business
Non-Immigrant Immigrant
Transforming Consumer orientedEducation, health and others Business services
Global Entrepreneurship Monitor
31
5.2 Well-being in Luxembourg
In recent years, subjective well-being has attracted the attention of policy-makers, as societies increasingly express the need of complementing traditional income-based measures of welfare with measures of well-being and quality of life. In addition to the issue of whether economic growth leads to improvements in people’s well-being, a wide literature examines the determinants of well-being. More recently, some studies tested the role of well-being at individual and country level. Well-being, however, has seldom been studied in conjunction with entrepreneurship.
Subjective well-being (SWB) refers to people’s experience with their lives, and it comprises both emotional reactions and cognitive judgments (Diener, 1984). A common measure of SWB is life satisfaction, that is, the global cognitive judgments of satisfaction with one’s life. APS survey for Luxembourg includes a question on respondents’ life satisfaction on all the waves of the survey, namely in 2013, 2014 and 2015.
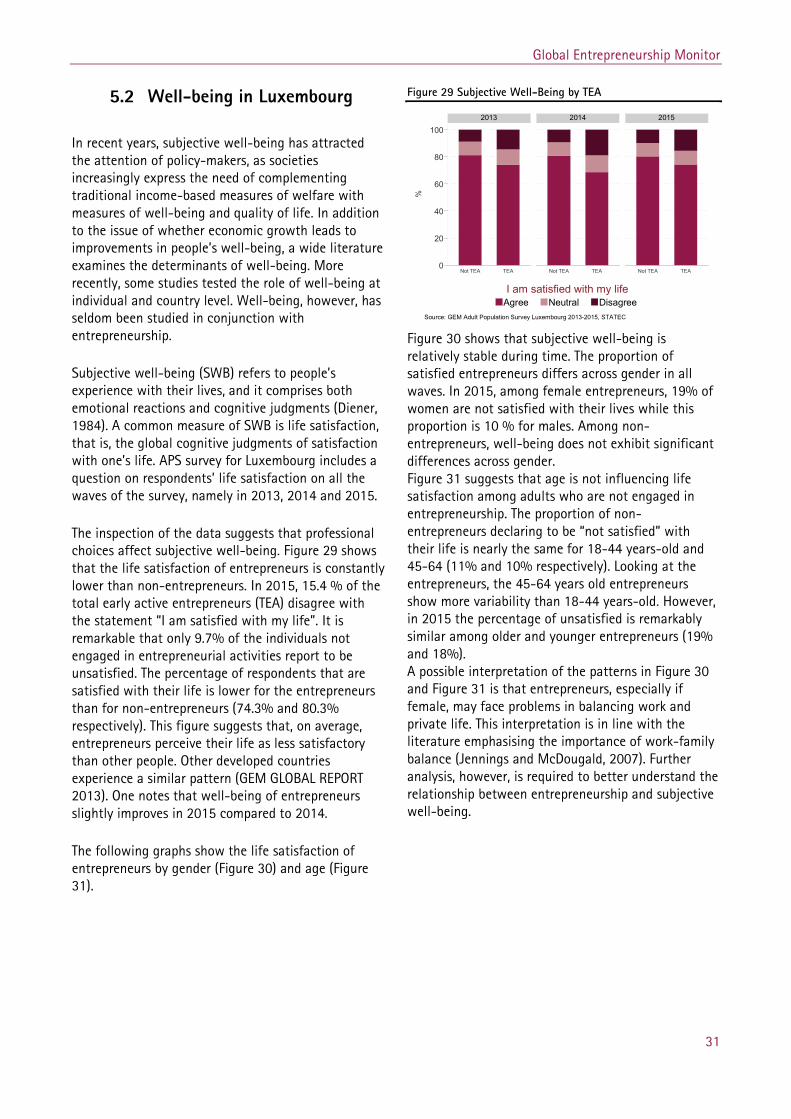
The inspection of the data suggests that professional choices affect subjective well-being. Figure 29 shows that the life satisfaction of entrepreneurs is constantly lower than non-entrepreneurs. In 2015, 15.4 % of the total early active entrepreneurs (TEA) disagree with the statement “I am satisfied with my life”. It is remarkable that only 9.7% of the individuals not engaged in entrepreneurial activities report to be unsatisfied. The percentage of respondents that are satisfied with their life is lower for the entrepreneurs than for non-entrepreneurs (74.3% and 80.3% respectively). This figure suggests that, on average, entrepreneurs perceive their life as less satisfactory than other people. Other developed countries experience a similar pattern (GEM GLOBAL REPORT 2013). One notes that well-being of entrepreneurs slightly improves in 2015 compared to 2014.
The following graphs show the life satisfaction of entrepreneurs by gender (Figure 30) and age (Figure 31).
Figure 29 Subjective Well-Being by TEA
0
20
40
60
80
100
Not TEA TEA Not TEA TEA Not TEA TEA
2013 2014 2015
Agree Neutral DisagreeI am satisfied with my life
%
Source: GEM Adult Population Survey Luxembourg 2013-2015, STATEC
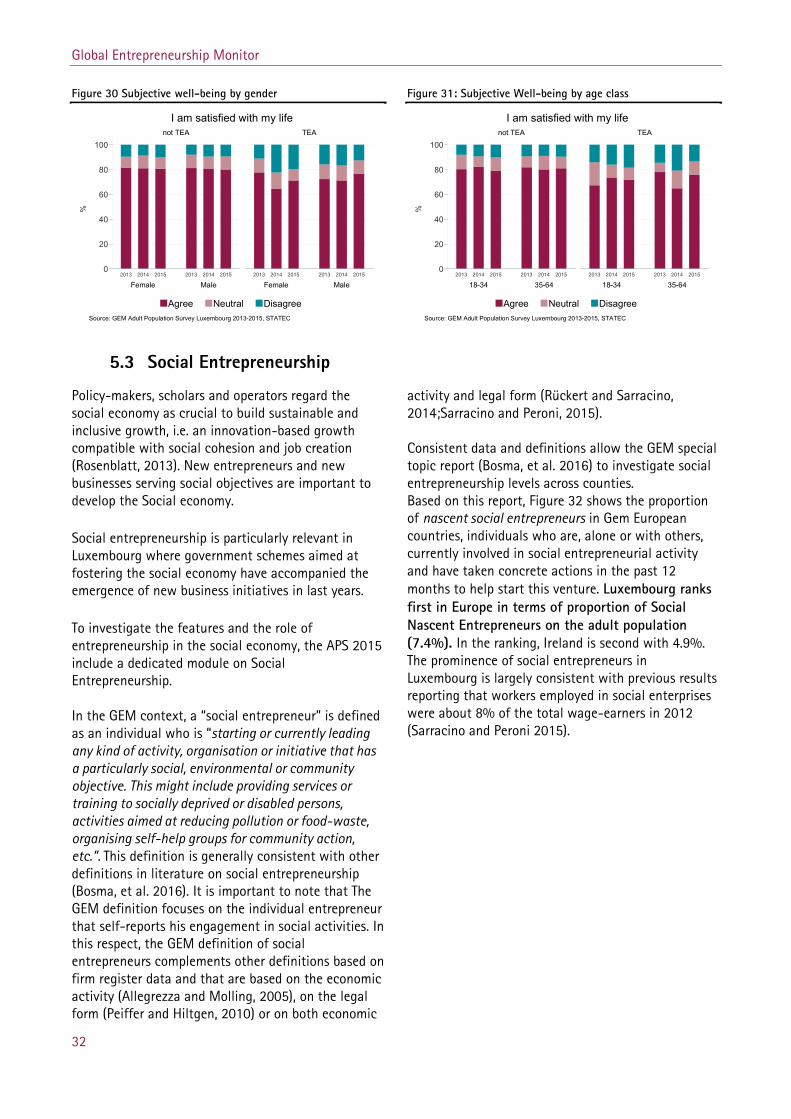
Figure 30 shows that subjective well-being is relatively stable during time. The proportion of satisfied entrepreneurs differs across gender in all waves. In 2015, among female entrepreneurs, 19% of women are not satisfied with their lives while this proportion is 10 % for males. Among non- entrepreneurs, well-being does not exhibit significant differences across gender. Figure 31 suggests that age is not influencing life satisfaction among adults who are not engaged in entrepreneurship. The proportion of non-entrepreneurs declaring to be “not satisfied” with their life is nearly the same for 18-44 years-old and 45-64 (11% and 10% respectively). Looking at the entrepreneurs, the 45-64 years old entrepreneurs show more variability than 18-44 years-old. However, in 2015 the percentage of unsatisfied is remarkably similar among older and younger entrepreneurs (19% and 18%). A possible interpretation of the patterns in Figure 30 and Figure 31 is that entrepreneurs, especially if female, may face problems in balancing work and private life. This interpretation is in line with the literature emphasising the importance of work-family balance (Jennings and McDougald, 2007). Further analysis, however, is required to better understand the relationship between entrepreneurship and subjective well-being.
Global Entrepreneurship Monitor
32
Figure 30 Subjective well-being by gender
0
20
40
60
80
100
Female Male Female Male2013 2014 2015 2013 2014 2015 2013 2014 2015 2013 2014 2015
not TEA TEA
Agree Neutral Disagree
%
Source: GEM Adult Population Survey Luxembourg 2013-2015, STATEC
I am satisfied with my life
Figure 31: Subjective Well-being by age class
0
20
40
60
80
100
18-34 35-64 18-34 35-642013 2014 2015 2013 2014 2015 2013 2014 2015 2013 2014 2015
not TEA TEA
Agree Neutral Disagree
%
Source: GEM Adult Population Survey Luxembourg 2013-2015, STATEC
I am satisfied with my life
5.3 Social Entrepreneurship Policy-makers, scholars and operators regard the social economy as crucial to build sustainable and inclusive growth, i.e. an innovation-based growth compatible with social cohesion and job creation (Rosenblatt, 2013). New entrepreneurs and new businesses serving social objectives are important to develop the Social economy.
Social entrepreneurship is particularly relevant in Luxembourg where government schemes aimed at fostering the social economy have accompanied the emergence of new business initiatives in last years.
To investigate the features and the role of entrepreneurship in the social economy, the APS 2015 include a dedicated module on Social Entrepreneurship. In the GEM context, a “social entrepreneur” is defined as an individual who is “starting or currently leading any kind of activity, organisation or initiative that has a particularly social, environmental or community objective. This might include providing services or training to socially deprived or disabled persons, activities aimed at reducing pollution or food-waste, organising self-help groups for community action, etc.”. This definition is generally consistent with other definitions in literature on social entrepreneurship (Bosma, et al. 2016). It is important to note that The GEM definition focuses on the individual entrepreneur that self-reports his engagement in social activities. In this respect, the GEM definition of social entrepreneurs complements other definitions based on firm register data and that are based on the economic activity (Allegrezza and Molling, 2005), on the legal form (Peiffer and Hiltgen, 2010) or on both economic
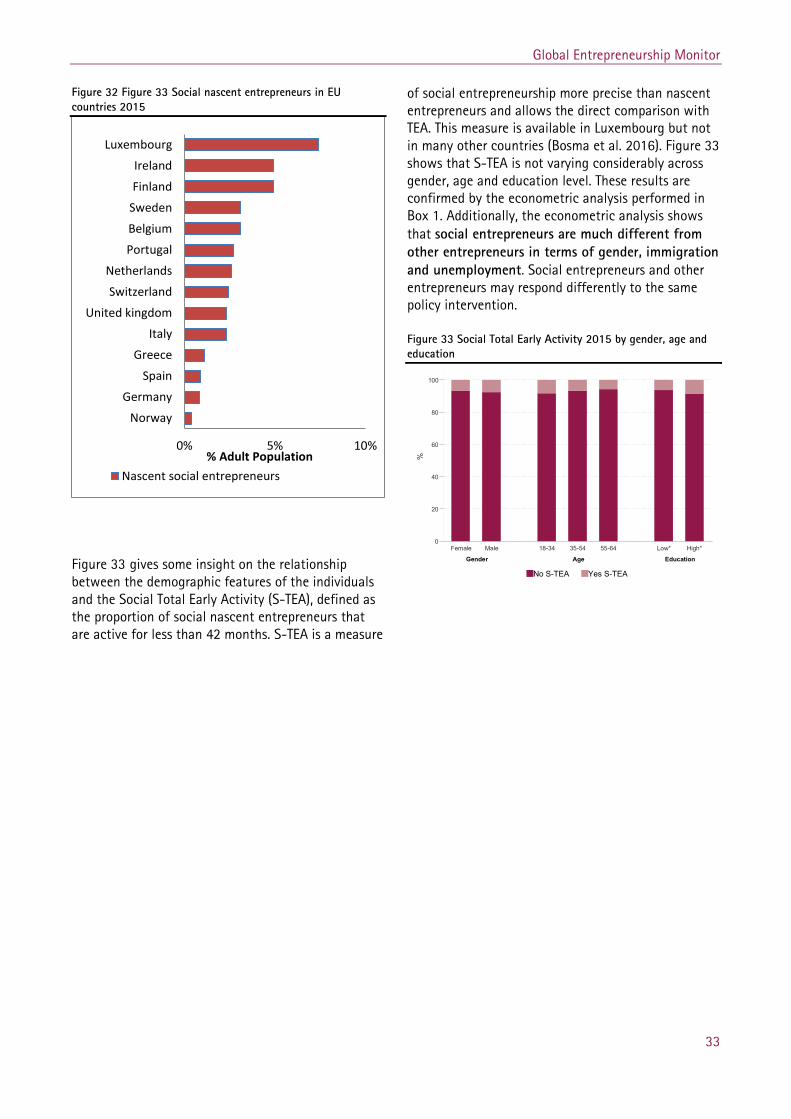
activity and legal form (Rückert and Sarracino, 2014;Sarracino and Peroni, 2015). Consistent data and definitions allow the GEM special topic report (Bosma, et al. 2016) to investigate social entrepreneurship levels across counties. Based on this report, Figure 32 shows the proportion of nascent social entrepreneurs in Gem European countries, individuals who are, alone or with others, currently involved in social entrepreneurial activity and have taken concrete actions in the past 12 months to help start this venture. Luxembourg ranks first in Europe in terms of proportion of Social Nascent Entrepreneurs on the adult population (7.4%). In the ranking, Ireland is second with 4.9%. The prominence of social entrepreneurs in Luxembourg is largely consistent with previous results reporting that workers employed in social enterprises were about 8% of the total wage-earners in 2012 (Sarracino and Peroni 2015).
Global Entrepreneurship Monitor
33
Figure 32 Figure 33 Social nascent entrepreneurs in EU countries 2015
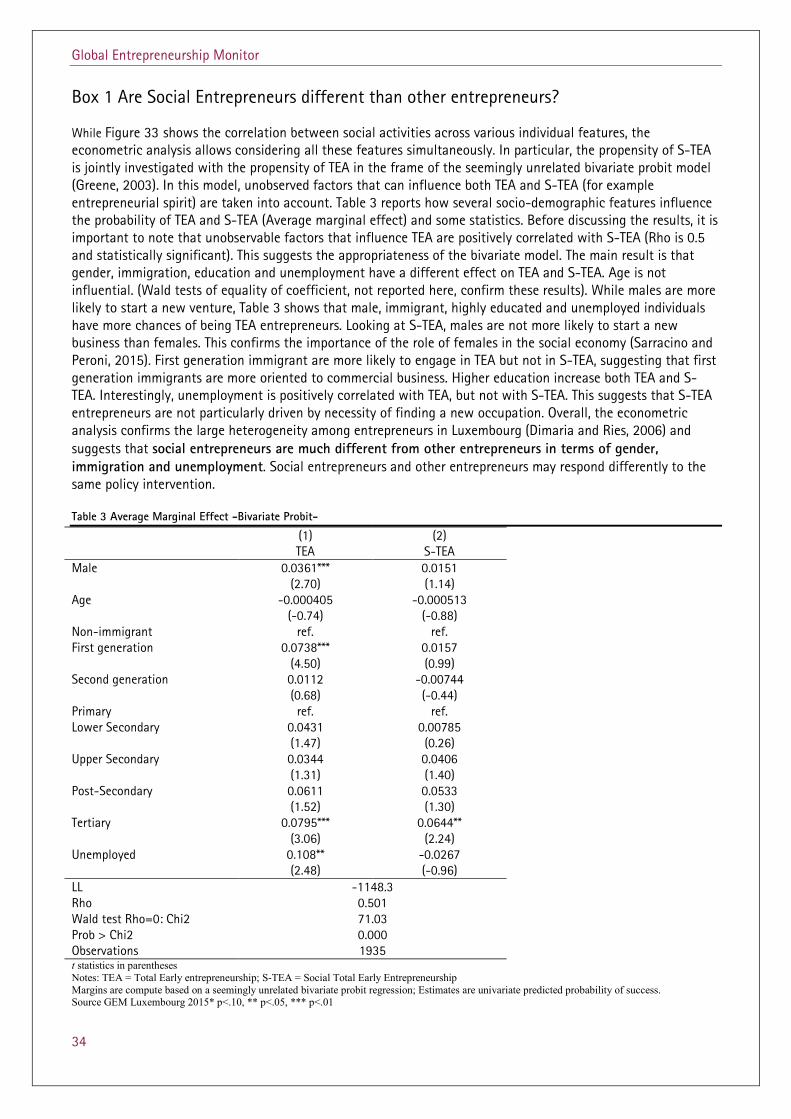
Figure 33 gives some insight on the relationship between the demographic features of the individuals and the Social Total Early Activity (S-TEA), defined as the proportion of social nascent entrepreneurs that are active for less than 42 months. S-TEA is a measure
of social entrepreneurship more precise than nascent entrepreneurs and allows the direct comparison with TEA. This measure is available in Luxembourg but not in many other countries (Bosma et al. 2016). Figure 33 shows that S-TEA is not varying considerably across gender, age and education level. These results are confirmed by the econometric analysis performed in Box 1. Additionally, the econometric analysis shows that social entrepreneurs are much different from other entrepreneurs in terms of gender, immigration and unemployment. Social entrepreneurs and other entrepreneurs may respond differently to the same policy intervention. Figure 33 Social Total Early Activity 2015 by gender, age and education
0% 5% 10%
Norway
Germany
Spain
Greece
Italy
United kingdom
Switzerland
Netherlands
Portugal
Belgium
Sweden
Finland
Ireland
Luxembourg
% Adult Population Nascent social entrepreneurs
0
20
40
60
80
100
%
Gender Age Education
Female Male 18-34 35-54 55-64 Low* High*
No S-TEA Yes S-TEA
Global Entrepreneurship Monitor
34
Box 1 Are Social Entrepreneurs different than other entrepreneurs? While Figure 33 shows the correlation between social activities across various individual features, the econometric analysis allows considering all these features simultaneously. In particular, the propensity of S-TEA is jointly investigated with the propensity of TEA in the frame of the seemingly unrelated bivariate probit model (Greene, 2003). In this model, unobserved factors that can influence both TEA and S-TEA (for example entrepreneurial spirit) are taken into account. Table 3 reports how several socio-demographic features influence the probability of TEA and S-TEA (Average marginal effect) and some statistics. Before discussing the results, it is important to note that unobservable factors that influence TEA are positively correlated with S-TEA (Rho is 0.5 and statistically significant). This suggests the appropriateness of the bivariate model. The main result is that gender, immigration, education and unemployment have a different effect on TEA and S-TEA. Age is not influential. (Wald tests of equality of coefficient, not reported here, confirm these results). While males are more likely to start a new venture, Table 3 shows that male, immigrant, highly educated and unemployed individuals have more chances of being TEA entrepreneurs. Looking at S-TEA, males are not more likely to start a new business than females. This confirms the importance of the role of females in the social economy (Sarracino and Peroni, 2015). First generation immigrant are more likely to engage in TEA but not in S-TEA, suggesting that first generation immigrants are more oriented to commercial business. Higher education increase both TEA and S-TEA. Interestingly, unemployment is positively correlated with TEA, but not with S-TEA. This suggests that S-TEA entrepreneurs are not particularly driven by necessity of finding a new occupation. Overall, the econometric analysis confirms the large heterogeneity among entrepreneurs in Luxembourg (Dimaria and Ries, 2006) and suggests that social entrepreneurs are much different from other entrepreneurs in terms of gender, immigration and unemployment. Social entrepreneurs and other entrepreneurs may respond differently to the same policy intervention. Table 3 Average Marginal Effect -Bivariate Probit-
(1) (2) TEA S-TEA Male 0.0361*** 0.0151 (2.70) (1.14) Age -0.000405 -0.000513 (-0.74) (-0.88) Non-immigrant ref. ref. First generation 0.0738*** 0.0157 (4.50) (0.99) Second generation 0.0112 -0.00744 (0.68) (-0.44) Primary ref. ref. Lower Secondary 0.0431 0.00785 (1.47) (0.26) Upper Secondary 0.0344 0.0406 (1.31) (1.40) Post-Secondary 0.0611 0.0533 (1.52) (1.30) Tertiary 0.0795*** 0.0644** (3.06) (2.24) Unemployed 0.108** -0.0267 (2.48) (-0.96) LL -1148.3
0.501 71.03 0.000 1935
Rho Wald test Rho=0: Chi2 Prob > Chi2 Observations t statistics in parentheses Notes: TEA = Total Early entrepreneurship; S-TEA = Social Total Early Entrepreneurship Margins are compute based on a seemingly unrelated bivariate probit regression; Estimates are univariate predicted probability of success. Source GEM Luxembourg 2015* p<.10, ** p<.05, *** p<.01
Global Entrepreneurship Monitor
35
6 Conclusions Entrepreneurship is an important dimension of innovation and a driver of productivity, and ultimately an engine of economic growth. On an early basis, GEM (Global Entrepreneurship Monitor) collects internationally comparable data to better understand the evolution and the characteristics of entrepreneurial activities across countries. Based on GEM data, this report gives an overview of the state of entrepreneurship in Luxembourg, discussing its features in a comparative perspective. This section draws the main conclusions.
Strengths and constraints of the entrepreneurial “ecosystem”
Institutional and cultural differences shape the entrepreneurial “ecosystem” and concur to determine the outcome of the entrepreneurial process. Results of the survey show that infrastructures and governmental policies are the main strengths of the Luxembourgish system of entrepreneurship. In contrast, the low level of entrepreneurial education in primary and secondary school is identified as the main weaknesses of the system. Experts perceive that the primary and secondary education system is not sufficiently encouraging and supporting the undertaking of personal initiatives. Adverse social and cultural norms are also cited as barriers towards the pursuit of an entrepreneurial career. Furthermore, the access to finance represents an important constraint faced by entrepreneurs.
The key indicator provided by the GEM dataset of the entrepreneurial activity is the early-stage entrepreneurial activity (TEA). This measure is defined as the proportion of entrepreneurs on total resident population. In 2015, the proportion of entrepreneurs in Luxembourg (10.2%) is considerably higher compared to neighbouring countries (around 5%) and previous years (7.1% in 2014 and 8.7% in 2013). Luxembourgish early-stage entrepreneurial activity confirms to be one of the highest among other developed countries. In 2015, Canada ranks the highest (15%) and Germany ranks the lowest (4%). Entrepreneurship is relatively stable over time
The comparison of GEM data from the available surveys shows that entrepreneurial conditions are generally unchanged. New data from the GEM 2015
survey confirm that the entrepreneurs in Luxembourg are primarily motivated by the desire for independence rather than by necessity.
The profile of the entrepreneur and start-ups
Efficient policies aiming to promote entrepreneurship require a deep knowledge of different typologies of entrepreneurs. Given the budget constraints faced by governments, it is important that policies target groups of individuals and new business that may benefit the most. The main features and the different typologies of entrepreneurs and start-ups emerging from the GEM surveys are summarized and presented below:
“Gender”: In 2015, the share of early entrepreneurs among males (11.6%) is higher than the share of young entrepreneurs among females (8.7%). However, the proportion of female entrepreneurs increases from 2014.
"Immigrant": Immigration confirms to be an important source of entrepreneurship. First generation immigrants play a major role in entrepreneurial activity (15.1% of first generation immigrants are engaged in entrepreneurship, against 7.2% of non-immigrants and 8.4% of second generation).
“Social”: Luxembourg ranks first in Europe in terms of proportion of Nascent Social Entrepreneurs on the adult population (7.4%). Nascent Social Entrepreneurs are individuals that are involved in entrepreneurial activity with particularly social, environmental or community objectives.
"The cherry-picking": residents in Luxembourg are risk averse and opportunity driven (only 9.7% of Luxembourgish entrepreneurs are motivated primarily by a lack of other options for making a living compared to the 22.4% of European entrepreneurs).
"Dissatisfied": on average, entrepreneurs describe themselves more often as dissatisfied with their lives (15.4%) than others (9.7%).
In addition to providing information on individual characteristic of entrepreneurs, GEM allows us also to describe characteristics of start-up firms in Luxembourg. The typical start-up has one owner
Global Entrepreneurship Monitor
36
(50%) and 40% of the businesses running for less than 42 months are providing business services and about 27% are consumer-oriented; this confirms the strong service orientation of Luxembourg’s economy. Concerning the funding of new businesses, 6% of the interviewees answer that they provide funds for a new business started by someone else. Out of those who declared the amount provided, 60% provided less than 10,000 €. One can see that close family and friends are giving most of the funding suggesting some difficulties of new firms to access bank and other traditional funding.
Future developments
This report confirms the importance of collecting GEM data to investigate all aspects of entrepreneurship: the “ecosystem”, the individual entrepreneurs, and new businesses. GEM data complement business register data and provide a more comprehensive picture of entrepreneurship. Collecting data on an annual basis is particularly important to evaluate the evolution of entrepreneurship.
This report sheds lights on important aspects of entrepreneurship, such as the evolution over time and the relevance of individual motivations. It also allows us to study the link between entrepreneurship and immigration background and life satisfaction.
Other important aspects of entrepreneurship in Luxembourg remain to be explored. They will be investigated in future studies.
Finally, the current survey covers adult residents in Luxembourg, but largely neglects the potential contribution of cross-border entrepreneurs. Several thousands of individuals commute on a daily basis to Luxembourg to work. Their contribution to entrepreneurship may be important. Future surveys will attempt to evaluate the magnitude of cross-country entrepreneurship in Luxembourg.
7 References
Allegrezza, S. and Molling, V. (2005). “À la recherche de l’économie sociale et solidaire, le cas du Grand-Duché de Luxembourg”. Statec working papers. http://www.statistiques.public.lu/catalogue-publications/economie-statistiques/2006/8-2006.pdf
Block, J.H. and Wagner, M., (2010) ‘Necessity and Opportunity Entrepreneurs in Germany: Characteristics and Earnings Differentials’ Schmalenbach Business Review, Vol. 62, pp. 154-174, April 2010.
Bosma, N. and J. Levie. ‘Global Entrepreneurship Monitor, 2009 Executive Report’. (2010), Babson Park, MA, U.S.: Babson College; Santiago, Chile: Universidad del Desarrollo; Reykjavík, Iceland: Háskólinn Reykjavík University; and London, U.K.: Global Entrepreneurship Research Association.
Bosma, N. S., K. Jones, E. Autio and J. Levie (2008). ‘Global Entrepreneurship Monitor 2007 Executive Report’. London, U.K.: London Business School and Babson Park, MA: Babson College.
Bosma, N., Schøtt T., Terjesen S. and Kew P. and J. Levie. GEM 2015 Report on Social Entrepreneurship http://gemconsortium.org/report/49542
Buenstorf, G. (2009). ‘Opportunity spin-offs and necessity spin-offs’. International Journal of Entrepreneurial Venturing, 1, 22-40.
Global Entrepreneurship Monitor
37
Colombo, M.G. and Grilli, L., (2005). ‘Founders' human capital and the growth of new technology-based firms: A competence-based view’. Research Policy, 34(6), pp. 795-816.
Dawson, C. and Henley, A. (2012). ‘Push versus pull entrepreneurship: An ambiguous distinction?’ International Journal of Entrepreneurial Behavior and Research, 18, 697-719.
Diener, E. (1984). Subjective well-being. Psychological Bulletin, 95, 542–575.
DiMaria C-H and Ries J. (2006) “In Search of the Entrepreneurial Profile(S) In Luxembourg” Brussels Economic review - cahiers Economiques de Bruxelles vol. 49 - n°1 spring 2006
Driver, A., Wood, E., Herrington, M. and Segal, N., (2001) ‘Global Entrepreneurship Monitor: 2001 South African Executive Report,’ Cape Town Graduate school of Business.
Easterlin R. (1974). Does Economic Growth Improve the Human Lot? Some Empirical Evidence. In Paul A. David and Melvin W. Reder, eds., Nations and Households in Economic Growth: Essays in Honor of Moses Abramovitz, New York: Academic Press
GEM GLOBAL REPORT 2015/2016, authored by Kelley D. Singer S. Herrington M. Herrington AVAILABLE AT HTTP://WWW.GEMCONSORTIUM.ORG/REPORT/49480
Global Entrepreneurship Monitor Luxembourg 2013, authored by Fletcher D. E., Giacomin O. and Höck P. R. and published in 2014.
Hessels, J., Van Gelderen, M. and Thurik, R. (2008). ‘Entrepreneurial aspirations, motivations, and their drivers’. Small Business Economics, 31, 323-339.
Hindle K. and Klyver K. (2007), ‘Exploring the relationship between media coverage and participation in entrepreneurship: Initial global evidence and research implications’ International Entrepreneurship and Management Journal June Volume 3, Issue 2, 217-242
Jennings, J. E., Mcdougald, M. S. (2007). ‘Work-Family Interface Experiences and Coping Strategies: Implications for Entrepreneurship Research And Practice’. ACADEMY OF MANAGEMENT REVIEW, 32(3), 747-760.
Kautonen, T. and Palmroos, J. (2010). ‘The impact of a necessity-based start-up on subsequent entrepreneurial satisfaction’. International Entrepreneurship and Management Journal, 6, 285-300.
Kelly, J. K., Singer S. Herrington M. ‘Global Entrepreneurship Monitor, 2011 Global report’ (2012). Babson College; Santiago, Chile: Universidad del Desarrollo; Universiti Tun Abdul Razak, Kuala Lampur, Malaysia, London Business School, London, UK. Global Entrepreneurship Research Association (GERA)
Kerr, William R., and Ramana Nanda. 2011 "Financing Constraints and Entrepreneurship." In Handbook of Research on Innovation and Entrepreneurship, edited by David Audretsch, Oliver Falck, and Stephan Heblich, 88–103. Cheltenham, U.K.: Edward Elgar Publishing, 2011. (NBER WP 15498, HBS WP 10-013.)
Kotha, R. and George, G. (2012) "Friends, family, or fools: Entrepreneur experience and its implications for equity distribution and resource mobilization" Journal of Business Venturing, vol 27 (5), p. 525-543.
Logan J. R., Alba R.D. and Stults B. J. (2003) Enclaves and Entrepreneurs: Assessing the Payoff for Immigrants and Minorities International Migration Review Vol. 37, No. 2, pp. 344-388
Global Entrepreneurship Monitor
38
Myrick J.G., Willoughby J.F., Noar S.M., Brown J. (2013) “Reactions of Young Adults to the Death of Apple CEO Steve Jobs: Implications for Cancer Communication’ Communication Research Reports. Vol 30 (2), pp.115-126
OECD (2015), OECD Economic Surveys: Luxembourg 2015, OECD Publishing, Paris.
Peiffer, J. and Hiltgen, M. (2010). Vers de nouvelles perspectives pour l’Économie Solidaire au Luxembourg ? À la recherche de l’économie solidaire et sociale au Luxembourg. Quelques chiffres préliminaires. Conférence CRP Henri Tudor.
Peltier, F., Thill, G. and Heinz, A. (2012). ‘La population par nationalité. (1)’ In S. Allegrezza, D. Ferring, H. Willems & P. Zahlen (Eds.), Recensement de la population 2011: : Premiers résultats N°4. Luxembourg: Institut national de la statistique et des études économiques (STATEC) & University of Luxembourg, Integrative Research Unit on Social and Individual Development (INSIDE).
Peroni C., Riillo C. Sarracino F. (2016) “Entrepreneurship and immigration: evidence from GEM Luxembourg” Small Business Economics 46(4), pp 639-656.
Reynolds, P. D., M. Hay, S.M. Camp, (1999) Global Entrepreneurship Monitor, Executive Report.
Reynolds, P., N. Bosma, E. Autio, S. Hunt, N. De Bono, I. Servais, P. Lopez-Garcia, and N. Chin. (2005). global entrepreneurship monitor: data collection design and implementation 1998-2003. Small Business Economics 24 (3): 205- 231.
Roster, C. A., Rogers, R. D., Albaum, G., and Klein, D. (2004). ‘A comparison ofresponse characteristics from web and telephone surveys’. International Journal of Market Research, 46:359–374.
Rückert, E. and Sarracino, F. (2014). “Assessing the social and solidarity economy in Luxembourg”. Statec working papers. http://www.statistiques.public.lu/catalogue-publications/economie-statistiques/2014/75-2014.pdf
Sarracino F. and Peroni C., Report on Social Enterprises in Luxembourg, September 2015. http://www.statistiques.public.lu/en/publications/theme/enterprises/social-enterprises/index.html
Sarracino F., Riillo C. A. F. and Mikucka, M. (2016) “Comparability of Web and Telephone survey for the Measurement of Subjective Well-being“. Mimeo
Sarracino, f., Gosset, A. (2016) "Non-economic outcomes of social entrepreneurship in Luxembourg", MPRA paper, 2016
Schenker N, Raghunathan TE, Chiu PL, Makuc DM, Zhang G, Cohen AJ. (2008)‚Multiple imputation of family income and personal earnings in the National Health Interview Survey: Methods and examples’. National Center for Health Statistics. 2008. Available from: http://www.cdc.gov/nchs/data/nhis/tecdoc.pdf.
Schumpeter, J. (1934). The Theory of Economic Development: An Inquiry Into Profits, Capital, Credit, Interest, And The Business Cycle. Harvard University Press.
Schwab, K. (2011). ‘The Global competiveness report 2011-2012.’ World Economic Forum. Geneva Switzerland. p. 4-9
Solymossy, E. (1997). ‘Push/pull motivations: Does it matter in venture performance?’. http://www.babson.edu/entrep/fer/papers97/solomo/soly1.htm (accessed July 17, 2013).
Global Entrepreneurship Monitor
39
STATEC (2012). ‘Le Luxembourg en chiffres.’ Luxembourg: Institut national de la statistique et des études économiques.
STATEC (2013) Niveau d’éducation de la population du Grand-Duché de Luxembourg, RP 2011 - Premiers résultats N°19, authored by Peltier, F., Thill, G. ; Heinz, A. Accessed 08/06/2015 http://www.statistiques.public.lu/fr/publications/series/rp2011/2013/19-13-education/index.html
STATEC (2015a) « N° 14/2015 Regards sur l'utilisation des TIC par les particuliers » Accessed the 14/07/2016 at http://www.statistiques.public.lu/catalogue-publications/regards/2015/PDF-14-2015.pdf
STATEC (2015b) Table C1100 Household disposable monthly income and household disposable income per adult-equivalent (in EUR) accessed the 03/06/2014 at http://www.statistiques.public.lu/stat/TableViewer/tableView.aspx?ReportId=2114&IF_Language=eng&MainTheme=3&FldrName=1&RFPath=29
STATEC (2015c) “Table x021 Population par canton et commune 1821 – 2015” accessed the 03/06/2014 at http://www.statistiques.public.lu/stat/TableViewer/tableView.aspx?ReportId=397&IF_Language=fra&MainTheme=2&FldrName=1&RFPath=69
STATEC (2015d) « Communiqué de presse n11-2015 La population du Grand-Duché continue à augmenter ». accessed the 08/06/2015 at http://www.statistiques.public.lu/fr/actualites/population/population/2015/04/20150408/20150408.pdf
STATEC (2015e). « B3002 Domestic payroll employment by citizenship and country of residence 1995 – 2015” In Le portail des statistiques: Grand-Duché de Luxembourg: retrieved 10/07/2013 from: http://www.statistiques.public.lu/stat/TableViewer/tableView.aspx?ReportId=7252&IF_Language=eng&MainTheme=2&FldrName=3&RFPath=92
Stawinska, A. (2012). ‘Entrepreneurship culture: The European perspective and national perspectives on the example of Luxembourg.’ In E. C. Eurostat (Ed.), Entrepreneurship determinants: Culture and capabilities. Luxembourg: Publications Office of the European Union.
Stel, A.V., Carree, M. and Thurik, R., 2005. The effect of entrepreneurial activity on national economic growth. Small Business Economics, 24(3), pp. 311-321.
Wennekers S., Thurik R. (1999) “Linking Entrepreneurship and Economic Growth” Small Business Economics 1999, Volume 13, Issue 1, pp 27-56
World Economic Forum (2015) ‘The Global Competitiveness Report 2014–2015’ available at http://www3.weforum.org/docs/WEF_GlobalCompetitivenessReport_2014-15.pdf