Embed Size (px)
Citation preview
T h e J o u r n a l o f D e v e l o p i n g A r e a s Volume 48 No. 4 Fall 2014
GLOBAL FINANCIAL CRISIS
AND CONTAGION: EVIDENCE
FOR THE ‘BRIC’ ECONOMIES*
Krishna Reddy Chittedi**
Central University of Tamil Nadu, India
ABSTRACT
The present study examined the effects of contagion from the developed markets (The US, the UK,
and Japan) to the BRIC stock markets during the period of Jan 1996 to July 2011 using daily data.
It applied Dynamic Condition Correlations (DCC) model and Asymmetric Generalized Dynamic
Conditional Correlation (AG-DCC) approach to capture the effects of contagion originated from
developed countries. Stock market indices are observed to display a persistent and high correlation
between them during and after high volatility periods. Evidence on contagion implies that
diversification sought by investing in multiple markets from different regional blocks is likely to be
lower when it is most desirable. As a result, an investment strategy focused solely on international
diversification seems not to work in practice during turmoil periods. Since countries and financial
markets react differently to sovereign shocks, stocks from different emerging economies could
provide advantages over debt-only or equity-only portfolios.
JEL Classifications: F37, G01, G17
Keywords: BRIC emerging markets, Global Financial Crisis and DCC and AGDCC GARCH
Corresponding Author Email Address: [email protected]
INTRODUCTION
The globalization of financial systems and the acceleration of information transmission
have increased the risk of financial crises, as a crisis in one country can spread to other
countries and bring about worldwide crises. Portfolio equity investment was introduced
into emerging economies to meet their foreign capital requirements and to promote their
capital market development. The equity market performance is just one manifestation of
the staggering rise in Brazil, Russia, India and China (BRIC) importance to the global
economy. These countries made a critical transition from a developing country to an
emerging market. Each of them is important as an individual market and the combined
effect of the group as a whole will change the face of the global economics. Neill and
Anna (2009) projections suggest that the BRICs could account for almost 50% of global
equity markets by 2050. The BRICs come under the largest twenty countries in the world
and they are projected to be among the most powerful economies within the next 50 years
(Wilson and Purushothaman, 2003; Tamos Fingar 2008). For instance, Brazil and India
underwent official equity market liberalization in May 1991 and November, 1992,
respectively, and have continued the reform process since then. Major institutional
reforms have been implemented in Russia and China including the reopening and
establishment of new stock exchanges.
244
Access to international capital markets has increased as corporations from each
BRIC countries have issued Depository Receipts (DRs). Depositary Receipts (DRs),
which include American Depositary Receipts and Global Depositary Receipts are
negotiable U.S. securities that generally represent a non-U.S. company's publicly traded
equity. The increasing demand for Depositary Receipts is driven by the desire of
individual and institutional investors to diversify their portfolios, reduce risk and invest
internationally in the most efficient manner possible. The BRIC equity markets have
experienced extremely high growth in 2007 briefly transformed the Chinese (Shanghai
and Shenzhen) and Indian (Bombay and NSE) stock markets to the fourth and fifth
largest world equity markets respectively by the end of 2007 (World Federation of
Exchanges, 2008; Merrill Lynch, 2008). Emerging markets issuers accounted for 58% of
DR trading value and 61% of DR trading volume globally. The four BRIC countries
alone accounted for 49% of the global value during 2010. DR capital raising transactions
were dominated by issuers from China and India (BNYM 2010).
According to the World Bank data, the global financial crisis had a pronounced
impact on net capital flows to developing countries in 2008, Portfolio equity inflows
turned sharply negative. China was the only developing country to receive a sizeable net
inflow of portfolio equity in 2008, but at $8.7 billion it was well below half the $18.5
billion recorded in 2007. India and Russia were the hardest hit: both countries
experienced outflows of $15 billion in 2008 compared to net inflows of $35 billion
(India) and $19 billion (Russia) in 2007.
Financial crises and contagion have attracted enormous attention among
academics and practitioners in the last decade of the 20th century, of which the five major
crises are: Mexican currency crisis in 1994–1995, Asian crisis in 1997, Russian default in
1998, Argentine crisis in 1999–2001, Brazilian stock market crash in 1997–1998 and the
United States of America (USA) Subprime crisis 2008. Common to all these events was
the fact that the turmoil, which had originated in one market would spill over to a wide
range of markets and countries, in a way that was hard to explain on the basis of changes
in fundamentals (Rodriguez, 2007). Generally, contagion refers to the spread of financial
disturbances from one country to the other(s). There is an extensive literature on financial
contagion during several crises of the 1980s and 1990s (see Dornbusch et al., 2000;
Kaminsky et al., 2003, for excellent surveys).
The 2008 USA subprime crisis has highlighted the risks of financial structures in
a financially integrated world. The concatenation of events followed the same logic as in
previous crises. The recomposition of the securities portfolio towards safer assets as well
as the rearrangement of banking balances caused, on the one hand, the withdrawal of
funds from emerging economies. This was particularly noticeable in the stock markets,
where prices started to fall parallel to what was happening in developed economies. This
process brought about pressures from exchange rates, which began to depreciate against
dollar (Ferreiro et al 2011).
These financial collapses have driven researchers to ask how such shocks are
transmitted internationally and why they have such intensity. In addition to its severe
effects in Asia, the crisis put pressure on emerging markets outside the region, and has
contributed to virulent contagion and volatility in international financial markets. The so-
called 'contagion' effect of the crisis drew a lot of attention to the linkages among
emerging stock markets. Yet reducing volatility and contagion has been an important
245
stated objective of recent reforms. According to Fischer (1998), reasons for revamping
the international financial architecture and smoothing the global economy is as follows:
i) The high degree of volatility of international capital flows to emerging markets and
these markets’ limited ability to deal with this volatility made the recipient country
vulnerable to shocks and crises that are excessively large, frequent, and disruptive. ii)
International capital markets appear to be highly susceptible to contagion. Thus proposals
to reform the international financial architecture must be based on a thorough
understanding of the causes and consequences of contagion. In this context, this study
examines the extent of the current global crisis and its induced contagion effects through
an empirical investigation of extreme financial interdependences of some selected
emerging markets with that of the US.
The remainder of the study is organized as follows: Section 2 describes the
analytical framework of the study. Section 3 presents motivation and Objective of the
study. Section 4 presents data and Methodology. Section 5 reports the empirical
estimation results and tests the time- varying correlation coefficient. Finally, Section 6
contains the conclusion.
ANALYTICAL FRAMEWORK
International capital flows steadily increased over the last couple of decades as many
financial markets opened their borders to foreign investors. For example, inter-national
portfolio investments have gradually grown from cumulative net flows in Japan, the UK,
and the US of about one billion US dollars in the 1980s to about two billion US dollars in
the 1990s. While most European and G-7 countries liberalized their stock markets in the
early 1970s, many emerging countries opened their markets to foreign investors in the
late 1980s and early 1990s (See, for example, Kaminsky and Schmukler (2001).
On the other hand, there was a contraction in credit to the emerging economies
during the 2008 global financial crisis. Capital inflows towards stock markets dropped.
Yield differentials of international bonds increased, in some cases (for example, Russia,
Turkey and South Africa) up to 800 average basic points. In the economies of Latin
America and Central Europe the increase was lower, though the level was between 400
and 600 basic points. Local bond yields increased in the emerging economies with an
increased dependence on foreign capital. Debt issuing ceased and the negotiation of the
securities of these countries in the secondary market decreased. In addition, banks in the
developed countries reduced their cross-border loans in, approximately, 1 per cent of the
GDP of emerging economies (Bank for International Settlements, 2009). In addition,
open capital accounts generate tendencies whereby capital movements occur because of
unpredictable changes in investor confidence (Ghosh and Chandrasekhar 2008). This
affects both the inflows and outflows in ways that the governments concerned cannot
control.
It is obvious that the degree of openness of a country has an important bearing
on the extent of integration of its financial market with global markets. India has pursued
a policy of gradual liberalisation of capital movements while strengthening its financial
sector infrastructure. Certain available measures help to gauge the degree of openness (or
the degree of capital controls1) of countries across the globe; two such indicators are as
follows:
246
The first one is foreign ownership/investment restrictions2.
This sub-component is based on the following two Global Competitiveness
Report questions:
“How prevalent is foreign ownership of companies in your country?
1 = Very rare, 7 = Highly prevalent”;
and “How restrictive are regulations in your country relating to international capital
flows?
1 = Highly restrictive, 7 = Not restrictive at all”.
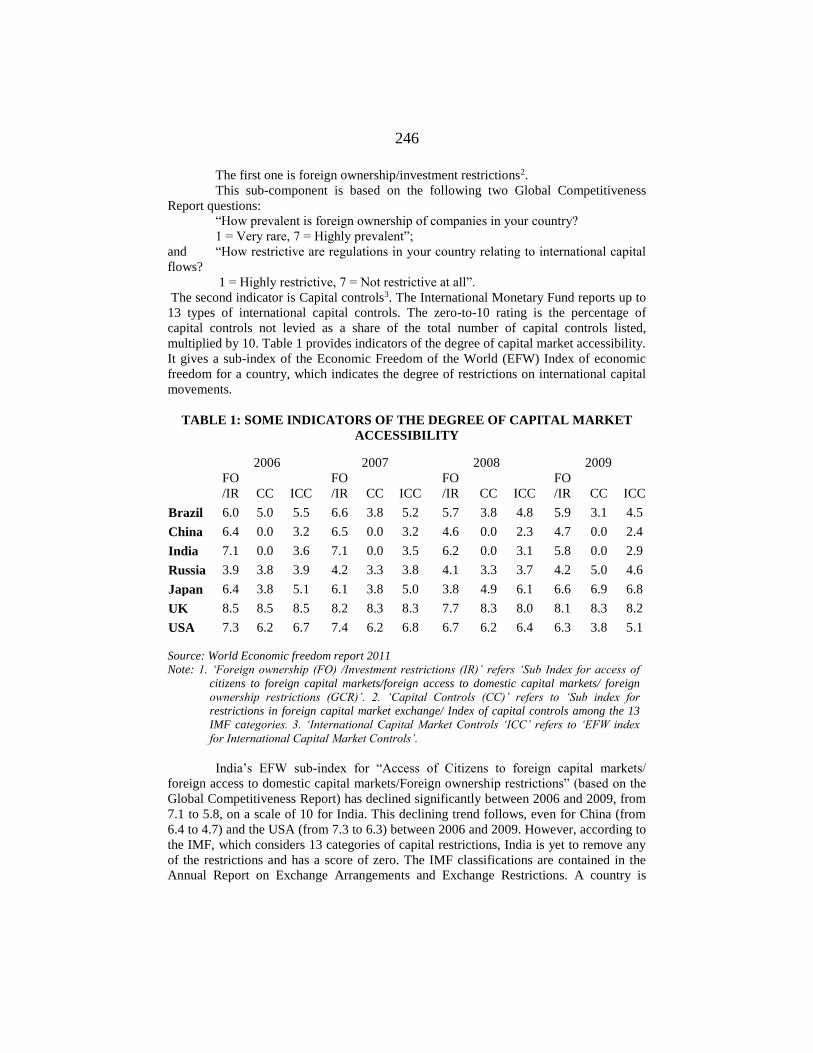
The second indicator is Capital controls3. The International Monetary Fund reports up to
13 types of international capital controls. The zero-to-10 rating is the percentage of
capital controls not levied as a share of the total number of capital controls listed,
multiplied by 10. Table 1 provides indicators of the degree of capital market accessibility.
It gives a sub-index of the Economic Freedom of the World (EFW) Index of economic
freedom for a country, which indicates the degree of restrictions on international capital
movements.
TABLE 1: SOME INDICATORS OF THE DEGREE OF CAPITAL MARKET
ACCESSIBILITY
2006 2007 2008 2009
FO
/IR CC ICC
FO
/IR CC ICC
FO
/IR CC ICC
FO
/IR CC ICC
Brazil 6.0 5.0 5.5 6.6 3.8 5.2 5.7 3.8 4.8 5.9 3.1 4.5
China 6.4 0.0 3.2 6.5 0.0 3.2 4.6 0.0 2.3 4.7 0.0 2.4
India 7.1 0.0 3.6 7.1 0.0 3.5 6.2 0.0 3.1 5.8 0.0 2.9
Russia 3.9 3.8 3.9 4.2 3.3 3.8 4.1 3.3 3.7 4.2 5.0 4.6
Japan 6.4 3.8 5.1 6.1 3.8 5.0 3.8 4.9 6.1 6.6 6.9 6.8
UK 8.5 8.5 8.5 8.2 8.3 8.3 7.7 8.3 8.0 8.1 8.3 8.2
USA 7.3 6.2 6.7 7.4 6.2 6.8 6.7 6.2 6.4 6.3 3.8 5.1
Source: World Economic freedom report 2011
Note: 1. ‘Foreign ownership (FO) /Investment restrictions (IR)’ refers ‘Sub Index for access of
citizens to foreign capital markets/foreign access to domestic capital markets/ foreign
ownership restrictions (GCR)’. 2. ‘Capital Controls (CC)’ refers to ‘Sub index for
restrictions in foreign capital market exchange/ Index of capital controls among the 13
IMF categories. 3. ‘International Capital Market Controls ‘ICC’ refers to ‘EFW index
for International Capital Market Controls’.
India’s EFW sub-index for “Access of Citizens to foreign capital markets/
foreign access to domestic capital markets/Foreign ownership restrictions” (based on the
Global Competitiveness Report) has declined significantly between 2006 and 2009, from
7.1 to 5.8, on a scale of 10 for India. This declining trend follows, even for China (from
6.4 to 4.7) and the USA (from 7.3 to 6.3) between 2006 and 2009. However, according to
the IMF, which considers 13 categories of capital restrictions, India is yet to remove any
of the restrictions and has a score of zero. The IMF classifications are contained in the
Annual Report on Exchange Arrangements and Exchange Restrictions. A country is
247
classified as either “liberalized” (value of unity) or not (value of zero) in terms of
liberalisation of the capital account, current account and requirements to surrender the
export proceeds. India’s overall EFW sub-index for international capital mobility is now
above that of China. Table 1 indicates that due to the global financial crisis, almost all the
countries have regulated and imposed restrictions on their financial market to protect
their economies.
The financial crisis was felt in these economies at the end of 2008. The
‘Emerging Markets Financial Stress Index’ developed by the International Monetary
Fund (2009) reveals that the intensity of the crisis in these countries was deeper than in
previous times. The starting situation of emerging economies, therefore, did not reflect
the same weaknesses as those observed in other recent crises, whether these were
originated in advanced or developing economies. Its insertion in the global financial
process had intensified though they had protected their position by means of the reserve
accumulation, the attainment of trade surplus and the development of local and regional
financial markets.
Although the U.S. subprime mortgage market was the first to absorb the
devastating effects of the bursting global asset bubble, the turmoil had directly impacted
most of the equity markets by the summer of 2007. Indeed, the crisis that broke by
October 2008 had erased around US$25 trillion from the value of stock markets, seems
largely to have been unexpected4. At the end of Q1 2009, global market capitalization
had fallen 53% since its peak on October 31, 2007. Partly this was because it came on the
heels of a seven-year period of high growth and originated in the USA; many had
expected a global slowdown to start in the emerging markets. Both the initial destruction
of financial wealth and the psychological shock of seeing many elite Wall Street firms on
their knees, prompted numerous commentators to initially raise the spectre of the great
depression. Although not the great depression, it is indeed true that the world was
staggering from financial to economic crisis as the US, the EU, Japan and other high-
income economies entered the recession at the end of 2008. Having decimated the Wall
Street and then crippled the Main Street, the financial crisis seems like a hurricane about
to sweep across the developing world (Evans et al. 2008).
The causes of the crisis have by now been widely analysed and dissected5. The
phenomenon of global stock market contagion is now too familiar and serious to ignore
and has become an integral part of the stock market activity. Contagion is not measurable
in itself, but rather estimated from the residual of the comovement, which is not
explained by the fundamentals. The definition of the term contagion varies widely across
the literature. Referring to the World Bank classification we can distinguish three
definitions of contagion viz., broad, restrictive and very restrictive definitions of
contagion6. In broad definition contagion is identified with the general process of shock
transmission across countries. The latter is supposed to work in both tranquil and crisis
periods, and the contagion is not only associated with negative shocks but also with the
positive spillover effects. In restrictive definition contagion has to be meant as the
propagation of shocks between two countries (or group of countries) in excess to what
should be expected to be explained by the fundamentals and besides considering the co-
movements triggered by the common shocks. According to the modern market-based
financial system, contagion can be transmitted through price changes and the measured
risks and marked to market (or according to fair value) capital of financial institutions.
248
When balance sheets are marked to market, asset-price changes will be reflected
immediately on balance sheets and will trigger response from financial market
participants. The most widely used definition in the literature is the very restrictive
definition.
An important strand of the empirical research on contagion uses conditional
correlation analysis to test for shifts in linkages across financial markets during crisis
periods. A set of papers examines contagion of financial markets by testing for higher
correlation between markets during crises times, inter alia, Boyer et al, (1999), Forbes
and Rigobon (2002), and Corsetti et al, (2005). Subsequent studies refined this approach
by addressing key features of the data generating process that affected the validity of
these tests such as heteroscedasticity, endogeneity, and the influence of common factors.
King and Wadhwani (1990) was the first study to employ this correlation approach in
examining cross-market co movements. They found that the correlation between the
London and the New York stock markets rose immediately after the 1987 U.S. market
crash, but returned to pre-crash levels when the volatility fell. The causes of contagion
can be divided conceptually into two categories (Masson 1998; Wolf 1999; Forbes and
Rigobon 2002; Pritsker 2001): Evidence of spillover and volatility transmission from one
market to another is well established (see, inter alia, Engle, Ito and Lin, 1990; Hamao,
Masulis and Ng, 1990). Further evidence on contagion and financial crises highlights the
impact of events such as the Asian crisis and the Russian crisis on other markets across
the globe (see, inter alia, Kaminsky and Reinhart, 1998; Edwards and Susmel, 2001; Bae
et al, 2003). In addition to these short run relationships, there is a body of evidence
suggesting that capital markets share common trends over the long-term period (Kasa,
1992; Garrett and Spyrou, 1999). This suggests that for investors with long-term
investment horizons, the benefits of international portfolio diversification could be
overstated. Despite the existence of such long run relationships it is unlikely that the
benefits of diversification will be eroded since returns may only react very slowly to the
trend. Indeed the benefits of diversification are likely to remain and hence accurate
measurement of volatilities and correlations between markets is of great importance.
Bekaert et al., (2005) identified contagion as “excess correlation,” that is, cross-country
correlations of the model residuals during crisis episodes. However, pure correlation-
based tests for contagion cannot be valid. Country specific regressors are needed to
distinguish contagion from interdependence.
The Asian crisis contagion clearly receives the highest share of attention in the
literature (e.g., Glick and Rose, 1999; Baig and Goldfajn, 1999; Sheng and Tu, 2000;
Chiang et al., 2007; Kenourgios et al., 2011). On the other hand, little empirical
investigation of the Russian default has been performed, while there is limited consensus
regarding its contagious effects (for example, Gelos and Sahay, 2000, found no
contagion, while Forbes, 2000, and Dungey et al., 2007, confirm the contagion effect).
On the contrary, empirical evidence on the contagion of the Argentinean default in global
financial markets is surprisingly scarce (e.g., Boschi, 2005). Although the literature on
the international impact of the U.S. subprime crisis is still developing, only few studies
focus on the EMEs. For example, Dooley and Hutchison (2009) provide evidence on the
decoupling of emerging markets from early 2007 to summer 2008, but after that point
confirms their recoupling due to the deteriorating situation in the U.S. financial system
249
and real economy, while Aloui et al. (2011) found strong evidence of time-varying
dependence between each of the BRIC equity markets and the U.S. markets.
All the studies reviewed till now reveal that most of the studies mainly are based
on developed countries context and there are only a few studies in emerging countries
including the BRIC countries. Further, it has been observed from empirical studies that
the financial sector reforms have been successful in bringing significant improvements in
various market segments.
MOTIVATION OF THE STUDY
We intend to examine whether contagion effects existed among these emerging markets
(viz. Brazil, Russia, India and China) during the current financial crisis originated from
the USA. If these markets are independent then investors in these countries can invest in
different markets of the region to diversify their portfolio and the authorities in the region
need not worry about any contagious effects if one market experiences any turmoil. The
present study follows Forbes and Rigobon, (2002); Bekaert et al., (2005) studies, and
uses an equivalently strict definition of contagion as the increase in the probability of
crisis beyond the linkages in fundamentals, and the rapid increase in co-movements
among markets during a crisis episode. The present study will help in understanding
portfolio diversification strategy of international investors who operate in these markets.
Objective
The general notion is that if there is evidence of cointegration, then the markets are
susceptible to shocks in other markets and, hence, the volatility in one market does spill
over to the other. In this context, the following is the specific objective of this study to
understand the contagion effects from the USA to BRIC economics during the USA
Subprime crisis.
To investigate the effects of contagion from the USA to the BRIC emerging
stock markets, the UK and Japan.
DATA AND METHODOLOGY
Nature of data
The study looks at daily closing stock returns of eight markets including Brazil, Russia,
India, China, and the US for a period from 2nd January 1997 to 30th June 2010. The data
is collected from www.econstats.com. The validity of the data was checked from
respective stock exchange websites. The USA subprime crisis acts as a structural break.
We have considered January 1st, 1997 till June 30th, 2007 as the pre-crisis period and July
1st, 2007 till December 31st, 2008 as the crisis period and January 1st, 2009, through June
30th, 2010 as the post-crisis period. When the first three moments for the three sub-
periods are compared, it was found that the stock returns were generally higher during the
pre-crisis and the post-crisis period. The stock indices used for the study are the most
important benchmark indexes for each country. Accordingly, our data series consists of
250
the daily index values of the DJIA, FTSE-100, NIKKEI-225, Bovespa, RTS, Sensex and
SSE composite for the USA, the United Kingdom (UK), Japan, Brazil, Russia, India and
China respectively. All the national stock price indices are in local currency, dividend-
unadjusted, and based on daily closing prices in each national market. Following the
conventional approach, stock returns are calculated as the first difference of the natural
log of each stock-price index, and the returns are expressed as percentages. When data
was unavailable, because of national holidays, bank holidays, or any other reasons, stock
prices were calculated via simple interpolation techniques.
Methodology
The multivariate GARCH model proposed by Engle (2002), which is used to estimate
dynamic conditional correlations (DCC), has three advantages over other estimation
methods. First, the DCC-GARCH model estimates correlation coefficients of the
standardized residuals and thus accounts for heteroskedasticity directly. Second, the
model allows including additional explanatory variables in the mean equation to ensure
that the model is well specified. Third, the multivariate GARCH model can be used to
examine multiple asset returns without adding too many parameters. However, it does not
account for the asymmetries in conditional variances, covariances, and correlations.
Cappiello, Engle, and Sheppard (2006) recently proposed an asymmetric version of the
Dynamic Conditional Correlation (ADCC) model to deal with the asymmetries in
conditional variances, covariances, and correlations of two assets.
The present study tests the existence of comovement of the USA subprime crisis
between the equity markets of the USA, the BRIC countries, the UK and Japan by
multivariate dynamic conditional correlation, the GARCH model proposed by Engle and
Sheppard (2001) and Engle (2002). The study was used econometric software’s such as
the RATs 7 and Eviews 7 for applying the econometric models. Following Bollerslev
(1990), Engle and Sheppard (2001) and Engle (2002) we start our empirical specification
with the assumption that stock market returns from the k series are multivariate,
normally distributed with zero mean and conditional variance-covariance matrix Ht.
Our multivariate DCC-GARCH model can be presented as follows:
tttr (1)
With εt| Ωt-1 → N (0, H t ) where, rt is the (k×1) vector of the returns, εt is a (k×1) vector
of zero mean return innovations conditional on the information, Ωt-1 , available at time t-
1 and for the bi-variate case, the conditional variance-covariance matrix ( H t ) in the
DCC model can be expressed as:
tttt DRDH (2)
where D represents a (k×k) diagonal matrix of the conditional volatility of the returns on
each asset in the sample and Rt is the (k×k) conditional correlation matrix. Basically, the
DCC-GARCH model estimates conditional volatilities and correlations in two steps. In
the first step the mean equation of each asset in the sample, nested in a univariate
251
GARCH model of its conditional variance is estimated. Hence, we can define D t as
follows:
).........( ktitt hhD
(3)
Where hit, conditional variance of each asset, is assumed to follow a univariate GARCH
(p, q) process, given by the following expression:
pti
Qi
q
qipti
pi
p
piiti hh
,
1
.
2
1,
1
,,
(4)
However, to insure non-negativity and stationarity some restrictions, such as:
0, pi , 0. qi and pti
Qi
q
qipti
pi
p
pi h
,
1
.
2
1,
1
, < 1
should be imposed. These uni-variate variance estimates are then used to standardize the
zero mean return innovations for each asset.
In the second step, the standardized zero mean return innovations are assumed to
follow a multivariate GARCH (m, n) process to illustrate the development of the time
varying correlation matrix, Rt , which can be described as follows:
2
12
1
)(())((
tttt QdiagQQdiagR
(5)
where
1
'
11)1( tttt QQQ (6)
Qt refers to a (k×k) symmetric positive definite matrix withitit hit , Q is the
(k×k) unconditional variance matrix of μit , and α and β are nonnegative scalar parameters
satisfying α + β < 1.
Where )1.............1())(( ,,2
1
tnntiit qqdiagQdiag
Finally, the conditional correlation coefficient ρij between two assets i and j is then
expressed by the following equation:
tjjii
tij
tijqtq
q
,
,
,.,
,
jiandnji ,.,,.........2,1, (7)
])1[(])1[(
)1(
1,22
2
1,2221,11
2
1,111
1,121,21,112
,12
tttt
ttt
tqqqq
(8)
252
As per Engle and Sheppard (2001) and Engle (2002), the DCC model can be estimated by
using a two – stage approach to maximizing the log - likelihood function. Let θ denote
the parameters in D t and Φ the parameters in Rt , then the log likelihood function is as
given below:
,tI
T
t
T
t ttttttttt RRDDn1 1
'1'2'2)]log)2(log(
2
1[)]log)2log((
2
1[
(9)
The first part of the likelihood function in equation (8) is volatility, which is the sum of
individual GARCH likelihoods. The log – likelihood function can be maximized in the
first stage over the parameter in Dt. Given the estimated parameters in the first stage, the
correlation component of the likelihood function in the second stage (the second part of
the equation (8) can be maximized to the estimated correlation coefficients.
The model described by Eqs. (5) and (6), however, does not allow for asset-
specific news and smoothing parameters or asymmetries. Cappiello et al. (2006) modified
the correlation evolution equation as
(10)
where A, B and G are k×k parameter matrices, nt = I [ t ≺ 0] º t (I[∙] is a k×1 indicator
function which takes on value 1 if the argument is true and 0 otherwise, while “◦”
indicates the Hadamard product7) and N = E [ tnn t ]. Eq. (9) is the AG-DCC model. In
order for the Qt to be positive definite for all possible realizations, the intercept,
GN G BP B A P A P must be positive semi-definite and the initial covariance
matrix Q0 be positive definite. An asymmetric scalar DCC model of the following form:
(11)
A sufficient condition for Qt to be positive definite is that the matrix in parentheses is
positive semi-definite. A necessary and sufficient condition for this to hold is a2 + b2 +
g2 < 1, where is the maximum eigenvalue [_
P −1/2
_
N_
P −1/2].
The full diagonal version of a scalar A-DCC (the matrices A, B and G are assumed to be
diagonal) of the following form:
(12)
where i is a vector of ones and a, b and g are vectors containing the diagonal elements of
matrices A, B and G, respectively.
This AGDCC allows for series-specific news impact and smoothing parameter
and permits conditional asymmetries in correlation dynamics. Moreover, this
specification enables us to overcome the problem with omitted variables and is well
suited to investigate the presence of asymmetric responses in conditional variances and
correlations during periods of negative shocks. Furthermore, this model interprets
BQBGnnGA ttttt 11111A G)NG BP B A P A P( =Qt
1
2
11
2
11
2_
222 a )Ng P b P a P( =Qt ttttt QbGnng
11111
_
'' aa' gg' N )bb' aa' - (ii' P( =Qt ttttt Qbbnngg
253
asymmetries broader than just within the class of the GARCH models, since it does not
assume constant correlation coefficients over the sample period. Ignoring the asymmetric
frictions would lead to overestimating the benefits of international portfolio
diversification in falling markets. (Kenourgios 2007).
EMPIRICAL ANALYSIS
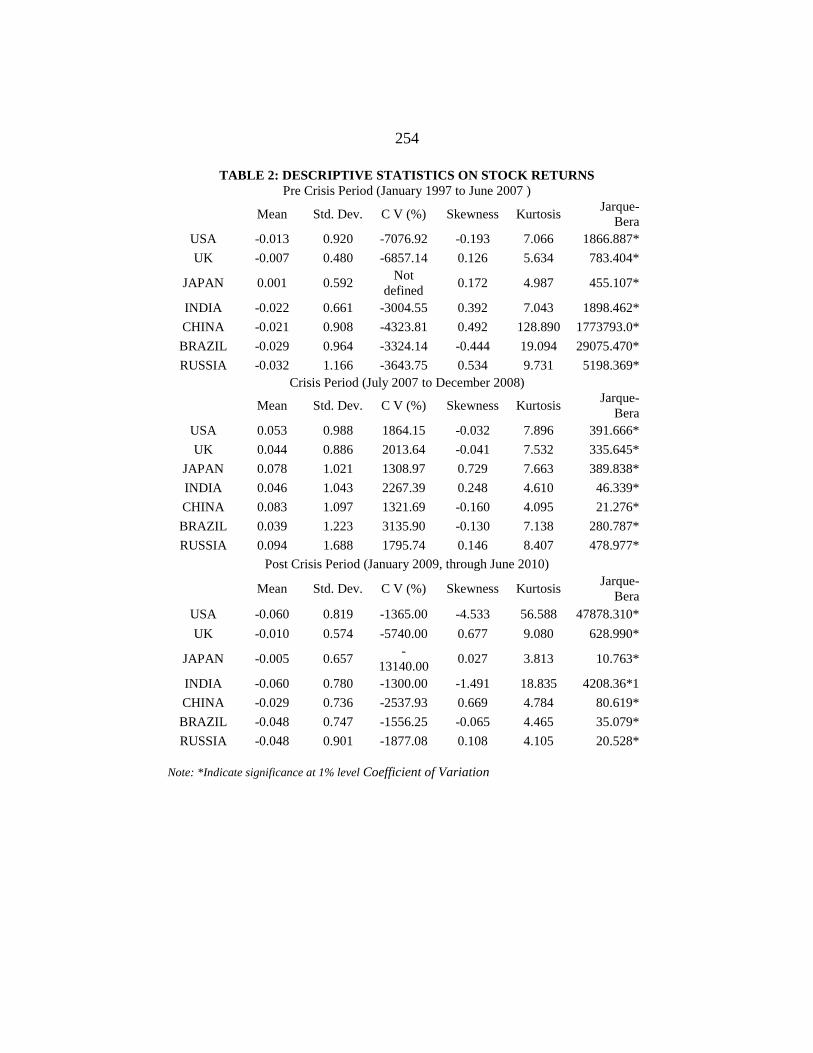
The summary statistics of stock-index returns in the UK, Japan, BRIC countries and the
United States are presented in Table 2. This indicates that in the crisis period, emerging
markets are relatively risky compared to the developed markets. Even during the crisis
period, the BRIC markets are very highly risky compared to the developed markets. The
stock returns variation (Coefficient of Variation) is large in emerging markets, and
appears unrelated to fundamentals co-movement, consistent with noise trader risk8. An
investor in emerging markets should therefore be willing to accept volatile returns, i.e.,
there is a chance for large profits at the risk of large losses. The negative skewness
coefficient for the USA and Brazil implies that the frequency distribution of the return
series has no longer tails to the right and also leptokurtic. Another noteworthy statistic of
the stock-return series shown in Table 2 is a high value of Jarque-Bera. This suggests
that, for these markets big shocks of either sign are more likely to be present and that the
stock-return series may not be normally distributed.
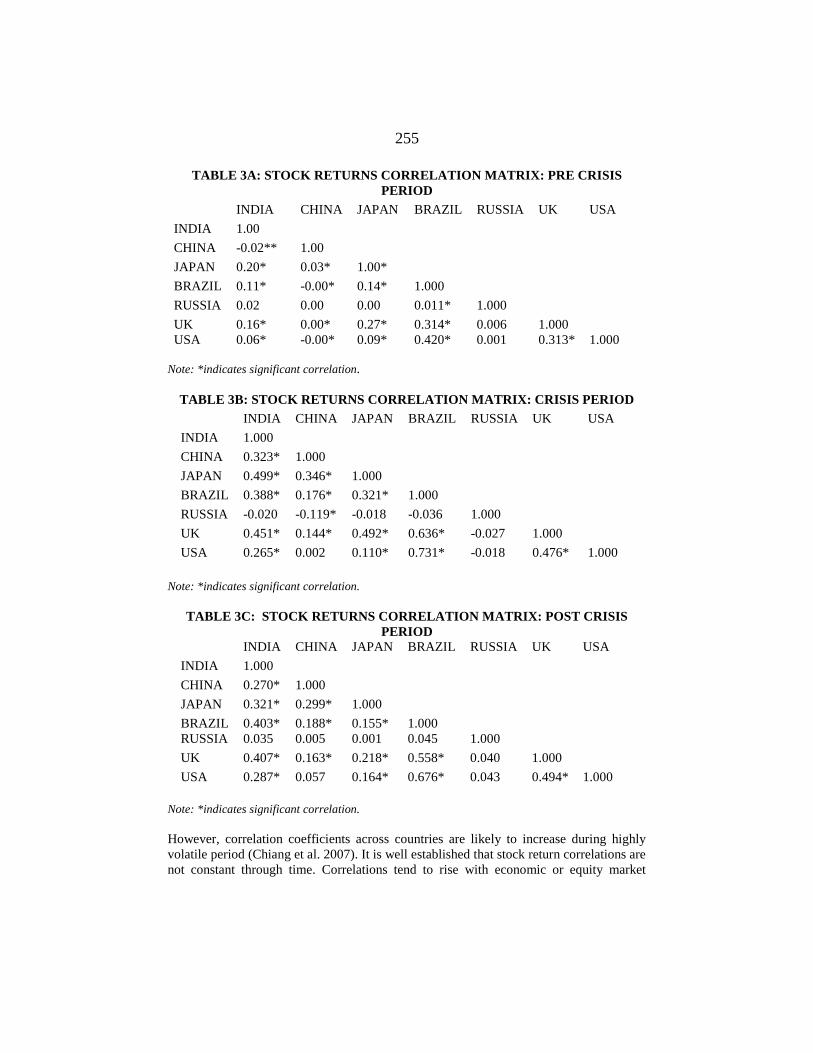
As a conventional way of understanding the contagion we have estimated the
correlation between the equity markets of the USA and the UK, Japan, the BRIC
countries (Table 3). From these tables, it can be see that during the crisis period, there
exists a comparatively high correlation between the equity markets. Russia has much
lower correlations with the US, the UK, Japan, Brazil, China and India. As would be
expected the correlations with the US and the UK, Japan and the BRIC markets after the
crisis are quite high but it is lower in the case of Russia (-0.020). The mean of the
correlation is varying between -0.008 to 0.420 with respect to the USA before the crisis.
The highest correlation found between India and Japan is 0.209 and the lowest coefficient
is between India and China, which is -0.020 before the crisis period. While the
correlations during the crisis period range from -0.017 to 0.730, during the post crisis
period, the correlation range from 0.043 to 0.675. These results clearly show that during
the crisis period correlation are high among the markets.
254
TABLE 2: DESCRIPTIVE STATISTICS ON STOCK RETURNS
Pre Crisis Period (January 1997 to June 2007 )
Mean Std. Dev. C V (%) Skewness Kurtosis
Jarque-
Bera
USA -0.013 0.920 -7076.92 -0.193 7.066 1866.887*
UK -0.007 0.480 -6857.14 0.126 5.634 783.404*
JAPAN 0.001 0.592 Not
defined 0.172 4.987 455.107*
INDIA -0.022 0.661 -3004.55 0.392 7.043 1898.462*
CHINA -0.021 0.908 -4323.81 0.492 128.890 1773793.0*
BRAZIL -0.029 0.964 -3324.14 -0.444 19.094 29075.470*
RUSSIA -0.032 1.166 -3643.75 0.534 9.731 5198.369*
Crisis Period (July 2007 to December 2008)
Mean Std. Dev. C V (%) Skewness Kurtosis
Jarque-
Bera
USA 0.053 0.988 1864.15 -0.032 7.896 391.666*
UK 0.044 0.886 2013.64 -0.041 7.532 335.645*
JAPAN 0.078 1.021 1308.97 0.729 7.663 389.838*
INDIA 0.046 1.043 2267.39 0.248 4.610 46.339*
CHINA 0.083 1.097 1321.69 -0.160 4.095 21.276*
BRAZIL 0.039 1.223 3135.90 -0.130 7.138 280.787*
RUSSIA 0.094 1.688 1795.74 0.146 8.407 478.977*
Post Crisis Period (January 2009, through June 2010)
Mean Std. Dev. C V (%) Skewness Kurtosis
Jarque-
Bera
USA -0.060 0.819 -1365.00 -4.533 56.588 47878.310*
UK -0.010 0.574 -5740.00 0.677 9.080 628.990*
JAPAN -0.005 0.657 -
13140.00 0.027 3.813 10.763*
INDIA -0.060 0.780 -1300.00 -1.491 18.835 4208.36*1
CHINA -0.029 0.736 -2537.93 0.669 4.784 80.619*
BRAZIL -0.048 0.747 -1556.25 -0.065 4.465 35.079*
RUSSIA -0.048 0.901 -1877.08 0.108 4.105 20.528*
Note: *Indicate significance at 1% level Coefficient of Variation
255
TABLE 3A: STOCK RETURNS CORRELATION MATRIX: PRE CRISIS
PERIOD
INDIA CHINA JAPAN BRAZIL RUSSIA UK USA
INDIA 1.00
CHINA -0.02** 1.00
JAPAN 0.20* 0.03* 1.00*
BRAZIL 0.11* -0.00* 0.14* 1.000
RUSSIA 0.02 0.00 0.00 0.011* 1.000
UK 0.16* 0.00* 0.27* 0.314* 0.006 1.000
USA 0.06* -0.00* 0.09* 0.420* 0.001 0.313* 1.000
Note: *indicates significant correlation.
TABLE 3B: STOCK RETURNS CORRELATION MATRIX: CRISIS PERIOD
INDIA CHINA JAPAN BRAZIL RUSSIA UK USA
INDIA 1.000
CHINA 0.323* 1.000
JAPAN 0.499* 0.346* 1.000
BRAZIL 0.388* 0.176* 0.321* 1.000
RUSSIA -0.020 -0.119* -0.018 -0.036 1.000
UK 0.451* 0.144* 0.492* 0.636* -0.027 1.000
USA 0.265* 0.002 0.110* 0.731* -0.018 0.476* 1.000
Note: *indicates significant correlation.
TABLE 3C: STOCK RETURNS CORRELATION MATRIX: POST CRISIS
PERIOD
INDIA CHINA JAPAN BRAZIL RUSSIA UK USA
INDIA 1.000
CHINA 0.270* 1.000
JAPAN 0.321* 0.299* 1.000
BRAZIL 0.403* 0.188* 0.155* 1.000
RUSSIA 0.035 0.005 0.001 0.045 1.000
UK 0.407* 0.163* 0.218* 0.558* 0.040 1.000
USA 0.287* 0.057 0.164* 0.676* 0.043 0.494* 1.000
Note: *indicates significant correlation.
However, correlation coefficients across countries are likely to increase during highly
volatile period (Chiang et al. 2007). It is well established that stock return correlations are
not constant through time. Correlations tend to rise with economic or equity market
256
integration (Longin and Solnik, 1995; Goetzmann, Li and Rouwenhorst, 2005). They
tend to decline in bull markets and increase during bear markets (Longin and Solnik,
2001; Ang and Bekaert, 2002). Longin and Solnik (1995, 2001) shows that correlations
between markets increase during periods of high market volatility, with the result that
correlations would be higher than average, exactly in the moment when diversification
promises to yield gains. Consequently, such changes in correlations imply that the
benefits to portfolio diversification may be rather modest during bear markets (Baele,
2005).
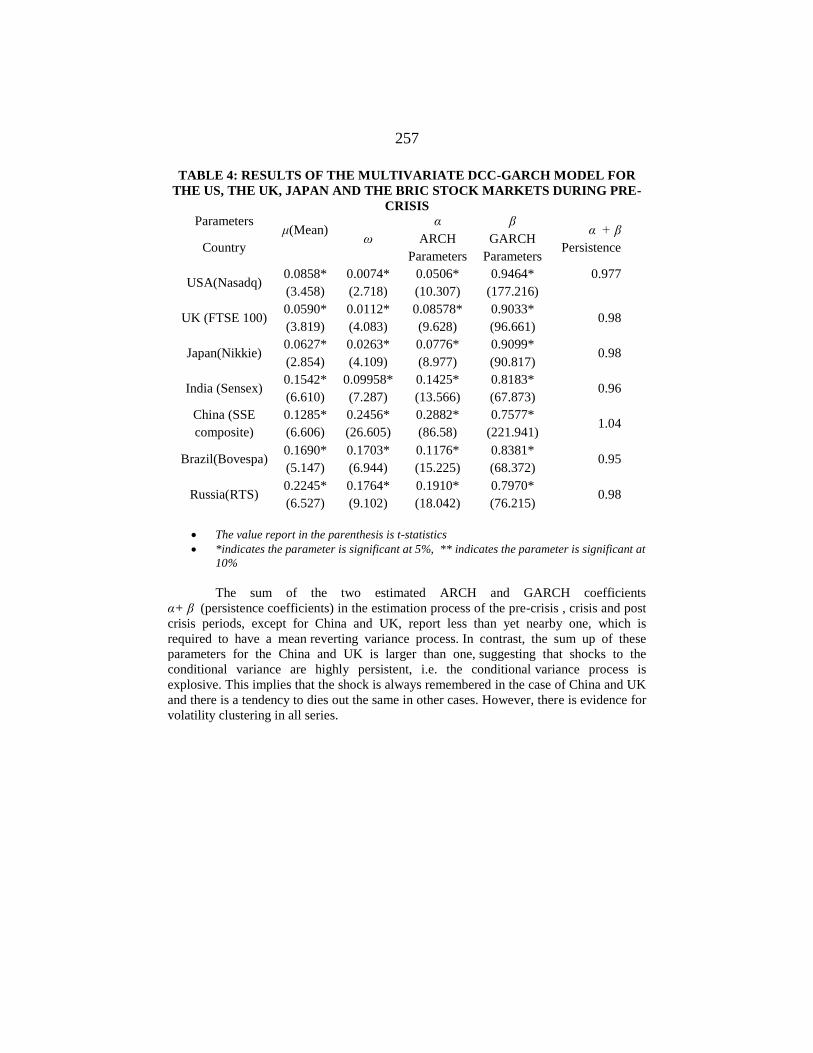
As already noted, the objective of this study is to investigate the dynamic
conditional correlation mechanism among the BRIC, the UK, Japan and the US equity
markets. Results of the multivariate DCC-GARCH model are reported from Table 4 to 6.
The multivariate DCC model applied in the analysis allows for time varying correlation
structure. Parameter μ corresponds to the mean equation while ω α and β represents the
conditional variance of equity returns of the BRIC, the UK, Japan and the US equity
markets, which are modeled by a separate univariate GARCH (1, 1) model. All
parameters except China’s GARCH coefficient are found significant and positive.
Negative values of the GARCH coefficients were commonly thought of as resulting
either from sampling error or model misspecification. However we have tried with other
variations of GARCH specification but still the problem persists. So the negative and
insignificant GARCH coefficient of China during the crisis period can be treated as zero,
which then implies that the previous period volatility has no impact on the
contemporaneous volatility of the asset. The significance of mean equation parameter μ
shows the dependence of returns on their lag returns in the precrisis and postcrisis period
except for Japan in the post-crisis period. But this parameter μ is not significant during
the crisis period for India, the USA, the UK, Japan, China and Russia.
Variance equation parameters α and β support our modeling technique, i.e.,
multivariate GARCH analysis, by revealing the presence of conditional hetroskedasticity
in the time series. Again GARCH (1, 1) parameters are highly significant confirming the
timevarying variance and covariance process as well as strengthening the use of
multivariate GARCH modeling among the BRIC, the UK, Japan and the US equity
markets.
257
TABLE 4: RESULTS OF THE MULTIVARIATE DCC-GARCH MODEL FOR
THE US, THE UK, JAPAN AND THE BRIC STOCK MARKETS DURING PRE-
CRISIS
Parameters μ(Mean)
ω
α
ARCH
Parameters
β
GARCH
Parameters
α + β
Persistence Country
USA(Nasadq) 0.0858*
(3.458)
0.0074*
(2.718)
0.0506*
(10.307)
0.9464*
(177.216)
0.977
UK (FTSE 100) 0.0590*
(3.819)
0.0112*
(4.083)
0.08578*
(9.628)
0.9033*
(96.661) 0.98
Japan(Nikkie) 0.0627*
(2.854)
0.0263*
(4.109)
0.0776*
(8.977)
0.9099*
(90.817) 0.98
India (Sensex) 0.1542*
(6.610)
0.09958*
(7.287)
0.1425*
(13.566)
0.8183*
(67.873) 0.96
China (SSE
composite)
0.1285*
(6.606)
0.2456*
(26.605)
0.2882*
(86.58)
0.7577*
(221.941) 1.04
Brazil(Bovespa) 0.1690*
(5.147)
0.1703*
(6.944)
0.1176*
(15.225)
0.8381*
(68.372) 0.95
Russia(RTS) 0.2245*
(6.527)
0.1764*
(9.102)
0.1910*
(18.042)
0.7970*
(76.215) 0.98
The value report in the parenthesis is t-statistics
*indicates the parameter is significant at 5%, ** indicates the parameter is significant at
10%
The sum of the two estimated ARCH and GARCH coefficients
α+ β (persistence coefficients) in the estimation process of the pre-crisis , crisis and post
crisis periods, except for China and UK, report less than yet nearby one, which is
required to have a mean reverting variance process. In contrast, the sum up of these
parameters for the China and UK is larger than one, suggesting that shocks to the
conditional variance are highly persistent, i.e. the conditional variance process is
explosive. This implies that the shock is always remembered in the case of China and UK
and there is a tendency to dies out the same in other cases. However, there is evidence for
volatility clustering in all series.
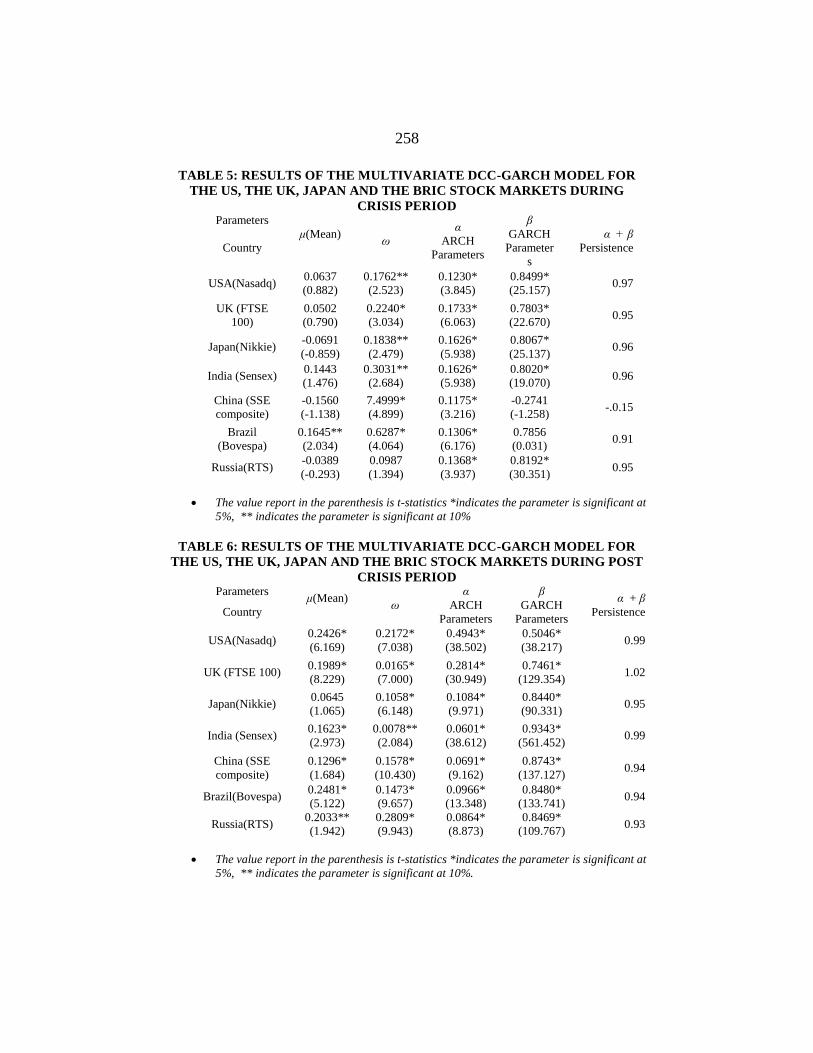
258
TABLE 5: RESULTS OF THE MULTIVARIATE DCC-GARCH MODEL FOR
THE US, THE UK, JAPAN AND THE BRIC STOCK MARKETS DURING
CRISIS PERIOD Parameters
μ(Mean)
ω
α
ARCH
Parameters
β
GARCH
Parameter
s
α + β
Persistence Country
USA(Nasadq) 0.0637
(0.882)
0.1762**
(2.523)
0.1230*
(3.845)
0.8499*
(25.157) 0.97
UK (FTSE
100)
0.0502
(0.790)
0.2240*
(3.034)
0.1733*
(6.063)
0.7803*
(22.670) 0.95
Japan(Nikkie) -0.0691
(-0.859)
0.1838**
(2.479)
0.1626*
(5.938)
0.8067*
(25.137) 0.96
India (Sensex) 0.1443
(1.476)
0.3031**
(2.684)
0.1626*
(5.938)
0.8020*
(19.070) 0.96
China (SSE
composite)
-0.1560
(-1.138)
7.4999*
(4.899)
0.1175*
(3.216)
-0.2741
(-1.258) -.0.15
Brazil
(Bovespa)
0.1645**
(2.034)
0.6287*
(4.064)
0.1306*
(6.176)
0.7856
(0.031) 0.91
Russia(RTS) -0.0389
(-0.293)
0.0987
(1.394)
0.1368*
(3.937)
0.8192*
(30.351) 0.95
The value report in the parenthesis is t-statistics *indicates the parameter is significant at
5%, ** indicates the parameter is significant at 10%
TABLE 6: RESULTS OF THE MULTIVARIATE DCC-GARCH MODEL FOR
THE US, THE UK, JAPAN AND THE BRIC STOCK MARKETS DURING POST
CRISIS PERIOD Parameters
μ(Mean)
ω
α
ARCH
Parameters
β
GARCH
Parameters
α + β
Persistence Country
USA(Nasadq) 0.2426*
(6.169)
0.2172*
(7.038)
0.4943*
(38.502)
0.5046*
(38.217) 0.99
UK (FTSE 100) 0.1989*
(8.229)
0.0165*
(7.000)
0.2814*
(30.949)
0.7461*
(129.354) 1.02
Japan(Nikkie) 0.0645
(1.065)
0.1058*
(6.148)
0.1084*
(9.971)
0.8440*
(90.331) 0.95
India (Sensex) 0.1623*
(2.973)
0.0078**
(2.084)
0.0601*
(38.612)
0.9343*
(561.452) 0.99
China (SSE
composite)
0.1296*
(1.684)
0.1578*
(10.430)
0.0691*
(9.162)
0.8743*
(137.127) 0.94
Brazil(Bovespa) 0.2481*
(5.122)
0.1473*
(9.657)
0.0966*
(13.348)
0.8480*
(133.741) 0.94
Russia(RTS) 0.2033**
(1.942)
0.2809*
(9.943)
0.0864*
(8.873)
0.8469*
(109.767) 0.93
The value report in the parenthesis is t-statistics *indicates the parameter is significant at
5%, ** indicates the parameter is significant at 10%.
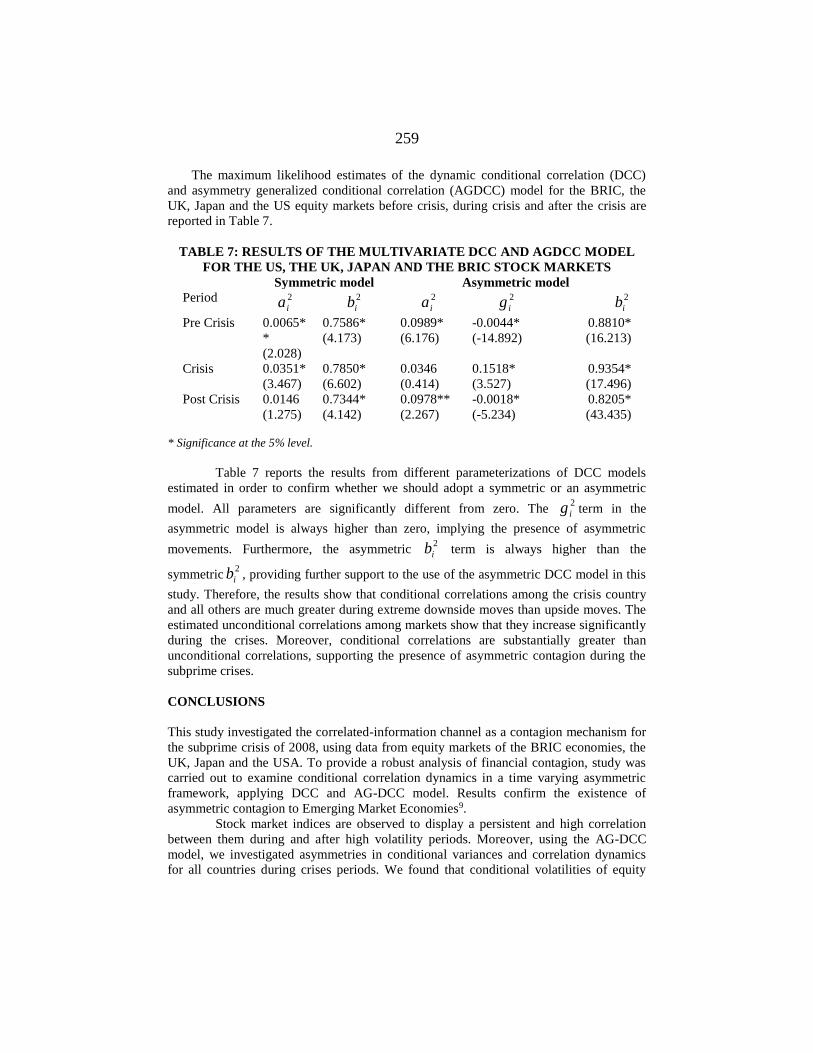
259
The maximum likelihood estimates of the dynamic conditional correlation (DCC)
and asymmetry generalized conditional correlation (AGDCC) model for the BRIC, the
UK, Japan and the US equity markets before crisis, during crisis and after the crisis are
reported in Table 7.
TABLE 7: RESULTS OF THE MULTIVARIATE DCC AND AGDCC MODEL
FOR THE US, THE UK, JAPAN AND THE BRIC STOCK MARKETS
Period Symmetric model Asymmetric model
2
ia 2
ib 2
ia 2
ig 2
ib
Pre Crisis 0.0065*
*
(2.028)
0.7586*
(4.173)
0.0989*
(6.176)
-0.0044*
(-14.892)
0.8810*
(16.213)
Crisis 0.0351*
(3.467)
0.7850*
(6.602)
0.0346
(0.414)
0.1518*
(3.527)
0.9354*
(17.496)
Post Crisis 0.0146
(1.275)
0.7344*
(4.142)
0.0978**
(2.267)
-0.0018*
(-5.234)
0.8205*
(43.435)
* Significance at the 5% level.
Table 7 reports the results from different parameterizations of DCC models
estimated in order to confirm whether we should adopt a symmetric or an asymmetric
model. All parameters are significantly different from zero. The 2
ig term in the
asymmetric model is always higher than zero, implying the presence of asymmetric
movements. Furthermore, the asymmetric 2
ib term is always higher than the
symmetric2
ib , providing further support to the use of the asymmetric DCC model in this
study. Therefore, the results show that conditional correlations among the crisis country
and all others are much greater during extreme downside moves than upside moves. The
estimated unconditional correlations among markets show that they increase significantly
during the crises. Moreover, conditional correlations are substantially greater than
unconditional correlations, supporting the presence of asymmetric contagion during the
subprime crises.
CONCLUSIONS
This study investigated the correlated-information channel as a contagion mechanism for
the subprime crisis of 2008, using data from equity markets of the BRIC economies, the
UK, Japan and the USA. To provide a robust analysis of financial contagion, study was
carried out to examine conditional correlation dynamics in a time varying asymmetric
framework, applying DCC and AG-DCC model. Results confirm the existence of
asymmetric contagion to Emerging Market Economies9.
Stock market indices are observed to display a persistent and high correlation
between them during and after high volatility periods. Moreover, using the AG-DCC
model, we investigated asymmetries in conditional variances and correlation dynamics
for all countries during crises periods. We found that conditional volatilities of equity
260
indices returns show widespread evidence of asymmetry. The AG-DCC results provide
further evidence for higher joint dependence during stock market crises. When bad news
hits stock markets, equity correlation among the BRICs and the developed markets
increases dramatically.
Consistent with the observations made by Bae et al. (2003) and Kallberg et al.
(2005), our study provides evidence of contagion effects in these BRIC markets in the
early stage of the crisis and then a transition to herding behavior in the latter stage. Here
contagion and herding behavior are distinguished in the sense that contagion describes
the spread of shocks from one market to another with a significant increase in correlation
between markets, while herding describes the simultaneous behavior of investors across
different markets with high correlation coefficients in all markets. It implies that in the
early phases of the crisis, investors focus mainly on local country information, so that
contagion takes place. As the crisis becomes public news, investor decisions tend to
converge due to herding behavior, creating higher correlations. As more and more asset
prices declined in neighboring countries due to the contagion effect spread through
various channels, investors began to panic and withdraw funds from the BRIC
economies. During this process, the convergence of market consensus and the stock
returns in these economies showed a gradual increase in correlation. This phenomenon is
identified during crisis period.
The USA crises hit global economies regardless of their economic integration,
since cross-market correlation dynamics are driven by behavioral reasons, and due to
shifting investor sentiment (increased risk aversion), causing significant changes in the
emerging countries’ financial structures. The study findings have important implications
for international investors and portfolio managers. Evidence on contagion implies that
diversification sought by investing in multiple markets from different regional blocks is
likely to be lower when it is most desirable. As a result, an investment strategy focused
solely on international diversification seems not to work in practice during turmoil
periods. Since countries and financial markets react differently to sovereign shocks,
stocks from different emerging economies could provide advantages over debt-only or
equity-only portfolios. The results also provide useful implications regarding the ability
of policy makers and multi-lateral organizations to insulate or at least attenuate an
economy from contagious effects.
Finally, the subprime crisis raised the need for a revamped international
financial architecture. The global contagious effects of this crisis and the rejection of the
decoupling hypothesis for the EMEs question the resilience and sustainability of
emerging-market policy performance. It seems that strong economic indicators in many
EMEs before the crisis (high growth rates, massive foreign exchange reserves, balanced
budgets) were not enough to decouple them from the crisis, because of their cyclicality
and endogeneity. A consequence of the contagion on the EMEs would be the redirection
of development loans by the World Bank, the IMF, and the regional development banks
to the public sector, since those funds had been crowded out by private-sector lending
throughout the boom decade (World Bank, Global Development Finance, 2008).
261
ENDNOTES
*Prelimanry version of the Paper was presented in 2nd Edition Perm Winter School on ‘Risk
Management and Financial Markets Modeling’ jointly organized by Perm State University,
Professional Risk Managers’ International Association (PRMIA) and PROGNOZ Company, Perm,
Russia during February 02-04, 2012. **Special thanks to Prof B Kamaiah, University of Hyderabad, India for his suggestions and
comments on the earlier version of the paper. The author is grateful to his Supervisors Dr.
Vijaymohanan Pillai, Dr.Hrushikesh Mallick, Centre for Development Studies (CDS), Kerala for
valuable guidance and encouragement. The usual disclaimer applies. 1 See for example, Bird and Rajan (2000) who note that restraints on capital movements can be
divided into controls on capital account transactions per se (capital controls) and controls on
foreign currency transactions (exchange controls). Capital controls can cover foreign direct
investment (FDI), portfolio investment, borrowing and lending by residents and non-residents,
transactions making use of deposit accounts and other miscellaneous transactions. Exchange
controls regulate the rights of residents to use (remit or receive) foreign currencies and hold
offshore or onshore foreign currency deposits. They also regulate the rights of non-residents to hold
domestic currency deposits onshore. In addition, they may be defined to include taxes on currency
transactions and multiple exchange rate practices, which are aimed at influencing the volume and
composition of foreign currency transactions. Such capital controls may have different effects on
the functioning of the economy, depending on their nature. 2 Source: World Economic Forum, Global Competitiveness Report (various issues). 3 Source: International Monetary Fund, Annual Report on Exchange Arrangements and Exchange
Restrictions (various issues). 4 See Giles (2008). In its October 2007 World Economic Outlook, for instance, the IMF, although
concerned about the subprime crisis in the US and its potential negative impact on slowing down
growth, still assumed in its baseline forecasts that, ‘market liquidity is gradually restored in the
coming months and that the interbank market reverts to more normal conditions’. 5 For overviews of the causes and nature of the financial crisis, see Barth (2008), Felton and
Reinhart (2008) and Taylor (2009). 6www.worldbank.org/economicpolicy/managing%20volatility/contagion/index.html. Accessed on
February 27th, 2009. 7 Element-wise matrix multiplication. 8 Investor who makes decisions regarding buy and sell trades without the use of fundamental data. 9 These results are consistent with studies on Asian and Latin American economies (IMF, 2008,
2009).
REFERENCES
Ang, A., and Bekaert, G., (2002), “International asset allocation with time-
varying correlations”. Review of Financial Studies 15 (4), 1137–1187.
Aloui, R. Aissa, M. S. B. and Nguyen, D. K (2011), “Global Financial Crisis,
Extreme Interdependences, and Contagion effects: the role of Economic Structure?
Journal of Banking and Finance, 35: 130 – 141.
Bae, K.-H., G.A. Karolyi and R.M. Stulz (2003), “A New Approach to
Measuring Financial Contagion", Review of Financial Studies, vol. 16, pp. 717-763.
Baig, T. and I. Goldfajn (2001), “The Russian Default and the Contagion to
Brazil” in International Financial Contagion, S. Claessens and K. Forbes (eds.), Kluwer
Academic Publishers, USA.
262
Baele, L., (2005), “Volatility Spillover Effects in European Equity Markets',
Journal of Financial and Quantitative Analysis, Vol. 40, pp. 373-401.
Barth, J. R. (2008). “US Subprime Mortgage Meltdown”. Paper presented at the
14th Dubrovnik Economic Conference, 25 June. Dubrovnik Available at
www.hnb.hr/dub-konf/14-konferencija/barth.ppt, Accessed on 9th August 2010.
Bank for International Settlements (2009) “79th Annual Report 1 April 2008–31
March 2009. Basel: Bank for International Settlements.
Bird, G., and R.S. Rajan (2000), “Restraining International Capital Movements,
What does it Mean?” Centre for International Economic Studies (CIES); University of
Adelaine Policy Discussion Paper No. 0014.
Bekaert, G., Harvey, C.R., Ng, A., (2005), “Market Integration and Contagion”
Journal of Business 78 (1), 39-69.
Bollerslev, T. (1990), “Modelling the Coherence in Short-Run Nominal
Exchange Rate: A Multivariate Generalized ARCH Approach”, Review of Economics
and Statistic, 72, 498-505.
Boschi, Melisso ((2005), “International Financial Contagion: Evidence from the
Argentine Crisis of 2001-2002,” Applied Financial Economics, 15; 153-163.
Boyer, Brian H., Michael S. Gibson, and Mico Loretan (1999), “Pitfalls in Tests
for Changes in Correlation” Federal Reserve Board, International Finance Discussion
Paper 597
Cappiello, L., Engle, R. F. & Sheppard, K. (2006), ‘Asymmetric Dynamics in
the Correlations of Global Equity and Bond Returns’, Journal of Financial Econometrics
4(4), 537–572.
Chiang TC, Jeon BN, and Li H (2007), “Dynamic correlation Analysis of
Financial Contagion: Evidence from Asian Markets, Journal of International Money and
Finance” Vol. 26, no. 7, pp. 1206-1228.
Corsetti, Giancarlo, Marcello Pericoli, and Massimo Sbracia (2005), “Some
Contagion, some Interdependence’: More pitfalls in tests of Financial Contagion”
Journal of International Money and Finance, 24(8), 1177–1199
Dooley and Hutchison (2009), “Transmission of the U.S. Subprime Crisis to
Emerging Markets: Evidence on the decoupling-decoupling hypothesis” Working Paper
15120, National Bureau of Economic Research.
Dornbusch, R, Park, YC and Claessens, S (2000), “Contagion: Understanding
how it spreads‟, The World Bank Research Observer, Vol. 15, No. 2, pp. 177-97.
Dungey, M., Fry, R. A., Gonz´alez-Hermosillo, and B., Martin, V. L., (2007),
“Contagion in Global Equity Markets in 1998: The effects of the Russian and LTCM
crises”. North American Journal of Economics and Finance 18, 155–174.
Edwards, S. and R. Susmel (2001), “Volatility dependence and contagion in
emerging equity markets", Journal of Development Economics, vol. 66, pp. 505-532.
Engle, R (2002), “Dynamic Conditional Correlation: A Simple Class of
Multivariate Generalized Autoregressive Conditional Heteroskedasticity Models”,
Journal of Business & Economic Statistics, 20(3), 339-50.
Engle, Robert F and Sheppard, Kevin K, (2001), "Theoretical and Empirical
Properties of Dynamic Conditional Correlation Multivariate GARCH," University of
California at San Diego, Economics Working Paper Series qt5s2218dp, Department of
Economics, UC San Diego.
263
Engle, R.F., T. Ito and W.-L. Lin (1990), “Meteor showers or heat waves?
Heterskedastic intra-daily volatility in the foreign exchange market", Econometrica, vol.
58, pp. 525-542.
Evans, A., and S. Maxwell (2008), “Financing Development: from Monterrey to
Doha”, Open Democracy, 26 November.
Felton, A., and K. Reinhart (2008), “The First Global Financial Crisis of the 21st
Century” A VoxEU.org Publication. Available at www.voxeu.org/index.
php?q=node/1352. Accessed on 6th December 2009.
Ferreiro, Jesus and Serrano, Felipe (2011), “The Impact of the Current Crisis on
Emerging Market and Developing Countries” in Philip Arestis, Rogério Sobreira and
José Luis Oreiro (ed.) ‘An Assessment of the Global Impact of the Financial Crisis’,
Palgrave Macmillan.
Fischer, Stanley. (1998), “Reforming the International Monetary System.” Draft
paper prepared for the David Finch Lecture, Melbourne, Australia, presented November
9. (Accessed on 3rd April 2009.at www.imf.org/external/np/speeches/1998/110998.htm).
Forbes, Kristin (2000), ‘The Asian Flu and Russian Virus: Firm-level Evidence
on How Crises are Transmitted Internationally”, NBER Working Paper 7807
Forbes, K., and Rigobon, R. (2002), “No contagion, only Interdependence:
Measuring Stock Market Comovements” Journal of Finance, vol. 57, pp. 2223–2261.
Garrett, I. and S. Spyrou (1999), “Common stochastic trends in emerging equity
markets", The Manchester School, 67, 649-660.
Gelos, G., and Sahay, R., (2000) “Financial Market Spillover in Transition
Economies” IMF Working Paper 00/71.
Ghosh, Jayati and C. P. Chandrasekhar, (2008), “A Decade After: Financial
crisis and recovery in East Asia (eds)., New Delhi: Tulika Books.
Giles, C. (2008), “The Vision Thing.” Financial Times, November 26.
Glick, R. and A. K. Rose (1999), “Contagion and Trade: Why are currency
crises regional?” Journal of International Money and Finance, Vol. 18, pp. 603-617.
Goetzmann, W.N., L. Li and K.G. Rouwenhorst (2005), “Long-term global
market correlations", Journal of Business, vol. 78, pp. 1-38.
Hamao, Y., R. Masulis and V. Ng (1990), “Correlation in price changes and
volatility across international stock markets", Review of Financial Studies, vol. 3, pp.
281-307.
IMF (2009), “Global Financial Stability Report. Responding to the Financial
Crisis and Measuring Systemic Risk”, April, Washington, DC, IMF
Kallberg, J., Liu, C., and Pasquariello, P., (2005), “An examination of the Asian
Crisis: Regime Shifts in Currency and Equity Markets”. Journal of Business, 78, 169–
211
Kaminsky, G.L. and C.M. Reinhart (1998) “Financial crises in Asia and Latin
America", American Economic Review, 88, 444-448.
Kaminsky, G., and Schmukler, S., (2001), “Short-Run and Long-Run
Integration: Do Capital Controls Matter?” in S. Collins and D. Rodrik (eds.), Brookings
Trade Forum 2000, Brookings Institution, Washington, D.C.
Kasa, Kenneth (1992), "Common Stochastic Trends in International Stock
Markets", Journal of Monetary Economics, vol. 29, pp. 95-124.
264
Kenourgios D, Samitas A, and Paltalidis N (2011), “Financial Crises and Stock
Market Contagion in a Multivariate Time-Varying Asymmetric Framework”. Journal of
International Financial Markets, Institutions & Money 21, 92-106.
King, Mervyn, and Sushil Wadhwani (1990), “Transmission of Volatility
between Stock Markets.” Review of Financial Studies, 3(1):5-33
Longin, F. and B. Solnik (2001), “Extreme correlation and international equity
markets", Journal of Finance, vol. 56, pp. 649-676.
Longin, F. and B. Solnik, (1995), “Is the Correlation in International Equity
Returns Constant", Journal of International Money and Finance, vol. 14, pp. 3-26.
Masson, Paul. (1998), “Contagion: Monsoonal Effects, Spillovers, and Jumps
between Multiple Equilibria.” IMF Working Paper WP/98/142. International Monetary
Fund, Washington, D.C.
Rodriguez, J (2007), “Measuring Financial Contagion: A Copula Approach”.
Journal of Empirical Finance, Vol. 14,
Sheng, H C and Tu, A H (2000), “A Study of Cointegration and Variance
Decomposition among National Equity Indices Before and During the Period of the
Asian Financial Crisis,” Journal of Multinational Financial Management, 10 (3-4), 345–
365.
Taylor, J. B. (2009), “The Financial Crisis and the Policy Responses: An
Empirical Analysis of What Went Wrong”, NBER Working Paper 14631. Cambridge,
MA: National Bureau of Economic Research.
Wolf, Holger. (1999), “International Asset Price and Capital Flow
Comovements during Crisis: The Role of Contagion, Demonstration Effects, and
Fundamentals.” Paper presented at the World Bank/IMF/WTO conference on “Capital
Flows, Financial Crises, and Policies,” April 15–16, Washington, D.C.
World Bank. (2008), ‘Global Development Finance’, Washington, DC: World
Bank.

Reproduced with permission of the copyright owner. Further reproduction prohibited withoutpermission.


![[1998] Contagion Effects During the Asian Fianncial Crisis](https://img.pdfslide.net/doc/110x75/577d36141a28ab3a6b921d91/1998-contagion-effects-during-the-asian-fianncial-crisis.jpg)