Embed Size (px)
Citation preview
Global Implications of the Fukushima Disaster for Nuclear Power
Thomas B. Cochran, Ph.D. Consultant Senior Scientists, Nuclear Program
Matthew G. McKinzie, Ph.D. Senior Scientist
Natural Resources Defense Council, Inc.
World Federation of Scientists’ International Seminars on Planetary Emergencies
Ettore Majorana Centre Erice, Sicily
August 19-25, 2011
Natural Resources Defense Council, Inc. 1200 New York Avenue, N.W., Suite 400
Washington, D.C. 20005 Tele: 202-289-6868 [email protected]
1
ABSTRACT
This paper reviews implications for the global use of nuclear power stemming from the nuclear accident at the Fukushima Dai-ichi Nuclear Power Station following the earthquake and tsunami on March 11, 2011. It includes: a) a review of numerous lessons learned from Fukushima related to accident precursors, design and operation of plant safety systems, emergency planning and nuclear plant regulation and safety culture: b) an examination of the historical frequency of severe fuel damage accidents at nuclear power plants and comparison of that frequency against the safety goals of the U.S. Nuclear Regulatory Commission; c) an examination of the population densities in the vicinity of nuclear power stations worldwide to assess the potential impact of radioactivity releases of Fukushima-scale or larger at other stations; and d) a review of reactor sites that are in areas of high risk to earthquakes and tsunamis. Introduction This paper follows closely and updates U.S. Senate testimony by Thomas Cochran, April 12th, which was updated in a statement by Thomas Cochran and Matthew McKinzie before the U.S. National Academies’ Nuclear and Radiation Studies Board on May 26th, and again at an International Workshop on Nuclear Energy Safety in Beijing on June 29th. We also draw on several excellent reports and presentations, including:
1) Staff of Congressman Edward J. Markey, “Fukushima Fallout, Regulatory Loopholes at U.S. Nuclear Plants,” May 12, 2011;1
2) Naoto Sekimura, “Overview of the Accident in Fukushima Daiichi Nuclear Power Plants,” U.S. National Academies’ Nuclear and Radiation Studies Board, May 26, 2011;2
3) Japanese Government, “Report of Japanese Government to the IAEA Ministerial Conference on Nuclear Safety: The Accident at TEPCO's Fukushima Nuclear Power Stations,” June 2011; 3
4) International Atomic Energy Agency (IAEA), “IAEA International Fact Finding Expert Mission of the Fukushima Dai-ichi NPP Accident Following the Great East Japan Earthquake and Tsunami,” 24 May – 2 June, 2011, Report to the IAEA Member States, 16 June 2011;4
5) Charles Miller, et al., “Recommendations for Enhancing Reactor Safety in the 21st
Century: The Near Term Task Force Review of Insights from the Fukushima Dai-ichi Accident,” U.S. Nuclear Regulatory Commission (US NRC), SECY-11-0093, July 12, 2011;5
1 http://markey.house.gov/docs/05-12-11reportfinalsmall.pdf 2 http://dels.nas.edu/resources/static-assets/nrsb/miscellaneous/SekimuraPresentation.pdf 3 http://www.kantei.go.jp/foreign/kan/topics/201106/iaea_houkokusho_e.html 4 http://www-pub.iaea.org/MTCD/meetings/PDFplus/2011/cn200/documentation/cn200_Final-Fukushima-Mission_Report.pdf 5 http://pbadupws.nrc.gov/docs/ML1118/ML111861807.pdf
2
6) Union of Concerned Scientists (UCS), “U.S. Nuclear Power after Fukushima: Common Sense Recommendations for Safety and Security, July 2011;6 and
7) Arjun Makhijani, “Preliminary review of Recommendations for Enhancing Reactor Safety in the 21st Century: The Near-Term Task Force Review of Insights from the Fukushima Dai-ichi Accident, U.S. Nuclear Regulatory Commission,” Institute for Energy and Environmental Research (IEER), July 12, 2011.7
Issues raised by the Fukushima disaster. There is a long list of issues and lessons learned from Fukushima that can be found in the reports identified above: Category A. Accident initiators:8
1. Need to strengthen measures to protect against: a. natural external hazards: 9
i. earthquakes10 ii. tsunamis
iii. floods 6 http://www.ucsusa.org/assets/documents/nuclear_power/ucs-rpt-nuclear-safety-recs.pdf 7 http://a4nr.org/wp-content/uploads/2011/07/July-19-IEER-review-NRC-report-on-Fukushima.pdf 8 See IAEA, “IAEA International Fact Finding Expert Mission of the Fukushima Dai-ichi NPP Accident Following the Great East Japan Earthquake and Tsunami,” 24 May – 2 June, 2011, Report to the IAEA Member States, 16 June 2011, p. 16, “Lesson 1: There is a need to ensure that in considering external natural hazards:
• the siting and design of nuclear plants should include sufficient protection against infrequent and complex combinations of external events and these should be considered in the plant safety analysis – specifically those that can cause site flooding and which may have longer term impacts;
• plant layout should be based on maintaining a ‘dry site concept’, where practicable, as a defense-in-depth measure against site flooding as well as physical separation and diversity of critical safety systems;
• common cause failure should be particularly considered for multiple unit sites and multiple sites, and for independent unit recovery options, utilizing all on-site resources should be provided;
• any changes in external hazards or understanding of them should be periodically reviewed for their impact on the current plant configuration; and
• an active tsunami warning system should be established with the provision for immediate operator action.”
9 Japan Government, “Report of Japanese Government to the IAEA Ministerial Conference on Nuclear Safety: The Accident at TEPCO's Fukushima Nuclear Power Stations,” June 2011, p. 28, Lesson 1. Also, Charles Miller, et al., “Recommendations for Enhancing Reactor Safety in the 21st Century: The Near Term Task Force Review of Insights from the Fukushima Dai-ichi Accident,” U.S. Nuclear Regulatory Commission (US NRC), SECY-11-0093, July 12, 201i, p. 30, Recommendation 2, “The Task Force recommends that the NRC require licensees to reevaluate and upgrade as necessary the design-basis seismic and flooding protection of SSCs for each operating reactor.” 10 Arjun Makhijani, “Preliminary review of Recommendations for Enhancing Reactor Safety in the 21st Century: The Near-Term Task Force Review of Insights from the Fukushima Dai-ichi Accident, U.S. Nuclear Regulatory Commission,” Institute for Energy and Environmental Research (IEER), July 12, 2011, p. 14, Recommendation 5: The US NRC should have its own independent seismology department.
3
iv. hurricanes and typhoons v. tornadoes11
vi. the implications of predicted sea-level rise and increased storm surges due to climate change.12
b. on-site hazards: i. fires, including seismically induced fires13
c. malevolent acts: i. external assault; terrorist attacks14
ii. insider threats 2. Need to periodically review the magnitude and potential consequences of
accident initiators.15 3. Need to improve warning systems for tsunamis and tornadoes.
Category B. Compliance with safety goals: 4. On a worldwide basis, power reactors are not adequately safe.16 5. The US NRC should create an enhanced-design-basis framework to replace
the design-basis plus beyond-design-basis framework now in place;17 extend regulations to cover severe accidents;18 which additional accident scenarios should be treated as part of the design-basis?19
6. Determine whether old reactor designs, e.g., GE BWRs with poorly designed Mark 1 and Mark 2 containments, are sufficiently safe to continue operation or have their licenses extended, even with subsequent safety upgrades.20
7. Apply the same type of timeliness goals to nuclear plant safety that it [the US NRC] does for business-related requests from reactor owners.21
8. Require new reactors to be safer than existing reactors.22 9. Assign an appropriate value to human life in cost-benefit analyses.23
11 IEER, pp. 10-12, Recommendation 4. 12 NRDC, see discussion in this paper. 13 USNRC, Near-Term Task Force Review, p. 32, Recommendation 3; UCS, “U.S. Nuclear Power after Fukushima: Common Sense Recommendations for Safety and Security, July 2011, p. 3, Recommendation: Enforce Fire Protection. 14 UCS, p. 3, Recommendation: Improve Protection against Terrorist Attacks. 15 US NRC, Near-Term Task Force Review, p. 30, Recommendation 2.2; IEER, p. 14, Recommendation 6. 16 NRDC analysis. 17 US NRC, Near-Term Task Force Review, p. 22, Recommendation 1; IEER, p. 3. 18 USC, p. 2, Recommendation: The US NRC should extend the scope of its regulations to include the prevention and mitigation of severe accidents. 19 NRDC question. 20 IEER, p. 16, Recommendation 8. 21 UCS, p. 3. Recommendation: Set Timeliness Goals for Safety Issues. 22 UCS, p. 3, Recommendation: Strengthen Safety Standards for New Reactors; IEER, p. 18, Recommendation 12. 23 UCS, p. 4, Recommendation: The US NRC should increase the value of human life in its analyses so it is consistent with other government agencies.
4
10. Probabilistic risk assessments (PRAs) should be updated;24 US NRC should perform its own independent PRAs as part of the license review process.25
11. Suspend relicensing and granting new licenses. 26 12. Consider alternatives to nuclear power.27
Category C. Reactor systems to cope with severe accidents:28 13. Secure AC power—offsite and emergency diesel generators and generator
fuel.29 14. DC power—longevity of batteries.30 15. Ensuring the water tightness of essential equipment facilities.31 16. “For severe situations, such as total loss of off-site power or loss of all heat
sinks or the engineering safety systems, simple alternative sources for these functions including any necessary equipment (such as mobile power, compressed air and water supplies) should be provided for severe accident management.”32
17. “Such provisions as are identified in [Category C, Lesson 10] should be located at a safe place and the plant operators should be trained to use them. This may involve centralized stores and means to rapidly transfer them to the affected site(s).”33
18. “Nuclear sites should have adequate on-site seismically robust, suitably shielded, ventilated and well equipped buildings to house the Emergency Response Centres, with similar capabilities to those provided at Fukushima Dai-ni and Dai-ichi, which are also secure against other external hazards such as flooding. They will require sufficient provisions and must be sized to maintain the welfare and radiological protection of workers needed to manage the accident.”34
19. “Emergency Response Centres should have available as far as practicable essential safety related parameters based on hardened instrumentation and lines such as coolant levels, containment status, pressure, etc., and have sufficient secure communication lines to control rooms and other places on-site and off-site.”35
24 Japan Government, p. 40, Lesson 27. 25 IEER, p. 17, Recommendation 10. 26 Ibid., pp. 19-20, Recommendation 14. 27 Ibid., p. 20, Recommendation 15. 28 US NRC, Near-Term Task Force Review, p. 37, Recommendation 4. 29 Japan Government, p. 29, Lesson 2. 30 Ibid. 31 Japan Government, p. 32, Lesson 8. 32 IAEA, p. 16, Lesson 2. 33 IAEA, p. 16, Lesson 3. 34 IAEA, p. 16, Lesson 4 35 IAEA, p. 17, Lesson 5.
5
20. Secure robust emergency core cooling systems for the reactor and the pressurized containment vessel (PCV)36
21. Insure that systems are capable of coping with large volumes of contaminated water, e.g., in the event of a breach of the reactor pressure vessel (RPV).37
22. Improve instrumentation for measuring status of reactors and spent fuel pools.38 “Greater consideration should be given to providing hardened systems, communications and sources of monitoring equipment for providing essential information for on-site and off-site responses, especially for severe accidents.39
23. Common cause failure should be particularly considered for multiple unit sites and multiple sites, and for independent unit recovery options, the utilization of all on-site resources should be provided. “External events have a potential of affecting several plants and several units at the plants at the same time. This requires a sufficiently large resource in terms of trained experienced people, equipment, supplies and external support. An adequate pool of experienced personnel who can deal with each type of unit and can be called upon to support the affected sites should be ensured.”40
24. “The international nuclear community should take advantage of the data and information generated from the Fukushima accident to improve and refine the existing methods and models to determine the source term involved in a nuclear accident and refine emergency planning arrangements.”41
Category D. Spent fuel pool issues: 25. Secure robust cooling functions of spent fuel pools.42 26. See Lesson 22 above. 27. Placement of spent fuel pools in new reactor and NPS designs.43 28. Move spent fuel from wet pools to dry casks as soon as practicable.44
Category E. Adequacy of the responses to severe accidents: 29. Hydrogen production due to steam cladding interactions following uncovering
of the core; enhancement of prevention measures.45 “The risk and
36 Japan Government, p. 30, Lesson 3. 37 NRDC Recommendation. 38 Japan Government, pp. 34-35, Lesson 14 and US NRC, Near-Term Task Force Review, p. 46, Recommendation 7. 39 IAEA, p. 17, Lesson 10. 40 IAEA, p. 17, Lesson 7 and Japan Government, p. 31, Lesson 6. 41 IAEA, p. 18, Lesson 13. 42 Japan Government, p. 30, Lesson 4; US NRC, Near-Term Task Force Review, p. 46, Recommendation 7; and IEER, p. 16, Recommendation 9. 43 Japan Government, p. 32, Lesson 7. 44 UCS, p. 3, Recommendation: Move Spent Fuel to Dry Casks; IEER, p. 17, Recommendation 11; NRDC recommendation. 45 Japan Government, p. 32, Lesson 9.
6
implications of hydrogen explosions should be revisited and necessary mitigating systems should be implemented.”46 Consider alternatives to zircaloy fuel cladding to reduce the risk of hydrogen explosions.47
30. Enhancement of the containment venting systems.48 31. Training programs for responding to severe accidents.49 32. Central control of emergency supplies and equipment and setting up rescue
team.50 33. Thorough accident management measures.51 34. Improvement of accident response environment.52 Severe Accident
Management Guidelines and associated procedures should take account of the potential unavailability of instruments, lighting, power and abnormal conditions including plant state and high radiation fields.53
Category F. Adequacy of radiation monitoring: 35. Enhance radiation exposure measurement systems for routine operations and
during accidents.54 36. Adequate identification and forecast of the effect of released radioactive
materials.55 37. Enhance radiation exposure management for workers. “Large scale radiation
protection for workers on sites under severe accident conditions can be effective if appropriately organized and with well led and suitable trained staff.”56
38. “Exercises and drills for on-site workers and external responders in order to establish effective on-site radiological protection in severe accident conditions would benefit from taking account of the experiences at Fukushima.”57
39. Enhance radiation exposure management of members of the public.58
46 IAEA, p. 17, Lesson 8. 47 IEER, p. 19, Recommendation 13. 48 Japan Government, p. 33, Lesson 10; US NRC, Near-Term Task Force Review, p. 41, Recommendation 5; and p. 43, Recommendation 6 and IEER, p. 16, Recommendations 7 and 8. 49 Japan Government, p. 34, Lesson 13. 50 Japan Government, p. 35, Lesson 15. 51 Japan Government, p. 31, Lesson 5. 52 Japan Government, p. 33, Lesson 11. 53 IAEA, p. 17, Lesson 6. 54 Japan Government, p. 34, Lesson 12 and p. 36, Lesson 17. 55 Japan Government, pp. 37-38, Lesson 21. 56 IAEA, p. 18, Lesson 14. 57 IAEA, p. 18, Lesson 15. 58 NRDC recommendation.
7
Category G. Adequacy of the emergency responses:59 40. Response to combined emergency of both large-scale natural disaster and
prolonged nuclear accidents.60 41. Establishment of clear division of labor between relevant central and local
organizations.61 42. Enhancement of communication relevant to accidents.62 43. Enhancement of response to assistance by other countries and communication
to the international community.63 44. Clear definition of widespread evacuation area and radiological protection
guideline in nuclear emergency.64 45. Determine which reactor sites are located in areas that cannot be adequately
evacuated, with consideration given to the need to evacuate in the immediate aftermath of a natural disaster.65
46. US NRC should require a complete revaluation of emergency planning zones, evacuation, and population protection, especially in densely populated areas where evacuation in zones extending out 30 or 40 miles will be essentially impossible and asking ten million or more people to stay indoors for extended periods of months is also equally impossible.66
47. The US NRC needs to revamp its entire regulatory structure for emergency planning to take into account (i) the protection of children, required by Executive Order 13045, (ii) the fact that large numbers of people may not be able to return to contaminated homes and jobs for prolonged periods, if ever, and that this needs special attention in densely populated areas, (iii) the irregular nature of the high radiation areas that develop, (iv) cleanup costs in the aftermath of accidents, (v) the need for real-time monitoring equipment to be in place far beyond the 10-mile planning zone, (vi) the need to take meteorological factors into account, often in real time, when informing the population (as, for instance, about potential rainfall and milk contamination), and (vii) the need to thoroughly reevaluate the viability of nuclear power plants in densely populated zones where evacuation in a 30-, 40-, or even 50-mile radius (depending on meteorological factors) may not be feasible.67
59 US NRC, Near-Term Task Force Review, p. 49, Recommendation 8, p. 56, Recommendation 9, and p. 57, Recommendation 10; UCS, p. 3, Recommendation: Strengthening Emergency Planning. 60 Japan Government, p. 35, Lesson 16. 61 Japan Government, p. 36, Lesson 18. 62 Japan Government, pp. 36-37, Lesson 19. 63 Japan Government, p. 37, Lesson 20. 64 Japan Government, p. 38, Lesson 22. 65 NRDC question. 66 IEER, p. 9, Recommendation 1. 67 Ibid., pp. 9-10, Recommendation 2.
8
48. The NRC needs to publish scientific guidelines for communicating radiation risks that respect the established science, notably the EPA’s Federal Guidance Report 13 and the National Academies BEIR VII report.68
49. Improve the adequacy of models used to calculate offsite environmental consequences and economic damage associated with a severe accident lasting for weeks.
50. Determine which reactor stations impose an undue economic risk to the local, regional or state economy in the event of a partial core melt accident.69
51. “The use of IAEA Safety Requirements (such as GS-R-2) and related guides on threat categorization, event classification and countermeasures, as well as Operational Intervention Levels, could make the off-site emergency preparedness and response even more effective in particular circumstances.”70
52. “The use of long term sheltering is not an effective approach and has been abandoned and concepts of ‘deliberate evacuation’ and ‘evacuation-prepared area’ were introduced for effective long term countermeasures using guidelines of the ICRP and IAEA.”71
Category H. Robustness of the safety infrastructure established at the nuclear power station: 53. Reinforcement of safety regulatory bodies.72 54. Establishment and reinforcement of legal structure, criteria and guidelines.73 55. Human resources for nuclear safety and nuclear emergency preparedness and
response.74 56. Securing independency and diversity of safety system.75 “Particularly in
relation to preventing loss of safety functionality, the robustness of defense-in-depth against common cause failure should be based on providing adequate diversity (as well as redundancy and physical separation) for essential safety functions.”76
Category I. Safety culture: 57. Raise awareness of safety culture at the nuclear reactor station.77 58. Need for improved safety culture at the regulatory authority.
68 Ibid., p. 10, Recommendation 3. 69 NRDC question. 70 IAEA, p. 17, Lesson 11. 71 IAEA, p. 17, Lesson 12. 72 Japan Government, pp. 38-39, Lesson 23. 73 Japan Government, p. 39, Lesson 24. 74 Japan Government, p. 39, Lesson 25. 75 Japan Government, pp. 39-40, Lesson 26. 76 IAEA, p. 17, Lesson 9. 77 Japan Government, p. 40, Lesson 28.
9
59. “Nuclear regulatory systems should ensure that regulatory independence and clarity of roles are preserved in all circumstances in line with IAEA Safety Standards.”78
60. Need for an industry sponsored safety program such as the U.S. Institute for Nuclear Power Operations (INPO).
Some implications for Nuclear Power Reactors Worldwide As noted by this lengthy list of issues and lessons learned, there are numerous concerns raised by the Fukushima nuclear disaster that bear on the safe operation and regulation of nuclear power reactors worldwide. Here we will offer brief observations regarding four issues:
• Are operational nuclear power reactors safe? • Which reactors are located in areas that represent the greatest challenge if
evacuation of the surrounding population is required or impose an undue economic risk to the local, regional or national economies in the event of a partial core melt accident?
• Which reactors are located in areas that are in areas of high risk to earthquakes and tsunamis?
• What improvements should be made to address the issue of hydrogen production caused by fuel cladding interactions with steam?
Are operational nuclear power reactors safe? To address this issue we first address what constitutes an acceptable level of safety and then compare the history of power reactor operations against this benchmark.
What constitutes an acceptable safety risk? The US NRC Inspection Manual defines safety and compliance as follows:
As commonly understood, safety means freedom from exposure to danger, or protection from harm. In a practical sense, an activity is deemed to be safe if the perceived risks are judged to be acceptable. The Atomic Energy Act of 1954, as amended [AEA], establishes “adequate protection” as the standard of safety on which NRC regulation is based. In the context of NRC regulation, safety means avoiding undue risk or, stated another way, providing reasonable assurance of adequate protection for the public in connection with the use of source, byproduct and special nuclear materials.
78 IAEA, p. 18, Lesson 16.
10
The definition of compliance is much simpler. Compliance simply means meeting applicable regulatory requirements. 79
Martin G. Malsch, former US NRC Acting General Counsel, notes that the AEA was initially silent on 1) how undue risk should be defined, and 2) when non-safety considerations (such as economic costs) may be taken into account in making undue risk decisions. 80 Following the TMI accident the US NRC further defined “undue risk” in terms of safety goals. In response to industry concerns in the 1980’s about the NRC’s failure to account for the economic costs in safety decisions, the NRC developed a framework whereby economic costs would be considered in some decisions but not in others. Prior to the US NRC formulating its safety goals, in July 1985, the US NRC Advisory Committee on Reactor Safeguards (ACRS) stated:
We believe that the Commission should state that a mean core melt frequency of not more than 10-4 per reactor year (one in 10,000 reactor-years) is an NRC objective for all but a few, small, existing nuclear power plants, and that, keeping in mind the considerable uncertainties, prudence and judgment will tend to take priority over benefit-cost analysis in working toward this goal. 81
The following year, on August 4, 1986, the US NRC published a final policy statement on safety goals, which states in part:
Severe core damage accidents can lead to more serious accidents with the potential for life-threatening offsite release of radiation, for evacuation of
79 US NRC, “NRC Inspection Manual,” Part 9900 Technical Guidance, Operation – Safety and Compliance, September 11, 2007. Martin G. Malsch, former US NRC Acting General Counsel, similarly notes:
The basic statute providing for the licensing and regulation of nuclear power plants in the United States is the 1954 Atomic Energy Act (AEA), which has been amended periodically. The AEA provides that licenses will be granted only if it is shown that there is adequate protection of the public health and safety. Historically, this has always been understood to mean that there must be reasonable assurance of no undue radiological risk to public health and safety. A license may be suspended or revoked if new information indicates this reasonable assurance no longer exists.
80 Martin G. Malsch, “US Nuclear Power Reactor Safety Goals and Protection from Natural Phenomena,” International Workshop on Nuclear Safety: Improving Safety in the Aftermath of the Fukushima Crisis, Beijing, China, June 29, 2011. 81 ACRS letter from D. A. Ward to N. J. Palladino, Subject: ACRS comments on proposed NRC safety goal evaluation report (17 July 1985); cited in David Okrent, “The Safety Goals of the Nuclear Regulatory Commission, Science, 236, 296-300 (17 April 1987).
11
members of the public, and for contamination of public property. Apart from their health and safety consequences, severe core damage accidents can erode public confidence in the safety of nuclear power and can lead to further instability and unpredictability for the industry. In order to avoid these adverse consequences, the Commission intends to continue to pursue a regulatory program that has as its objective providing reasonable assurance, while giving appropriate consideration to the uncertainties involved, that a severe core damage accident will not occur at a U.S. nuclear power plant. 82 (emphasis added)
The policy statement also included two qualitative and two quantitative goals. With regard to the later the policy statement says:
The Commission has decided to adopt the following two health effects as quantitative objectives concerning mortality risks to be used in determining achievement of the qualitative safety goals—
• The risk to an average individual in the vicinity of a nuclear power plant of prompt fatalities that might result from reactor accidents should not exceed one-tenth of one percent (0.1 percent) of the prompt fatality risks resulting from other accidents to which members of the U.S. population are generally exposed.
• The risk to the population in the area near a nuclear power plant of cancer fatalities that might result from nuclear power plant operation should not exceed one-tenth of one percent (0.1 percent) of the sum of cancer fatality risks resulting from all other causes.
Richard A Meserve, then Chairman of the US NRC, noted in 2001:
In 1990, the Commission provided additional guidance to the staff regarding the Safety Goals, endorsing surrogate objectives concerning the frequency of core damage accidents and large releases of radioactivity.2
The numerical value of one-in-ten-thousand for core damage frequency (CDF) was cited as a “very useful subsidiary benchmark....” In addition, a conditional containment failure probability of one-tenth was approved for application to evolutionary light water reactor designs. This resulted in a large release frequency of one in one-hundred-thousand, since containment failure is necessary for a large release to occur. These values
82 U.S. NRC, “Safety Goals for the Operation of Nuclear Power Plants; Policy Statement,” Federal Register 30028, August 21, 1986. See also, U.S. NRC, Federal Register 51, 28044 (4 August 1986); cited in David Okrent, “The Safety Goals of the Nuclear Regulatory Commission, Science, 236, 296-300 (17 April 1987). See Also: Richard R. Meserve, Chairman, NRC, “The Evolution of Safety Goals and Their Connection to Safety Culture,” Speech before the Atomic Energy Society of Japan/American Nuclear Society Meeting on Safety Goals and Safety Culture, Milwaukee, Wisconsin, June 18, 2001 http://www.nrc.gov/reading-rm/doc-collections/commission/speeches/2001/s01-013.html
12
have evolved into the “benchmark” values of 10-4 for CDF and 10-5 for
large early release frequency (LERF), as discussed in Regulatory Guide 1.174 for use in risk informed regulatory decision-making.3
2. U.S. NRC, Staff Requirements Memorandum on SECY-89-102, “Implementation of the Safety Goals,” June 15, 1990. 3 U.S. NRC, Regulatory Guide 1.174, “An Approach for Using Probabilistic Risk Assessment in Risk-Informed Decisions on Plant-Specific Changes to the Licensing Basis, July 1998.
US NRC Regulatory Guide 1.174, to which Commissioner Meserve referred, states:
While there is no requirement to calculate the total CDF [core damage frequency], if there is an indication that the CDF may be considerably higher than 10-4 per reactor year, the focus should be on finding ways to decrease rather than increase it. Such an indication would result, for example, if (1) the contribution to CDF calculated from a limited scope analysis, such as the individual plant examination (IPE) or the individual plant examination of external events (IPEEE), significantly exceeds 10-4, (2) a potential vulnerability has been identified from a margins-type analysis, or (3) historical experience at the plant in question has indicated a potential safety concern.83
In sum, the US NRC now assumes the following quantitative safety goals for accident risk:
• The risk to an average individual in the vicinity of a nuclear plant of prompt fatality should not exceed 0.1% of the prompt fatality risk from other accidents (or 10-7/yr), and related to the US NRC’s desire for defense in depth, two subsidiary quantitative safety goals:
o a core damage frequency (CDF) goal of 10-4/yr, and
o a large early release frequency (LERF) goal of 10-5/yr.
• And the risk to the population in the area near a nuclear power plant of cancer fatalities that might result from nuclear power plant operation should not exceed one-tenth of one percent (0.1 percent) of the sum of cancer fatality risks resulting from all other causes.
Neither “core damage” nor “core damage frequency’ was precisely defined when these safety goals were enunciated. We thus turned to the US NRC’s web-based glossary and a report by the Institute of Nuclear Power Operations (INPO) for further insight. In its web-site glossary, “Core damage frequency (CDF)” is defined by the US NRC to mean “An expression of the likelihood that, given the way a reactor is designed and operated, an 83 NRC, Regulatory Guide 1.174, “An Approach for Using Probabilistic Risk Assessment in Risk-Informed Decisions on Plant-Specific Changes to the Licensing Basis,” November 2002. http://www.nrc.gov/reading-rm/doc-collections/reg-guides/power-reactors/rg/01-174/
13
accident could cause the fuel in the reactor to be damaged;”84 and “Large early release frequency (LERF)” is defined as “the frequency of those accidents leading to significant, unmitigated releases from containment in a time frame prior to effective evacuation of the close-in population such that there is a potential for early health effects.”85 As will be seen from the discussion below, INPO distinguishes major fuel damage events caused, for example, by improperly managed reactivity additions, thermal-hydraulic transients, obstructions in coolant channels and overheating, from minor fuel damage events resulting, for example, from fabrication flaws.86 Initially the US NRC’s quantitative goals were not used in individual reactor licensing decisions because of reservations about probabilistic risk assessment. Moreover, as Martin Malsch notes, in developing the goals, no explicit consideration was given to potential environmental damage from severe accidents, the severe accident safety risk to populations (and opposed to individual safety risk), the increased severe accident risk from multi-unit sites, or the potential for large socioeconomic costs of severe accidents. Also, as Malsch notes:
Reservations about PRA [probabilistic risk assessment] are now largely resolved; for example NRC’s reactor inspection and oversight program now includes quantitative risk metrics based on the 10-4/yr CDF goal; an existing reactor with a CDF significantly greater than 10-4/yr would not be allowed to continue operation without further risk reduction. Other countries’ CDF goals range from 10-4/yr to 10-5/yr. Other countries’ LERF goals range from 10-5/yr to 10-7/yr. But comparisons are difficult because of different definitions of core damage and large early release.87 Reassessing the frequency of reactor core damage events. There have been
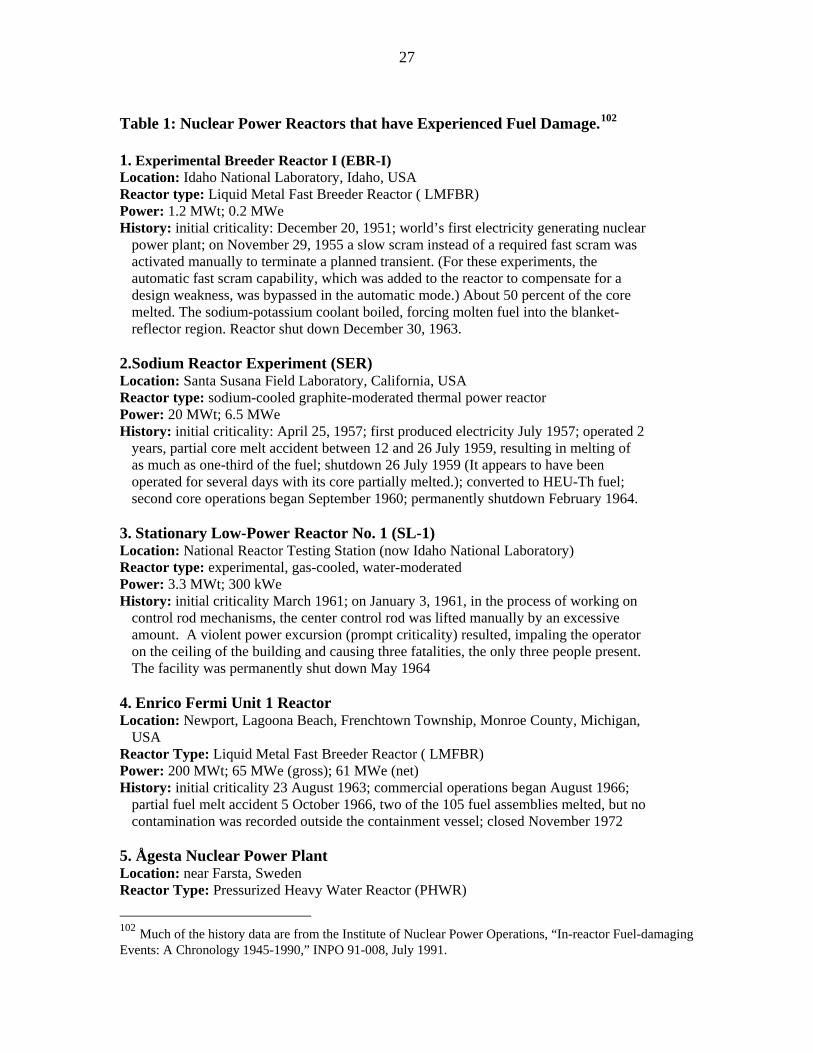
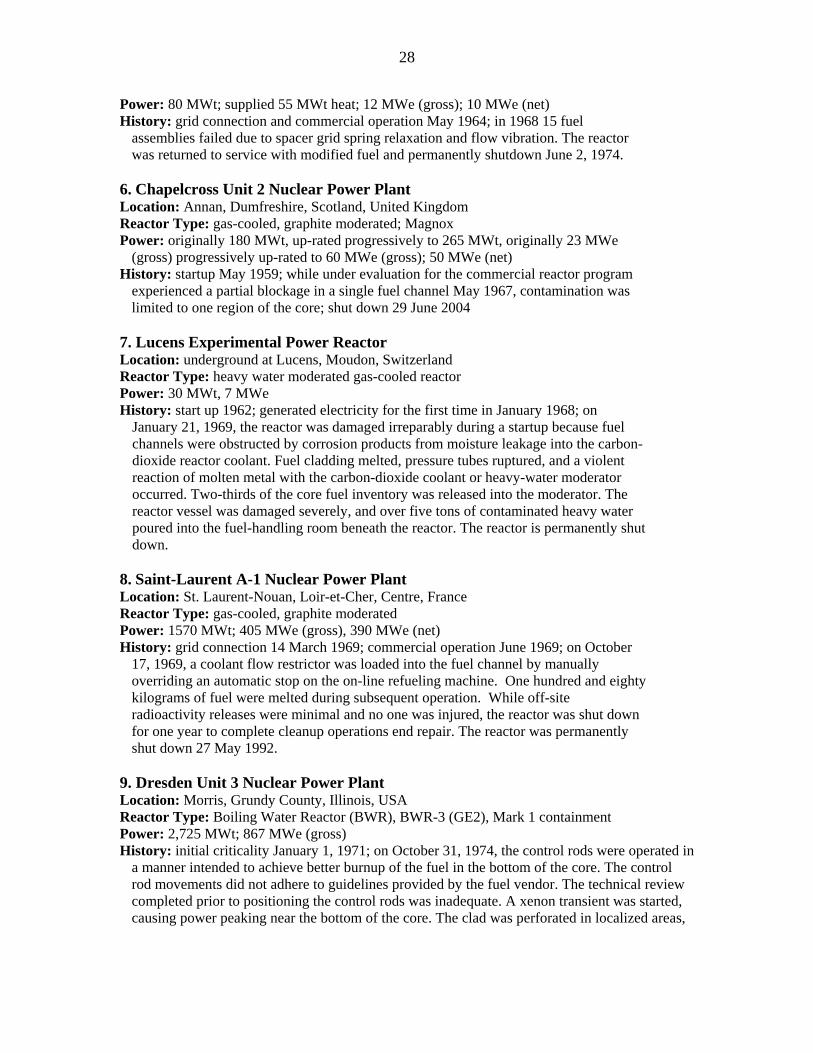
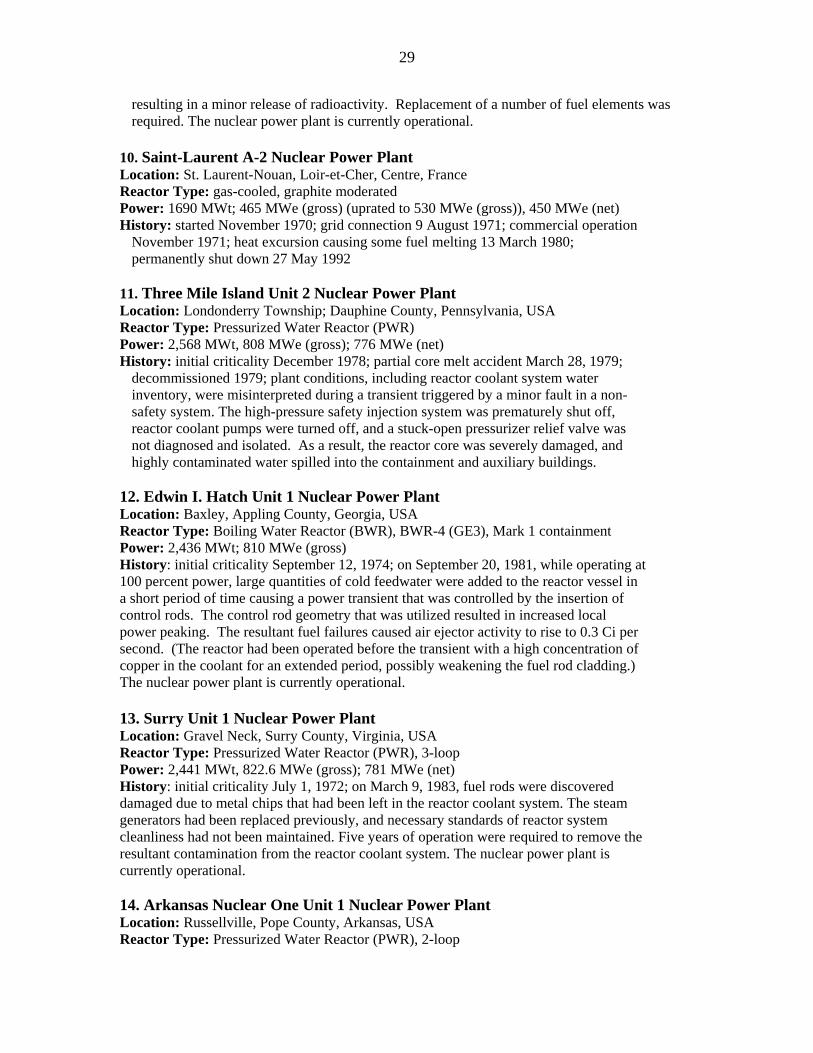
enough major fuel damage events, i.e., core damage, that we can ask whether the operational nuclear power plants throughout the world are safe enough as a group. For this purpose we will use as our primary benchmark the CDF goal of 10-4/yr. As noted above, experts differ regarding the level of core or fuel damage that needs to occur before the event should be counted in assessing CDF. With this caveat in Table 1
84 http://www.nrc.gov/reading-rm/basic-ref/glossary/core-damage-frequency.html 85 US NRC Regulatory Guide 1.174, footnote 3. 86 See Institute of Nuclear Power Operations, “In-reactor Fuel-damaging Events: A Chronology 1945-1990,” INPO 91-008, July 1991. http://research.greenpeaceusa.org/?a=download&d=434 87 Martin G. Malsch, “US Nuclear Power Reactor Safety Goals and Protection from Natural Phenomena,” International Workshop on Nuclear Safety: Improving Safety in the Aftermath of the Fukushima Crisis, Beijing, China, June 29, 2011.
14
we record 25 instances of fuel damage that have occurred in 24 nuclear power plants.88 The 24 reactors are: 89
1. Experimental Breeder Reactor-I (EBR-I) 2. Sodium Reactor Experiment (SRE) 3. Stationary Low-Power Reactor No. 1 (SL-1) 4. Enrico Fermi Reactor-1 5. Ågesta 6. Chapelcross-2 7. St. Laurent A-1 8. Lucens Experimental Power Reactor 9. St. Laurent A-2 10. Dresden-3 11. Three Mile Island-2 12. Hatch-1 13. Surry-1 14. Arkansas Nuclear One-1 15. Oyster Creek (two core damage events) 16. Atucha-1 17. Chernobyl-4 18. Limerick-1 19. Pickering A-1 20. Hadden Neck (Connecticut Yankee) 21. Greifswald-5 22. Fukushima Dai-ichi-1 23. Fukushima Dai-ichi-2 24. Fukushima Dai-ichi-3
Following INPO’s lead, in Table 1, events involving minor fuel damage resulting from fabrication flaws or damage that occurred during fuel handling are excluded.90 Also excluded are fuel damage events resulting from vibration or erosion from coolant flow (baffle jet impingement) because such damage could have occurred without the reactor ever being critical.91
88 Oyster Creek Generating Station experienced two fuel failure events. 89 Absent from this list are events at reactors that were not designed to produce electricity, including events with major fuel damage at research and test reactors—National Research Experiment (NRX) (December 12, 1952) and Heat Transfer Reactor Experiment (HTRE-3) (November 8, 1958), Westinghouse Testing Reactor (WTR) (April 3, 1960), Oak Ridge Research Reactor (July 1, 1963)—and at military production reactors that were not dual-use and connected to the grid—Hanford (October 3, 1954), Hanford (January 5, 1955), Windscale (October 7, 1957). Windscale Pile 1, an air-cooled, graphite-moderated plutonium production reactor, was destroyed by a fire in October 1957. Windscale Piles 1 and 2 were both permanently shut down following the fire in Pile 1. 90 See Institute of Nuclear Power Operations, “In-reactor Fuel-damaging Events: A Chronology 1945-1990,” INPO 91-008, July 1991. 91 Ibid.
15
All 24 reactors produced electricity. Twenty-two of the reactors—all except EBR-I and SL-1—were connected to the grid during some period of their operation. Seven reactors—Lucens, TMI-2, Chernobyl-4, Greifswald-5 and Fukushima Dai-ichi-1, -2, and 3—were permanently shut down as a consequence of reactor accidents resulting in partial core melt or fuel damage. After 18 accidents at 17 reactors, the fuel melt or damage did not result in immediate closure of the plant; rather the damage was repaired and the reactor was restarted. However, in three cases—SER, SL-1 and Fermi-1—the reactors only operated for a short period of time following the fuel damage incident. Sixteen of the 24 power reactors are now permanently shut down. Eight reactors— Dresden-3, Hatch-1, Surry-1, Arkansas Nuclear One-1, Oyster Creek, Atuche-1, Limerick-1 and Pickering A-1—are still operational. In assessing the historical core melt frequency among nuclear power reactors, the number counted depends on how the issue is framed. EBR-I, SL-1 and Lucens can be excluded on the basis that they were experimental reactors. EBR-I produced electricity but was not connected to the grid. The SL-1design was abandoned after the accident. Although it was the first U.S. reactor to supply electricity to the grid, the SRE could be excluded because it was primarily a research reactor. Ågesta was an early small design. Chapelcross-2 and St. Laurent A1 and A2 were dual use military reactors, producing plutonium for weapons and electricity for civilian use. Ågesta was also intended to be a production reactor. Thus, reasoned arguments can be advanced for excluding up to eight reactors/events of the 25 events at the 24 reactors. It is difficult to make a case that any of the remaining 17 events at 16 reactors should be excluded. Also notable is how the frequency of fuel damage events varies over time. There were two events in the 1950s, six in the 1960s, three in the 1970s, 11 in the 1980s, and three to-date in the 2010s. The absence of events between 1990 and the Fukushima events may reflect a lack of documentation rather than a lack of events. We will assume there were no, or only a few, events during this period. Thus, before Fukushima the historical CDF data suggested that power reactor operations were becoming significantly safer over time—a case that has become more difficult to make after Fukushima. Worldwide, there have been 141 nuclear power plants that have been shut down after becoming operational with a total generating capacity of about 43,811 mega-watts electric (MWe) and about 3,077 reactor-years of cumulative operation.92 Excluding EBR-I and SL-1, 14 experienced fuel damage.93 Thus, one in ten (141/14 = 10.1) shut down power reactors experienced some form of fuel damage during their operation. Even excluding experimental and dual-purpose production reactors (EBR-I, SRE, SL-1, Ågesta, Chapelcross-2, Lucens and St. Laurent A-1 and A-2, for example) one in 15
92 This sum excludes production reactors that were not dual-use and connected to the grid and the U.S. reactors, EBR-I, SL-1, ML-1, PM-1, PM-2A, PM-3A, SM-1, SM-1A and Sturgis. Although it produced electricity, EBR-I and SL-1 are excluded because they were not connected to the grid. The German KNK-I and KNK-II reactors are treated a one reactor. 93 The 14 shut down reactors that experienced fuel damage counted here are SER, Fermi-1, Ågesta, Chapelcross-2, Lucens, St. Laurent A-1 and A-2, TMI-2, Chernobyl-4, Hadden Neck, Greifswald-5, and Fukushima Dai-ichi-1, -2 and -3.
16
(108/7=15.4) shut down power reactors experienced some form of fuel damage during their operation. Of the power reactors that have been shut down, seven—Lucens, TMI-2, Chernobyl-4, Greifswald-5, Fukushima Dai-ichi-1, -2, -3—were shut down as a direct consequence of partial or full core melt accidents—one in 20 (141/7 = 20.1) reactors, or one for every 440 reactor-years (3,077/7 = 440) of operation. Excluding experimental (e.g., Lucens) and dual-purpose production reactors, one in 18 (108/6 = 18.0) were shut down as a direct consequence of partial core melt accidents. With the same exclusions only about nine out of ten giga-watts (GW) (40,545-4,068)/40,545 = 0.9) of nuclear power plant capacity have been closed without experiencing a fuel damage accident. One out of 10 GW (40,545/4,068 = 10) of nuclear power plant capacity have been closed as a direct result of a fuel melting accident. Worldwide, there have been 593 nuclear power reactors that have operated approximately 14,400 reactor-years.94 Thus, to date, the historical frequency of core damage is about one in 600 reactor-years (14,400/23 = 626). Even if one excluded nine of the fuel damage events—thus discounting the least severe core damage events—the CDF is still one in 1,000 reactor-years, or an order of magnitude greater that what the US NRC deemed acceptable. Worldwide, there have been 433 Light Water Reactors (LWRs) that have operated, of which 74 have been shut down and 359 remain operational. Among LWRs there have been 13 core damage events in 12 LWRs. Five of these were serious partial core melt downs—TMI-2, Greifsweld-5, Fukushima-1, -2, -3. More than one percent of the LWRs have experienced a serious core melt down. Four of the five generated a hydrogen explosion. One of the four hydrogen explosions (at TMI-2) was contained, but then we are not counting the hydrogen explosion at Fukushima Dai-ichi-4 which appears to have resulted from the core melt event at Fukushima Dai-ichi-3. Worldwide, there have been 117 Boiling Water Reactors (BWRs) that have operated approximately 3,100 reactor-years. Thus, to date, the historical frequency of core-melt accidents in BWRs is about one in 1,000 reactor-years (3,100/3 = 1,033). Worldwide, there have been 49 BWRs with Mark 1 containments (the type at Fukushima) and 12 with Mark 2 containments. Five with Mark 1 containment (Millstone Unit 1 and Fukushima Dai-ichi Units 1-4) have been permanently shut down. These 61 BWRs have operated for 1,900 reactor-years to date. Thus, to date, the historical frequency of core-melt accidents in BWRs with Mark 1 and 2 containments is about one in 630 reactor-years (1,900/3 = 633). Clearly, the historical frequency of core damage events worldwide does not measure up to the safety objectives of the US NRC. On the whole, the operational reactors worldwide are not sufficiently safe. If one believes U.S. reactors on the whole are safer than those in most other countries, the logical conclusion is that the reactors in these other countries 94 See footnote 92.
17
are somewhat less safe than indicated by the worldwide historical frequency of core damage. If nuclear power is to have a long-term future, greater attention must be given to the safety of current operational reactors worldwide. Older obsolete designs should be phased out rather than having their licenses extended.95 Reactors currently under construction worldwide and those on the drawing board must be made safer than operational reactors. We offer two additional observations regarding the use of probabilistic risk assessments (PRAs) and the NRC safety goals. First, the NRC increasingly relies upon core-melt frequency estimates from PRA studies. While PRA analyses provide a useful relative measure of safety, given the large uncertainties of many input assumptions we do not believe quantitative risk calculations reliably measure the absolute frequency of low-probability catastrophic accidents. As but one example of why the absolute frequency values are unreliable, prior to Fukushima PRAs did not include scenarios where major events such as a hurricane, tornado or other severe weather conditions result in the loss of offsite power for more than 24 hours. Rather, the PRA analyses assumed offsite power would be restored within a few hours, and thus the PRAs were typically not run for more than 24 hours after the accident is initiated. For the second observation we return to the two US NRC’s quantitative safety goals:
• The risk to an average individual in the vicinity of a nuclear power plant of prompt fatalities that might result from reactor accidents should not exceed one-tenth of one percent (0.1 percent) of the prompt fatality risks resulting from other accidents to which members of the U.S. population are generally exposed.
• The risk to the population in the area near a nuclear power plant of cancer fatalities that might result from nuclear power plant operation should not exceed one-tenth of one percent (0.1 percent) of the sum of cancer fatality risks resulting from all other causes.
While these risk limits are typically compared against PRA estimates of frequency of accident scenarios multiplied by their consequences, we have taken a different approach. We compare the Fukushima consequences to the safety goals. In this comparison the operation of the Fukushima Dai-ichi nuclear plants, even accounting for the radioactive releases from the disaster, meet these two NRC safety goals. There were no prompt radiation fatalities due to the Fukushima accident. There were about 60,000 persons living within 20 km (12.6 mi) of Fukushima Dai-ichi. Over their lifetimes one would expect about 12,000 (20 percent) cancer fatalities from other causes. One-tenth of one percent of this amount is 12 cancer fatalities. Since the population was evacuated, less than 12 cancer fatalities are expected in this population from Fukushima. 95 In the United States 71 of the 104 operational reactors have been granted 20-year license renewals by the NRC. See US NRC, “Status of License Renewal Applications and Industry Activities,” updated July 25, 2011. http://www.nrc.gov/reactors/operating/licensing/renewal/applications.html
18
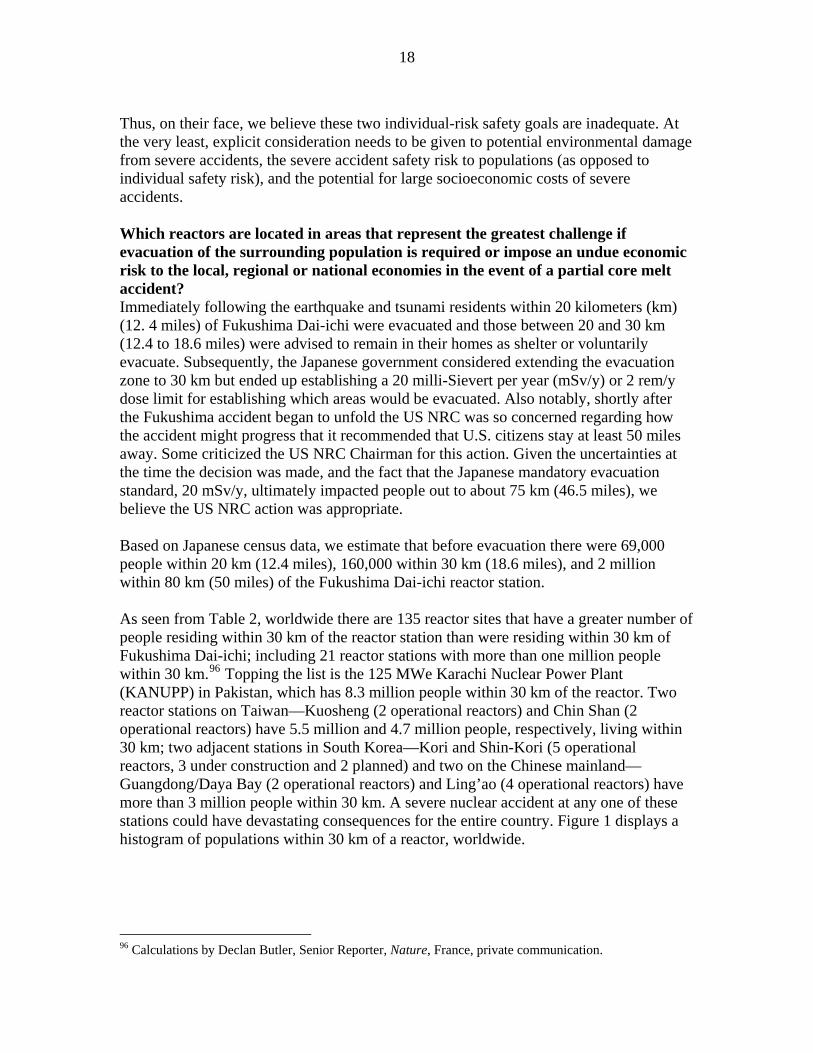
Thus, on their face, we believe these two individual-risk safety goals are inadequate. At the very least, explicit consideration needs to be given to potential environmental damage from severe accidents, the severe accident safety risk to populations (as opposed to individual safety risk), and the potential for large socioeconomic costs of severe accidents. Which reactors are located in areas that represent the greatest challenge if evacuation of the surrounding population is required or impose an undue economic risk to the local, regional or national economies in the event of a partial core melt accident? Immediately following the earthquake and tsunami residents within 20 kilometers (km) (12. 4 miles) of Fukushima Dai-ichi were evacuated and those between 20 and 30 km (12.4 to 18.6 miles) were advised to remain in their homes as shelter or voluntarily evacuate. Subsequently, the Japanese government considered extending the evacuation zone to 30 km but ended up establishing a 20 milli-Sievert per year (mSv/y) or 2 rem/y dose limit for establishing which areas would be evacuated. Also notably, shortly after the Fukushima accident began to unfold the US NRC was so concerned regarding how the accident might progress that it recommended that U.S. citizens stay at least 50 miles away. Some criticized the US NRC Chairman for this action. Given the uncertainties at the time the decision was made, and the fact that the Japanese mandatory evacuation standard, 20 mSv/y, ultimately impacted people out to about 75 km (46.5 miles), we believe the US NRC action was appropriate. Based on Japanese census data, we estimate that before evacuation there were 69,000 people within 20 km (12.4 miles), 160,000 within 30 km (18.6 miles), and 2 million within 80 km (50 miles) of the Fukushima Dai-ichi reactor station. As seen from Table 2, worldwide there are 135 reactor sites that have a greater number of people residing within 30 km of the reactor station than were residing within 30 km of Fukushima Dai-ichi; including 21 reactor stations with more than one million people within 30 km.96 Topping the list is the 125 MWe Karachi Nuclear Power Plant (KANUPP) in Pakistan, which has 8.3 million people within 30 km of the reactor. Two reactor stations on Taiwan—Kuosheng (2 operational reactors) and Chin Shan (2 operational reactors) have 5.5 million and 4.7 million people, respectively, living within 30 km; two adjacent stations in South Korea—Kori and Shin-Kori (5 operational reactors, 3 under construction and 2 planned) and two on the Chinese mainland—Guangdong/Daya Bay (2 operational reactors) and Ling’ao (4 operational reactors) have more than 3 million people within 30 km. A severe nuclear accident at any one of these stations could have devastating consequences for the entire country. Figure 1 displays a histogram of populations within 30 km of a reactor, worldwide.
96 Calculations by Declan Butler, Senior Reporter, Nature, France, private communication.
19
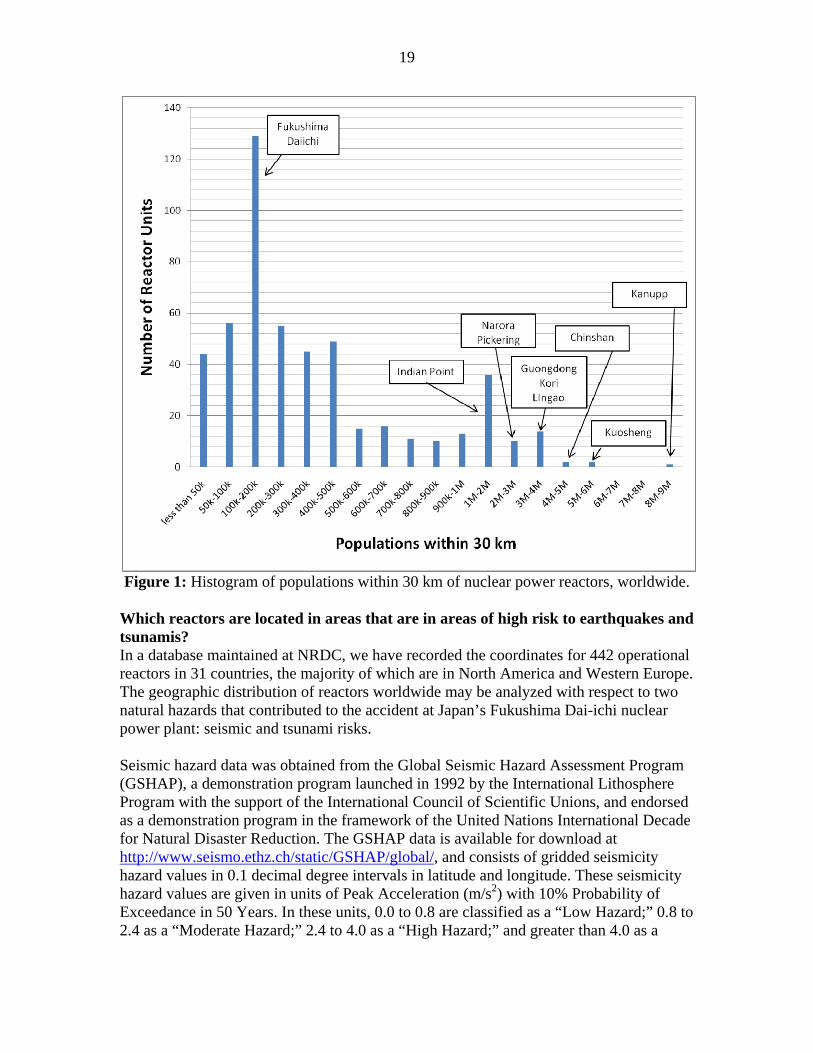
Figure 1: Histogram of populations within 30 km of nuclear power reactors, worldwide. Which reactors are located in areas that are in areas of high risk to earthquakes and tsunamis? In a database maintained at NRDC, we have recorded the coordinates for 442 operational reactors in 31 countries, the majority of which are in North America and Western Europe. The geographic distribution of reactors worldwide may be analyzed with respect to two natural hazards that contributed to the accident at Japan’s Fukushima Dai-ichi nuclear power plant: seismic and tsunami risks. Seismic hazard data was obtained from the Global Seismic Hazard Assessment Program (GSHAP), a demonstration program launched in 1992 by the International Lithosphere Program with the support of the International Council of Scientific Unions, and endorsed as a demonstration program in the framework of the United Nations International Decade for Natural Disaster Reduction. The GSHAP data is available for download at http://www.seismo.ethz.ch/static/GSHAP/global/, and consists of gridded seismicity hazard values in 0.1 decimal degree intervals in latitude and longitude. These seismicity hazard values are given in units of Peak Acceleration (m/s2) with 10% Probability of Exceedance in 50 Years. In these units, 0.0 to 0.8 are classified as a “Low Hazard;” 0.8 to 2.4 as a “Moderate Hazard;” 2.4 to 4.0 as a “High Hazard;” and greater than 4.0 as a
20
“Very High Hazard.” Figure 2 charts the number of operational reactors located in the given seismic hazard zones.
Figure 2: Numbers of operational reactors within very high, high, medium and low seismic hazard areas, as determined by the GSHAP seismic hazard data. The 12 operational nuclear reactors within very high seismic hazard areas are listed in Table 3, and are located in Japan and Taiwan, including all of Taiwan’s six operating reactors. In May of 2011 Japanese Prime Minister Naoto Kan requested that the Hamaoka Nuclear Power Plant be shut down, due to predictions that an earthquake of magnitude 8.0 or higher has an 87% likelihood of occurring in the area of the plant within the next 30 years. The plant remains shut and the reactors may begin decommissioning, pending the outcome of lawsuits. The three nuclear reactors at the Onagawa Nuclear Power Plant remain in cold shutdown following the March 11th earthquake and tsunami. In addition to the six operating nuclear reactors in Taiwan located in a very high seismic hazard area, two additional reactors are under construction at Lungmen: Lungmen Unit 1 is expected to begin commercial operation at the end of 2011. Of the 36 operating nuclear reactors in the high seismic risk category, 29 are in Japan, 4 in the United States and one each in Armenia, Iran (Bushehr) and Slovenia (Krško). The 67 operating nuclear reactors in the medium seismic risk area include 15 in Japan, 10 in
21
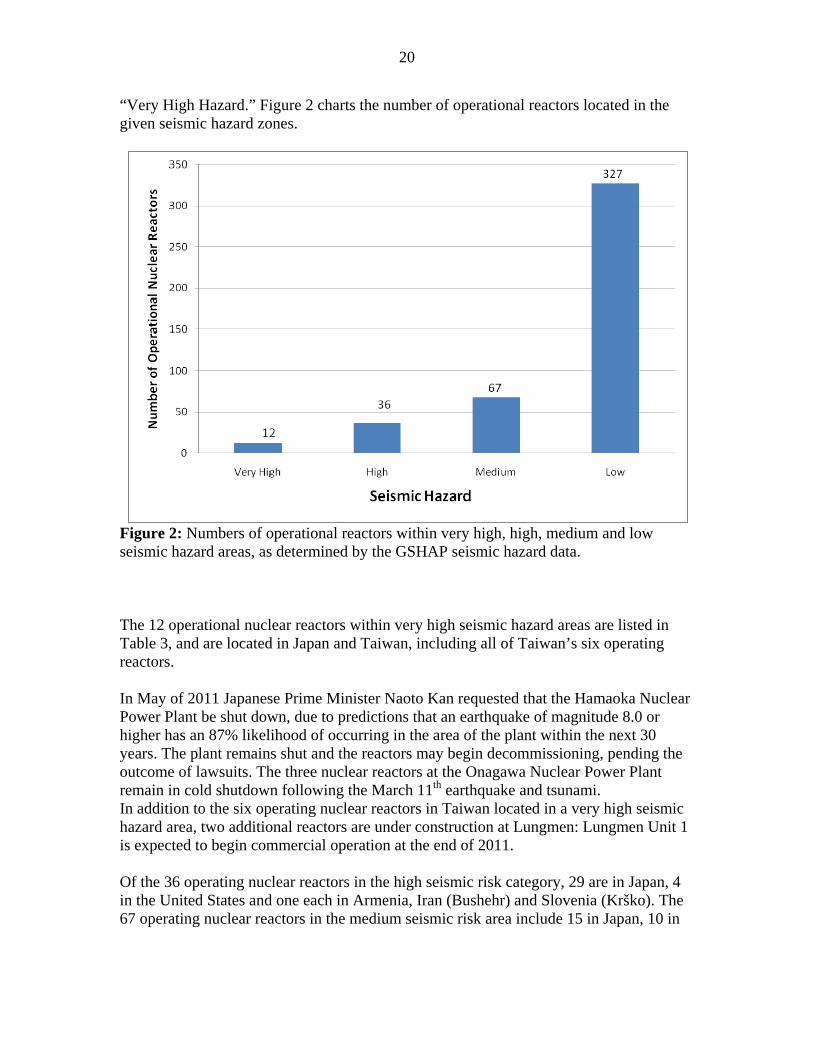
France, 5 in South Korea, and 5 in the United States. Figure 3 shows a map of seismic hazard areas in Asia and the locations of operating nuclear reactors.
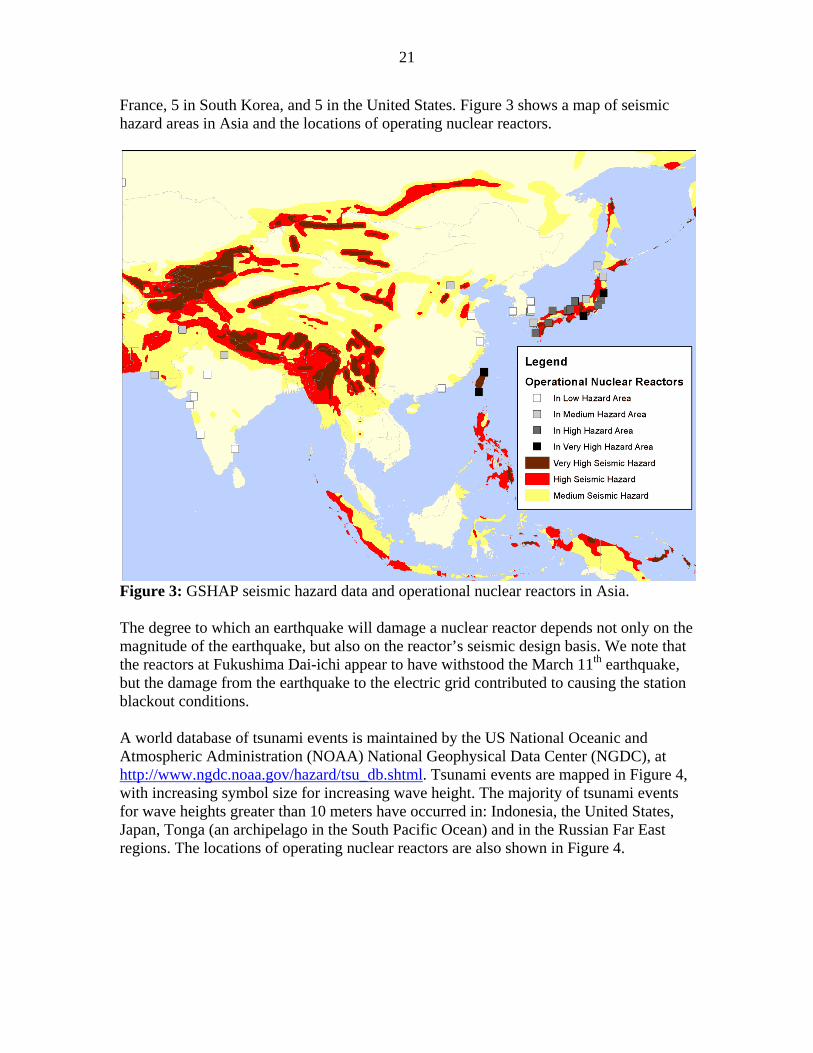
Figure 3: GSHAP seismic hazard data and operational nuclear reactors in Asia. The degree to which an earthquake will damage a nuclear reactor depends not only on the magnitude of the earthquake, but also on the reactor’s seismic design basis. We note that the reactors at Fukushima Dai-ichi appear to have withstood the March 11th earthquake, but the damage from the earthquake to the electric grid contributed to causing the station blackout conditions. A world database of tsunami events is maintained by the US National Oceanic and Atmospheric Administration (NOAA) National Geophysical Data Center (NGDC), at http://www.ngdc.noaa.gov/hazard/tsu_db.shtml. Tsunami events are mapped in Figure 4, with increasing symbol size for increasing wave height. The majority of tsunami events for wave heights greater than 10 meters have occurred in: Indonesia, the United States, Japan, Tonga (an archipelago in the South Pacific Ocean) and in the Russian Far East regions. The locations of operating nuclear reactors are also shown in Figure 4.
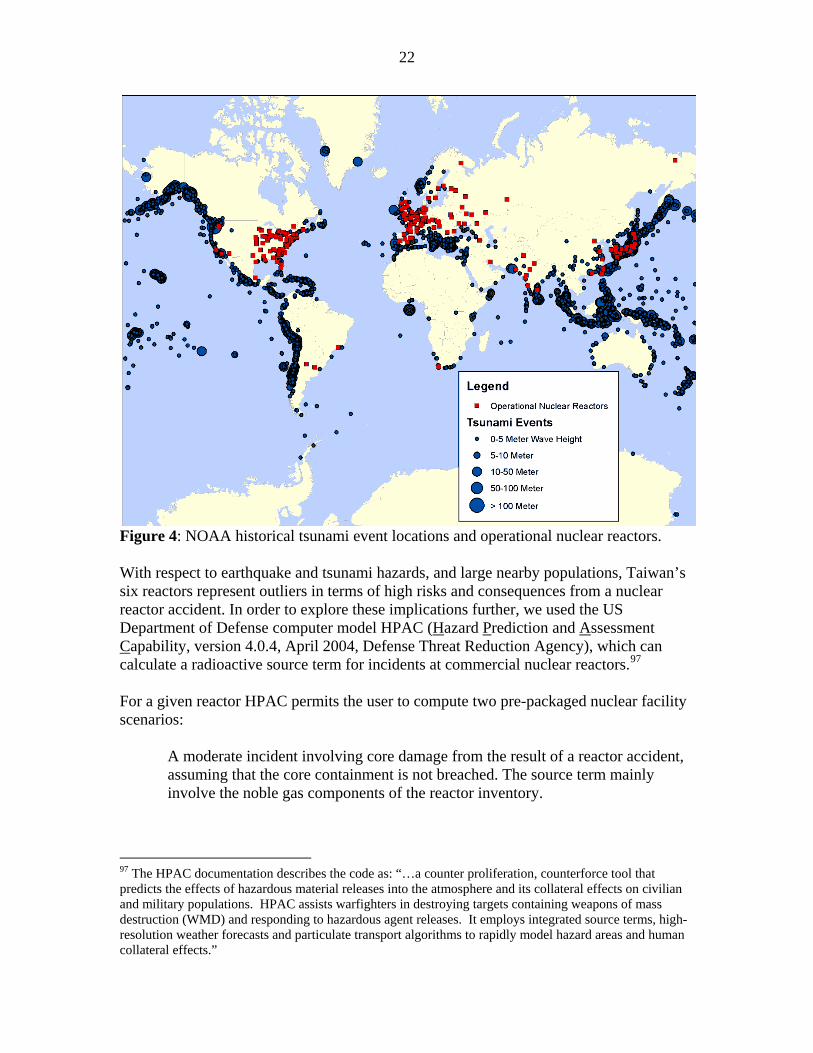
22
Figure 4: NOAA historical tsunami event locations and operational nuclear reactors. With respect to earthquake and tsunami hazards, and large nearby populations, Taiwan’s six reactors represent outliers in terms of high risks and consequences from a nuclear reactor accident. In order to explore these implications further, we used the US Department of Defense computer model HPAC (Hazard Prediction and Assessment Capability, version 4.0.4, April 2004, Defense Threat Reduction Agency), which can calculate a radioactive source term for incidents at commercial nuclear reactors.97 For a given reactor HPAC permits the user to compute two pre-packaged nuclear facility scenarios:
A moderate incident involving core damage from the result of a reactor accident, assuming that the core containment is not breached. The source term mainly involve the noble gas components of the reactor inventory.
97 The HPAC documentation describes the code as: “…a counter proliferation, counterforce tool that predicts the effects of hazardous material releases into the atmosphere and its collateral effects on civilian and military populations. HPAC assists warfighters in destroying targets containing weapons of mass destruction (WMD) and responding to hazardous agent releases. It employs integrated source terms, high-resolution weather forecasts and particulate transport algorithms to rapidly model hazard areas and human collateral effects.”
23
A severe incident involving very serious damage to the reactor core and an associated breach in the reactor containment. This results in a large release of radionuclides to the environment.
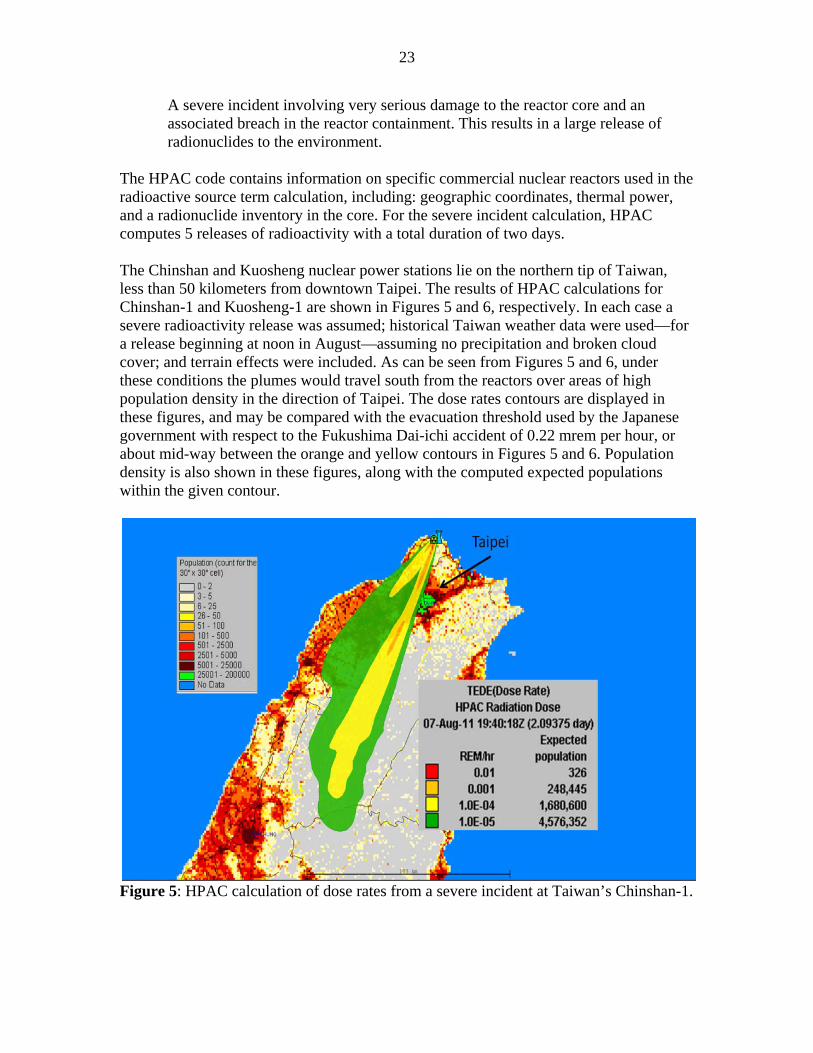
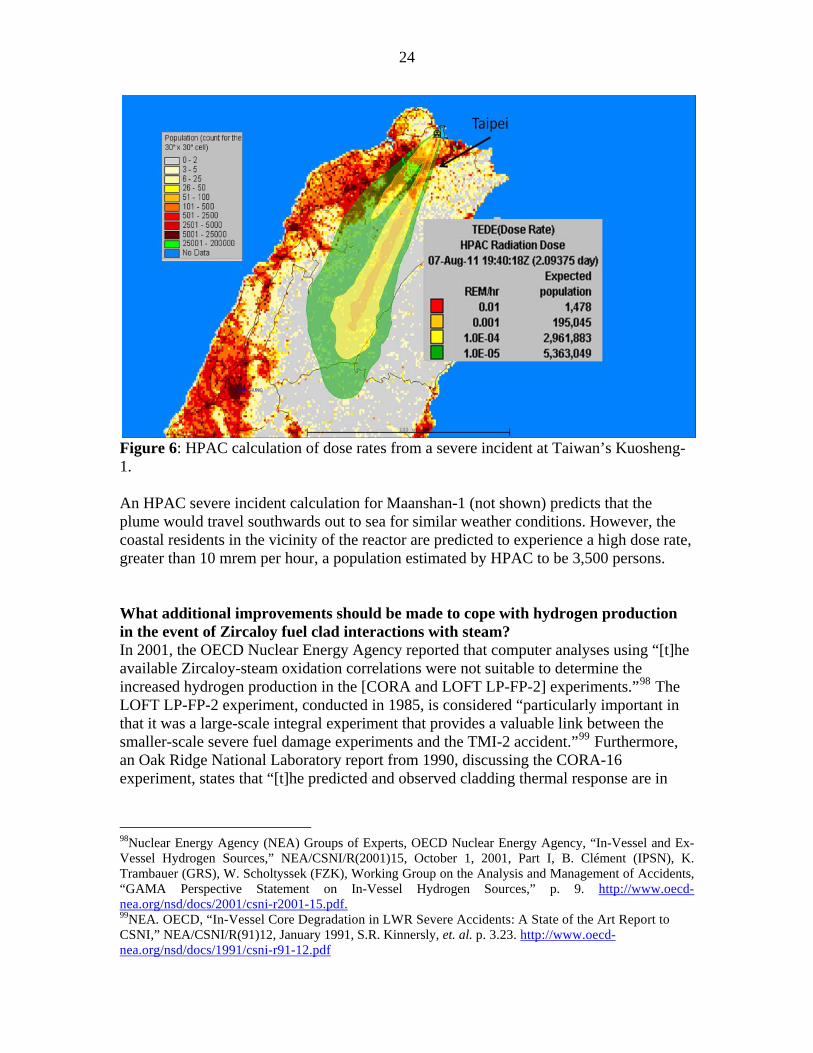
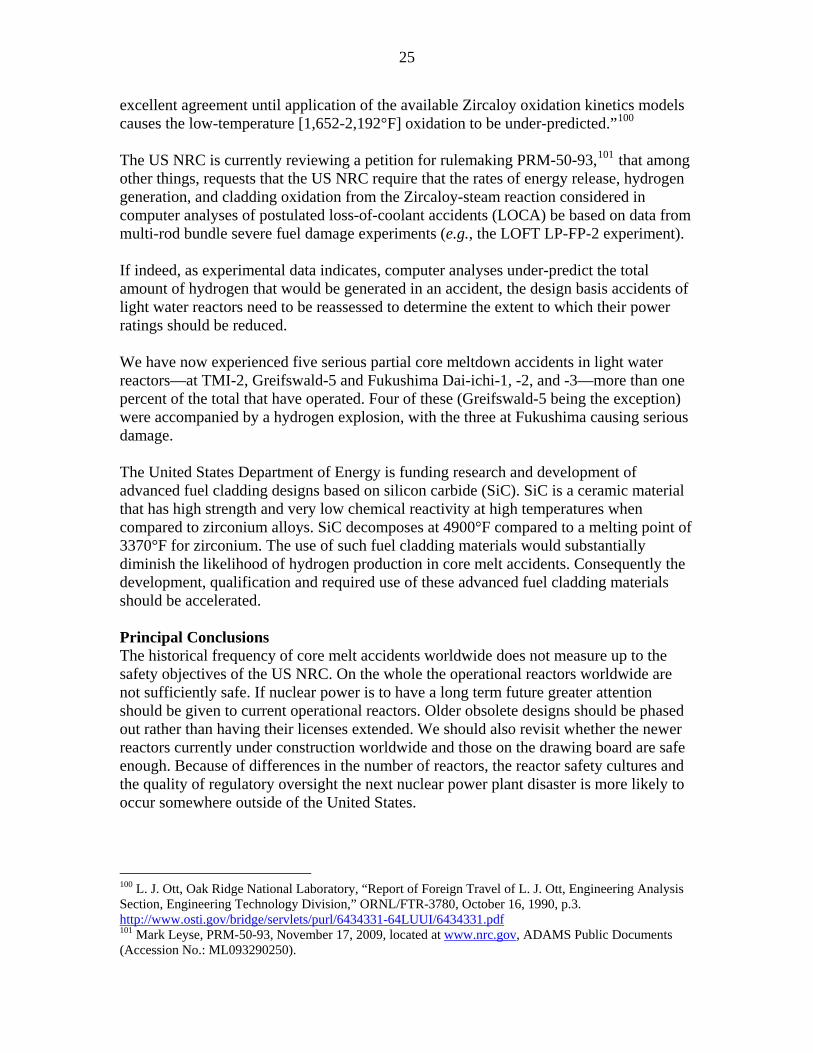
The HPAC code contains information on specific commercial nuclear reactors used in the radioactive source term calculation, including: geographic coordinates, thermal power, and a radionuclide inventory in the core. For the severe incident calculation, HPAC computes 5 releases of radioactivity with a total duration of two days. The Chinshan and Kuosheng nuclear power stations lie on the northern tip of Taiwan, less than 50 kilometers from downtown Taipei. The results of HPAC calculations for Chinshan-1 and Kuosheng-1 are shown in Figures 5 and 6, respectively. In each case a severe radioactivity release was assumed; historical Taiwan weather data were used—for a release beginning at noon in August—assuming no precipitation and broken cloud cover; and terrain effects were included. As can be seen from Figures 5 and 6, under these conditions the plumes would travel south from the reactors over areas of high population density in the direction of Taipei. The dose rates contours are displayed in these figures, and may be compared with the evacuation threshold used by the Japanese government with respect to the Fukushima Dai-ichi accident of 0.22 mrem per hour, or about mid-way between the orange and yellow contours in Figures 5 and 6. Population density is also shown in these figures, along with the computed expected populations within the given contour.
Figure 5: HPAC calculation of dose rates from a severe incident at Taiwan’s Chinshan-1.
24
Figure 6: HPAC calculation of dose rates from a severe incident at Taiwan’s Kuosheng-1. An HPAC severe incident calculation for Maanshan-1 (not shown) predicts that the plume would travel southwards out to sea for similar weather conditions. However, the coastal residents in the vicinity of the reactor are predicted to experience a high dose rate, greater than 10 mrem per hour, a population estimated by HPAC to be 3,500 persons. What additional improvements should be made to cope with hydrogen production in the event of Zircaloy fuel clad interactions with steam? In 2001, the OECD Nuclear Energy Agency reported that computer analyses using “[t]he available Zircaloy-steam oxidation correlations were not suitable to determine the increased hydrogen production in the [CORA and LOFT LP-FP-2] experiments.”98 The LOFT LP-FP-2 experiment, conducted in 1985, is considered “particularly important in that it was a large-scale integral experiment that provides a valuable link between the smaller-scale severe fuel damage experiments and the TMI-2 accident.”99 Furthermore, an Oak Ridge National Laboratory report from 1990, discussing the CORA-16 experiment, states that “[t]he predicted and observed cladding thermal response are in
98Nuclear Energy Agency (NEA) Groups of Experts, OECD Nuclear Energy Agency, “In-Vessel and Ex-Vessel Hydrogen Sources,” NEA/CSNI/R(2001)15, October 1, 2001, Part I, B. Clément (IPSN), K. Trambauer (GRS), W. Scholtyssek (FZK), Working Group on the Analysis and Management of Accidents, “GAMA Perspective Statement on In-Vessel Hydrogen Sources,” p. 9. http://www.oecd-nea.org/nsd/docs/2001/csni-r2001-15.pdf. 99NEA. OECD, “In-Vessel Core Degradation in LWR Severe Accidents: A State of the Art Report to CSNI,” NEA/CSNI/R(91)12, January 1991, S.R. Kinnersly, et. al. p. 3.23. http://www.oecd-nea.org/nsd/docs/1991/csni-r91-12.pdf
25
excellent agreement until application of the available Zircaloy oxidation kinetics models causes the low-temperature [1,652-2,192°F] oxidation to be under-predicted.”100 The US NRC is currently reviewing a petition for rulemaking PRM-50-93,101 that among other things, requests that the US NRC require that the rates of energy release, hydrogen generation, and cladding oxidation from the Zircaloy-steam reaction considered in computer analyses of postulated loss-of-coolant accidents (LOCA) be based on data from multi-rod bundle severe fuel damage experiments (e.g., the LOFT LP-FP-2 experiment). If indeed, as experimental data indicates, computer analyses under-predict the total amount of hydrogen that would be generated in an accident, the design basis accidents of light water reactors need to be reassessed to determine the extent to which their power ratings should be reduced. We have now experienced five serious partial core meltdown accidents in light water reactors—at TMI-2, Greifswald-5 and Fukushima Dai-ichi-1, -2, and -3—more than one percent of the total that have operated. Four of these (Greifswald-5 being the exception) were accompanied by a hydrogen explosion, with the three at Fukushima causing serious damage. The United States Department of Energy is funding research and development of advanced fuel cladding designs based on silicon carbide (SiC). SiC is a ceramic material that has high strength and very low chemical reactivity at high temperatures when compared to zirconium alloys. SiC decomposes at 4900°F compared to a melting point of 3370°F for zirconium. The use of such fuel cladding materials would substantially diminish the likelihood of hydrogen production in core melt accidents. Consequently the development, qualification and required use of these advanced fuel cladding materials should be accelerated. Principal Conclusions The historical frequency of core melt accidents worldwide does not measure up to the safety objectives of the US NRC. On the whole the operational reactors worldwide are not sufficiently safe. If nuclear power is to have a long term future greater attention should be given to current operational reactors. Older obsolete designs should be phased out rather than having their licenses extended. We should also revisit whether the newer reactors currently under construction worldwide and those on the drawing board are safe enough. Because of differences in the number of reactors, the reactor safety cultures and the quality of regulatory oversight the next nuclear power plant disaster is more likely to occur somewhere outside of the United States.
100 L. J. Ott, Oak Ridge National Laboratory, “Report of Foreign Travel of L. J. Ott, Engineering Analysis Section, Engineering Technology Division,” ORNL/FTR-3780, October 16, 1990, p.3. http://www.osti.gov/bridge/servlets/purl/6434331-64LUUI/6434331.pdf 101 Mark Leyse, PRM-50-93, November 17, 2009, located at www.nrc.gov, ADAMS Public Documents (Accession No.: ML093290250).
26
In light of an improved scientific understanding of the full range of natural and man-made “beyond design basis” events that could strike nuclear plants, the risk of core melt followed by failure of containment should be stringently reevaluated for existing and new reactors located in areas of high population density and high risk from natural disasters. Under these revised conditions, the feasibility of an adequately protective evacuation and the potential for severe economic damage extending 30 km and beyond should be reassessed. The severity of the resulting radiological and other risks to life, property, and natural resources should inform regulatory decisions regarding which units should have their operating licenses shortened or construction permits revoked. Countries should make comprehensive reassessments of the risks due to all the principal severe accident precursors, including the risks associated with earthquakes (beginning with those in areas of known high seismic risk), flooding, fires and malevolent acts at all reactor sites, and tsunamis, hurricanes and typhoon of coastal reactors. These studies and assessments should be conducted before further reactor license extensions are granted.
27
Table 1: Nuclear Power Reactors that have Experienced Fuel Damage.102 1. Experimental Breeder Reactor I (EBR-I) Location: Idaho National Laboratory, Idaho, USA Reactor type: Liquid Metal Fast Breeder Reactor ( LMFBR) Power: 1.2 MWt; 0.2 MWe History: initial criticality: December 20, 1951; world’s first electricity generating nuclear
power plant; on November 29, 1955 a slow scram instead of a required fast scram was activated manually to terminate a planned transient. (For these experiments, the automatic fast scram capability, which was added to the reactor to compensate for a design weakness, was bypassed in the automatic mode.) About 50 percent of the core melted. The sodium-potassium coolant boiled, forcing molten fuel into the blanket-reflector region. Reactor shut down December 30, 1963.
2.Sodium Reactor Experiment (SER) Location: Santa Susana Field Laboratory, California, USA Reactor type: sodium-cooled graphite-moderated thermal power reactor Power: 20 MWt; 6.5 MWe History: initial criticality: April 25, 1957; first produced electricity July 1957; operated 2
years, partial core melt accident between 12 and 26 July 1959, resulting in melting of as much as one-third of the fuel; shutdown 26 July 1959 (It appears to have been operated for several days with its core partially melted.); converted to HEU-Th fuel; second core operations began September 1960; permanently shutdown February 1964.
3. Stationary Low-Power Reactor No. 1 (SL-1) Location: National Reactor Testing Station (now Idaho National Laboratory) Reactor type: experimental, gas-cooled, water-moderated Power: 3.3 MWt; 300 kWe History: initial criticality March 1961; on January 3, 1961, in the process of working on
control rod mechanisms, the center control rod was lifted manually by an excessive amount. A violent power excursion (prompt criticality) resulted, impaling the operator on the ceiling of the building and causing three fatalities, the only three people present. The facility was permanently shut down May 1964
4. Enrico Fermi Unit 1 Reactor Location: Newport, Lagoona Beach, Frenchtown Township, Monroe County, Michigan,
USA Reactor Type: Liquid Metal Fast Breeder Reactor ( LMFBR) Power: 200 MWt; 65 MWe (gross); 61 MWe (net) History: initial criticality 23 August 1963; commercial operations began August 1966;
partial fuel melt accident 5 October 1966, two of the 105 fuel assemblies melted, but no contamination was recorded outside the containment vessel; closed November 1972
5. Ågesta Nuclear Power Plant Location: near Farsta, Sweden Reactor Type: Pressurized Heavy Water Reactor (PHWR)
102 Much of the history data are from the Institute of Nuclear Power Operations, “In-reactor Fuel-damaging Events: A Chronology 1945-1990,” INPO 91-008, July 1991.
28
Power: 80 MWt; supplied 55 MWt heat; 12 MWe (gross); 10 MWe (net) History: grid connection and commercial operation May 1964; in 1968 15 fuel
assemblies failed due to spacer grid spring relaxation and flow vibration. The reactor was returned to service with modified fuel and permanently shutdown June 2, 1974.
6. Chapelcross Unit 2 Nuclear Power Plant Location: Annan, Dumfreshire, Scotland, United Kingdom Reactor Type: gas-cooled, graphite moderated; Magnox Power: originally 180 MWt, up-rated progressively to 265 MWt, originally 23 MWe
(gross) progressively up-rated to 60 MWe (gross); 50 MWe (net) History: startup May 1959; while under evaluation for the commercial reactor program
experienced a partial blockage in a single fuel channel May 1967, contamination was limited to one region of the core; shut down 29 June 2004
7. Lucens Experimental Power Reactor Location: underground at Lucens, Moudon, Switzerland Reactor Type: heavy water moderated gas-cooled reactor Power: 30 MWt, 7 MWe History: start up 1962; generated electricity for the first time in January 1968; on
January 21, 1969, the reactor was damaged irreparably during a startup because fuel channels were obstructed by corrosion products from moisture leakage into the carbon-dioxide reactor coolant. Fuel cladding melted, pressure tubes ruptured, and a violent reaction of molten metal with the carbon-dioxide coolant or heavy-water moderator occurred. Two-thirds of the core fuel inventory was released into the moderator. The reactor vessel was damaged severely, and over five tons of contaminated heavy water poured into the fuel-handling room beneath the reactor. The reactor is permanently shut down.
8. Saint-Laurent A-1 Nuclear Power Plant Location: St. Laurent-Nouan, Loir-et-Cher, Centre, France Reactor Type: gas-cooled, graphite moderated Power: 1570 MWt; 405 MWe (gross), 390 MWe (net) History: grid connection 14 March 1969; commercial operation June 1969; on October
17, 1969, a coolant flow restrictor was loaded into the fuel channel by manually overriding an automatic stop on the on-line refueling machine. One hundred and eighty kilograms of fuel were melted during subsequent operation. While off-site radioactivity releases were minimal and no one was injured, the reactor was shut down for one year to complete cleanup operations end repair. The reactor was permanently shut down 27 May 1992.
9. Dresden Unit 3 Nuclear Power Plant Location: Morris, Grundy County, Illinois, USA Reactor Type: Boiling Water Reactor (BWR), BWR-3 (GE2), Mark 1 containment Power: 2,725 MWt; 867 MWe (gross) History: initial criticality January 1, 1971; on October 31, 1974, the control rods were operated in
a manner intended to achieve better burnup of the fuel in the bottom of the core. The control rod movements did not adhere to guidelines provided by the fuel vendor. The technical review completed prior to positioning the control rods was inadequate. A xenon transient was started, causing power peaking near the bottom of the core. The clad was perforated in localized areas,
29
resulting in a minor release of radioactivity. Replacement of a number of fuel elements was required. The nuclear power plant is currently operational.
10. Saint-Laurent A-2 Nuclear Power Plant Location: St. Laurent-Nouan, Loir-et-Cher, Centre, France Reactor Type: gas-cooled, graphite moderated Power: 1690 MWt; 465 MWe (gross) (uprated to 530 MWe (gross)), 450 MWe (net) History: started November 1970; grid connection 9 August 1971; commercial operation
November 1971; heat excursion causing some fuel melting 13 March 1980; permanently shut down 27 May 1992
11. Three Mile Island Unit 2 Nuclear Power Plant Location: Londonderry Township; Dauphine County, Pennsylvania, USA Reactor Type: Pressurized Water Reactor (PWR) Power: 2,568 MWt, 808 MWe (gross); 776 MWe (net) History: initial criticality December 1978; partial core melt accident March 28, 1979;
decommissioned 1979; plant conditions, including reactor coolant system water inventory, were misinterpreted during a transient triggered by a minor fault in a non-safety system. The high-pressure safety injection system was prematurely shut off, reactor coolant pumps were turned off, and a stuck-open pressurizer relief valve was not diagnosed and isolated. As a result, the reactor core was severely damaged, and highly contaminated water spilled into the containment and auxiliary buildings.
12. Edwin I. Hatch Unit 1 Nuclear Power Plant Location: Baxley, Appling County, Georgia, USA Reactor Type: Boiling Water Reactor (BWR), BWR-4 (GE3), Mark 1 containment Power: 2,436 MWt; 810 MWe (gross) History: initial criticality September 12, 1974; on September 20, 1981, while operating at 100 percent power, large quantities of cold feedwater were added to the reactor vessel in a short period of time causing a power transient that was controlled by the insertion of control rods. The control rod geometry that was utilized resulted in increased local power peaking. The resultant fuel failures caused air ejector activity to rise to 0.3 Ci per second. (The reactor had been operated before the transient with a high concentration of copper in the coolant for an extended period, possibly weakening the fuel rod cladding.) The nuclear power plant is currently operational. 13. Surry Unit 1 Nuclear Power Plant Location: Gravel Neck, Surry County, Virginia, USA Reactor Type: Pressurized Water Reactor (PWR), 3-loop Power: 2,441 MWt, 822.6 MWe (gross); 781 MWe (net) History: initial criticality July 1, 1972; on March 9, 1983, fuel rods were discovered damaged due to metal chips that had been left in the reactor coolant system. The steam generators had been replaced previously, and necessary standards of reactor system cleanliness had not been maintained. Five years of operation were required to remove the resultant contamination from the reactor coolant system. The nuclear power plant is currently operational. 14. Arkansas Nuclear One Unit 1 Nuclear Power Plant Location: Russellville, Pope County, Arkansas, USA Reactor Type: Pressurized Water Reactor (PWR), 2-loop
30
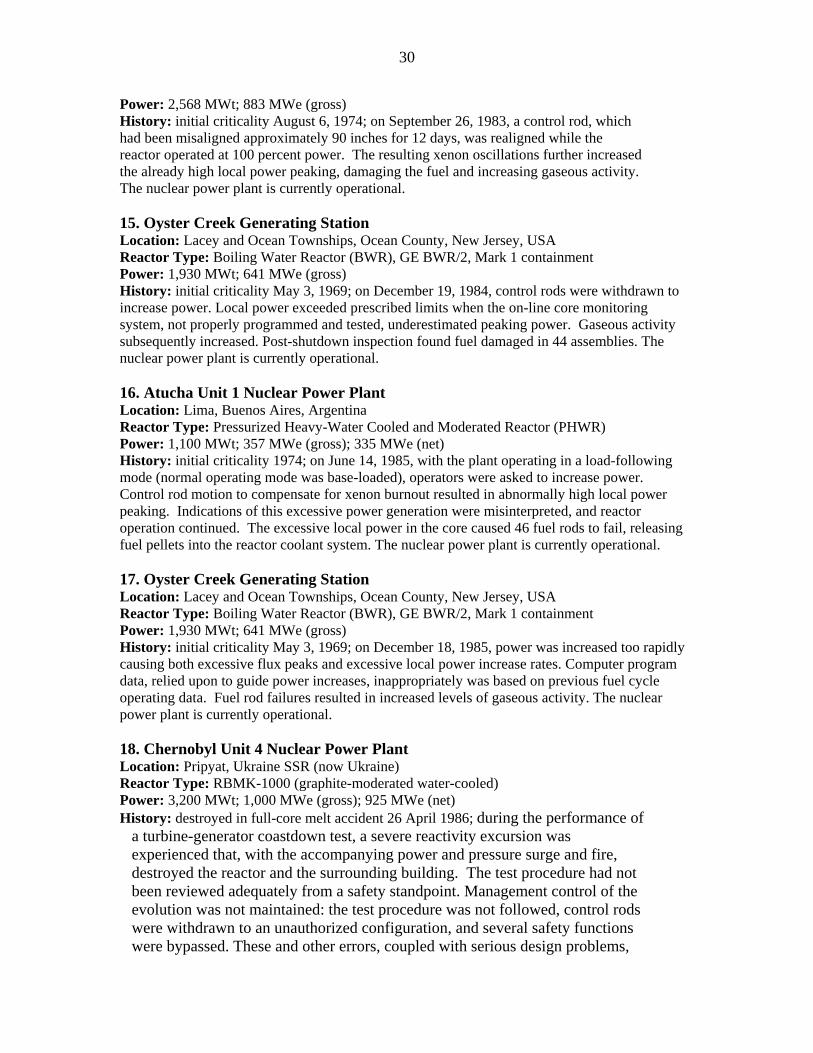
Power: 2,568 MWt; 883 MWe (gross) History: initial criticality August 6, 1974; on September 26, 1983, a control rod, which had been misaligned approximately 90 inches for 12 days, was realigned while the reactor operated at 100 percent power. The resulting xenon oscillations further increased the already high local power peaking, damaging the fuel and increasing gaseous activity. The nuclear power plant is currently operational. 15. Oyster Creek Generating Station Location: Lacey and Ocean Townships, Ocean County, New Jersey, USA Reactor Type: Boiling Water Reactor (BWR), GE BWR/2, Mark 1 containment Power: 1,930 MWt; 641 MWe (gross) History: initial criticality May 3, 1969; on December 19, 1984, control rods were withdrawn to increase power. Local power exceeded prescribed limits when the on-line core monitoring system, not properly programmed and tested, underestimated peaking power. Gaseous activity subsequently increased. Post-shutdown inspection found fuel damaged in 44 assemblies. The nuclear power plant is currently operational. 16. Atucha Unit 1 Nuclear Power Plant Location: Lima, Buenos Aires, Argentina Reactor Type: Pressurized Heavy-Water Cooled and Moderated Reactor (PHWR) Power: 1,100 MWt; 357 MWe (gross); 335 MWe (net) History: initial criticality 1974; on June 14, 1985, with the plant operating in a load-following mode (normal operating mode was base-loaded), operators were asked to increase power. Control rod motion to compensate for xenon burnout resulted in abnormally high local power peaking. Indications of this excessive power generation were misinterpreted, and reactor operation continued. The excessive local power in the core caused 46 fuel rods to fail, releasing fuel pellets into the reactor coolant system. The nuclear power plant is currently operational. 17. Oyster Creek Generating Station Location: Lacey and Ocean Townships, Ocean County, New Jersey, USA Reactor Type: Boiling Water Reactor (BWR), GE BWR/2, Mark 1 containment Power: 1,930 MWt; 641 MWe (gross) History: initial criticality May 3, 1969; on December 18, 1985, power was increased too rapidly causing both excessive flux peaks and excessive local power increase rates. Computer program data, relied upon to guide power increases, inappropriately was based on previous fuel cycle operating data. Fuel rod failures resulted in increased levels of gaseous activity. The nuclear power plant is currently operational. 18. Chernobyl Unit 4 Nuclear Power Plant Location: Pripyat, Ukraine SSR (now Ukraine) Reactor Type: RBMK-1000 (graphite-moderated water-cooled) Power: 3,200 MWt; 1,000 MWe (gross); 925 MWe (net) History: destroyed in full-core melt accident 26 April 1986; during the performance of
a turbine-generator coastdown test, a severe reactivity excursion was experienced that, with the accompanying power and pressure surge and fire, destroyed the reactor and the surrounding building. The test procedure had not been reviewed adequately from a safety standpoint. Management control of the evolution was not maintained: the test procedure was not followed, control rods were withdrawn to an unauthorized configuration, and several safety functions were bypassed. These and other errors, coupled with serious design problems,
31
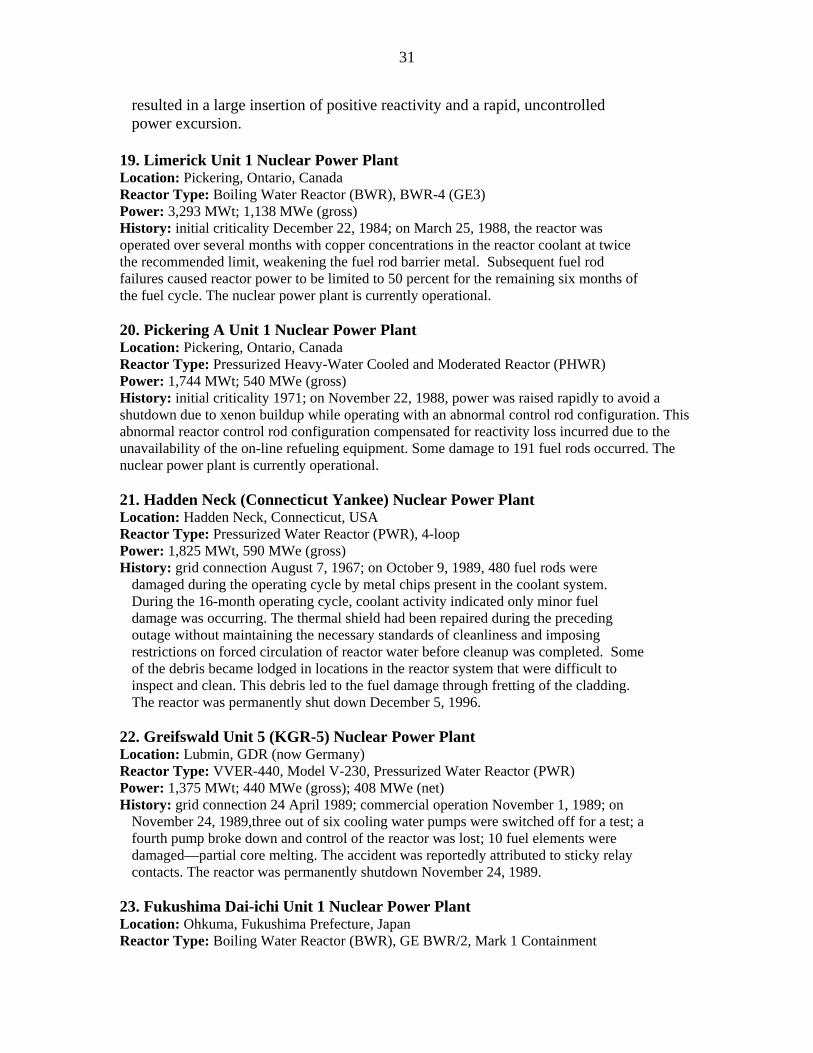
resulted in a large insertion of positive reactivity and a rapid, uncontrolled power excursion.
19. Limerick Unit 1 Nuclear Power Plant Location: Pickering, Ontario, Canada Reactor Type: Boiling Water Reactor (BWR), BWR-4 (GE3) Power: 3,293 MWt; 1,138 MWe (gross) History: initial criticality December 22, 1984; on March 25, 1988, the reactor was operated over several months with copper concentrations in the reactor coolant at twice the recommended limit, weakening the fuel rod barrier metal. Subsequent fuel rod failures caused reactor power to be limited to 50 percent for the remaining six months of the fuel cycle. The nuclear power plant is currently operational. 20. Pickering A Unit 1 Nuclear Power Plant Location: Pickering, Ontario, Canada Reactor Type: Pressurized Heavy-Water Cooled and Moderated Reactor (PHWR) Power: 1,744 MWt; 540 MWe (gross) History: initial criticality 1971; on November 22, 1988, power was raised rapidly to avoid a shutdown due to xenon buildup while operating with an abnormal control rod configuration. This abnormal reactor control rod configuration compensated for reactivity loss incurred due to the unavailability of the on-line refueling equipment. Some damage to 191 fuel rods occurred. The nuclear power plant is currently operational. 21. Hadden Neck (Connecticut Yankee) Nuclear Power Plant Location: Hadden Neck, Connecticut, USA Reactor Type: Pressurized Water Reactor (PWR), 4-loop Power: 1,825 MWt, 590 MWe (gross) History: grid connection August 7, 1967; on October 9, 1989, 480 fuel rods were
damaged during the operating cycle by metal chips present in the coolant system. During the 16-month operating cycle, coolant activity indicated only minor fuel damage was occurring. The thermal shield had been repaired during the preceding outage without maintaining the necessary standards of cleanliness and imposing restrictions on forced circulation of reactor water before cleanup was completed. Some of the debris became lodged in locations in the reactor system that were difficult to inspect and clean. This debris led to the fuel damage through fretting of the cladding. The reactor was permanently shut down December 5, 1996.
22. Greifswald Unit 5 (KGR-5) Nuclear Power Plant Location: Lubmin, GDR (now Germany) Reactor Type: VVER-440, Model V-230, Pressurized Water Reactor (PWR) Power: 1,375 MWt; 440 MWe (gross); 408 MWe (net) History: grid connection 24 April 1989; commercial operation November 1, 1989; on
November 24, 1989,three out of six cooling water pumps were switched off for a test; a fourth pump broke down and control of the reactor was lost; 10 fuel elements were damaged—partial core melting. The accident was reportedly attributed to sticky relay contacts. The reactor was permanently shutdown November 24, 1989.
23. Fukushima Dai-ichi Unit 1 Nuclear Power Plant Location: Ohkuma, Fukushima Prefecture, Japan Reactor Type: Boiling Water Reactor (BWR), GE BWR/2, Mark 1 Containment
32
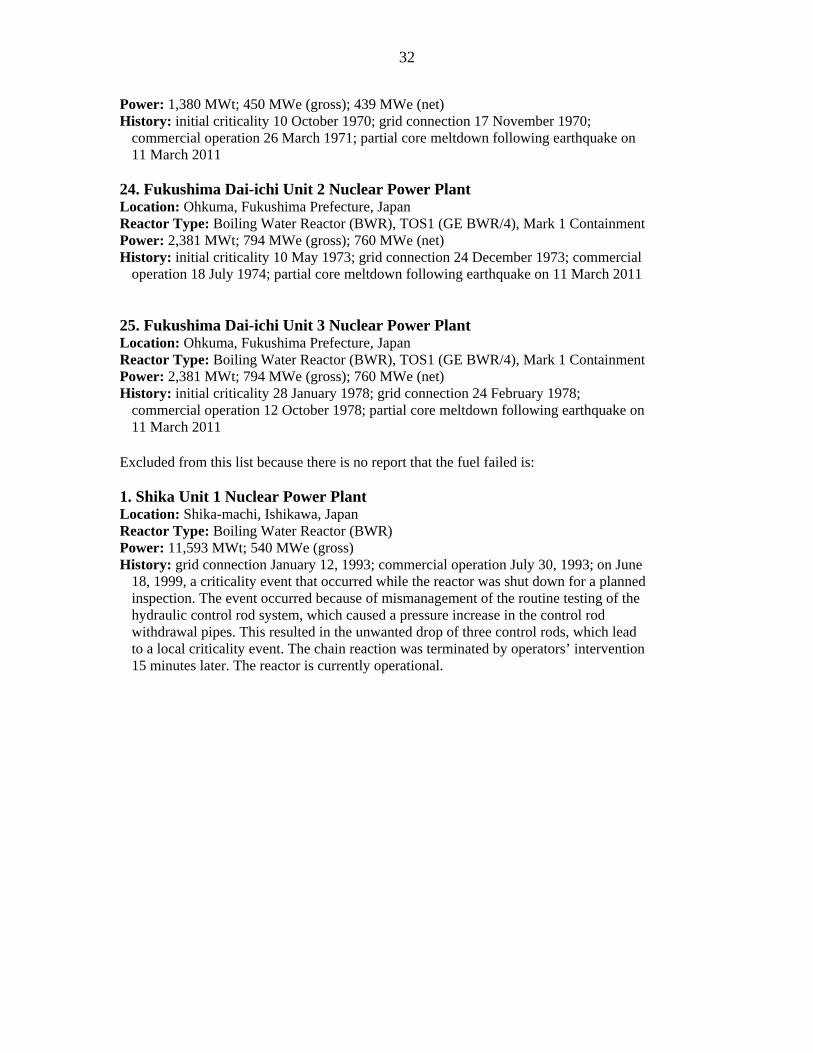
Power: 1,380 MWt; 450 MWe (gross); 439 MWe (net) History: initial criticality 10 October 1970; grid connection 17 November 1970;
commercial operation 26 March 1971; partial core meltdown following earthquake on 11 March 2011
24. Fukushima Dai-ichi Unit 2 Nuclear Power Plant Location: Ohkuma, Fukushima Prefecture, Japan Reactor Type: Boiling Water Reactor (BWR), TOS1 (GE BWR/4), Mark 1 Containment Power: 2,381 MWt; 794 MWe (gross); 760 MWe (net) History: initial criticality 10 May 1973; grid connection 24 December 1973; commercial
operation 18 July 1974; partial core meltdown following earthquake on 11 March 2011 25. Fukushima Dai-ichi Unit 3 Nuclear Power Plant Location: Ohkuma, Fukushima Prefecture, Japan Reactor Type: Boiling Water Reactor (BWR), TOS1 (GE BWR/4), Mark 1 Containment Power: 2,381 MWt; 794 MWe (gross); 760 MWe (net) History: initial criticality 28 January 1978; grid connection 24 February 1978;
commercial operation 12 October 1978; partial core meltdown following earthquake on 11 March 2011
Excluded from this list because there is no report that the fuel failed is: 1. Shika Unit 1 Nuclear Power Plant Location: Shika-machi, Ishikawa, Japan Reactor Type: Boiling Water Reactor (BWR) Power: 11,593 MWt; 540 MWe (gross) History: grid connection January 12, 1993; commercial operation July 30, 1993; on June
18, 1999, a criticality event that occurred while the reactor was shut down for a planned inspection. The event occurred because of mismanagement of the routine testing of the hydraulic control rod system, which caused a pressure increase in the control rod withdrawal pipes. This resulted in the unwanted drop of three control rods, which lead to a local criticality event. The chain reaction was terminated by operators’ intervention 15 minutes later. The reactor is currently operational.
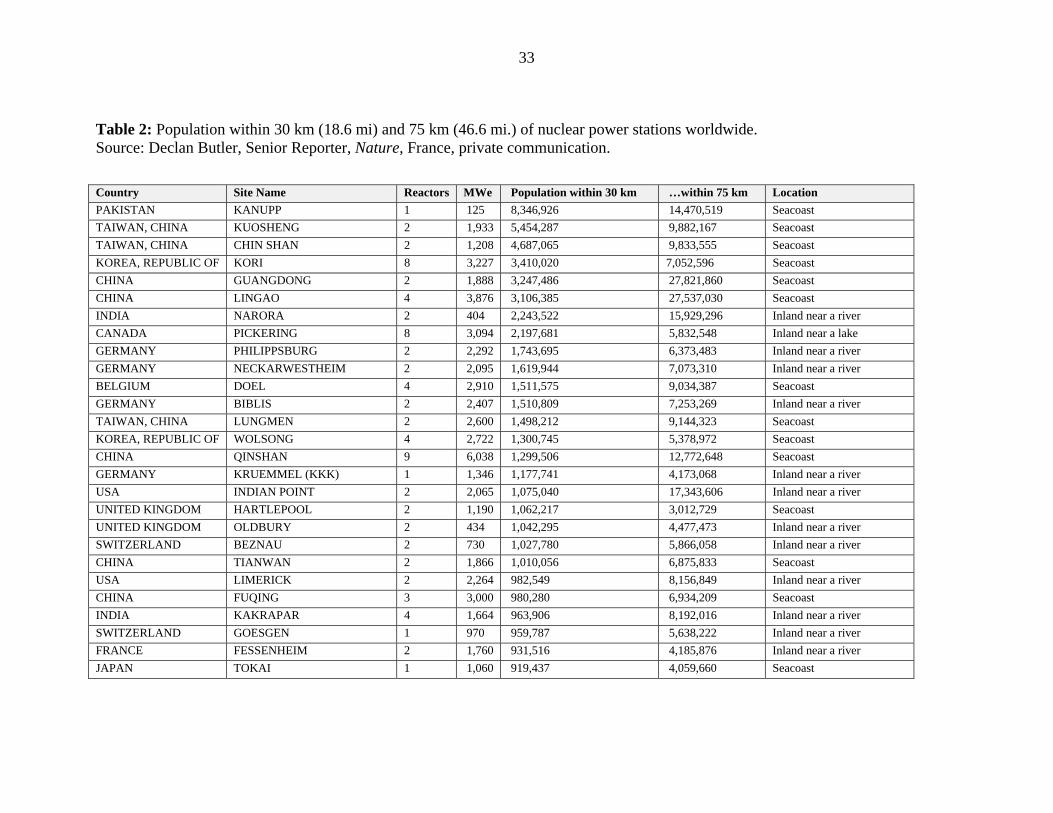
33
Table 2: Population within 30 km (18.6 mi) and 75 km (46.6 mi.) of nuclear power stations worldwide. Source: Declan Butler, Senior Reporter, Nature, France, private communication.
Country Site Name Reactors MWe Population within 30 km …within 75 km Location PAKISTAN KANUPP 1 125 8,346,926 14,470,519 Seacoast TAIWAN, CHINA KUOSHENG 2 1,933 5,454,287 9,882,167 Seacoast TAIWAN, CHINA CHIN SHAN 2 1,208 4,687,065 9,833,555 Seacoast KOREA, REPUBLIC OF KORI 8 3,227 3,410,020 7,052,596 Seacoast CHINA GUANGDONG 2 1,888 3,247,486 27,821,860 Seacoast CHINA LINGAO 4 3,876 3,106,385 27,537,030 Seacoast INDIA NARORA 2 404 2,243,522 15,929,296 Inland near a river CANADA PICKERING 8 3,094 2,197,681 5,832,548 Inland near a lake GERMANY PHILIPPSBURG 2 2,292 1,743,695 6,373,483 Inland near a river GERMANY NECKARWESTHEIM 2 2,095 1,619,944 7,073,310 Inland near a river BELGIUM DOEL 4 2,910 1,511,575 9,034,387 Seacoast GERMANY BIBLIS 2 2,407 1,510,809 7,253,269 Inland near a river TAIWAN, CHINA LUNGMEN 2 2,600 1,498,212 9,144,323 Seacoast KOREA, REPUBLIC OF WOLSONG 4 2,722 1,300,745 5,378,972 Seacoast CHINA QINSHAN 9 6,038 1,299,506 12,772,648 Seacoast GERMANY KRUEMMEL (KKK) 1 1,346 1,177,741 4,173,068 Inland near a river USA INDIAN POINT 2 2,065 1,075,040 17,343,606 Inland near a river UNITED KINGDOM HARTLEPOOL 2 1,190 1,062,217 3,012,729 Seacoast UNITED KINGDOM OLDBURY 2 434 1,042,295 4,477,473 Inland near a river SWITZERLAND BEZNAU 2 730 1,027,780 5,866,058 Inland near a river CHINA TIANWAN 2 1,866 1,010,056 6,875,833 Seacoast USA LIMERICK 2 2,264 982,549 8,156,849 Inland near a river CHINA FUQING 3 3,000 980,280 6,934,209 Seacoast INDIA KAKRAPAR 4 1,664 963,906 8,192,016 Inland near a river SWITZERLAND GOESGEN 1 970 959,787 5,638,222 Inland near a river FRANCE FESSENHEIM 2 1,760 931,516 4,185,876 Inland near a river JAPAN TOKAI 1 1,060 919,437 4,059,660 Seacoast
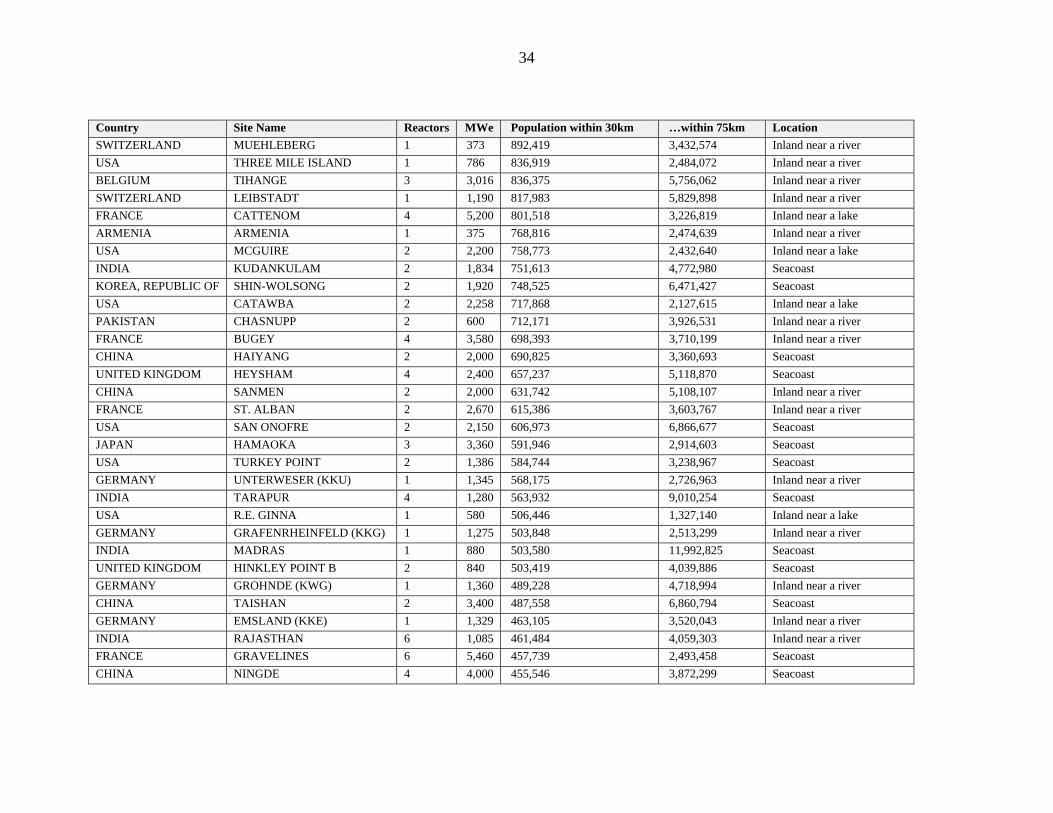
34
Country Site Name Reactors MWe Population within 30km …within 75km Location SWITZERLAND MUEHLEBERG 1 373 892,419 3,432,574 Inland near a river USA THREE MILE ISLAND 1 786 836,919 2,484,072 Inland near a river BELGIUM TIHANGE 3 3,016 836,375 5,756,062 Inland near a river SWITZERLAND LEIBSTADT 1 1,190 817,983 5,829,898 Inland near a river FRANCE CATTENOM 4 5,200 801,518 3,226,819 Inland near a lake ARMENIA ARMENIA 1 375 768,816 2,474,639 Inland near a river USA MCGUIRE 2 2,200 758,773 2,432,640 Inland near a lake INDIA KUDANKULAM 2 1,834 751,613 4,772,980 Seacoast KOREA, REPUBLIC OF SHIN-WOLSONG 2 1,920 748,525 6,471,427 Seacoast USA CATAWBA 2 2,258 717,868 2,127,615 Inland near a lake PAKISTAN CHASNUPP 2 600 712,171 3,926,531 Inland near a river FRANCE BUGEY 4 3,580 698,393 3,710,199 Inland near a river CHINA HAIYANG 2 2,000 690,825 3,360,693 Seacoast UNITED KINGDOM HEYSHAM 4 2,400 657,237 5,118,870 Seacoast CHINA SANMEN 2 2,000 631,742 5,108,107 Inland near a river FRANCE ST. ALBAN 2 2,670 615,386 3,603,767 Inland near a river USA SAN ONOFRE 2 2,150 606,973 6,866,677 Seacoast JAPAN HAMAOKA 3 3,360 591,946 2,914,603 Seacoast USA TURKEY POINT 2 1,386 584,744 3,238,967 Seacoast GERMANY UNTERWESER (KKU) 1 1,345 568,175 2,726,963 Inland near a river INDIA TARAPUR 4 1,280 563,932 9,010,254 Seacoast USA R.E. GINNA 1 580 506,446 1,327,140 Inland near a lake GERMANY GRAFENRHEINFELD (KKG) 1 1,275 503,848 2,513,299 Inland near a river INDIA MADRAS 1 880 503,580 11,992,825 Seacoast UNITED KINGDOM HINKLEY POINT B 2 840 503,419 4,039,886 Seacoast GERMANY GROHNDE (KWG) 1 1,360 489,228 4,718,994 Inland near a river CHINA TAISHAN 2 3,400 487,558 6,860,794 Seacoast GERMANY EMSLAND (KKE) 1 1,329 463,105 3,520,043 Inland near a river INDIA RAJASTHAN 6 1,085 461,484 4,059,303 Inland near a river FRANCE GRAVELINES 6 5,460 457,739 2,493,458 Seacoast CHINA NINGDE 4 4,000 455,546 3,872,299 Seacoast
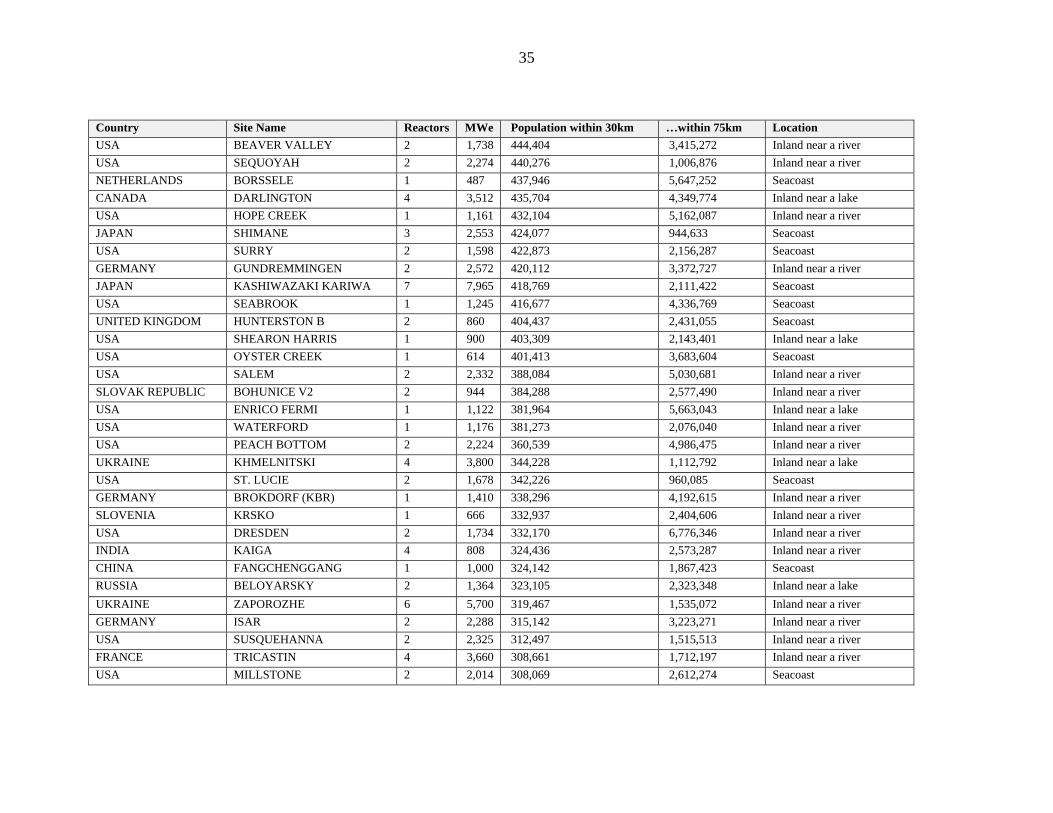
35
Country Site Name Reactors MWe Population within 30km …within 75km Location USA BEAVER VALLEY 2 1,738 444,404 3,415,272 Inland near a river USA SEQUOYAH 2 2,274 440,276 1,006,876 Inland near a river NETHERLANDS BORSSELE 1 487 437,946 5,647,252 Seacoast CANADA DARLINGTON 4 3,512 435,704 4,349,774 Inland near a lake USA HOPE CREEK 1 1,161 432,104 5,162,087 Inland near a river JAPAN SHIMANE 3 2,553 424,077 944,633 Seacoast USA SURRY 2 1,598 422,873 2,156,287 Seacoast GERMANY GUNDREMMINGEN 2 2,572 420,112 3,372,727 Inland near a river JAPAN KASHIWAZAKI KARIWA 7 7,965 418,769 2,111,422 Seacoast USA SEABROOK 1 1,245 416,677 4,336,769 Seacoast UNITED KINGDOM HUNTERSTON B 2 860 404,437 2,431,055 Seacoast USA SHEARON HARRIS 1 900 403,309 2,143,401 Inland near a lake USA OYSTER CREEK 1 614 401,413 3,683,604 Seacoast USA SALEM 2 2,332 388,084 5,030,681 Inland near a river SLOVAK REPUBLIC BOHUNICE V2 2 944 384,288 2,577,490 Inland near a river USA ENRICO FERMI 1 1,122 381,964 5,663,043 Inland near a lake USA WATERFORD 1 1,176 381,273 2,076,040 Inland near a river USA PEACH BOTTOM 2 2,224 360,539 4,986,475 Inland near a river UKRAINE KHMELNITSKI 4 3,800 344,228 1,112,792 Inland near a lake USA ST. LUCIE 2 1,678 342,226 960,085 Seacoast GERMANY BROKDORF (KBR) 1 1,410 338,296 4,192,615 Inland near a river SLOVENIA KRSKO 1 666 332,937 2,404,606 Inland near a river USA DRESDEN 2 1,734 332,170 6,776,346 Inland near a river INDIA KAIGA 4 808 324,436 2,573,287 Inland near a river CHINA FANGCHENGGANG 1 1,000 324,142 1,867,423 Seacoast RUSSIA BELOYARSKY 2 1,364 323,105 2,323,348 Inland near a lake UKRAINE ZAPOROZHE 6 5,700 319,467 1,535,072 Inland near a river GERMANY ISAR 2 2,288 315,142 3,223,271 Inland near a river USA SUSQUEHANNA 2 2,325 312,497 1,515,513 Inland near a river FRANCE TRICASTIN 4 3,660 308,661 1,712,197 Inland near a river USA MILLSTONE 2 2,014 308,069 2,612,274 Seacoast
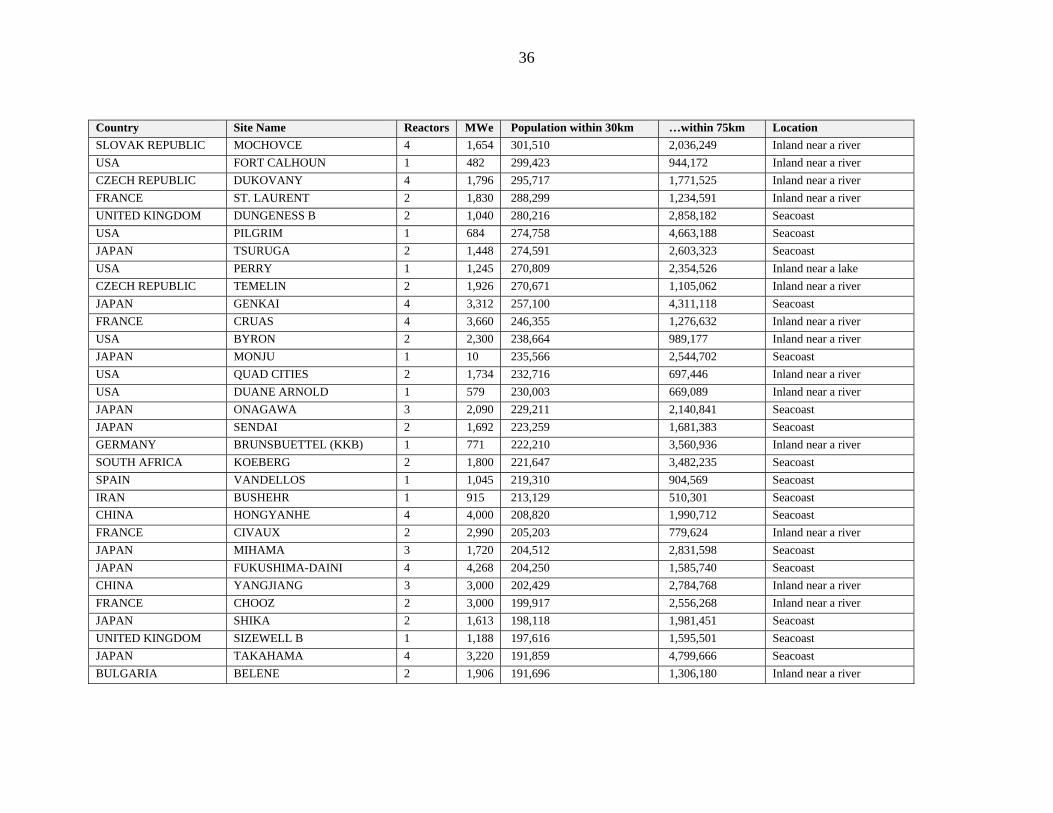
36
Country Site Name Reactors MWe Population within 30km …within 75km Location SLOVAK REPUBLIC MOCHOVCE 4 1,654 301,510 2,036,249 Inland near a river USA FORT CALHOUN 1 482 299,423 944,172 Inland near a river CZECH REPUBLIC DUKOVANY 4 1,796 295,717 1,771,525 Inland near a river FRANCE ST. LAURENT 2 1,830 288,299 1,234,591 Inland near a river UNITED KINGDOM DUNGENESS B 2 1,040 280,216 2,858,182 Seacoast USA PILGRIM 1 684 274,758 4,663,188 Seacoast JAPAN TSURUGA 2 1,448 274,591 2,603,323 Seacoast USA PERRY 1 1,245 270,809 2,354,526 Inland near a lake CZECH REPUBLIC TEMELIN 2 1,926 270,671 1,105,062 Inland near a river JAPAN GENKAI 4 3,312 257,100 4,311,118 Seacoast FRANCE CRUAS 4 3,660 246,355 1,276,632 Inland near a river USA BYRON 2 2,300 238,664 989,177 Inland near a river JAPAN MONJU 1 10 235,566 2,544,702 Seacoast USA QUAD CITIES 2 1,734 232,716 697,446 Inland near a river USA DUANE ARNOLD 1 579 230,003 669,089 Inland near a river JAPAN ONAGAWA 3 2,090 229,211 2,140,841 Seacoast JAPAN SENDAI 2 1,692 223,259 1,681,383 Seacoast GERMANY BRUNSBUETTEL (KKB) 1 771 222,210 3,560,936 Inland near a river SOUTH AFRICA KOEBERG 2 1,800 221,647 3,482,235 Seacoast SPAIN VANDELLOS 1 1,045 219,310 904,569 Seacoast IRAN BUSHEHR 1 915 213,129 510,301 Seacoast CHINA HONGYANHE 4 4,000 208,820 1,990,712 Seacoast FRANCE CIVAUX 2 2,990 205,203 779,624 Inland near a river JAPAN MIHAMA 3 1,720 204,512 2,831,598 Seacoast JAPAN FUKUSHIMA-DAINI 4 4,268 204,250 1,585,740 Seacoast CHINA YANGJIANG 3 3,000 202,429 2,784,768 Inland near a river FRANCE CHOOZ 2 3,000 199,917 2,556,268 Inland near a river JAPAN SHIKA 2 1,613 198,118 1,981,451 Seacoast UNITED KINGDOM SIZEWELL B 1 1,188 197,616 1,595,501 Seacoast JAPAN TAKAHAMA 4 3,220 191,859 4,799,666 Seacoast BULGARIA BELENE 2 1,906 191,696 1,306,180 Inland near a river
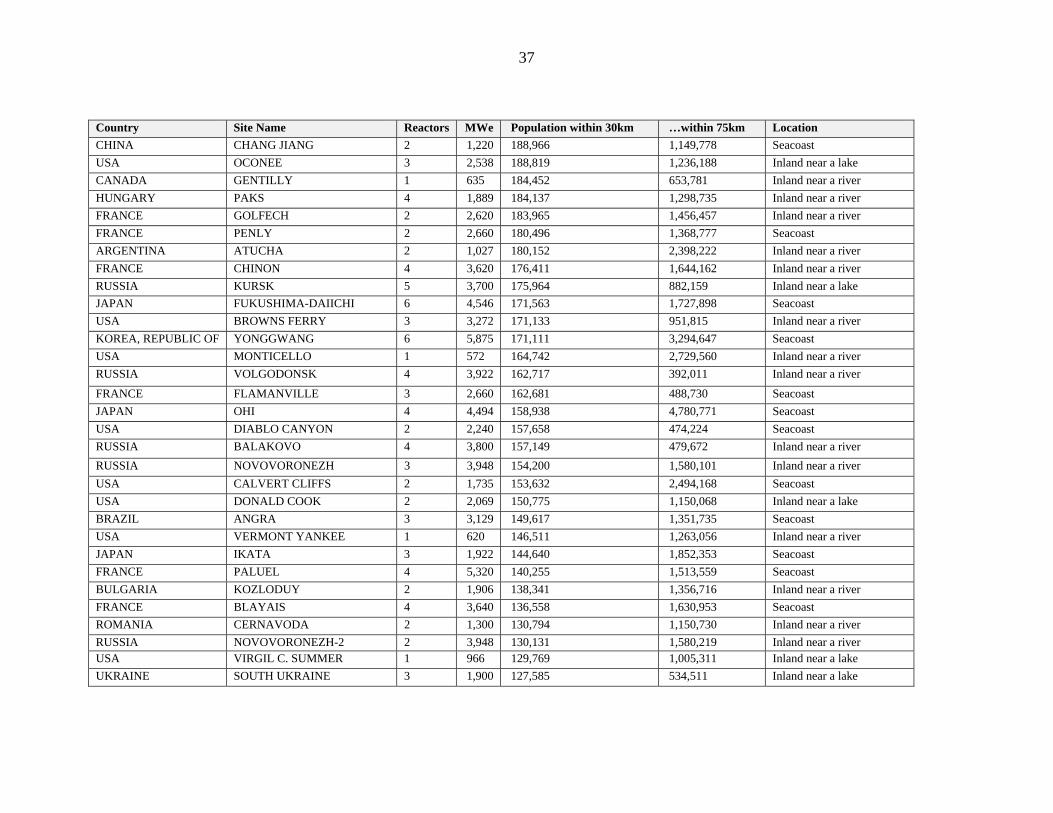
37
Country Site Name Reactors MWe Population within 30km …within 75km Location CHINA CHANG JIANG 2 1,220 188,966 1,149,778 Seacoast USA OCONEE 3 2,538 188,819 1,236,188 Inland near a lake CANADA GENTILLY 1 635 184,452 653,781 Inland near a river HUNGARY PAKS 4 1,889 184,137 1,298,735 Inland near a river FRANCE GOLFECH 2 2,620 183,965 1,456,457 Inland near a river FRANCE PENLY 2 2,660 180,496 1,368,777 Seacoast ARGENTINA ATUCHA 2 1,027 180,152 2,398,222 Inland near a river FRANCE CHINON 4 3,620 176,411 1,644,162 Inland near a river RUSSIA KURSK 5 3,700 175,964 882,159 Inland near a lake JAPAN FUKUSHIMA-DAIICHI 6 4,546 171,563 1,727,898 Seacoast USA BROWNS FERRY 3 3,272 171,133 951,815 Inland near a river KOREA, REPUBLIC OF YONGGWANG 6 5,875 171,111 3,294,647 Seacoast USA MONTICELLO 1 572 164,742 2,729,560 Inland near a river RUSSIA VOLGODONSK 4 3,922 162,717 392,011 Inland near a river
FRANCE FLAMANVILLE 3 2,660 162,681 488,730 Seacoast JAPAN OHI 4 4,494 158,938 4,780,771 Seacoast USA DIABLO CANYON 2 2,240 157,658 474,224 Seacoast RUSSIA BALAKOVO 4 3,800 157,149 479,672 Inland near a river RUSSIA NOVOVORONEZH 3 3,948 154,200 1,580,101 Inland near a river USA CALVERT CLIFFS 2 1,735 153,632 2,494,168 Seacoast USA DONALD COOK 2 2,069 150,775 1,150,068 Inland near a lake BRAZIL ANGRA 3 3,129 149,617 1,351,735 Seacoast USA VERMONT YANKEE 1 620 146,511 1,263,056 Inland near a river JAPAN IKATA 3 1,922 144,640 1,852,353 Seacoast FRANCE PALUEL 4 5,320 140,255 1,513,559 Seacoast BULGARIA KOZLODUY 2 1,906 138,341 1,356,716 Inland near a river FRANCE BLAYAIS 4 3,640 136,558 1,630,953 Seacoast ROMANIA CERNAVODA 2 1,300 130,794 1,150,730 Inland near a river RUSSIA NOVOVORONEZH-2 2 3,948 130,131 1,580,219 Inland near a river USA VIRGIL C. SUMMER 1 966 129,769 1,005,311 Inland near a lake UKRAINE SOUTH UKRAINE 3 1,900 127,585 534,511 Inland near a lake
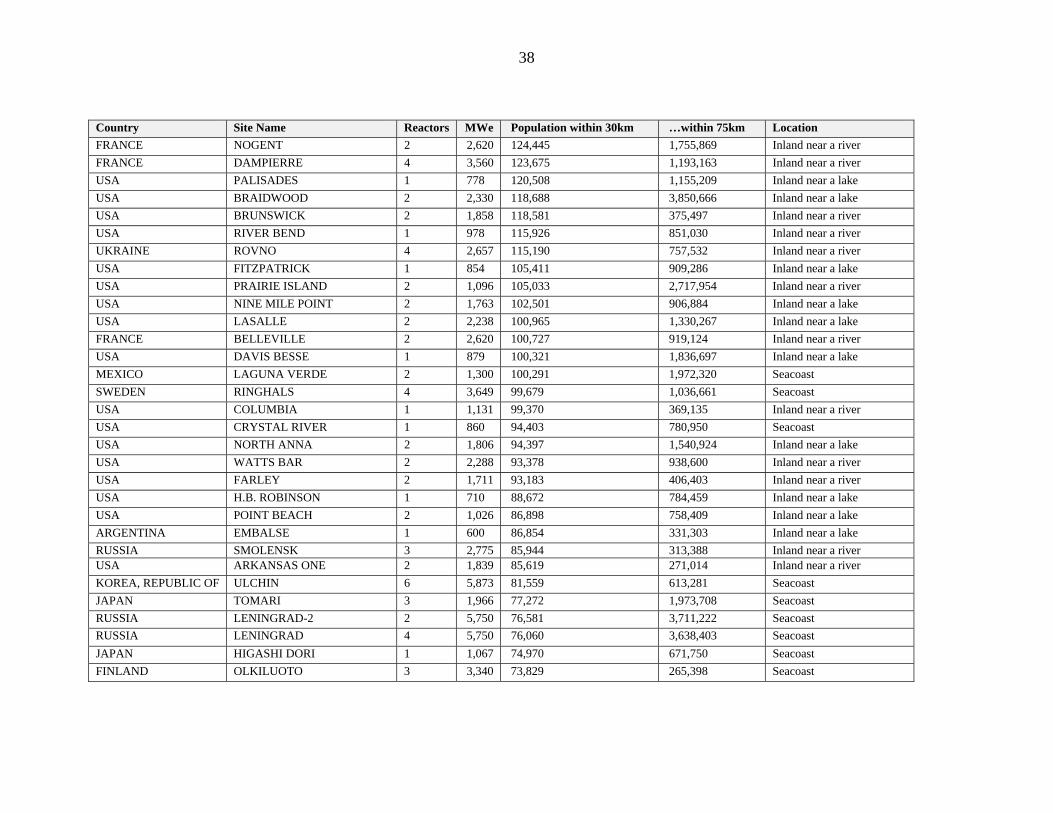
38
Country Site Name Reactors MWe Population within 30km …within 75km Location FRANCE NOGENT 2 2,620 124,445 1,755,869 Inland near a river FRANCE DAMPIERRE 4 3,560 123,675 1,193,163 Inland near a river USA PALISADES 1 778 120,508 1,155,209 Inland near a lake USA BRAIDWOOD 2 2,330 118,688 3,850,666 Inland near a lake USA BRUNSWICK 2 1,858 118,581 375,497 Inland near a river USA RIVER BEND 1 978 115,926 851,030 Inland near a river UKRAINE ROVNO 4 2,657 115,190 757,532 Inland near a river USA FITZPATRICK 1 854 105,411 909,286 Inland near a lake USA PRAIRIE ISLAND 2 1,096 105,033 2,717,954 Inland near a river USA NINE MILE POINT 2 1,763 102,501 906,884 Inland near a lake USA LASALLE 2 2,238 100,965 1,330,267 Inland near a lake FRANCE BELLEVILLE 2 2,620 100,727 919,124 Inland near a river USA DAVIS BESSE 1 879 100,321 1,836,697 Inland near a lake MEXICO LAGUNA VERDE 2 1,300 100,291 1,972,320 Seacoast SWEDEN RINGHALS 4 3,649 99,679 1,036,661 Seacoast USA COLUMBIA 1 1,131 99,370 369,135 Inland near a river USA CRYSTAL RIVER 1 860 94,403 780,950 Seacoast USA NORTH ANNA 2 1,806 94,397 1,540,924 Inland near a lake USA WATTS BAR 2 2,288 93,378 938,600 Inland near a river USA FARLEY 2 1,711 93,183 406,403 Inland near a river USA H.B. ROBINSON 1 710 88,672 784,459 Inland near a lake USA POINT BEACH 2 1,026 86,898 758,409 Inland near a lake ARGENTINA EMBALSE 1 600 86,854 331,303 Inland near a lake RUSSIA SMOLENSK 3 2,775 85,944 313,388 Inland near a river USA ARKANSAS ONE 2 1,839 85,619 271,014 Inland near a river KOREA, REPUBLIC OF ULCHIN 6 5,873 81,559 613,281 Seacoast JAPAN TOMARI 3 1,966 77,272 1,973,708 Seacoast RUSSIA LENINGRAD-2 2 5,750 76,581 3,711,222 Seacoast RUSSIA LENINGRAD 4 5,750 76,060 3,638,403 Seacoast JAPAN HIGASHI DORI 1 1,067 74,970 671,750 Seacoast FINLAND OLKILUOTO 3 3,340 73,829 265,398 Seacoast
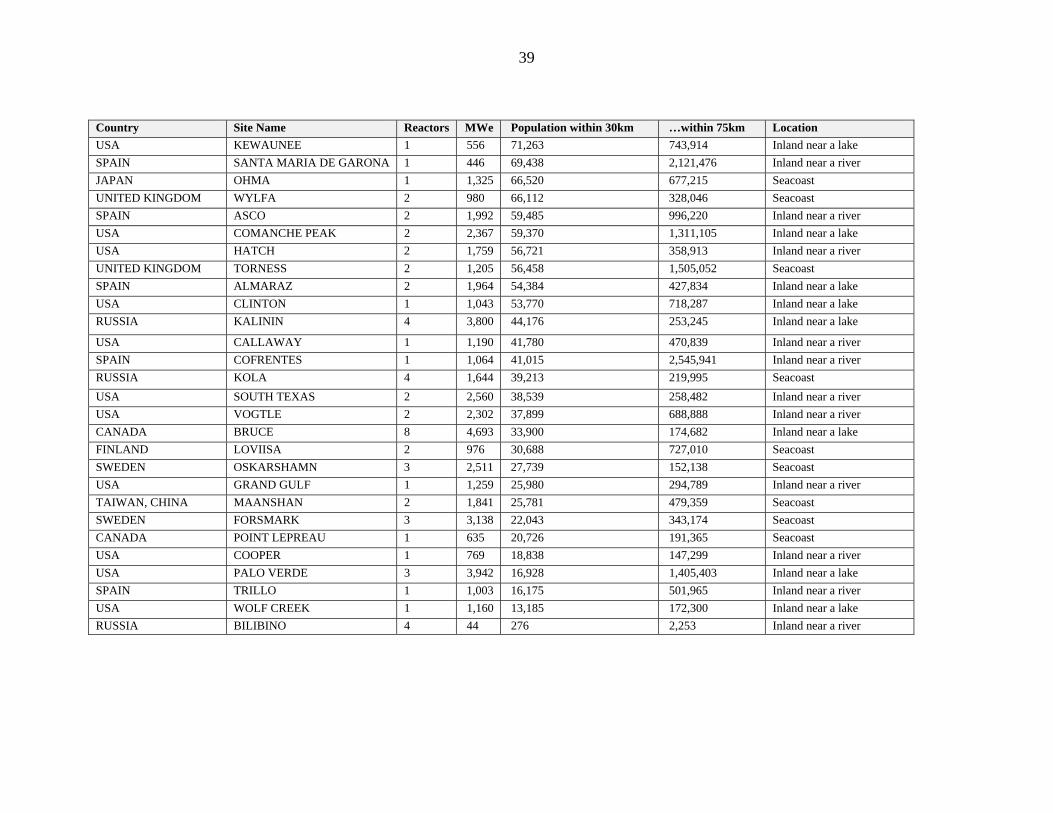
39
Country Site Name Reactors MWe Population within 30km …within 75km Location USA KEWAUNEE 1 556 71,263 743,914 Inland near a lake SPAIN SANTA MARIA DE GARONA 1 446 69,438 2,121,476 Inland near a river JAPAN OHMA 1 1,325 66,520 677,215 Seacoast UNITED KINGDOM WYLFA 2 980 66,112 328,046 Seacoast SPAIN ASCO 2 1,992 59,485 996,220 Inland near a river USA COMANCHE PEAK 2 2,367 59,370 1,311,105 Inland near a lake USA HATCH 2 1,759 56,721 358,913 Inland near a river UNITED KINGDOM TORNESS 2 1,205 56,458 1,505,052 Seacoast SPAIN ALMARAZ 2 1,964 54,384 427,834 Inland near a lake USA CLINTON 1 1,043 53,770 718,287 Inland near a lake RUSSIA KALININ 4 3,800 44,176 253,245 Inland near a lake
USA CALLAWAY 1 1,190 41,780 470,839 Inland near a river SPAIN COFRENTES 1 1,064 41,015 2,545,941 Inland near a river RUSSIA KOLA 4 1,644 39,213 219,995 Seacoast USA SOUTH TEXAS 2 2,560 38,539 258,482 Inland near a river USA VOGTLE 2 2,302 37,899 688,888 Inland near a river CANADA BRUCE 8 4,693 33,900 174,682 Inland near a lake FINLAND LOVIISA 2 976 30,688 727,010 Seacoast SWEDEN OSKARSHAMN 3 2,511 27,739 152,138 Seacoast USA GRAND GULF 1 1,259 25,980 294,789 Inland near a river TAIWAN, CHINA MAANSHAN 2 1,841 25,781 479,359 Seacoast SWEDEN FORSMARK 3 3,138 22,043 343,174 Seacoast CANADA POINT LEPREAU 1 635 20,726 191,365 Seacoast USA COOPER 1 769 18,838 147,299 Inland near a river USA PALO VERDE 3 3,942 16,928 1,405,403 Inland near a lake SPAIN TRILLO 1 1,003 16,175 501,965 Inland near a river USA WOLF CREEK 1 1,160 13,185 172,300 Inland near a lake RUSSIA BILIBINO 4 44 276 2,253 Inland near a river
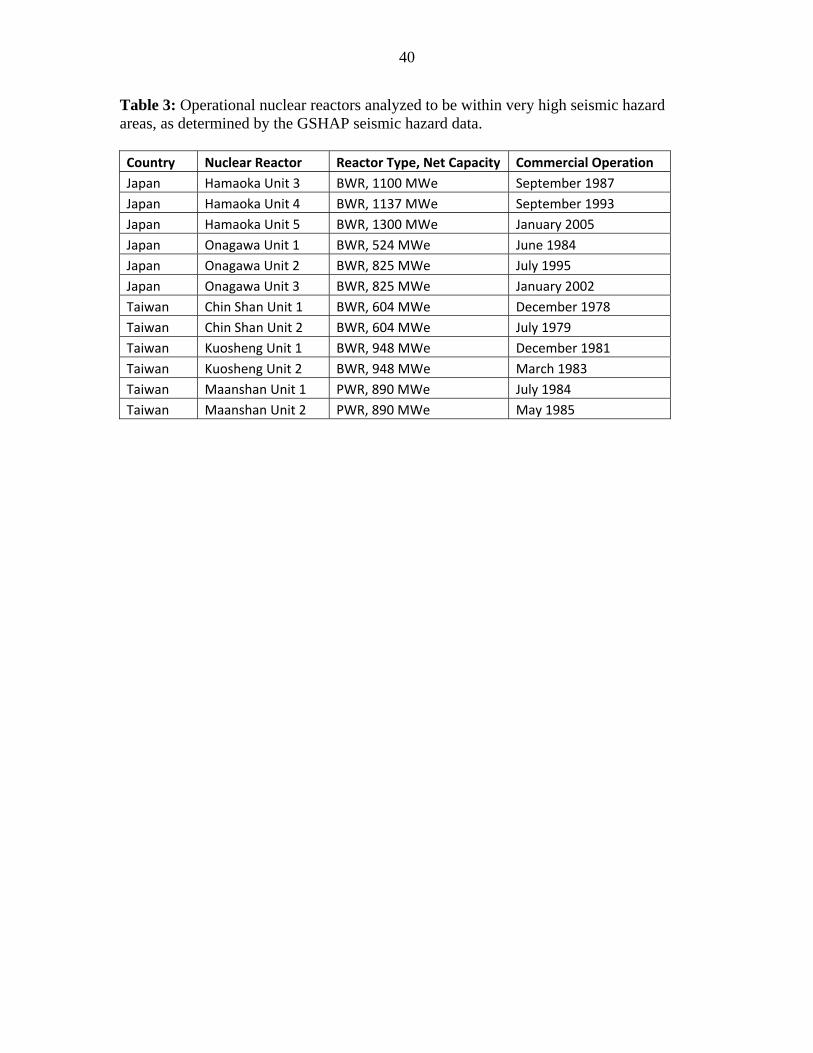
40
Table 3: Operational nuclear reactors analyzed to be within very high seismic hazard areas, as determined by the GSHAP seismic hazard data. Country Nuclear Reactor Reactor Type, Net Capacity Commercial Operation Japan Hamaoka Unit 3 BWR, 1100 MWe September 1987 Japan Hamaoka Unit 4 BWR, 1137 MWe September 1993 Japan Hamaoka Unit 5 BWR, 1300 MWe January 2005 Japan Onagawa Unit 1 BWR, 524 MWe June 1984 Japan Onagawa Unit 2 BWR, 825 MWe July 1995 Japan Onagawa Unit 3 BWR, 825 MWe January 2002 Taiwan Chin Shan Unit 1 BWR, 604 MWe December 1978 Taiwan Chin Shan Unit 2 BWR, 604 MWe July 1979 Taiwan Kuosheng Unit 1 BWR, 948 MWe December 1981 Taiwan Kuosheng Unit 2 BWR, 948 MWe March 1983 Taiwan Maanshan Unit 1 PWR, 890 MWe July 1984 Taiwan Maanshan Unit 2 PWR, 890 MWe May 1985