Embed Size (px)
Citation preview
Global synthesis of the temperature sensitivity of leaflitter breakdown in streams and riversJ ENN I FER J . FOLLSTAD SHAH1 , 2 , J OHN S . KOMINOSK I 3 , MARCELO ARD �ON4 ,
WALTER K . DODDS 5 , MARK O . GES SNER 6 , 7 , NATAL I E A . GR I F F I THS 8 ,
CHARLES P . HAWKINS 2 , SHERR I L . JOHNSON9 , ANTO INE LECERF 1 0 , CARR I J . L EROY 1 1 ,
DAV ID W . P . MANNING1 2 , AMY D . ROSEMOND1 3 , ROBERT L . S INSABAUGH1 4 ,
CHR I STOPHER M . SWAN1 5 , JACKSON R . WEBSTER 1 6 and LYDIA H. ZEGLIN5
1Environmental and Sustainability Studies/Department of Geography, University of Utah, Salt Lake City, UT 84112, USA,2Department of Watershed Sciences, Utah State University, Logan, UT 84322, USA, 3Department of Biological Sciences, Florida
International University, Miami, FL 33199, USA, 4Department of Forestry and Environmental Resources, North Carolina State
University, Raleigh, NC 27695, USA, 5Division of Biology, Kansas State University, Manhattan, KS 66506, USA, 6Department of
Experimental Limnology, Leibniz-Institute of Freshwater Ecology and Inland Fisheries (IGB), 16775 Stechlin, Germany,7Department of Ecology, Berlin Institute of Technology (TU Berlin), Ernst-Reuter-Platz 1, 10587 Berlin, Germany, 8Climate
Change Science Institute and Environmental Sciences Division, Oak Ridge National Laboratory, Oak Ridge, TN 37831, USA,9Pacific Northwest Research Station, US Forest Service, Corvallis, OR 97331, USA, 10Universit�e de Toulouse, UPS, INP, CNRS,
EcoLab (Laboratoire d’�Ecologie Fonctionnelle et Environnement), 31062 Toulouse, France, 11Environmental Studies Program, The
Evergreen State College, Olympia, WA 98505, USA, 12School of Environment and Natural Resources, Ohio State University,
Columbus, OH 43210, USA, 13Odum School of Ecology, University of Georgia, Athens, GA 30602, USA, 14Department of
Biology, University of New Mexico, Albuquerque, NM 87131, USA, 15Department of Geography and Environmental Systems,
University of Maryland-Baltimore County, Baltimore, MD 21250, USA, 16Department of Biological Sciences, Virginia Polytechnic
Institute and State University, Blacksburg, VA 24061, USA
Abstract
Streams and rivers are important conduits of terrestrially derived carbon (C) to atmospheric and marine reservoirs. Leaf
litter breakdown rates are expected to increase as water temperatures rise in response to climate change. The magnitude
of increase in breakdown rates is uncertain, given differences in litter quality and microbial and detritivore community
responses to temperature, factors that can influence the apparent temperature sensitivity of breakdown and the relative
proportion of C lost to the atmosphere vs. stored or transported downstream. Here, we synthesized 1025 records of litter
breakdown in streams and rivers to quantify its temperature sensitivity, as measured by the activation energy (Ea, in
eV). Temperature sensitivity of litter breakdown varied among twelve plant genera for which Ea could be calculated.
Higher values of Ea were correlated with lower-quality litter, but these correlations were influenced by a single, N-fixing
genus (Alnus). Ea values converged when genera were classified into three breakdown rate categories, potentially due to
continual water availability in streams and rivers modulating the influence of leaf chemistry on breakdown. Across all
data representing 85 plant genera, the Ea was 0.34 � 0.04 eV, or approximately half the value (0.65 eV) predicted by
metabolic theory. Our results indicate that average breakdown rates may increase by 5–21% with a 1–4 °C rise in water
temperature, rather than a 10–45% increase expected, according to metabolic theory. Differential warming of tropical
and temperate biomes could result in a similar proportional increase in breakdown rates, despite variation in Ea values
for these regions (0.75 � 0.13 eV and 0.27 � 0.05 eV, respectively). The relative proportions of gaseous C loss and
organic matter transport downstream should not change with rising temperature given that Ea values for breakdown
mediated by microbes alone and microbes plus detritivores were similar at the global scale.
Keywords: activation energy, breakdown, carbon cycling, climate change, detritivore, leaf chemistry, metabolic theory, microbe,
organic matter, temperature sensitivity
Received 21 October 2016 and accepted 26 November 2016
Introduction
Understanding the temperature sensitivity of
ecosystem processes that govern carbon (C) cycling is
imperative as global temperatures rise (Yvon-Durocher
et al., 2012; Welter et al., 2015; Demars et al., 2016).
Inland freshwaters are an important contributor to the
global C cycle, although they cover only about 3% of
the Earth’s land surface (Battin et al., 2009; Raymond
et al., 2013). Elevated temperature affects the C balanceCorrespondence: Jennifer J. Follstad Shah, tel. +1 801 585 5730,
e-mail: [email protected]
1© 2017 John Wiley & Sons Ltd
Global Change Biology (2017), doi: 10.1111/gcb.13609
of aquatic ecosystems, with the strength of effects
depending on the temperature sensitivity of key meta-
bolic processes (Yvon-Durocher et al., 2010; Demars
et al., 2011) and the responses of biological communi-
ties to warming (Boyero et al., 2011b).
Most freshwater ecosystems are net heterotrophic, so
temperature increases are likely to enhance net C
losses. The breakdown of leaf litter (hereafter ‘litter’)
and other particulate organic matter produces a large
fraction of the particulate, dissolved, and gaseous forms
of C that are exported from streams and rivers (Gessner
et al., 1999) through downstream transport and efflux
to the atmosphere (Dodds & Cole, 2007; Battin et al.,
2009). Litter breakdown is an integrative ecosystem
process that involves multiple organisms, fuels aquatic
food webs, and links biogeochemical cycles (Wallace
et al., 1997; Gessner et al., 1999). The process involves
leaching of dissolved constituents, degradation by
microbes, feeding by detritivores, and physical frag-
mentation, all of which are mediated, in part, by leaf
chemistry and physical structure (Webster & Benfield,
1986; Gessner et al., 1999).
Mean annual water temperature for some streams
and rivers is rising on the order of 0.01–0.1 °C yr�1
from changes in climate and land use (Kaushal et al.,
2010). Rates of litter breakdown are predicted to
increase exponentially with temperature (Boyero et al.,
2011b) because elevated temperature stimulates meta-
bolism by accelerating biochemical reactions (Brown
et al., 2004) and leaf litter is used as a substrate to sup-
port the metabolic processes of microbes and detriti-
vores (Gessner et al., 1999). However, the magnitude of
change in breakdown rates is unclear because drivers
other than the direct temperature effect on metabolism
can influence the temperature sensitivity of the process.
The temperature sensitivity of chemical reactions is
quantified by the activation energy, Ea (Arrhenius,
1915). As the scale increases from single reactions to
ecosystem processes involving multiple organisms, the
activation energy represents an apparent (i.e., empiri-
cal), rather than an inherent, temperature sensitivity.
According to metabolic theory, metabolic rate controls
processes at all levels of ecological organization by set-
ting rates of resource uptake from the environment and
resource allocation to maintenance, growth, and repro-
duction of organisms (Brown et al., 2004). Thus, an Ea
of ~0.65 eV is expected, according to metabolic theory,
if rates of litter breakdown reflect the temperature sen-
sitivity of microbial and detritivore metabolism (Allen
et al., 2005). Conversely, a lower Ea, or reduced temper-
ature sensitivity, is expected if rates of litter breakdown
are limited by the activity of microbial ‘ecoenzymes’
(enzymes expressed by microbes or released to the
environment via cell lysis; Sinsabaugh et al., 2009),
which on average have Ea values of ~0.31–0.56 eV (Sins-
abaugh & Follstad Shah, 2012; Wang et al., 2012). Lower
Ea values also may arise if other factors interact with
temperature in ways that augment rates at low temper-
ature relative to rates expected based on temperature
alone (Boyero et al., 2011b).
Examples of extrinsic and intrinsic factors that can
influence the apparent temperature sensitivity of litter
breakdown include variation in detritivore density
(Boyero et al., 2011b; Griffiths & Tiegs, 2016), thermal
adaptation of organisms (Bradford, 2013; Strickland
et al., 2015), and litter quality (Cornwell et al., 2008;
Makkonen et al., 2012). Empirical data from 22 sites
located between 0° and 48° north and south suggest that
the relative contribution of detritivores to litter break-
down increases with latitude, which may have the effect
of diminishing or negating the apparent temperature
sensitivity of litter breakdown (Boyero et al., 2011b).
Many relatively large-bodied detritivores that consume
leaf litter (e.g., various taxa of the orders Plecoptera and
Trichoptera) evolved in cool waters 200 million years
ago and are still restricted to cool habitats (Ward & Stan-
ford, 1982). Hence, densities of litter-consuming detriti-
vores are generally greater at higher latitudes relative to
the tropics (Boyero et al., 2011a). Greater densities could
persist at higher latitudes relative to the tropics as water
temperatures rise, but dominance within macroinverte-
brate communities may shift to smaller-bodied taxa (Fri-
berg et al., 2009). Elevated temperature also can alter the
catabolic processes by which litter is processed through
changes in microbial community composition, produc-
tion of ecoenzymes, and microbial metabolism (Dang
et al., 2009; Ferreira & Chauvet, 2011b; Bradford, 2013).
Litter chemistry is an important control on breakdown
rate in streams and rivers (Boyero et al., 2016; Garc�ıa-
Palacios et al., 2016). Labile litter (i.e., litter low in com-
plex C compounds and high in nutrient concentrations)
loses mass more rapidly than recalcitrant litter (Gessner
& Chauvet, 1994; Ard�on et al., 2009; Mart�ınez et al.,
2013). However, studies in terrestrial ecosystems have
shown that the breakdown of low-quality, recalcitrant
litter is more sensitive to temperature compared with
high-quality, labile litter (Hobbie, 1996; Fierer et al.,
2005). Thus, it is critical to understand the consequences
of climate change on litter breakdown not only through
temperature but also through the influences of other
key drivers that interact with temperature.
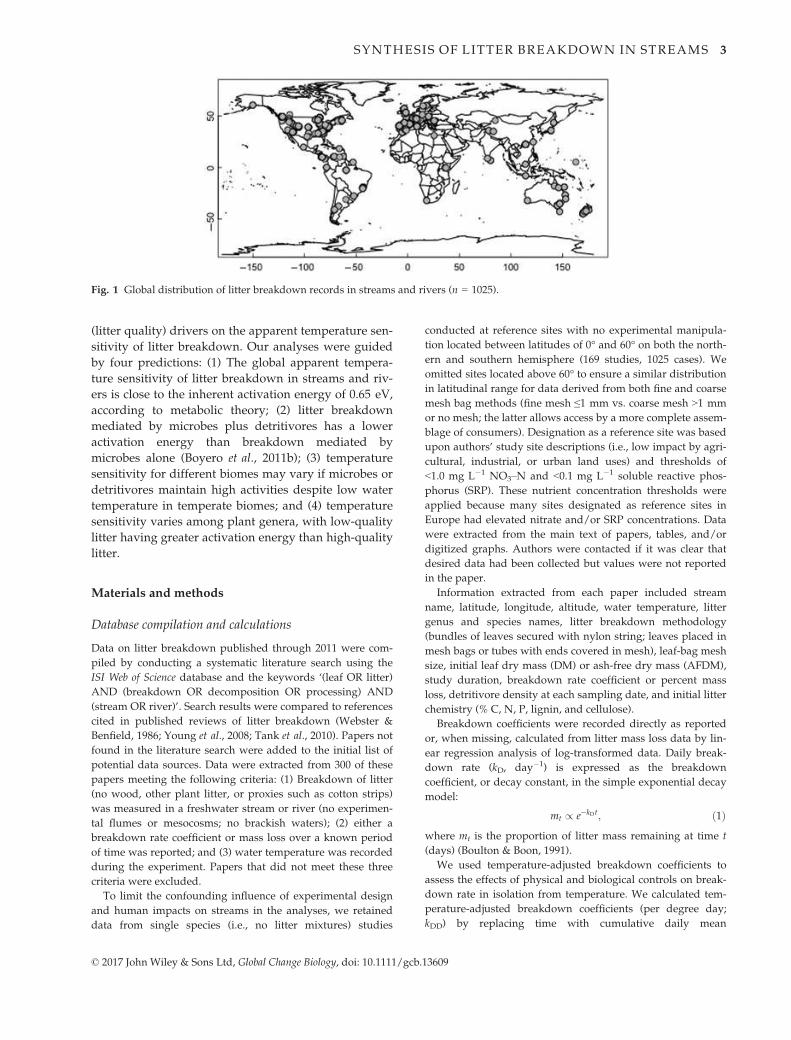
Here, we used data from 169 published studies (Sup-
plemental Information) corresponding to 1025 individ-
ual cases (Fig. 1; Appendix S1) across 85 plant genera
at globally distributed reference sites to quantify the
apparent temperature sensitivity of litter breakdown in
streams and rivers. We also examined the effects of
extrinsic (detritivore density, location) and intrinsic
© 2017 John Wiley & Sons Ltd, Global Change Biology, doi: 10.1111/gcb.13609
2 J . J . FOLLSTAD SHAH et al.
(litter quality) drivers on the apparent temperature sen-
sitivity of litter breakdown. Our analyses were guided
by four predictions: (1) The global apparent tempera-
ture sensitivity of litter breakdown in streams and riv-
ers is close to the inherent activation energy of 0.65 eV,
according to metabolic theory; (2) litter breakdown
mediated by microbes plus detritivores has a lower
activation energy than breakdown mediated by
microbes alone (Boyero et al., 2011b); (3) temperature
sensitivity for different biomes may vary if microbes or
detritivores maintain high activities despite low water
temperature in temperate biomes; and (4) temperature
sensitivity varies among plant genera, with low-quality
litter having greater activation energy than high-quality
litter.
Materials and methods
Database compilation and calculations
Data on litter breakdown published through 2011 were com-
piled by conducting a systematic literature search using the
ISI Web of Science database and the keywords ‘(leaf OR litter)
AND (breakdown OR decomposition OR processing) AND
(stream OR river)’. Search results were compared to references
cited in published reviews of litter breakdown (Webster &
Benfield, 1986; Young et al., 2008; Tank et al., 2010). Papers not
found in the literature search were added to the initial list of
potential data sources. Data were extracted from 300 of these
papers meeting the following criteria: (1) Breakdown of litter
(no wood, other plant litter, or proxies such as cotton strips)
was measured in a freshwater stream or river (no experimen-
tal flumes or mesocosms; no brackish waters); (2) either a
breakdown rate coefficient or mass loss over a known period
of time was reported; and (3) water temperature was recorded
during the experiment. Papers that did not meet these three
criteria were excluded.
To limit the confounding influence of experimental design
and human impacts on streams in the analyses, we retained
data from single species (i.e., no litter mixtures) studies
conducted at reference sites with no experimental manipula-
tion located between latitudes of 0° and 60° on both the north-
ern and southern hemisphere (169 studies, 1025 cases). We
omitted sites located above 60° to ensure a similar distribution
in latitudinal range for data derived from both fine and coarse
mesh bag methods (fine mesh ≤1 mm vs. coarse mesh >1 mm
or no mesh; the latter allows access by a more complete assem-
blage of consumers). Designation as a reference site was based
upon authors’ study site descriptions (i.e., low impact by agri-
cultural, industrial, or urban land uses) and thresholds of
<1.0 mg L�1 NO3–N and <0.1 mg L�1 soluble reactive phos-
phorus (SRP). These nutrient concentration thresholds were
applied because many sites designated as reference sites in
Europe had elevated nitrate and/or SRP concentrations. Data
were extracted from the main text of papers, tables, and/or
digitized graphs. Authors were contacted if it was clear that
desired data had been collected but values were not reported
in the paper.
Information extracted from each paper included stream
name, latitude, longitude, altitude, water temperature, litter
genus and species names, litter breakdown methodology
(bundles of leaves secured with nylon string; leaves placed in
mesh bags or tubes with ends covered in mesh), leaf-bag mesh
size, initial leaf dry mass (DM) or ash-free dry mass (AFDM),
study duration, breakdown rate coefficient or percent mass
loss, detritivore density at each sampling date, and initial litter
chemistry (% C, N, P, lignin, and cellulose).
Breakdown coefficients were recorded directly as reported
or, when missing, calculated from litter mass loss data by lin-
ear regression analysis of log-transformed data. Daily break-
down rate (kD, day�1) is expressed as the breakdown
coefficient, or decay constant, in the simple exponential decay
model:
mt / e�kDt; ð1Þwhere mt is the proportion of litter mass remaining at time t
(days) (Boulton & Boon, 1991).
We used temperature-adjusted breakdown coefficients to
assess the effects of physical and biological controls on break-
down rate in isolation from temperature. We calculated tem-
perature-adjusted breakdown coefficients (per degree day;
kDD) by replacing time with cumulative daily mean
Fig. 1 Global distribution of litter breakdown records in streams and rivers (n = 1025).
© 2017 John Wiley & Sons Ltd, Global Change Biology, doi: 10.1111/gcb.13609
SYNTHESIS OF LITTER BREAKDOWN IN STREAMS 3
temperature in Eqn 1 (Woodward et al., 2012). We approxi-
mated kDD by dividing the breakdown coefficient by the mean
water temperature during the study when thermal sum was
not reported.
Reference to kD and kDD denotes breakdown coefficients per
day and per degree day, respectively, across litter confinement
methods (i.e., fine mesh bag vs. coarse mesh bag or nylon
string; nylon string is henceforth grouped with coarse mesh).
Differences in leaf-bag mesh size were used to distinguish
between breakdown caused by microbes alone (fine mesh)
versus by microbes and detritivores together (coarse mesh).
Coefficients with the subscript ‘f’ indicate breakdown in fine
mesh bags and with the subscript ‘c’ indicate breakdown in
coarse mesh bags.
Information on site characteristics also was included in the
database. Mean water temperature was estimated as the mean
of reported minimum and maximum values when continuous
records or mean values were unavailable. Latitude and longi-
tude of study sites were obtained from Google Earth when
coordinates were omitted from data sources. Altitude was
estimated from GPS Visualizer (http://www.gpsvisualizer.c
om/elevation) if missing from data sources and verified using
Google Earth.
Detritivore data collected at or near the time at which litter
mass was 50% of the initial mass (T50 in days; calculated as ln
0.5/kD) were selected to ensure meaningful comparisons of
the influence of detritivores across studies varying widely in
duration and sampling frequency. Because few studies
reported detritivore density precisely at T50, the criterion for
selection was relaxed according to the following rules: (1) The
sampling day was within �20% of T50; (2) data from the sam-
pling day preceding T50 were used where two sampling days
were about equidistant from T50; and (3) data from the first
sampling day were used where T50 was very short or from the
last sampling day when T50 was very long.
Data analysis
Apparent temperature sensitivity of litter breakdown. The
Arrhenius equation describes the temperature sensitivity of
reaction rates, r (Arrhenius, 1915):
ln r ¼ ln r0 � Ea � ð1=kBT � 1=kBT0Þ; ð2Þwhere r0 is a normalization constant, Ea is the apparent activa-
tion energy (eV; 1 eV = 1.6 9 10�19 joule or 96 kJ mol�1), kB is
the Boltzmann constant (8.62 9 10�5 eV K�1), T is tempera-
ture in Kelvin (K), and T0 is a standard water temperature.
This normalization centers the temperature data on the stan-
dard temperature (Allen et al., 2005; Yvon-Durocher et al.,
2012), such that values of 0 on the x-axis represent rates at the
standard temperature. We used a standard temperature of
10 °C (283.15 K) because it was close to the median water tem-
perature (10.5 °C) in our database. In this case, r represents the
breakdown coefficient (kDf or kDc). Equation 2 shows that the
value of Ea may be obtained from the slope of the relationship
between inverse absolute temperature (i.e., 1/kBT – 1/kBT0)
and ln r. The higher the value of Ea, the more sensitive a
process is to temperature.
We assessed the temperature sensitivity of litter breakdown
using linear mixed-effect (LME) models. Mixed-effects models
are appropriate statistical tools for carrying out syntheses of
data collected from multiple locations across broad spatial
scales using nonuniform methods (Zuur et al., 2009). The
inclusion of both fixed and random factors in LME models
allows for the assessment of independent variables while
accounting for hierarchical structure or related groupings
(Zuur et al., 2009). Generalized least squares (GLS) models
were used in the absence of groupings.
To test whether litter breakdown has an activation energy
(Ea) close to 0.65 eV (prediction 1), we built a set of LME mod-
els with litter breakdown rate, kD (day�1), as the response vari-
able, inverse normalized temperature, 1/kBT – 1/kBT0 (eV), as
a covariate, and mesh size category (fine vs. coarse) as a ran-
dom (intercept) factor. This random intercept model assumes
that detritivore exclusion influences breakdown rate but not
its temperature sensitivity. We fit another model with a ran-
dom intercept (mesh size category) and slope (inverse normal-
ized temperature) to test the validity of this assumption
(prediction 2).
Temperature variation across the dataset was largely deter-
mined by latitude and altitude (see Supporting Information).
To test whether these spatial factors influenced litter break-
down rates independent of temperature, we fitted a second set
of LME models with temperature-adjusted breakdown rate (ln
kDD, degree day�1; n = 1017) as the response variable, latitude
and altitude as fixed effects, and mesh size category as a ran-
dom (intercept) factor.
Detritivore density can lower the apparent activation
energy (Ea) of litter breakdown if density positively covaries
with temperature along latitudinal gradients (Boyero et al.,
2011b; prediction 2). We thus built GLS models to assess the
effects of detritivore density at ~T50, latitude, altitude, and
interactions of these terms on breakdown rate per degree day
(ln kDD), as another approach to testing our second prediction.
These models were based on subsets of the studies in our
database for which these data were available (n = 61). The
simplest model was obtained by sequentially omitting the
least important explanatory variables as described in Model
building and statistical inference.
To test whether apparent temperature sensitivity varies by
biome (prediction 3), we separated latitude into two categories
(tropics: 0°–30°, temperate: 31°–60°) and built another set of
LME models in which latitudinal category was specified as
the random intercept term and inverse normalized tempera-
ture was the random slope term.
We built a set of LME models with litter breakdown in
coarse mesh bags, kDc (day�1), as the response variable,
inverse normalized temperature as a covariate, with and with-
out slope as a random factor, and plant genus as a random (in-
tercept) factor to test whether the temperature sensitivity of
breakdown varies among plant genera (prediction 4). We used
12 (of 85) plant genera with eight or more values of kDc for
these analyses, which represented the minimal sample size
needed to estimate Ea with a significance level of P ≤ 0.10. We
carried out several analyses that included indicators of litter
quality. First, we regressed averaged values of initial litter
© 2017 John Wiley & Sons Ltd, Global Change Biology, doi: 10.1111/gcb.13609
4 J . J . FOLLSTAD SHAH et al.
chemistry against genus-specific values of Ea. We obtained
average values of initial litter chemistry from our dataset (30%
of records), which we augmented with data from published
literature not used in our synthesis (see Appendix S2 in Sup-
porting Information). Individual GLS models were con-
structed for each litter chemistry parameter because some
data were missing for two genera (Melicytus and Phragmites).
These models also allowed us to quantify relationships when
influential data points were excluded from each analysis.
In a second approach, we classified litter from all 85 plant
genera as having ‘fast’ (kD >0.0100 day�1), ‘medium’
(kD = 0.0050–0.0100 day�1), or ‘slow’ (kD < 0.0050 day�1)
breakdown rate based on median values of kD in our dataset
and the categories established by Petersen & Cummins (1974).
We used these categories as a proxy for litter quality because
litter species classified as having fast breakdown are usually
of higher quality than litter species classified as breaking
down at medium or slow rates (Schindler & Gessner, 2009)
and we could apply this categorization to all plant genera in
our dataset. We then used LME models to quantify the Ea
(random slope term) of litter breakdown (kDc; response vari-
able) by breakdown rate category (random intercept term).
We also used a Kruskal–Wallis test to determine whether tem-
perature sensitivity differed among breakdown rate categories
for the 12 genera with genus-specific Ea values.
Model building and statistical inference. Statistical analyses
were conducted in R v.3.0.1 (R Core Team 2013). GLS and
LME models were computed using the ‘NLME’ package
(Pinheiro et al., 2014). LME models were built sequentially,
starting with the inclusion of all fixed effects (Zuur et al.,
2009). Significance of random effects (i.e., intercept and
slope) was assessed using likelihood ratio tests, each com-
paring models with and without the term to test for signifi-
cance. We sequentially omitted explanatory variables and
compared each model with more complex models using
Akaike’s information criterion (AIC) scores and likelihood
ratio (L) tests until the most parsimonious model composed
of significant factors (P < 0.05) was found. Model compar-
isons were based on the restricted estimated maximum like-
lihood (REML) when fitting random effects and maximum
likelihood (ML) when fitting fixed effects. Once the simplest
fixed effects model was found, it was refitted in REML to
provide the best estimates of standard errors and random
effects.
Model assumptions of linearity, normality, and
homoscedasticity were checked by plotting normalized resid-
uals based on the REML fit against fitted values and explana-
tory variables (for LME models) and by plotting histograms of
the residuals. These assumptions were met for breakdown
coefficients (kD, day�1; kDD, degree day
�1) and detritivore den-
sities at ~T50 (no. of individuals g�1 litter DM or AFDM) after
a natural log transformation (or ln [n + 1] in case of detritivore
density at ~T50). We used density data reported in units per g
litter DM and AFDM to increase sample size used in analyses.
Model parameters are reported along with their standard
errors (SE). For Ea, 95% confidence intervals (CI) also are
reported to show the precision of the estimate and distance
from temperature invariance (i.e., 0 eV).
Results
Temperature sensitivity of litter breakdown mediated bymicrobes and microbes plus detritivores
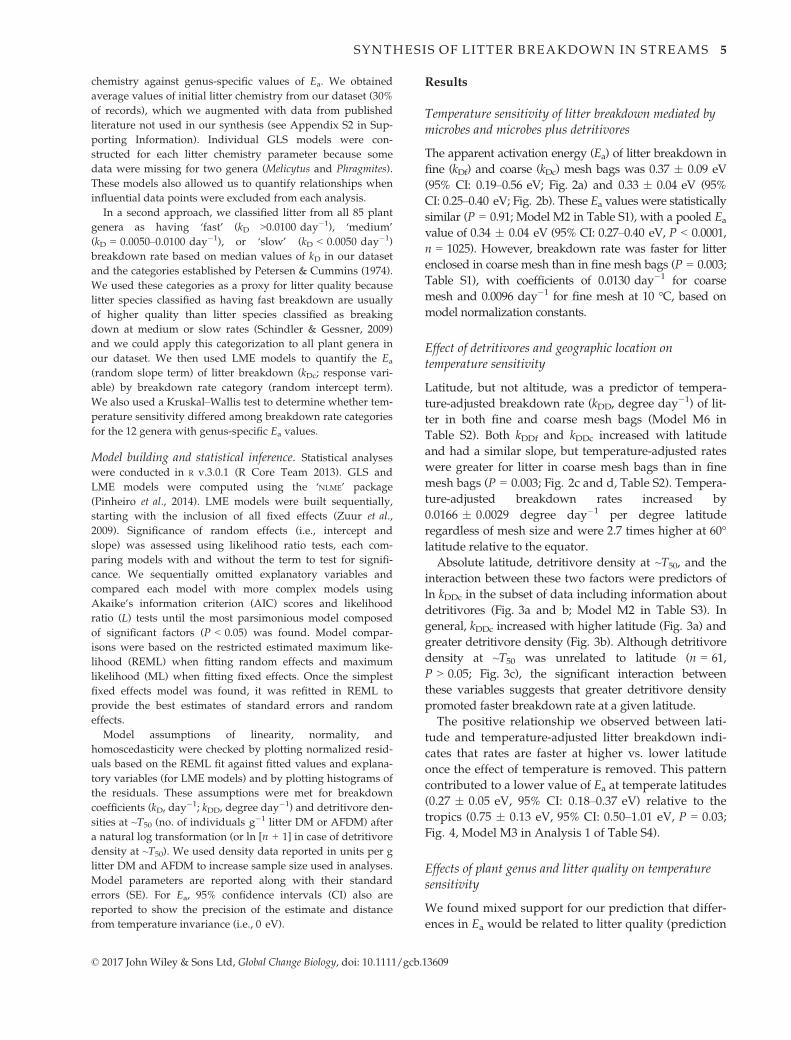
The apparent activation energy (Ea) of litter breakdown in
fine (kDf) and coarse (kDc) mesh bags was 0.37 � 0.09 eV
(95% CI: 0.19–0.56 eV; Fig. 2a) and 0.33 � 0.04 eV (95%
CI: 0.25–0.40 eV; Fig. 2b). These Ea values were statistically
similar (P = 0.91; Model M2 in Table S1), with a pooled Eavalue of 0.34 � 0.04 eV (95% CI: 0.27–0.40 eV, P < 0.0001,
n = 1025). However, breakdown rate was faster for litter
enclosed in coarse mesh than in fine mesh bags (P = 0.003;
Table S1), with coefficients of 0.0130 day�1 for coarse
mesh and 0.0096 day�1 for fine mesh at 10 °C, based on
model normalization constants.
Effect of detritivores and geographic location ontemperature sensitivity
Latitude, but not altitude, was a predictor of tempera-
ture-adjusted breakdown rate (kDD, degree day�1) of lit-
ter in both fine and coarse mesh bags (Model M6 in
Table S2). Both kDDf and kDDc increased with latitude
and had a similar slope, but temperature-adjusted rates
were greater for litter in coarse mesh bags than in fine
mesh bags (P = 0.003; Fig. 2c and d, Table S2). Tempera-
ture-adjusted breakdown rates increased by
0.0166 � 0.0029 degree day�1 per degree latitude
regardless of mesh size and were 2.7 times higher at 60°latitude relative to the equator.
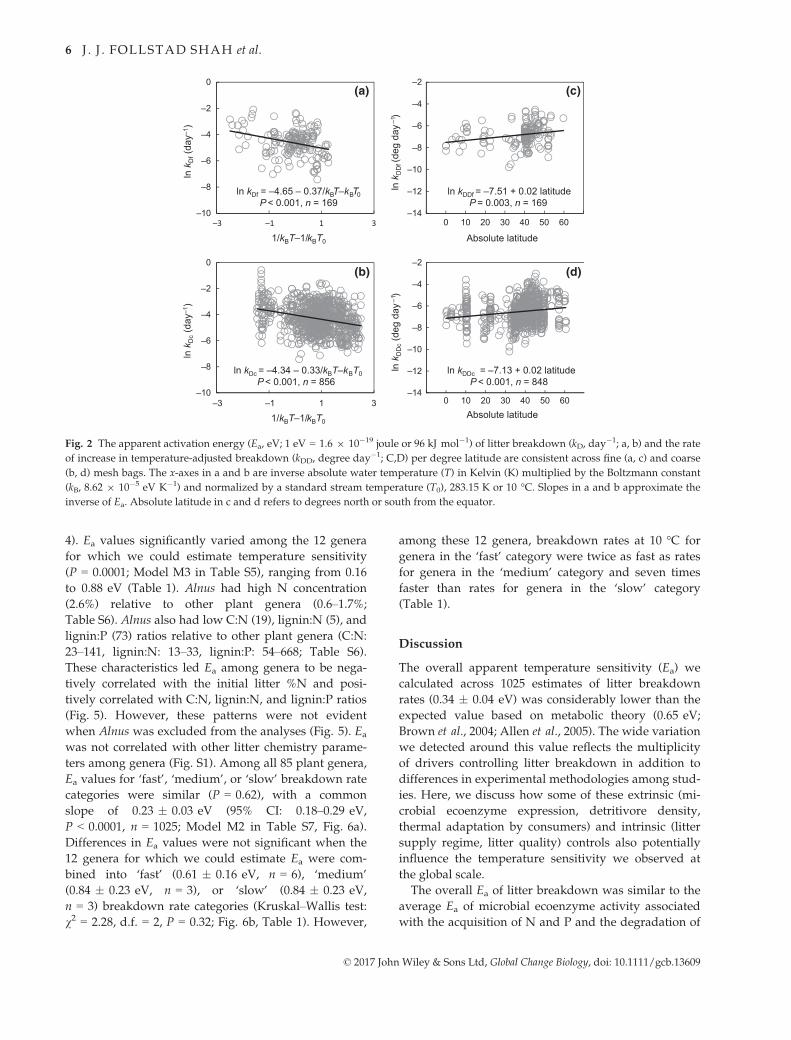
Absolute latitude, detritivore density at ~T50, and the
interaction between these two factors were predictors of
ln kDDc in the subset of data including information about
detritivores (Fig. 3a and b; Model M2 in Table S3). In
general, kDDc increased with higher latitude (Fig. 3a) and
greater detritivore density (Fig. 3b). Although detritivore
density at ~T50 was unrelated to latitude (n = 61,
P > 0.05; Fig. 3c), the significant interaction between
these variables suggests that greater detritivore density
promoted faster breakdown rate at a given latitude.
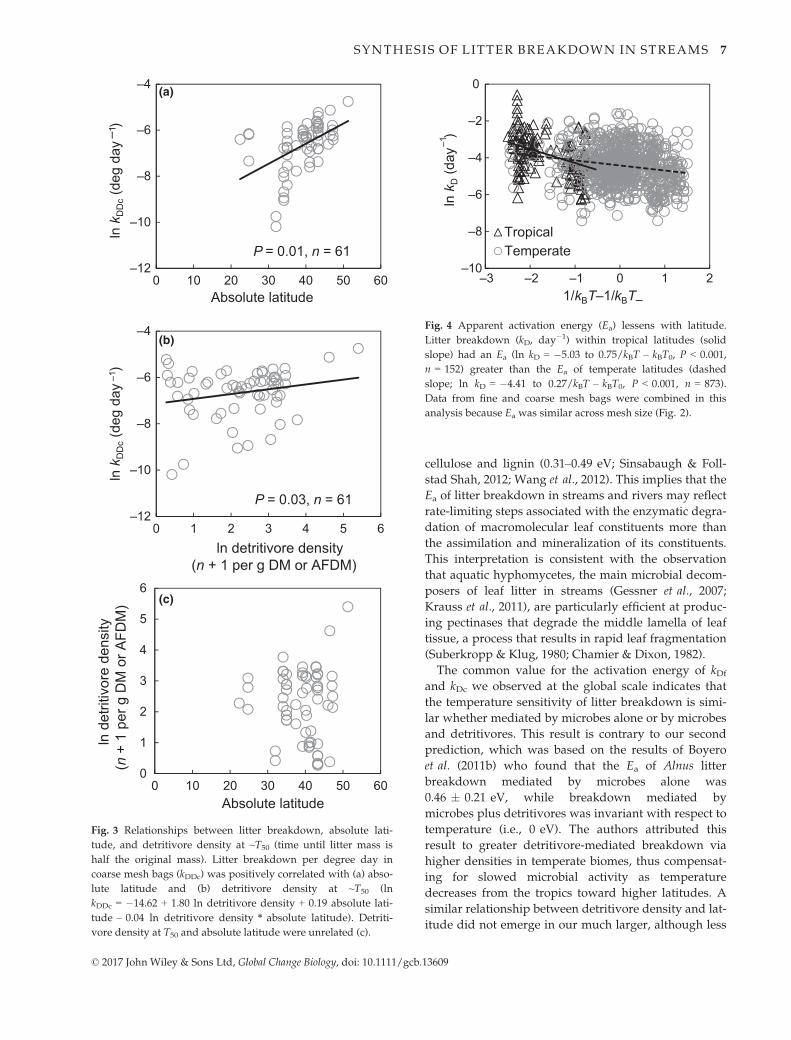
The positive relationship we observed between lati-
tude and temperature-adjusted litter breakdown indi-
cates that rates are faster at higher vs. lower latitude
once the effect of temperature is removed. This pattern
contributed to a lower value of Ea at temperate latitudes
(0.27 � 0.05 eV, 95% CI: 0.18–0.37 eV) relative to the
tropics (0.75 � 0.13 eV, 95% CI: 0.50–1.01 eV, P = 0.03;
Fig. 4, Model M3 in Analysis 1 of Table S4).
Effects of plant genus and litter quality on temperaturesensitivity
We found mixed support for our prediction that differ-
ences in Ea would be related to litter quality (prediction
© 2017 John Wiley & Sons Ltd, Global Change Biology, doi: 10.1111/gcb.13609
SYNTHESIS OF LITTER BREAKDOWN IN STREAMS 5
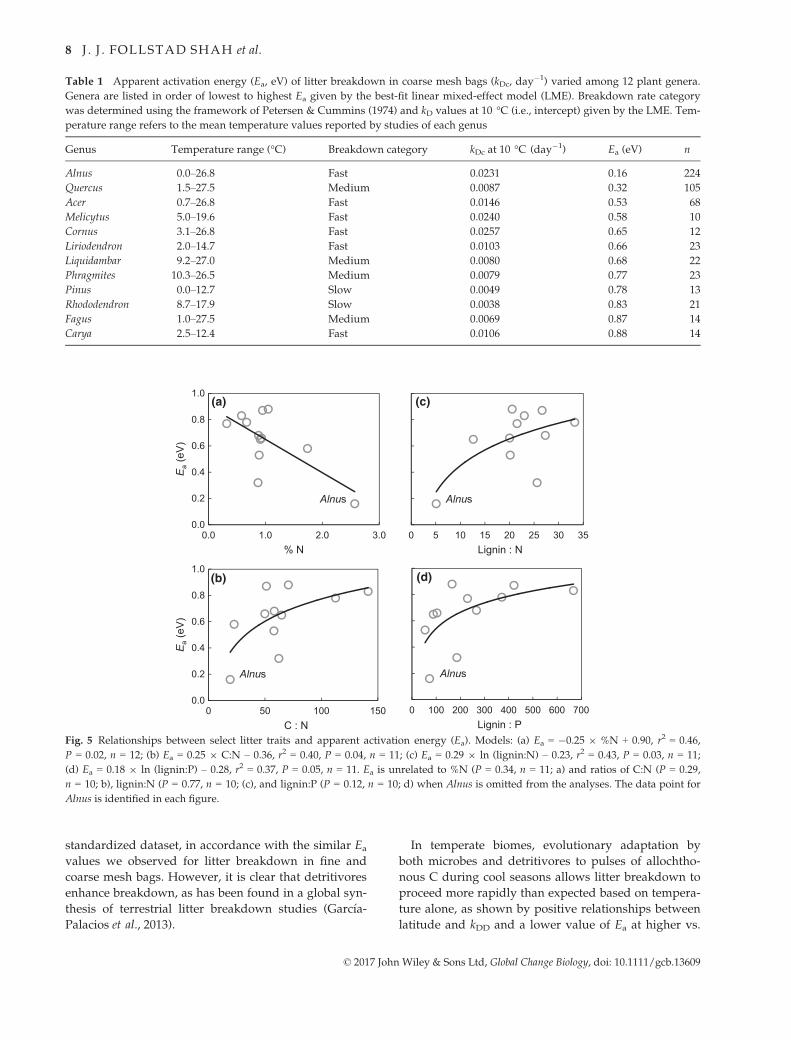
4). Ea values significantly varied among the 12 genera
for which we could estimate temperature sensitivity
(P = 0.0001; Model M3 in Table S5), ranging from 0.16
to 0.88 eV (Table 1). Alnus had high N concentration
(2.6%) relative to other plant genera (0.6–1.7%;
Table S6). Alnus also had low C:N (19), lignin:N (5), and
lignin:P (73) ratios relative to other plant genera (C:N:
23–141, lignin:N: 13–33, lignin:P: 54–668; Table S6).
These characteristics led Ea among genera to be nega-
tively correlated with the initial litter %N and posi-
tively correlated with C:N, lignin:N, and lignin:P ratios
(Fig. 5). However, these patterns were not evident
when Alnus was excluded from the analyses (Fig. 5). Ea
was not correlated with other litter chemistry parame-
ters among genera (Fig. S1). Among all 85 plant genera,
Ea values for ‘fast’, ‘medium’, or ‘slow’ breakdown rate
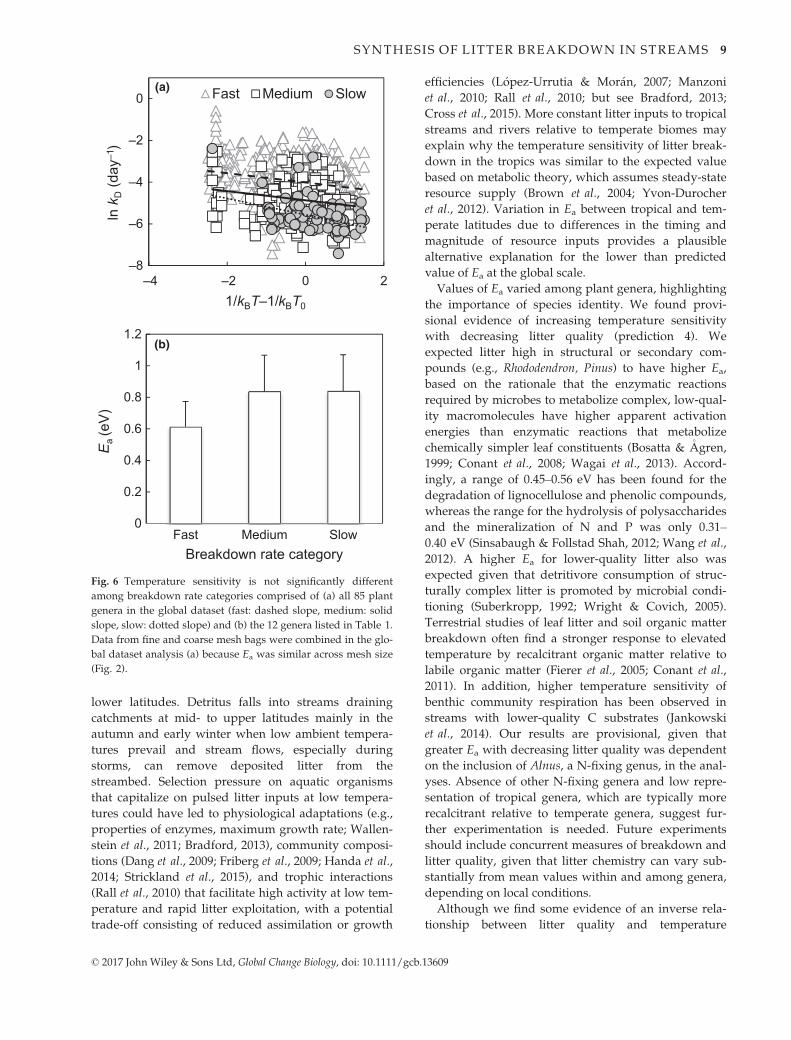
categories were similar (P = 0.62), with a common
slope of 0.23 � 0.03 eV (95% CI: 0.18–0.29 eV,
P < 0.0001, n = 1025; Model M2 in Table S7, Fig. 6a).
Differences in Ea values were not significant when the
12 genera for which we could estimate Ea were com-
bined into ‘fast’ (0.61 � 0.16 eV, n = 6), ‘medium’
(0.84 � 0.23 eV, n = 3), or ‘slow’ (0.84 � 0.23 eV,
n = 3) breakdown rate categories (Kruskal–Wallis test:
v2 = 2.28, d.f. = 2, P = 0.32; Fig. 6b, Table 1). However,
among these 12 genera, breakdown rates at 10 °C for
genera in the ‘fast’ category were twice as fast as rates
for genera in the ‘medium’ category and seven times
faster than rates for genera in the ‘slow’ category
(Table 1).
Discussion
The overall apparent temperature sensitivity (Ea) we
calculated across 1025 estimates of litter breakdown
rates (0.34 � 0.04 eV) was considerably lower than the
expected value based on metabolic theory (0.65 eV;
Brown et al., 2004; Allen et al., 2005). The wide variation
we detected around this value reflects the multiplicity
of drivers controlling litter breakdown in addition to
differences in experimental methodologies among stud-
ies. Here, we discuss how some of these extrinsic (mi-
crobial ecoenzyme expression, detritivore density,
thermal adaptation by consumers) and intrinsic (litter
supply regime, litter quality) controls also potentially
influence the temperature sensitivity we observed at
the global scale.
The overall Ea of litter breakdown was similar to the
average Ea of microbial ecoenzyme activity associated
with the acquisition of N and P and the degradation of
(a)
(b)
(c)
(d)
ln kDf = –4.65 – 0.37/kBT–kBT0P< 0.001, n = 169
ln kDc = –4.34 – 0.33/kBT–kBT0P< 0.001, n = 856
ln kDDf = –7.51 + 0.02 latitudeP= 0.003, n = 169
ln kDDc = –7.13 + 0.02 latitudeP< 0.001, n = 848
–10
–8
–6
–4
–2
0
lnk D
f(d
ay–1
)
1/kBT–1/kBT0
–10
–8
–6
–4
–2
0
–3 –1 1 3
–3 –1 1 3
lnk D
c(d
ay–1
)
1/kBT–1/kBT0
–14
–12
–10
–8
–6
–4
–2
0 10 20 30 40 50 60
lnk D
Df(
deg
day–
1 )
Absolute latitude
–14
–12
–10
–8
–6
–4
–2
0 10 20 30 40 50 60lnk D
Dc
(deg
day
–1)
Absolute latitude
Fig. 2 The apparent activation energy (Ea, eV; 1 eV = 1.6 9 10�19 joule or 96 kJ mol�1) of litter breakdown (kD, day�1; a, b) and the rate
of increase in temperature-adjusted breakdown (kDD, degree day�1; C,D) per degree latitude are consistent across fine (a, c) and coarse
(b, d) mesh bags. The x-axes in a and b are inverse absolute water temperature (T) in Kelvin (K) multiplied by the Boltzmann constant
(kB, 8.62 9 10�5 eV K�1) and normalized by a standard stream temperature (T0), 283.15 K or 10 °C. Slopes in a and b approximate the
inverse of Ea. Absolute latitude in c and d refers to degrees north or south from the equator.
© 2017 John Wiley & Sons Ltd, Global Change Biology, doi: 10.1111/gcb.13609
6 J . J . FOLLSTAD SHAH et al.
cellulose and lignin (0.31–0.49 eV; Sinsabaugh & Foll-
stad Shah, 2012; Wang et al., 2012). This implies that the
Ea of litter breakdown in streams and rivers may reflect
rate-limiting steps associated with the enzymatic degra-
dation of macromolecular leaf constituents more than
the assimilation and mineralization of its constituents.
This interpretation is consistent with the observation
that aquatic hyphomycetes, the main microbial decom-
posers of leaf litter in streams (Gessner et al., 2007;
Krauss et al., 2011), are particularly efficient at produc-
ing pectinases that degrade the middle lamella of leaf
tissue, a process that results in rapid leaf fragmentation
(Suberkropp & Klug, 1980; Chamier & Dixon, 1982).
The common value for the activation energy of kDf
and kDc we observed at the global scale indicates that
the temperature sensitivity of litter breakdown is simi-
lar whether mediated by microbes alone or by microbes
and detritivores. This result is contrary to our second
prediction, which was based on the results of Boyero
et al. (2011b) who found that the Ea of Alnus litter
breakdown mediated by microbes alone was
0.46 � 0.21 eV, while breakdown mediated by
microbes plus detritivores was invariant with respect to
temperature (i.e., 0 eV). The authors attributed this
result to greater detritivore-mediated breakdown via
higher densities in temperate biomes, thus compensat-
ing for slowed microbial activity as temperature
decreases from the tropics toward higher latitudes. A
similar relationship between detritivore density and lat-
itude did not emerge in our much larger, although less
–12
–10
–8
–6
–4
0 10 20 30 40 50 60
lnk D
Dc
(deg
day
–1)
Absolute latitude
–12
–10
–8
–6
–4
0 1 2 3 4 5 6
lnk D
Dc
(deg
day
–1)
ln detritivore density(n + 1 per g DM or AFDM)
0
1
2
3
4
5
6
0 10 20 30 40 50 60
ln d
etrit
ivor
e de
nsity
(n +
1 p
er g
DM
or A
FDM
)
Absolute latitude
(a)
(b)
(c)
P = 0.01, n = 61
P = 0.03, n = 61
Fig. 3 Relationships between litter breakdown, absolute lati-
tude, and detritivore density at ~T50 (time until litter mass is
half the original mass). Litter breakdown per degree day in
coarse mesh bags (kDDc) was positively correlated with (a) abso-
lute latitude and (b) detritivore density at ~T50 (ln
kDDc = �14.62 + 1.80 ln detritivore density + 0.19 absolute lati-
tude – 0.04 ln detritivore density * absolute latitude). Detriti-
vore density at T50 and absolute latitude were unrelated (c).
–10
–8
–6
–4
–2
0
–3 –2 –1 0 1 2
lnk D
(day
–1)
1/kBT–1/kBT–
TropicalTemperate
Fig. 4 Apparent activation energy (Ea) lessens with latitude.
Litter breakdown (kD, day�1) within tropical latitudes (solid
slope) had an Ea (ln kD = �5.03 to 0.75/kBT – kBT0, P < 0.001,
n = 152) greater than the Ea of temperate latitudes (dashed
slope; ln kD = �4.41 to 0.27/kBT – kBT0, P < 0.001, n = 873).
Data from fine and coarse mesh bags were combined in this
analysis because Ea was similar across mesh size (Fig. 2).
© 2017 John Wiley & Sons Ltd, Global Change Biology, doi: 10.1111/gcb.13609
SYNTHESIS OF LITTER BREAKDOWN IN STREAMS 7
standardized dataset, in accordance with the similar Ea
values we observed for litter breakdown in fine and
coarse mesh bags. However, it is clear that detritivores
enhance breakdown, as has been found in a global syn-
thesis of terrestrial litter breakdown studies (Garc�ıa-
Palacios et al., 2013).
In temperate biomes, evolutionary adaptation by
both microbes and detritivores to pulses of allochtho-
nous C during cool seasons allows litter breakdown to
proceed more rapidly than expected based on tempera-
ture alone, as shown by positive relationships between
latitude and kDD and a lower value of Ea at higher vs.
Table 1 Apparent activation energy (Ea, eV) of litter breakdown in coarse mesh bags (kDc, day�1) varied among 12 plant genera.
Genera are listed in order of lowest to highest Ea given by the best-fit linear mixed-effect model (LME). Breakdown rate category
was determined using the framework of Petersen & Cummins (1974) and kD values at 10 °C (i.e., intercept) given by the LME. Tem-
perature range refers to the mean temperature values reported by studies of each genus
Genus Temperature range (°C) Breakdown category kDc at 10 °C (day�1) Ea (eV) n
Alnus 0.0–26.8 Fast 0.0231 0.16 224
Quercus 1.5–27.5 Medium 0.0087 0.32 105
Acer 0.7–26.8 Fast 0.0146 0.53 68
Melicytus 5.0–19.6 Fast 0.0240 0.58 10
Cornus 3.1–26.8 Fast 0.0257 0.65 12
Liriodendron 2.0–14.7 Fast 0.0103 0.66 23
Liquidambar 9.2–27.0 Medium 0.0080 0.68 22
Phragmites 10.3–26.5 Medium 0.0079 0.77 23
Pinus 0.0–12.7 Slow 0.0049 0.78 13
Rhododendron 8.7–17.9 Slow 0.0038 0.83 21
Fagus 1.0–27.5 Medium 0.0069 0.87 14
Carya 2.5–12.4 Fast 0.0106 0.88 14
0 100 200 300 400 500 600 700Lignin : P
Alnus
0 5 10 15 20 25 30 35Lignin : N
Alnus
0.0
0.2
0.4
0.6
0.8
1.0
0.0 1.0 2.0 3.0
Ea
(eV
)
% N
Alnus
0.0
0.2
0.4
0.6
0.8
1.0
0 50 100 150
Ea
(eV
)
C : N
Alnus
(a)
(b) (d)
(c)
Fig. 5 Relationships between select litter traits and apparent activation energy (Ea). Models: (a) Ea = �0.25 9 %N + 0.90, r2 = 0.46,
P = 0.02, n = 12; (b) Ea = 0.25 9 C:N – 0.36, r2 = 0.40, P = 0.04, n = 11; (c) Ea = 0.29 9 ln (lignin:N) – 0.23, r2 = 0.43, P = 0.03, n = 11;
(d) Ea = 0.18 9 ln (lignin:P) – 0.28, r2 = 0.37, P = 0.05, n = 11. Ea is unrelated to %N (P = 0.34, n = 11; a) and ratios of C:N (P = 0.29,
n = 10; b), lignin:N (P = 0.77, n = 10; (c), and lignin:P (P = 0.12, n = 10; d) when Alnus is omitted from the analyses. The data point for
Alnus is identified in each figure.
© 2017 John Wiley & Sons Ltd, Global Change Biology, doi: 10.1111/gcb.13609
8 J . J . FOLLSTAD SHAH et al.
lower latitudes. Detritus falls into streams draining
catchments at mid- to upper latitudes mainly in the
autumn and early winter when low ambient tempera-
tures prevail and stream flows, especially during
storms, can remove deposited litter from the
streambed. Selection pressure on aquatic organisms
that capitalize on pulsed litter inputs at low tempera-
tures could have led to physiological adaptations (e.g.,
properties of enzymes, maximum growth rate; Wallen-
stein et al., 2011; Bradford, 2013), community composi-
tions (Dang et al., 2009; Friberg et al., 2009; Handa et al.,
2014; Strickland et al., 2015), and trophic interactions
(Rall et al., 2010) that facilitate high activity at low tem-
perature and rapid litter exploitation, with a potential
trade-off consisting of reduced assimilation or growth
efficiencies (L�opez-Urrutia & Mor�an, 2007; Manzoni
et al., 2010; Rall et al., 2010; but see Bradford, 2013;
Cross et al., 2015). More constant litter inputs to tropical
streams and rivers relative to temperate biomes may
explain why the temperature sensitivity of litter break-
down in the tropics was similar to the expected value
based on metabolic theory, which assumes steady-state
resource supply (Brown et al., 2004; Yvon-Durocher
et al., 2012). Variation in Ea between tropical and tem-
perate latitudes due to differences in the timing and
magnitude of resource inputs provides a plausible
alternative explanation for the lower than predicted
value of Ea at the global scale.
Values of Ea varied among plant genera, highlighting
the importance of species identity. We found provi-
sional evidence of increasing temperature sensitivity
with decreasing litter quality (prediction 4). We
expected litter high in structural or secondary com-
pounds (e.g., Rhododendron, Pinus) to have higher Ea,
based on the rationale that the enzymatic reactions
required by microbes to metabolize complex, low-qual-
ity macromolecules have higher apparent activation
energies than enzymatic reactions that metabolize
chemically simpler leaf constituents (Bosatta & �Agren,
1999; Conant et al., 2008; Wagai et al., 2013). Accord-
ingly, a range of 0.45–0.56 eV has been found for the
degradation of lignocellulose and phenolic compounds,
whereas the range for the hydrolysis of polysaccharides
and the mineralization of N and P was only 0.31–0.40 eV (Sinsabaugh & Follstad Shah, 2012; Wang et al.,
2012). A higher Ea for lower-quality litter also was
expected given that detritivore consumption of struc-
turally complex litter is promoted by microbial condi-
tioning (Suberkropp, 1992; Wright & Covich, 2005).
Terrestrial studies of leaf litter and soil organic matter
breakdown often find a stronger response to elevated
temperature by recalcitrant organic matter relative to
labile organic matter (Fierer et al., 2005; Conant et al.,
2011). In addition, higher temperature sensitivity of
benthic community respiration has been observed in
streams with lower-quality C substrates (Jankowski
et al., 2014). Our results are provisional, given that
greater Ea with decreasing litter quality was dependent
on the inclusion of Alnus, a N-fixing genus, in the anal-
yses. Absence of other N-fixing genera and low repre-
sentation of tropical genera, which are typically more
recalcitrant relative to temperate genera, suggest fur-
ther experimentation is needed. Future experiments
should include concurrent measures of breakdown and
litter quality, given that litter chemistry can vary sub-
stantially from mean values within and among genera,
depending on local conditions.
Although we find some evidence of an inverse rela-
tionship between litter quality and temperature
–8
–6
–4
–2
0
–4 –2 0 2
lnk D
(day
–1)
1/kBT–1/kBT0
Fast Medium Slow
0
0.2
0.4
0.6
0.8
1
1.2
Fast Medium Slow
Ea
(eV
)
Breakdown rate category
(a)
(b)
Fig. 6 Temperature sensitivity is not significantly different
among breakdown rate categories comprised of (a) all 85 plant
genera in the global dataset (fast: dashed slope, medium: solid
slope, slow: dotted slope) and (b) the 12 genera listed in Table 1.
Data from fine and coarse mesh bags were combined in the glo-
bal dataset analysis (a) because Ea was similar across mesh size
(Fig. 2).
© 2017 John Wiley & Sons Ltd, Global Change Biology, doi: 10.1111/gcb.13609
SYNTHESIS OF LITTER BREAKDOWN IN STREAMS 9
sensitivity at the scale of individual genera, differences
in Ea were not apparent when genera were classified
into coarsely defined breakdown rate categories. Small
sample size and variation in median values of break-
down rate coefficients may have masked potential dif-
ferences among the 12 genera for which we could
estimate Ea, but this explanation does not apply across
all 85 genera. Alternatively, the seemingly disparate
results at the scales of genus and breakdown rate cate-
gory may be reconciled by considering characteristics
unique to streams and rivers. Continual availability of
water and constant flow of dissolved nutrients across
leaves in streams and rivers contribute to potentially
rapid (i.e., over several days) biological degradation of
recalcitrant forms of terrestrially derived organic matter
(e.g., lignin) and phenolic compounds (Ward et al.,
2013). Unlike terrestrial systems, higher temperature in
perennial streams and rivers does not result in moisture
becoming a limiting factor (Gessner et al., 2010), allow-
ing temperature to assume greater importance in affect-
ing litter breakdown than litter quality when
temperature is elevated (Ferreira & Chauvet, 2011a).
These attributes of streams and rivers remove or miti-
gate key constraints operating on land, thereby promot-
ing a convergence of Ea values across coarsely defined
litter types.
Projections of leaf litter breakdown response to risingtemperature
Equivalence in the temperature sensitivity of litter
breakdown driven by microbes alone and microbes and
detritivores combined suggests that it is possible to
make an initial, broad-scale forecast of breakdown rate
response to altered stream temperatures. Given an
overall average Ea of 0.34 eV and a standard water tem-
perature of 10 °C, litter breakdown rates would be
expected to increase by 5–21% with a 1–4 °C increase in
mean water temperature (IPCC 2013), rather than a 10–45% increase if Ea was 0.65 eV in accordance with
metabolic theory. Stream temperature is expected to
rise less in the tropics than at mid- to upper latitudes
(IPCC 2013). However, we estimate that a roughly 10%
increase in litter breakdown rate requires only a 1 °Crise in the tropics but a 4 °C rise in temperate biomes,
based on the Ea values and normalization constants
(i.e., intercepts) we observed for tropical and temperate
latitudes. Thus, differential regional warming could
result in a similar proportional increase in breakdown
rates despite regional variation in Ea.
Litter breakdown dominated by microbial activity
converts a sizeable fraction of organic matter to CO2,
while detritivores generate large amounts of fine partic-
ulate organic C due to low assimilation efficiencies
(Ward et al., 1994; Baldy et al., 2007). Similarity in the
temperature sensitivity of litter breakdown mediated by
microbes alone and microbes plus detritivores suggests
that the fractions of gaseous C loss and particulate C
transport attributed to litter breakdown will not signifi-
cantly change over broad scales as temperatures rise.
Acknowledgements
We thank many authors who graciously provided requestedinformation that was not included in published literature andthree anonymous reviewers who provided suggestions thatimproved the clarity of the manuscript. The US Long Term Eco-logical Research (LTER) Network provided financial support forthis project, through an award (DEB#0936498) from the NationalScience Foundation (NSF). JSK was supported by NSFEF#1064998. MA was supported by NSF DBI#1216512. NAGwas supported by the Department of Energy’s Office of Science,Biological and Environmental Research. Oak Ridge NationalLaboratory is managed by UT-Battelle, LLC, for the US DOEunder contract DE-AC05-00OR22725.
Statement of authorship
JJFS, JSK, and MA obtained funding for collaborators to
participate in research workshops, JJFS, JSK, MA,
WKD, MOG, NAG, SLJ, AL, CJL, DWPM, ADR, CMS,
JRW, and LHZ compiled data and conducted prelimi-
nary analyses, JJFS, AL, and RLS developed the statisti-
cal approach, JJFS conducted final analyses, JJFS and
JSK created tables and figures, JJFS wrote the first draft
of the manuscript, and all authors contributed substan-
tially to manuscript revisions.
References
Allen AP, Gillooly JF, Brown JH (2005) Linking the global carbon cycle to individual
metabolism. Functional Ecology, 19, 202–213.
Ard�on M, Pringle CM, Eggert SL (2009) Does leaf chemistry differentially affect
breakdown in tropical vs. temperate streams? Importance of standardized analyti-
cal techniques to measure leaf chemistry. Journal of the North American Benthological
Society, 28, 440–453.
Arrhenius S (1915) Quantitative Laws in Biological Chemistry. Bell, London, UK.
Baldy V, Gobert V, Guerold F, Chauvet E, Lambrigot D, Charcosset JY (2007) Leaf lit-
ter breakdown budgets in streams of various trophic status: effects of dissolved
inorganic nutrients on microorganisms and invertebrates. Freshwater Biology, 52,
1322–1335.
Battin TJ, Luyssaert S, Kaplan LA, Aufdenkampe AK, Richter A, Tranvik LJ (2009)
The boundless carbon cycle. Nature Geoscience, 2, 598–600.
Bosatta E, �Agren GI (1999) Soil organic matter quality interpreted thermodynami-
cally. Soil Biology and Biochemistry, 31, 1889–1891.
Boulton AJ, Boon PI (1991) A review of methodology used to measure leaf litter
decomposition in lotic environments – time to turn over an old leaf. Australian
Journal of Marine and Freshwater Research, 42, 1–43.
Boyero L, Pearson RG, Dundgeon D et al. (2011a) Global distribution of a key trophic
guild contrasts with common latitudinal diversity patterns. Ecology, 92, 1839–1848.
Boyero L, Pearson RG, Gessner MO et al. (2011b) A global experiment suggests cli-
mate warming will not accelerate litter decomposition in streams but might reduce
carbon sequestration. Ecology Letters, 14, 289–294.
Boyero L, Pearson RG, Hui C et al. (2016) Biotic and abiotic variables influencing
plant litter breakdown in streams: a global study. Proceedings of the Royal Society B,
283, 20152664.
© 2017 John Wiley & Sons Ltd, Global Change Biology, doi: 10.1111/gcb.13609
10 J . J . FOLLSTAD SHAH et al.
Bradford MA (2013) Thermal adaptation of decomposer communities in warming
soils. Frontiers in Microbiology, 4, 1–16, Article 333.
Brown J, Gillooly J, Allen A, Savage V, West G (2004) Toward a metabolic theory of
ecology. Ecology, 85, 1771–1789.
Chamier AC, Dixon PA (1982) Pectinases in leaf degradation by aquatic hyphomy-
cetes the enzymes and leaf maceration. Journal of General Microbiology, 128, 2469–
2484.
Conant RT, Drijber RA, Haddix ML et al. (2008) Sensitivity of organic matter decom-
position to warming varies with its quality. Global Change Biology, 14, 868–877.
Conant RT, Ryan MG, �Agren GI et al. (2011) Temperature and soil organic matter
decomposition rates – synthesis of current knowledge and a way forward. Global
Change Biology, 17, 3392–3404.
Cornwell WK, Cornelissen JHC, Amatangelo K et al. (2008) Plant species traits are the
predominant control on litter decomposition rates within biomes worldwide. Ecol-
ogy Letters, 11, 1065–1071.
Cross WF, Hood JM, Benstead JP, Huryn AD, Nelson D (2015) Interactions between
temperature and nutrients across levels of ecological organization. Global Change
Biology, 21, 1025–1040.
Dang CK, Schindler M, Chauvet E, Gessner MO (2009) Temperature oscillation cou-
pled with fungal community shifts can modulate warming effects on litter decom-
position. Ecology, 90, 122–131.
Demars BOL, Manson JR, �Olaffson JS et al. (2011) Temperature and the metabolic bal-
ance of streams. Freshwater Biology, 56, 1106–1121.
Demars BOL, G�ıslason GM, �Olaffson JS et al. (2016) Impact of warming on CO2 emissions
from streams countered by aquatic photosynthesis.Nature Geoscience, 9, 758–761.
Dodds WK, Cole JJ (2007) Expanding the concept of trophic state in aquatic ecosys-
tems: It’s not just the autotrophs. Aquatic Science, 69, 427–439.
Ferreira V, Chauvet E (2011a) Future increase in temperature more than decrease in
litter quality can affect microbial litter decomposition in streams. Oecologia, 167,
279–291.
Ferreira V, Chauvet E (2011b) Synergistic effects of water temperature and dissolved
nutrients on litter decomposition and associated fungi. Global Change Biology, 17,
551–564.
Fierer N, Craine JM, McLauchlan K, Schimel JP (2005) Litter quality and the tempera-
ture sensitivity of decomposition. Ecology, 86, 320–326.
Friberg N, Dybkjaer JB, �Olafsson JS, G�ıslason GM, Larsen SE, Lauridsen TL (2009)
Relationships between structure and function in streams contrasting in tempera-
ture. Freshwater Biology, 54, 2051–2068.
Garc�ıa-Palacios P, Maestre FT, Kattge J, Wall D (2013) Climate and litter quality dif-
ferently modulate the effects of soil fauna on litter decomposition across biomes.
Ecology Letters, 16, 1045–1053.
Garc�ıa-Palacios P, McKie BG, Handa IT, Frainer A, H€attenschwiler S (2016) The
importance of litter traits and decomposers for litter decomposition: a comparison
of aquatic and terrestrial ecosystems within and across biomes. Functional Ecology,
30, 819–829.
Gessner MO, Chauvet E (1994) Importance of stream microfungi in controlling break-
down rates of leaf-litter. Ecology, 75, 1807–1817.
Gessner MO, Chauvet E, Dobson M (1999) A perspective on leaf litter breakdown in
streams. Oikos, 85, 377–378.
Gessner MO, Gulis V, Kuehn KA, Chauvet E, Suberkropp K (2007) Fungal decom-
posers of plant litter in aquatic ecosystems. In: The Mycota, Vol. 4: Environmental
and Microbial Relationships, 2nd edn (eds Kubicek CP, Druzhinina IS). pp. 301–324.
Springer, Berlin.
Gessner MO, Swan CM, Dang CK, McKie BG, Bardgett RD, Wall DH, H€attenschwiler
S (2010) Diversity meets decomposition. Trends in Ecology and Evolution, 25, 372–
380.
Griffiths NG, Tiegs SD (2016) Organic-matter decomposition along a temperature gra-
dient in a forested headwater stream. Freshwater Science, 35, 518–533.
Handa IT, Aerts R, Berendse F et al. (2014) Consequences of biodiversity loss for litter
decomposition across biomes. Nature, 509, 218–221.
Hobbie SE (1996) Temperature and plant species control over litter decomposition in
Alaskan tundra. Ecological Monographs, 66, 503–522.
IPCC (2013) Climate change 2013: the physical science basis. In: Contribution of
Working Group I to the Fifth Assessment Report of the Intergovernmental Panel on
Climate Change (eds Stocker TF, Qin D, Plattner GK, Tignor M, Allen SK,
Boschung J, Nauels A, Xia Y, Bex V, Midgley PM). Cambridge University Press,
Cambridge.
Jankowski K, Schindler DE, Lisi PJ (2014) Temperature sensitivity of community res-
piration rate associated with watershed geomorphic features. Ecology, 95, 2707–
2714.
Kaushal SS, Likens GE, Jaworski NA et al. (2010) Rising stream and river tempera-
tures in the United States. Frontiers in Ecology and the Environment, 8, 461–466.
Krauss GJ, Sol�e M, Krauss G, Schlosser D, Wesenberg D, B€arlocher F (2011) Fungi in
freshwaters: ecology, physiology and biochemical potential. FEMS Microbiology
Review, 35, 620–651.
L�opez-Urrutia A, Mor�an XAG (2007) Resource limitation of bacterial production
distorts the temperature dependence of oceanic carbon cycling. Ecology, 88, 817–
822.
Makkonen M, Berg MP, Handa IT et al. (2012) Highly consistent effects of plant litter
identity and functional traits on decomposition across a latitudinal gradient. Ecol-
ogy Letters, 15, 1033–1041.
Manzoni S, Trofymow JA, Jackson RB, Porporato A (2010) Stoichiometric controls on
carbon, nitrogen, and phosphorus dynamics in decomposing litter. Ecological
Monographs, 80, 89–106.
Mart�ınez A, Larra~naga A, P�erez J, Basaguren A, Pozo J (2013) Leaf-litter quality
effects on stream ecosystem functioning: a comparison among five species. Funda-
mental and Applied Limnology, 183, 239–248.
Petersen RC, Cummins KW (1974) Leaf processing in a woodland stream. Freshwater
Biology, 4, 343–368.
Pinheiro J, Bates D, DebRoy S, Sarkar D, R Core Team (2014) nlme: Linear and Non-
linear Mixed Effects Models. R package version 3.1–117. Available at: http://cran.
r-project.org/web/packages/nlme/index.html (accessed 10 January 2014).
R Core Team (2013) R: A language and environment for statistical computing. R Founda-
tion for Statistical Computing, Vienna, Austria. Available at: http://www.R-pro
ject.org/ (accessed 11 November 2017).
Rall BC, Vucic-Pestic O, Ehnes RB, Emmerson M, Brose U (2010) Temperature, preda-
tor-prey interaction strength and population stability. Global Change Biology, 16,
2145–2157.
Raymond PA, Hartmann J, Lauerwald R et al. (2013) Global carbon dioxide emissions
from inland waters. Nature, 503, 355–359.
Schindler MH, Gessner MO (2009) Functional leaf traits and biodiversity effects on lit-
ter decomposition in a stream. Ecology, 90, 1641–1649.
Sinsabaugh RL, Follstad Shah JJ (2012) Ecoenzymatic stoichiometry and ecological
theory. Annual Review of Ecology Evolution and Systematics, 43, 313–343.
Sinsabaugh RL, Hill BH, Follstad Shah JJ (2009) Ecoenzymatic stoichiometry of micro-
bial organic nutrient acquisition in soil and sediment. Nature, 462, 795–798.
Strickland MS, Keiser AD, Bradford MA (2015) Climate history shapes contemporary
leaf litter decomposition. Biogeochemistry, 122, 165–174.
Suberkropp K (1992) Interactions with invertebrates. In: Ecological Studies, Vol. 4: The
Ecology of Aquatic Hyphomycetes (ed. B€arlocher F), pp. 118–134. Springer, Berlin.
Suberkropp K, Klug MJ (1980) The maceration of deciduous leaf litter by aquatic
hyphomycetes. Canadian Journal of Botany, 58, 1025–1031.
Tank JL, Rosi-Marshall EJ, Griffiths NA, Entrekin SA, Stephen ML (2010) A review of
allochthonous organic matter dynamics and metabolism in streams. Journal of the
North American Benthological Society, 29, 118–146.
Wagai R, Kishimoto-Mo AW, Yonemura S, Shirato Y, Hiradate S, Yagasaki Y (2013)
Linking temperature sensitivity of soil organic matter decomposition to its molec-
ular structure, accessibility, and microbial physiology. Global Change Biology, 19,
1114–1125.
Wallace JB, Eggert SL, Meyer JL, Webster JR (1997) Multiple trophic levels of a forest
stream linked to terrestrial litter inputs. Science, 277, 102–104.
Wallenstein MD, Allison SD, Ernakovich J, Steinweg JM, Sinsabaugh RL (2011) Con-
trols on the temperature sensitivity of soil enzymes: a key driver of in-situ enzyme
activity rates. In: Soil Enzymology (eds Shukla G, Varma A), pp. 245–258. Springer
Verlag, Berlin.
Wang GS, Post WM, Mayes MA, Frerichs JT, Sindhu J (2012) Parameter estimation for
models of ligninolytic and cellulolytic enzyme kinetics. Soil Biology and Biochem-
istry, 48, 28–38.
Ward JV, Stanford JA (1982) Thermal responses in the evolutionary ecology of aquatic
insects. Annual Review of Entomology, 27, 97–117.
Ward GM, Ward AK, Dahm CN, Aumen NG (1994) Origin and formation of organic
and inorganic particles in aquatic systems. In: The Biology of Particles in Aquatic Sys-
tems (ed Wotton RS), pp. 45–73. Lewis Publishers, Ann Arbor, MI.
Ward ND, Keil RG, Medeiros PM et al. (2013) Degradation of terrestrially derived
macromolecules in the Amazon River. Nature Geoscience, 6, 530–533.
Webster JR, Benfield EF (1986) Vascular plant breakdown in freshwater ecosystems.
Annual Review of Ecology Evolution and Systematics, 17, 567–594.
Welter JR, Benstead JP, Cross WF, Hood JM, Huryn AD, Johnson PW, Williamson TJ
(2015) Does N2-fixation amplify the temperature dependence of ecosystem meta-
bolism? Ecology, 96, 603–610.
© 2017 John Wiley & Sons Ltd, Global Change Biology, doi: 10.1111/gcb.13609
SYNTHESIS OF LITTER BREAKDOWN IN STREAMS 11
Woodward G, Gessner MO, Giller PS et al. (2012) Continental-scale effects
of nutrient pollution on stream ecosystem functioning. Science, 336, 1438–
1440.
Wright MS, Covich AP (2005) Relative importance of bacteria and fungi in a tropical
headwater stream: leaf decomposition and invertebrate feeding preference. Micro-
bial Ecology, 49, 536–546.
Young RG, Matthaei CD, Townsend CR (2008) Organic matter breakdown and
ecosystem metabolism: functional indicators for assessing river ecosystem health.
Journal of the North American Benthological Society, 27, 605–625.
Yvon-Durocher G, Jones JI, Trimmer M, Woodward G, Montoya JM (2010) Warming
alters the metabolic balance of ecosystems. Philosophical Transactions of the Royal
Society B, 365, 2117–2126.
Yvon-Durocher G, Caffrey JM, Cescatti A et al. (2012) Reconciling the temperature
dependence of respiration across timescales and ecosystem types. Nature, 487,
472–476.
Zuur A, Ieno EN, Walker N, Saveliev AA, Smith GM (2009) Mixed effects modeling
for nested data. Mixed Effects Models and Extensions in Ecology with R, pp. 101–142.
Springer, Berlin.
Supporting Information
Additional Supporting Information may be found in the online version of this article:
Appendix S1. Data and data sources.Appendix S2. Database characteristics and supporting data analyses.Table S1. Results of linear mixed effect modeling predicting global breakdown rate coefficients, ln kD (per day, d�1), by methodcode.Table S2. Results of linear mixed effect modeling predicting global temperature-adjusted breakdown rate coefficients, ln kDD (perdegree day, dd�1), by method code.Table S3. Results of generalized least squares modeling predicting breakdown rate coefficients per degree day in coarse mesh bags(ln kDDc, dd
�1), using subsets of data with information on detritivore and total macroinvertebrate densities at T50 (#/g DM orAFDM).Table S4. Results of linear mixed effect modeling predicting breakdown rate coefficients among and within mesh sizes (fine orcoarse), ln kD, kDf, or kDc (all per day, d
�1), by biome (tropical vs. temperate).Table S5. Results of linear mixed effect modeling predicting breakdown rate coefficients in coarse mesh bags, ln kDc (per day, d
�1),by plant genus (n = 12 genera).Table S6. Apparent activation energy (Ea, eV) of leaf litter breakdown and mean leaf chemistry for twelve riparian plant genera.Table S7. Results of linear mixed effect modeling predicting breakdown rate coefficients, ln kD (per day, d�1), by breakdown ratecategory (85 plant genera).Figure S1. Apparent activation energy (Ea, eV; 1 eV = 1.6 9 10�19 joule or 96 kJ mol�1) of genus-specific leaf litter breakdown isrelated to neither initial leaf litter content (%) of C, P, lignin, and cellulose nor ratios of C:P and N:P.
© 2017 John Wiley & Sons Ltd, Global Change Biology, doi: 10.1111/gcb.13609
12 J . J . FOLLSTAD SHAH et al.