Embed Size (px)
Citation preview
Kevin E TrenberthNCAR
Global warming:Coming ready or not!
Help!
NCAR Earth System LaboratoryNCAR is sponsored by NSF
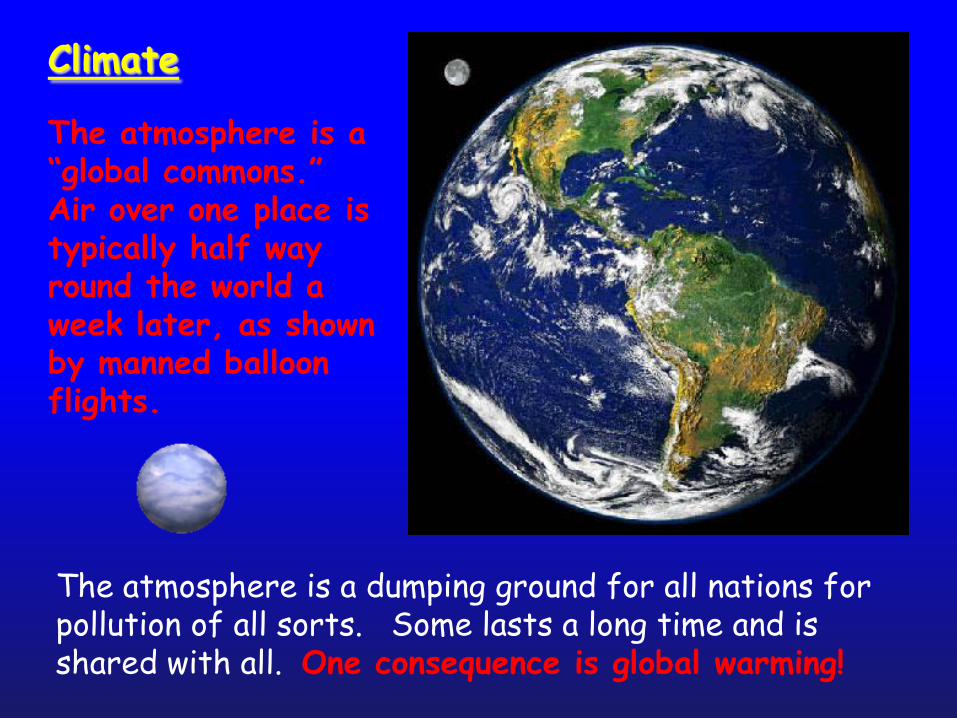
Climate
The atmosphere is a “global commons.”Air over one place is typically half way round the world a week later, as shown by manned balloon flights.
The atmosphere is a dumping ground for all nations for pollution of all sorts. Some lasts a long time and is shared with all. One consequence is global warming!
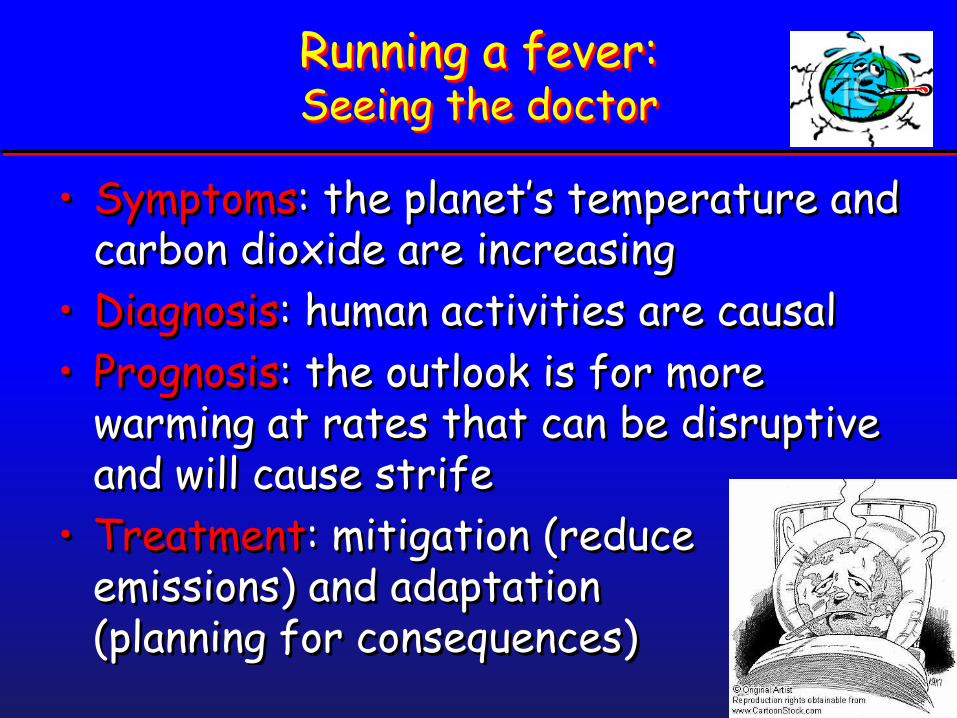
Running a fever:Seeing the doctor
• Symptoms: the planet’s temperature and carbon dioxide are increasing
• Diagnosis: human activities are causal• Prognosis: the outlook is for more
warming at rates that can be disruptive and will cause strife
• Treatment: mitigation (reduce emissions) and adaptation (planning for consequences)
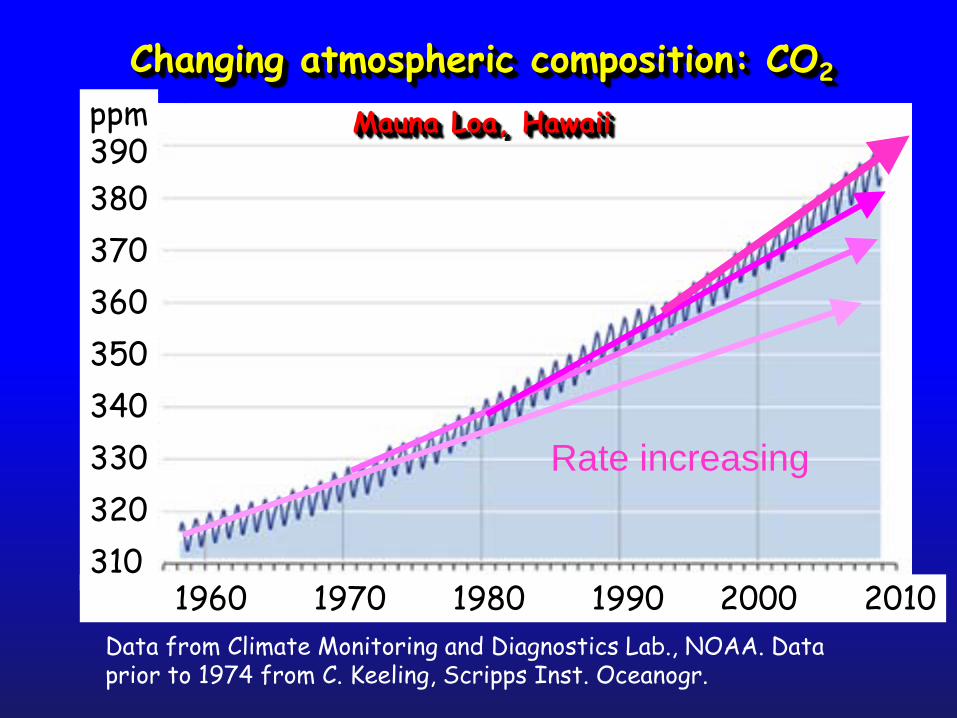
Data from Climate Monitoring and Diagnostics Lab., NOAA. Data prior to 1974 from C. Keeling, Scripps Inst. Oceanogr.
Changing atmospheric composition: CO2
Mauna Loa, Hawaii
Rate increasing
ppm390380370360350340330320310
1960 1970 1980 1990 . 2000 2010
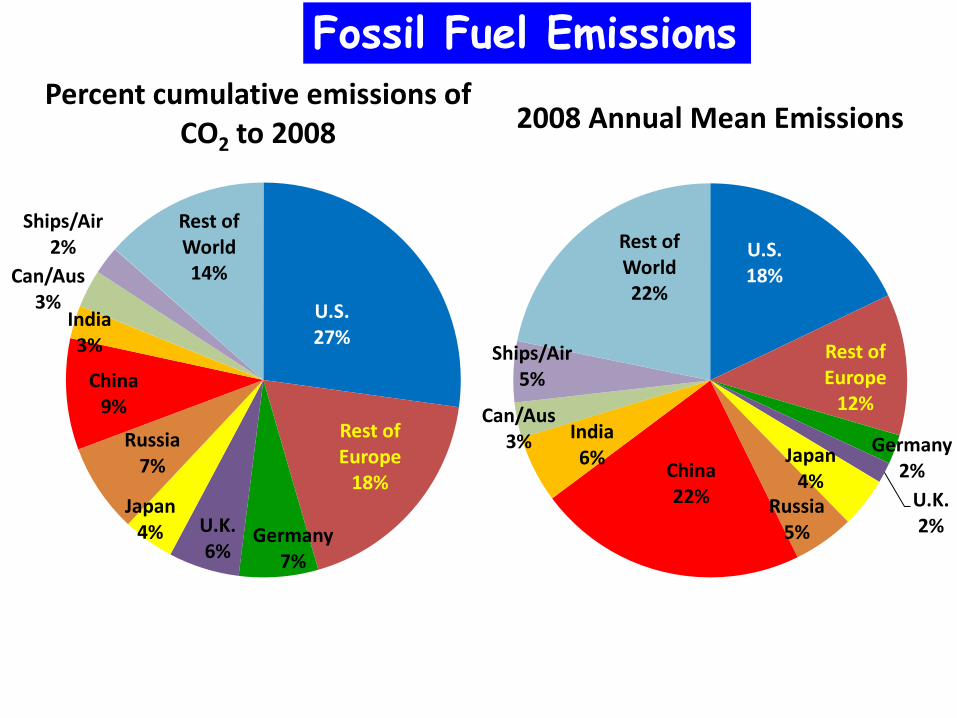
U.S.27%
Rest of Europe
18%
Germany7%
U.K.6%
Japan4%
Russia7%
China9%
India3%
Can/Aus3%
Ships/Air2%
Rest of World14%
Percent cumulative emissions of CO2 to 2008
U.S.18%
Rest of Europe
12%
Germany2%
U.K.2%
Japan4%
Russia5%
China22%
India6%
Can/Aus3%
Ships/Air5%
Rest of World22%
2008 Annual Mean Emissions
Fossil Fuel Emissions
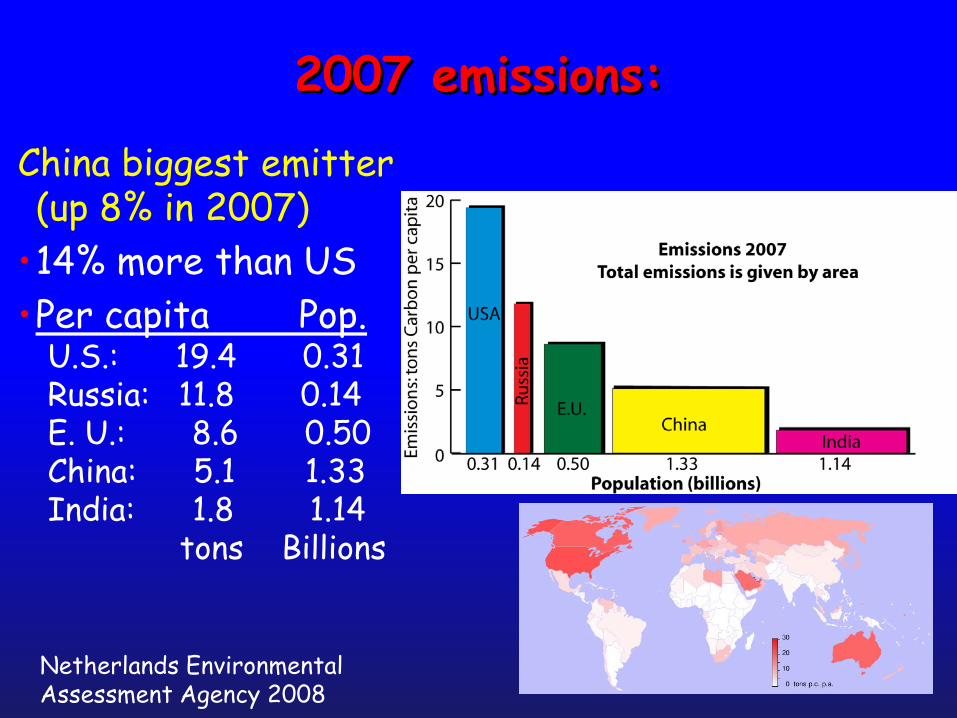
2007 emissions:
China biggest emitter (up 8% in 2007)
•14% more than US•Per capita Pop.
U.S.: 19.4 0.31Russia: 11.8 0.14E. U.: 8.6 0.50China: 5.1 1.33India: 1.8 1.14
tons Billions
Netherlands Environmental Assessment Agency 2008
0
5
10
15
20
25
30
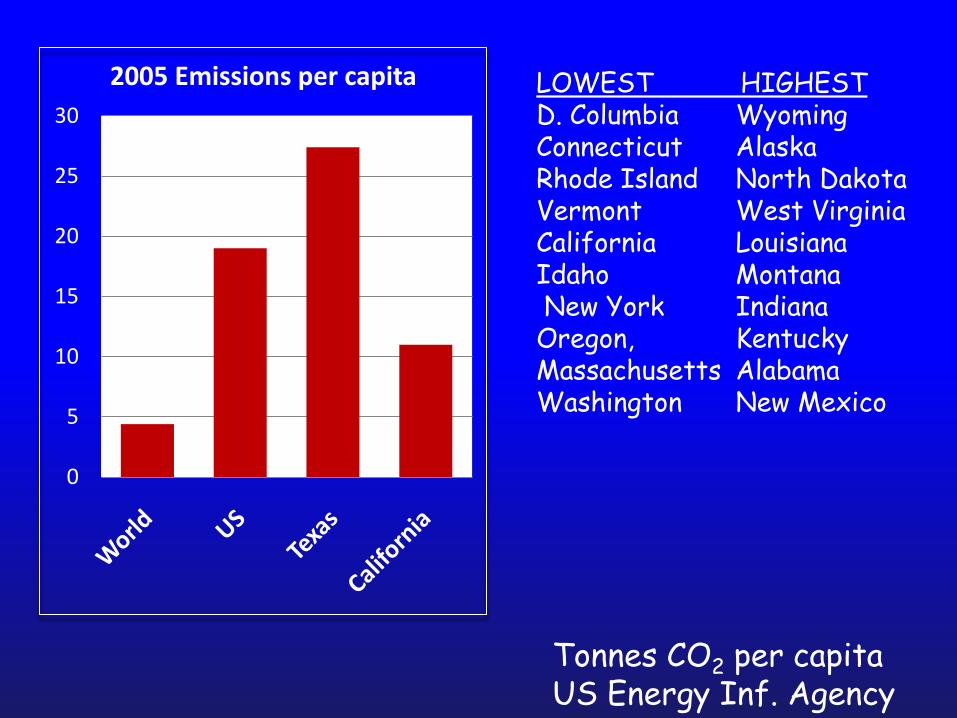
2005 Emissions per capita LOWEST HIGHESTD. Columbia Wyoming Connecticut AlaskaRhode Island North DakotaVermont West Virginia California LouisianaIdaho MontanaNew York Indiana Oregon, KentuckyMassachusetts AlabamaWashington New Mexico
Tonnes CO2 per capitaUS Energy Inf. Agency
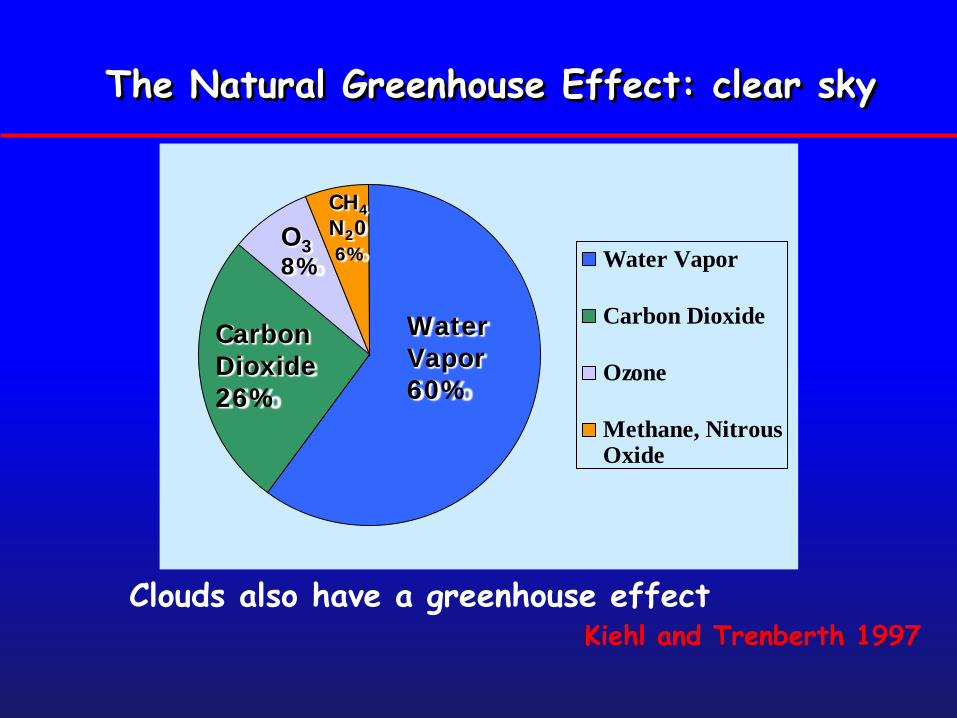
Water Vapor
Carbon Dioxide
Ozone
Methane, NitrousOxide
WaterVapor60%
CarbonDioxide26%
O38%
CH4N206%
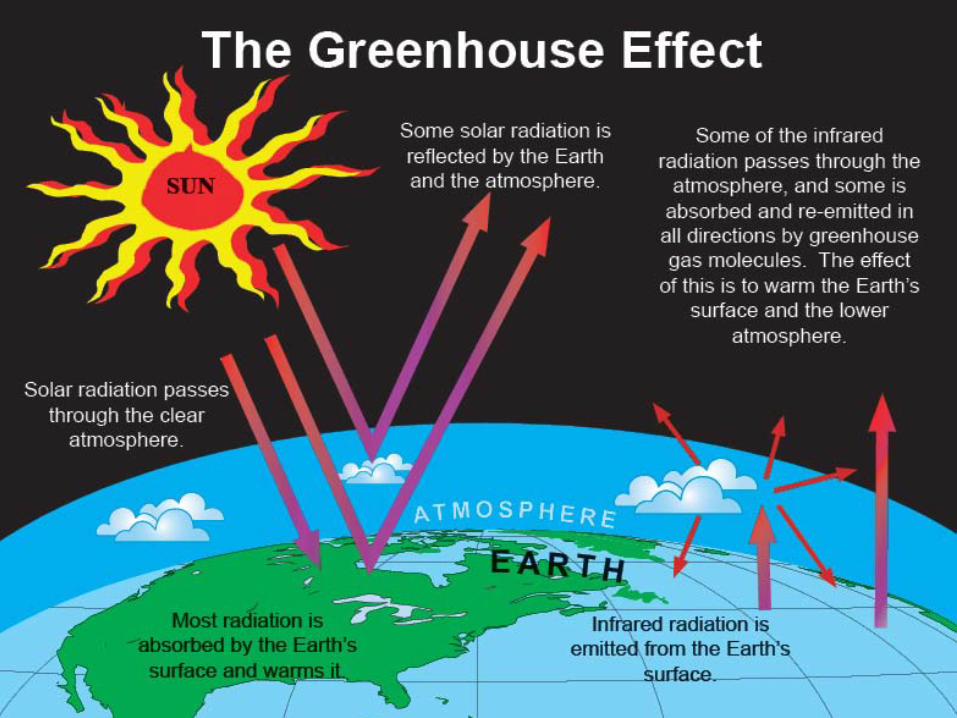
The Natural Greenhouse Effect: clear sky
Clouds also have a greenhouse effectKiehl and Trenberth 1997
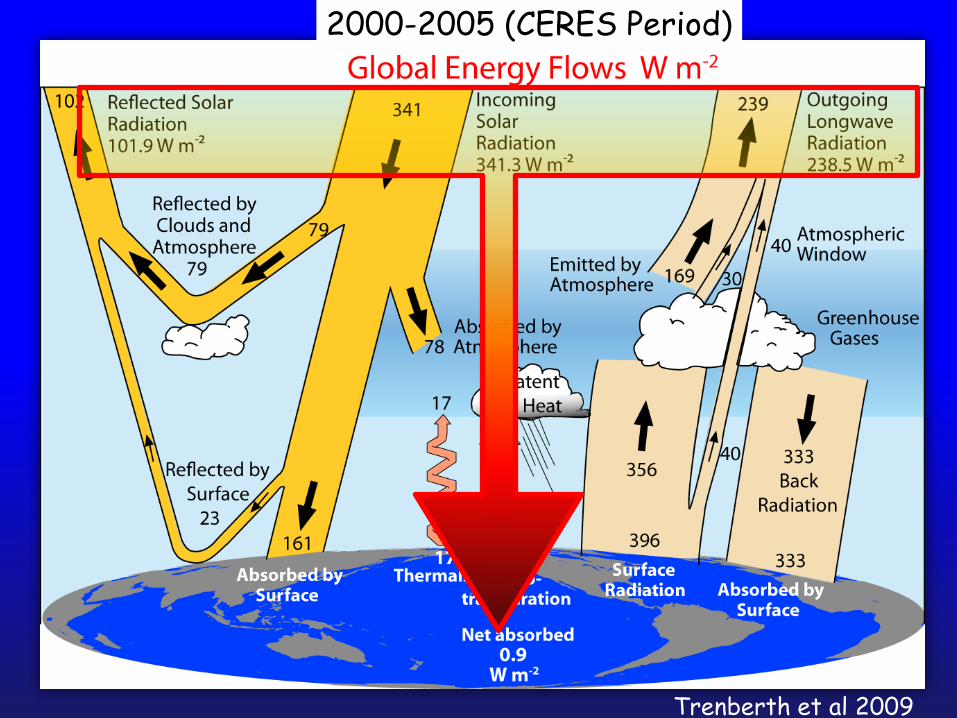
2000-2005 (CERES Period)
Trenberth et al 2009
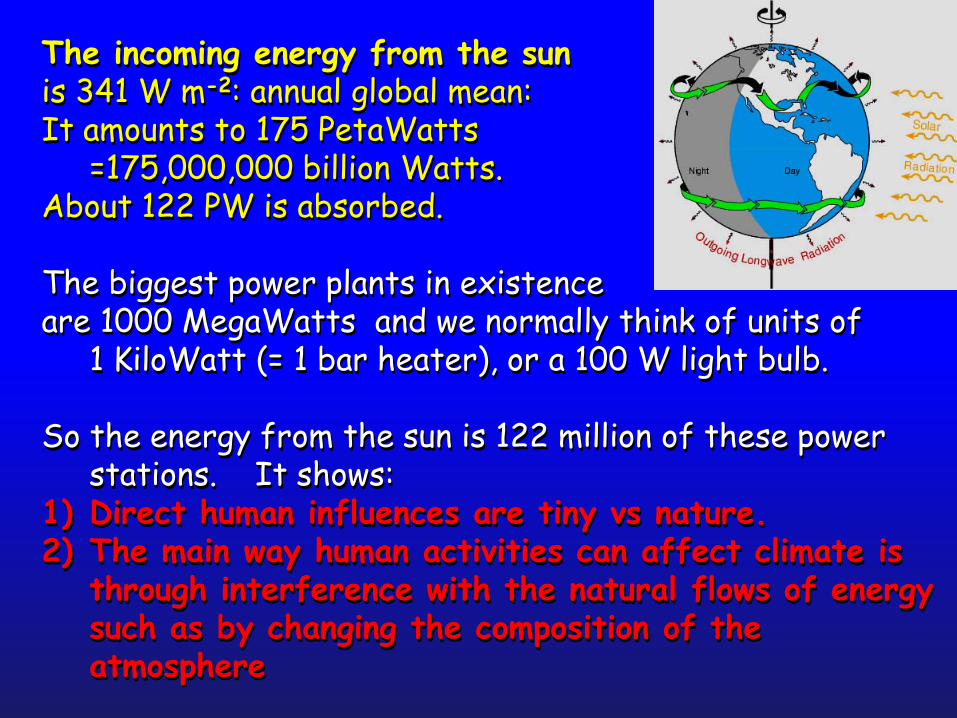
The incoming energy from the sunis 341 W m-2: annual global mean:It amounts to 175 PetaWatts
=175,000,000 billion Watts.About 122 PW is absorbed.
The biggest power plants in existence are 1000 MegaWatts and we normally think of units of
1 KiloWatt (= 1 bar heater), or a 100 W light bulb.
So the energy from the sun is 122 million of these power stations. It shows:
1) Direct human influences are tiny vs nature.2) The main way human activities can affect climate is
through interference with the natural flows of energy such as by changing the composition of the atmosphere
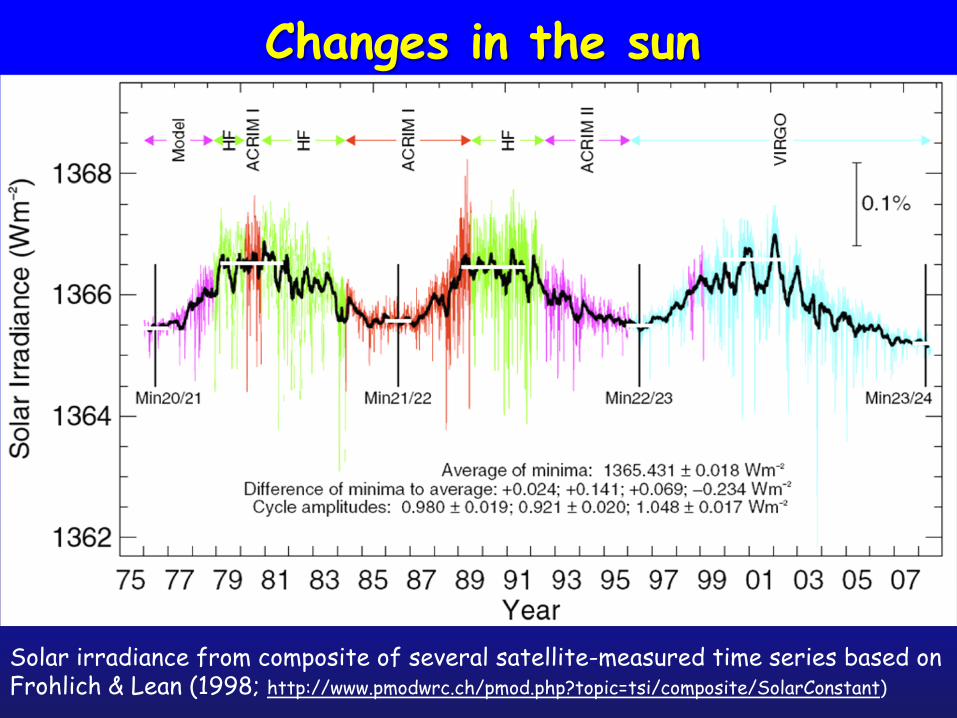
Solar irradiance from composite of several satellite-measured time series based on Frohlich & Lean (1998; http://www.pmodwrc.ch/pmod.php?topic=tsi/composite/SolarConstant)
Changes in the sun
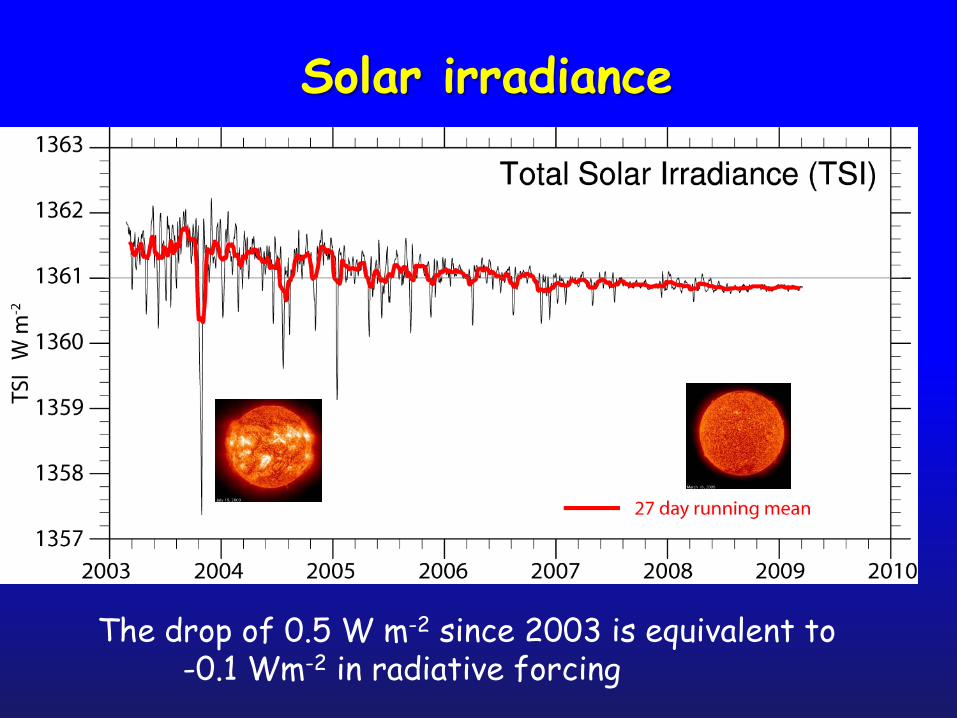
Solar irradiance
The drop of 0.5 W m-2 since 2003 is equivalent to -0.1 Wm-2 in radiative forcing
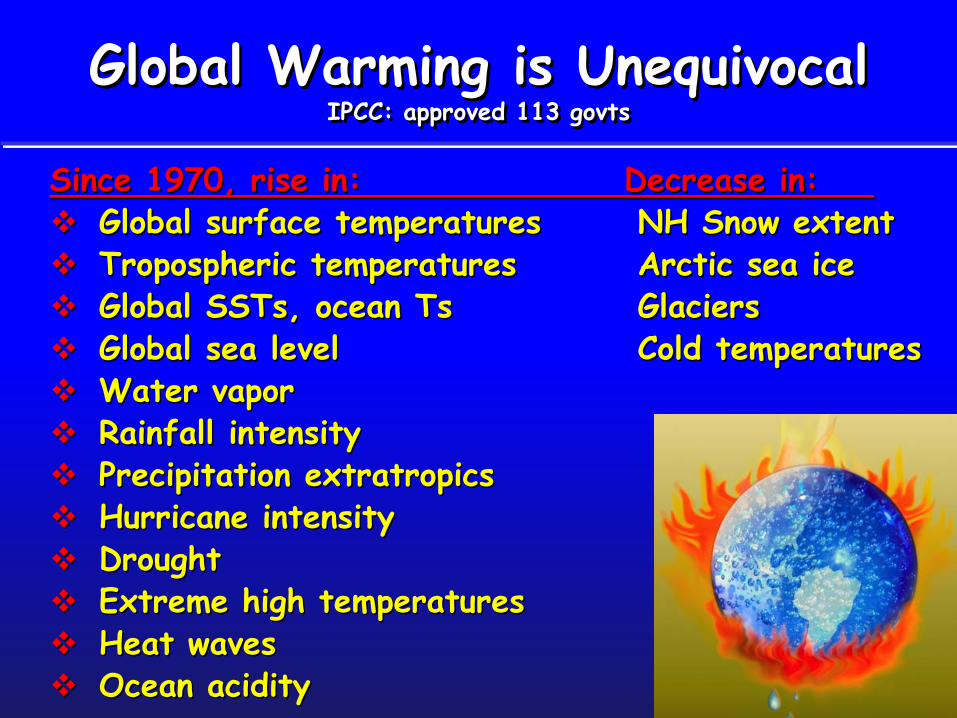
Global Warming is UnequivocalIPCC: approved 113 govts
Since 1970, rise in: Decrease in: Global surface temperatures NH Snow extent Tropospheric temperatures Arctic sea ice Global SSTs, ocean Ts Glaciers Global sea level Cold temperatures Water vapor Rainfall intensity Precipitation extratropics Hurricane intensity Drought Extreme high temperatures Heat waves Ocean acidity
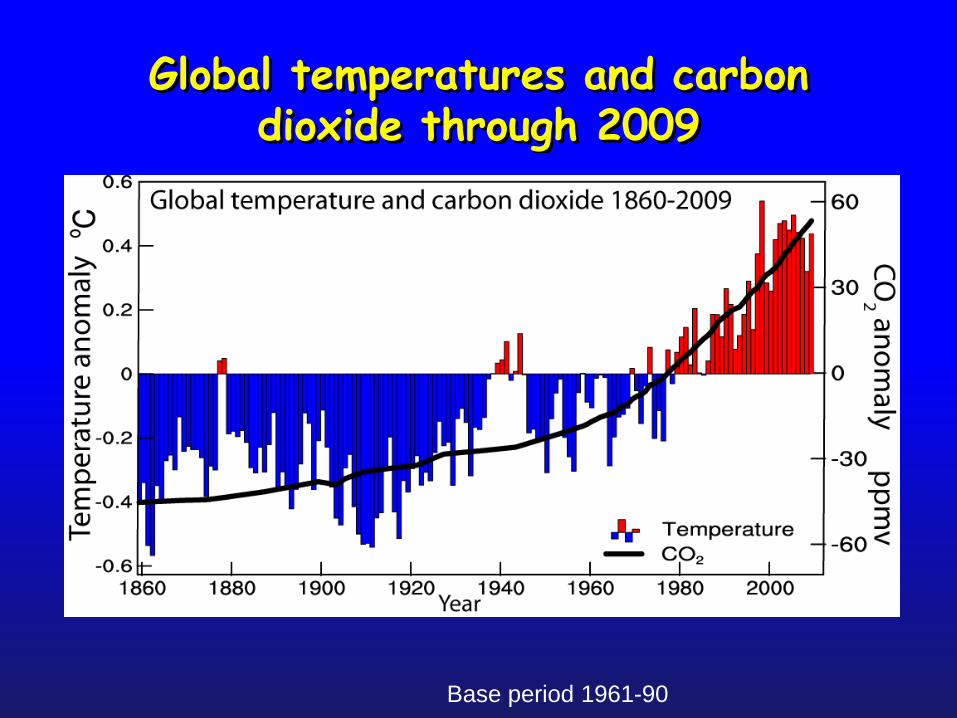
Global temperatures and carbon dioxide through 2009
Base period 1961-90
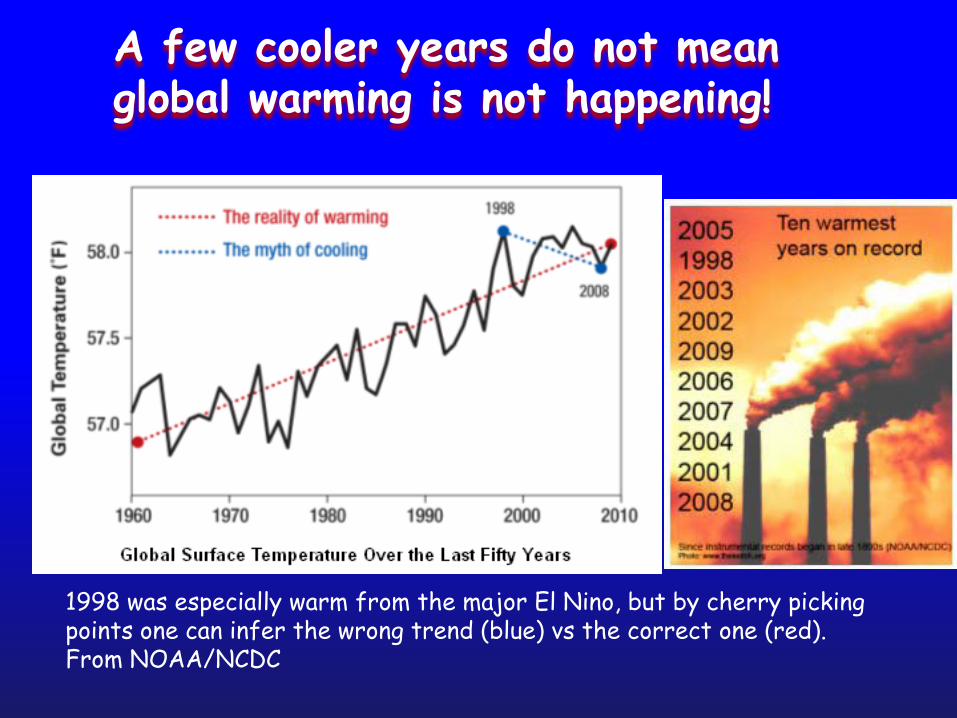
A few cooler years do not mean global warming is not happening!
1998 was especially warm from the major El Nino, but by cherry picking points one can infer the wrong trend (blue) vs the correct one (red).From NOAA/NCDC
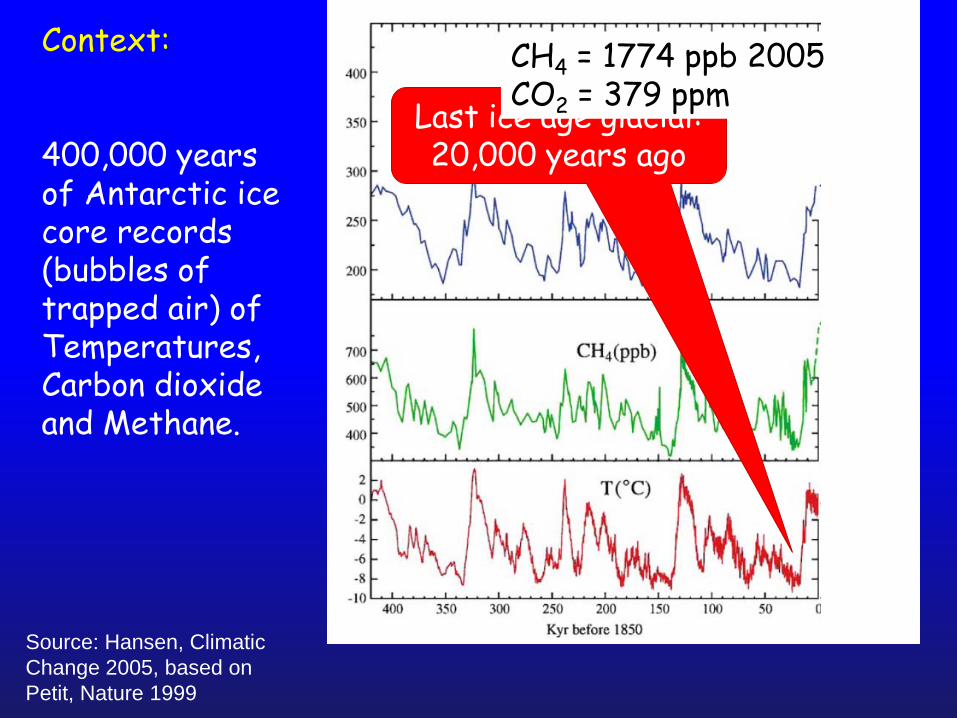
Source: Hansen, Climatic Change 2005, based on Petit, Nature 1999
Context:
400,000 years of Antarctic ice core records (bubbles of trapped air) of Temperatures, Carbon dioxide and Methane.
Last ice age glacial:20,000 years ago
CH4 = 1774 ppb 2005CO2 = 379 ppm
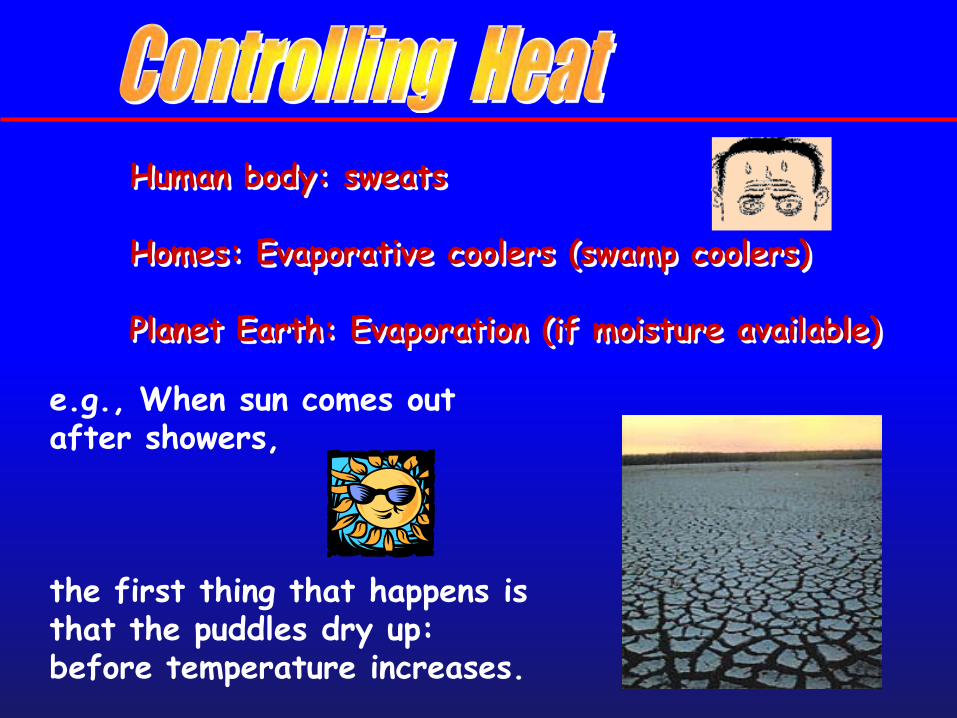
Human body: sweats
Homes: Evaporative coolers (swamp coolers)
Planet Earth: Evaporation (if moisture available)
e.g., When sun comes out after showers,
the first thing that happens is that the puddles dry up: before temperature increases.
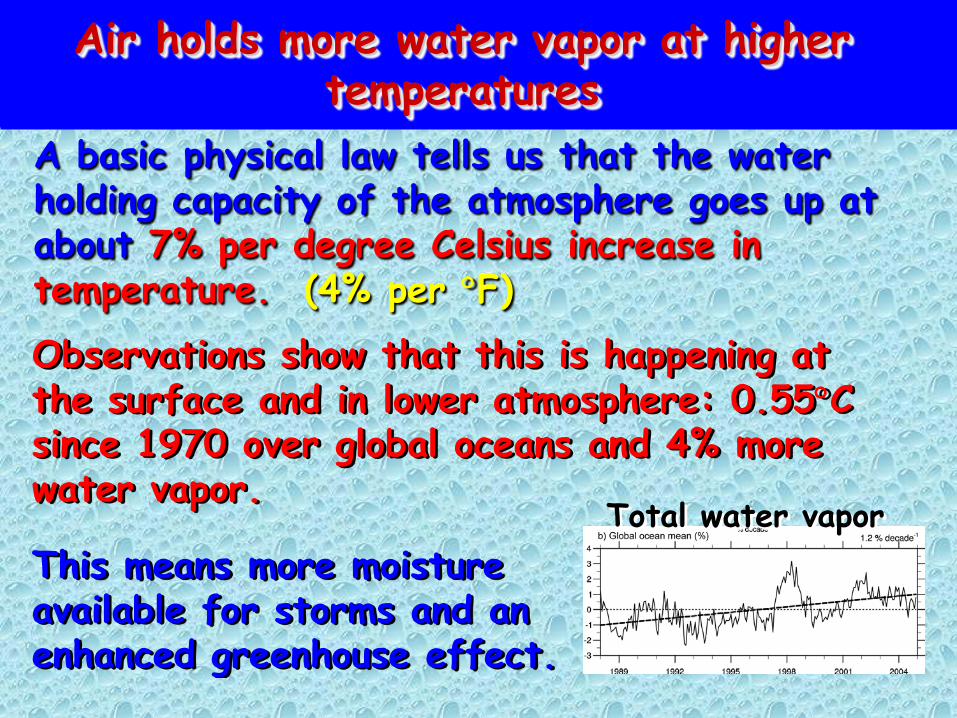
Air holds more water vapor at higher temperatures
Total water vapor
Observations show that this is happening at the surface and in lower atmosphere: 0.55°C since 1970 over global oceans and 4% more water vapor.
This means more moisture available for storms and an enhanced greenhouse effect.
A basic physical law tells us that the water holding capacity of the atmosphere goes up at about 7% per degree Celsius increase in temperature. (4% per °F)
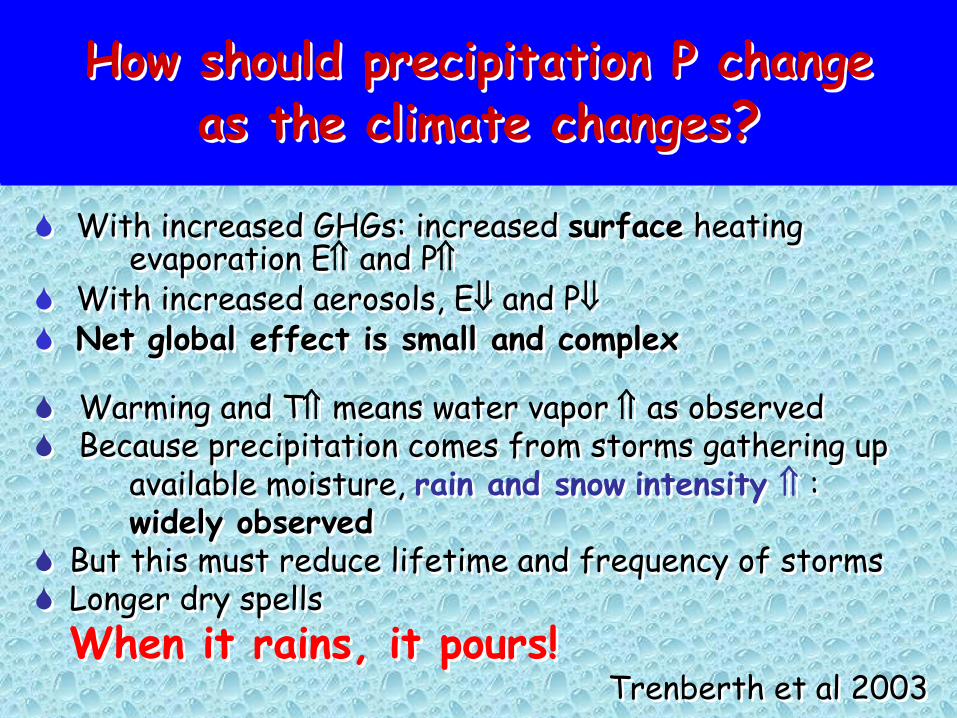
How should precipitation P change as the climate changes?
With increased GHGs: increased surface heating evaporation E⇑ and P⇑
With increased aerosols, E⇓ and P⇓ Net global effect is small and complex
Warming and T⇑ means water vapor ⇑ as observed Because precipitation comes from storms gathering up
available moisture, rain and snow intensity ⇑ : widely observed
But this must reduce lifetime and frequency of storms Longer dry spellsWhen it rains, it pours!
Trenberth et al 2003
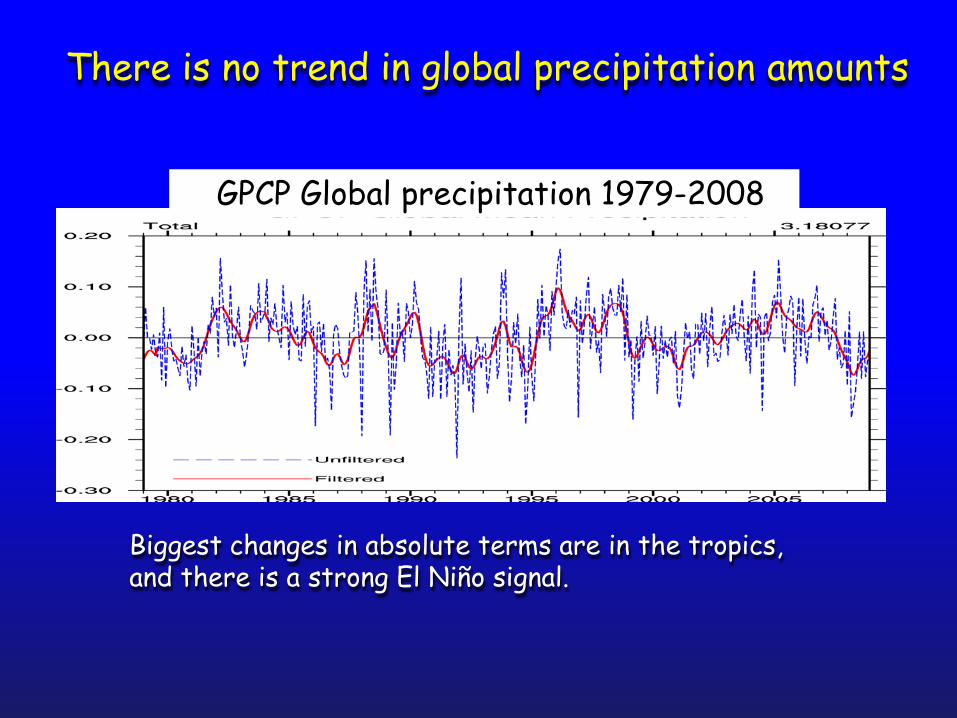
GPCP Global precipitation 1979-2008
Biggest changes in absolute terms are in the tropics, and there is a strong El Niño signal.
There is no trend in global precipitation amounts
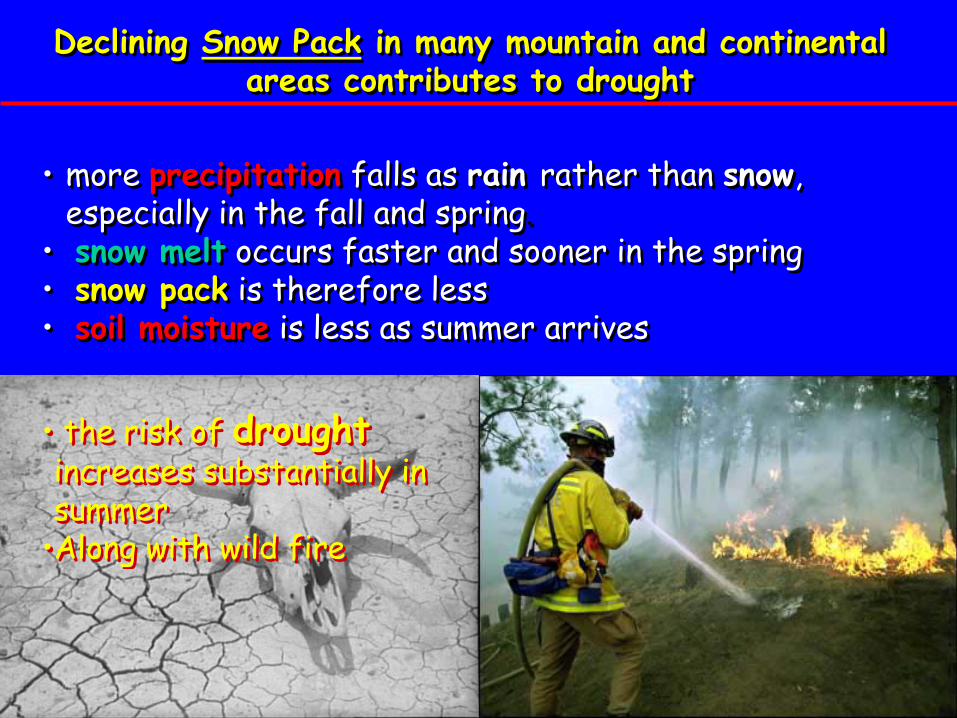
• more precipitation falls as rain rather than snow, especially in the fall and spring.
• snow melt occurs faster and sooner in the spring• snow pack is therefore less• soil moisture is less as summer arrives
• the risk of droughtincreases substantially in summer
•Along with wild fire
Declining Snow Pack in many mountain and continental areas contributes to drought
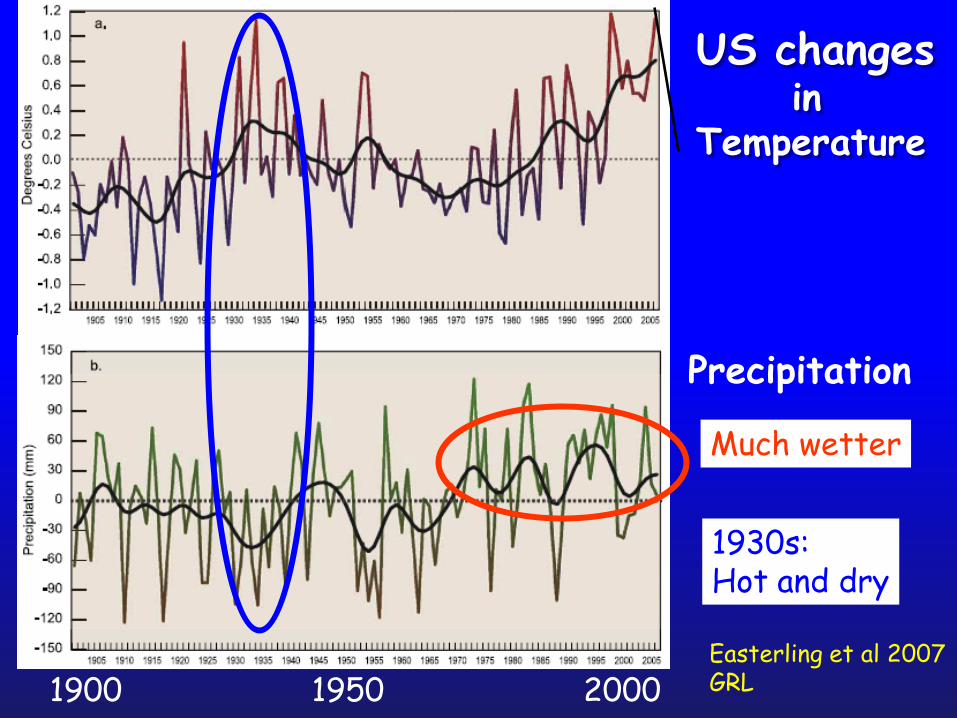
US changesin
Temperature
Much wetter
1930s:Hot and dry
1900 1950 2000Easterling et al 2007GRL
Precipitation
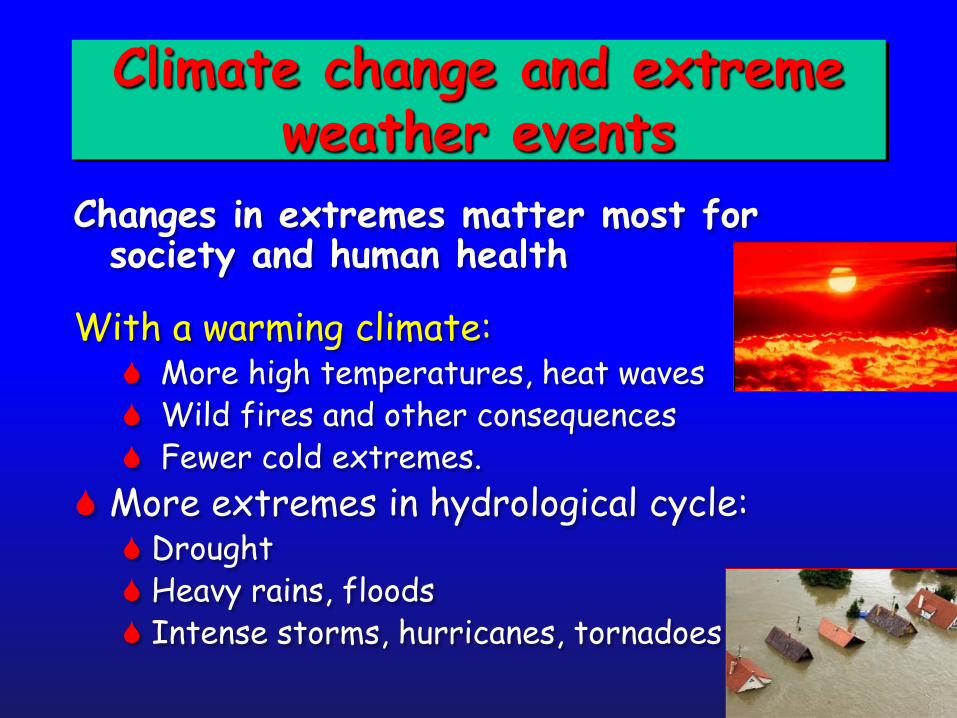
Climate change and extreme weather events
Changes in extremes matter most for society and human health
With a warming climate: More high temperatures, heat waves Wild fires and other consequences Fewer cold extremes.
More extremes in hydrological cycle: Drought Heavy rains, floods Intense storms, hurricanes, tornadoes
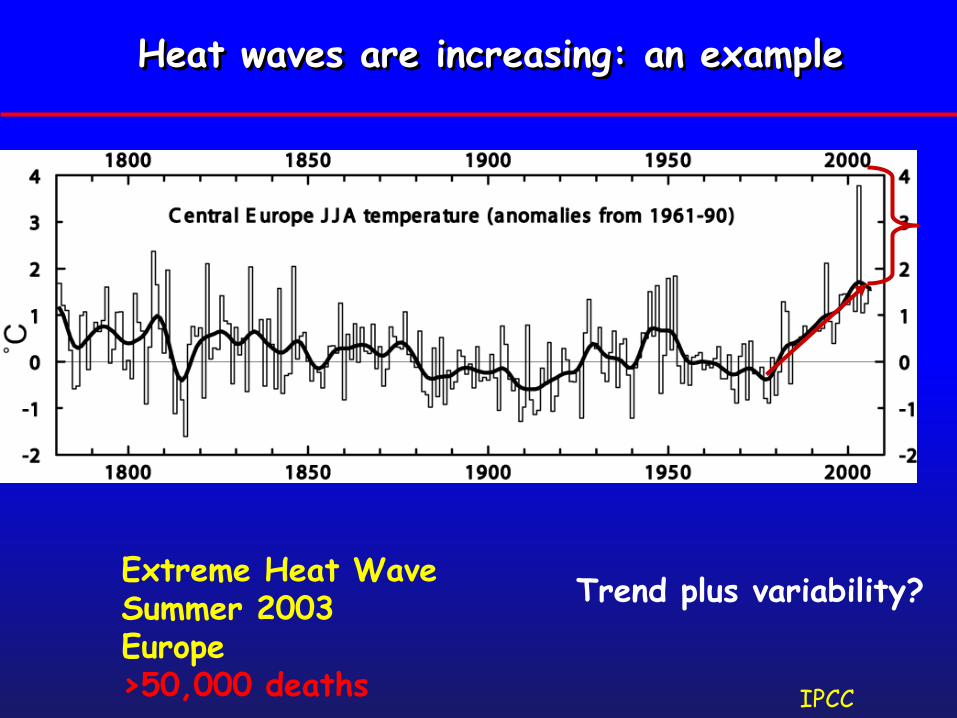
Extreme Heat WaveSummer 2003Europe>50,000 deaths
Heat waves are increasing: an example
Trend plus variability?
IPCC
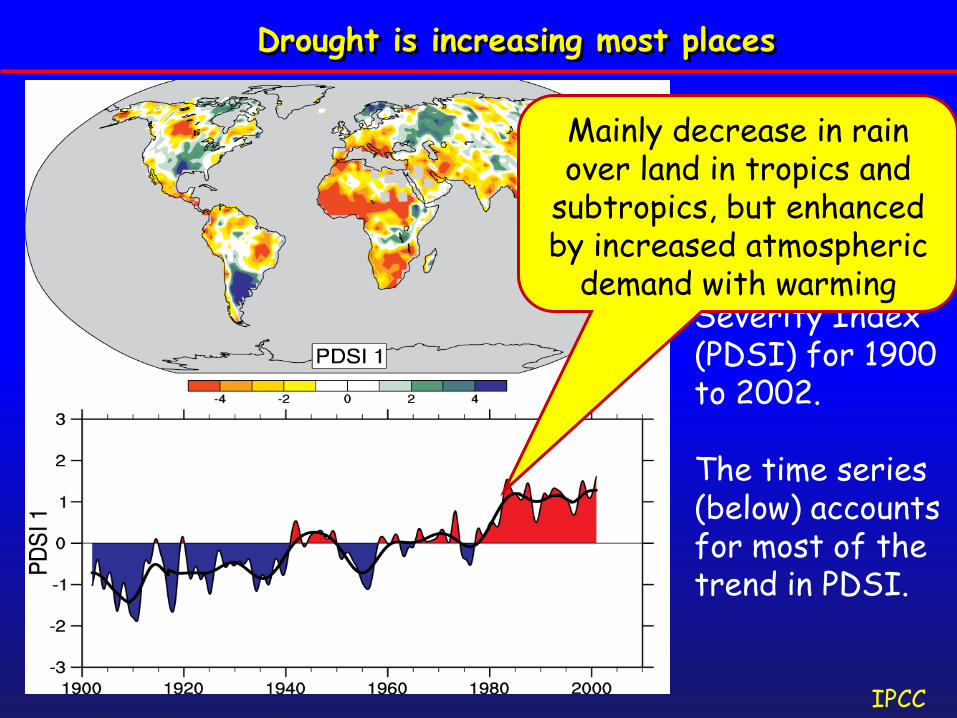
The most important spatial pattern (top) of the monthly Palmer Drought Severity Index (PDSI) for 1900 to 2002.
The time series (below) accounts for most of the trend in PDSI.
Drought is increasing most places
Mainly decrease in rain over land in tropics and
subtropics, but enhanced by increased atmospheric
demand with warming
IPCC
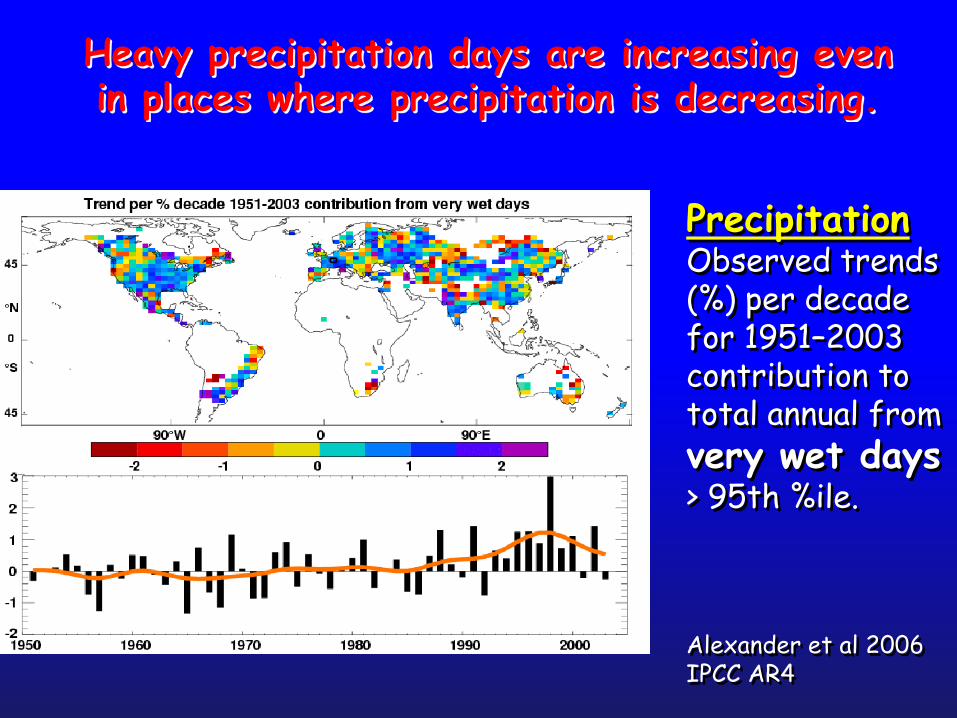
PrecipitationObserved trends (%) per decade for 1951–2003 contribution to total annual from very wet days> 95th %ile.
Alexander et al 2006IPCC AR4
Heavy precipitation days are increasing even in places where precipitation is decreasing.
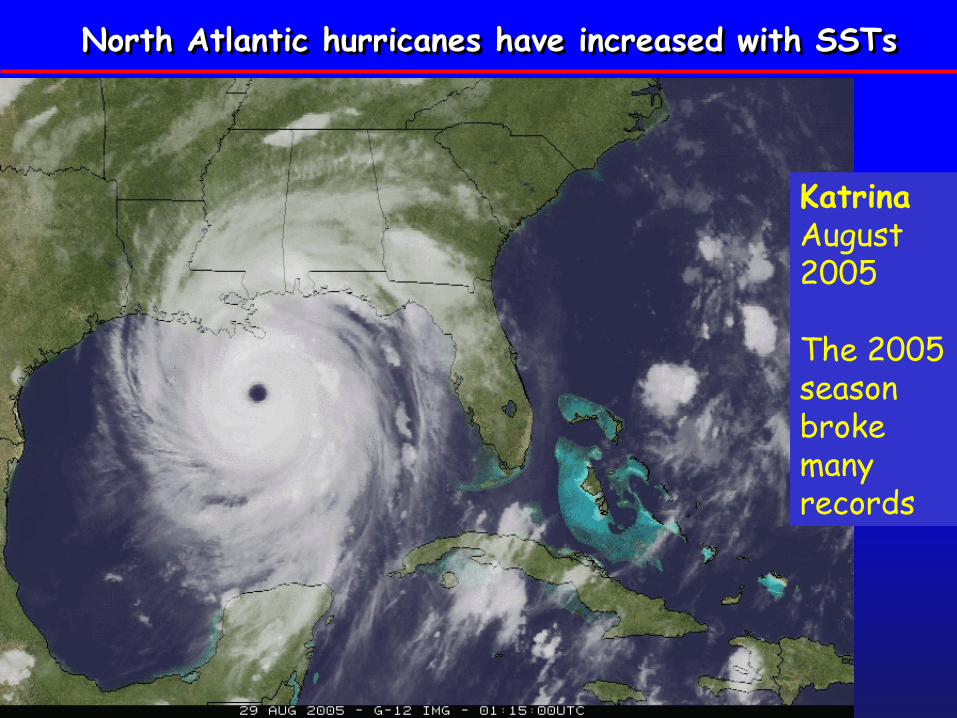
North Atlantic hurricanes have increased with SSTs
Katrina August 2005
The 2005 season broke many records
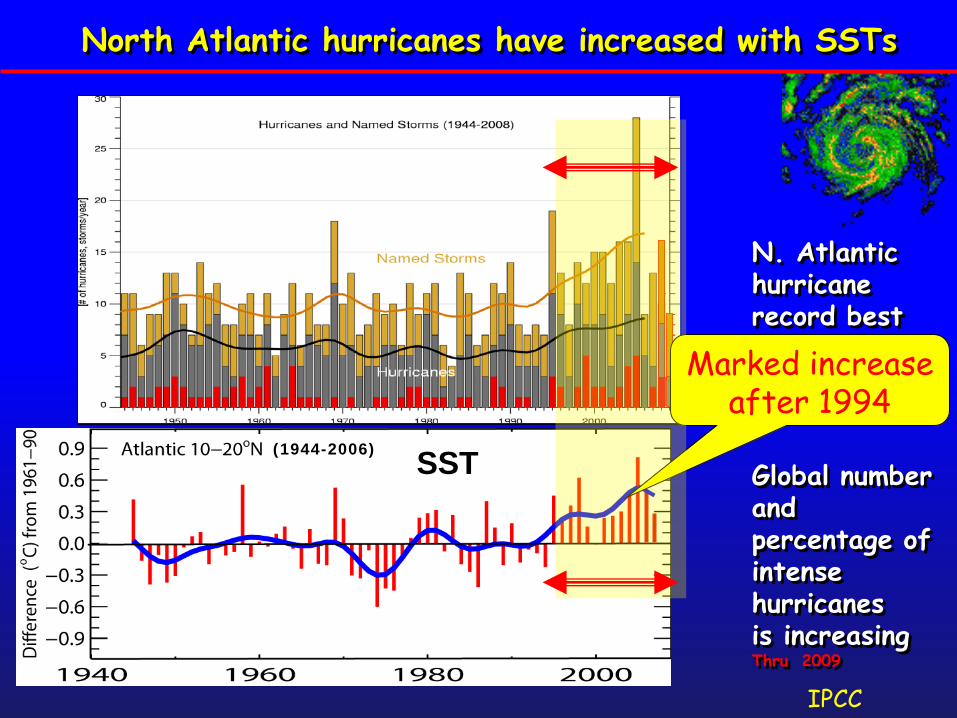
N. Atlantic hurricane record best after 1944 with aircraft surveillance.
Global number and percentage of intense hurricanes is increasingThru 2009
North Atlantic hurricanes have increased with SSTs
SST(1944-2006)
IPCC
Marked increase after 1994
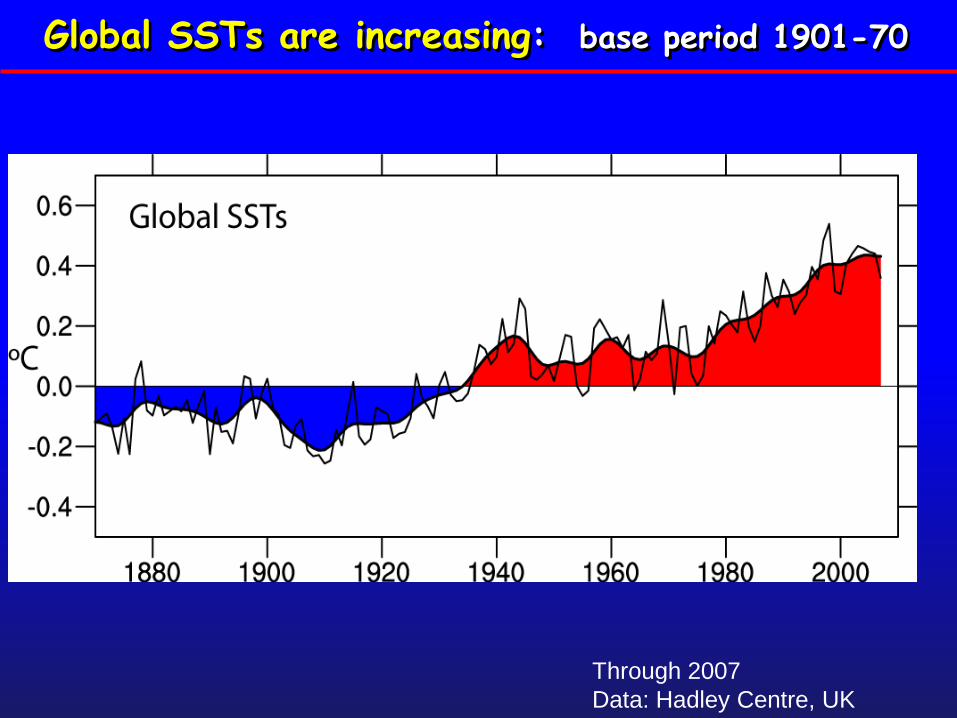
Global SSTs are increasing: base period 1901-70
Through 2007Data: Hadley Centre, UK
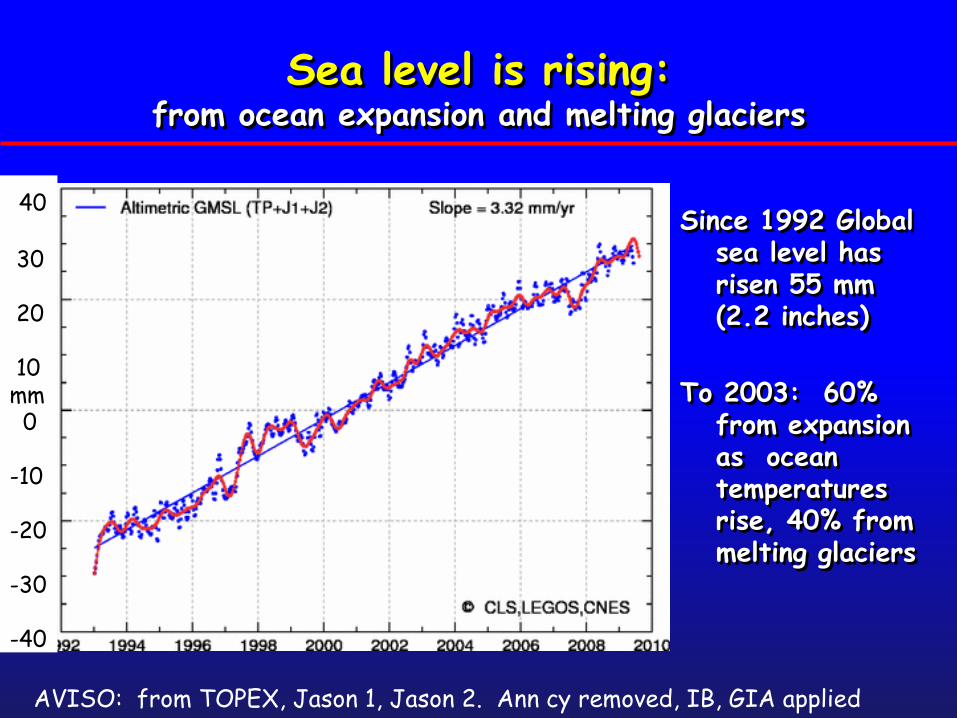
Sea level is rising:from ocean expansion and melting glaciers
Since 1992 Global sea level has risen 55 mm (2.2 inches)
To 2003: 60% from expansion as ocean temperatures rise, 40% from melting glaciers
AVISO: from TOPEX, Jason 1, Jason 2. Ann cy removed, IB, GIA applied
40
30
20
10mm0
-10
-20
-30
-40
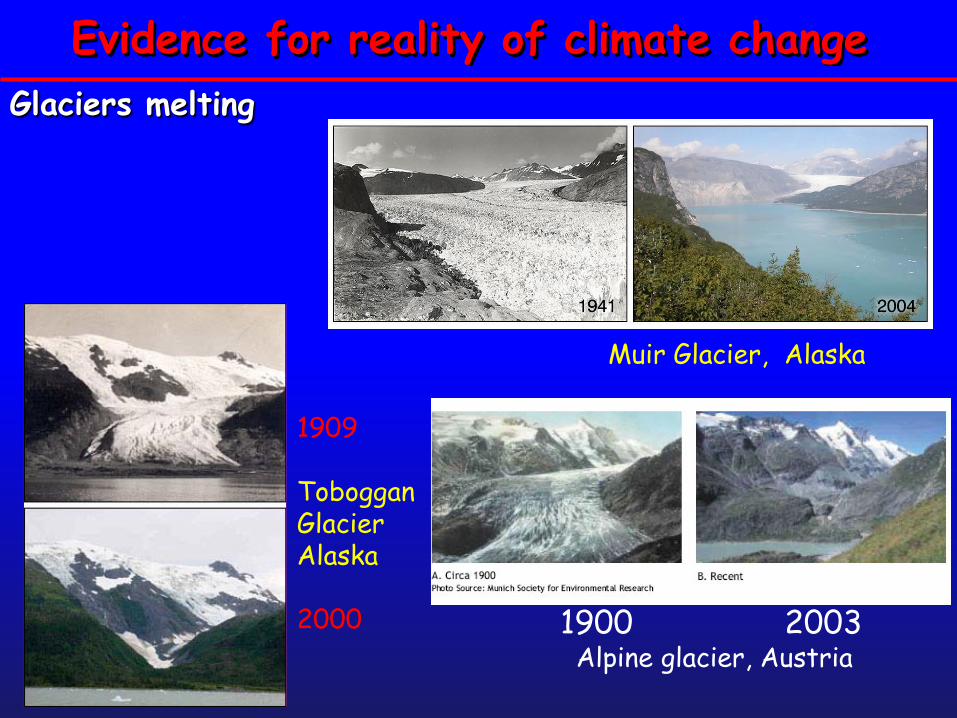
Evidence for reality of climate changeGlaciers melting
1900 2003Alpine glacier, Austria
1909
TobogganGlacierAlaska
2000
Muir Glacier, Alaska
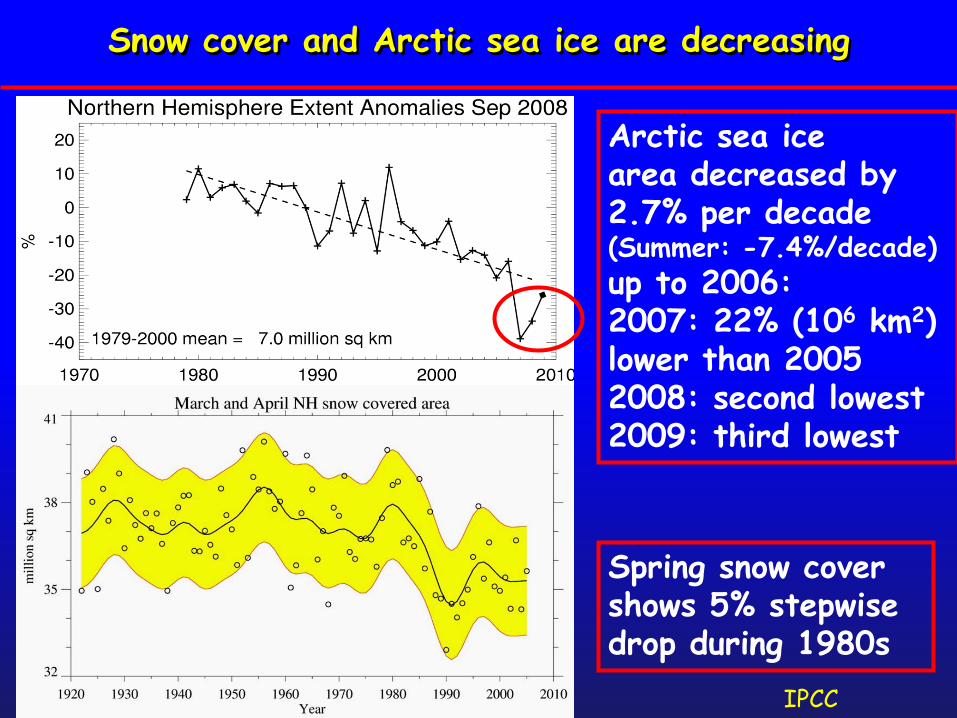
Snow cover and Arctic sea ice are decreasing
Spring snow covershows 5% stepwise drop during 1980s
Arctic sea ice area decreased by 2.7% per decade(Summer: -7.4%/decade)up to 2006:2007: 22% (106 km2) lower than 20052008: second lowest2009: third lowest
IPCC
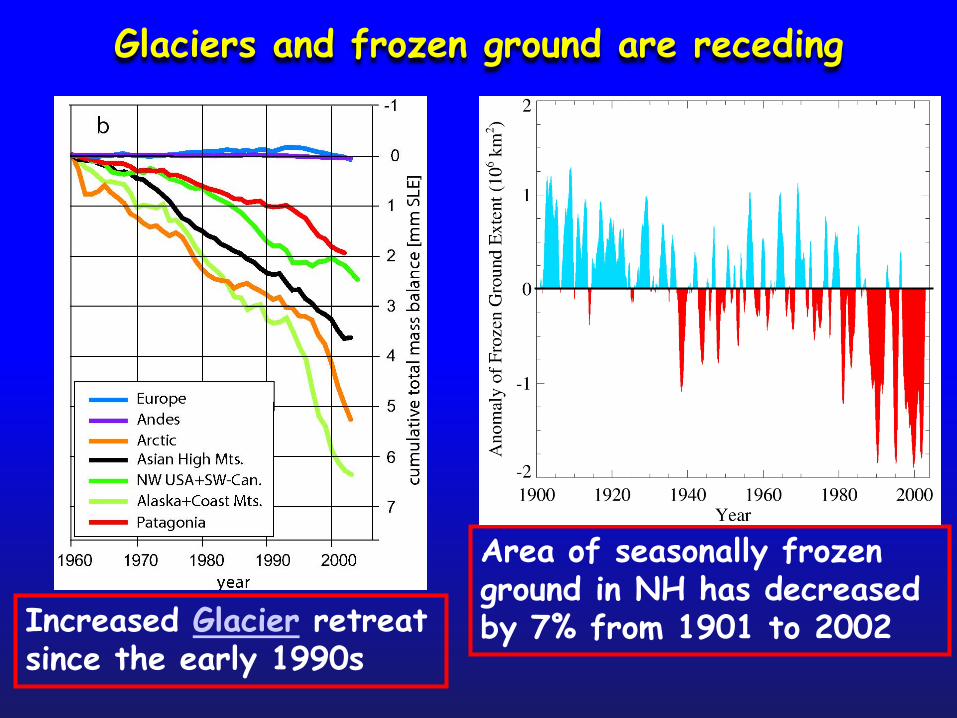
Glaciers and frozen ground are receding
Increased Glacier retreat since the early 1990s
Area of seasonally frozen ground in NH has decreasedby 7% from 1901 to 2002
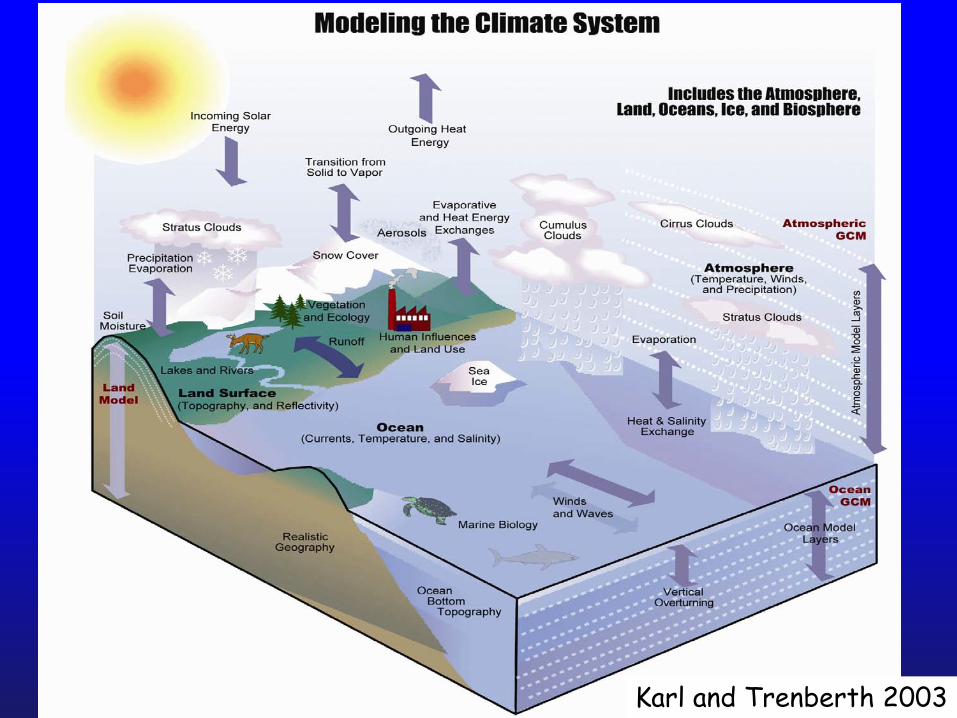
Karl and Trenberth 2003
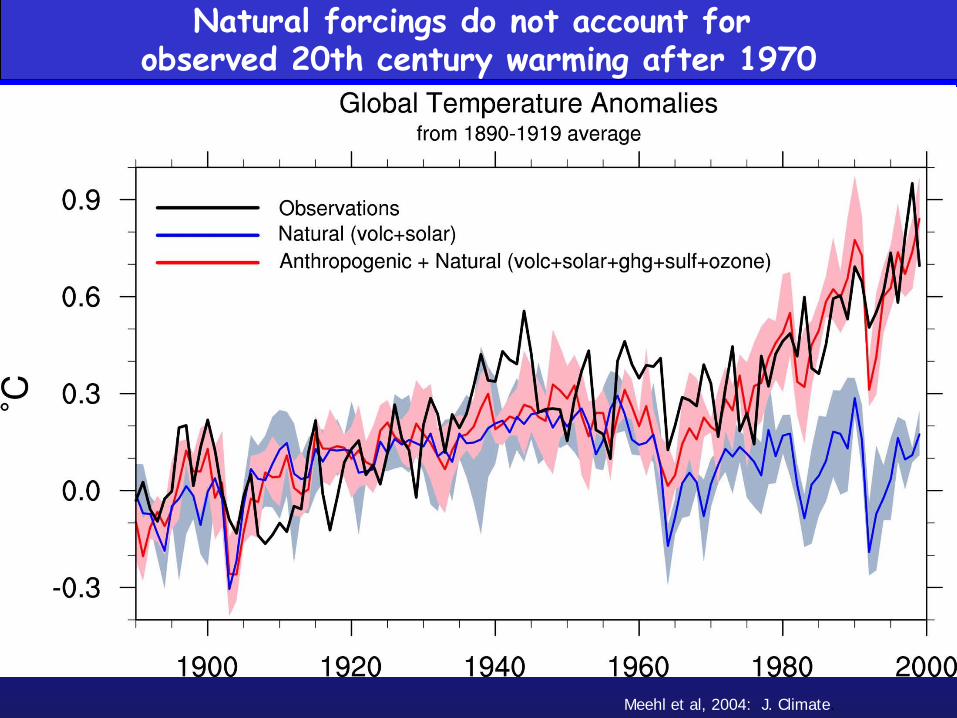
Natural forcings do not account for observed 20th century warming after 1970
Meehl et al, 2004: J. Climate.
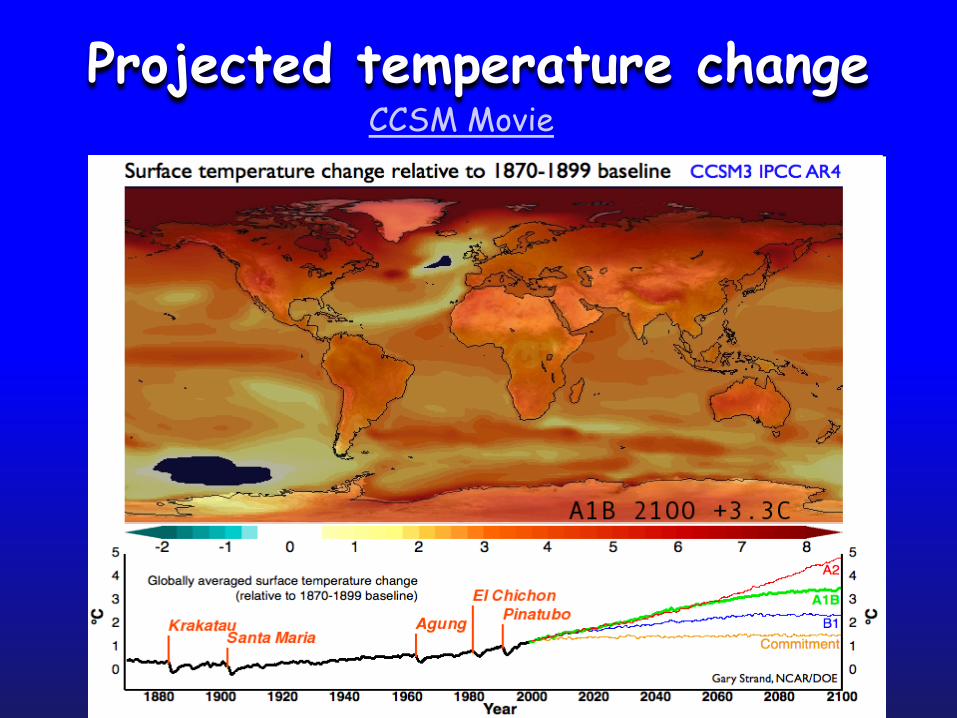
Projected temperature changeCCSM Movie
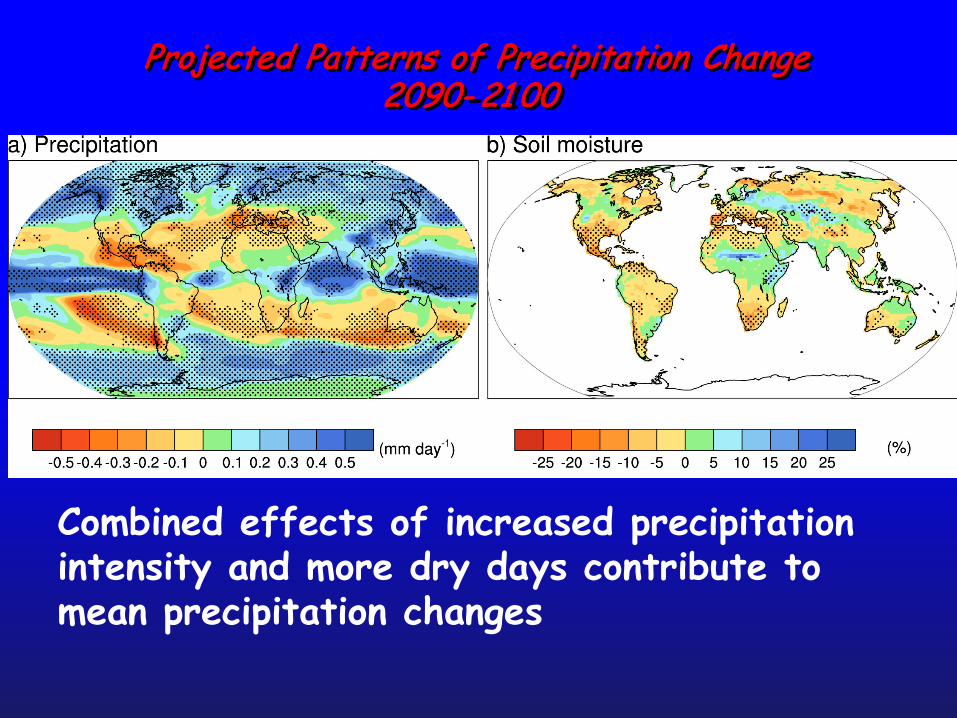
Combined effects of increased precipitation intensity and more dry days contribute to mean precipitation changes
Projected Patterns of Precipitation Change2090- 21 00
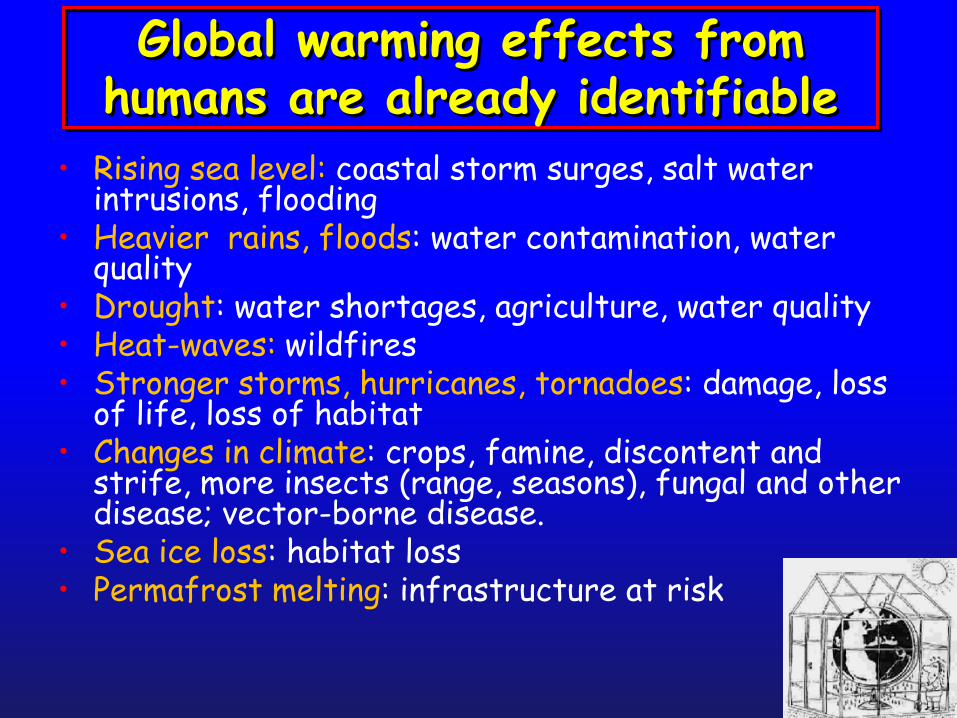
Global warming effects from humans are already identifiable
• Rising sea level: coastal storm surges, salt water intrusions, flooding
• Heavier rains, floods: water contamination, water quality
• Drought: water shortages, agriculture, water quality• Heat-waves: wildfires• Stronger storms, hurricanes, tornadoes: damage, loss
of life, loss of habitat• Changes in climate: crops, famine, discontent and
strife, more insects (range, seasons), fungal and other disease; vector-borne disease.
• Sea ice loss: habitat loss• Permafrost melting: infrastructure at risk
Multi-dimensional problem
• Environmental• Economic• Human strife• Trade (tariffs)• Foreign policy• Security• Sustainability
Security and Climate Change9 Aug 2009
• "We will pay for this one way or another. We will pay to reduce greenhouse gas emissions today, and we’ll have to take an economic hit of some kind. Or we will pay the price later in military terms. And that will involve human lives."
GEN. ANTHONY C. ZINNI, former head of the Central Command, on climate change.
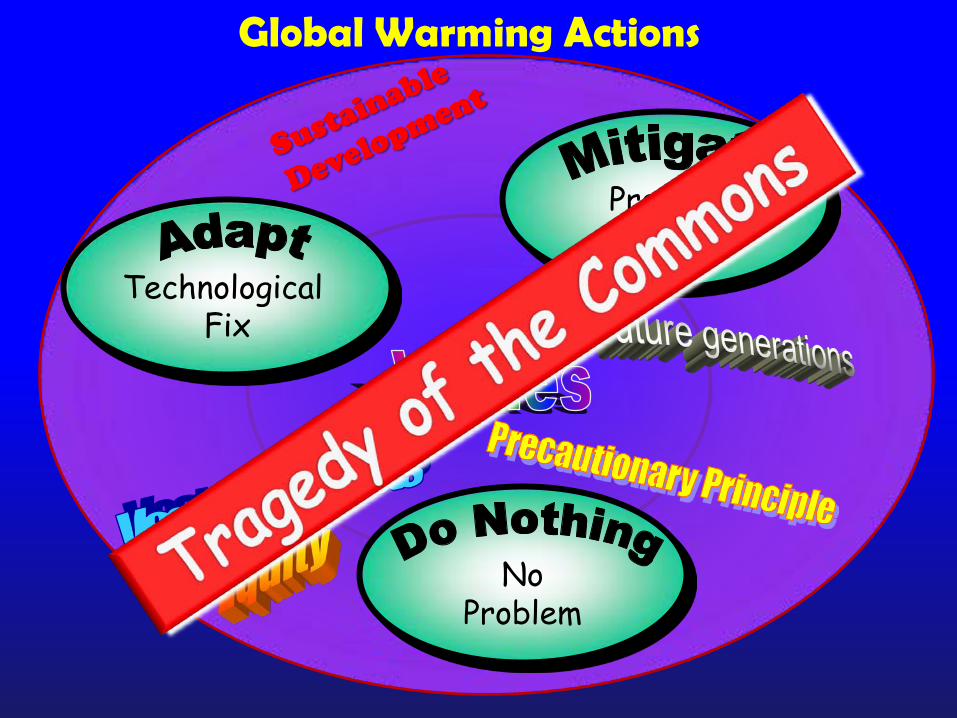
PreventProblem
NoProblem
Technological Fix
Global Warming Actions
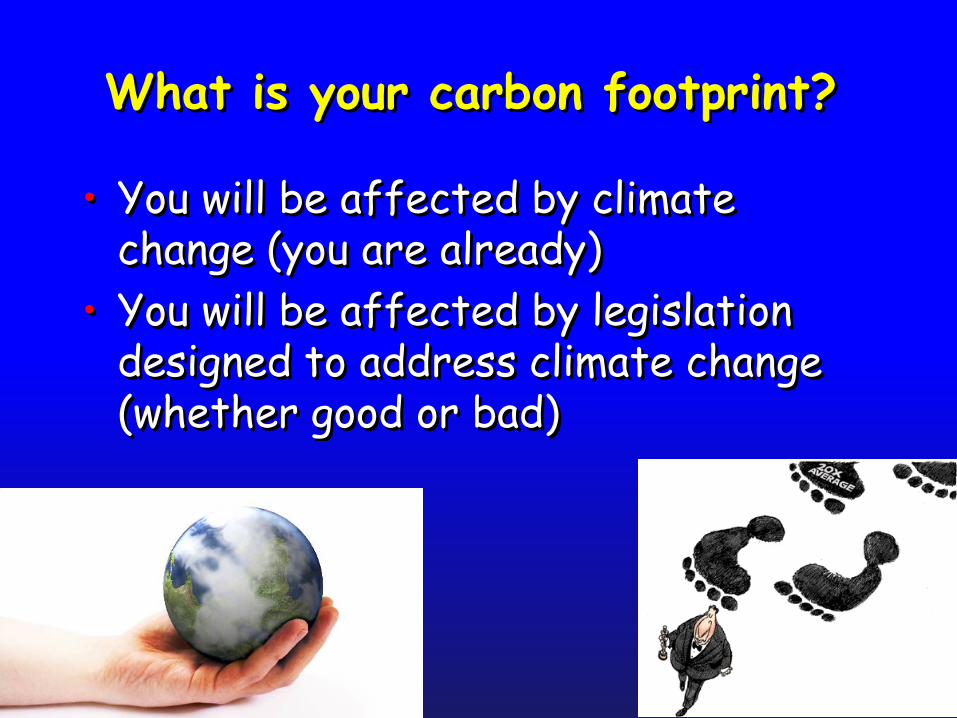
What is your carbon footprint?
• You will be affected by climate change (you are already)
• You will be affected by legislation designed to address climate change (whether good or bad)

GoingGreen!
Many things you can do:
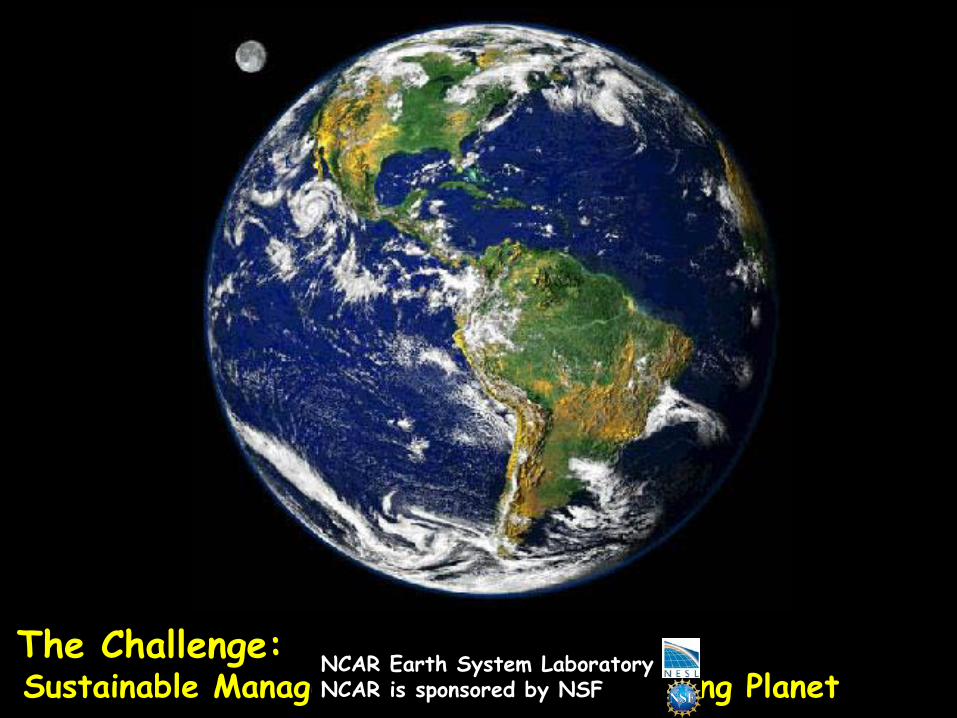
The Challenge: Sustainable Management of an Ever-Changing Planet
NCAR Earth System LaboratoryNCAR is sponsored by NSF


![[HKDUG] #20151017 - BarCamp 2015 - Drupal 8 is Coming! Are You Ready?](https://img.pdfslide.net/doc/110x75/58eebed41a28abb84f8b4657/hkdug-20151017-barcamp-2015-drupal-8-is-coming-are-you-ready.jpg)