Embed Size (px)
Citation preview
animals
Article
Possibility of Autonomous Estimation of ShibaGoat’s Estrus and Non-Estrus Behavior by MachineLearning Methods
Toshiya Arakawa †
Department of Mechanical Systems Engineering, Aichi University of Technology,Gamagori-shi, Aichi 443-0047, Japan; [email protected]; Tel.: +81-533-68-1135† Current address: 50-2, Manori, Nishihasama-cho, Gamagori-shi, Aichi 443-0047, Japan.
Received: 12 March 2020; Accepted: 27 April 2020; Published: 29 April 2020�����������������
Simple Summary: Direct observation of mammalian behavior requires a substantial amount of effortand time, particularly if the number of animals to be observed is sufficiently large or if the observationis conducted for a prolonged period. In this study, different machine learning methods were appliedto detect and estimate whether a goat is in estrus, based on the goat’s behavior. The percentageconcordance (PC) of their behavior, based on tracking data and human observations, was evaluated.The results establish that HMM is an adequate method from the viewpoints of estimation, statistical,and time series modeling. In this experiment, neural network did not seem to be adequate method,however, if the more goat’s data were acquired, neural network would be an adequate methodfor estimation.
Abstract: Mammalian behavior is typically monitored by observation. However, direct observationrequires a substantial amount of effort and time, if the number of mammals to be observed issufficiently large or if the observation is conducted for a prolonged period. In this study, machinelearning methods as hidden Markov models (HMMs), random forests, support vector machines(SVMs), and neural networks, were applied to detect and estimate whether a goat is in estrus basedon the goat’s behavior; thus, the adequacy of the method was verified. Goat’s tracking data wasobtained using a video tracking system and used to estimate whether they, which are in “estrus” or“non-estrus”, were in either states: “approaching the male”, or “standing near the male”. Totally,the PC of random forest seems to be the highest. However, The percentage concordance (PC) valuebesides the goats whose data were used for training data sets is relatively low. It is suggested thatrandom forest tend to over-fit to training data. Besides random forest, the PC of HMMs and SVMsis high. However, considering the calculation time and HMM’s advantage in that it is a time seriesmodel, HMM is better method. The PC of neural network is totally low, however, if the more goat’sdata were acquired, neural network would be an adequate method for estimation.
Keywords: shiba goat; Estrus; estimation; machine learning
1. Introduction
The purpose of this study was to show that machine learning can be applied to detect and estimatewhether a goat is in estrus based on the goat’s behavior, and the adequacy of detection and estimationmethod by machine learning is verified. Estrus is a state of sexual receptivity during which thefemale will accept the male and is capable of conceiving. This behavioral state occurs under hormonalregulation involving the ovary and pituitary gland, and precedes or coincides with ovulation [1].Behaviors exhibited during estrus are significant for successful mating in all mammals. Estrus behavior
Animals 2020, 10, 771; doi:10.3390/ani10050771 www.mdpi.com/journal/animals
Animals 2020, 10, 771 2 of 20
is characterized by three components: attractivity, receptivity, and proceptivity [2]. Attractivity is thefemale’s stimulus value in evoking sexual responses by the male [2]; an example can be changes inthe female’s scent (pheromones) [3]. Receptivity is defined as female responses that are necessary andsufficient for the male’s success in achieving intravaginal ejaculation [2]. Proceptivity is any behaviorexhibited by a female that initiates or maintains sexual interaction with a male, which in goats includesapproaching males, sniffing, mounting, and tail wagging [4–6]. Here, upon sniffing and mounting,the female permits mounting by the male. These behaviors are generally monitored by a humanobserver because direct observation is currently regarded as the best method for obtaining detaileddata regarding specific behaviors [7]. Generally, direct observation requires substantial effort andtime, if the number of targets to be observed is large and the observations are to be conducted for aprolonged period. For example, a previous study shows that it takes 24 h/day for 13 days to describebreeding behavior and activity budgets of an undisturbed pair of adult polar bears [8]. The case ofgoats is almost similar to this. In addition, observation-based data are based on a human observer’ssubjective judgment, and the observation by other observers might yield different results. In otherwords, the observation results differ depending on the observers, particularly their skill or experience.For this reason, it is necessary to develop objective and effective quantitative evaluation methods toreplace ineffective evaluation methods based on an observer’s direct observation. In the livestockindustry in particular, the need for information and communication technology (ICT) and the Internetof Things (IoT) is a system of interrelated computing devices, mechanical and digital machines, objects,animals, or people that are provided with unique identifiers and the ability to transfer data over anetwork without requiring human-to-human or human-to-computer interaction [9]) for monitoringand management of production, mating, and health of animals has been growing [10].
Previous studies [7] have shown that automated video tracking systems for studying animalbehavior were introduced in the early 1990s and that they have been increasingly incorporated intostudying laboratory mice [11–13] and other small animals. In addition to the development of digitalimage processing technology, several types of specialized computer software for animal tracking havebeen proposed, which allow tracking of positions and movement of subjects automatically and generatecoordinates of a target position as time series data. Vector analysis of the trajectory data, i.e., thesubject’s position, can be used to assess the activity of the subject by calculating movement distanceand speed. More complex behaviors, such as social interactions between male and female mice can beidentified automatically using statistical models [14–16]. The merit of quantitative evaluation methodsis that they are not limited by an observer’s capacity and proficiency. Even if well-trained and proficientobservers judge the behavior, the judgment might vary between two observers. In addition, even if theobservers are well-trained, they might make mistakes, i.e. human error. According to our previousstudy, the machine learning method could detect states of mice that well-trained observers couldnot judge well due to human error [17]. We think that the case of estimating goat states is similar.Considering this, quantitative evaluation method has merit in terms of solving these problems.
The video tracking systems are widely used to track small objects, such as laboratory mice [12,14–16],small animals [18,19] and fishes [20], to large animals, such as monkeys [21] and pigs [22].
On the other hand, from the point of effective behavior analysis of large animals such as goats,tracking the animal’s behavior and analyzing its tracking data can be beneficial. For example, previousstudies have involved fixing a data logger to cattle and detecting their estrus behavior, in cases oflarge animals’ behavior detection, and that data logger has been commercialized [23,24]. In addition,statistical modeling can be quite effective towards utilizing the recorded animal’s behavioral data.Previous studies show effective behavioral analysis and tag development from the point of statisticalmodeling [25]. However, it takes time and effort to attach sensors because the sensors are affixed tothe animals by winding a band around them. In addition, there is a need to improve the materialsused in sensors to prevent breakage by animals and shifting of attached sensors. It is also necessaryto downsize sensors and facilitate sensor attachment considering field use [10], because it becomes
Animals 2020, 10, 771 3 of 20
difficult for animals to move around if the sensors are large in size, and it takes a long time, if attachingthe sensor is not facilitated. This prevents efficient data acquisition.
Therefore, alternative methods for identifying estrus behavior in large animals must be developed.Video tracking is one of these methods because it does not restrict the animals’ movement due toattached sensors. Tracking data are acquired by attaching a marker to a goat (which is considered asan example of a large animal) and methods for estimating the goat’s estrus behavior from these data aredevised. A previous study has shown that an estrus goat has an increased tendency to approach andstand near a male goat’s paddock, based on the male goat’s behavior [7]. In this case, the female goat’sbehavior is recorded as a movie, and a professional evaluator judges the goat’s behavior subjectivelyfor exhibiting estrus tendencies in each frame.
Generally, machine learning is used for pattern recognition [26] or estimation [27]. One applicationof machine learning is to estimate behavior. For example, machine learning is used for predictionof ambulation behavior [28] or everyday life activities [29]. As for animals’ behavior, it is used forautomated measurement of social behavior of mice with depth sensing and video tracking [30].In another study, dairy cows’ behavior is predicted by variable segmentation and ensembleclassifiers [31]. It is suggested that machine learning could be applied to detect and estimate,and/or predict a goat’s behavior as well. Especially, as far as author’s survey, there are no previousstudies about machine learning methods that estimate whether goat is in estrus state or not. In thisstudy, as methods of machine learning, hidden Markov models (HMMs) [32–34], random forest,support vector machines (SVMs), and neural networks was applied to detect and estimate whethera goat is in estrus, based on the goat’s behavior, and the adequacy of this detection and estimationmethod is verified. As for HMMs, a previous study has shown that HMMs are adequate for detectingand estimating a large animal’s “estrus” and “non-estrus” behaviors [10]. However, in this study,“estrus” behavior is divided into “approaching the male” state and “standing near the male” state (thiswill be described in Section 2.4). The purpose of dividing goat’s behavior into two is for estimatingmore detail states of goats. Here, there are other machine learning methods asides from HMMs,and if we can estimate when these states related to “estrus” behavior occur by some machine learningmethod, it might help breeding management to mate animals successfully. This paper can contributeto this. In general, for breeding goats, it is said that different areas are needed if a large number ofanimals should be kept, and they should be divided into groups. Ideally, they are divided into groups,such as seeded male goats, young male goats, young female goats, mother and child goats (calving toweaning), adult female goats (unconceived), and sick goats. At mating time, sired goats are placedinto the female flock [35].
It is important to detect estrus accurately because the breeding season will be over if estrus ismissed. For this reason, breeders need to determine if their goats are in estrus. They need to trainto discern whether goats are in estrus or not accurately. By demonstrating the possibility of usingmachine learning methods, such as those in this manuscript, to estimate goat behavior, breeders whoare uncertain about their goats’ states will be able to learn about goat behavior in real time, eliminatingthe need to spend their time training to distinguish between estrus and non-estrus accurately.
The remainder of this paper is organized as follows. Section 2 comprehensively explains theexperiments and the estimation methods used in this study, Section 3 describes the estimation resultsand discusses the results, and Section 4 summarizes the main findings of this research with a briefconsideration for future study.
2. Materials and Methods
The methods described in the study by Endo et al. [7] are followed in this study.
Animals 2020, 10, 771 4 of 20
2.1. Ethics Approval and Consent to Participate
Adult female Shiba goats used in this study were maintained at the Tokyo University ofAgriculture and Technology, and all of the experimental procedures were approved by the UniversityCommittee for the Use and Care of Animals at Tokyo University of Agriculture and Technology (#27-18).
2.2. Animals and Housing
Six to eight goats were housed in a paddock with an outside area of 25 m2, a sheltered area of15 m2, and a natural photoperiod. The goats were fed maintenance diets of alfalfa hay cubes twice aday (0900 h and 1500 h). Clean water and mineralized salt were provided ad libitum.
2.3. Video Recording
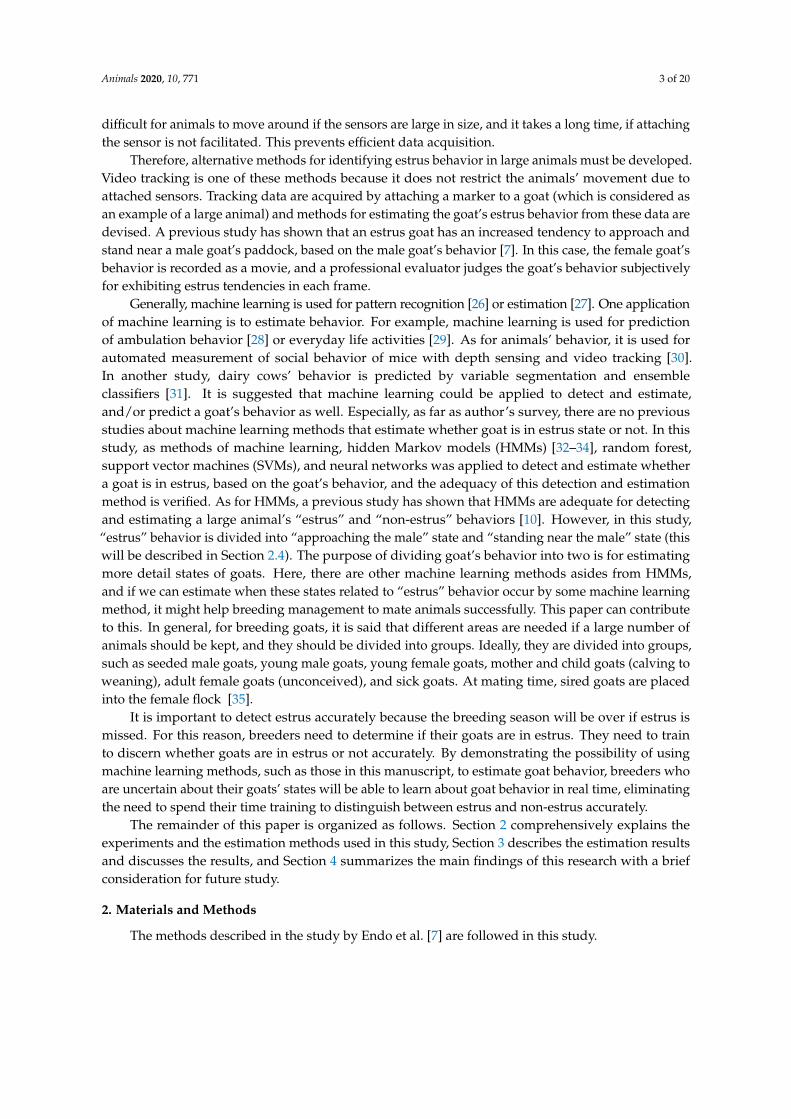
The study was conducted between November 2014 and January 2015. All female goats werechecked for estrus once or twice daily and were considered to be in estrus when they allowed mountingby a male goat. Here, female goats and a male goat are housed separately. Between December 2014and January 2015, 16 goats were tested (age = 2–9 years, body weight = 21–37 kg) and confirmed tobe in estrus (n = 8: #24, #23, #17, #33, #12, #9, #4, and #22) or not in estrus (n = 8: #25, #13, #6, #3, #14,#15, #21, and #35). An observation pen (2.5 m × 2.5 m) was set up at a corner of the female paddock,with one side adjacent to the male paddock. A network camera (DG-SF334, Panasonic Corporation,Kadoma, Japan) was fixed to the ceiling. A captured image from the video recording data is shown inFigure 1.
Before beginning the observations, one male goat was tied loosely with a rope to the adjacent sideof the observation pen. A bright-colored circle marker (red or blue, 12 cm in diameter) was attachedto the back of the female goats to enable identification and tracking in video recordings. The femalegoats were then moved gently into the observation pen by one observer. The female and male goatswere allowed to contact each other partially by poking their muzzles through the bars on the adjacentside of the observation pen. After an adaptation period of approximately 10 min, the behaviors of thegoats were recorded for 10 min using a network camera recorder (BB-HNP17, Panasonic) connected toa personal computer. The computer was located in a building at a distance from the goat paddocks.During video recordings, the observer remained in the building to prevent disturbing the behaviors ofthe goats. Here, each goat was observed and their behavior was recorded individually.
Figure 1. Image from the video recording data. One side of the observation pen was adjacent to themale paddock. A marker was attached to the back of the female goat to track its movements.
Animals 2020, 10, 771 5 of 20
2.4. Behavioral Analysis by Human Observation
After finishing the video recording, behavioral observations were performed once by awell-trained observer, who is a veterinary expert, using the video recordings. On the basis ofprevious descriptions of sexual behaviors during estrus in goats [7], the occurrence of two behaviors,“approaching the male” and “staying near the male,” were investigated as indicators of proceptivity.The following criteria was used to define each behavior:
• Approaching to the maleWalking or running from the other side of the observation pen toward the area adjacent to themale paddock.
• Standing near the maleStanding or behaving restlessly (continuously) in the area adjacent to the male paddock,and occasionally contacting the male through the bars of the pen.
The data frames were scored as 0 (behavior besides approaching and standing), 1 (approaching themale), or 2 (standing near the male) by the observer to analyze each behavior in terms of its frequencyor duration. The continuous time was taken as the duration of the behavior. The video recordings wereprocessed using ABDigitizer software (Chinou Jouhou Shisutemu, Kyoto, Japan). Here, we used large,visible markers to track the goats’ movements; however, this was because we used the ABDigitizer.Needless to say, even small devices, such as RFID tags, could be used to track the goats’ movements.Any device that can track the goats’ movements could be used. As for judgment whether goat is inestrus or non-estrus, receptivity symptoms, such as a flush look to the vulva, outflowing of swellingand mucus, loss of appetite, increase in the frequency of urination, and characteristic cries, were used.
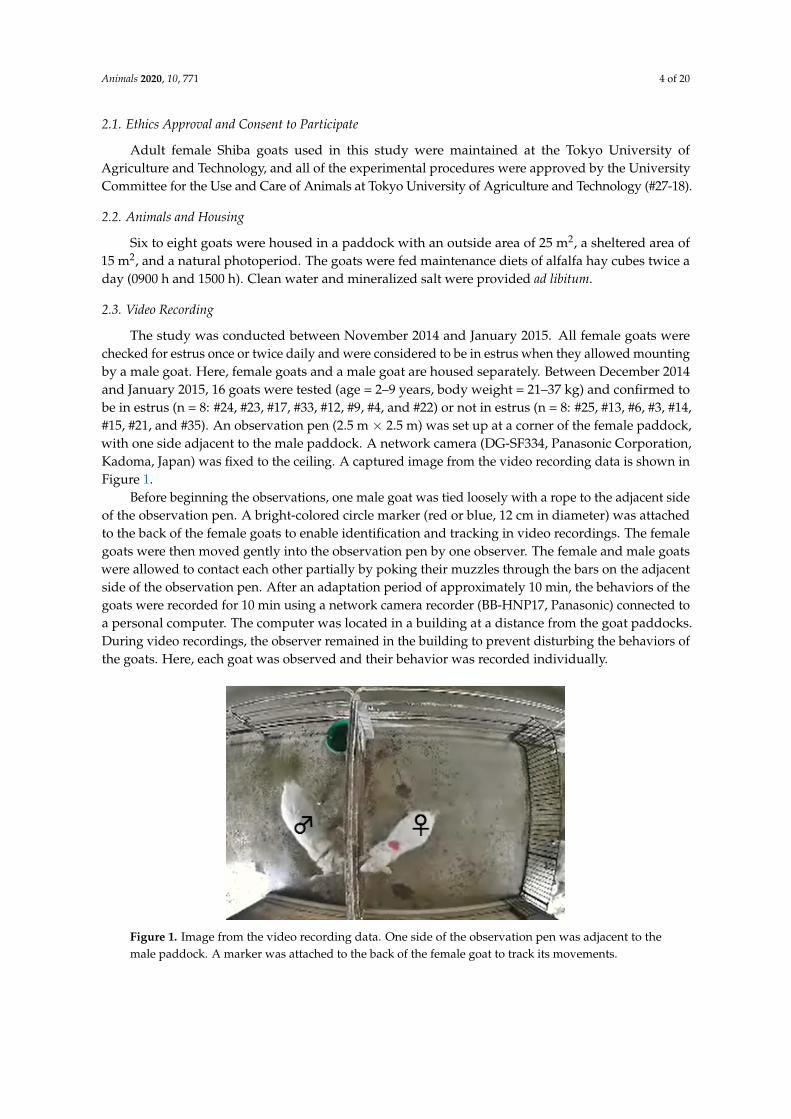
The positions and movements of the markers attached to the back of the goats were trackedautomatically (Figure 2), and the x- and y-coordinates of the central point of the marker were outputtedevery 0.5 s. Thus, a 10-min video tracking dataset contained 1200 frames.
Figure 2. Image from the video recording data. One side of the observation pen was adjacent to themale paddock. A marker was attached to the back of the female goat to track goat movements.
In this context, it was considered that a goat pair assumed one of three states sk at each time pointk (1, . . . , 1200):
sk = 0: behavior besides approaching and standing (state 0),sk = 1: approaching the male (state 1),sk = 2: standing near the male (state 2)
Animals 2020, 10, 771 6 of 20
where sk is the state of the pair at time point k. The reason for considering these three states was thatthe human observer identified three behavioral states, and the ability of the model to classify thosethree states correctly needed to be assessed.
Next, observable variables were calculated. The number of observable variables in this modelwere three:
(a) x-coordinate: x(k)(b) y-coordinate: y(k)(c) step length of a goat at k and k + 1: L(k) =
√{x(k + 1)− x(k)}2 + {y(k + 1)− y(k)}2
Here, the reason for adopting these three observable variables was based on a previous study [10](see Appendix A).
2.5. Modeling and Estimation of Estrus Behavior by Hmm
An HMM is composed of a Markov process that updates “states” and a (conditional) probabilisticdistribution of the observable variables in a given state. The principal purpose of applying an HMMwas to estimate behavioral states from a time series of observable variables.
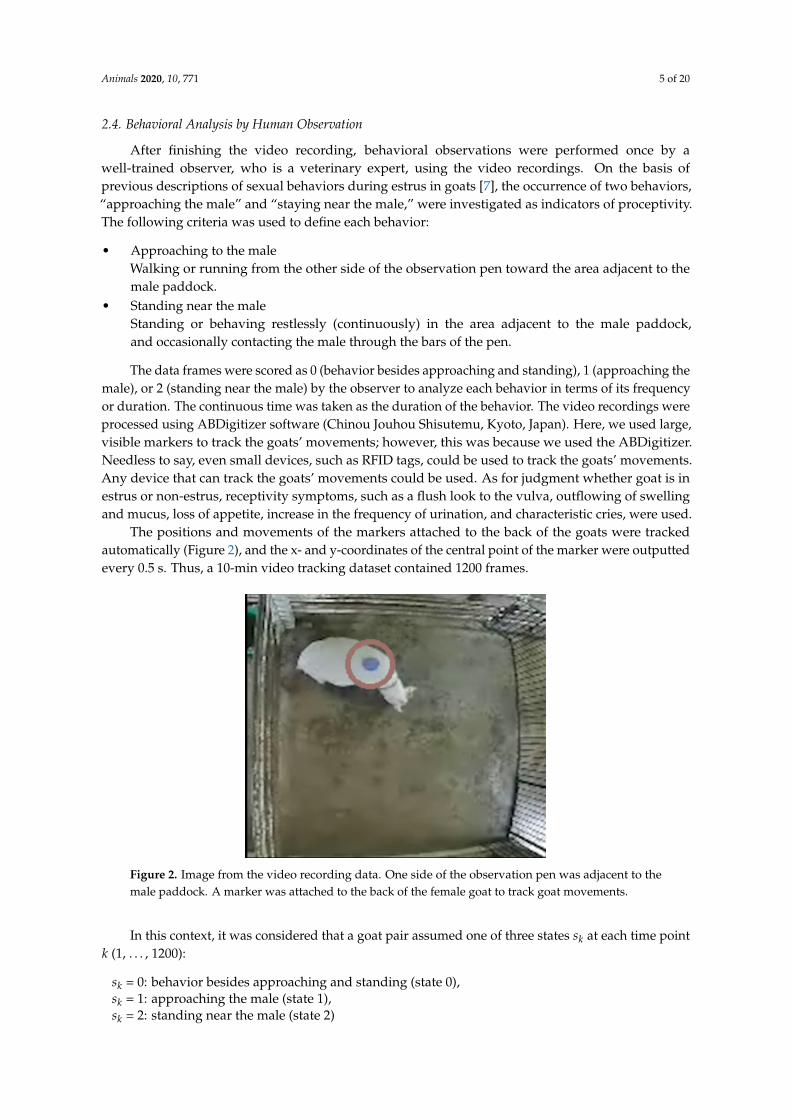
The state was considered to be updated according to Markov process (Figure 3).
Figure 3. Three-state HMM. Shiba goats show three states, behavior besides approaching and standing,approaching the male, and standing near the male. There is a timing when the state remains the same,and there is a timing when the state transitions to another state.
Next, the conditional distribution p(y|s) of observable variables for a given state was explained,where y was the set of observable variables and s is the state. For all the goats, the state s during eachdata frame was labeled by the observer, thus p(y|s) was easily calculated if y was observed.
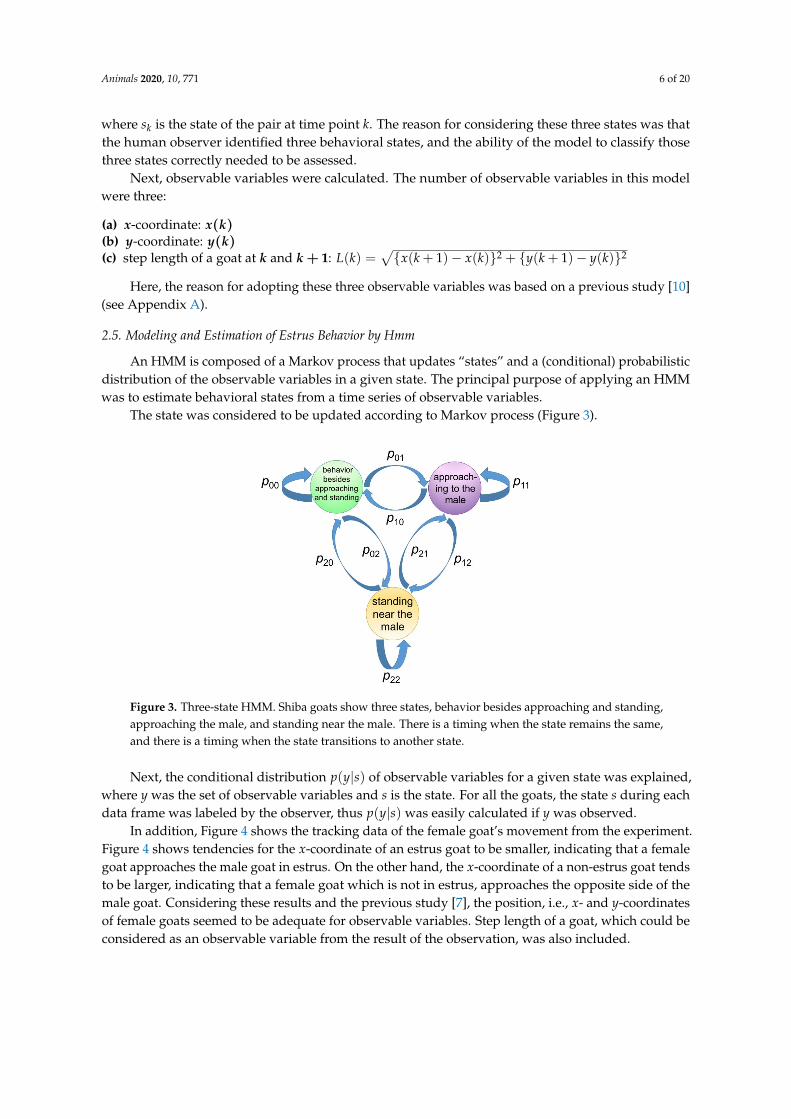
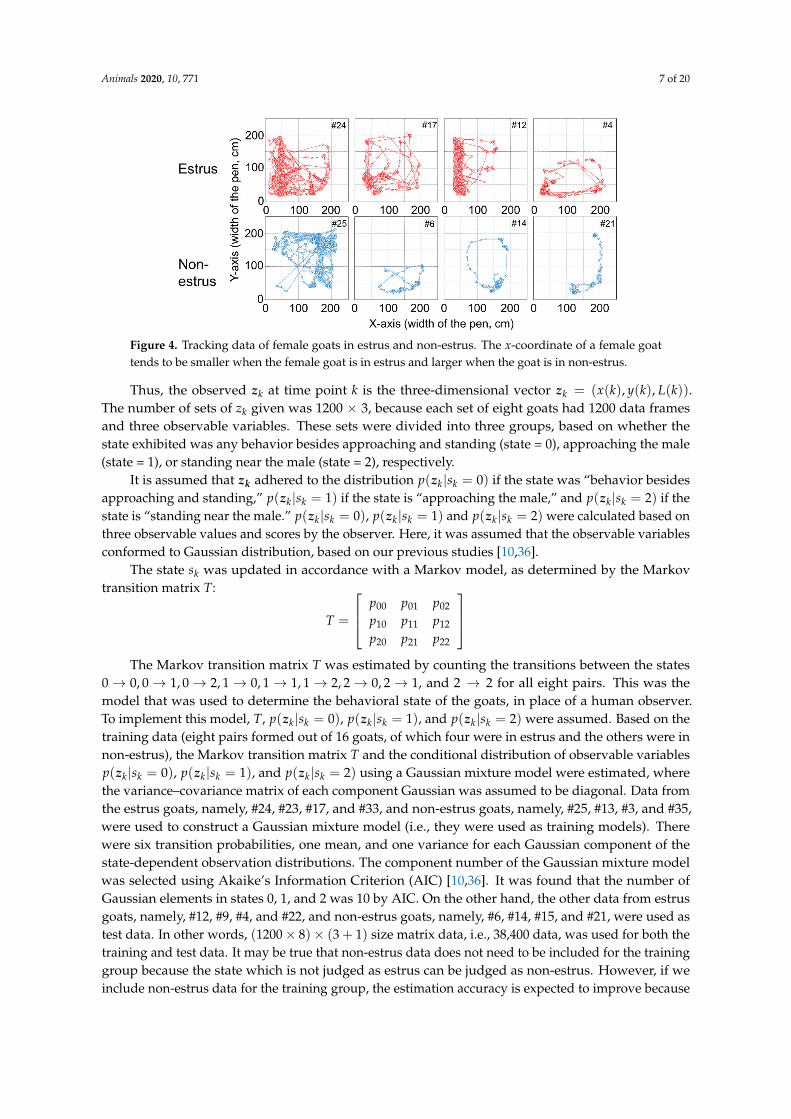
In addition, Figure 4 shows the tracking data of the female goat’s movement from the experiment.Figure 4 shows tendencies for the x-coordinate of an estrus goat to be smaller, indicating that a femalegoat approaches the male goat in estrus. On the other hand, the x-coordinate of a non-estrus goat tendsto be larger, indicating that a female goat which is not in estrus, approaches the opposite side of themale goat. Considering these results and the previous study [7], the position, i.e., x- and y-coordinatesof female goats seemed to be adequate for observable variables. Step length of a goat, which could beconsidered as an observable variable from the result of the observation, was also included.
Animals 2020, 10, 771 7 of 20
Figure 4. Tracking data of female goats in estrus and non-estrus. The x-coordinate of a female goattends to be smaller when the female goat is in estrus and larger when the goat is in non-estrus.
Thus, the observed zk at time point k is the three-dimensional vector zk = (x(k), y(k), L(k)).The number of sets of zk given was 1200 × 3, because each set of eight goats had 1200 data framesand three observable variables. These sets were divided into three groups, based on whether thestate exhibited was any behavior besides approaching and standing (state = 0), approaching the male(state = 1), or standing near the male (state = 2), respectively.
It is assumed that zk adhered to the distribution p(zk|sk = 0) if the state was “behavior besidesapproaching and standing,” p(zk|sk = 1) if the state is “approaching the male,” and p(zk|sk = 2) if thestate is “standing near the male.” p(zk|sk = 0), p(zk|sk = 1) and p(zk|sk = 2) were calculated based onthree observable values and scores by the observer. Here, it was assumed that the observable variablesconformed to Gaussian distribution, based on our previous studies [10,36].
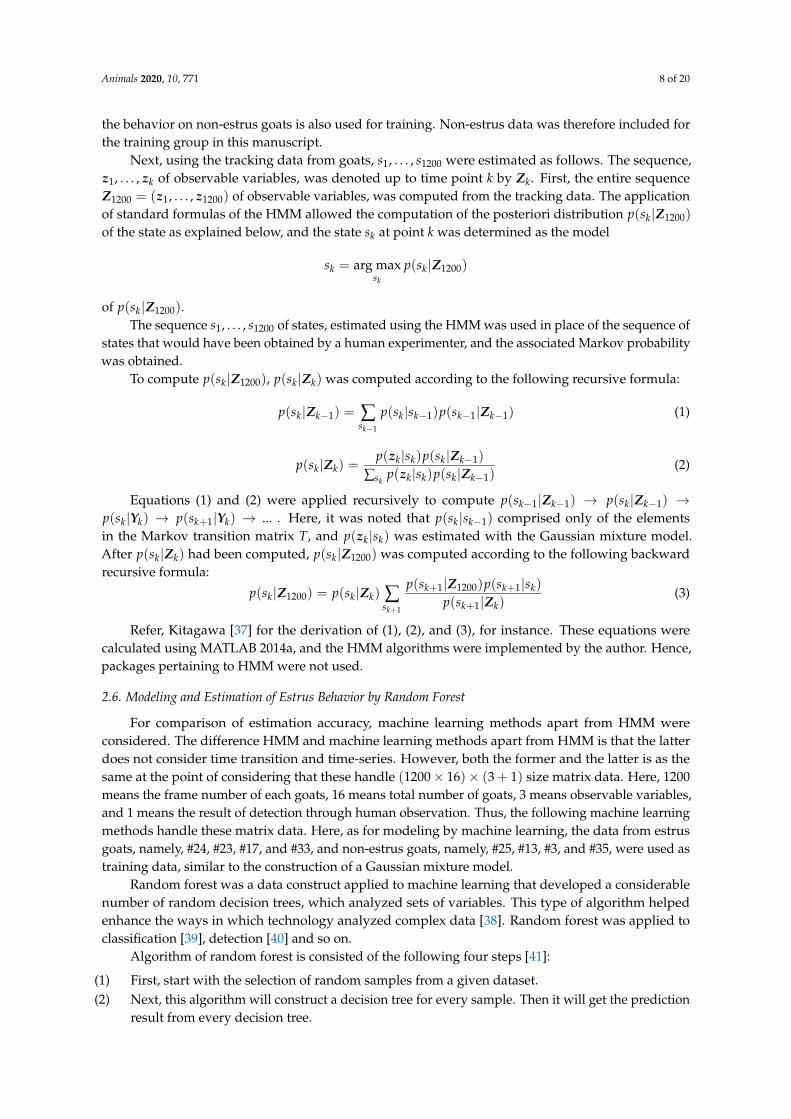
The state sk was updated in accordance with a Markov model, as determined by the Markovtransition matrix T:
T =
p00 p01 p02
p10 p11 p12
p20 p21 p22
The Markov transition matrix T was estimated by counting the transitions between the states
0→ 0, 0→ 1, 0→ 2, 1→ 0, 1→ 1, 1→ 2, 2→ 0, 2→ 1, and 2 → 2 for all eight pairs. This was themodel that was used to determine the behavioral state of the goats, in place of a human observer.To implement this model, T, p(zk|sk = 0), p(zk|sk = 1), and p(zk|sk = 2) were assumed. Based on thetraining data (eight pairs formed out of 16 goats, of which four were in estrus and the others were innon-estrus), the Markov transition matrix T and the conditional distribution of observable variablesp(zk|sk = 0), p(zk|sk = 1), and p(zk|sk = 2) using a Gaussian mixture model were estimated, wherethe variance–covariance matrix of each component Gaussian was assumed to be diagonal. Data fromthe estrus goats, namely, #24, #23, #17, and #33, and non-estrus goats, namely, #25, #13, #3, and #35,were used to construct a Gaussian mixture model (i.e., they were used as training models). Therewere six transition probabilities, one mean, and one variance for each Gaussian component of thestate-dependent observation distributions. The component number of the Gaussian mixture modelwas selected using Akaike’s Information Criterion (AIC) [10,36]. It was found that the number ofGaussian elements in states 0, 1, and 2 was 10 by AIC. On the other hand, the other data from estrusgoats, namely, #12, #9, #4, and #22, and non-estrus goats, namely, #6, #14, #15, and #21, were used astest data. In other words, (1200× 8)× (3 + 1) size matrix data, i.e., 38,400 data, was used for both thetraining and test data. It may be true that non-estrus data does not need to be included for the traininggroup because the state which is not judged as estrus can be judged as non-estrus. However, if weinclude non-estrus data for the training group, the estimation accuracy is expected to improve because
Animals 2020, 10, 771 8 of 20
the behavior on non-estrus goats is also used for training. Non-estrus data was therefore included forthe training group in this manuscript.
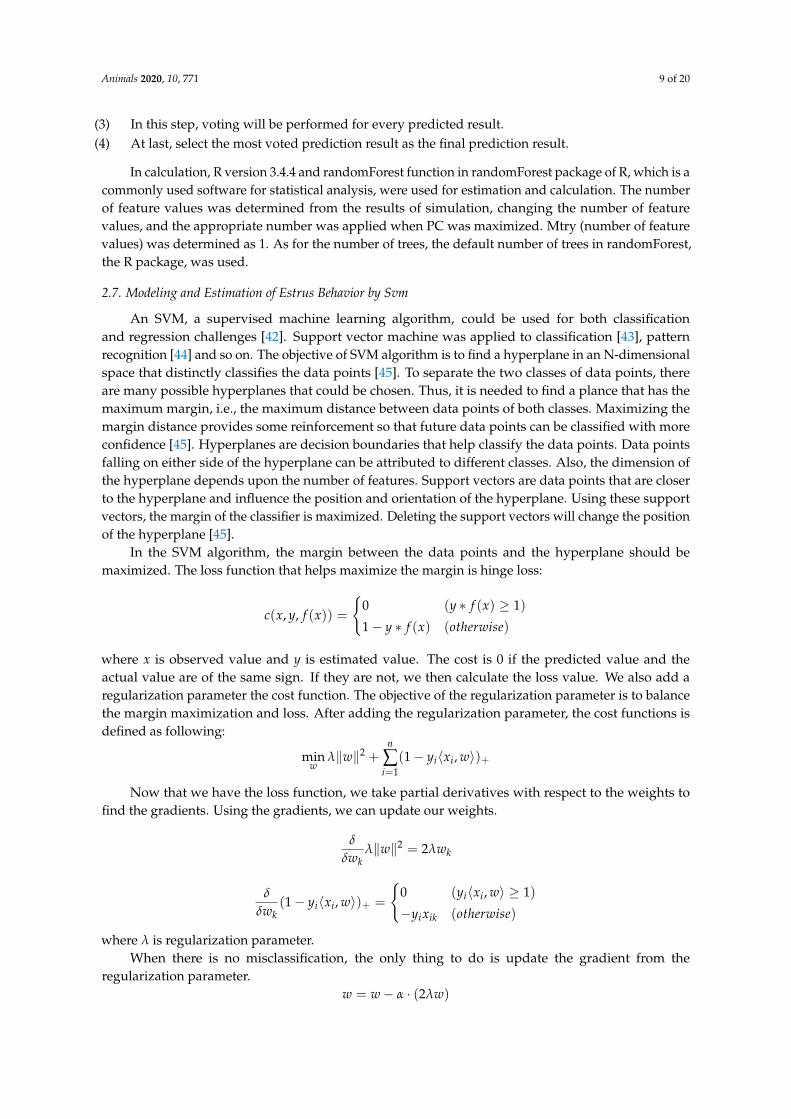
Next, using the tracking data from goats, s1, . . . , s1200 were estimated as follows. The sequence,z1, . . . , zk of observable variables, was denoted up to time point k by Zk. First, the entire sequenceZ1200 = (z1, . . . , z1200) of observable variables, was computed from the tracking data. The applicationof standard formulas of the HMM allowed the computation of the posteriori distribution p(sk|Z1200)
of the state as explained below, and the state sk at point k was determined as the model
sk = arg maxsk
p(sk|Z1200)
of p(sk|Z1200).The sequence s1, . . . , s1200 of states, estimated using the HMM was used in place of the sequence of
states that would have been obtained by a human experimenter, and the associated Markov probabilitywas obtained.
To compute p(sk|Z1200), p(sk|Zk) was computed according to the following recursive formula:
p(sk|Zk−1) = ∑sk−1
p(sk|sk−1)p(sk−1|Zk−1) (1)
p(sk|Zk) =p(zk|sk)p(sk|Zk−1)
∑skp(zk|sk)p(sk|Zk−1)
(2)
Equations (1) and (2) were applied recursively to compute p(sk−1|Zk−1) → p(sk|Zk−1) →p(sk|Yk) → p(sk+1|Yk) → ... . Here, it was noted that p(sk|sk−1) comprised only of the elementsin the Markov transition matrix T, and p(zk|sk) was estimated with the Gaussian mixture model.After p(sk|Zk) had been computed, p(sk|Z1200) was computed according to the following backwardrecursive formula:
p(sk|Z1200) = p(sk|Zk) ∑sk+1
p(sk+1|Z1200)p(sk+1|sk)
p(sk+1|Zk)(3)
Refer, Kitagawa [37] for the derivation of (1), (2), and (3), for instance. These equations werecalculated using MATLAB 2014a, and the HMM algorithms were implemented by the author. Hence,packages pertaining to HMM were not used.
2.6. Modeling and Estimation of Estrus Behavior by Random Forest
For comparison of estimation accuracy, machine learning methods apart from HMM wereconsidered. The difference HMM and machine learning methods apart from HMM is that the latterdoes not consider time transition and time-series. However, both the former and the latter is as thesame at the point of considering that these handle (1200× 16)× (3 + 1) size matrix data. Here, 1200means the frame number of each goats, 16 means total number of goats, 3 means observable variables,and 1 means the result of detection through human observation. Thus, the following machine learningmethods handle these matrix data. Here, as for modeling by machine learning, the data from estrusgoats, namely, #24, #23, #17, and #33, and non-estrus goats, namely, #25, #13, #3, and #35, were used astraining data, similar to the construction of a Gaussian mixture model.
Random forest was a data construct applied to machine learning that developed a considerablenumber of random decision trees, which analyzed sets of variables. This type of algorithm helpedenhance the ways in which technology analyzed complex data [38]. Random forest was applied toclassification [39], detection [40] and so on.
Algorithm of random forest is consisted of the following four steps [41]:
(1) First, start with the selection of random samples from a given dataset.(2) Next, this algorithm will construct a decision tree for every sample. Then it will get the prediction
result from every decision tree.
Animals 2020, 10, 771 9 of 20
(3) In this step, voting will be performed for every predicted result.(4) At last, select the most voted prediction result as the final prediction result.
In calculation, R version 3.4.4 and randomForest function in randomForest package of R, which is acommonly used software for statistical analysis, were used for estimation and calculation. The numberof feature values was determined from the results of simulation, changing the number of featurevalues, and the appropriate number was applied when PC was maximized. Mtry (number of featurevalues) was determined as 1. As for the number of trees, the default number of trees in randomForest,the R package, was used.
2.7. Modeling and Estimation of Estrus Behavior by Svm
An SVM, a supervised machine learning algorithm, could be used for both classificationand regression challenges [42]. Support vector machine was applied to classification [43], patternrecognition [44] and so on. The objective of SVM algorithm is to find a hyperplane in an N-dimensionalspace that distinctly classifies the data points [45]. To separate the two classes of data points, thereare many possible hyperplanes that could be chosen. Thus, it is needed to find a plance that has themaximum margin, i.e., the maximum distance between data points of both classes. Maximizing themargin distance provides some reinforcement so that future data points can be classified with moreconfidence [45]. Hyperplanes are decision boundaries that help classify the data points. Data pointsfalling on either side of the hyperplane can be attributed to different classes. Also, the dimension ofthe hyperplane depends upon the number of features. Support vectors are data points that are closerto the hyperplane and influence the position and orientation of the hyperplane. Using these supportvectors, the margin of the classifier is maximized. Deleting the support vectors will change the positionof the hyperplane [45].
In the SVM algorithm, the margin between the data points and the hyperplane should bemaximized. The loss function that helps maximize the margin is hinge loss:
c(x, y, f (x)) =
{0 (y ∗ f (x) ≥ 1)
1− y ∗ f (x) (otherwise)
where x is observed value and y is estimated value. The cost is 0 if the predicted value and theactual value are of the same sign. If they are not, we then calculate the loss value. We also add aregularization parameter the cost function. The objective of the regularization parameter is to balancethe margin maximization and loss. After adding the regularization parameter, the cost functions isdefined as following:
minw
λ‖w‖2 +n
∑i=1
(1− yi〈xi, w〉)+
Now that we have the loss function, we take partial derivatives with respect to the weights tofind the gradients. Using the gradients, we can update our weights.
δ
δwkλ‖w‖2 = 2λwk
δ
δwk(1− yi〈xi, w〉)+ =
{0 (yi〈xi, w〉 ≥ 1)
−yixik (otherwise)
where λ is regularization parameter.When there is no misclassification, the only thing to do is update the gradient from the
regularization parameter.w = w− α · (2λw)
Animals 2020, 10, 771 10 of 20
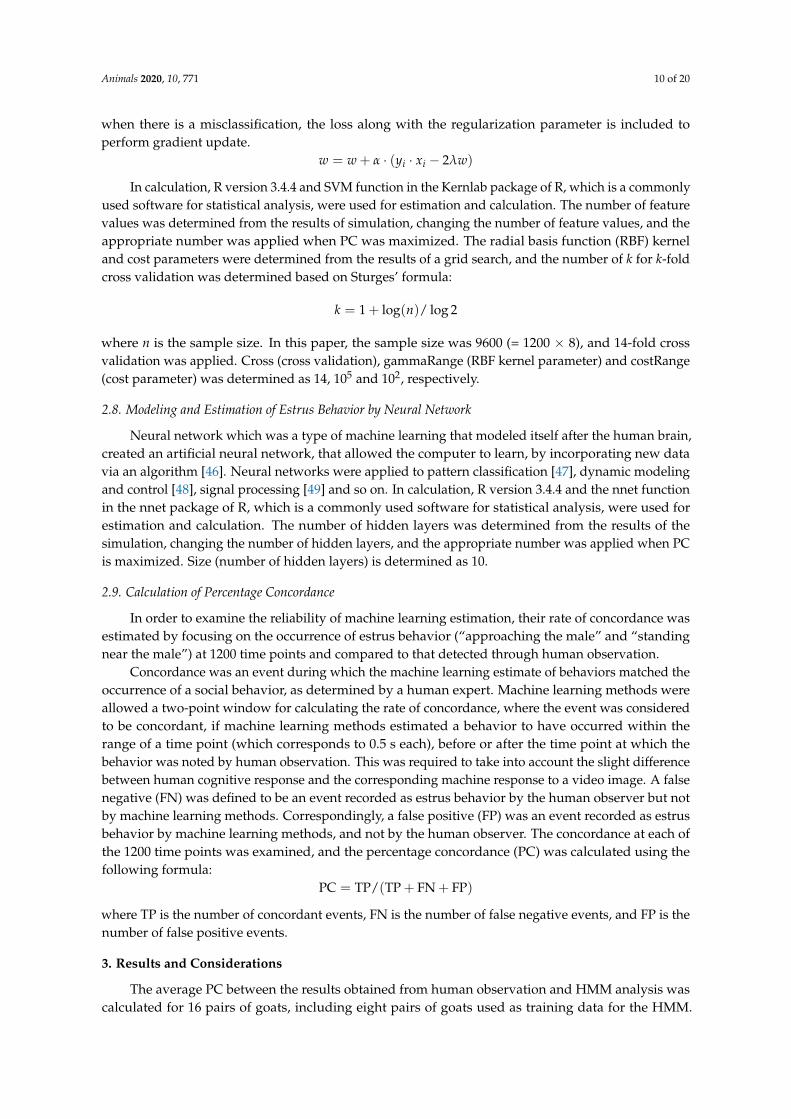
when there is a misclassification, the loss along with the regularization parameter is included toperform gradient update.
w = w + α · (yi · xi − 2λw)
In calculation, R version 3.4.4 and SVM function in the Kernlab package of R, which is a commonlyused software for statistical analysis, were used for estimation and calculation. The number of featurevalues was determined from the results of simulation, changing the number of feature values, and theappropriate number was applied when PC was maximized. The radial basis function (RBF) kerneland cost parameters were determined from the results of a grid search, and the number of k for k-foldcross validation was determined based on Sturges’ formula:
k = 1 + log(n)/ log 2
where n is the sample size. In this paper, the sample size was 9600 (= 1200 × 8), and 14-fold crossvalidation was applied. Cross (cross validation), gammaRange (RBF kernel parameter) and costRange(cost parameter) was determined as 14, 105 and 102, respectively.
2.8. Modeling and Estimation of Estrus Behavior by Neural Network
Neural network which was a type of machine learning that modeled itself after the human brain,created an artificial neural network, that allowed the computer to learn, by incorporating new datavia an algorithm [46]. Neural networks were applied to pattern classification [47], dynamic modelingand control [48], signal processing [49] and so on. In calculation, R version 3.4.4 and the nnet functionin the nnet package of R, which is a commonly used software for statistical analysis, were used forestimation and calculation. The number of hidden layers was determined from the results of thesimulation, changing the number of hidden layers, and the appropriate number was applied when PCis maximized. Size (number of hidden layers) is determined as 10.
2.9. Calculation of Percentage Concordance
In order to examine the reliability of machine learning estimation, their rate of concordance wasestimated by focusing on the occurrence of estrus behavior (“approaching the male” and “standingnear the male”) at 1200 time points and compared to that detected through human observation.
Concordance was an event during which the machine learning estimate of behaviors matched theoccurrence of a social behavior, as determined by a human expert. Machine learning methods wereallowed a two-point window for calculating the rate of concordance, where the event was consideredto be concordant, if machine learning methods estimated a behavior to have occurred within therange of a time point (which corresponds to 0.5 s each), before or after the time point at which thebehavior was noted by human observation. This was required to take into account the slight differencebetween human cognitive response and the corresponding machine response to a video image. A falsenegative (FN) was defined to be an event recorded as estrus behavior by the human observer but notby machine learning methods. Correspondingly, a false positive (FP) was an event recorded as estrusbehavior by machine learning methods, and not by the human observer. The concordance at each ofthe 1200 time points was examined, and the percentage concordance (PC) was calculated using thefollowing formula:
PC = TP/(TP + FN + FP)
where TP is the number of concordant events, FN is the number of false negative events, and FP is thenumber of false positive events.
3. Results and Considerations
The average PC between the results obtained from human observation and HMM analysis wascalculated for 16 pairs of goats, including eight pairs of goats used as training data for the HMM.
Animals 2020, 10, 771 11 of 20
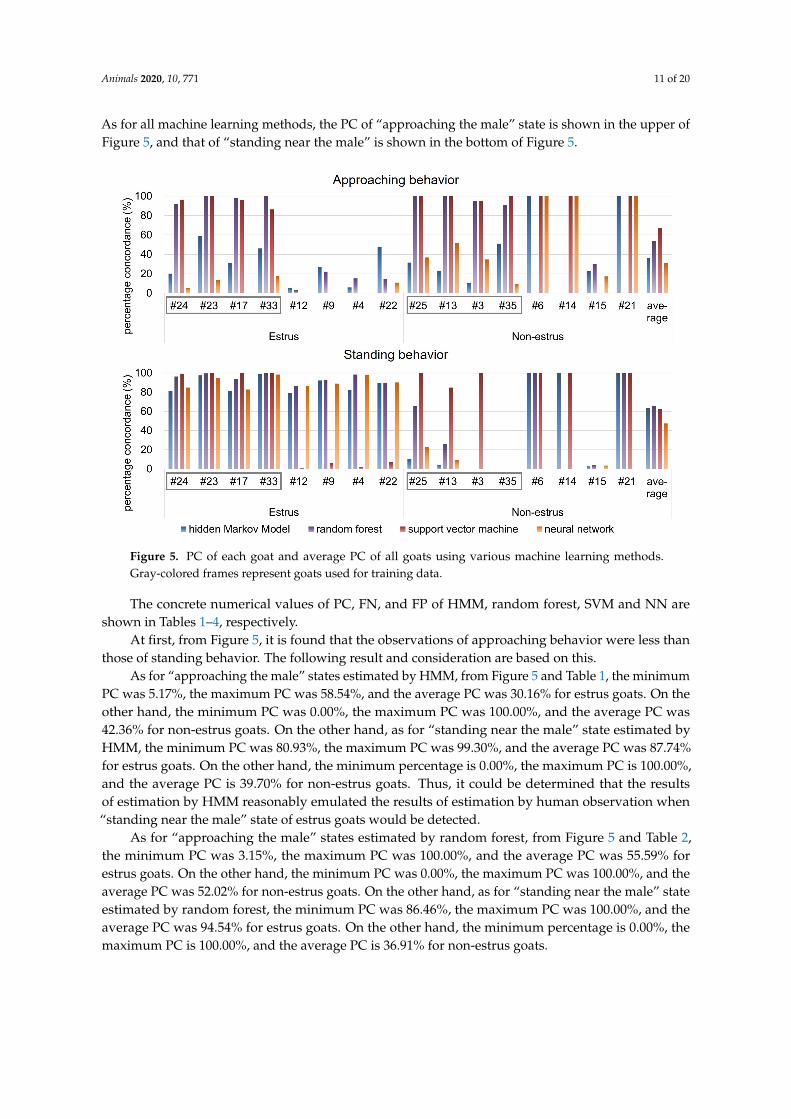
As for all machine learning methods, the PC of “approaching the male” state is shown in the upper ofFigure 5, and that of “standing near the male” is shown in the bottom of Figure 5.
Figure 5. PC of each goat and average PC of all goats using various machine learning methods.Gray-colored frames represent goats used for training data.
The concrete numerical values of PC, FN, and FP of HMM, random forest, SVM and NN areshown in Tables 1–4, respectively.
At first, from Figure 5, it is found that the observations of approaching behavior were less thanthose of standing behavior. The following result and consideration are based on this.
As for “approaching the male” states estimated by HMM, from Figure 5 and Table 1, the minimumPC was 5.17%, the maximum PC was 58.54%, and the average PC was 30.16% for estrus goats. On theother hand, the minimum PC was 0.00%, the maximum PC was 100.00%, and the average PC was42.36% for non-estrus goats. On the other hand, as for “standing near the male” state estimated byHMM, the minimum PC was 80.93%, the maximum PC was 99.30%, and the average PC was 87.74%for estrus goats. On the other hand, the minimum percentage is 0.00%, the maximum PC is 100.00%,and the average PC is 39.70% for non-estrus goats. Thus, it could be determined that the resultsof estimation by HMM reasonably emulated the results of estimation by human observation when“standing near the male” state of estrus goats would be detected.
As for “approaching the male” states estimated by random forest, from Figure 5 and Table 2,the minimum PC was 3.15%, the maximum PC was 100.00%, and the average PC was 55.59% forestrus goats. On the other hand, the minimum PC was 0.00%, the maximum PC was 100.00%, and theaverage PC was 52.02% for non-estrus goats. On the other hand, as for “standing near the male” stateestimated by random forest, the minimum PC was 86.46%, the maximum PC was 100.00%, and theaverage PC was 94.54% for estrus goats. On the other hand, the minimum percentage is 0.00%, themaximum PC is 100.00%, and the average PC is 36.91% for non-estrus goats.
Animals 2020, 10, 771 12 of 20
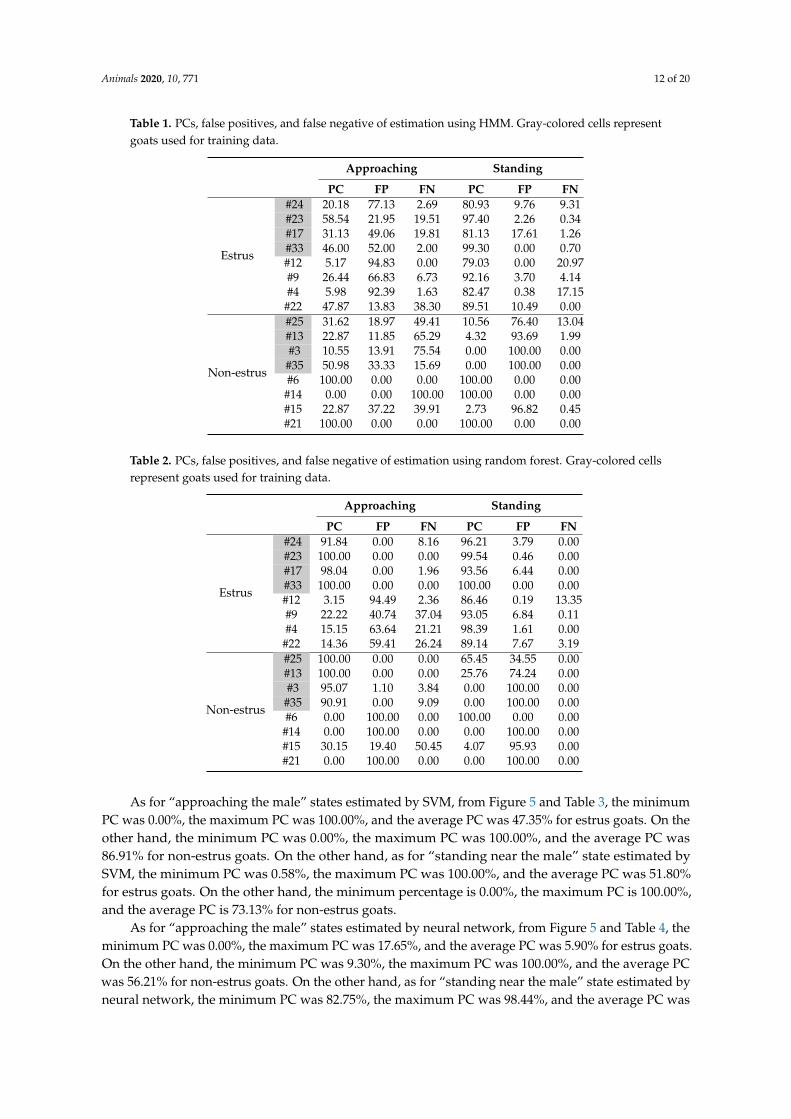
Table 1. PCs, false positives, and false negative of estimation using HMM. Gray-colored cells representgoats used for training data.
Approaching Standing
PC FP FN PC FP FN
Estrus
#24 20.18 77.13 2.69 80.93 9.76 9.31#23 58.54 21.95 19.51 97.40 2.26 0.34#17 31.13 49.06 19.81 81.13 17.61 1.26#33 46.00 52.00 2.00 99.30 0.00 0.70#12 5.17 94.83 0.00 79.03 0.00 20.97#9 26.44 66.83 6.73 92.16 3.70 4.14#4 5.98 92.39 1.63 82.47 0.38 17.15
#22 47.87 13.83 38.30 89.51 10.49 0.00
Non-estrus
#25 31.62 18.97 49.41 10.56 76.40 13.04#13 22.87 11.85 65.29 4.32 93.69 1.99#3 10.55 13.91 75.54 0.00 100.00 0.00#35 50.98 33.33 15.69 0.00 100.00 0.00#6 100.00 0.00 0.00 100.00 0.00 0.00
#14 0.00 0.00 100.00 100.00 0.00 0.00#15 22.87 37.22 39.91 2.73 96.82 0.45#21 100.00 0.00 0.00 100.00 0.00 0.00
Table 2. PCs, false positives, and false negative of estimation using random forest. Gray-colored cellsrepresent goats used for training data.
Approaching Standing
PC FP FN PC FP FN
Estrus
#24 91.84 0.00 8.16 96.21 3.79 0.00#23 100.00 0.00 0.00 99.54 0.46 0.00#17 98.04 0.00 1.96 93.56 6.44 0.00#33 100.00 0.00 0.00 100.00 0.00 0.00#12 3.15 94.49 2.36 86.46 0.19 13.35#9 22.22 40.74 37.04 93.05 6.84 0.11#4 15.15 63.64 21.21 98.39 1.61 0.00#22 14.36 59.41 26.24 89.14 7.67 3.19
Non-estrus
#25 100.00 0.00 0.00 65.45 34.55 0.00#13 100.00 0.00 0.00 25.76 74.24 0.00#3 95.07 1.10 3.84 0.00 100.00 0.00
#35 90.91 0.00 9.09 0.00 100.00 0.00#6 0.00 100.00 0.00 100.00 0.00 0.00#14 0.00 100.00 0.00 0.00 100.00 0.00#15 30.15 19.40 50.45 4.07 95.93 0.00#21 0.00 100.00 0.00 0.00 100.00 0.00
As for “approaching the male” states estimated by SVM, from Figure 5 and Table 3, the minimumPC was 0.00%, the maximum PC was 100.00%, and the average PC was 47.35% for estrus goats. On theother hand, the minimum PC was 0.00%, the maximum PC was 100.00%, and the average PC was86.91% for non-estrus goats. On the other hand, as for “standing near the male” state estimated bySVM, the minimum PC was 0.58%, the maximum PC was 100.00%, and the average PC was 51.80%for estrus goats. On the other hand, the minimum percentage is 0.00%, the maximum PC is 100.00%,and the average PC is 73.13% for non-estrus goats.
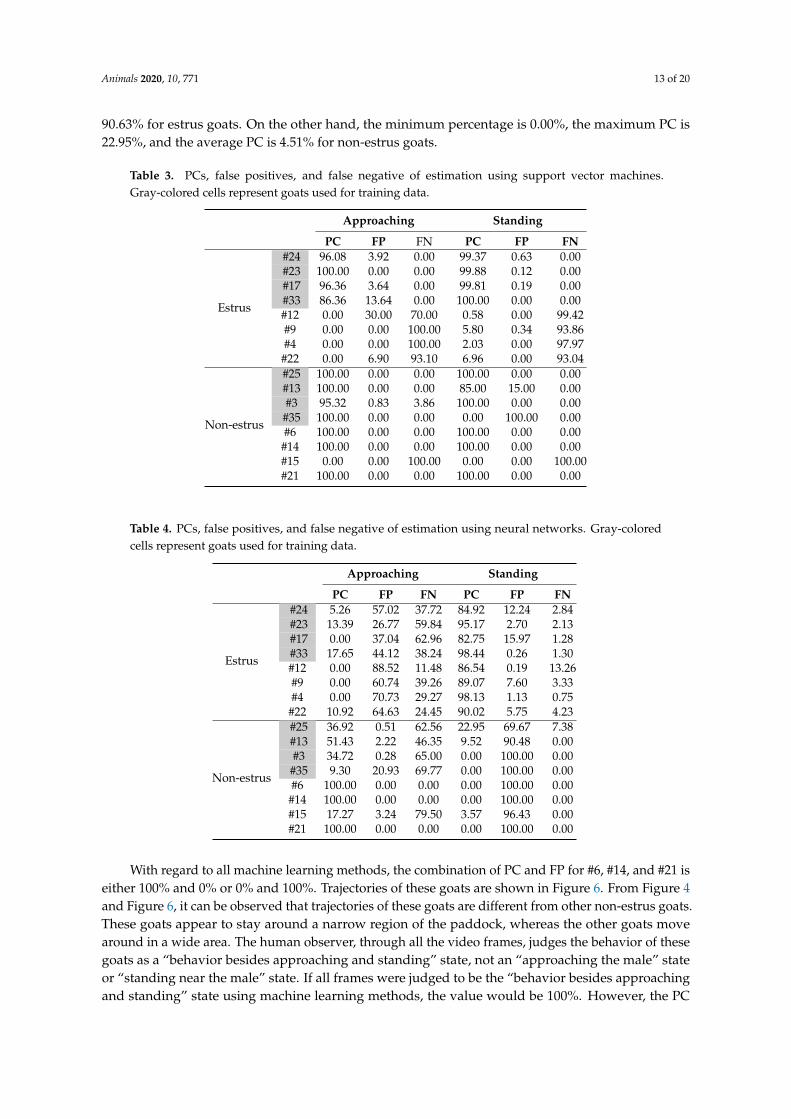
As for “approaching the male” states estimated by neural network, from Figure 5 and Table 4, theminimum PC was 0.00%, the maximum PC was 17.65%, and the average PC was 5.90% for estrus goats.On the other hand, the minimum PC was 9.30%, the maximum PC was 100.00%, and the average PCwas 56.21% for non-estrus goats. On the other hand, as for “standing near the male” state estimated byneural network, the minimum PC was 82.75%, the maximum PC was 98.44%, and the average PC was
Animals 2020, 10, 771 13 of 20
90.63% for estrus goats. On the other hand, the minimum percentage is 0.00%, the maximum PC is22.95%, and the average PC is 4.51% for non-estrus goats.
Table 3. PCs, false positives, and false negative of estimation using support vector machines.Gray-colored cells represent goats used for training data.
Approaching Standing
PC FP FN PC FP FN
Estrus
#24 96.08 3.92 0.00 99.37 0.63 0.00#23 100.00 0.00 0.00 99.88 0.12 0.00#17 96.36 3.64 0.00 99.81 0.19 0.00#33 86.36 13.64 0.00 100.00 0.00 0.00#12 0.00 30.00 70.00 0.58 0.00 99.42#9 0.00 0.00 100.00 5.80 0.34 93.86#4 0.00 0.00 100.00 2.03 0.00 97.97
#22 0.00 6.90 93.10 6.96 0.00 93.04
Non-estrus
#25 100.00 0.00 0.00 100.00 0.00 0.00#13 100.00 0.00 0.00 85.00 15.00 0.00#3 95.32 0.83 3.86 100.00 0.00 0.00
#35 100.00 0.00 0.00 0.00 100.00 0.00#6 100.00 0.00 0.00 100.00 0.00 0.00
#14 100.00 0.00 0.00 100.00 0.00 0.00#15 0.00 0.00 100.00 0.00 0.00 100.00#21 100.00 0.00 0.00 100.00 0.00 0.00
Table 4. PCs, false positives, and false negative of estimation using neural networks. Gray-coloredcells represent goats used for training data.
Approaching Standing
PC FP FN PC FP FN
Estrus
#24 5.26 57.02 37.72 84.92 12.24 2.84#23 13.39 26.77 59.84 95.17 2.70 2.13#17 0.00 37.04 62.96 82.75 15.97 1.28#33 17.65 44.12 38.24 98.44 0.26 1.30#12 0.00 88.52 11.48 86.54 0.19 13.26#9 0.00 60.74 39.26 89.07 7.60 3.33#4 0.00 70.73 29.27 98.13 1.13 0.75#22 10.92 64.63 24.45 90.02 5.75 4.23
Non-estrus
#25 36.92 0.51 62.56 22.95 69.67 7.38#13 51.43 2.22 46.35 9.52 90.48 0.00#3 34.72 0.28 65.00 0.00 100.00 0.00#35 9.30 20.93 69.77 0.00 100.00 0.00#6 100.00 0.00 0.00 0.00 100.00 0.00#14 100.00 0.00 0.00 0.00 100.00 0.00#15 17.27 3.24 79.50 3.57 96.43 0.00#21 100.00 0.00 0.00 0.00 100.00 0.00
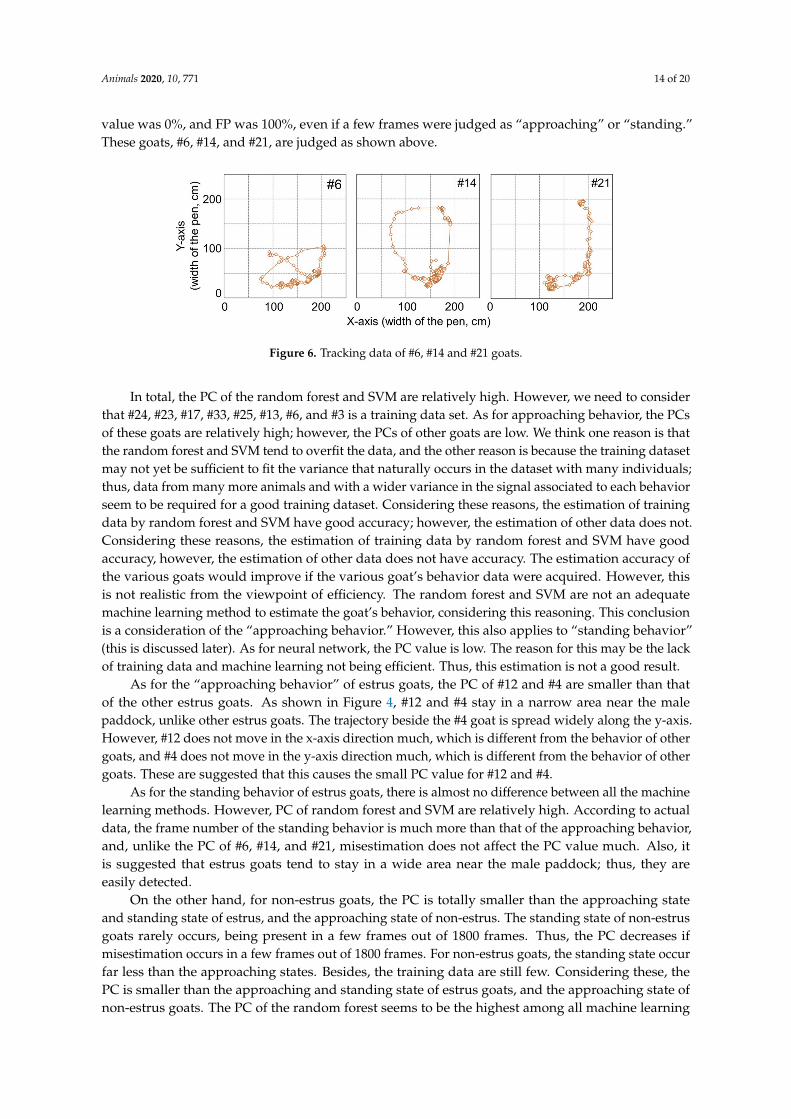
With regard to all machine learning methods, the combination of PC and FP for #6, #14, and #21 iseither 100% and 0% or 0% and 100%. Trajectories of these goats are shown in Figure 6. From Figure 4and Figure 6, it can be observed that trajectories of these goats are different from other non-estrus goats.These goats appear to stay around a narrow region of the paddock, whereas the other goats movearound in a wide area. The human observer, through all the video frames, judges the behavior of thesegoats as a “behavior besides approaching and standing” state, not an “approaching the male” stateor “standing near the male” state. If all frames were judged to be the “behavior besides approachingand standing” state using machine learning methods, the value would be 100%. However, the PC
Animals 2020, 10, 771 14 of 20
value was 0%, and FP was 100%, even if a few frames were judged as “approaching” or “standing.”These goats, #6, #14, and #21, are judged as shown above.
Figure 6. Tracking data of #6, #14 and #21 goats.
In total, the PC of the random forest and SVM are relatively high. However, we need to considerthat #24, #23, #17, #33, #25, #13, #6, and #3 is a training data set. As for approaching behavior, the PCsof these goats are relatively high; however, the PCs of other goats are low. We think one reason is thatthe random forest and SVM tend to overfit the data, and the other reason is because the training datasetmay not yet be sufficient to fit the variance that naturally occurs in the dataset with many individuals;thus, data from many more animals and with a wider variance in the signal associated to each behaviorseem to be required for a good training dataset. Considering these reasons, the estimation of trainingdata by random forest and SVM have good accuracy; however, the estimation of other data does not.Considering these reasons, the estimation of training data by random forest and SVM have goodaccuracy, however, the estimation of other data does not have accuracy. The estimation accuracy ofthe various goats would improve if the various goat’s behavior data were acquired. However, thisis not realistic from the viewpoint of efficiency. The random forest and SVM are not an adequatemachine learning method to estimate the goat’s behavior, considering this reasoning. This conclusionis a consideration of the “approaching behavior.” However, this also applies to “standing behavior”(this is discussed later). As for neural network, the PC value is low. The reason for this may be the lackof training data and machine learning not being efficient. Thus, this estimation is not a good result.
As for the “approaching behavior” of estrus goats, the PC of #12 and #4 are smaller than thatof the other estrus goats. As shown in Figure 4, #12 and #4 stay in a narrow area near the malepaddock, unlike other estrus goats. The trajectory beside the #4 goat is spread widely along the y-axis.However, #12 does not move in the x-axis direction much, which is different from the behavior of othergoats, and #4 does not move in the y-axis direction much, which is different from the behavior of othergoats. These are suggested that this causes the small PC value for #12 and #4.
As for the standing behavior of estrus goats, there is almost no difference between all the machinelearning methods. However, PC of random forest and SVM are relatively high. According to actualdata, the frame number of the standing behavior is much more than that of the approaching behavior,and, unlike the PC of #6, #14, and #21, misestimation does not affect the PC value much. Also, itis suggested that estrus goats tend to stay in a wide area near the male paddock; thus, they areeasily detected.
On the other hand, for non-estrus goats, the PC is totally smaller than the approaching stateand standing state of estrus, and the approaching state of non-estrus. The standing state of non-estrusgoats rarely occurs, being present in a few frames out of 1800 frames. Thus, the PC decreases ifmisestimation occurs in a few frames out of 1800 frames. For non-estrus goats, the standing state occurfar less than the approaching states. Besides, the training data are still few. Considering these, thePC is smaller than the approaching and standing state of estrus goats, and the approaching state ofnon-estrus goats. The PC of the random forest seems to be the highest among all machine learning
Animals 2020, 10, 771 15 of 20
methods; however, an overfitting problem exists, as stated above. HMM gets the large PC next to therandom forest. HMM could model a Shiba goat’s behavior based on Markov probability and has theprobability of characterizing Shiba goat’s behavior statistically, similar to that of mice [16,17].
From the above discussion, considering the PC, convenience of modeling, and computing timeneeded, we suggest that estimation by HMM is an adequate machine learning method for estimatingthe goat’s behavior. The PC of neural network is small. However, if additional data are acquired andlearned by neural network, the PC of neural network would increase. If the amount of data is small,HMM is an adequate method for estimation; on the other hand, if the amount of data is large, neuralnetwork can be an adequate method for estimation.
As for SVM, we should also consider about computing time. It is said that SVM requires muchtime. Thus, it might not take a long time to estimate the goat’s state by SVM if the data are small,like those used in this study. However, it might take a long time to estimate if more data were used.This will be a problem if the goat’s state estimation system is considered for practical use.
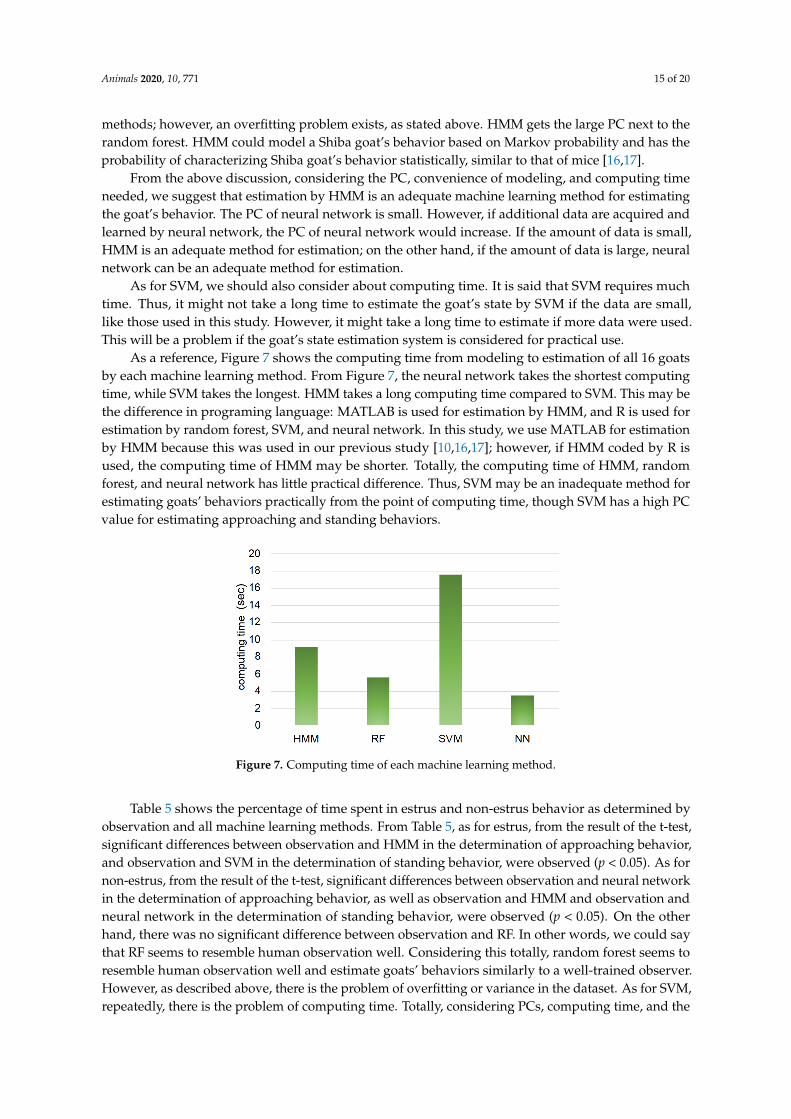
As a reference, Figure 7 shows the computing time from modeling to estimation of all 16 goatsby each machine learning method. From Figure 7, the neural network takes the shortest computingtime, while SVM takes the longest. HMM takes a long computing time compared to SVM. This may bethe difference in programing language: MATLAB is used for estimation by HMM, and R is used forestimation by random forest, SVM, and neural network. In this study, we use MATLAB for estimationby HMM because this was used in our previous study [10,16,17]; however, if HMM coded by R isused, the computing time of HMM may be shorter. Totally, the computing time of HMM, randomforest, and neural network has little practical difference. Thus, SVM may be an inadequate method forestimating goats’ behaviors practically from the point of computing time, though SVM has a high PCvalue for estimating approaching and standing behaviors.
Figure 7. Computing time of each machine learning method.
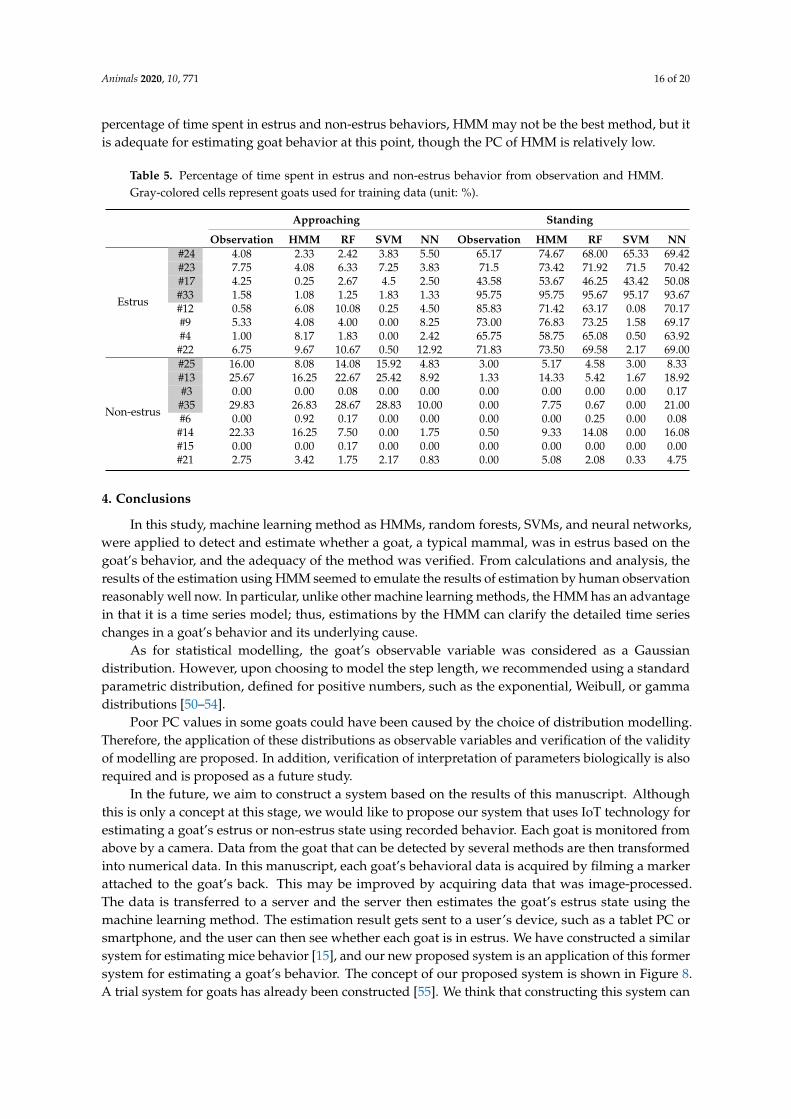
Table 5 shows the percentage of time spent in estrus and non-estrus behavior as determined byobservation and all machine learning methods. From Table 5, as for estrus, from the result of the t-test,significant differences between observation and HMM in the determination of approaching behavior,and observation and SVM in the determination of standing behavior, were observed (p < 0.05). As fornon-estrus, from the result of the t-test, significant differences between observation and neural networkin the determination of approaching behavior, as well as observation and HMM and observation andneural network in the determination of standing behavior, were observed (p < 0.05). On the otherhand, there was no significant difference between observation and RF. In other words, we could saythat RF seems to resemble human observation well. Considering this totally, random forest seems toresemble human observation well and estimate goats’ behaviors similarly to a well-trained observer.However, as described above, there is the problem of overfitting or variance in the dataset. As for SVM,repeatedly, there is the problem of computing time. Totally, considering PCs, computing time, and the
Animals 2020, 10, 771 16 of 20
percentage of time spent in estrus and non-estrus behaviors, HMM may not be the best method, but itis adequate for estimating goat behavior at this point, though the PC of HMM is relatively low.
Table 5. Percentage of time spent in estrus and non-estrus behavior from observation and HMM.Gray-colored cells represent goats used for training data (unit: %).
Approaching Standing
Observation HMM RF SVM NN Observation HMM RF SVM NN
Estrus
#24 4.08 2.33 2.42 3.83 5.50 65.17 74.67 68.00 65.33 69.42#23 7.75 4.08 6.33 7.25 3.83 71.5 73.42 71.92 71.5 70.42#17 4.25 0.25 2.67 4.5 2.50 43.58 53.67 46.25 43.42 50.08#33 1.58 1.08 1.25 1.83 1.33 95.75 95.75 95.67 95.17 93.67#12 0.58 6.08 10.08 0.25 4.50 85.83 71.42 63.17 0.08 70.17#9 5.33 4.08 4.00 0.00 8.25 73.00 76.83 73.25 1.58 69.17#4 1.00 8.17 1.83 0.00 2.42 65.75 58.75 65.08 0.50 63.92
#22 6.75 9.67 10.67 0.50 12.92 71.83 73.50 69.58 2.17 69.00
Non-estrus
#25 16.00 8.08 14.08 15.92 4.83 3.00 5.17 4.58 3.00 8.33#13 25.67 16.25 22.67 25.42 8.92 1.33 14.33 5.42 1.67 18.92#3 0.00 0.00 0.08 0.00 0.00 0.00 0.00 0.00 0.00 0.17
#35 29.83 26.83 28.67 28.83 10.00 0.00 7.75 0.67 0.00 21.00#6 0.00 0.92 0.17 0.00 0.00 0.00 0.00 0.25 0.00 0.08
#14 22.33 16.25 7.50 0.00 1.75 0.50 9.33 14.08 0.00 16.08#15 0.00 0.00 0.17 0.00 0.00 0.00 0.00 0.00 0.00 0.00#21 2.75 3.42 1.75 2.17 0.83 0.00 5.08 2.08 0.33 4.75
4. Conclusions
In this study, machine learning method as HMMs, random forests, SVMs, and neural networks,were applied to detect and estimate whether a goat, a typical mammal, was in estrus based on thegoat’s behavior, and the adequacy of the method was verified. From calculations and analysis, theresults of the estimation using HMM seemed to emulate the results of estimation by human observationreasonably well now. In particular, unlike other machine learning methods, the HMM has an advantagein that it is a time series model; thus, estimations by the HMM can clarify the detailed time serieschanges in a goat’s behavior and its underlying cause.
As for statistical modelling, the goat’s observable variable was considered as a Gaussiandistribution. However, upon choosing to model the step length, we recommended using a standardparametric distribution, defined for positive numbers, such as the exponential, Weibull, or gammadistributions [50–54].
Poor PC values in some goats could have been caused by the choice of distribution modelling.Therefore, the application of these distributions as observable variables and verification of the validityof modelling are proposed. In addition, verification of interpretation of parameters biologically is alsorequired and is proposed as a future study.
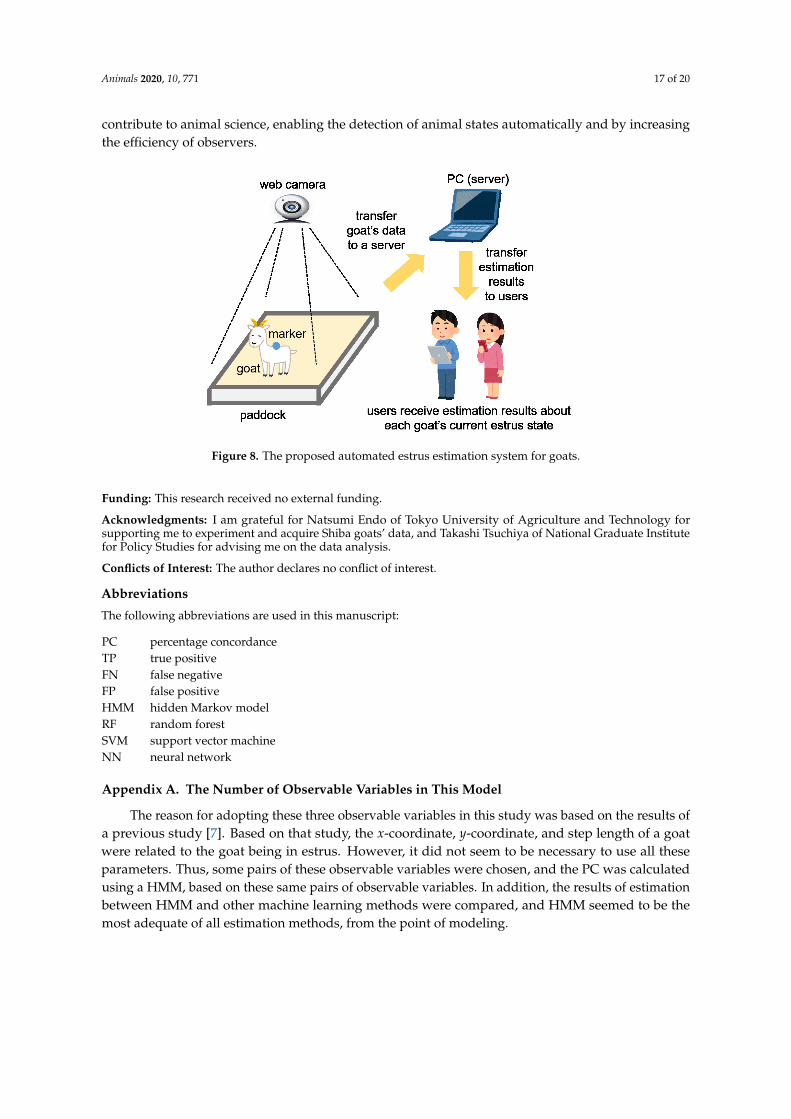
In the future, we aim to construct a system based on the results of this manuscript. Althoughthis is only a concept at this stage, we would like to propose our system that uses IoT technology forestimating a goat’s estrus or non-estrus state using recorded behavior. Each goat is monitored fromabove by a camera. Data from the goat that can be detected by several methods are then transformedinto numerical data. In this manuscript, each goat’s behavioral data is acquired by filming a markerattached to the goat’s back. This may be improved by acquiring data that was image-processed.The data is transferred to a server and the server then estimates the goat’s estrus state using themachine learning method. The estimation result gets sent to a user’s device, such as a tablet PC orsmartphone, and the user can then see whether each goat is in estrus. We have constructed a similarsystem for estimating mice behavior [15], and our new proposed system is an application of this formersystem for estimating a goat’s behavior. The concept of our proposed system is shown in Figure 8.A trial system for goats has already been constructed [55]. We think that constructing this system can
Animals 2020, 10, 771 17 of 20
contribute to animal science, enabling the detection of animal states automatically and by increasingthe efficiency of observers.
Figure 8. The proposed automated estrus estimation system for goats.
Funding: This research received no external funding.
Acknowledgments: I am grateful for Natsumi Endo of Tokyo University of Agriculture and Technology forsupporting me to experiment and acquire Shiba goats’ data, and Takashi Tsuchiya of National Graduate Institutefor Policy Studies for advising me on the data analysis.
Conflicts of Interest: The author declares no conflict of interest.
Abbreviations
The following abbreviations are used in this manuscript:
PC percentage concordanceTP true positiveFN false negativeFP false positiveHMM hidden Markov modelRF random forestSVM support vector machineNN neural network
Appendix A. The Number of Observable Variables in This Model
The reason for adopting these three observable variables in this study was based on the results ofa previous study [7]. Based on that study, the x-coordinate, y-coordinate, and step length of a goatwere related to the goat being in estrus. However, it did not seem to be necessary to use all theseparameters. Thus, some pairs of these observable variables were chosen, and the PC was calculatedusing a HMM, based on these same pairs of observable variables. In addition, the results of estimationbetween HMM and other machine learning methods were compared, and HMM seemed to be themost adequate of all estimation methods, from the point of modeling.
Animals 2020, 10, 771 18 of 20
References
1. Boness, D.J. Estrus and Estrous Behavior. In Encyclopedia of Marine Mammals; Academic Press: Amsterdam,The Netherlands, 2009.
2. Beach, F.A. Sexual attractivity, proceptivity, and receptivity in female mammals. Horm Behav. 1976, 7,105–138.
3. Walf, A.W.; Frye, C.A. Organizational and Activational Effects of Progesterone on Social Behavior in FemaleMammals. In Routledge International Handbook of Social Neuroendocrinology; Schultheiss, O., Mehta, P.H., Eds.;Routledge: Abingdon-on-Thames, UK, 2018.
4. Shearer, M.K.; Kats, L.S. Female-female mounting among goats stimulates sexual performance in males.Horm. Behav. 2006, 50, 33–37.
5. Okada, M.; Takeuchi, Y.; Mori, Y. Estradiol-dependency of sexual behavior manifestation at the post-LHsurge period in ovariectomized goat. J. Reprod. Dev. 1998, 44, 53–58.
6. Haulenbeek, A.M.; Katz, L.S. Female tail wagging enhances sexual performance in male goats. Horm. Behav.2011, 60, 244–247.
7. Endo, N.; Rahayu, P.L.; Arakawa, T.; Tanaka, T. Video tracking analysis of behavioral patterns during estrusin goats. J. Reprod. Dev. 2016, 62, 115–119.
8. Stirling, I.; Spencer, C.; Andriashek, D. Behavior and activity budgets of wild breeding polar bears (Ursusmaritimus). Mar. Mammal Sci. 2015, 32, 13–37.
9. IoT Agenda. Available online: https://internetofthingsagenda.techtarget.com/definition/Internet-of-Things-IoT (accessed on 31 January 2019).
10. Arakawa, T. Proposal and evaluation of behavior estimation method for Shiba goats. Trans. JSME 2017, 83,16-00447. (In Japanese)
11. Noldus, L.P.; Spink, A.J.; Tegelenbosch, R.A. Etho Vision: a versatile video tracking system for automation ofbehavioral experiments. Behav. Res. Methods Instrum. Comput. 2001, 33, 398–414.
12. Steele, A.D.; Jackson, W.S.; King, O.D.; Lindquist, S. The power of automated high-resolution behavioranalysis revealed by its application to mouse models of Huntington’s and prion diseases. Proc. Natl. Acad.Sci. USA 2007, 104, 1983–1988.
13. Richardson, C.A. The power of automated behavioural homecage technologies in characterizing diseaseprogression in laboratory mice: A review. Appl. Anim. Behav. Sci. 2015, 163, 19–27.
14. Takahashi, A.; Tomihara, K.; Shiroishi, T.; Koide, T. Genetic mapping of social interaction behavior inB6/MSM consomic mouse strains. Behav. Genet. 2010, 40, 366–376.
15. Arakawa, T.; Tanave, A.; Ikeuchi, S.; Takahashi, A.; Kakihara, S.; Kimura, S.; et al. A male-specific QTL forsocial interaction behavior in mice mapped with automated pattern detection by a hidden Markov modelincorporated into newly developed freeware. J. Neurosci. Methods 2014, 234, 127–134.
16. Arakawa, T.; Takahashi, A.; Tanave, A.; Kakihara, S.; Kimura, S.; Sugimoto, H.; Shiroishi, T.; Tomihara, K.;Koide, T.; Tsuchiya, T. A Markov transition score for characterizing interactive behavior of two animals andits application to genetic background analysis of social behavior of mouse. Proc. Measur. Behav. 2012, 2012,279–282.
17. Arakawa, T.; Takahashi, A.; Tanave, A.; Kakihara, S.; Kimura, S.; Sugimoto, H.; Shiroishi, T.; Tomihara,K.; Koide, T.; Tsuchiya, T. Automatic segmentation of mouse states using hidden Markov model andcharacterization of mouse strain using 2-states Markov model. Proc. Inst. Stat. Math. 2012, 60, 189–213.(In Japanese)
18. Cullen, D.A.; Sword, G.A.; Simpson, S.J. Optimizing multivariate behavioural syndrome models in locustsusing automated video tracking. Anim. Behav. 2012, 84, 771–784.
19. Martin, J.R. A portrait of locomotor behavior in Drosophila determined by a video-tracking paradigm.Behav. Process. 2004, 67, 207–219.
20. Chuang, M.C.; Hwang, J.N.; Ye, J.H.; Huang, S.C.; Williams, K. Underwater Fish Tracking for MovingCameras Based on Deformable Multiple Kernels. IEEE Trans Syst. Man Cybern. Syst. 2017, 47, 2467–2477.
21. Khan, Z.; Herman, R.A.; Wallen, K.; Balch, T. An outdoor 3-D visual tracking system for the study of spatialnavigation and memory in rhesus monkeys. Behav. Res. Methods 2005, 37, 453–463
Animals 2020, 10, 771 19 of 20
22. Kashiha, M.; Bahr, C.; Ott, S.; Moons, C.P.H.; Niewold, T.A.; Ödberg, F.O.; Berckmans, D. Automaticidentification of marked pigs in a pen using image pattern recognition. Comput. Electron. Agric. 2013, 93,111–120.
23. National Institute of Information and Communications Technogy (NICT). Research and Development forInformation and Communication Network Formation between Breeding Farm and Livestock Engineer byEstrus of Cattle Detection System. 2009. Available online: http://kiban.nict.go.jp/annual_report/report/report20/20-19-202.pdf (accessed on 1 September 2016). (In Japanese)
24. P. A. Technology. Hatsu-Hatsu (Support System for Estrus Detection). Available online: http://pa-technology.co.jp/index.html (accessed on 1 September 2016). (In Japanese)
25. Patterson, T.A.; Parton, A.; Langrock, R.; Blackwell, P.G.; Thomas, L.; King, R. Statistical modelling ofindividual animal movement: an overview of key methods and a discussion of practical challenges. AStAAdv. Stat. Anal. 2017, 101, 399–438.
26. Nasrabadi, N.M. Pattern recognition and machine learning. J. Electron. Imaging 2007, 16, 049901.27. Kruppa, J.; Andreas, Z.; Inke R.K. Risk estimation and risk prediction using machine-learning methods.
Hum. Genet. 2012, 131, 1639–1654.28. Madokoro, H.; Shimoi, N.; Sato, K. Prediction of bed-leaving behaviors using accelerometer-embedded
pillow based on machine learning. Trans. Soc. Instrum. Control. Eng. 2013, 49, 994–1003. (In Japanese)29. Motomura, Y. Daily life behavior modeling from large scale data–Statistical learning and probabilistic
reasoning of Bayesian networks through real services. Synthesiology 2009, 2, 1–11. (In Japanese)30. Hong, W.; Kennedy, A.; Burgos-Artizzu, X.P.; Zelikowsky, M.; Navonne, S.G.; Perona, P.; Anderson, D.J.
Automated measurement of mouse social behaviors using depth sensing, video tracking, and machinelearning. Proc. Natl. Acad. Sci. USA 2015, 112, E5351–E5360.
31. Williams, M.L.; James, W.P.; Rose, M.T. Variable segmentation and ensemble classifiers for predicting dairycow behaviour. Biosyst. Eng. 2019, 178, 156–167.
32. Rabiner, LR. A tutorial on hidden Markov models and selected applications in speech recognition. Proc. IEEE1989, 7, 257–286.
33. Eddy, S.R. Hidden Markov models. Curr. Opin. Struct. Biol. 1996, 6, 361–365.34. Eddy, S.R. What is a hidden Markov model? Nat. Biotechnol. 2004, 22, 1315–1316.35. National Goat Network. How to Keep a Goat. Available online: http://japangoat.web.fc2.com/goat4.
html(accessed on 28 March 2020). (In Japanese)36. Arakawa, T.; Tanave A.; Takahashi A.; Kakihara S.; Koide T.; Tsuchiya T. Automated estimation of mouse
social behaviors based on a hidden Markov model. Methods Mol. Biol. 2017, 1552, 185–197.37. Kitagawa, G. Non-Gaussian state-space modeling of nonstationary time series. JASA 1987, 82, 1032–1063.38. Technopedia. Random Forest. Available online: https://www.techopedia.com/definition/32935/random-
forest (accessed on 6 February 2019).39. Díaz-Uriarte, R.; De Andrés, S.A. Gene selection and classification of microarray data using random forest,
BMC Bioinform. 2006, 7, 3.40. Khan, R.; Hanbury, A.; Stoettinger, J. Skin detection: A random forest approach. In Proceedings of the
2010 IEEE International Conference on Image Processing, Hong Kong, China, 26–29 September 2010;pp. 4613–4616.
41. Tutorialspoint. Classification Algorithms–Random Forest. Available online: https://www.tutorialspoint.com/machine_learning_with_python/machine_learning_with_python_classification_algorithms_random_forest.htm (accessed on 7 January 2020).
42. Analytics Vidhya. Understanding Support Vector Machine algorithm from examples (along with Code).Available online: https://www.analyticsvidhya.com/blog/2017/09/understaing-support-vector-machine-example-code/ (accessed on 6 February 2019).
43. Joachims, T. Text categorization with support vector machines: Learning with many relevant features.In Proceedings of the European Conference on Machine Learning, Chemnitz, Germany, 21–23 April 1998.
44. Burges, C.J. A tutorial on support vector machines for pattern recognition. Data Min. Knowl. Disc. 1998, 2,121–167.
45. Rohith Gandhi. Support Vector Machine—Introduction to Machine Learning Algorithmsm. Availableonline: https://towardsdatascience.com/support-vector-machine-introduction-to-machine-learning-algorithms-934a444fca47 (accessed on 7 January 2020).
Animals 2020, 10, 771 20 of 20
46. Techradar.pro. What is a Neural Network? Available online: https://www.techradar.com/news/what-is-a-neural-network (accessed on 6 February 2019).
47. Lippmann, R.P. Pattern classification using neural networks. IEEE Commun. Mag. 1989, 27, 47–50.48. N.Bhat, N.; McAvoy, T.J. Use of neural nets for dynamic modeling and control of chemical process systems.
Comput. Chem. Eng. 1990, 14, 573–582.49. Herault, J., Jutten, C. Space or time adaptive signal processing by neural network models. AIP Conf. Proc.
1986, 151, 206–211.50. Patterson, T.A.; Basson, M.; Bravington, M.V.; Gunn, J.S. Classifying movement behaviour in relation to
environmental conditions using hidden Markov models. J. Anim. Ecol. 2009, 78, 1113–1123.51. Langrock, R.; King, R.; Matthiopoulos, J.; Thomas, L.; Fortin, D.; Morales, J.M. Flexible and practical
modeling of animal telemetry data: hidden Markov models and extensions. Ecology 2012, 93, 2336–2342.52. Morales, J.M.; Haydon, D.T.; Frair, J.; Holsinger, K.E.; Fryxell, J.M. Extracting more out of relocation data:
building movement models as mixtures of random walks. Ecology 2004, 85, 2436–2445.53. McClintock, B.T.; King, R.; Thomas, L.; Matthiopoulos, J.; McConnell, B.J.; Morales, J.M. A general
discrete-time modeling framework for animal movement using multistate random walks. Ecol. Monogr.2012, 82, 335–349.
54. Michelot, T.; Langrock, R.; Patterson, T.A. moveHMM: An R package for the statistical modelling of animalmovement data using hidden Markov models. Methods Ecol. Evol. 2016, 7, 1308–1315.
55. Kaga, S.; Arakawa, T. Proposal of a method for estimation goat’s behavior and consideration of goat’sestrus state detection system. In Proceedings of the SICE 2016, SS13-7, Shiga, Japan, 6–8 December 2016.(In Japanese)
© 2020 by the authors. Licensee MDPI, Basel, Switzerland. This article is an open accessarticle distributed under the terms and conditions of the Creative Commons Attribution(CC BY) license (http://creativecommons.org/licenses/by/4.0/).